
Correlational research of antecedents in Tourism Destination ...
Upload
khangminh22Category
view
1download
0
Antecedents of Servitization Strategies in Manufacturing Firms and Servitization’s
Impact on Firm Performance A Theoretical and Empirical Analysis
MOHAMAD ABOU-FOUL
August 2018
Submitted in partial fulfilment of the requirements for the degree of Doctor of Philosophy of the University of West London

i
Declaration This thesis is the result of my own work and includes nothing that is the outcome of collaboration with
others. It has not been submitted in whole or in part for a degree at any other university. Some of the
work has been published previously in conference proceedings and journal articles. All sources of
quoted information are acknowledged by means of references. The length of this thesis, including
appendices, references, footnotes, tables and equations, is approximately 80,000 words and it
contains 61 tables and 24 figures.
Mohamad Aboufoul
London, August 2018

ii
Abstract Manufacturing firms have vigorously pursued opportunities for profitability and growth through
service-led growth strategies. A major part of the existing literature has focused on such strategies
and has shown that this phenomenon is prevalent and growing in most developed economies.
However, very little systematic evidence regarding the extent or consequences of
servitization, based on comprehensive survey research, yet exists. Furthermore, the current body of
research presents contradictory findings regarding the impact of servitization on firm performance.
Drawing on the theoretical framework of the resource-based view, this research seeks to shed some
light on this question by exploring the effect of servitization on firm performance. Through a survey
of 185 U.S. and European manufacturing firms, along with the use of secondary financial data, this
thesis provides empirical evidence that servitization has a direct, positive effect on firm performance.
The study also finds that for the vast majority of manufacturers, the development of learning
capabilities has served as a significant driver of servitization. Furthermore, the relationship between
servitization and firm performance is moderated by industry dynamism.
The original contribution of this research to the field of knowledge is twofold, including a
theoretical contribution through the validation of the theoretical model and its implications for the
literature, and a pragmatic contribution through the managerial implications of the findings. The
findings have significant managerial implications because achieving superior bottom-line results is
contingent upon the integration of those learning- and service-specific capabilities that transform the
nature of an offering. Such integration enables the manufacturing firm and its customers to achieve
radically improved operation within their ecosystems.
Keywords: servitization, firm performance, structural equation modelling, resource-based view.

iii
Acknowledgments First and foremost, I would like to extend my deepest gratitude to my supervisor Dr. José L. Ruiz-Alba
for all the support, encouragement and guidance offered during my research. I would also like to thank
Professor Chin-Bun Tse for lending his knowledge and experience to polishing the work in its final
stages. My appreciation further extends to University of West London for giving me a competitive PhD
scholarship, which was a tremendous incentive. I would like also to acknowledge and extend my
heartfelt gratitude to the graduate school at University of West London for the support I have received
during my PhD. Above all, I am grateful to my parents, my brothers, my sister and all my family for
their unconditional love, support, and sacrifice throughout my academic journey.

iv
Acronyms
AI Artificial Intelligence
AMOS Analysis of Moment Structures
AVE Average Variance Explained
B2B Business to Business
BSC Balanced Scorecard
CEO Chief Executive Officer
EPS Earnings Per Share
Cf. Confer
CFA Conformity Factor Analysis
CMS Chemical Management Services
CMV Common Method Variance
C‐OAR‐SE Construct definition, Object and Attribute classification, Rater identification,
Scale formation and Enumeration
CR Composite Reliability
CSV Substantive Validity Assessment
CVI Content Validity Index
DCT Dynamic Capabilities Theory
df Degrees of Freedom
DN Deductive-Nomological
DV Dependant Variable
EFA Exploratory Factor Analysis
e.g. Exempli gratia (for example)
Fig Figure
EVAC Economic Value-Added Change rate
G2 Second Generation
GDL Goods Dominant Logic
Gof Goodness of Fit
IB Installed Base
ICT Information and Communication Technology

v
IO Industrial Organization
IOT Internet of Things
IP Intellectual Property
IV Independent Variable
KIS Knowledge Intensive Services
KMO Kaiser-Meyer-Olkin
LISREL Linear Structural Relationship
LV Latent Variables
MANOVA Multivariate Analysis of Variance
MSA Measure Sampling Adequacy
n Sample size
NIH Not Invented Here
NPD New Product Development
NS Not Significant
OBCs Outcome-Based Contracts
p. / pp. Page(s)
PCA Principle Component Analysis
PLS Partial Least Squares
PRL Proportional Reduction in Loss
PSA Proportion of Substantive Agreement
PSS Product Service System
R&D Research and Development
RBV Resource‐Based View (of the firm)
RMS Remote Monitoring Systems
ROA Return on Assets
ROI Return on Investment
ROS Return on Sales
SBM Servitization Basic Model
SD Standard Deviation
SDL Service Dominant Logic
SEM Structural Equation Modelling
SPC Structure-Conduct-Performance Paradigm
SPSS Statistical Package for Social Science
TCE Transaction Cost Economics

vi
VAF Variance Accounted For
VCC Value Co-creation
VIF Variance Inflation Factor
VRIN Value, Rareness, Inimitability and Non-substitutability

vii
Notations
β Beta Path Coefficient
D Certain Omission Distance
f2 Effect Size
R2 Coefficient of Determination
q2 Effect Size
Q2 Predictive Relevance
log(x) Natural Logarithm of x
P Significance Level
∝ Cronbach’s Alpha
η Latent Endogenous Variable
ξ Latent Exogenous Variable
ε Error Term for an Indicator y
δ Error Term for an Indicator X
ζ Error Term for a Latent Endogenous Variable
Γ Matrix Γ Contains the Coefficients of the y’s on the x’s
Λ Loadings Matrix of Indicators

viii
Table of Contents
Declaration ....................................................................................................................... i
Abstract ........................................................................................................................... ii
Acknowledgments ........................................................................................................... iii
Acronyms ........................................................................................................................ iv
Notations ....................................................................................................................... vii
Table of Contents .......................................................................................................... viii
List of Tables ................................................................................................................. xiii
List of Figures .................................................................................................................xvi
List of Publications ........................................................................................................ xvii
Introduction ..................................................................................................................... 1
1.1 Background ................................................................................................................................... 1
1.2 Limitations of the Existing Research ............................................................................................. 4
1.3 Problem Delineation ..................................................................................................................... 6
1.4 Research Aim ................................................................................................................................ 7
1.5 Research Objectives ...................................................................................................................... 7
1.6 Research Questions ...................................................................................................................... 7
1.7 Fundamental Aspects of Research Objectives .............................................................................. 8
1.8 Contributions ................................................................................................................................ 8
1.9 Scientific Position and Research Strategy ..................................................................................... 9
1.9.1 Scientific Position and Statistical Examination ................................................................... 9
1.9.2 Research Design and Research Process ............................................................................ 11
1.10 Terminology and Fundamental Concepts ................................................................................... 14
1.11 Structure of the Thesis ................................................................................................................ 17
Literature Review ........................................................................................................... 19
2.1 Introduction ................................................................................................................................ 19

ix
2.2 Theoretical Underpinnings of Servitization: A Resource-Based View of the Firm ..................... 21
2.3 Internal Factors Influencing Servitization Strategies .................................................................. 27
2.3.1 Theoretical Grounding of the Conceptualization ............................................................. 27
2.4 External Factors Influencing Servitization Strategies ................................................................. 37
2.4.1 Theoretical Grounding of Industry Clock Speed Conceptualization ................................. 37
2.5 Servitization Articles ................................................................................................................... 39
2.6 Empirical Research on Servitization ........................................................................................... 40
2.7 Summative Content Analysis Procedures ................................................................................... 42
2.8 Definitional Issues and Contribution to Servitization Dialogue .................................................. 44
2.9 Contemporary Definitions of Servitization ................................................................................. 45
2.10 Content Analysis and Findings .................................................................................................... 50
2.10.1 ‘Servitization Qualifier’ ‘Market Offering’ and ‘Value’Categories .................................... 51
2.10.2 Contemporary Views of Servitization ‘Market offering’ ................................................... 55
2.10.3 Examples of Servitization in Industry ................................................................................ 58
2.10.4 Servitization from the ‘Value’ Perspective........................................................................ 60
2.11 Challenges of Servitization.......................................................................................................... 63
2.11.1 Organisational Challenges................................................................................................. 63
2.11.2 Financial Challenges .......................................................................................................... 66
2.11.3 Customer Challenges ........................................................................................................ 67
2.11.4 Supply Chain Challenges ................................................................................................... 68
2.11.5 Market Challenges ............................................................................................................ 69
2.12 Antecedents of Servitization....................................................................................................... 70
2.13 Servitization and Business Model Innovation ............................................................................ 73
2.13.1 Value Proposition .............................................................................................................. 74
2.13.2 Resources .......................................................................................................................... 75
2.13.3 Processes ........................................................................................................................... 75
2.13.4 Profit Formula ................................................................................................................... 75
2.14 Reconceptualization of the Servitization Concept ..................................................................... 77
2.14.1 Product-Centric Servitization ............................................................................................ 79
2.14.2 Process-Centric Servitization ............................................................................................ 79
2.14.3 Operation-Centric Servitization ........................................................................................ 79
2.14.4 Platform-Centric Servitization ........................................................................................... 80
Hypotheses Development ............................................................................................... 85
3.1 Introduction ................................................................................................................................ 85
3.2 Principles of Framework Development and Conceptual Modelling ........................................... 86

x
3.2.1 Conceptual and Theoretical Pluralism .............................................................................. 86
3.2.2 Contingent Modelling ....................................................................................................... 86
3.2.3 Integrated Causal Framework for Examining Servitization Antecedents and Performance
Impact ............................................................................................................................... 89
3.3 Modelling the Internal Factors that Influence Servitization Strategies and Firm Performance. 90
3.3.1 Value Co-Creation ............................................................................................................. 90
3.3.2 Open Innovation ............................................................................................................... 97
3.3.3 Absorptive Capacity ........................................................................................................ 103
3.3.4 Service Orientation of Organisation Culture ................................................................... 110
3.3.5 Risk .................................................................................................................................. 113
3.4 Modelling the External Factors Influencing Servitization Strategies and Firm Performance ... 116
3.4.1 Dynamism and Industry Clock Speed .............................................................................. 116
3.5 Servitization’s Impact on Firm Performance ............................................................................ 119
3.6 Firm Performance ..................................................................................................................... 123
Research Methodology ................................................................................................. 125
4.1 Philosophical Standpoint .......................................................................................................... 126
4.2 Questionnaire Design and Data Collection ............................................................................... 127
4.3 Sample ...................................................................................................................................... 131
4.3.1 Population and Sampling Frame ..................................................................................... 131
4.4 The C‐OAR‐SE Method for Scale Development ........................................................................ 138
4.5 Data Analysis Techniques ......................................................................................................... 141
4.5.1 Overview of Major Analysis Phases ................................................................................ 141
4.5.2 Structural Equation Modelling (SEM) – Basic Features and Suitability for the Research
Problem ........................................................................................................................... 142
4.5.3 Construct Types in PLS-SEM Modelling .......................................................................... 145
4.5.4 Sequence of a Structural Equation Analysis ................................................................... 147
4.6 Measures .................................................................................................................................. 152
4.6.1 Measurement Model Indicators Sources ................................................................................. 152
4.6.2 Operationalization of Dependent Variables ............................................................................. 154
4.6.2.2 Servitization .................................................................................................................... 154
4.6.2.3 Open Innovation ............................................................................................................. 156
4.6.2.4 Absorptive Capacity ........................................................................................................ 157
4.6.2.5 Value Co-Creation ........................................................................................................... 157
4.6.2.6 Firm Performance ........................................................................................................... 158
4.6.2.7 Service Orientation of Organisational Culture ................................................................ 160

xi
4.6.2.8 Risk .................................................................................................................................. 160
4.6.3 Operationalization of Moderating Variables ............................................................................ 161
4.6.3.1 Industry clock speed ....................................................................................................... 161
4.6.4 Operationalization of Control Variables ................................................................................... 161
Primary Analysis and Results ........................................................................................ 163
5.1 Research Constructs Psychometric Assessment....................................................................... 163
5.1.1 Servitization Construct Psychometric Assessment ......................................................... 163
5.1.2 Open Innovation Construct Psychometric Assessment .................................................. 168
5.1.3 Absorptive Capacity Construct Psychometric Assessment ............................................. 170
5.1.4 Value Co-Creation Construct Psychometric Assessment ................................................ 171
5.1.5 Service Orientation of Organisational Culture Construct Psychometric Assessment .... 172
5.1.6 Industry clock speed Construct Psychometric Assessment ............................................ 173
5.1.7 Firm Performance Construct Psychometric Assessment ................................................ 174
5.1.8 Risk Construct Psychometric Assessment ....................................................................... 176
5.2 Measurement Model Reliability and Validity ........................................................................... 178
5.3 Common Method Variance Tests ............................................................................................. 182
5.4 Descriptive Data Analysis .......................................................................................................... 192
5.4.1 Sample............................................................................................................................. 192
5.4.2 Non-Response Bias ......................................................................................................... 195
5.5 Testing the Research Models.................................................................................................... 198
5.5.1 Servitization Basic Model ................................................................................................ 198
5.5.2 Test for Mediating Effects ............................................................................................... 213
5.6 Groups Comparison and Analysis ............................................................................................. 217
5.7 Testing the SBM Model Using Objective Performance Data .................................................... 222
Conclusions, Implications and Critical Discussion .......................................................... 226
6.1 Introduction .............................................................................................................................. 226
6.2 Overview of Research ............................................................................................................... 226
6.3 Conclusions Regarding the Research Questions....................................................................... 229
6.3.1 Servitization Conceptualization and Operationalization ................................................ 229
6.3.2 Internal Anteceddents of Servitization ........................................................................... 229
6.3.3 Major External Factors in Influencing and Determining the Relationship between
Servtization and Firm Performance ................................................................................ 234
6.3.4 Servitization Impact on Firm Performance ..................................................................... 235
6.4 Theoretical Contributions ......................................................................................................... 238
6.5 Managerial Implications ........................................................................................................... 241

xii
6.5.1 Enhancing Service Capabilities ........................................................................................ 242
6.5.2 Leverageing Strategic Alliances and Partnerships between Stakeholders ..................... 243
6.5.3 Enhancing Firm Performance .......................................................................................... 244
6.6 Research Limitations and Future Directions ............................................................................. 245
Reference List ............................................................................................................... 250
APPENDIX A ................................................................................................................. 292
APPENDIX B .................................................................................................................. 303

xiii
List of Tables Table 2-1: Main management theories used to ground the research hypotheses . ............................ 36
Table 2-2: Journal distribution of servitization articles ........................................................................ 39
Table 2-3: Methodological structure of servitization research ............................................................ 40
Table 2-4: Quantitative studies on servitization ................................................................................... 41
Table 2-5: Definitions of servitization in the literature ........................................................................ 53
Table 2-6: Examples of servitization in industry ................................................................................... 58
Table 2-7: Industry examples of changes in servitization value propositions ...................................... 59
Table 2-8: Types of value in a servitized offer presented in the literature .......................................... 62
Table 4-1: Sample industry US SIC Code distribution. ........................................................................ 132
Table 4-2: Search strategy and sample identification. ....................................................................... 134
Table 4-3: Comparison between partial least squares (PLS) and covariance-based (CB) structural
equation modelling ........................................................................................................... 144
Table 4-4: Nomenclature widely used in the SEM literature. ............................................................ 148
Table 4-5: Systematic evaluation of PLS-SEM results. ........................................................................ 150
Table 4-6: Sources for recommended values for assessing PLS models. ........................................... 150
Table 4-7: General guidelines for the quality criterion in PLS-SEM model. ........................................ 151
Table 4-8: Contributing literature for construct definition and operationalization. .......................... 153
Table 5-1: KMO and Bartlett's test for servitization construct. .......................................................... 164
Table 5-2: Servitization construct exploratory factor analysis ........................................................... 166
Table 5-3: Quality of the operationalisation of the reflective construct of servitization ................... 167
Table 5-4: Quality of the operationalisation of the reflective construct of open innovation ............ 169
Table 5-5: Quality of the operationalisation of the reflective construct of absorptive capacity ....... 170
Table 5-6: Quality of the operationalisation of the reflective construct of value co-creation .......... 171
Table 5-7: Quality of the operationalisation of the reflective construct of service orientation of
organisational culture ....................................................................................................... 172
Table 5-8: Quality of the operationalisation of the reflective construct of industry clock speed ……173
Table 5-9: Correlations between subjective and objective performance measures. ......................... 174
Table 5-10: Quality of the operationalisation of the reflective constructs of firm financial and market
performance ..................................................................................................................... 175

xiv
Table 5-11: Quality of the operationalisation of the formative construct of risk .............................. 177
Table 5-12: Psychometric tests criteria summary .............................................................................. 179
Table 5-13: Fornell-Larcker test for discriminant validity ................................................................... 180
Table 5-14: Outer collinearity statistics (VIF) ..................................................................................... 180
Table 5-15: Goodness of Fit. ............................................................................................................... 181
Table 5-16: One-factor test for common method bias....................................................................... 183
Table 5-17: Inner VIF values. .............................................................................................................. 184
Table 5-18: Means, standard deviations and intercorrelations among the study's variables ........... 185
Table 5-19: Key figures for the reflective construct of servitization operationalised in the SBM model
.......................................................................................................................................... 186
Table 5-20: Key figures for the reflective constructs of absorptive capacity and industry clock speed
operationalised in the SBM model ................................................................................... 187
Table 5-21: Key figures for the reflective construct of value co-creation operationalised in the SBM
model ................................................................................................................................ 188
Table 5-22: Key figures for the reflective construct of open innovation operationalised in the SBM
model ................................................................................................................................ 189
Table 5-23: Key figures for the reflective construct of service orientation of organisational culture
operationalized in the SBM model ................................................................................... 190
Table 5-24: Key figures for the formative construct of risk operationalised in the SBM model ....... 190
Table 5-25: Key figures for the reflective constructs of firm financial/market performance
operationalised in the SBM model ................................................................................. 191
Table 5-26: Sample demographics. .................................................................................................... 193
Table 5-27: Descriptive statistics of survey respondents ................................................................... 193
Table 5-28: Non-response bias testing using MANOVA ..................................................................... 195
Table 5-29: T-tests comparing early and late responders to check for non-response bias. .............. 196
Table 5-30: Correlations between respondent groups on constructs to check for inter-rater reliability
.......................................................................................................................................... 197
Table 5-31: Industry clock speed’s moderating effect ....................................................................... 200
Table 5-32: Significance of the path coefficients in the SBM structural model ................................ 202
Table 5-33: Degree of confirmation of the hypotheses in the SBM model ........................................ 207
Table 5-34: Comparison of the structural models .............................................................................. 209
Table 5-35: Coefficients of determination (R2) and effect sizes (f2) of the latent variables in the SBM
model ................................................................................................................................ 210

xv
Table 5-36: Predictive relevance of the endogenous constructs in the SBM model, measured by
Stone‐Geisser Q² criterion. ............................................................................................... 211
Table 5-37: Coefficients of determination (R2) and effect sizes (q2) of the latent variables in the SBM
model ................................................................................................................................ 212
Table 5-38: Specific indirect effects .................................................................................................... 214
Table 5-39: Significance of mediated paths ........................................................................................ 215
Table 5-40: Total effect of the significant variables on servitization.................................................. 217
Table 5-41: Total effect of the significant variables on firm performance ......................................... 217
Table 5-42: Comparison of path coefficients in the SBM for companies with low vs. high revenues
from services .................................................................................................................... 220
Table 5-43: Coefficient of determination of the endogenous constructs in the objective models vs.
SBM ................................................................................................................................... 224
Table 5-44: Model Comparison. Subjective firm performance measures vs. objective firm
performance measures ..................................................................................................... 225
Table 6-1: Implications for the servitization discourse ....................................................................... 241

xvi
List of Figures Figure 1-1: Dimensions of the overarching research problem ............................................................... 6
Figure 1-2: Interrelationship between theoretical and pragmatic scientific objectives ...................... 10
Figure 1-3: Major research activities .................................................................................................... 13
Figure 2-1: Relevant theoretical perspectives for modelling causal relationships ............................... 27
Figure 2-2: Relevant theoretical perspectives for modelling the moderation relationship ................ 37
Figure 2-3: Yearly distribution of servitization articles ......................................................................... 39
Figure 2-4: Abstract view of approaches to servitization . .................................................................. 52
Figure 2-5: Types of services that a manufacturer can offer . .............................................................. 56
Figure 2-6: Servitization pyramid. ......................................................................................................... 57
Figure 2-7: Business model elements ................................................................................................... 74
Figure 2-8: Servitization modes ............................................................................................................ 78
Figure 3-1: Types of contingent modelling strategies. ......................................................................... 88
Figure 3-2: Servitization Basic Model (SBM) ......................................................................................... 89
Figure 3-3: Model of value creation. .................................................................................................... 95
Figure 3-4: Open innovation model – the innovation funnel. ............................................................ 100
Figure 3-5: Major dimensions of absorptive capacity ........................................................................ 105
Figure 4-1: Steps in the C‐OAR‐SE scale development method ......................................................... 140
Figure 4-2: Major analyses phases ..................................................................................................... 141
Figure 4-3: Example of a PLS path model. .......................................................................................... 143
Figure 4-4: Reflective versus formative indicators ............................................................................. 145
Figure 4-5: Structural model parameters. .......................................................................................... 147
Figure 4-6: Servitization dimensions. .................................................................................................. 155
Figure 5-1: Servitization construct (EFA) screen plot. ........................................................................ 165
Figure 5-2: Moderating effect of industry clock speed ...................................................................... 201
Figure 5-3: Research model testing results ........................................................................................ 206
Figure 6-1: Research model ................................................................................................................ 206

xvii
List of Publications
Journals Paper 1. Aboufoul, M. and Ruizalba, J. (2nd round review). Servitization: Toward a Conceptual
Framework. The Service Industries Journal. (ABS, 2)
Paper 2. Aboufoul, M., Ruizalba, J., and Soares, A. (Under review). The impact of Digitalization and
Servitization on the Financial Performance of the Firm: An Empirical Analysis. Journal of
Business Research. (ABS, 3)
Conferences
1. Aboufoul, M. and Ruizalba, J. (2016). Determinants of Servitization in Manufacturing Firms.
In: Doctoral Student’s Conference. University of West London, London.
2. Aboufoul, M. (2017). Antecedents of Servitization Strategies in Manufacturing Firms in the
UK. In: Servitization Spring Conference, Internationalisation through servitization. Lucerne,
Switzerland.
3. Aboufoul, M. and Ruizalba, J. (2017). Towards a Conceptual Framework of the Impact of
Servitization on Firm Performance. In: Servitization Spring Conference, Internationalisation
through servitization. Lucerne, Switzerland.
4. Aboufoul, M. and Ruizalba, J. (2017). Servitization Antecedents and Consequences and the
Impact on Firm Performance. In: Doctoral Student’s Conference. University of West London,
London.

xviii
5. Aboufoul, M. and Ruizalba, J. (2017). Servitization Antecedents and Consequences and the
Impact on Firm Performance. CBIM 2017 International Conference. Stockholm University,
Sweden.
6. Ruizalba, J. and Aboufoul, M. (2017). The Financial Consequences of Servitization in
Manufacturing Firms: An Empirical Analysis. ICBS Conference. Barcelona, Spain.

1
CHAPTER1
Introduction
1.1 Background
n the early seventies, an article by Levitt (1972) published in the Harvard Business Review argued
that “everybody is in service.” In this seminal article, the author claimed that the current services
taxonomy was obsolete and that the services spectrum should therefore be broadened to include all
types of services, especially those provided by manufacturing firms. Addressing the service marketing
field, Grönroos (2000) equally suggested that it is not beneficial to try to classify customers based on
whether they are buying products or services; customers are paying for the value and benefits that
both products and services provide them with.
Indeed, within developed countries, services are widely considered the largest and often
fastest-growing sector (Triplett and Bosworth, 2004), and service firms comprise a significant and
growing proportion of the largest firms (Heskett, 1986). To highlight the impact of services on the
economy, Quinn et al. (1990) and Chesbrough and Spohrer (2006) investigated the economic activities
of developed countries, and found the economies of these countries to already be dominated by
services.
I

CHAPTER 1. INTRODUCTION 2
Furthermore, Salter and Tether (2006) argued that industrialised nations are well advanced in terms
of research and development (R&D) expenditures in the service sector, with more than 30 percent of
total R&D expenditures dedicated to services. While most of the service literature concerned with
manufacturing is still dominated by the logic emphasising that customer value is embedded within the
physical artefact and underpinned by discrete transactions (Rust and Mui, 2006), Vargo and Lusch
(2004) challenged this narrow perspective, arguing that value is realised when the customer actually
uses the products. Nevertheless, in the academic discourse regarding both industrial marketing and
operations management, discussions of the ‘transition to service’ undertaken by manufacturing firms
have proliferated (Wilkinson, Dainty and Neely, 2009).
An important body of research has asserted that services play a pivotal role in product-based
firms in mature industry sectors. Likewise, in his seminal work, Teece (1986) emphasised that services
“do not loom large” in the early stages of an industry (p. 251). After the onset of maturity, product
firms should shift their innovation focus away from products to services in order to compete through
process innovation and efficiency (Suarez et al., 2013; Klepper, 1996).
The argument is that manufacturers, encountering growing commoditisation of their
businesses, ought to consider service offerings as a way to capture new revenue streams, differentiate
themselves, create value and increase profitability (Spring and Araujo, 2013). Furthermore, in
manufacturing markets, services have often been regarded as an add-on to the core product offering
and as a necessary evil in order to ensure future product sales (Robinson et al., 2002).
The transition from manufacturing to services is conventionally known as ‘servitization,’ a
term first coined by Vandermerwe and Rada (1988). The accounts of the servitization literature are
predominantly concerned with a shift in the vertical scope of firms' activities from those typically
considered as manufacturing according to standard industry categorisations to activities equally
categorised as services, such as maintenance, spares provision and condition monitoring, also known
as ancillary services (Spring and Araujo, 2013).

CHAPTER 1. INTRODUCTION 3
Such a transition is viewed as an alteration to the division of labour within a value chain that
is otherwise presumed to be mostly static, with the manufacturer taking over activities previously
carried out by its customers in order to deliver trouble-free operation for the customers. Such
additional services might be sold separately, or under arrangements based on the ‘rental/asset
paradigm’ of service (Lovelock and Gummesson, 2004), which involves the retention of ownership of
the asset (typically a capital asset) by the firm that has manufactured it, and the provision of access to
the asset rather than giving users outright ownership (e.g. Doerr, Lewis and Eaton, 2005).
A classic example of such a transformation is aero engine manufacturer Rolls-Royce plc, which
now sells its jet engines along with the services to maintain, repair and upgrade them over many years,
known as the “Power by the Hour” program. New service contracts now account for more than 50%
of Rolls-Royce’s revenues (Rolls-Royce, 2016).
However, despite the evidence that manufacturing firms in many sectors are adding service
activities to their offerings and pursuing a service-led competitive strategy, it seems that these
businesses often do not achieve the expected growth in revenues. This phenomenon has been termed
the ‘service paradox’ (Gebauer, Fleisch, and Friedli, 2005). Furthermore, while manufacturing firms
may offer services both in response to outside forces and to gain competitive advantage,
understanding of the outside factors (contingencies) that negatively impact servitization remain
poorly understood (Kowalkowski, Gebauer, and Oliva, 2017).
Although the number of studies on servitization have increased in recent years, most of the
research continues to be conceptual or based on case studies (Parida et al., 2014), and a little is known
about the antecedents of servitization and the impact of servitization on firm performance (Baines,
2015). Furthermore, the current literature lacks the quantitative empirical research (Kowalkowski,
2017) necessary to fill the theoretical and empirical gaps; this thesis seeks to partially fill these gaps.

CHAPTER 1. INTRODUCTION 4
This research complements the existing research in two ways. First, one could argue that
designing, implementing and delivering services within manufacturing firms is a straightforward task,
but this simply is not so; rather, such a strategy should be carefully and thoughtfully crafted. This
research will provide the understanding necessary to do so by investigating the cause–effect
relationships between the factors that influence the adoption of servitization and their impact on the
firm performance. The second way this research complements the existing research is by examining
the internal and external factors that the firm must understand in order to deliver a successful
servitization strategy.
1.2 Gaps in the Existing Research
Managers in manufacturing firms are not aware of servitization and its impact on organisational
performance (Spring and Araujo, 2013). The plethora of servitization studies that investigate the
relationship between servitization and organisational performance yielded contradictory results also
been vague and far from conclusive (Baines et al., 2015). Furthermore, there is a general lack of
empirical studies using survey technique and large sample (Eggert et al., 2011; Eggert et al., 2014; Fang
et al., 2008) to validate integrative model that inspect this relationship. There also a lack of identifying
the mediators and moderators that might influence such relationship.
While servitization scholars paid no attention to the fact that, there are other factors such as
service culture and the organization learning capabilities that may have a big influence on servitization
and firm performance. This failure to address the influences of other factors such as those external
factors also add to the limitations of current literature.
Also based on the existing literature there is no doubt about the impact of contractual risk on
servitization, however, a deep insight on the true nature of such risk and its classification is not
presented in the current literature, which consider rich area to be explored and bridged by this
research, therefore, this study intends to investigate the multi-dimensional risk construct and its
impact on the servitization process and firm performance. The literature also suffered from a huge

CHAPTER 1. INTRODUCTION 5
significant gap which is to the researcher knowledge there is no validate scale that measures
servitization, due to failing attempts to conceptualize and operationalise servitization concept this
huge gape this research address and will be filling this gap by developing a workable definition to
servitization construct and also by validating a scale that specifically measures servitization in
manufacturing firms. This study also proposed the industry clock speed as moderator of the
servitization- performance relationship. In which this research is trying to bridge some of the gaps of
the lack of industry level factors that might influence this relationship. The importance of this study
lies in its novel attempt to enhance the servitization dialog by better understanding of the nature of
the relationship between servitization and organisational performance and identifying those
mediators and moderator’s factors in this relationship within manufacturing firms.
As mentioned above, the existing literature suffers from two main shortcomings that underscore the
purpose and the motivation of the present research and provide the rationale for this thesis and its
scientific relevance. Those limitations are as follows:
1. Theoretical limitations
a) Limited and opaque conceptualization of servitization strategies in the manufacturing sector
b) Lack of validated scales that measure servitization
c) Lack of insight into the external contingencies (external business environment) affecting
servitization
d) Insufficient consideration of the interrelation between servitization strategies and firm
performance
e) Lack of consensus regarding which theoretical framework to use to examine servitization

CHAPTER 1. INTRODUCTION 6
2. Empirical limitations
a) Lack of quantitative studies empirically investigating the relationship between servitization
strategies and firm performance
b) Lack of statistical cause-effect analyses that take into account moderating and mediating
factors that influence the implementation of servitization strategies
1.3 Problem Delineation
In order to address the shortcomings of the existing body of research on servitization, this thesis
investigates the relationships between servitization strategies and firm performance, taking into
account both the external environment of the firm and its internal servitization practices. As illustrated
in figure 1-1, this research problem takes a “Janus-faced” view towards servitization. It also
incorporates the external and the internal perspectives on servitization and their effect on firm
performance.
Figure 0-1: Dimensions of the overarching research problem

CHAPTER 1. INTRODUCTION 7
1.4 Research Aim
The aim of this thesis is to investigate the antecedents of servitization within manufacturing
companies and to explore the impact of servitization strategies on organisational performance.
1.5 Research Objectives
1. Conceptualize servitization and identify its key elements, drawing on a systematic review of
existing conceptual, theoretical and empirical studies.
2. Identify the internal and external factors that drive servitization by examining current
theoretical and empirical development in servitization, accounting for some related theories
and measuring constructs.
3. Develop a novel integrative framework for the adoption and implementation of servitization
and its impact on firm performance, using theoretically grounded directional hypotheses to
support the proposed research model.
4. Statistically model and empirically examine the multivariate causal relationships between
servitization antecedents, servitization and firm performance.
5. Identify the different forms of service-relevant capabilities that manufacturers must possess
to successfully deliver services.
6. Based on empirically validated model, this study identifies implications for theory and
practitioners.
1.6 Research Questions
The research activities will be informed and guided by the following research questions:
1. What is servitization and how can it be conceptualized, operationalized and measured?
2. What are the internal and external factors driving servitization in manufacturing companies?

CHAPTER 1. INTRODUCTION 8
3. What are the relationships between external industry factors, servitization, and organisational
performance in the context of manufacturing firms?
4. What is the existent relationship between servitization and firm performance and how they
are bounded by organisational context?
1.7 Fundamental Aspects of Research Objectives
This thesis fundamentally depends on the collection of primary and secondary data at the firm level
(Van de Ven, 2007); for this reason, the research can be considered empirical inquiry. Furthermore,
this research can be considered applied research, whereby the theoretical knowledge gained can help
enhance managerial decision making with regard to the phenomenon under investigation. The
following scientific objectives will be applied (Neuman, 1994; Burns, 2000):
Descriptive objective: Describe the main concepts, constructs or elements concerning
servitization, as a fundamental aspect of any scientific research.
Theoretical objective (explanatory): Empirically infer the causal relationships between
endogenous and exogenous variables, and the explanation of these relationships (See Chapter
3).
Pragmatic objective: Develop practical solutions and provide recommendations for real
problems in the field of servitization in manufacturing.
1.8 Contributions
The contribution of this research is two-fold, including a theoretical and a pragmatic contribution. The
study’s findings profoundly advance the current body of servitization literature. Simultaneously, the
results should enhance managerial decision-making with regard to implementing servitization
strategies, while also revealing some of the limitations of servitization as a strategic choice. More
importantly, this thesis considers the organisational context and the interdependencies between the

CHAPTER 1. INTRODUCTION 9
internal servitization antecedents. Therefore, the findings advance the servitization dialogue and the
theoretical underpinnings of servitization practices by identifying the capabilities and resources
needed to successfully implement servitization, exploring the enabling role of the external
environment in the internal servitization process, and elucidating the impact of servitization on firm
performance.
From a practical standpoint, the results may benefit decision makers by providing a clearer
prescriptive regarding the interrelationships between external and internal factors that influence the
implementation of servitization activities. Finally, the most significant impact of this thesis will result
from empirically modelling how servitization and its antecedents explain firm financial and market
performance.
1.9 Scientific Position and Research Strategy
1.9.1 Scientific Position and Statistical Examination
This research draws on Popper’s theory of scientific explanation (Popper, 1959), which asserts that
science should offer both an explanation as well as a description of a particular phenomenon. Hence,
the role of scientific examination is to chart and structure such explanations. The theory furthermore
stresses the importance of causality as a central pillar of scientific explanation (Popper, 2005).
In this regard, the present research utilises the Deductive-Nomological Model (DN) (Hempel,
1965) to facilitate scientific explanation. According to this model, a “scientific explanation consists of
two major ‘constituents’”: an explanandum, or a sentence “describing the phenomenon to be
explained” and an explanans, or “the class of those sentences which are adduced to account for the
phenomenon” (Hempel, 1965: p. 247).
This notion encapsulates two preconditions which should be met so that the explanans can
successfully explain the explanandum. First “the explanandum must be a logical consequence of the
explanans” and “the sentences constituting the explanans must be true” (Hempel, 1965, p. 248). This

CHAPTER 1. INTRODUCTION 10
means that the scientific explanation must be a rigorous deductive argument in which the
explanandum follows as a supposition from the main principles in the explanans (the deductive part
of the model). Second, the explanans must contain at least one “law of nature” nomological. It is
noteworthy to mention that ‘nomological’ is a philosophical term of art that roughly means “lawful”
(Hempel, 1965).
In this context, de Vaus (2001) argued that social science is rather probabilistic and less
deterministic. Put differently, in strands of science like economics, management, biology, and
psychology, generalizations of results most often fail to meet both the measures and the criteria of
lawfulness. This argument can lend itself to the organisational and managerial sciences, whose
foundations are mainly built upon probabilistic assumptions, hypotheses and tendencies rather than
solid laws, in contrast to natural science. As a result, the present research draws upon the critical
proposition made by the deductive-statistical explanation (Popper, 2003), in which proposing
hypotheses is the main premise for establishing statistical “laws” by means of deduction. This means
that this research can be classified as providing a probabilistic explanation for the behaviour of people
and organizations (de Vaus, 2001).
Figure 0-2: Interrelationship between theoretical and pragmatic scientific objectives (Based on: Brunswicker, 2011).

CHAPTER 1. INTRODUCTION 11
Finally, following the statistical approach to explain servitization and the probabilistic nature
of causation, this research draws on Burns’s (2000) suggestion that when examining cause-effect
relationships, the two major pillars of scientific objectives should be followed, as shown in figure 1-2.
Elaborating on the aforementioned scientific objectives, the theoretical explanatory objective
includes an empirical analysis of the causal relationship proposed by the research. Here, real,
observable data is empirically analysed to yield meaningful results. The pragmatic scientific objective,
on the other hand, can be claimed by means of recommendations guided by the empirical
examination, which facilitates the formation of the “real” object – in case, the servitization
implementation system (including servitization strategies and organisational configurations for
resources and capabilities). In this context, the theoretical propositions are transformed into
managerial tools and technological initiatives (Popper et al., 1973). Finally, the effect will be translated
into an objective, and the cause will be applied as a means.
1.9.2 Research Design and Research Process
According to Van de Ven (2007), research design represents the structure of an enquiry. The main goal
of research design is to guarantee that the research results will enable the researcher to achieve the
research objectives and answer the research questions as clearly as possible. This entails identifying
which strategies to implement and the method to be used to collect and analyse the data (Creswell,
2009). Furthermore, there is wide agreement among scholars that delineating causal relationships
presents a significant challenge to researchers.
This challenge stems from the nature of explanatory research, which is concerned with
evaluating probabilistic causal relationships. The explanatory nature of the current research involves
adopting a more rigorous research process and design, as causal inference is a complex phenomenon,
while other descriptive research requires a less complex design and process (Schnell et al., 1993). In
this context, correlation does not necessarily equal causation. However, one of the main premises of
explanatory research is to preclude any invalid inferences. This can be achieved by full consideration

CHAPTER 1. INTRODUCTION 12
to the research border context, and treating the research as an interactive process in which the
research design guides the propositions regarding causality and the outcomes (Van de Ven, 2007).
In order to choose an adequate research design to answer a methodological question, three
main research designs can be considered:
a) Experimental (or quasi-experimental)
b) Qualitative
c) Quantitative research
First, the experimental research design undeniably offers the most reliable results and has
most powerful implications in academic discourse; it offers the means to exert control over the causal
claims while ensuring internal validity (Munch and Verkuilen, 2005). However, experimental research
is rarely seen in organisational studies, as it requires the conscious manipulation of independent
variables and a control group against which to benchmark the results. This is difficult to achieve in
complex environments such as organisations (Creswell, 2009).
The second design, qualitative research, has so far dominated the research on servitization in
manufacturing firms. Data are collected through interpretive means, leading to non-generalizable
results that lack accuracy and objectivity. Furthermore, this research design is inadequate for
statistical explanation of causality in organizational studies and economics (Creswell, 2009).
The third type of research design, quantitative research, is considered the most adequate for
testing hypotheses and examining causal models, thus facilitating the examination of the underlying
relationships between interdependences and measurable variables. Therefore, the present research
follows a quantitative research design to answer the research questions and accomplish the research
objectives.

CHAPTER 1. INTRODUCTION 13
A cross-sectional survey instrument was used to collect data on the firm level to analyse the
impact of servitization on firm performance. Structural equation modelling (SEM) was used to infer
statistical causality in a complex model, ensuring accuracy and statistical rigor (Hair et al., 2013).
It is highly important to follow a set of robust steps and procedures in order to conduct
quantitative empirical research (Van de Ven, 2007). Figure 1-3 illustrates the main steps followed in
conducting such research. In the interest of clarity, these steps do not imply a linear process but rather
a more interactive process.
As figure 1-3 illustrates, the first research activity to be performed is to specify the overarching
research questions. The second activity is to review the existing theoretical and empirical research on
the phenomena. In carrying out this step for the present study, some of the gaps in the current
literature were discovered and the important theoretical underpinnings and perspectives regarding
servitization were identified.
The third activity is concerned with constructing the study’s conceptual framework and
developing the directional hypotheses. This framework establishes the foundation for the structural
equation modelling and the empirical analysis. The fourth activity is concerned with the
operationalization of the research constructs, the sampling strategy and the data collection context.
Figure 0-3: Major research activities (Based on: Brunswicker, 2011).

CHAPTER 1. INTRODUCTION 14
Fifth and finally, the empirical analysis is performed and the statistical estimation is carried
out to infer causality. This is followed by interpretation of the results to draw out the theoretical and
the pragmatic implications of the findings.
1.10 Terminology and Fundamental Concepts
This section presents some of the fundamental concepts and terms used in the research. The terms
sometimes entail differences in meaning between the literature and real industrial practice. This
section will therefore describe how the terms are used and understood in this research. It should be
noted that servitization concept will be discussed compressively in section 2.2.5.
Customer
Customer in this research refers to any economic entity who pays for the products/services or who
uses or receives the product /service, unless otherwise specified. This term is synonymous with user,
buyer, purchaser, consumer, and client. The customer or economic entity can be business‐to‐business,
business‐to‐ consumer, individual, business‐to‐government, etc.
Company
Company refers to any organization or group of people participating in actions to generate business.
Companies’ main business objective in this research is to serve customers and generate profits. They
achieve this by providing products, services or systems (or a combination thereof). A company can be
a customer of another company when it buys products or services that other company. In this
research, the term is synonymous with supplier, provider, producer, firm, enterprise and organisation.
If two companies are collaborating to achieve a common goal and to mutually benefit from the
collaboration, they are called partners. A company can be a manufacturer, a service provider, or both.

CHAPTER 1. INTRODUCTION 15
Actor
The term actor denotes to any economic entity that is involved in the business activity between a
company and a customer. Both the customer and the company can be referred to as actors. However,
many different actors can participate in delivering the final product/service, for instance, employees,
distributors, etc. Hence, actors can be perceived as a subcategory of stakeholders, who can be defined
as anybody with an interest in the business. Actors can be those who serve upstream (supply-side)
and downstream (demand side) in the economic transaction. Furthermore, actors have the capacity
to influence the business process. According to actor network theory (Latour, 1991), an actor can take
a non-human form, including a technology, an event, or an artefact; this perspective will also be used
in this research.
Product
Product in this research is contrasted with ‘service,’ and a clear distinction is established because the
terms ‘product’ and ‘service’ have been used rather casually in the literature (Spring & Araujo, 2009).
Product will be restricted to goods and physical objects, unless otherwise specified. A product can
refer to the output of a business process that is offered to the marketplace and leads to the transfer
of ownership of the artefact.
Service
For decades, the definition of service term has been debated and it comes with several connotations.
Service in this research context refers to a non-physical activity system that is the diametrical opposite
to a product (the artefact system). It is considered to be any activity performed by a company and
offered to a customer. It may encompass an engineering meaning in terms of maintenance of
products, condition monitoring, etc., or other activities such as training, consulting, designing,
financing, operating, etc. This research adopts Hill’s (1977) definition of service as
CHAPTER 1. INTRODUCTION 16
a change in the condition of a person, or a good belonging to some economic entity, brought about as the result of the activity of some other economic entity, with the approval of the first person or economic entity. (p. 23)
System
System in this research refers to “a construct or collection of different elements that together produce
results not obtainable by the elements alone” (Maier and Rechtin, 2002, p. 78). The main goal of such
a system is to meet customer needs and to ensure high quality. Any system can be a part of a larger
system with elements including people, hardware, software, facilities, and policies. A system can
surround the product/service in order to enable the business activities to be carried out. For instance,
a system can refer to the underlying infrastructure needed to make a phone call, with the service being
the provision of telecommunications.
Value
Fundamentally, value is a subjective and hard-to-define term because it is relative and context
dependant. However, in this research context, value is perceived from the customer perspective, as
the customer judges the value of the product or service. This judgment stems from the customer’s
basic beliefs about what is good and desirable. This research also takes the perspective of value related
to how actors in the value chain can meet the needs of another actor by providing products, services,
or both.
Value proposition
Value proposition refers to any output of a company to be offered to a customer in order to generate
business opportunities and solve a specific customer problem. Furthermore, the value proposition can
be realised when the customer receives the product, service, or combination of both.

CHAPTER 1. INTRODUCTION 17
1.11 Structure of the Thesis
This thesis is structured into six chapters. Chapter One presented an introduction to the servitization
phenomenon, followed by a delineation of the study’s scope, subsequent limitations, research aims
and objectives, and main research questions. Furthermore, this chapter has shed light on the research
strategy and the scientific position taken, while also presenting an overview of the thesis structure.
Chapter Two presents a literature review on servitization and its meaning as a phenomenon.
In so doing, the chapter establishes the servitization market offering modes, followed by the
theoretical underpinnings of servitization. The chapter finishes with a reconceptualization of the
phenomena under investigation.
Chapter Three establishes the study’s conceptual framework, articulating the main principles
of framework development and causal modelling. Next, the chapter articulates each of the study’s
constructs through a respective theoretical framework. This is done in order to establish the
underlying assumptions of the proposed conceptual framework and its corresponding conceptual
rationale, which led to the development of the postulated directional hypotheses.
Chapter Four starts with a presentation of the study’s philosophical standpoint in terms of the
ontology of the servitization phenomenon and the epistemology of the phenomenon. Next, the
chapter covers the research methodology, including empirical context, target population, and
sampling strategy. The data collection instrument is described, as well as the application of the C‐OAR‐
SE method for measurement scale development and survey administration, followed by a description
of the structure equation modelling technique for data analysis.
Chapter Five presents and discusses the findings from the statistical estimation of the study’s
measurement and structure models, offering a full report of the empirical results related to the study’s
hypotheses.

CHAPTER 1. INTRODUCTION 18
Chapter Six presents the conclusions, implications and a critical discussion. The chapter starts
by presenting the theoretical implications of the research findings, followed by the pragmatic
implications for practitioners. Finally, the research limitations and directions for future research are
discussed.

19
CHAPTER2
Literature Review
2.1 Introduction
The purpose of this chapter is to articulate the theoretical underpinnings of servitization. Firstly, the
main theoretical lens resource-based view (hereafter RBV) theory, will be reviewed in order to develop
a framework for servitization antecedents in manufacturing firms. Secondly, typologies of servitization
will be covered. Furthermore, this literature review chapter is focusing on identifying the main
antecedents of servitization, which help manufacturing firms successfully transitioning into service
provision. The scope of this chapter will include addressing the main theoretical framework used in
the literature to identify servitization antecedents, while the current servitization literature is mainly
conceptual, there tend to be low agreement on key definitions and concepts related to servitization,
in which this chapter will address and critically present servitization definitions in order to derive
workable servtization definition which serves this thesis achieve its objectives and achieve a better
understanding of the servitization concept. More importantly this chapter will help understand how
manufacturing firms can offer a servitized market offirng, and what is the relationship between the
product and service(s) in the corporate offering. To do so this chapter will also carry out systematic
literature review presented to create a common understanding of the phenomenon under
investigation, its different dimensiones and characteristics, in order to support the thesis’s conceptual
model which will further advance the knowledge base.

CHAPTER 2. LITERATURE REVIEW 20
Vandermerwe and Rada (1988) coined the concept of servitization to denote the move by
manufacturing firms to enhance their offerings by introducing the provision of services; the authors
defined the concept as a move in which “corporations are increasingly offering fuller market packages
or bundles of customer‐focussed combinations of goods, services, support, self‐service, and
knowledge” (p.314).
Since then, the term has caught the attention of academia, especially in recent years,
becoming a mainstream research interest in disciplines like industrial marketing and service
operations management (Baines and Lightfoot, 2014; Bustinza, Parry, and Vendrell-Herrero, 2011;
Lindberg and Nordin, 2008; Matthyssens and Vandenbempt, 2008; Ng, Parry, Smith, Maull, and
Briscoe, 2012; Raddats and Easingwood, 2010; Spring and Araujo, 2013).
Following this development, many streams of literature have tried to implicitly and explicitly
investigate the main premises of servitization, finding inventive ways to describe servitization
phenomena, the most notable among them being ‘systems integration’ (Davies, 2004), ‘service
infusion’ (Gustafsson, Brax, and Witell, 2010; Kowalkowski, Witell, and Gustafsson, 2013), ‘service
addition strategy’ (Matthyssens and Vandenbempt, 2010) and ‘transition to services’ (Fang, Palmatier,
and Steenkamp, 2008; Oliva and Kallenberg, 2003; Ulaga and Loveland, 2014).
‘Product‐service systems’ (Manzini and Vezolli, 2003), ‘performance‐based logistics’ (Kim et
al., 2007), ‘servicizing’ (Rothenberg, 2007), ‘product-service-system (PSS)’ (Tukker and Tischner,
2006), ‘functional sales’ (Markeset and Kumar, 2005) and even ‘full-service contracts’ (Stremersch et
al., 2001) are other terms and concepts that have been coined and explored.
In the context of the present research, the main focus of investigation is the servitization
concept and its manifestations in manufacturing firms. Therefore, since the aforementioned concepts
lie outside the scope and objectives of this research, they will not be investigated here. Nevertheless,

CHAPTER 2. LITERATURE REVIEW 21
the term “transition to service” will be used in conjunction with servitization as described by Oliva et
al. (2012, p. 5):
This transition into services implies the bundling of services with the existing product offering
and that the firm has begun to consider its offer more in terms of a service offer rather than
a pure product.
Thus, as Vandermerwe and Rada (1988) assert, the term does not imply the move from a pure product
to pure service offering.
2.2 Theoretical Underpinnings of Servitization: A Resource-Based View
of the Firm
In order to position our research in a manner that displays coherence and scientific significance,
particularly in our approach to understanding firm-level success and failure when introducing
servitization strategies, this research draws upon the resource-based view of the firm (RBV) (Penrose,
1959; Richardson, 1972; Chandler, 1990) as the main theoretical lens for investigating servitization.
The RBV theoretical framework is well suited to examining the effect of service transition strategies
(servitization) on firm performance (Palmatier et al., 2007). In particular, this research deploys the
more recent incarnation of the RBV proposed by Teece et al. (1997), in which a dynamic capability or
competency-based view of the firm is taken. These two terms are usually used interchangeably in the
literature, and the dynamic capabilities theory (DCT) has been used to investigate servitization from
the supplier perspective in many studies (Benedetti, Neely, and Swink 2015; Fang et al., 2008;
Coreynen et al., 2016; Hobday et al., 2005; Alvizos, 2012).
Notwithstanding, before developing our argument, the author will try to clarify the RBV’s
theoretical framework by providing a brief explanation of how this theory was introduced and how
the DCT can lend itself to disciplinary introspection on the subject of servitization.

CHAPTER 2. LITERATURE REVIEW 22
The development of the RBV was an attempt to complement industrial organization theory
(Bain, 1968; Porter, 1979), which played the protagonist role in the discipline of strategic
management. This role was further consolidated through its focus on the structure-conduct-
performance (SCP) paradigm, which offers a causal theoretical explanation for firm performance. The
main premise of industrial organization theory is that firm performance is widely determined outside
the firm, especially by the external industry structure (referred to as the positional perspective)
(Barney, 2007). In contrast, the RBV takes an explicitly opposing view, arguing that a sustainable
competitive advantage is attained from within the firm, particularly through the use of its internal
resources. This perspective was introduced in an attempt to explain the performance discrepancies
between firms in the same industry. However, the RBV’s main purpose was not to replace the
industrial organization view, but rather to complement it (Peteraf and Barney, 2003).
Nowadays, the RBV has gained unprecedented prominence in the organisational literature,
especially in the strategy field, due to its flexibility and usefulness when working with heterogeneous
firm resources. In this context RBV is defined by Rotharmel (2013, p.5) as:
a model that sees resources as key to superior firm performance. If a resource exhibits
VRIN attributes, the resource enables the firm to gain and sustain competitive advantage.
In the evolution process of this theory, two school of thought have emerged. The first is called
the static RBV (Newbert, 2007), building on the work of Barney (1991), who introduced the initial
value, rareness, inimitability and non-substitutability (VRIN) framework to assess the firm’s resources.
This stream of literature is primarily concerned with the perspective of resource efficiency, articulating
the relationship between the resource’s rareness and value to further explain the diverse impact it
has on bottom-line performance (Peteraf and Barney, 2003).
According to Teece et al. (1994, P. 513),
The resource-based approach sees firms with superior systems and structures being profitable not because they engage in strategic investments that may deter entry and raise prices above long run costs, but because they have markedly lower costs, or offer markedly higher quality

CHAPTER 2. LITERATURE REVIEW 23
or product performance. This approach focuses on the rents accruing to the owners of scarce firm-specific resources rather than the economic profits from product market positioning. Competitive advantage lies 'upstream' of product markets and rests on the firm's idiosyncratic and difficult-to imitate resources.
The RBV also stresses the strategic role that managers play in developing new capabilities
(Wernerfelt, 1984). Furthermore, the RBV widely advocates the importance of both vertical
integration and diversification, as both can capture and yield a good return on the firm’s capital and
scarce assets controlled by the firm (Wiklund and Shepherd, 2005).
The advent of information technologies and the evolution of a sophisticated breed of
manufacturing firms required an expanded paradigm to understand how competitive advantage is
achieved. This paved the way for the second school of thought regarding the RBV that takes a dynamic
resource-based view of the firm (Armstrong and Shimizu, 2007); it is widely known in the academic
arena as the Dynamic Capabilities Theory (DCT) (Teece et al., 1994) and is considered an important
extension of the RBV theory (Wiklund et al., 2009).
Teece et al. (1997) define dynamic capabilities as
the firm’s processes that use resources—specifically the processes to integrate, reconfigure, gain and release resources—to match and even create market change. Dynamic capabilities thus are the organizational and strategic routines by which firms achieve new resource configurations as markets emerge, collide, split, evolve, and die.
In order to gain better insight into the DCT, some acceptable definitions needed to be
established within the current theory. These definitions are as follows:
Resources
Resources are defined as the firm-specific assets that are difficult to replicate or imitate. These
include the firm’s tacit knowledge, facilities, human capital, and engineering experience. These are
considered hard to transfer due to transaction costs and transfer costs (Teece et al., 1994).

CHAPTER 2. LITERATURE REVIEW 24
Core Competencies
Core competencies are defined as those capabilities (know-how) that define a firm's fundamental
business. For instance, IBM's core competencies might be considered to be integrated data
processing and service. In other words, core competencies refer to the firm’s major value-creating
skills and capabilities that are distinctive.
Because the terminology of capabilities and competencies are slightly vague and show some
ambiguity, it is important to reach a consensus about the real meanings of the terms. In this regard,
O’Reilly and Tushman (2004) stress that capabilities are usually considered to be an outcome of
managerial actions, practices or routines taken to ensure integration, learning and reconfiguration, to
capture business opportunities, and to adapt as the market and technology evolve.
The DCT argues that the competitive advantage (and hence, the capabilities and
competencies) of firms depend mainly on three pillars: the organizational processes, the asset
position, and the paths available to that position.
The first pillar of competitive advantage, the ‘organizational processes,’ denote the underlying
firm routines, practice patterns and learning, or simply the way of doing things in the firm, or in other
words, the intra-firm configuration of resources that facilitate value creation (Barreto, 2010). To sum
up the notion of process, there exist three dimensions of intra-firm processes that define the firm
capabilities: first, the rather static concept represented by ‘coordination and integration,’ also referred
to as strategic coordination; second, the transformational concept underpinning ‘reconfiguration,’
also referred to as operative coordination; and finally, the dynamic concept of the ‘learning’ process
and culture (Teece et al., 1997).
The second pillar of competitive advantage, ‘position,’ refers to the firm’s latest developments
in terms of its customer base, its external relations with its network of suppliers, its complementary
assets, and its in-house technology or intellectual property. The third pillar of competitive advantage,

CHAPTER 2. LITERATURE REVIEW 25
‘path,’ refers in particular to ‘path dependencies,’ which means that the future direction or trajectory
of the firm is a function of its current position. In other words, the previous path of the firm shapes its
future path in a changing market.
The DCT hails the strategic necessity of building dynamic capabilities, as demonstrated by the
firm’s ability to build, integrate, and reconfigure capabilities to address rapid environmental changes.
Adding to that, dynamic capabilities are often considered to be distinctive and idiosyncratic processes
that reflect the firm’s past doings and its path-dependence. This means that dynamic capabilities are
highly dependent on market dynamism and resource leveraging (Teece et al., 1997; Eisenhardt and
Martin, 2000). Eisenhardt and Martin (2000) advanced the RBV framework by emphasizing that
competitive advantage “lies in using dynamic capabilities sooner, more astutely, or more fortuitously
than the competition to create resource configurations that have that advantage” (p. 1117).
Previous research has already hinted at the link between servitization pathways and dynamic
capabilities (Hobday et al., 2005; Fischer et al., 2010; Den Hertog et al., 2010; Gebauer, 2011; Gebauer
et al., 2012a; Kindström et al., 2013). For instance, servitization research has investigated the optimal
configuration of endogenous and exogenous resources needed to deliver a servitized offer to
customers via improving the provider’s dynamic capabilities (Coreynen, 2017).
Drawing on dynamic capabilities and more broadly the RBV, the present study argues that the
success of servitization in achieving a competitive advantage depends on the firm’s ability to adapt,
integrate, and reconfigure its skills, resources, and functional competencies in a dynamic
environment. Therefore, manufacturing firms that are making the strategic choice to move
downstream towards servicing the final customer more directly must configuration their internal
resources correctly to deliver capabilities to the end user.
Furthermore, the study’s author argue that the firm’s capabilities are path-dependent and
indistinguishably linked to the strategic choice taken by management to outsource some operations,

CHAPTER 2. LITERATURE REVIEW 26
develop them in house, or more actively look for collaborations with other network actors to leverage
value co-creation (Hobday et al., 2005). Consequently, following Fang et al. (2008), the author argues
that dynamic capabilities or “the firm’s ability to integrate, build, and reconfigure internal and external
competencies,” are the most critical drivers of manufacturer competitive advantage and lead to higher
performance.
In addition, the DCT stresses the learning process as a profound driver of innovation; the
author argue that this is critical for manufacturers to implement in the process of accumulating the
capabilities needed to deliver a servitized market offering, which requires continuous assimilation,
transformation, and exploitation of organizational processes, while considering the environmental
conditions (Fang et al., 2008; Zahra and George, 2002).
As the main objective of this research is to investigate the impact of a servitization strategy
on manufacturer performance, the author argue that the service transition is widely driven by the
internal innovation of the organization’s processes and routines, which in turn influences the resource
configuration needed to achieve the intended outcome (Winter, 2006). This means that the innovation
of the firm does not lie in its ability to produce a more innovative product or service, but in the
integration of routines and organisational processes to facilitate the right configuration of internal
capabilities, such that an innovative servitized offer is produced in ever-changing market conditions
(Birchall and Tovstiga, 2005).
Finally, the author argues that for manufacturers to successfully accomplish servitization,
these very processes and organizational practices are the main antecedents of the pathway to
designing, implementing, and delivering the servitized offering (Raddats and Easingwood, 2010). A
detailed explanation of this argument will be developed in Chapter 3.

CHAPTER 2. LITERATURE REVIEW 27
2.3 Internal Factors Influencing Servitization Strategies
2.3.1 Theoretical Grounding of the Conceptualization
In order to theoretically ground a robust conceptual framework for the antecedents of servitization,
this research draws on the most important theoretical frameworks in order to develop proposition
statements about causal relationships. The following conceptualization draws upon the following five
theoretical perspectives, which inform the theoretical grounding of the research hypotheses (see
figure 2-1): the resource/capability-based view of the firm (Teece, 1997), the attention-based view of
the firm (Ocasio 1997), social network theory (Katz and Kahn, 1978), transaction cost economics
(Williamson, 1985), and principle agent theory (Eisenhardt, 1989). These perspectives are presented
in brief in the following sections.
Figure 0-1: Relevant theoretical perspectives for modelling causal relationships

CHAPTER 2. LITERATURE REVIEW 28
2.3.1.1 The Resource-based/Capability-based View of the Firm
As discussed in Chapter 2, the RBV is an influential theoretical framework that highlights the
uniqueness of the firm’s internal resources. It argues that the internal resources of a company are the
most pivotal source of sustainable competitive advantage, which will materialise in the form of higher
organizational performance over time (Barney, 1991; Penrose, 1959; Brown and Eisenhardt, 1995).
Such heterogeneously distributed resources can be bundled together to achieve a competitive
advantage by introducing fresh, value-creating strategies that cannot be easily replicated by rivals
(Eisenhardt and Martin, 2000; Barney, 1991). In an effort to expand the static perspective of the RBV,
both the capability/competency-based view and the knowledge-based view of the firm were
introduced to emphasise the importance of assets that are implicit and intangible in nature and which
form the source of competitive advantage (Grant, 1996a). The knowledge-based view suggests that
knowledge constitutes a key resource in organizations, and that the main goal of organizations is to
facilitate the creation, integration and transfer of knowledge (Grant, 1996a). While the RBV approach
views competitive advantage as being achieved through the possession and exploitation of unique
resources, the knowledge-based approach stresses the importance of learning and organizational
renewal in achieving positive organizational performance (Grant, 1996a; Birchall and Tovstiga, 2005).
A corollary to the notion of organizational knowledge-seeking is the dynamic capabilities perspective.
More specifically, the knowledge creation process is widely considered to be a crucial dynamic
capability, especially within high-technology firms (Teece et al., 1997). This can explain the rationale
behind implementing processes to enhance the firm’s absorptive capacity and external knowledge
seeking.
The dynamic capability theory (DCT) is another essential extension of the RBV theory
(Eisenhardt and Martin, 2000; Wiklund et al., 2009). According to Eisenhardt and Martin (2000, p.
1107),

CHAPTER 2. LITERATURE REVIEW 29
Dynamic capabilities are the antecedent organizational and strategic routines by which managers alter their resource base—acquire and shed resources, integrate them together, and recombine them—to generate new value-creating strategies.
In other words, dynamic capabilities can be viewed as higher-level capabilities that facilitate strategic
renewal, learning and innovation the organization. Despite the idiosyncratic nature of dynamic
capabilities (Teece et al., 1997), they can be very useful for understanding how managers configure
internal resources to enhance the firm’s absorptive capacity and value co-creation.
Teece (2007) argues that companies can achieve competitive advantage by making
supernormal profits in economic terms. This can be done by fostering, protecting and managing the
company’s intangible assets to increase their relevance in the current service economy. In the same
vein, the author argues that servitization is mostly about fostering and managing the company’s
intangible assets and enhancing its dynamic capabilities.
Previous research has already hinted at a link between servitization pathways and dynamic
capabilities (den Hertog, van der Aa, and de Jong, 2010; Fischer et al., 2010; Gebauer, Gustafsson, and
Witell, 2011; Gebauer, Paiola, and Edvardsson, 2012; Hobday et al., 2005). In particular, servitization
has been investigated to understand the optimal configuration of endogenous and exogenous
resources to improve the provider’s dynamic capabilities so that a servitized offer can be delivered
(Coreynen, Matthyssens, and Van Bockhaven, 2017; Kanninen et al., 2017)
Drawing on dynamic capabilities and, more broadly, the RBV (Barney, 1991; Wernerfelt,
1984), this research argues that the success of servitization in terms of achieving competitive
advantage depends on the firm’s ability to adapt, integrate, and reconfigure its skills, resources, and
functional competencies within a dynamic environment. Therefore, manufacturing firms that are
making the strategic decision to move downstream into servicing the final customer more directly
must adjust their internal resources to achieve a configuration that can deliver capabilities to the end
user (Baines and Lightfoot, 2014).

CHAPTER 2. LITERATURE REVIEW 30
Furthermore, firm capabilities can be considered as path-dependent and indistinguishably
linked to the strategic choices made by management to outsource certain operations, develop them
in house, or more actively seek collaboration with other network actors. In fact, Fang et al. (2008)
argue that dynamic capabilities, or the firm’s ability to integrate, build, and reconfigure internal and
external competencies, are the most critical antecedents of a manufacturer’s competitive advantage
and lead to higher performance.
DCT also stresses the learning process as a profound driver of innovation. Learning is itself a
cornerstone for accumulating the capabilities necessary to deliver a servitized market offering, and it
requires continuous assimilation, transformation and exploitation of external knowledge in
organizational processes, while adhering to environmental conditions (Fang et al., 2008; Zahra &
George, 2002).
As stated above, there are three types of dynamic capabilities – sensing, seizing and
transforming – that can be used as a framework for investigating the servitization process.
Sensing capabilities
In a servitized context, sensing capabilities refer to the tendency of some manufacturers to have a
proactive market orientation (Voola and O'Cass, 2010) through their ability to gather relevant business
intelligence locally, globally, and within the ecosystem as a whole, particularly about customers, in
turn feeding the development of service provision (Kindstrom and Kowalkowski, 2009). Such sensing
capabilities can be capitalized on only after the co-creation of the service in the customer’s unique
context (Vargo and Lusch, 2008). Furthermore, sensing capabilities can come in form of processes that
facilitate collaboration as well as platforms that allow engagement with other economic entities in the
ecosystem.

CHAPTER 2. LITERATURE REVIEW 31
Seizing capabilities
Seizing capabilities are concerned with the ability of management to exploit a sensed opportunity; this
involves selecting the product architecture and business model, determining the enterprise
boundaries, defining decision-making protocols, and building loyalty and commitment. In a servitized
context, seizing capabilities are manifest in the migration from a product-centric business model to a
more service-oriented business model through the leveraging of the manufacturer’s service-oriented
capabilities (Kowalkowski et al., 2017). Examples of seizing capabilities can be the introduction of new
processes for the acquisition of external R&D, external information (market data utilization), and
external cooperation with other parties to deliver innovative servitized offerings (Tsinopoulos, Sousa,
and Yan, 2017).
Transforming capabilities
Transforming capabilities are mostly concerned with enhancing the current business model and
ordinary capabilities (current operational capability), also known as resource optimisation, which can
be sufficient to exploit sensed market opportunities (Helfat and Peteraf, 2003).
Teece (2007) identifies four characteristics of the transforming stage: decentralized
structures, effective incentive systems, co-specialization, and particular attention paid to knowledge
management processes. Servitized manufacturers sometimes need to make fundamental changes to
their business model to reap the benefits of the emerging opportunities presented by service provision
(Kindstrom, 2010). This requires a fine tuning of business priorities, capabilities and the
interdependencies between them (Christensen, Bartman, and Van Bever, 2016), bearing in mind that
such interdependencies become rigid over time. Therefore, introducing service provision into the
business model can enhance business efficiency by bringing in a new value proposition (Visnjic,
Wiengarten, and Neely, 2016). In this context, a manufacturing firm’s current production and
operational processes might be considered as ordinary capabilities, or, as Winter (2003) suggests,

CHAPTER 2. LITERATURE REVIEW 32
‘zero-level’ capabilities, which denote ‘how firms earn a living now.’ However, what constitutes a
dynamic capability for a servitized manufacturing firm might take the form of a high-level
‘transitioning’ capability such as a new system for service infusion or a new production system (Spring
and Araujo, 2013).
2.3.1.2 Social Network Theory and Internal Knowledge Transformation Processes
By utilising network theory in this research, the concept of social capital and the value of connections
can shed light on how organizational knowledge management systems can influence the transition to
service provision in manufacturing and how this affects the firm’s value co-creation and performance
(Brown and Duguid, 1998, 2006; Uzzi, 1997).
One of the main premises of social network theory is two-fold. First, social integration is
paramount in structuring connectedness and shared meaning. Therefore, the integration mechanism
facilitates external knowledge absorption, which encapsulates the process of knowledge
transformation and assimilation (Todorova and Durisin, 2007). Second, the intra-organizational
relationships, whether strong or weak, can also influence the firm’s performance (Granovetter, 2005).
The performance benefits of embedded ties are often associated with strong and more exclusive
business relationships (Uzzi, 1997). Because strong ties can enhance the firm’s absorptive capacity and
open innovation practices (Todorova and Durisin, 2007), this research postulates them to be main
antecedents of servitization in manufacturing firms.
It noteworthy to mention that social network theory contrasts transaction cost economics
(TCE) theory, with the former stressing that firms may opt to build informal ties with other actors in
the business ecology while the latter emphasises formal business relationships built on governance
and contractual agreements. For instance, those actors can be highly specialized research
communities or external relationships formed over the course of collaboration projects with other
economic entities in the ecosystem (Simard and West, 2006).

CHAPTER 2. LITERATURE REVIEW 33
2.3.1.3 Attention-Based View
According to the attention-based view of the firm (Ocasio, 1997), organizations’ strategy depends on
the structuring of organizational attention, and firm behaviour is the outcome of how firms channel
and distribute the attention of their decision makers (Carlsson, 2008).
Ocasio (1997) argues that “an attention-based theory views the firm as systems of structurally
distributed attention in which the cognition and action of individuals are not predictable from the
knowledge of individuals, but derive from the specific organizational context and situations in which
individual decision makers find themselves” (p. 189). From the managerial and upper echelon
perspective, the dominant argument is that the information-processing capabilities of senior
managers and the upper echelon exert a substantial influence on organizational practices, including
strategic decisions, and the shared cognation of organizational members (Schein, 1985; Clapham and
Schwenk, 1991). The attention-based view of the firm is founded on three interrelated theoretical
premises: (a) focus of attention, (b) situated attention, and (c) structural distribution of attention.
The focus-of-attention principle suggests that what a decision-maker does inside the firm
depends on what issues and answers the decision-maker is focusing; he or she will be selective in
terms of the issues and answers attended to at any one time. The situated attention principle suggests
that what issues and answers a decision-maker focuses on, and his or her response to contingences,
depend on the specific context and situation. The structural-distribution-of-attention principle
suggests that the specific context that decision-makers find themselves in, and how they deal with it,
depend on how the firm distributes and controls the allocation of issues, answers, and decision-
makers within specific firm activities, communications and procedures (Ocasio, 1997). All three
principles are based on cognitive processes such as cognitive diversity, comprehensiveness, and
extensiveness, reflecting the mental models of managers (Miller et al., 1998; Cho and Hambrick, 2006).

CHAPTER 2. LITERATURE REVIEW 34
This theory can be used to analyse how a service orientation of can be embedded into
organizational culture and shaped by top management to increase the manufacturing firm’s service
offerings (Gebauer et al., 2009).
2.3.1.4 Transaction Cost Economics (TCE)
Transaction costs economics (Williamson, 1985) argues that the optimal form of organization is
primarily a function of the characteristics underlying a given exchange (Leiblein and Miller, 2003). This
theory’s main premises are as follows. First, economic actors are both boundedly rationale and
potentially opportunistic. Second, transaction cost theory explains how unfavourable exchange
conditions can increase the cost of writing enforceable contracts and create ex-post maladaptation
and encapsulation problems (Williamson, 1985). Furthermore, this theory’s main contribution is that
it solves the management dilemma of whether to vertically integrate or disintegrate, since it argues
that integration is a more efficient form of organization than market contraction, in that continuous
and frequent transactions involve either highly specific assets (physical, human, or site) or high levels
of uncertainty (demand or technological) (Williamson, 1975; Monteverde and Teece, 1982a). With
regard to uncertainty, De vita et al. (2010) state that it refers to “the degree to which ex‐ante
contractual costs and ex‐post monitoring and enforcing costs are augmented by environmental and
behavioural unpredictability, respectively” (p.658).
The main assumptions of the TCE are human foresight, bounded rationality and opportunism
(Williamson, 1999). Human foresight refers to actors who are trying to foresee consequences, and
who will react to those foreseen consequences in a way that will lead to favourable outcomes.
However, human foresight in turn assumes bounded rationality, in which actors try to predict the
imminent consequences but are cognitively limited in doing so accurately. This notion fundamentally
asserts that favourable outcomes are predicted inaccurately by human actors. A corollary of this
notion is that all contractual agreements between various parties are inherently imperfect, meaning
that they are unable to cover all contingencies (Alvizos, 2012). Lastly, Williamson (1999) suggests that

CHAPTER 2. LITERATURE REVIEW 35
in some instances agents will act opportunistically in order to amplify their gains at the expense of
exchange partners, regardless of the agents’ initial promise. Therefore, all transactions are affected
by the problem of ‘‘self-interest seeking with guile,” leading to greater economic risk for the exploited
party. To mitigate this, a credible commitment can be regarded as the offering of ‘hostage’ assets,
collateral, or plenty clauses to ensure full contractual compliance. In this context, contractual hazards
materialise especially when courts are incapable of validating the exchange partners’ knowledge
(Williamson, 1975) or guarding weak property rights (e.g. intellectual property); when non‐easily-
reusable assets are held up in the exchange; or when quality, health, safety and other risks are
undisclosed by the parties involved in the exchange (Williamson, 2000).
This theory can be highly beneficial when analysing why manufacturers opt to servitize and to
structure their transaction costs, especially in the context of outcome-based service contracts (OBCs),
which revolve around the contractual agreement to deliver predefined outcomes and results (Ng et
al., 2010). Furthermore, servitized manufacturers usually modify the structural and hierarchical
governance of the value creation process, sometimes favouring increased integration to enable higher
productivity, which in turn reduces uncertainty and transaction costs (Williamson, 2000). Therefore,
the author argues that manufacturing firms that are shifting into service provision must understand
the transaction costs related to service provision and contracting; this can help them form the right
governance structure (Jones, Hesterly, and Borgatti, 1997). They must also increase their
understanding of both the supplier and customer side to align their market offer with the customer’s
transaction governance and objectives, while ensuring frictionless value co-creation.
Table 2-1 summarise the main theatrical frameworks used in this thesis to ground the research
conceptual framework, they are widely used theories in the management studies and more specifically
in servitization literature.

CHAPTER 2. LITERATURE REVIEW 36
Table 0-1: Main management theories used to ground the research hypotheses (Adapted
from Walker et al., 2015).
Main theories Description
Key authors Construct
Contingency theory The efficiency of an organization depends on the “fit” of the internal organizational structure with environmental contingencies.
Burns and Stalker (1961); Lawrence and Lorsch (1967);
Dynamism, Industry clock speed
Recourse-/capability- based view of the firm
The resource-based view suggests that organizations should focus on their strengths through their resources rather than the environmental opportunities and threats.
Barney (1991); Wernerfelt (1984)
Servitization, Value co-creation, Absorptive capacity, Industry clock speed
Attention-based view Organizational attention and firm behaviour are the outcome of how firms channel and distribute the attention of their decision-makers.
Ocasio (1997) Service orientation of organizational culture
Transaction cost theory Focuses on the make-or-buy decision and the appropriateness of different governance forms in an attempt to minimize the costs of exchanging resources with the environment.
Williamson (1975, 1991)
Risk
Social network theory Network theory considers the relationships between (social) entities in a network.
Granovetter (1992); Huatuco et al. (2013)
Open innovation, Value co-creation

CHAPTER 2. LITERATURE REVIEW 37
2.4 External Factors Influencing Servitization Strategies
2.4.1 Theoretical Grounding of Industry Clock Speed Conceptualization
2.4.1.1 Contingency Theory
According to contingency theory, the most effective organizational structural design is one in which
the structure fits the contingencies; therefore, the performance outcomes of a certain organisational
response will depend on the context of the operations (Donaldson, 2001). Accordingly, contingency
theory encompasses three main aspects: contingency, response and performance. Contingency
variables describe the situational characteristics that are usually outside management’s control, or at
least involve considerable effort over a long time span (Sousa and Voss, 2008). The response aspect
refers to the actions taken by the organisation in response to the contingency (Sousa and Voss, 2008).
Performance aspects are the measures of effectiveness that can be used to evaluate the fit between
response and contextual variables (Sousa and Voss, 2008). In this research, the deployment of this
theory can help in understanding a manufacturing firm’s response to contingencies, such as market
volatility and industry clock speed, and can promote a more appropriate organizational design and
firm effectiveness, as well as influence different parts of the organization, such as divisions, business
units, functional departments, and work teams (Neu and Brown, 2005; Homburg, Workman, and
Krohmer, 1999).
Figure 0-2: Relevant theoretical perspectives for modelling the moderation relationship

CHAPTER 2. LITERATURE REVIEW 38
2.4.1.2 The Resource-based/Capability-based View of the Firm
The external factors that may influence servitization and its impact on firm performance can be
analysed through a recent incarnation of the RBV, namely the dynamic capability of the firm (Teece,
Pisano, and Shuen, 1997). The highly influential resource-based view of the firm suggests that firms
can be conceptualized as bundles of resources that are heterogeneously distributed across the firm,
where such resource differences persist over time (Eisenhardt and Martin, 2000; Wernerfelt, 1984). A
key principle of this theoretical perspective is that a firm’s heterogeneous resources are
fundamentally idiosyncratic, emerging from the path-dependent history of the individual firm (Teece
et al., 1997). Such resources are valuable, rare, inimitable, and non-substitutable (i.e., so-called VRIN
attributes), and as such can be a source of competitive advantage (Eisenhardt and Martin, 2000;
Wiklund et al., 2009). This research suggests a boundary condition such as industry dynamism and
high velocity markets, where the strategic challenge is maintaining competitive advantage. In such
market settings, managers use the firm’s dynamic capabilities to adapt to external changes in the firm
environment. These capabilities can take different forms. The first form is resources that can
integrated, such as product development routines in manufacturing firms, by which managers
combine their diverse skills and functional backgrounds to create revenue producing products and
services (e.g., Clark and Fujimoto, 2005; Dougherty, 1992; Helfat and Raubitschek, 2000). The second
form focuses on the reconfiguration of resources within the firm, whereby managers copy, transfer,
and recombine resources, especially knowledge-based ones, within the firm. This can be achieved via
resource allocation routines, which are widely used to distribute scarce resources such as capital and
manufacturing assets from central points within the hierarchy (e.g., Burgelman, 1994; Burgelman et
al., 2004). The third form focuses on the gain and release of resources (Eisenhardt and Martin, 2000).
Such resources include knowledge creation routines by which managers and others build new forms
of thinking within the firm – a particularly crucial dynamic capability in industries like pharmaceuticals,
optical disks, and oil, where cutting-edge knowledge is essential for effective strategy and
performance (e.g., Helfat, 1997; Henderson and Cockburn, 1994; Rosenkopf and Nerkar, 1999).

CHAPTER 2. LITERATURE REVIEW 39
2.5 Servitization Articles
The journals with the largest numbers of contributions are presented in table 2-2. As depicted
in figure 2-3, the year of publication ranged from 1988 to early 2017. A surge of interest in recent
years is evident from a sharp rise in publications concerning servitization from 2009 onwards,
remaining at a level of about 25 articles per year from 2012-2017.
Table 0-2: Journal distribution of servitization articles
Journal Number of articles
Impact Factor (2016)
% of articles
Industrial Marketing Management 28 3.50 17% Journal of Manufacturing Technology Management 19 1.75 11% International Journal of Production Economics 18 4.34 10% International Journal of Operations & Production Management
11 3.93 6%
Management Journal of Service Management 10 3.94 5% Remaining 56 journals 82 N/a 51%
1 0 0 0 0 0 0 0 0 0 0 0 0 0 1 1 1 1 16
11 12 11 12 13
45
6372
103
80
0
20
40
60
80
100
120
19
88
19
89
19
90
19
91
19
92
19
93
19
94
19
95
19
96
19
97
19
98
19
99
20
00
20
01
20
02
20
03
20
04
20
05
20
06
20
07
20
08
20
09
20
10
20
11
20
12
20
13
20
14
20
15
20
16
20
17
Nu
mb
er o
f P
up
licat
ion
s
Year
Figure 0-3: Yearly distribution of servitization articles

CHAPTER 2. LITERATURE REVIEW 40
Table 2-3 summarizes the methodological frameworks used by the academic community in
investigating servitization. The findings show that the majority of articles are primarily case studies
and conceptual studies, accounting for 73% and 78% of the articles, respectively. The main aim of
these studies was theory building; this has been the main focal point among servitization researchers
(45% of total peer-reviewed articles), followed by theory refinement and theory exploration. It is
notable that some of the research on theory refinement is not merely descriptive, but also explores
and supports other theories and results. Unsurprisingly, the findings support our assertion that survey
methodologies have rarely been used in the servitization research, especially for theory testing.
Table 0-3: Methodological structure of servitization research
Action research
Case study
Conceptual study
Literature review
Quantitative Survey/case study
Total
Description 0.7% 3% 6% 0.01% 9.7% Exploration 0.3% 13% 5% 7% 0.2% 3% 25.5% Theory Building 3.4% 27% 14% 44.4%
Theory refinement
0.2% 4% 3.2% 3% 10.4%
Theory testing 10% 13%
Total 3.9% 44.7% 25.2% 16% 10.2% 100%
2.6 Empirical Research on Servitization
In analysing the latest empirical studies on servitization that followed a quantitative research
methodology, the systematic review yielded 16 survey-based publications. These covered only specific
geographic regions, with a narrow perspective on servitization. These findings support our claim that
an empirical gap exists in the servitization literature, with empirical research only accounting for
approximately 10% of the total article dataset in the current review (16 out of 168 articles). Thus,
quantitative analysis addressing servitization remains scant and shows limitations (Benedettini, 2015).
Table 2-4 presents a list of empirical servitization research.

CHAPTER 2. LITERATURE REVIEW 41
Table 0-4: Quantitative studies on servitization
Author Country Sample Methodology Industry
Leo and Philippe, 2001 France 8480 companies
Quantitative Exports
Gebauer, 2007 Worldwide 30 Quantitative Machinery and Equipment
Antioco et al., 2008 Belgium, the Netherlands and Denmark
137 companies
Quantitative Various
Fang et al., 2008 USA 477 companies
Quantitative Various
Gebauer, 2008 German and Switzerland
212 Quantitative Machinery and Equipment
Neely, 2008 worldwide 13,775 companies
Quantitative Various
Panesar et al., 2008 Norway 62 companies Quantitative Oil and Gas Davidsson et al., 2009 Sweden 364
companies Quantitative Pulp and Paper
Gebauer et al., 2010 Europe 106 Quantitative Various Gebauer et al., 2011 Europe 332 Quantitative Various Raddats and Easingwood, 2010
UK 40 Quantitative Various
Oliva et al., 2012 Germany 216 Quantitative Various Visnjic et al., 2013 Worldwide 44 Quantitative Various Raddats and Kowalkowski, 2014
UK 145 companies
Quantitative Various
Eggert et al., 2014 22 countries 882 companies
Quantitative Various
Ruizalba et al., 2016 Spain 219 Quantitative Pharmaceutical
The most influential research on servitization using secondary data was conducted by Fang et
al. (2008), who employed the COMPUSTAT database, as well as Neely (2007, 2008), who based his
studies on the OSIRIS database. The information relevant to servitization in both databases comes
from company profiles and should be explored with caution, using methodologies such as survey-
based research (Fang et al., 2008).

CHAPTER 2. LITERATURE REVIEW 42
2.7 Summative Content Analysis Procedures
In order to untangle some of the complexities in the servitization literature and the many
concepts associated with the servitization phenomenon, a fine-grained conceptualization of the term
must be developed. The first step in understanding the qualifications and meanings of the servitization
concept is to undertake a rigorous structured review of the literature on the topic. Subsequently, a
summative continent analysis (Hsieh and Shannon, 2005) should be done to extract and articulate a
definitional view of the phenomenon. Finally, five main questions will guide the systematic review and
conceptualization:
What is the definition of servitization?
How can a manufacturing firm perform servitization?
What are the challenges of servitization?
What are the main antecedents of servitization?
How to reconceptualise servitization?
NVivo 10 software was used for the content analysis to accomplish three main objectives.
First, it allowed the coding of different parameters found in the articles reviewed; second, it allowed
for a detailed analysis of any emerging themes; and finally, it allowed us to structure the observations
and outcomes in a meaningful manner.
This analysis constituted five major stages, each with a different focus in order to answer the
review questions:
1. Stage One was concerned with determining the article’s major contribution toward defining
the servitization concept in manufacturing. This helped established the key definitions used
in the discourse on servitization.

CHAPTER 2. LITERATURE REVIEW 43
2. Stage Two was concerned with identifying the type of market offerings delivered by
manufacturing firms when adopting a servitization strategy, along with a comparison of these
offerings. This helped address the question of how manufacturing firms carry out servitization.
3. Stage Three was concerned with constructing the theoretical underpinnings of the
servitization concept and determining the theoretical orientation of the current research.
4. Stage Four was concerned with identifying the emergent antecedents of and challenges faced
by servitization.
5. Stage Five was concerned with reconceptualising servitization by building on robust
theoretical underpinnings and insights found in the current literature.
This analysis started by highlighting the term ‘servitization’ in the text in order to understand
the contextual use of word. This approach is referred to as manifest (on the surface) content analysis
(Potter and Levine-Donnerstein, 1999), and was followed by latent (under the surface) content
analysis, in which the content is interpreted (Holsti, 1969). The focus was on discovering the
underlying meanings of the word and content (Babbie, 1992; Morse and Field, 1995). This approach
was deemed to be adequate for this research because it is an unobtrusive and nonreactive way to
study the servitization phenomenon. Huff (1990) and Duriau et al. (2007) argue that this qualitative
analysis technique is powerful because the text analysis helps highlight any cognitive schemas, the
aggregation of words helps unearth underlining themes, and the repetition of keywords can be used
to structure associations and bonds between underling concepts.
The coding procedure was performed by the author, and acceptable inter‐coder reliability was
reached through a reiterative coding process (Neuendorf, 2002). It is noteworthy to mention that the
content analysis was carried out as a purely qualitative approach rather than a quantitative approach
entailing coefficients and thresholds. Finally, evidence for the internal consistency and credibility of
the analysis are presented in Section 2.2.9 (Weber, 1990).

CHAPTER 2. LITERATURE REVIEW 44
2.8 Definitional Issues and Contribution to Servitization Dialogue
The previous section presented the methodology for analysing the literature, and this section will
present the findings with regards to definitions of servitization of manufacturing. These findings were
extracted to develop a relevant conceptualisation of servitization. In order to establish a reference
point for the review, the first paper that used the term, Vandermerwe and Rada (1988), will be
analysed first. Subsequently, the review will take a chronological approach toward addressing the
contemporary definitions of servitization in the literature.
Vandermerwe and Rada’s (1988) article was primarily based on interviews with senior
managers from service and manufacturing companies. The authors found that services were
considered paramount in the formulation of corporate strategy and the enhancement of competitive
advantage, especially for manufacturers making the strategic shift toward service provision. The most
vivid argument highlighted in this thesis was that companies should always search for an adjacent
service to their value proposition in order to enhance the customer experience. Furthermore, the
authors suggested that an offering should be flexible and customised, and that this can be achieved
by actively introducing additional products and services that extend beyond the company’s core
business activities.
The main contribution of this thesis is that it offers an exceedingly flexible framework that
companies can follow to adopt servitization. Vandermerwe and Rada (1988) emphasise the following
in particular: services can be replaced or substituted with products and products with services;
services by definition can be produced by products; and services can be added to products or
incorporated into the offering to improve the value proposition.
The thesis also managed to anticipate the role of technology in advancing servitization in
manufacturing by addressing the role of artificial intelligence (A.I.) and expert’s systems. Both of these
forms of technology are now considered to be within grasp, especially with the advent of remote

CHAPTER 2. LITERATURE REVIEW 45
monitoring systems (RMS) and diagnostic software built into smart products. Such technologies could
provide machine operators and maintenance engineers with real-time information that they can then
use to schedule maintenance checks, improve machine efficiency, and enhance operational efficiency
(Wing, 2016).
2.9 Contemporary Definitions of Servitization
This section will address the most prominent definitions of servitization put forward in the literature,
presented in a chronological manner. For full list of definitions of the concept, see table 2-5.
According to Robinson et al. (2002) servitization is
[a concept] which goes beyond the traditional approach of providing additional services but considers the total offer to the customer as an integrated bundle consisting of both the goods and the services. (p. 150)
This definition is considered an extension of Levitt’s (1969) conception of the ‘augmented product’
and is in line with Vandermerwe and Rada’s (1988) conceptualization of the phenomenon.
Slack (2004), who comes from the operation management field states that
servitization is the generic term that has come to mean any strategy that seeks to change the way in which product functionality is delivered to its markets. And hence companies are becoming aware of the value of the servitization of their products. That is, marketing the capability that their products bring. (p. 384)
Lewis et al. (2004) aslo adopt this definition to investigate the servitization phenomena.
Brax (2005) argues that servitization is a process in which “companies are adding more and
more value to their core offering through services while experiencing a shift in their core business” (p.
146).
Ahlström and Nordin (2006) studied servitization of manufacturing in B2B business‐to‐
business service provision context defining servitization as a strategy:
to establish service supply relationships to deliver product services in order to augment their physical products” and thus “differentiate themselves from the competition by offering a higher level of services than their competitors. (p. 77)

CHAPTER 2. LITERATURE REVIEW 46
Nordin (2006, p.302) further articulates the notion of “business solutions, full maintenance
contracts, and managing customers’ operations” as the primary strategic objectives for
manufacturers, and argues that services such as “repair, product support, product‐oriented training,
installation, and systems integration” are secondary objectives for the servitized firm.
Lindberg and Nordin (2008) investigated the process of buying complex services (from the
buyer perspective) and defined servitization as the phenomenon in which “firms move from
manufacturing goods to providing services or integrating products and services into solutions or
functions” (p. 292). More interestingly, this paper takes a unique approach by investigating
servitization from the buyer’s perspective. In doing so, the authors identify a challenger to the service-
dominant logic, citing “a diametrically opposed logic implying the objectification of service … by
materializing, standardizing, specifying or packaging services and making them more tangible” (p.292).
For more about this strand of literature, see Araujo and Spring (2006).
In a seminal paper by Neely (2008), the financial consequences of servitization on
manufacturing were investigated using a large sample of worldwide manufacturing firms. Here, the
author introduced the servitization concept as a movement in which manufacturing firms “move
beyond manufacturing [to] offer services and solutions, often delivered through their products, or at
least in association with them” (p.104). At a further point, the paper defines servitization as “the
innovation of an organisation’s capabilities and processes so that it can better create mutual value
through a shift from selling product[s] to selling Product–Service Systems” (p.107). It is noteworthy to
mention that Baines et al. (2009a) adopted a fairly identical view of servitization. For the interest of
clarity, it can be assumed that the first definition above from Neely (2008) can be viewed as a sectorial
reference to the manufacturing business ecology, while the latter definition refers to the servitization
of the manufacturing firm itself, in terms of the internal transformation process.
The two concepts most cited in the literature to describe the transition from manufacturing
to service provision are servitization (Vandermerwe and Rada, 1988) and PSS (Goedkoop et al., 1999;

CHAPTER 2. LITERATURE REVIEW 47
Tukker, 2004). The latter is defined as a combination of products and services in a system that provides
functionality for consumers and reduces environmental impact, while servitization is defined as a
market package or customer-focused combinations of goods, services, support, self-service and
knowledge. As the two concepts overlap on some points, Baines et al. (2007) proposed a synthesis of
both terms. A [P-S] is thus defined as an integrated combination of products and services that deliver
value in use.
Later, Baines et al. (2009b, p. 495) introduced the concept of product‐centric servitization,
defining it as “the phenomenon where a portfolio of services is directly coupled to a product offering”
or as “goods combined with closely related services (e.g. products offered with maintenance, repair,
finance, etc.).”
It should be noted that Baines et al.’s (2009b) notion of product‐centric implies a very specific
servitization type, and thus I argue that this implies of the existence of other possible types (modes)
of servitization. This will be discussed later in the chapter (Section 2.7).
According to Lewis and Howard (2009), servitization is a trend in which manufacturers place
“a greater emphasis on a whole range of novel product‐service combinations” (p. 3). In their paper,
the authors investigated the global automotive markets from a supply chain perspective. The paper
contributes to the understanding of the servitization by introducing two types of servitization
strategies: ‘value‐creating,’ meaning that it is intended to increase customer perceived value, and
‘efficiency maximising,’ meaning that it is intended to reduce organisational costs, which are invisible
to customers. In other words, servitization can be implemented using two paths, the first of which
would be leveraging the perceived value through value added to the core business offerings, and the
second of which would be cost cutting via outsourcing, offloading assets and horizontal integration.
Johnstone et al. (2008) refers to servitization as “a general trend away from a ‘pure product’
orientation towards a combined [P‐S] offering” (p. 862). This concept was utilised in the paper to
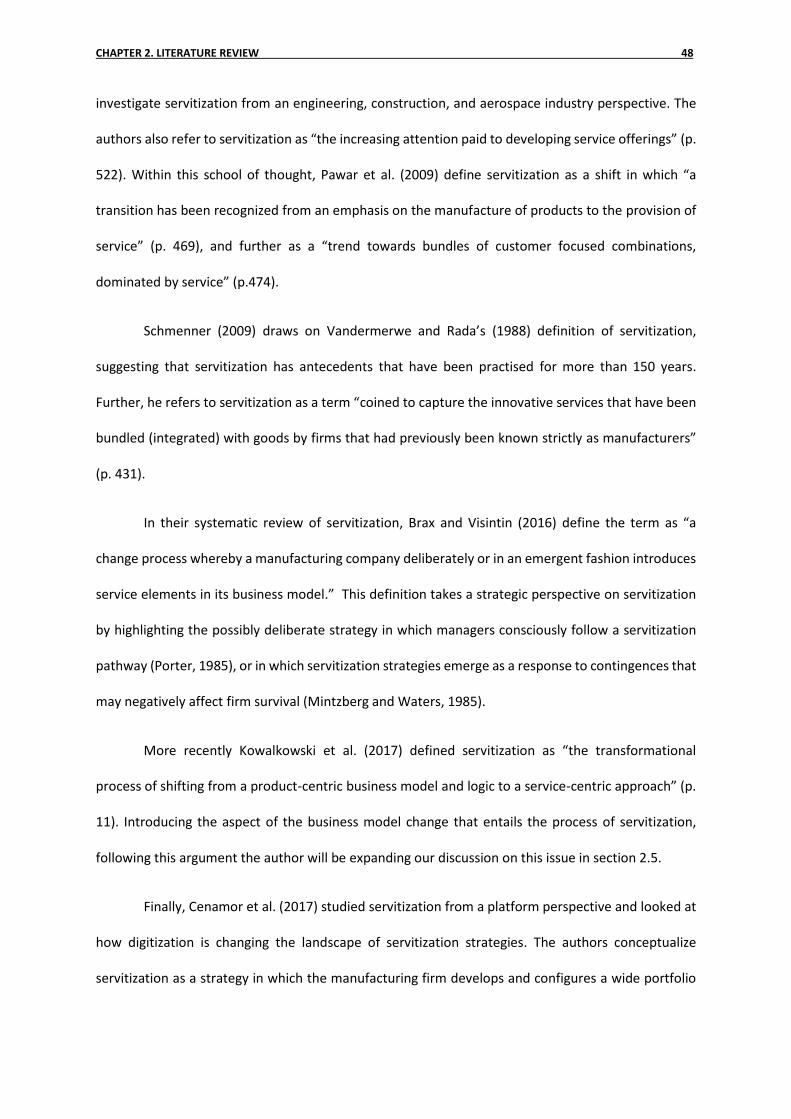
CHAPTER 2. LITERATURE REVIEW 48
investigate servitization from an engineering, construction, and aerospace industry perspective. The
authors also refer to servitization as “the increasing attention paid to developing service offerings” (p.
522). Within this school of thought, Pawar et al. (2009) define servitization as a shift in which “a
transition has been recognized from an emphasis on the manufacture of products to the provision of
service” (p. 469), and further as a “trend towards bundles of customer focused combinations,
dominated by service” (p.474).
Schmenner (2009) draws on Vandermerwe and Rada’s (1988) definition of servitization,
suggesting that servitization has antecedents that have been practised for more than 150 years.
Further, he refers to servitization as a term “coined to capture the innovative services that have been
bundled (integrated) with goods by firms that had previously been known strictly as manufacturers”
(p. 431).
In their systematic review of servitization, Brax and Visintin (2016) define the term as “a
change process whereby a manufacturing company deliberately or in an emergent fashion introduces
service elements in its business model.” This definition takes a strategic perspective on servitization
by highlighting the possibly deliberate strategy in which managers consciously follow a servitization
pathway (Porter, 1985), or in which servitization strategies emerge as a response to contingences that
may negatively affect firm survival (Mintzberg and Waters, 1985).
More recently Kowalkowski et al. (2017) defined servitization as “the transformational
process of shifting from a product-centric business model and logic to a service-centric approach” (p.
11). Introducing the aspect of the business model change that entails the process of servitization,
following this argument the author will be expanding our discussion on this issue in section 2.5.
Finally, Cenamor et al. (2017) studied servitization from a platform perspective and looked at
how digitization is changing the landscape of servitization strategies. The authors conceptualize
servitization as a strategy in which the manufacturing firm develops and configures a wide portfolio

CHAPTER 2. LITERATURE REVIEW 49
of modular components of products, services, and information [technologies] to be delivered through
a service platform. This elaboration emphasizes product and service modularity, which in turn
facilitates the integration between different business functions. Such modularity is paramount in the
coordination efforts taking place between the back end (e.g., the R & D unit) and the front end (e.g.,
the marketing and sales unit), representing a key aspect in the implementation of services (Silvestro
and Lustrato, 2015).

CHAPTER 2. LITERATURE REVIEW 50
2.10 Content Analysis and Findings
In examining the relevant servitization literature, a variety of contributions and definitional concepts
emerged. These findings are summarized in table 2-5, along with the authors.
Following our research questions, particularly regarding what servitization involves, three
main content categories were identified, one manifest and two latent. These three categories were
used to inform the coding procedure. The manifest category was named ‘Servitization Qualifier’
(Alvizos, 2012), referring to words that were used to denote the main meaning related to servitization.
Identifying these words helped answering the question ‘what does servitization means?’
The two latent content categories used in the coding process were named ‘Market Offering’,
and ‘Value.’ In the interest of clarity, the terms ‘offer’ (Johne and Storey, 1998), ‘market offering’
(Brännström, 2004), and ‘product’ (Kotler & Keller 2006) are used interchangeably to describe value
propositions. The two latent categories are described as follows:
1. The ‘Market Offering’ latent content category refers to the type of business offering that
servitized manufacturing introduce to the market. This category is mainly concerned with
exploring the relationship between the product and the service(s) to reveal how the original
firm offerings are presented to the marketplace. Table 2-5 presents the final codings for both
the manifest category ‘Servitization Qualifier’ and the first latent content category ‘Market
Offering.’
2. The latent content category ‘Value’ explores how the value is created with the servitized
offering. In other words, where does the value lie in a servitized offering context? The results
for this category are presented in table 2-5.

CHAPTER 2. LITERATURE REVIEW 51
2.10.1 ‘Servitization Qualifier’ ‘Market Offering’ and ‘Value’Categories
The coding process was informed primarily by the context in which servitization was referred to in the
respective study, in terms of configuration and application. It noteworthy to mention at this point that
the manifest category presents the coded content as closely as possible to the original literature
source, especially in terms of the wording used by the contributing authors. This strict procedure was
followed for the majority of the sample in table 2-5 to ensure the credibility of the content analysis.
However, some exceptions were required for some articles (e.g., Nordin, 2006; Schmenner, 2009;
Cenamor et al., 2017) in order to unearth the qualifier.
The first latent content category ‘Market Offering’ was used to refer to how the servitized
final offering looks when introduced to the market. This categorization was inspired by Tukker (2004),
who proposed that PSS offers can range from products with services as ‘add-ons,’ to services with
tangible goods.
After the completion of coding, any possibly meaningful emergent structure was thoroughly
scrutinized, resulting in the three categories described above. The first category, ‘Servitization
Qualifier,’ entails three predominant concepts: ‘Strategy,’ ‘Process,’ and ‘Trend.’ Here, strategy is
defined as “a plan of action designed to achieve a long-term or overall aim” (Compact Oxford English
Dictionary, 2017), a trend is defined as “a general direction in which something is developing or
changing,” and process is defined as “a series of actions or steps taken in order to achieve a particular
end”.
With regard to the ‘Offering’ category, three overarching themes were extracted in the
analysis supporting Alvizos (2012) same findings. As can be seen in Fig. 5, the first theme is called
‘Product and Services,’ indicating that the potential offering in a servitized context may contain two
separate stages: first, selling the product by itself, and then expanding the offering by adding
complementary services. Here, the manufacturer has the option to sell the newly offered service to a
totally new market segment, as well as to its existing market.

CHAPTER 2. LITERATURE REVIEW 52
The second theme within the ‘Market Offering’ category is ‘Product with Services,’ referring
to the situation in which the manufacturer’s servitized offering consists a core product bundled with
a set of services. Conceptually, this means that the product and the service are intertwined to some
degree, precluding stand-alone status for either.
The third – and most critical – theme, which emerged in the latent ‘Market Offering’ category,
diverges significantly from the two aforementioned two themes. It is called ‘Product Functionality,’
denoting that the core product is a vehicle for delivering services to the customer. In other words,
customers are purchasing the capabilities and functionalities of the product. At this point, it is
important to clarify the meaning of ‘product’ in the servitization context. According to Spring and
Araujo (2017), “products have been seen as largely stable entities imbued by the manufacturer with
competences or ‘frozen knowledge,’ entering into the customer's domain to provide pre-defined
‘problem solving services’” (p. 3).
Figure 0-4: Abstract view of approaches to servitization (Source: Alvizos, 2012, p. 29).

CHAPTER 2. LITERATURE REVIEW 53
Table 0-5: Definitions of servitization in the literature (Adopted from Alvizos, 2012)
Author(s) Definition Main aspects in definitions
Manifest content codes
Latent content codes
Servitization Qualifier
Market Offering
Stra
tegy
Tre
nd
Pro
cess
Pro
du
ct a
nd
serv
ice
Pro
du
ct w
ith
serv
ice
s
Pro
du
ct
fun
ctio
nal
ity
Robinson et al., 2002
Servitization is a concept which goes beyond providing additional services to consider the total offering to the customer as an integrated bundle consisting of both the goods and the services.
× ×
Slack et al. 2004 Lewis et al., 2004; Slack, 2005
Servitization is a strategy that seeks to change the way in which product functionality is delivered to markets (by way of marketing the capability rather than the product).
× ×
Brax, 2005 Servitization is a process in which companies add increasing value to their core offering through services.
× ×
Ahlström and Nordin, 2006
Servitization is a strategy that seeks to establish service supply relationships to deliver product services in order to augment a physical product offering.
× ×
Nordin, 2006 In a servitization strategy, business solutions, full maintenance contracts, and managing customers' operations are valued over repair, product support, product-oriented training, and systems integration.
× ×
Johnson and Mena, 2008
Servitization is a competitive strategy that involves the bundling of products and services. Servitization involves a customer proposition that includes a product and a range of associated services.
× ×
Lindberg and Nordin, 2008
Servitization is the trend in which firms move from manufacturing goods to providing services or integrating products and services into solutions or functions.
× ×
Neely, 2008 Servitization is the phenomenon in which manufacturing firms move beyond manufacturing and offer services and solutions, often delivered through their products, or at least in association with them.
× ×
Neely, 2008; Baines et al., 2009a
Servitization is the innovation of an organisation's capabilities and processes so that it can better create mutual value through a shift from selling products to selling Product‐Service Systems.
× ×
Baines et al., 2009b
(Product‐centric) servitization is the phenomenon in which a portfolio of services is directly coupled to a product offering.
× ×

CHAPTER 2. LITERATURE REVIEW 54
(Continuation of Table 2-6)
Author(s) Definition Main aspects in definitions
Manifest content codes
Latent content codes
Servitization Qualifier
Market Offering
Stra
tegy
Tre
nd
Pro
cess
Pro
du
ct a
nd
serv
ice
Pro
du
ct w
ith
serv
ice
s
Pro
du
ct
fun
ctio
nal
ity
Baines et al., 2009b
Servitization is the offering of goods combined with closely related services
× ×
Lewis et al., 2008 Servitization is a strategy where manufacturers place a greater emphasis on a whole range of novel product‐service combinations. Servitization may be either 'value creating' (adding perceived customer value) or 'efficiency maximizing' (a form of outsourcing).
× ×
Johnstone et al., 2008
Servitization is the general trend away from a 'pure product' orientation towards a combined Product‐Service offering.
× ×
Pawar et al., 2009
Servitization is the transition from an emphasis on the manufacture of products to the provision of services.
× ×
Schmenner, 2009
Servitization is a term coined to capture the innovative services that have been bundled (integrated) with goods by firms that had previously been known strictly as manufacturers.
× ×
Visnjic and Van Looy, 2013
Servitization is a business model innovation process that develops the firm's innovative capabilities and creates value at the consumer level by offering a balance of products and services.
× ×
Baines, 2014 Servitization is a change in business model from selling products to selling capabilities, or the combination of products and services that enable the desired outcomes for customers.
× ×
Brax and Visintin, 2017
Servitization is a change process whereby a manufacturing company deliberately or in an emergent fashion introduces service elements into its business model.
× ×
Cenamor et al., 2017
Servitization is a strategy in which a manufacturing firm develops and configures a wide portfolio of modular components of products, services and information to be delivered through a service platform.
× ×

CHAPTER 2. LITERATURE REVIEW 55
2.10.2 Contemporary Views of Servitization ‘Market offering’
The literature content analysis highlights the concept of providing advanced services. Baines and
Lightfoot (2013) define this as a focus on the capability as an outcome delivered through product use.
Schroeder and Kotlarsky (2015) furthermore argue that the provision of advanced services represents
a special case of servitization in which the manufacturer provides the customer with a capability
instead of a product.
By investigating advanced service provision, Baines and Lightfoot (2013) offer a service
typology by which manufacturers can categorize their market offerings. Figure 2-5 illustrates these
three categories. The first category is labelled as ‘Base Services’ and refers to the core of any offering
from a manufacturing firm. These are the basic services concerned with the initial provision of the
product (e.g., a machine tool) and related spare parts. The second category is labelled ‘Intermediate
Services’ and includes services such as repair and overhaul, which require a high degree of
involvement from the service provider with the goal of ensuring product performance.
Finally, advanced services main features, is the economic model associated with usage and
penalties. In this case, a contractual agreement is established between providers and customers to
share both the risk and rewards. In addition, advanced services have been acknowledged to offer
higher levels of customer value on average than intermediate services, via improved performance,
availability and reliability (Baines, Lightfoot, and Smart, 2011b). Baines and Lightfoot (2013) articulate
that the fundamental premise of advanced services generally requires providers to take over a
customer’s business process activities, and in special cases take over the customer’s specific
operational activity. Under this scenario, the customer pays for trouble-free operations. This is
considered a backbone of the modern conceptualisation and practice of servitization.

CHAPTER 2. LITERATURE REVIEW 56
Another important framework was introduced by Kindström and Kowalkowski (2014) and
Ulaga and Reinartz (2011) as guidance by which manufacturing firms can excel in their service
offerings; this framework is called the ‘servitization pyramid.’ As shown in figure 2-6, the framework
has two dimensions: the horizontal dimension, in which the core focus of the service can be to support
either the product or the customer processes, and the vertical dimension, which improves the value
proposition on the provider side by providing customers with pre-defined input, pre-agreed-upon
performance, or a guaranteed result. These market value propositions are customized to customer
needs. Baines and Lightfoot (2013, p. 64) further suggest three customer segments that correspond
to each type of service offering shown in figure 2-5. The first segment includes those customers “who
want to do it themselves,” the second are those “who want us to do it with them,” and the third are
those “who want us to do it for them.”
Figure 0-5: Types of services that a manufacturer can offer (Source: Baines and Lightfoot, 2013, p. 68).

CHAPTER 2. LITERATURE REVIEW 57
Hobday et al. (2005) investigated the system integrator located at the top of the servitization
pyramid; it is considered the ultimate servitization mode that a manufacturing firm can seek to acquire
and provide. The authors argue that simultaneous “twin” processes of vertical integration and
disintegration take place in the process of providing the solution, where the provider seeks a vertical
or micro-vertical (Baines et al., 2011b) integration with the customer to provide the solution, while
the customer experiences a disintegration (or from a managerial perspective, outsourcing) of some
manufacturer activities in order to focus the firm on its core competencies.
Figure 0-6: Servitization pyramid (Source: Coreynen et al., 2017, p. 2).
CHAPTER 2. LITERATURE REVIEW 58
2.10.3 Examples of Servitization in Industry
Table 2-6 presents key examples of the shift in mindset of some leading names in global
manufacturing, who uniformly march downstream in an effort to exploit opportunities provided by
incorporating services.
Table 0-6: Examples of servitization in industry (Adapted from Tan, 2010)
Company From Products Centric To servitization and total solutions
Alstom Railway vehicles and signalling
‘Total Train-life Management’ Maintenance, upgrade and operation of trains and signalling systems, product availability.
Caterpillar Construction and mining, heavy machinery
Autonomous mining solution, financing, insurance, rental, maintenance, support, monitoring, optimization through analytics, training, etc.
Danfoss Refrigeration controls and sensors
“Cooling total solution for food retail” – design and implementation, asset management, maintenance, energy management, etc.
Dupont Paint “Chemical management services” – quality painted surfaces, etc.
Douwe Egberts
Coffee “Coffee solutions” – leasing coffee machines, supply of coffee beans, maintenance.
Electrolux Professional washing machines
“Laundry systems” – helping initiators to start a new laundrette or to upgrade old ones, installation, training, financing, etc.
Philips Home appliances, lighting, and medical equipment
“Pay per lux” – selling light as service, asset management, condition monitoring, etc.
Rolls Royce Aircraft engines “Power-by-the-hour” – Total care, guaranteed flying hours for aero engines, maintenance, back-up service, condition monitoring, predictive and self-diagnostic maintenance, spare parts life management, etc.
SKF Ball bearings “Engineering consultancy services” – condition monitoring, industrial sealing, lubrication and vibration analysis, etc.
Siemens Power generation, medical technology
Energy saving; support customer operations, plant availability, asset management; equipment procurement, replacement, management, maintenance, repair and financing, etc.
Xerox Photocopying machines
“Document management services” – guaranteed fixed price per copy, leasing, maintenance, equipment monitoring, paper and toner supply, document and data management, etc.
Industries are aspiring to transform value perceptions into value propositions in order to
attract customers and lock them in. For additional insight into servitization strategies and the
transition from a product-centric to a more customer-centric firm, and for examples of disruptive
changes to the value proposition related to servitization and solution provision, see table 2-7.

CHAPTER 2. LITERATURE REVIEW 59
Table 0-7: Industry examples of changes in servitization value propositions (Source: Sharma
and Molloy, 1999)
Industry Traditional Value Proposition Solution Value Proposition
Chemicals “We sell a wide range of lubricants.”
“We can increase your machine performance and up-time.”
Pharmaceuticals “We sell pharmaceuticals.” “We help you better manage your patient base.”
Utilities “We provide electricity reliably.” “We can help you reduce your total energy costs.” Truck manufacturing
“We sell and service trucks.” “We can help you reduce your lifecycle transportation costs.”

CHAPTER 2. LITERATURE REVIEW 60
2.10.4 Servitization from the ‘Value’ Perspective
In this section, the second latent content category of ‘Value’ will be discussed. Ng and Nudurupati
(2010) argue that value is clearly central to the servitization understanding, and that the current
literature has diverged from the old school of thought that perceived value as coming from value-in-
exchange (the transactional perspective) (Smith, 1776) to the more adequate concept of value-in-use
(Vargo and Lusch, 2008).
Vargo and Lusch (2004), Tukker and Tischner, (2006) and Ng et al. (2009a) argue that value
must be evaluated by the customer, rather than based on the monetary aspect during the transfer of
ownership of a particular good. This shifts the firm toward a customer-focused orientated, meaning
that the customer pays only for the delivered outcome, rather than simply for activities and tasks.
Furthermore, Ward and Graves (2007) argue that the mindset in manufacturing has shifted to
the extent that many “now view the manufactured products as incidental” (p. 465), meaning that what
is purchased is not the manufactured product but rather the benefit or “value” that is derived from
the product and its associated services.
In their seminal work, Vandermerwe and Rada (1988) observe the following:
The point … is that a larger component of the added value in customer offerings is going into services. And since the primary objective of business is to create wealth by creating value, “servitization” of business is very much a top management issue. (p. 315)
This proposition highlights the value that is added to the offer, meaning that the value is treated as
cumulative as it moves downstream in the value chain (Wise and Baumgartner, 1999), and where
added services are merely viewed as a differentiation strategy to achieve a competitive advantage.
Tukker (2004) articulates the value position related to PSS when he states that “the ability to
create and capture sustained added value (often referred to as shareholder value) is often seen as the
key measure of success in business” (p. 250). At a later point, he accepts Porter’s (1985) argument
that manufacturers must take a strategic position in the value network in order to capture value,

CHAPTER 2. LITERATURE REVIEW 61
justifying his position by arguing that the creation of (tangible and intangible) value alone is not
sufficient.
Neely (2008) also contributes to the debate on the servitized value argument by clarifying that
his position adopts Vargo and Lusch’s (2004) service dominant logic (SDL). He states that “a servitized
organisation designs, builds and delivers one or more integrated product and service offerings that
deliver value in use” (p. 10), meaning that the customer is only paying for the delivered outcomes,
rather than for discreet activities and tasks.
Baines et al. (2009a) start their argument by viewing value as an add-on to the offering, stating
that “the main part of total value creation [is] considered to stem from physical goods, and services
[are] assumed purely as an add-on to products” (p. 555). The authors also maintain the service-
dominant logic in perceiving value by defining PSS as an “integrated product and service offering that
delivers value in use.” This vague position, however, only adds to the confusion caused by the
contradictory arguments from the previously-mentioned literature. Baines (2014) later takes a side
favouring the SDL, stressing the notion that nowadays customers are more interested in buying a
“capability” rather than products; this requires a business model change in order to deliver the sought-
after value proposition.
Prahalad and Ramaswamy (2004) stress the value co-creation that occurs between the
manufacturer and the customer, stating that customers nowadays are stepping out of their traditional
role to become co-creators as well as consumers of value. It is important in this context to mention
that the definition of value co-creation entails both value in use and value co-production, with there
being a clear distinction between the two (Ranjan and Read, 2014).
According to Pawer et al. (2009), value is defined by the producer of goods and realised by the
beneficiary: “This means that what is sold is not the manufactured product, but the benefit or ‘value’
which customers derive from the product, and associated services” (p. 469). However, their study

CHAPTER 2. LITERATURE REVIEW 62
failed to capture the essence of value in use, implying that value is defined by the producer. This
proposition is in line with the goods dominant (G-D) logic argument, in which the customer is the
recipient of the goods and value is determined by the producer (Vargo and Lusch, 2004). Grönroos
and Helle (2010) make a significant contribution to the value literature because in their paper,
value for customers and value for the firm are discussed and analysed separately as separate, non-interactive phenomena. However, the value a supplier can create in a business engagement with a customer is dependant of the value that this customer can create from being involved in the same relationship. Hence … in this sense value is considered a mutually created phenomenon. (p. 565)
This manufacturing paradigm shift demands a less “firm-centric” and more interactive model of
business in order to accommodate the concept of mutually created value.
Finally, Vargo and Lusch (2004 p.7) argue that in a servitized context, “a firm cannot ‘satisfy’
a customer; they can only collaboratively support value co creation.” This means that a manufacturer’s
offering is purely value unrealised, i.e. a “store of potential value,” until the customer releases this
stored value through actual use in co-creation to realize the intended benefits (Smith et al., 2014; Ng
and Smith, 2012). Table 2-8 below summarizes which types of value in a servitized offer are presented
by the literature.
Table 0-8: Types of value in a servitized offer presented in the literature
Author(s) Value Type in Servitized Offer
Added value Value in use Value co-creation
Vandermerwe and Rada, 1988 ×
Tukker, 2004 ×
Neely., 2008 ×
Baines et al., 2009;
Baines et al., 2007
×
Prahalad and Ramaswamy, 2000 ×
Pawer et al., 2009 ×
Grönroos and Helle, 2010 ×
Smith et al., 2014 ×
CHAPTER 2. LITERATURE REVIEW 63
2.11 Challenges of Servitization
Manufacturing firms have traditionally focused on producing products and capturing value by
transferring the ownership of their product to the customer through a sales transaction (Porter and
Heppelmann, 2015). Accomplishing a smooth transition from pure manufacturing to the addition of
service provision is far from a seamless process (Oliva and Kallenberg, 2003), and this transition is
considered to be a type of organisational change (Whelan-Berry and Somerville, 2010), requiring a
deep understanding of the systematic challenges that may be faced by the manufacturer in the change
process. Through the research content analysis carried out in the present study, the most prominent
internal and external challenges were identified and will be described below.
2.11.1 Organisational Challenges
According to Oliva and Kallenberg (2003), manufacturing firms that undertake servitization
increasingly face new realities within the firm boundaries. As such, new organisational structures need
to be re-engineered to facilitate service design and delivery; new internal and external process need
to be redesigned to fit the new service delivery routines; and an entire organisational alignment is
needed to deliver on the new value proposition (Johansson et al., 2003).
This change process requires a fundamental change to the organizational culture, such that
the organizational environment is made more accommodative to service provision. Gebauer et al.
(2005) found that changing organizational culture is one of the most prominent challenges faced
during servitization; this notion is widely supported in the literature (Neely, 2008; Baines et al., 2009b;
Mathieu, 2001b). The fundamental change in the mindset of a manufacturer whereby the embedded
product culture is abandoned is a necessity in order to become a service-centric manufacturing firm
(Martinez et al., 2010; Rust and Miu, 2006). However, Slack’s (2005) findings confirm that
manufacturing firms widely perceive themselves to be makers of physical goods, with services being
merely 'add-ons,' rather than perceiving themselves as providers of products-as-a-service; such a
mindset hinders the servitization process.

CHAPTER 2. LITERATURE REVIEW 64
Another organizational challenge facing manufacturing companies is that coherence requires
awareness on the part of top management of strategic choices (Martinez et al., 2010). This challenge
is manifested in the requirement to develop clear, implementable service management principles,
process and recourses (Tukker and Tischner, 2006a). However, such efforts largely fail due to top
management’s lack of service-oriented strategic insights and skills, which are required in order to
manage new, geographically dispersed activities (Araujo and Spring, 2006), as well as due to a failure
to configure internal process to facilitate coordination across functional silos (Gawer and Cusumano,
2013).
Cohen et al. (2006) further argue that manufacturers need to master the art of providing
solutions by 1) understanding the customers’ needs, 2) building strategic partnerships, 3) managing
various partners needed in the service delivery process, 4) fostering solution customization, 5)
prioritizing resources, and finally, 6) planning for contingencies; all of these steps are required to put
the organization on a trajectory toward servitization.
Baines (2014) and Brax and Visintin (2017) suggest that for manufacturers to successfully
embrace servitization, they need to develop a new business model that can create and capture the
value that servitization promises. This business model change should subsequently leverage the shift
from transactional selling to a product-as-a-service model. In this context, it is the manufacturer’s
responsibility to support and service its products throughout the product life cycle, along with finding
an innovative way to make service more tradable, with a smooth cost structure (Spring and Araujo,
2013).
Baines et al.’s (2009c) findings suggest that the process of integrating services into products
will increase the organisational complexity, confirming the findings of other scholars (Johnstone et al.,
2008; Tukker and Tischner, 2006a; Slack, 2005). To overcome this challenge, Gebauer et al. (2005)
suggest that manufacturing firms should clearly define the service development process, which will
minimize the strain on different business functions.

CHAPTER 2. LITERATURE REVIEW 65
Furthermore, manufacturers ought to create a separate service and solution organisation that
will be responsible for its own profit and losses, with its own control system, information system, and
marketing and sales force. Hence, Davies et al. (2006) argue that a new firm structure must contain
three fundamental functions: a front-end, customer-facing function in which the role of the
salesperson is to ensure customer success; a back-end capability provider; and a strong strategic
centre.
The seminal work of Reinartz and Ulaga (2008) suggests that a new breed of service managers
must come into existence in order to ensure successful servitization. Such managers must have a
variety of skills, talents and traits; they include service-savvy sales managers, relationship managers,
and service development managers, all of whom have one goal in mind: customer success. Johnstone
et al. (2009) further assert that employee engagement and commitment are critical to servitization
success.
In terms of the communication challenges that manufacturing firms face in their transition to
service provision, Brax (2005) found that most manufacturers have no structural process for obtaining
feedback from their customers, despite the saying that ‘feedback always beats a manager’s intuition.’
The lack of feedback and communication hinders the servitized offering. To overcome this challenge,
research (e.g., Bitner and Brown, 2008; Mathieu, 2001b) has revealed that manufacturing firms must
implement clear internal and external communication strategies in order to leverage cross-functional
collaboration and communication within the firm’s boundaries. This can lead to better customer
engagement and better service customization.
In addition, some manufacturing firms that have introduced a digitization strategy are
increasingly building analytics capabilities in order to understand their customers in greater detail.
They are doing so by actively collecting data on the products or the processes they provide; this is
called ‘product wrapping’ and is offered to enhance the customer experience (Westerman et al.,
2014).

CHAPTER 2. LITERATURE REVIEW 66
2.11.2 Financial Challenges
Financial challenges are considered one of the major risks and uncertainties facing manufacturing
firms in their transition to service provision (Vladimirova, 2012; Oliva and Kallenberg, 2003). Changes
on the firm level required in order to provide a servitized market offer involve a substantial increase
in investment into acquiring new resources, capabilities and competencies (Araujo and Spring, 2006).
Despite the fact that most top management see servitization as uncharted territory as well as
an opportunity that needs to be exploited (Gebauer and Fleisch, 2007), manufacturing firms still hold
a fuzzy perspective on how to identify the strategic, financial, and marketing opportunities arising
from service provision. In particular, they find it extremely difficult to establish the structure of their
revenue model, mainly with regard to pricing their market offerings (Baines et al., 2007). This is due
to top management’s struggle to comprehend that pricing for services is mostly high. Thus, companies
need a detailed understanding of the value stream when providing services. In addition, delivering
services involves the complex integration of internal and external resources over a long period,
enabling the producer to support the product over its life cycle or over its contractual agreement. This
requires a special knowledge of risk management and its corresponding pricing technique
(Benedettini, Swink, and Neely, 2017).
Gebauer et al. (2006) find that product managers in manufacturing firms are more risk averse
than managers in different sectors, and that top management prefer an outcome of their operations
that can be easily quantified. This causes them to miss out on the economic opportunities that
servitization can provide. Gebauer and Friedli (2005) also found that there is a systemic bias on the
part of product managers against services, as they fear the dilution of their core product strategy.
Furthermore, according to Hobday et al. (2005), most servitized companies have a serious
problem with making the right choice between integration and disintegration, meaning that they
widely miscalculate the transaction cost. This miscalculation leads to the strategic mistake of
outsourcing core processes or vertically integrating with other actors in the network, which may cause
CHAPTER 2. LITERATURE REVIEW 67
irreversible financial damage and hamper the firm’s chances of survival if the third party fails to
achieve the minimal required performance. To avoid such a situation, Neely (2008) suggests that
manufactures should have a rigorous mechanism for managing and controlling long-term risk and
exposure, as well as metrics to assess the financial performance of servitization.
2.11.3 Customer Challenges
The literature discussing the challenges of servitization emphasises the important role the customer
plays in servitization success (Tukker and Tischner, 2006b; Vladimirova, 2012). However, customers
also pose a significant challenge to manufacturing companies that are adopting servitization, in that
the development of a new relationship with the customer requires cultural and cognitive proximity
(Mathieu, 2001b). This challenge arises from the fundamental business model change from
transaction- to relationship-based that the manufacturer must undergo, which requires a new
customer-centric orientation to accommodate the new service offering (Oliva and Kallenberg, 2003;
Brax, 2005).
The findings of Isaksson et al. (2009) and Baines et al. (2007) suggest that manufacturing firms
adopting a servitization strategy must achieve a higher degree of customer involvement in all phases
of service development, starting from the designing of the service to the actual service delivery. To
overcome these customer challenges, Bitner and Brown (2008) assert that manufacturing firms should
first educate their customer, second, co-create services with their customer, third, build their
customer experience, fourth, know their customer’s needs, and finally, enhance their customer’s total
experience. The servitization research also places huge importance on the value proposition, which
must be focused on solving customers’ actual problems and must be built on actual measurable
outcomes and capabilities (Gebauer et al., 2005; Neely, 2008; Neu and Brown, 2005).
Interestingly enough, Johansson et al. (2003) suggest that manufacturing firms must servitize
one customer at a time when delivering solutions, arguing that solutions have unique characteristics
and require high levels of customization and integration. However, the higher the level, the more

CHAPTER 2. LITERATURE REVIEW 68
troublesome and expensive the solution will be for the manufacture to offer it. Therefore,
manufacturers adopting servitization must develop distinctive insights into their customers and
industry and exploit those insights in order to develop an integrated, customized solution that
outperforms the available alternatives.
Manzini and Vezzoli (2002) argue that manufacturing firms that offer services must educate
their customer on the nature of the offering. This is because customers can sometimes be quite
apprehensive about giving vendors access to sensitive data and specific facilities. Adding to that,
customers may find it difficult to comprehend that some offerings are not based on ownership
transfer, but rather on access. In this context, the customer is buying a predetermined level of
availability or an outcome that meets his objectives (Matthyssens and Vandenbempt, 2010).
Furthermore, some customers prefer to retain full control over their risk exposure, contradicting the
main premise of servitization in terms of transferring risk to providers or at least sharing it them
(Williams, 2007; Neely, 2008). Following this line of argumentation, Spring and Araujo (2009)
recognize that performance‐based contracts are a form of servitization, with the main focus being on
“the shift in incentives and re‐allocation of risk between the supplier and the customer” (p. 454). This
entails the considerable challenge of defining the performance level requirement and then measuring
it accordingly.
2.11.4 Supply Chain Challenges
This content analysis uncovered a wide agreement in the servitization literature with regards to the
challenges faced in the supply chain, particularly in terms of managing the supplier, which requires a
high level of cooperation, formation of alliances, and building of strategic partnerships, rather than a
merely transactional relationship (Tukker and Tischner, 2006a; Vladimirova, 2012). In fact, the
operation management discipline recommends that external resource alignment should be a strategic
objective of top management in order to improve lead time (shorter time to market), market
responsiveness, and achieve maximum agility (Baines et al., 2009a; Slack, 2005). Furthermore, some

CHAPTER 2. LITERATURE REVIEW 69
manufacturers find themselves in a situation in which they are required to establish a coopetition
relationship with competitor in order to achieve common goals and deliver sound solutions. For
instance, rival manufacturers may share the same production platform or collaborate on a specific
technology or patent (Ruizalba et al., 2016; Mathieu, 2001a).
Managing supply chain challenges in the servitization operational sphere requires a special set
of skills to be formed, new partnerships to be created, and wider set of suppliers in both directions
(upstream and downstream), who need to be managed effectively (Windahl and Lakemond, 2006;
Johansson et al., 2003). This kind of operational development facilitates the establishment of new
competitive dynamics and sometimes a shift of power occurs within the existing supply chain to
accommodate the servitization initiatives (Brax, 2005; Wise and Baumgartner, 1999).
2.11.5 Market Challenges
Mont and Lindhqvist (2003) describe market challenges as circumstances imposed by the market that
may adversely affect manufacturing firms adopting servitization, possibly leading to a service
transition failure. Such adverse market circumstances can take the form of conflicts of interest
between collaborating firms, new entrants, new public policies, new regulations, and lack of capital
investment (Manzini and Vezzoli, 2002). However, Oliva and Kallenberg (2003) mention that
manufacturing firms adopting servitization may
face the difficulty of managing two tightly-coupled markets. On one hand, increasing service quality and scope might extend the product’s useful life, thus reducing its replacement sales. On the other hand, increasing the quality and durability of products might reduce future service revenues. (p. 164)
In addition, firms may face great challenges in creating a service network to support a geographically
dispersed installed base (IB). Finally, some scholars describe the shift from products to services as “a
move into a highly complex market” (Neu and Brown, 2005), especially when the transition requires
the development of new networks to work with a new distribution channel.

CHAPTER 2. LITERATURE REVIEW 70
2.12 Antecedents of Servitization
The content analysis performed in this section reveals some of the major antecedents of servitization
(Vladimirova et al., 2011b). According to Mont and Lindhqvist (2003) and Baines et al. (2009b), the
antecedents, drivers, enablers or factors (these terms are used interchangeably here) of a successful
transition to service provision have not received the necessary attention from the research
community. Therefore, the present research will try to bridge part of this literature gap.
The current literature addresses different factors that influence the adoption of servitization
strategies, such as customer pull by means of changing preferences and expectations, and technology
push by means of process innovation and the advancement of information and communications
technology (ICT) (Baines et al., 2009b). Some of these factors are imposed upon the firm from the
immediate external environment, such as a change in the legal system that pushes the manufacturing
firm to look into service provision in order to achieve compliance (Goedkoop et al., 1999). Another
external factor that can push a manufacturing firm to consider a servitization strategy is the need to
protect market share from competitor encroachment.
The argument put forward by Wise and Baumgartner (1999) indicates that selling standalone
products is becoming less and less attractive for manufacturers, especially because the product
market is currently suffering from both commoditization and stagnation. Matthyssens and
Vandenbempt (2008) define commoditization as “a dynamic process that erodes the competitive
differentiation potential and consequently deteriorates the financial position of any organization” (p.
317). It endangers the very existence of the firm.
Add to that the fact that products nowadays enjoy longer life spans (Wise and Baumgartner,
1999), meaning that the installed product base is expanding in an unprecedented way due to a culture
of consumerism among the developed world. This product base explanation creates new
opportunities for many industries to service their ever-expanding installed product base, which in turn

CHAPTER 2. LITERATURE REVIEW 71
drives a genuine interest on the part of manufacturers to adopt servitization as a new stream of
revenue (Oliva and Kallenberg, 2003).
Another important factor that leads manufacturer to seek and explore servitization pathways
is the interest on the part of management in making the business more agile, flexible and highly
specialized, or in other words, focusing on the business’s core competences. That means that a new
wave of outsourcing and disintegration is underway, which is pushing other players in the network to
grab these business opportunities and vertically integrate with other customers to provide a desired
solution. With this development, a new breed of firms has emerged that call themselves ‘system
integrators.’ For example, the multinational company Apple has outsourced most of its operations to
other manufacturers in order to focus on its core competencies of design, supply chain integration
and marketing (Davies et al., 2007; Tukker and Tischner, 2006a).
The adoption of servitization can be seen through the lens of strategic differentiation in order
to escape the product commoditisation trap and enhance the firm growth. This holds true when
adding services to the firm offering as a source of competitive advantage, since services are widely
considered to be more stable in an economic downturn cycle, less labour intensive, and difficult to
imitate. This claim is supported by the notion that services require the building of long-term
relationships with customers rather than merely transactional, short-term relationships (Goedkoop et
al., 1999; Oliva and Kallenberg, 2003).
Mont (2002b) articulate that sustainability and being environmentally conscious are another
major factor pushing companies to show interest in offering services, as they seek to develop the
capabilities to manage products throughout their life cycle. Rabetino et al. (2015) present the typical
life-cycle of a product as consisting of four phases: pre-sales, sales, post-sales and de-commissioning.
The authors argue that the manufacturer’s service offering can be positioned in one or more of these
phases, especially in the de-commissioning phase, where the company can leverage the notion of the

CHAPTER 2. LITERATURE REVIEW 72
circular economy. This new term refers to managing products from cradle to cradle, challenging the
unidirectional management of products from cradle to grave. Spring and Araujo (2016) suggest that
a linear ‘take-make-dispose’ model of production and consumption, is untenable nowadays […] as environmental pressures and material scarcity stimulate interest among industry, policy and academic communities in what is becoming known as the circular economy. (p. 2)
Other antecedents of servitization will be explored in in Chapter 3 when developing the study’s
conceptual framework.

CHAPTER 2. LITERATURE REVIEW 73
2.13 Servitization and Business Model Innovation
The findings of the literature analysis show that an emerging and important new perspective on
servitization has yet to materialise; this new perspective views servitization as merely a change in the
manufacturer’s business model to incorporate service provision and deliver capabilities (Baines, 2014;
Brax and Visintin, 2017).
In order to understand this emerging theme, it is important to explore the meaning of a
business model. However, as the business model literature is vast and diverse (e.g., Morris et al., 2005;
Osterwalder et al., 2005; Richardson, 2008; Teece, 2010; Bask et al., 2010; Zott et al., 2011; George
and Bock, 2011), a deep investigation of business model innovation is outside the scope of this
research. As such, this thesis will adopt the most influential definition of a business model, developed
by Harvard scholars Christensen and Johnson (2010). This framework will help to explain the
servitization strategy in a more profound way and will strengthen the theoretical underpinnings of
this research.
According to Christensen and Johnson (2010), the conventional business model encapsulates
four intertwining – and thus, interdependent – elements, that when incorporated together, lead to
the creation and delivery of value. These are the value proposition, resources, processes, and finally,
the profit formula (see figure 2-7).

CHAPTER 2. LITERATURE REVIEW 74
The meaning of each element in the framework depicted in figure 2-7, and how it relates to
manufacturer servitization strategies, will be explained in the following.
2.13.1 Value Proposition
The value proposition refers in this context to the solution (product or service) that enables the
customer to undertake a specific job they are trying to accomplish in a more efficient and affordable
way. Here, job refers to a business problem the customer faces, leading to the need to seek a solution.
This job is usually multidimensional, meaning that there can be functional, social, and emotional
dimensions to the result that is required. In short, the value proposition asks “what is needed for the
job to be done perfectly?” from the customer perspective. If the value proposition helps the customer
accomplish a job they are not trying to do – even if the customer should be doing that job – it falls
outside the fundamental basis for a business model.
Figure 0-7: Business model elements (Source: Christensen and Johnson, 2010, p.2).

CHAPTER 2. LITERATURE REVIEW 75
2.13.2 Resources
A clear articulation of the value proposition is pivotal to clearly defining the resources a firm must
deploy to deliver the sought-after value proposition. These resources, for instance, can be considered
to be anything the firm can buy or sell, hire or fire, or assemble or dismantle, such as human capital,
facilities, technology, brand, distribution channels, cash, products, etc.
2.13.3 Processes
As a firm deploys its resources to deliver the value proposition, processes glue things together
(integrate). Processes in general have two segments. The first consists of the processes that can be
controlled, monitored and consciously managed; these are mainly visible and can be codified. The
second segment consists of routines and recurring tasks that evolve over time to form a habitual way
of working together. Once these processes start to work together continuously and harmoniously in
a successful manner, they become the status quo of the firm and will be followed by mere assumption
rather than explicit decision. This helps create the so-called the ‘culture of the organization.’
2.13.4 Profit Formula
In general, the profit formula is concerned with the question of how firms make money from their
value proposition. The profit formula (or revenue model) is concerned with the key financial
indicators, the gross and net margins that the firm must meet the structure of the firm, and the fixed
and variable costs related to its resources. It also identifies the size of the firm needed in order to
break even, the adequate level of return on assets, and profit improvement patterns.
In sum, the value proposition is concerned with how a firm creates value for customers, while
the profit formula is concerned with how the firm creates value for the firm and its shareholders. The
resources and processes are concerned with the mechanism by which value will be delivered to both
the customer and the firm.

CHAPTER 2. LITERATURE REVIEW 76
In a further elaboration of this business model framework, the arrows that connect the boxes
in figure 2-7 are bidirectional because the sequence in which the four boxes of the business model are
assembled typically varies by circumstance. For instance, when a manufacturing firm offers a value
proposition in the form of service provision, such as product functionality and reliability, the sequence
usually proceeds in a clockwise manner starting from the value proposition. In this context, the profit
formula is derived from the resources and processes that are required to deliver the service – the
product functionality and reliability. Building on the perspectives in the aforementioned business
model literature, Baines (2014) argues that pure manufacturers are required to innovate and change
their business model by having the right resources with the right processes and the right revenue
model to successfully undertake the servitization journey. The present paper will maintain this view
of servitization and will argue that servitization in one way or another requires a change in the business
model of the manufacturer, or a fundamental repositioning of the business model, to incorporate
services in the firm offering. This position is taken when reconceptualising servitization Section 2.7.

CHAPTER 2. LITERATURE REVIEW 77
2.14 Reconceptualization of the Servitization Concept
In this section, I will attempt to synthesize the literature’s findings as well as add a critical
interpretation of the literature by reframing of servitization concept to arrive at a definition that suits
the objectives of this research. The definitional analysis of servitization presented earlier in this
chapter, coupled with the categorization of servitized market offerings by manufacturing firms, can
be explained by the RBV theoretical framework, which in turn emphasises the ‘business model change’
required by manufacturers in order to move into service provision.
This thesis adopts a business model definition that is fundamentally rooted in the RBV’s main
premises in terms of the crucial importance of adjusting the intra- and inter-firm resources and
processes to match market dynamism. The findings from the systematic literature review suggest that
the market offering is the main unit of analysis that determines the following: 1) the extent to which
the manufacturer needs to integrate with the customer; 2) the extent to which the firm must change
its business model; 3) the extent to which risk exposure is acceptable; 4) the required degree of
customer intimacy; 5) the degree of service complexity required, and 6) the degree of value co-
creation required. To shed more light on these postulations, four different modes of market offerings
in a servitized context are proposed:
Product-centric servitization
Process-centric servitization
Operation-centric servitization
Platform-centric servitization
Figure 2-8 depicts these four servitization modes, each of which requires a different degree of business
model change and a different level of customer integration.

CHAPTER 2. LITERATURE REVIEW 78
Figure 0-8: Servitization modes

CHAPTER 2. LITERATURE REVIEW 79
2.14.1 Product-Centric Servitization
Product-centric servitization refers to the outcome focused on product provision (Baines et
al., 2009a) such as providing spare parts. This mode of basic services requires a low degree of
integration with customer process and necessitates no fundamental alteration in the provider’s
business model. It usually does not require any customer intimacy in terms of the exchange, as it is
recognized to be mostly transaction based. Thus, in this context, providing services is considered to
be low risk, the co-creation value is very minimal, the service design is far from complex, and value is
added to the product.
2.14.2 Process-Centric Servitization
According to Kindstrom and Kowalkowski (2014), process-centric servitization refers to the outcome
focused on asset management, preventive maintenance, and condition monitoring. This mode of
servitization requires a higher degree of customer integration and a modest alteration of the
provider’s business model in terms of incorporating different resources and new process to achieve
the outcome the customer is seeking. The service design requires some degree of complexity and
there is higher risk exposure. The manufacturer attempts to increase customer intimacy in terms of a
better relationship and collaboration in order to overcome some of the servitization challenges posed
by customer or the market. A good example of this mode of servitization is the paint manufacturer
DuPont, which provides services to the automobile industry. As an alternative to selling paint and
being paid per litre supplied, DuPont is now involved in operating the car manufacturer paint line
(taking over the painting process) and is paid per car painted. This is an explicit example of the
common practice known as chemical management services (CMS) (Stoughton and Votta, 2003).
2.14.3 Operation-Centric Servitization
According to Ulaga and Reinartz (2008), operation-centric servitization refers to outcomes focused on
capability delivery, in which a higher degree of integration with the customer is needed as well as a
greater degree of business model modification. The main objective, from the customer perspective, is

CHAPTER 2. LITERATURE REVIEW 80
to disintegrate from a specific operational function and outsource this entire operational activity to a
third party – in many cases, to a manufacturer that has adopted a servitization strategy. This mode of
servitization can be seen as the situation in which manufacturer moves from a ‘box‐pushing’ business
model to some form of an ‘availability/leasing’ business model, where the firm’s main focus remains
on the original product market segment (e.g. Rolls Royce’s Power‐by‐the‐Hour total service offering).
In this context, a contractual agreement needs to be executed, governance modifications need to be
introduced, and value is delivered through customer use (value-in-use). The risk is higher with this
form of servitization due to the increased service complexity and responsibility. This type of outcome-
based contract is usually designed to share the rewards and penalise poor performance.
2.14.4 Platform-Centric Servitization
The term ‘platform-centric servitization’ is being put forth by the present paper in an attempt to
advance and develop the servitization literature. This term refers to manufacturing firms that deliver
services through a high degree of customer integration and a high degree of business model
modification, where the service offering is highly complex and the value proposition is based on a high
degree of value co-creation between the different actors in the ecosystem. A good example of a
platform leader is Intel, the world’s leading manufacturer of microprocessors. The company created
a platform aimed at orchestrating industry-level innovation by providing an open system and
interfaces to enable outside companies to ‘plug in’ complementary products and services for solution
delivery. This platform serves different business environments and different industrial sectors.
The main focus of this emerging concept of platform architecture and design is to build a base
of modular products and services, which can later be integrated to deliver a customized solution to
the customer. Another interesting example is Daimler AG, the holding company that manufactures
the prestigious Mercedes Benz luxury car brand. This company recently views itself as provider of
mobility rather than a manufacturing company, and it has built its platform around services. It
outsources the manufacturing of many car parts to third parties, and has built its platform to be a

CHAPTER 2. LITERATURE REVIEW 81
system integrator for information from different vendors (Daimler, 2016). It is important to
understand that several manufacturing firms have developed ‘product platforms’ in which the
customer solution is delivered by simply modifying, adding, or subtracting different features (Gawer
and Cusumano, 2013). In this context, Baines (2009) suggests that managers should move toward
‘portfolio thinking’ in delivering products and services. However, the author favours Gawer and
Cusumano’s (2013) suggestion of “platform thinking,” which refers to “understanding the common
elements that tie the firm’s offerings, markets, and processes together, and exploit[ing] these
commonalities to create leveraged growth and variety” (p. 419).
In their interesting article, “Products to Platforms: Making the Leap,” Zhu and Furr (2016) state
the following:
In a product business model, firms create value by developing differentiated products for specific customer needs, and they capture value by charging money for those items. In a platform business model, firms create value primarily by connecting users and third parties, and they capture value by charging fees for access to the platform. Platform models bring a shift in emphasis—from meeting specific customer needs to encouraging mass-market adoption in order to maximize the number of interactions, or from product-related sources of competitive advantage (such as product differentiation) to network-related sources of competitive advantage (the network effects of connecting many users and third parties).
As this research is concerned with how platform thinking can be utilized in the servitization
context, it is highly important to understand the term ‘external or industry platform.’ This term has
been defined by Gawer and Cusumano, (2013, p. 410) as follows:
Products, services, or technologies developed by one or more firms, and which serve as foundations upon which a larger number of firms can build further complementary innovations and potentially generate network effects.
This type of platform is highly dependent on, first, the co-creation of value between network actors,
second, the level of access of outside firms to the platform in order to utilize its capabilities, and finally,
the degree of risk sharing among the members of the ecosystem. However, for this type of platform
to succeed, it is vital to ensure the openness of the system. Such openness should be embedded in
the platform foundation to foster the scalability by linking the core and peripheral subsystem

CHAPTER 2. LITERATURE REVIEW 82
components, which collaborate to deliver a specific solution to a customer problem. This can be
achieved while maintaining some degree of control over the platform and its interdependences
(Schilling, 2009). Furthermore, the main premise of platform thinking is that the platform is being
founded as a ‘manageable object,’ meaning that the organizations that embrace it are purposefully
bringing together multiple actors within the industry as users and complementors.
The emerging literature on servitization has sporadically discussed the platform idea in terms
of the formation of a servitization strategy. There are three major themes in such research. The first
is the use of platforms for service modularization (Pekkarinen and Ulkuniemi, 2008). From the
modularization perspective, the platform’s main purpose is to allow manufacturers to develop,
organize and provide modularized service offerings. The second theme is service delivery
(Kowalkowski et al., 2013; Brax and Jonsson, 2009), and third is the creation of service innovation and
provision networks (Gebauer et al., 2013; Den Hertog et al., 2010).
The notion of core capabilities has also been introduced to the platform and servitization
literature, with the argument that platform capabilities are the foundation to providing solution
offerings (Kowalkowski et al., 2013). Spring and Araujo (2013) adopt the inter-organisational
perspective of manufacturing firms, suggesting that such firms should be seen as service platforms,
and as a collection of productive opportunities and knowledge resources that are integrated within
the company platform. Furthermore, the importance of sharing resources in a platform domain has
been highlighted by Palo and Tähtinen (2011), whose findings confirm that platform adoption by a
manufacturing firm boosts cooperation in a servitized context and yields better service performance.
In the servitization context, Brax and Jonsson (2009) and Kowalkowski et al. (2013) use the
term ‘platform' to refer to the integrated solution and service provided, introducing two fundamental
types of platforms to be used in servitization. The first is called the operative platform, where the
platform is opened to a third party so that it can get involved in the value creation. The second is called
a customer-to-customer intermediary, where the platform brings together the two sides of the
CHAPTER 2. LITERATURE REVIEW 83
market, the supply and the demand, enabling an independent transaction between the two market
sides, changing the role of the manufacturing company to be service intermediary, with main role to
introduce adequate governance, foster synergies, and co-specialization (Teece, 2007).
For this research, it is highly important to have a clear understanding of the circumstances
and conditions in which a manufacturer is to be considered to be adopting servitization. To address
this issue, the literature suggests that a manufacturer with a servitized offering should have the
following characteristics:
1.12 Offers services that are clearly defined as service concepts, i.e. they can be purchased
separately, like goods (Turunen and Finn, 2014).
1.13 Earns returns on services, i.e. the service business is liable for part of the total returns,
which average approximately 20%–30% of total firm sales (Fang et al., 2008).
1.14 Has allocated human resources for service development and delivery (Turunen and Finn,
2014).
In summary, this chapter has presented the following findings. First, it conceptualized the four
modes of servitization, which will help facilitate the contextual study of servitization. Second, the
author introduced the importance of business model innovation when shifting toward service
provision. Third, the author adopted a clear progressive set of criteria that must be met if any
manufacturer is to be considered as adopting servitization. Fourth, following Hobday et al. (2005), the
author argued that it is crucial to broaden the scope of the abstract conceptualization of servitization
by further including the position of the manufacturer in the value stream. Finally, building on the RBV
and its recent incarnation, the DCT, the author argued that this theoretical framework is adequate for
explaining servitization and the transition to services in terms of resource configurations and fit with
the market dynamics. In this context and in our quest to find and formulate a shared terminology for

CHAPTER 2. LITERATURE REVIEW 84
the concept of servitization, this research builds on Hobday et al. (2005) and Baines (2014) to propose
the following definition:
Servitization is a strategy in which firms adapt their business models in order to gain
capabilities that will enable them to move selectively up- and downstream in the marketplace
through the simultaneous “twin” processes of vertical integration and disintegration.
84
CHAPTER3 Hypotheses Development
3.1 Introduction
This chapter presents the theoretically grounded conceptual framework developed to measure
servitization and its impact on firm performance. This thesis is proposing a model that is referred to
as the servitization basic model, henceforth SBM, which integrates different theoretical frameworks.
The model provides the foundation for the empirical quantitative examination conducted by means
of the second-generation multivariate statistical analysis method, structural equation modelling
(SEM). The research model proposes two kinds of constructs, internal and external, both of which
influence servitization strategies and the impact of servitization on firm performance. All of the
postulated directional hypotheses developed for this research are based on prior studies in industrial
marketing, strategic management, innovation management, operations management, system design
and marketing. This present study strives to achieve originality and novelty through capturing a small
number of factors that can account for most of the variance in servitization’s impact, thus facilitating
the prediction of firm performance. First, this chapter presents the main modelling principles used to
create a valid causal framework with latent variables. Second, the conceptual framework is presented,
incorporating the internal and external factors that influence servitization strategies and their impact
on firm performance.

CHAPTER 3. HYPOTHESES DEVELOPMENT 86
3.2 Principles of Framework Development and Conceptual Modelling
3.2.1 Conceptual and Theoretical Pluralism
According to Schnell et al. (1993), a rigorous causal effects analysis requires the conceptual framework
to be grounded theoretically. As shown in previous chapters, servitization has been investigated from
multiple theoretical perspectives, for instance, organisational ecology theory (e.g., Turunen and Finne,
2014), contingency theory (e.g., Gebauer, 2008; Finne, 2014), RBV and dynamic capabilities (e.g.,
Ulaga and Reinartz, 2011; Davies, 2006; Fang et al., 2008; Benedettini et al., 2015), the theory of the
growth of the firm (e.g., Spring & Araujo 2006), game theory (e.g., Lee et al., 2015), agency theory
(e.g., Kim, Cohen, and Netessine, 2007), social network theory (Lindahl et al., 2014) and transaction
cost theory (e.g., Viitamo, 2013; Zhong, 2014). This confirms our position that a single theoretical
perspective is inadequate to model servitization and its impact on firm performance. Therefore, the
present study draws on several theories and relevant concepts revealed to be pertinent when
reviewing the current research (Chapter 2).
3.2.2 Contingent Modelling
As discussed in the previous chapters, the prior empirical research has fallen short in terms of
capturing the complex interrelationships among servitization antecedents, servitization strategies and
firm performance. In this context, contingency theory and contingent modelling provide a better lens
through which to investigate the role played by third variables in influencing the relationship between
servitization and firm performance (Gebauer, 2008; Finne, 2014). Contingency theory and its
applications in contingent modelling stem from organizational theory (Donaldson, 2001). The main
premise of contingency theory is that organizational performance depends on the adequate alignment
of three sets of variables: environment, strategy and organizational design factors (Damanpour and
Gopalakrishnan, 1998; Mintzberg, 1991). Therefore, the optimal organizational structure must be
adjusted to fit a specific contingency, such as strategy, technology, or any emerging uncertainty.

CHAPTER 3. HYPOTHESES DEVELOPMENT 87
In a focused effort, Barley (1990) and Tidd (2001) attempted to refine the methodological and
theoretical bases of contingency theory, finding that contingency modelling can usually be used to
understand the relationship between two variables in a two-way interaction. As such, the interaction
between the organizational context and firm performance can be studied in this way (Wiklund and
Shepherd, 2005).
Boal and Bryson (1987) proposed four alternative models for examining the effect of third
variables as a means of exploring contingency relationships. For instance, modelling the contingencies
helps in explaining the interrelationships between independent variables (IVs) such as firm
servitization, and dependent variables (DVs) such as firm performance (Lumpkin and Dess, 1996).
These four models include moderating, mediating, interactive, and independent effects (see figure 3-
1).
First, in the moderating effect, the third variable may influence the strength of the effect of
an IV on a DV (Lumpkin and Dess, 1996). In other words, in this model, the form or strength of the
relationship between the independent and dependant variables varies as a function of the third
moderating variable. This kind of model and relationship is widely used in social science research such
as management research, economics and most widely, psychology research (Baron and Kenny, 1986).
Second, mediating factors are considered to be variables that transmit the indirect effects of
an independent variable or variables on a dependent variable. In other words, a mediator can be a
potential generative mechanism by which a focal independent variable can influence a dependent
variable. When the effect of the mediator is removed, the relationship between the independent and
dependent variables may go away (Baron and Kenny, 1986).
Third, interacting effects denote that the effect on the dependent variable occurs if and only
if a set of variables are combined. Put differently, one standalone variable will not have a direct effect

CHAPTER 3. HYPOTHESES DEVELOPMENT 88
on the dependent variable (Baron and Kenny, 1986). However, this type of relationship has hardly
been seen in strategy and industrial marketing research.
Fourth and finally, independent factors are considered to be variables that have a direct effect
on a dependant variable, which may explain some of the variance of the independent factor and have
an effect size on the dependent variable (Lumpkin and Dess, 1996).
Figure 0-1: Types of contingent modelling strategies (Adapted from: Lumpkin and Dess, 1996).

CHAPTER 3. HYPOTHESES DEVELOPMENT 89
3.2.3 Integrated Causal Framework for Examining Servitization Antecedents and Performance Impact
Figure 0-2: Servitization Basic Model (SBM) (Source: Aboufoul and Ruizalba, 2017).
CHAPTER 3. HYPOTHESES DEVELOPMENT 90
Figure 3-2 depicts the posited conceptual framework for this research, in which the most
relevant concepts and variables have been incorporated in an integrative way (Aboufoul and Ruizalba,
2017), while also addressing the causal relationships among the IVs, many of which influence firm
performance (the DV) in a servitized context. This causal framework provides the basis for a
mathematical transformation of the proposed model for use in structural equation modelling.
3.3 Modelling the Internal Factors that Influence Servitization Strategies
and Firm Performance
3.3.1 Value Co-Creation
Value co-creation (VCC) has recently caught the attention of both academics and practitioners; this
term usually refers to the collaboration between the organization and external stakeholders (Prahalad
and Ramaswamy, 2000). The research interest in VCC has taken different directions, fuelled by the
seminal work of Vargo and Lusch (2004) on a co-creative service-dominant logic (SDL) of marketing.
The VCC concept has also influenced the examination of customer relationships in the context of
relationship marketing (e.g., Oliver, 1999), co-production (e.g., Morgan and Hunt, 1994), co-design
(e.g., Fournier, 1998), self-service (e.g., Holbrook and Hirschman, 1982) and experiential marketing
(Pine and Gilmore, 1998).
The traditional paradigm of value creation mainly relies on the distinction between the roles
of the producer and the consumer in the value creation process: one provides and the other receives.
This type of value is usually referred to as value-in-exchange (Macdonald et al., 2011).
The exchange of value is performed in the marketplace between different actors, where the
product and services are considered the sources of value. With the introduction of the service-
dominant logic (SDL), however, this distinction has faded away. In SDL context, companies and
customers are viewed as an integrated entity, with reciprocal benefits creating a new form of value
called value-in-use. The main premise of the SDL is the interaction between the organization and the

CHAPTER 3. HYPOTHESES DEVELOPMENT 91
customer, which harnesses the dialogical and personalized interaction for joint value creation
(Prahalad and Ramaswamy, 2004b).
In this context, it is important to define the concept of value co-creation (VCC). The most cited
definition of co-creation was introduced by Prahalad and Ramaswamy (2000), who define co-creation
as
a form of market or business strategy that emphasizes the generation and ongoing realization of mutual firm-customer value. It views markets as forums for firms and active customers to share combine and renew each other’s resources and capabilities to create value through new forms of interaction, service and learning mechanisms. (p. 15)
In a further elaboration of the concept of co-creation, Payne et al. (2008) propose a typology
and conceptual framework in which co-creation includes: (a) dynamic participation among at least
two actors; (b) resource integration to create mutually beneficial value; (c) willingness to interact with
other actors; and (d) a continuum of possible forms of collaboration. Building on these factors, Payne
et al. (2008) define co-creation as
an interactive process involving at least two willing resource integrating actors which are engaged in specific form(s) of mutually beneficial collaboration, resulting in value creation for those actors. (p. 201)
To provide an additional perspective on the value co-creation process, Grönroos (2008)
proposes three overarching elements that facilitate the co-creation of the outcome: the customer
sphere, the supplier sphere, and the joint sphere. In the joint sphere, or the area of where the
customer and supplier spheres overlap, value is created by actual use. This value-in-use concept is
dynamic concept and changes depending on the customer's goals (Füller, 2010; Macdonald et al.,
2011).
The VCC construct also encapsulates many components that are fundamental to understand
for this research. These components are as follows:

CHAPTER 3. HYPOTHESES DEVELOPMENT 92
Co-production, which can take the form of direct or indirect “co-working with customers”
(Nuttavuthisit, 2010), active participation in the product/service design process (Fang et al.,
2008), or integration of mutual resources into the value configuration (Ballantyne and Varey
2008). However, Vargo and Lusch (2004) argue that the locus of control in co-production
resides with the firm, which defines the nature and extent of co-production. Nevertheless, the
research favours Hunt et al.’s (2012) reasoning that in the co-production context, outcomes
are jointly produced, with only a slight emphasis on the supplier role.
Knowledge sharing, which is considered a basic operant resource that encompasses the
sharing of consumers’ knowledge, ideas, and creativity (Zhang and Chen, 2008). The act of
sharing data and information results in better outcomes compared with working
independently, due to reconciliation, shared inventiveness, and better communication and
assessment of needs (Enz and Lambert, 2012)
Relationship, which includes strong joint, reciprocal, and iterative processes between the
customer and the business environment. In this context, the role of relationship and
collaboration is to empower customers to develop solutions (Bonsu and Darmody, 2008),
thereby creating value.
Personalization, which refers to the distinctiveness of the actual or perceived use process, in
which value is widely perceived as being contingent on individual characteristics (Karpen et
al., 2012; Lemke et al., 2011). The main benefit of a personalized proposition is that it extends
the boundaries of realized consumer value and facilitates a vital reconfiguration of the future
production of use and exchange value, even beyond the scope and the purview of companies
and consumers (Cova et al., 2011).
Value in use, which refers to the idea in which the value is extended beyond the co-
production, exchange, and possession of the physical artefact or service. Therein, value is co-

CHAPTER 3. HYPOTHESES DEVELOPMENT 93
created in use as the consumer evaluates and defines the value of a particular proposition on
the basis of its usage specificity (Vargo and Lusch, 2004, 2008). Furthermore, value can be a
result of the interaction between the company and its market offerings. It can also derive from
the process of actual consumption, which may be mostly independent of the company’s
involvement or exchange (Grönroos, 2006; Vargo and Lusch, 2004). Therefore, the present
paper maintains the view that value for customers emerges in the customer's domain during
usage (Grönroos and Ravald, 2011).
It is highly important to understand why value co-creation is considered to be at the heart of
the service dominant logic, especially in manufacturing firms. In this perspective, the manufacturer
can only make the value proposition, while the customer realises the value through actual use and
through the value generation process (Grönroos and Gummerus, 2014). The S-D logic’s main principle
is that services are exchanged with services. The SDL also stresses the equality between different
actors in the network, making it of high importance in a B2B context (Vargo and Lusch, 2008).
Furthermore, the S-D logic highlights the importance of operant resources, for instance, skills and
knowledge. This perspective emphasises the joint development efforts between the firm, the
customer, and any other stakeholders in the ecosystem, in performing a service and contributing to
value co-creation. It emphasises the notion that value “is always determined by the beneficiary”
(Vargo et al., 2008, p.148).
In addition, manufacturing firms are increasingly endorsing a rigorous feedback mechanism
to collect data from different actors in the value co-creation process; this helps firms to enhance their
knowledge base through improved personalization of customer solutions (Hunt, 2000; Lusch et al.,
2007). Feedback from the value co-creation process can help firms to develop new dynamic
capabilities, enabling them to respond to changes in the business ecology. Moreover, it can help
companies avoid a competency trap, in which competencies become irrelevant due to changes in the
business sphere (Teece, 2007).

CHAPTER 3. HYPOTHESES DEVELOPMENT 94
The main benefit of these new capabilities is that they improve the customer’s business
effectiveness by supporting the customer’s processes. In a B2B context, the main obligation of the
solution provider is to support the processes of the receiving company by providing a service offering
in a value-supporting way, and not only providing resources (Grönroos, 2011b). Furthermore, the SDL
emphasises the customer’s involvement in the value co-creation process, and the importance of
managing customers as a partial employee of the provider. In this realm, customers become active
resource integrators rather than taking a passive role (as is done in the G-D logic) during the usage of
a product/service.
Ueda et al. (2008) present three models of how the value of products or services is created in
the market through the interaction between producers, consumers and products/services (see figure
3-3):
Class I – Value-Creation Model (Added Value)
In this setting, value for the product or service provider (producer) and receiver (consumer) can be
specified independently, and the environment can be determined in advance. The model can be
described as a closed system. The problem that needs to be addressed is the search for the optimal
solution for the customer. Here, solution refers to the product and service components that are
necessary to deliver an integrated response to the operational and business needs of the customer
(Nordin and Kowalkowski, 2010).
Class II – Value-Creation Model (Adaptive Value)
In this model, the value for the product or service provider and consumer can be quantified, but the
environment is changing, making it difficult to predict the optimal customer solution. The model
provides a unique representation of a system that is open and sensitive to contingencies and the
external environment. The problem to be addressed by the system actors is the adaptive strategy.
Class III – Value-Creation Model (Value Co-Creation)

CHAPTER 3. HYPOTHESES DEVELOPMENT 95
In this setting, the value for the product or service provider and consumer cannot be realised
independently. Because the two actors are interacting with one another, they cannot be separated.
The producer enters the system in order to address the problem of value co-creation. This model of
value co-creation encapsulates the core of the service offering. Departing from the G-D logic, the
service is an intangible good, so it cannot be saved or transported, and is consumed at the time of
production. The producer, the receiver, the environment and the products and the services enter the
system and interact to co-create value. The problem is that the value is co-created at the service site,
and this offering cannot be divided into its respective elements, which presents a problem for the
system designer.
As discussed in Section 2.2.11, servitization entails delivering value in use by integrating one
or more product and service into the market offering (Neely, 2008). This idea is also confirmed by
Baines et al. (2009) with their notion that customers nowadays want manufacturers to do the job with
them by providing them with a capability, especially in process-centric servitization. Since better
product function does not necessarily create new value, the co-creation aspect in design and
Figure 0-3: Model of value creation (Source: Ueda et al., 2008, p.55).

CHAPTER 3. HYPOTHESES DEVELOPMENT 96
customization ensures that the servitized offer always creates value for the customer. Furthermore,
in order to deliver a servitized offering, a degree of joint development must occur to leverage value
co-creation, especially during the service design phase. Moreover, the findings of Ruizalba et al. (2016)
suggest that customer input and involvement in the B2B context is highly important in order to achieve
servitization’s benefits and enhance firm performance. Put differently, value co-creation moderates
the relationship between advanced service provision and firm performance. Furthermore, as
Wikström (1996a) states, “it is no longer a question of creating value for the customer; rather, it is
about creating value with the customer and incorporating the customer’s value creation into the
system” (p. 9). Ng et al. (2010) investigated value co-creation in the context of outcome-based
contracting (OBC), which is considered a special form of servitization that delivers value in use. Their
findings suggest that the co-creation of value helps firms cut delivery costs and increase customer
satisfaction, improving overall provider performance (Kohtamäki, Partanen, Parida, and Wincent,
2013).
This thesis conceptual framework views value co-creation as multi-dimensional construct that
involves collaboration between both supplier and customer to deliver value in use (Vargo & Lusch,
2004). The main goal of value co-creation in a servitized context is to increase the productivity and/or
effectiveness of both the supplier and consumer, taking into consideration that providing value in use
is a dynamic process due to changes in the customer’s objectives along the stages of the relationship
(Macdonald, Wilson, Martinez, & Toossi, 2011). A study by Viljakainen and Toivonen, (2014) found a
positive relationship between value co-creation and service infusion which leads to a higher
performance.
Following this rationale, the following hypotheses are put forward:
H1: The co-creation of firm value positively influences the firm’s servitization strategies.
H2: The co-creation of firm value positively influences the firm’s performance.

CHAPTER 3. HYPOTHESES DEVELOPMENT 97
3.3.2 Open Innovation
The emerging literature on innovation and more specifically, open innovation, argues for a need for
focal organizations to transcend their boundaries by sourcing knowledge and technology externally
(Felin and Zenger, 2013). The increase in global competition and rising cost of R&D activities hinder
firms’ ability to survive simply by relying on the traditional internal and closed innovation paradigm.
Therefore, organisations should tap external sources of knowledge that are relevant to the
organisation in order to incorporate this knowledge into the organisation’s innovation process and
augment in-house research and development (R&D) (Wolpert, 2002; Chesbrough, 2006c). In this
context, open innovation is defined as “a distributed innovation process based on purposively
managed knowledge flows across organizational boundaries, using [pecuniary and non-pecuniary]
mechanisms in line with the organization’s business model” (Chesbrough et al., 2014, p. 27).
The core idea behind the open innovation paradigm described by Chesbrough (2003) is that
organizations reliance on internal R&D) may lead to missed business opportunities because important
sources of innovation exist outside the organization’s boundaries. Thus, firms should seek to introduce
an open innovation strategy to capture internal and external paths to market.
Advances in ICT and network technologies play a central role in helping organizations embed
open innovation strategies and facilitate collaboration with external knowledge partners in the
ecosystem (Tushman, Lakhani, and Lifshitz-Assaf, 2012). The literature on open innovation and firm
openness suggests that organizations that fail to pursue an openness strategy may manifest
organizational myopia (Laursen and Salter, 2006), in which managers overestimate internal sources
and underestimate external sources. In the context of open innovation, three fundamental principles
are essential in this research for understanding the concept.
First, open innovation is a broad concept that encompasses both purposive inflows and
outflows of knowledge. Purposive inflows, also referred to as inbound open innovation, allow the
organisation to align its internal innovation activities with external sources of knowledge to improve

CHAPTER 3. HYPOTHESES DEVELOPMENT 98
the firm’s existing technological developments. Internal purposive outflows of knowledge, or
outbound open innovation, are innovation activities that leverage the current technological
capabilities outside the boundaries of the organization (Laursen and Salter, 2006).
Second, there is wide agreement in the open innovation literature that organizations pursuing
open innovation strategies should have a certain degree of permeability at the firm level, and more
specifically, at the innovation process boundaries, to ensure successful innovation (Laursen and Salter,
2006).
Third, the extant open innovation literature argues that the concept is quite wide; it is
considered an “umbrella that encompasses, connects and integrates a range of already existing
activities” (Huizingh, 2011, p. 3). Consequently, the spectrum of organisational practices that can be
qualified as an open innovation activity is wide and varied. For instance, the following organisational
practices fall, by definition, under the category of inbound open innovation: engaging in R&D alliances,
scanning the external environment for new technologies, participating in crowd sourcing, forming a
joint venture, licensing technology from a university, and participating in broad networks to
coordinate innovative activities (cf., Petroni, Venturini, and Verbano, 2011; van de Vrande, Lemmens,
and Vanhaverbeke, 2006).
In terms of manufacturing firms, these firms traditionally depend on internal R&D activities,
which are considered to be an important dynamic capability by which manufacturers create and
develop new products and services. Furthermore, internal R&D functions are considered to be of
strategic importance and are widely regarded as an entry barrier for potential competitors (Teece,
1986). The process by which traditional manufacturing firms discover, develop and commercialize
products internally has been classified as the closed innovation model (Chesbrough, 2003). Even
though this traditional box-push model in manufacturing has thrived for quite a long period, the
organisational and innovation landscape has evolved in recent times. Due to changes in the division
of labour, a surge in venture capital, and the diversity of knowledge sources across multiple public and
CHAPTER 3. HYPOTHESES DEVELOPMENT 99
private organisations, manufacturers can no longer afford to innovate on their own, but rather need
to engage in alternative innovation practices (van de Vrande et al., 2009). Manufacturers are now
called to introduce open innovation strategies by combining technological exploitation with
exploration in order to maximize the value created from their technological capabilities and core
competencies (Chesbrough and Crowther, 2006; Lichtenthaler, 2008).
Open innovation (OI) has proven to be beneficial to manufacturing firms, helping them reduce
time to market, lower costs, increase access to additional competencies, increase access to new
markets, and accelerate innovation through collaboration (Chesbrough, 2011). The ‘not invented here’
(NIH) syndrome, which is considered one of the greatest obstacles to the implementation of OI, can
be defined as “the tendency of a project group of stable composition to believe that it possesses a
monopoly of knowledge in its field, which leads it to reject new ideas from outsiders to the detriment
of its performance” (Katz and Allen, 1982, p. 7). This syndrome widely exists in the closed innovation
model, which advocates the segregation of internal and external paths to market. The open innovation
model stands in contrast to this traditional model of closed innovation. In an open innovation model
(see figure 3-4), manufacturers maintain close relationships with external parties at different stages
of the innovation development process in order to accelerate product or service launches. Newly
developed products and services can be introduced to the marketplace via many different distribution
channels, such as patent licensing, joint venture leasing, or also more traditional paths to market
(Chesbrough, 2004).

CHAPTER 3. HYPOTHESES DEVELOPMENT 100
Figure 0-4: Open innovation model – the innovation funnel (Source: Lazzarotti and Manzini, 2009).
In the field of innovation management, Chesbrough (2011) argues that manufacturing firms’
increasing service offerings are growing into an important cornerstone of their market offering. In
addition, services are no longer the remit of dedicated service providers, but rather reflect a broader
business model adopted by manufacturing firms to capture additional value or retain their customer
base.
However, offering complex bundles of products, processes and services involves some
organisational challenges, specifically with regard to the firm’s knowledge base. Such a situation is
likely to require the integration of different resources (Kogut and Zander, 1992), including external
knowledge acquired from different sources, which may be necessary to sustain an integrated business
model (Chesbrough, 2011). Therefore, in order to achieve a higher degree of openness, firms need to
consider making a fundamental change to their business model to harnesses external resources. This
idea builds on the literature of business model innovation, which emphasises the need to investigate
how firms develop, deliver and appropriate value and how firms can change their business
architecture to adapt to new environments, sustain competitive advantages, or generate extra profit
(Zott et al., 2011). Chesbrough (2011) consider open innovation to be an antecedent to open service
innovation and a catalyst to business model innovation, especially when creating a platform that

CHAPTER 3. HYPOTHESES DEVELOPMENT 101
intertwines the firm’s products and services and invites other actors to participate in creating the
servitization platform. In this context, Visnjic and Looy (2013) refer to servitization as a unique form
of open service innovation in which an organization develops its innovation capabilities by undergoing
a shift away from products toward product-service systems, thereby better satisfying customer needs,
escaping the commoditization trap, and enhancing the service offering.
A plethora of studies on open innovation advocates that the network of relationships between
the firm and its external environment can play a significant role in influencing the firm’s performance.
Therefore, the author argues that manufacturers that are more open to exploiting external sources to
acquire knowledge and pooling technological opportunities to develop new market offerings will have
a higher level of innovative performance and better overall firm performance (Laurson and Salter,
2006). Laurson and Salter (2006) carried out an empirical study of the strategies that firms use when
introducing open innovation, looking specifically at the impact of openness in terms of the breadth
and depth of the external search for innovation and its influence on financial performance (as
measured by share of income from new products). The study, which was based on a large sample of
manufacturers from the UK, revealed an inverted U-shaped relationship between the depth of the
external search on the one hand and innovative performance on the other, and showed that firms
may over-search, hindering their performance (Laursen and Salter, 2006).
According to Chesbrough (2011), the move towards services and the resulting increase in
customer focus can be seen as an innovation of the business model and an adoption of open service
innovation practices, reflecting the main premises of servitization. Moreover, the author argues here
that manufacturing firms that adopt open innovation practices must develop new capabilities and
business models to successfully acquire and integrate external knowledge that helps in developing
servitized offers (Chesbrough, 2006; Lichtenthaler and Lichtenthaler, 2009).
More recently, the open innovation research has started to consider co-creative interactions with
consumers as part of product development and value creation (Hippel, 2006; Tseng and Piller, 2003;

CHAPTER 3. HYPOTHESES DEVELOPMENT 102
Potts et al., 2008). Redlich et al. (2014) examined the relationship between open innovation and value
co-creation in manufacturing firms in the context of PSS and found that it is highly important for
manufacturing firms to actively promote openness in order to tap the potential of value co-creation.
Furthermore, openness was found to a key antecedent to value co-creation in a production network.
The research of Martinez (2013) confirms this relationship, and further emphasise these
benefits related to opening the firm’s boundaries, firms need to consider a fundamental change to
their business model in order to achieve a higher degree of openness. In this sense, Chesbrough (2011)
considers open innovation to be an antecedent to open service innovation and a catalyst to business
model innovation, especially for creating a platform that intertwines the firm’s products, services, and
information in order to invite other actors to participate in creating the servitization platform. Visnjic
Kastalli and Van Looy (2013) refer to servitization as a unique form of ‘open service innovation,’ in
which an organization develops its innovation capabilities by undergoing a shift from products to
product-service systems, thereby better satisfying customer needs, escaping the commoditization
trap, and enhancing the service offering, they also found a positive association between open
innovation and service innovation in the manufacturing context. Following this line of inquiry, this
research argues that manufacturing firms that adopt open innovation practices need to develop
specific dynamic capabilities and a specific business model to successfully acquire and integrate
external knowledge (Chesbrough & Crowther, 2006; Lichtenthaler & Ernst, 2009). Therefore, in the
manufacturing context, tapping network externalities that promote and enable open innovation can
support service innovation and servitization strategies. Based on the above, the author therefore
postulates the following hypotheses:
H3: The firm’s open innovation activities positively influence the firm’s servitization strategies.
H4: The firm’s open innovation activities positively influence the firm’s value co-creation.
H5: The firm’s absorptive capacity positively influences the firm’s open innovation.
H6: The firm’s open innovation activities positively influence the firm’s performance.

CHAPTER 3. HYPOTHESES DEVELOPMENT 103
3.3.3 Absorptive Capacity
For manufacturing firms, it is considered axiomatic that to successfully introduce innovative products
and services requires the assimilation of both external knowledge and internal innovation practices
(Volberda, Foss, and Lyles, 2010). The concept of absorptive capacity, which emerged from
macroeconomics (Adler, 1965), refers to the ability of an economy to utilize and absorb external
information and resources. This term has been widely used in the organizational research and is
considered a significant construct in a number of management fields, such as strategic management,
industrial economics, resource-based view, and dynamic capabilities, making it a multidisciplinary
term (Schmidt, 2010; Zahra and George, 2002). Furthermore, this term was introduced at the firm
level Cohen and Levinthal (1989), who later defined it as the “ability of an organization to recognize
the value of new information, assimilate it, and apply it to commercial ends” (Cohen and Levinthal,
1990; p. 128). The central idea of this concept is that a firm’s ability to accumulate experience with
any technological adoption or invention in turn improves its capacity to recognize and absorb
influential external ideas and create valuable inventions in the form of new products, services, or a
combination thereof (King and Lakhani, 2011).
The role that absorptive capacity plays in fostering manufacturers’ growth mainly depends on
the firm’s set of organizational routines and configuration of internal dynamic capabilities (Reilly and
Scott, 2010). One can argue that organizational learning capabilities are central to providing a solution
to a customer’s problem (Davies and Brady, 2000), and therefore absorptive capacity is considered an
important organisational capability that manufacturing firms must leverage to better implement
servitization or create and deploy the knowledge necessary to build other organizational capabilities
(Todorova and Durisin, 2007). In the context of manufacturing, rapid technological advancement
coupled with ever changing customer needs has pushed firms to screen their environment for new
ideas for leveraging their new product development (NPD) processes (Zahay, Griffin, and Fredericks,
2004).
CHAPTER 3. HYPOTHESES DEVELOPMENT 104
In line with Cohen and Levinthal’s (1990) seminal paper, absorptive capacity is usually
operationalised as the existence and/or intensity of a company’s R&D activities (Veugelers, 1997; Lane
and Lubatkin, 1998; Lin, 2003; Oltra and Flor, 2003; Leahy and Neary, 2007; Zahra and Hayton, 2008).
Later research has broadened the concept to include the development of absorptive capacity at the
organisational level (Lichtenthaler, 2009; Tsai, 2001).
Drawing on dynamic capability theory, Zahra and George (2002) reconceptualise absorptive
capacity as a dynamic organizational capability consisting of four dimensions: acquiring, assimilation,
transformation and exploitation. These dimensions allow incumbents to adapt to the market
dynamism by reconfiguring the firm’s resource base and its organizational routines and practices
(Spithoven et al., 2011).
Absorptive Capacity and its Dimensions
Absorptive capacity is widely viewed as a facilitator of internal innovation practices for organizations
(Todorova and Durisin (2007). Hence, in order to better operationalize this construct in the present
research, its main components are worth a deep investigation. This research will adopt the most
recent conceptualization of the construct by Todorova and Durisin (2007), who suggested that
absorptive capacity encapsulates the following temporal dimensions: acquisition, transformation,
assimilation, and exploitation (see figure 3-5).
These four components can be divided into two distinct categories of absorptive capacity:
potential and realized, where the former consists of acquisition and assimilation and latter of
transformation and exploitation (Zahra and George, 2002). It is important to clarify that the internal
antecedents of absorptive capacity are paramount and cannot be dismissed, but they lay outside the
scope of this research model and therefore will not be dealt with (for further information see Cohen
and Levinthal, 1990, p. 131). Furthermore, Zahra and George (2002) argued that organisations “can
acquire and assimilate knowledge but might not have the capability to transform and exploit the
knowledge for profit generation” (p. 191). This notion paves the way for this study’s attempt to

CHAPTER 3. HYPOTHESES DEVELOPMENT 105
investigate these components (dimensions and component are used interchangeably) in greater
detail, as will be done below.
Figure 0-5: Major dimensions of absorptive capacity (Based on Todovora and Durisin, 2007).
a) Knowledge acquisition
This first key component of absorptive capacity refers to the firm’s ability to acquire new external
knowledge that is critical to its operations (Zahra and George, 2002). This component emphasises the
active screening of the environment and any relevant sources to identify potentially relevant
knowledge. This practice should not be constrained to a specific function within the organization;
rather, it should be perceived as an organization-wide activity with the purpose of achieving ultimate
absorption of knowledge.
b) Knowledge assimilation
This dimension encompasses the way the firm communicates, interprets and internalizes the
knowledge collected across firm boundaries. This dissemination of knowledge requires the substantial
flow and sharing of data between different business functions and individuals in order to capitalize on
the acquired knowledge. This process of knowledge assimilation sometimes requires reconfiguration
of the firm resources and a restructuring of the business functions to maximise the internal network’s

CHAPTER 3. HYPOTHESES DEVELOPMENT 106
capacity to disseminate knowledge and cooperate. However, Zahra and George (2002) argue that the
successful dissemination of knowledge requires a deep understanding of how the collected knowledge
is structured and embedded at its source. This important understanding will determine how easy or
difficult it will be to assimilate the acquired knowledge.
c) Transformation
The third component of absorptive capacity entails the refinement and conversion of the assimilated
knowledge to fit the firm’s existing cognitive schema, while tailoring it to the business function’s
idiosyncratic needs (Todorova and Durisin, 2007). The modification of internalized knowledge to fit
the firm’s distinct needs is widely rooted in the learning process implemented inside the firm. Lane
and Lubatkin (1998) put forth the dyadic student-teacher typology to refer to the process firms use to
absorb and transform knowledge, stating that “student firms have the greatest potential to learn from
teachers with similar basic knowledge but different specialized knowledge” (p. 464). This notion is
grounded in the DCT, in which the knowledge transformation capabilities inside the firm are
dependent on previous investments into absorptive capacity applications and the firm’s prior
experience. This path dependency enhances the firm’s positional advantage, allowing it to better
internalize the external knowledge and adapt more easily within the marketplace (Teece, 1997).
Moreover, in the DCT context, Zahra and George (2002) suggest that “the ability of firms to recognize
two apparently incongruous sets of information and then combine them to arrive at a new schema
represents a transformation capability” (p. 190).
d) Exploitation of knowledge
The final component of absorptive capacity is the process by which the newly absorbed capabilities
are leveraged. The importance of internal organizational innovation practices, especially in terms of
human capital abilities, is profoundly important to the exploitation process (Minbaeva et al., 2003).
The existing research on managerial cognitive abilities emphasises the role that managerial aptitudes

CHAPTER 3. HYPOTHESES DEVELOPMENT 107
play in influencing new product and service development trajectories and the corresponding
exploitation of capabilities (Dosi, 1982). Furthermore, one can argue that the lack of managerial
cognitive abilities and skills can stem from organisational inertia (Tripas and Gavetti, 2000). In other
words, the process of exploiting acquired knowledge is pivotal to actually realising the potential of
incorporating absorptive capacity in a manufacturing firm (Barringer and Bluedorn, 1999).
Nevertheless, the antecedent role of absorptive capacity has been neglected in the
servitization literature. While no study on servitization has highlighted whether absorptive capacity
positively influences servitization adoption or has any association with servitization construct, the
existing quantitative empirical research has revealed that absorptive capacity has a positive impact on
the process of new product development and R&D practices (Stock et al., 2001). Furthermore, Koçoğlu
et al.’s (2015) findings confirm that absorptive capacity is one of the main drivers of product
innovation in manufacturing firms. The ability to develop innovative new products, particularly within
high-technology industries, can be a key determinant of competitive advantage (Brown and
Eisenhardt, 1995; Rosenthal, 1992). Therefore, firms seek to increase their innovation capabilities by
tapping into external knowledge sources; they do so by opening inbound open innovation systems
(Chesbrough, 2003b).
Parallel to this, Kranz et al. (2016) found a positive impact of absorptive capacity on the
process of business model change. This was also confirmed by the previous finding that absorptive
capacity increases a firm’s “capacity to correctly generalise and link internal with external knowledge
to increase its responsiveness to customer needs” (Weigelt and Sarkar, 2012, p. 196). Symeou and
Kretschmer (2013) explored the drivers of manufacturing firm performance and found a positive
impact of the four dimensions of absorptive capacity on firm performance. These findings are in line
with Grant’s (1996) research, which found that superior profitability is fundamentally related to the
technology, knowledge resources and capability-based advantages in firms, rather than merely
positioning advantages. Furthermore, researchers (e.g., Chen, Lin and Chang, 2009) have suggested

CHAPTER 3. HYPOTHESES DEVELOPMENT 108
that absorptive capacity is a fundamental determinant of innovation performance, and further
empirical research has confirmed that there exists a direct positive relationship between absorptive
capacity and firm performance (e.g., George, Zahra, Wheatley, and Khan, 2001; Lane, Salk, and Lyles,
2001; Tsai, 2001). These findings are based on the notion that the more information a firm gather
through the search for external knowledge, the better its chances for recognising changes in the
environment, leading to improved performance. Furthermore, in terms of the relationship between
absorptive capacity and value co-creation, the empirical findings of Komulainen (2014) suggest that
firms with a higher degree of absorptive capacity, an explorative learning orientation, and a0
willingness to invest in learning, were more successful at obtaining the benefits of value co-creation.
Therefore, absorptive capacity is an important antecedent to firm value co-creation.
As previously mentioned in Section 2.7, this research conceptualizes servitization as a change
in the manufacturing business model and its interlocking elements in order to accommodate service
provision in the firm’s market offerings (Barnett et al., 2013). This follows the fundamental idea that
absorptive capacity is an organisational capability reflecting a firm’s receptivity to technological
change (Kedia and Bhagat, 1988), and builds on the resource/capability-based view and the
knowledge-based view of the firm (Grant, 1996), which argue that firms must acquire capability-based
advantages and innovate firm capabilities in order to deliver a servitized offer. As mentioned before,
when absorptive capacity is realized, a firm may increase its growth by “exploiting existing internal
and external firm-specific competencies to address changing environments” (Teece et al., 1997, p.
510). This is an established theme in the strategic management and innovation literatures, which also
suggest that firms increasingly need to rely on external knowledge sources to advance and sustain
competitive advantages, which can be fostered through intra-firm adoption of absorptive capacity
initiatives (Teece, 2007; Chesbrough, 2003). Cohen and Levinthal (1990) suggest that R&D has “two
faces” (inside and outside the firm) and assert the importance of investing in internal research in order
to be able to utilize external technology, an ability they term “absorptive capacity” and consider an
important antecedent to an open innovation paradigm. In line with this argument, Laursen and Salter’s

CHAPTER 3. HYPOTHESES DEVELOPMENT 109
(2006) empirical findings confirm this relationship, in which absorptive capacity is considered to be
complementary to open innovation. This complementary relationship enhances the firm’s overall
competitive advantage if both practices (absorptive capacity and open innovation) exist
simultaneously.
Although the role of absorptive capacity as a dynamic capability (Zahra & George, 2002) has
thus far not been discussed in the servitization research, the exploitation of new knowledge in the
manufacturing context through absorptive capacity is paramount to promoting the flexibility needed
to compete in a dynamic and evolving marketplace (Ambrosini & Bowman, 2009).
In line with this argument, Hayes and Pisano (1994) suggest that diverse markets and fierce
global competition require a higher degree of strategic flexibility on the part of manufacturing firms;
this can fostered by recognising the value of newly acquired external knowledge, assimilating it and
then applying it to commercial means. Therefore, a firm’s growth mainly depends on knowledge
acquisition and learning, especially in SMEs (Altinay, Madanoglu, De Vita, Arasli, & Ekinci, 2016).
From the above, it becomes clear that innovation success within manufacturing firms depends
predominantly on absorptive capacities that target technological knowledge. On the one hand,
absorptive capacity creates opportunities for manufacturing firms in their shift to service provision by
allowing them to acquire the capabilities required to deliver a servitized offer. On the other hand, it is
considered an important organizational antecedent (Felin and Foss, 2006). Following the
aforementioned reasoning, and based on our discussion of absorptive capacity and the empirical
evidence from prior literature, the author puts forward the following hypotheses:
H7: The firm’s absorptive capacity positively influences the firm’s servitization strategies.
H 8: The firm’s absorptive capacity positively influences the firm’s performance.
H9: The firm’s absorptive capacity positively influences the firm’s value co-creation.

CHAPTER 3. HYPOTHESES DEVELOPMENT 110
3.3.4 Service Orientation of Organisation Culture
The concept of organizational culture originated in cultural anthropology and is popular within the
organizational behaviour, management, and marketing literature (e.g., Gregory et al., 2009; Homburg
and Pflesser, 2000; Schein, 2004). Furthermore, corporate culture is considered an important
organizational ‘soft factor’ (Homburg, Fassnacht and Guenther, 2003), especially in the highly
competitive industrial markets. In this context, organizational culture is defined by Deshpand and
Webster (1989, p. 4) as "the pattern of shared values and beliefs that help individuals understand
organizational functioning and that provide norms for behaviour in the organization." Schein (2004),
however, provides the most commonly cited definition of culture as
a pattern of shared basic assumptions that the group learn[s] as it solve[s] its problems of external adaptation and internal integration that has worked well enough to be considered valid and, therefore, to be taught to new members as the correct way to perceive, think, and feel in relation to those problems. (p.17)
Organizational culture is a profound resource that is difficult for competitors to imitate and
hard to substitute without exerting a great deal of effort (Hoopes et al., 2003). It also plays a key role
in determining the level of organisational performance (Narver and Slater, 1990)
Prior research indicates that manufacturing firms that are shifting towards providing service
or augmenting their core offering with services require significant internal changes in terms of
management philosophy and approach (Homburg, Fassnacht, and Guenther 2003). The effect of
organizational (corporate) culture on firms is twofold: first, it affects the organization’s choice of
desired outcomes, and second, it affects the means to achieving these outcomes. It also influences
the organizational structure and internal processes as the firm changes its business model to suit the
immediate environment (Gebauer et al., 2009; Deshpande, Farley, and Webster, 1993; Quinn and
Rohrbaugh, 1983).
The servitization literature suggests that a shift in organizational culture and mindset is
required to move from a product-oriented organization to a service-oriented one (Nuutinen and

CHAPTER 3. HYPOTHESES DEVELOPMENT 111
Lappalainen, 2012; Brax, 2005; Finne, Brax, and Holmström, 2013). Consequently, in terms of
achieving a service orientation of organisational culture within industrial marketing companies, Schein
(2004) suggests that these companies have two types of organizational culture: a product orientation
and a service orientation, both of which influence firm performance (Gebauer et al., 2009; Neu and
Brown, 2005). The former is considered to create competitive advantage by focusing of the
engineering side of the product, stressing product functionality, features, durability, reliability,
conformance quality and design, while the latter is concerned with the service-related issues such as
pre- and after-sales services, including consulting, training, installation, asset management,
maintenance and repair. In general, one is not considered superior to the other (Gebauer et al., 2009;
Kotler and Keller, 2012).
Empirical research that investigated manufacturers’ transition from selling products to
providing services found a positive association between a service-oriented culture of the firm and
overall firm performance (Gebauer et al., 2009). Other findings also suggest that a service-oriented
culture in manufacturing firms encompasses the values and behaviours linked with an entrepreneurial
orientation, real problem-solving willingness, innovativeness, and the resilience of service employees
(Matthyssens and Vandenbempt, 1998).
In the present research, a service orientation of organisational culture is measured
quantitatively, as recommended by Gebauer (2008), because it is considered a sub-aspect of the
overall organizational culture. Furthermore, service-related aspects are widely evaluated in a
quantifiable manner in organizational research (Parasuraman and Zeithaml, 1991). In the present
study, organisational culture is analysed through the lens of the attention-based view of the firm,
which stresses the role that managerial cognition and actions play in shaping the organisational
culture as well as a variety of organizational phenomena, such as strategic decision-making (Barr,
Stimpert, and Huff 1992). Furthermore, from the DCT perspective, it is argued that culture can be
conceptualized as a governance system (control on the cheap) that influences employee behaviour

CHAPTER 3. HYPOTHESES DEVELOPMENT 112
without the need for strict administrative management methods (Eisenhardt and Martin, 2000; Teece
et al., 1997), in this context the author argues that servitization adoption is the strategic decision made
by top management to shift into service provision (Baines et al., 2009; Neely, 2013). In this context,
Homburg et al. (2003) suggest that a service orientation of organisational culture can be divided into
two main components. The first component is the intrinsic value of services, as perceived by managers
and employees, who attempt to manifest this value in their day-to-day job responsibilities. The second
component is the degree to which managers and employees behave in a service-oriented manner.
All in all, a service orientation of organisational culture has a positive impact on service-related
performance outcomes and overall profitability (Homburg et al., 2003; Neu and Brown 2005), and it
has been empirically shown to have a positive impact on the alignment between the external
environment, strategy, and organizational design, and more specifically on the formulation and
implementation of a strategy for offering customer support services (Gebauer et al., 2008). Parveen
et al. (2015) confirm this, with their study showing a significant positive impact of organizational
culture on open innovation; here, culture plays a critical role in enhancing the process of searching for
new knowledge (Anderson and West, 1996), and is considered a critical enabler and success factor for
open innovation (Balsano et al., 2008). Following the aforementioned reasoning, the author puts
forward the following hypotheses:
H10: A service orientation of organisational culture positively influences the firm’s servitization
strategies.
H11: A service orientation of organisational culture positively influences the firm’s open innovation
strategy.
H12: A service orientation of organisational culture positively influences the firm’s performance.

CHAPTER 3. HYPOTHESES DEVELOPMENT 113
3.3.5 Risk
In this research, servitization is considered a strategic decision and a move by the manufacturing firm
to enhance its competitive advantage via repositioning (differentiating) itself in the product-service
market (Slack, 2005). In this context of servitization, risk is defined as “the estimated probability of
the occurrence of any loss or any potential negative outcomes while implementing a strategy to
achieve a certain objective” (Featherman and Pavlou, 2003, p. 12). Benedettini et al. (2015) studied
servitization from a risk-based perspective, concluding that servitization risks derive from two blocks:
external environmental risk and internal organisational risk. The first is manifested in manufacturing
firms when the extension of a service offering requires the building of new relationships with the
immediate environment. This type of risk usually has to do with ongoing changes in the business
landscape of the manufacturing firm (Sharma and Mahajan, 1980), as manufacturers have no control
over the external environment and can only prepare by means of risk management strategies (Sheth
and Sisodia, 2005). As discussed in Section 2.3, servitization comes with many challenges that pose
huge risks to firms, such as volatility in demand and customer expectations, changes in regulations,
the capital market and ever-evolving technology (Benedettini et al., 2015). The second block of risk is
manifested when the manufacturing firm needs to acquire new capabilities, new competencies, or
even a new organizational structure in order to integrate a service process. Furthermore, internal risks
refer to the inability of top management to make and execute sound strategic decisions due to
miscalculations or a lack of understanding of the transaction costs associated with delivering services
or outsourcing some core activities (Sharma and Mahajan, 1980). Such a situation can lead to a
deterioration of the firm’s financial health, causing it to fall behind its industry rivals, financially and
technologically. The situation can be further worsened if the firm embarks on unfavourable contracts
with customers or business partners; such mistakes can be fatal to the firm (Benedettini et al., 2015).
This internal risk block, which is the focus of the present research, can be divided into the following
subcategories commonly considered to be barriers to servitization:

CHAPTER 3. HYPOTHESES DEVELOPMENT 114
Strategic risks: Risks that arise from the fundamental decisions taken by management with
regard to the organisation’s objectives (Barid and Thomas, 1985). Essentially, strategic risks
include the risk of failing to achieve business objectives and failing to implement achievable
performance metrics for assessing the success of a servitized offering (Benedettini et al.,
2015). Strategic risk can be derived from the fact that top management in manufacturing firms
often lack the background and skills necessary to deliver services. Furthermore, they may
underestimate the importance of modifying the organisational structure, culture and
processes to accommodate a service strategy (Gebauer and Fleisch, 2007).
Financial risk: Monetary risk resulting from the financial consequences of a wrong decision
taken by top management. This type of risk can be identified and prioritized through a better
understanding of transaction cost theory (Viitamo, 2013). It musts be understood how a
change in ownership structure alters incentives in a ‘servitized’ relationship; failure to
understand this important risk can lead to bankruptcy risks (Benedettini et al., 2015).
Operational risk: This can be broadly categorised as risk regarding the people, processes and
assets related to development planning, sourcing, production, and distribution of a service.
This type of risk can be caused by high exposure to third parties, lack of collaboration, and
failure to achieve certain servitization outcomes due to low uptime and poor maintenance-
repair-overhaul (MRO) practices. Such risk can be analysed by understanding the principle
agent theory, leading to better risk mitigation strategies (Kim et al., 2007).
The servitization literature argues that manufacturing firms that provide services actually
reduce their risk due to an enhancement in the quality of customer relationships (Oliva et al., 2012)
and the development of capability-based competitive advantage (Wise and Baumgartner, 1999).
Nevertheless, some recent research (e.g., Fang et al., 2008) has implied that manufacturing firms that
are pursuing a service-led growth strategy face exposure to new risks that can negatively affect firm
value, such as organisational conflict and loss of strategic focus.

CHAPTER 3. HYPOTHESES DEVELOPMENT 115
At the same time, Brady et al. (2005a) suggest that manufacturers that want to deliver services
(solutions) successfully must acquire certain skills that will enhance their ability to identify, evaluate,
prioritize and manage long-term risks in the value stream. Recent research into servitization has found
that the risk is usually transferred from the customer side to the provider side, especially when the
provider is considered a system integrator (Davies, 2004), solution provider (Nordin and Kowalkowski,
2010) or process outsourcing provider (Gebauer, 2008; Raddats and Easingwood, 2010).
Manufacturing firms can also deliver services supporting the product (SSP) and/or services supporting
the customer (SSC), where the former refers to services that ensure proper product access or
functioning (e.g., after-sale services) and the latter refers to services that optimise customer
processes, actions and strategies associated with the supplied product (e.g., financing, training, spare
parts management) (Benedettini et al., 2015). These two types of offerings are directly linked to the
reduction of environmental risk because they enhance the firm’s differentiating power, customer
intimacy and personalization level (Eggert et al., 2014; Mathieu, 2001b; Raddats and Kowalkowski,
2014). Empirical findings from Benedettini et al. (2015) show that the presence of a service business
increases bankruptcy risk for the supplying firm, with the risk stemming from three distinct categories:
lack of management ability, misjudged corporate policy, and company characteristics. Management
abilities include motivations, qualities, skills and personal characteristics. Corporate policy refers to
strategy and investments, commercial, operational, finance and administration, and corporate
governance. Finally, company characteristics include the company’s maturity, size, industry and
flexibility (Ooghe and Prijcker, 2008). The present research favours the argument that providing
services increases the risk exposure faced by manufacturing firms. Following this rationale, the author
postulates the following hypothesis:
H13: Risk negatively influences the firm’s servitization strategy.

CHAPTER 3. HYPOTHESES DEVELOPMENT 116
3.4 Modelling the External Factors Influencing Servitization Strategies and
Firm Performance
3.4.1 Dynamism and Industry Clock Speed
According to Fine (1998), industry clock speed (IC) refers to the rate of change within an industry
sector or change that is external to a particular industry. The swifter the rate of change, the higher the
clock speed (Guimaraes, 2011). For instance, the mining industry is considered a slow-clock speed
industry sector, while the computer software industry is an example of a fast-clock speed sector (Fine,
1998).
In exploring dynamic capability theory, environmental dynamism is considered an important
contingency variable that shapes the type of strategy employed by the organization (Teece et al., 1997;
Eisenhardt and Martin, 2000). In this dynamic environment, contingency theory can lend itself to an
understanding of the industry clock speed effect when choosing a firm strategy (Chavez et al., 2012).
This theory is founded on the premise that firms are not closed systems; instead, they are perpetually
being exposed to environmental pressure that should be taken into account when designing the firm’s
strategy (Lawrence and Lorsch, 1967). Doing so should improve the design and choice of the strategy,
and at the very least should help improve firm performance (Hofer, 1975).
Departing from the conceptual tautology of industry clock speed, Fine (1998) suggests that
industry clock speed can be measured in terms of the rate of change of products/services, processes
and organizational structures. In this paper, the product/service change rate denotes the rate of
product/service introduction to the market, while change in process denotes the frequency at which
dominant production processes and production technologies are substituted and changed. Finally,
changes in organizational structure refer to changes such as mergers and acquisitions, CEO transitions
and restructuring programmes (Fine, 1998).
Dynamism also plays a pivotal role in the manufacturer’s environment; it is related to market
and industry turbulence, as well as to the degree of uncertainty in both the product markets and

CHAPTER 3. HYPOTHESES DEVELOPMENT 117
technology (Thornhill, 2006; Utterback, 2006). The role of industry clockspeed (IC) was investigated
by O'Connor, Ravichandran and Robeson (2008), who found a moderating effect of IC on firm
collaboration activities and firm performance. The IC construct is also considered an external
environmental moderator of the relationship between business model change and firm performance
(Jansen, van den Bosch, and Volberda, 2005; Jacobides et al., 2006; Chavez et al., 2011).
Moreover, Fine (1998) argues that companies must be able to anticipate and adapt to change
in the environment in order to achieve better market performance. Fine (1998) also suggests that the
most prominent goal of the firm is to understand the dynamics of processes that will help in
developing principles to guide the choice of organisational design and internal organisational
processes, specifically in high IC environments where firms need to appreciate and manage all their
internal capabilities in order to deliver better market offerings. The recent innovation literature
suggests that industry clock speed is a significant factor in evaluating company management strategies
(Guimaraes, 2011; O’Connor et al., 2008; Weijermars, 2009). Generally speaking, rapidly-changing
business environments generate more uncertainty and place substantially more strain on direct
human relationships than more slowly-changing business environments (Hall, 1999). Consequently,
manufacturing firms in fast-changing environments require better leadership, more knowledge about
business conditions, and better management in general, which will impact the way the firms introduce
service offerings to keep pace with the outside environment, leading to higher profitability (Visnjic et
al., 2014).
Furthermore, an empirical study by Fang et al. (2008) found a moderating effect of industry
turbulence on the relationship between service ratio and firm value. In highly volatile industries,
mangers seek a more diversified portfolio that can help stabilize firm earnings and cash flows and
increase the chances of survival (Zahra, Ireland, and Hitt, 2000).
On the other hand, in a relatively stable industrial environment, there is less need for
innovation and less need for managers to quickly identify business problems and opportunities,

CHAPTER 3. HYPOTHESES DEVELOPMENT 118
technologies and other resources necessary for service delivery (Handfield et al., 2000). Therefore, in
the low turbulence industry context, servitization strategies have a negative impact on firm value due
to complacency in the market place which hamper the growth trajectories (Fang et al., 2008). In
dynamic environments, where demand is constantly shifting, opportunities become abundant and
performance should be highest for those firms that have an orientation toward pursuing new
opportunities. This is because such firms show a good fit between their strategic orientation and the
environment (Wiklund and Shepherd, 2005).
An additional aspect when studying performance outcomes is the consideration of
moderating variables. In this thesis, the author concentrate on market dynamism, which is considered
the most relevant moderating variable (Slater and Narve, 1994). Building on this notion, the author
argues that servitization adoption requires the manufacturing firm to be flexible and agile in order to
adapt to the external environment. Therefore, this research argues that the size and the nature of the
relationship between servitization and firm performance changes as a function of the industry
dynamism and clock speed. Following this reasoning and rationale, the author puts forward the
following hypothesis:
H14: Industry clock speed has a moderating effect on the relationship between servitization strategy
and firm performance

CHAPTER 3. HYPOTHESES DEVELOPMENT 119
3.5 Servitization’s Impact on Firm Performance
Wise and Baumgartner (1999) argue that services could represent a more profitable long-term source
of revenue than initial product sales. However, in the context of servitization, findings about the
relationship between implementing services and firm performance have been vague and far from
conclusive (Baines et al., 2015). This is due to a lack of empirical research investigating this relationship
using a large sample (Eggert et al., 2011; Eggert et al., 2014; Fang et al., 2008). Prior research
investigating the consequences of servitization suggests that servitization is a beneficial strategy by
which manufacturers can differentiate themselves from competitors (Baines et al., 2009; Oliva and
Kallenberg, 2003), achieve higher profitability (Suarez et al., 2013; Visnjic et al., 2014), increase their
market value (Fang et al., 2008), and increase customer loyalty (Baines and Lightfoot, 2013). However,
these studies provide little robust evidence of the real impact of servitization on firm performance
(Crozet and Milet, 2015; Gebauer et al., 2005; Visinjic and Van Looy, 2013). In addition, the empirical
research has yielded contradictory results, thus demanding more fine-grained empirical research to
clarify the true nature of this relationship (Benedetti, Neely, and Swink, 2015) and to explain why the
expected benefits of servitization often do not materialise – a phenomenon that is called the “service
paradox” (Gebauer et al., 2005). Gebauer et al. (2005) describes the service paradox as follows:
Most product manufacturers are confronted with the following phenomenon: companies which invest heavily in extending their service business increase their service offerings and incur higher costs, but this does not result in the expected correspondingly higher returns. Because of increasing costs and a lack of corresponding returns, the growth in service revenue fails to meet its intended objectives. We term this phenomenon the ‘‘service paradox in manufacturing companies.’’ (p.15)
This concept has also been referred to as the servitization paradox (Benedettini, Neely, and
Swink, 2015) in prior empirical research. For example, Neely (2008) investigated the financial
consequences of servitization and found that servitized manufacturing firms generate higher revenues
but lower net profits as a percentage of revenues than pure manufacturing firms. The reasons for this
are that servitized firms face higher average labour costs, working capital and net assets.

CHAPTER 3. HYPOTHESES DEVELOPMENT 120
Fang et al. (2008) further investigated the effect of the service transition on firm value in U.S.
firms and found a non-linear U-shaped relationship, with an improvement seen in the market value of
servitized manufacturing firms. For this improvement to materialise and become noticeable, service
sales and service intensity must surpass the critical level of approximately 15%-20% of total revenue.
This non-linear performance effect was later confirmed by Kohtamäki et al. (2013), and Suarez et al.
(2013) found a convex, non-linear relationship between advanced service implementation and
financial performance, where firms with a very high level of product sales were most profitable and
increasing service provision was linked with declining profitability. In contrast, the findings of Ruizalba
et al. (2016) found no statistically significant direct impact of advanced services on firm performance,
as this relationship was mediated by servitization consequences.
Interestingly, Chen (2010) compared Chinese and U.S. firms with regard to the impact of
service orientation on firm performance, and concluded that a positive linear relationship does exist
between servitization and firm performance in the U.S., while the Chinese counterparts display an
inverted U-shaped relationship (Min, Wang, and Luo, 2015). Parallel to this, Zhou’s (2010) empirical
findings suggest that the servitization decision positively influences the firm’s market performance
(Tobin’s q), while the servitization level negatively influences firm financial performance, as measured
by return on assets (ROA), economic value-added change rate, and earnings per share (EPS). In this
context and based on data from the International Manufacturing Strategy Survey, Li et al. (2013)
investigated the impact of servitization on manufacturing business performance. His results reveal a
positive effect of servitization on business performance in terms of both the return on sales (ROS) and
return on investment (ROI). More recently, Benedetti et al. (2015) have suggested that servitization is
associated with a high risk of bankruptcy and that manufacturing firms deciding to diversify via
servitization can therefore expect higher returns in exchange for accepting this risk. Visnjic,
Wiengarten and Neely (2014) propose that manufacturing firms should invest in product innovation
processes coupled this with adequate investment into the service business model in order to enhance
long-term profitability.

CHAPTER 3. HYPOTHESES DEVELOPMENT 121
The recent servitization literature also suggests that many different factors can affect the
impact of servitization on firm performance, such as industry clock speed and resource slack (Fang et
al., 2008), the firm’s socio-technical capacity, its strategic alignment (Hu et al., 2013), and network
capabilities (Kohtamäki et al., 2013).
Substantial body of servitization research argued that services could represent a more
profitable long-term source of revenue than initial product sales (Eggert et al., 2014). However,
services are known to be knowledge-intensive, labour-intensive and hard to standardised which can
increase the transaction cost and hamper profitability (Kohtamäki & Partanen, 2016). Prior
servitization research which investigates the consequences of servitization, suggested that
servitization is a beneficial strategy in which manufacturers can differentiate themselves from
competitors (Oliva & Kallenberg, 2003), it can lead to higher profitability (Suarez et al., 2013), increase
in market value (Fang et al., 2008) and increase customer loyalty (Baines & Lightfoot, 2013).
However, these studies give little robust evidence on the real impact of servitization on firm
performance (Crozet & Milet, 2017; Gebauer et al., 2005; Visnjic Kastalli & Van Looy, 2013). Add to
that the contradictory results produced by prior empirical studies, this lead us to the need to a fine-
grained empirical research to clarify the true nature of this relationship (Benedettini et al., 2015), and
further explain why the expected benefits of servitization does not materialise in many cases causes
what so called the “service paradox” (Gebauer et al., 2005).
Prior empirical research investigated the financial consequences of servitization, found that
servitization of manufacturers generate higher revenues but lower net profits as a percentage of
revenues than pure manufacturing firms (e.g. Neely, 2008). The reasons for this are that servitized
firms encounter higher average labour costs, working capital and net assets. Conversely, other
scholars empirically established a positive relationship between service offerings and company
outcomes (Antioco et al., 2008; Homburg et al., 2003).

CHAPTER 3. HYPOTHESES DEVELOPMENT 122
For instance, the study by (Homburg et al., 2003) supported (indirect) effects of service
orientation on service profitability, and overall company profitability. In a similar vein, Gebauer (2007)
finds a positive relationship between the customer service support strategy and overall profitability.
Moreover, Fang et al. (2008) investigated the effect of service transition on firm value in U.S,
and supported that a non-liner relationship does exist between them taking a U-shape form, thus
exhibiting, an improvement of the market value of the manufacturing firm. For this improvement to
materialise and become noticeable service, sales service intensity must surpass a critical level of
approximately 15%–20% of the total revenue. This non-liner performance effect was later confirmed
by Kohtamäki et al. (2013) and at a further point Suarez et al. (2013) found a convex, non-linear
relationship between advanced service implementation and financial performance in the software
industry. According to this study, firms with a very high level of product sales are most profitable,
whilst rising the service provision is linked with declining profitability.
Based on the foregoing discussion, the author puts forward the following hypothesis:
H15: Servitization strategies positively influence the firm’s overall performance.
CHAPTER 3. HYPOTHESES DEVELOPMENT 123
3.6 Firm Performance
In investigating the servitization–performance relationship, it is essential to recognize the
multidimensional nature of the performance construct (Chakravarthy, 1986). That is, different factors
contribute to overall firm performance, at times leading to favourable outcomes on one performance
dimension and unfavourable outcomes on a different performance dimension, as discussed in Section
3.5. For instance, ramping up investment in R&D and product innovation may lead to better
penetration into new product-market domains, consequently enhancing sales growth in the long run.
However, the requisite resource commitment and the process of acquiring new capabilities and
competences may hinder short-run profitability. Therefore, research that only considers a single
dimension or a narrow range of the performance construct (e.g., multiple indicators of profitability)
may yield a misleading description and normative theory building (Christensen, 2006). Research that
tests propositions, such as this endeavour, should include multiple performance measures. Such
measures could include traditional accounting measures such as sales growth, market share, and
profitability. In addition, indicators of overall performance would be useful in incorporating the firm’s
goals, objectives and aspiration levels (Kirchhoff, 1978), as well as other elements such as broader
stakeholder satisfaction. Alternative measures of performance may compete with one another,
depending on the size and type of firm and its ownership structure (Chenhall, 2003). This can be
addressed by the use of the balanced scorecard (BSC) to evaluate firm performance (Kaplan and
Norton, 2001). Cornerstones of the BSC include its balance of different aspects of performance,
multiple stakeholder perspectives, including external organisations, and the way it encourages setting
goals for measures. Innovation and learning are recognised as important by the BSC, and just as the
previous chapter discussed how innovation is essentially an inter-organisational process (Tidd and
Bessant, 2016), the BSC suggests that performance is of interest to and influenced by stakeholders
beyond the immediate organisation.

CHAPTER 3. HYPOTHESES DEVELOPMENT 124
Other nonfinancial considerations may also be important for firm performance, such as
reputation, public image and goodwill, and the commitment and satisfaction of employees. Quinn
and Cameron (1983) found that the criteria for evaluating firm performance and effectiveness shift as
an organization evolves; therefore, those investigating the effectiveness and impact of specific
organizational practices should be careful to choose the right performance criteria.
In this research, the construct of firm performance (Jaworski and Kohli, 1993) was measured
subjectively, which is a common practice in research on companies and business units (Powell, 1995).
In particular, overall financial performance was measured using five subjective items: profitability,
sales, growth, and overall financial performance, following the recommendations of various authors
(Gebauer et al., 2010; Lawrence and Lorsch, 1967; Dess, 1987; Powell, 1992). While subjective
performance measures are widely accepted in organizational research, the author preferred to use
financial statement data because the study’s heterogeneous sample showed substantial industry
variance in terms of capital structure and accounting conventions, and the manufacturing target
sample showed differences in inventory valuation, depreciation, and employee salaries. (Powell,
1995). Firm performance, as the author refer to it in this research, is a subset of organizational
effectiveness that covers market, operational, learning and financial outcomes. Prior empirical
research looking at servitization’s impact on firm performance has measured performance using
market performance measures (e.g., customer satisfaction, total sales and market shares) and
financial performance measures (e.g., return on sales (ROS), return on assets (ROA), general
profitability and cash flow) (Gunday et al., 2011). Gebauer (2008) measured overall profitability by
average return on sales (operating result before tax/sales) of the business unit over the last three
years and average return on sales in comparison with the industry average. Gebauer et al. (2011) later
measured firm performance by asking participants their market share and financial performance
relative to competitors over a 3-year span.
The measures used in this model construct will be explained in detail in Chapter 4.
125
CHAPTER4 Research Methodology
ccording to Faul et al. (2007), data collection in empirical studies can rely on existing data
(secondary data) or independent data (primary data). In order to answer the proposed research
questions and investigate the servitization processes undertaken by manufacturing companies, this
empirical analysis includes the collection of both primary and secondary data.
Popper’s (1972) theory of scientific explanation will be followed to achieve the research aim
and objectives, and will influence the research strategy. The scientific explanation theory entails the
conjecture that science per se should enhance the ability to provide explanations (rather than merely
descriptions). To do this, the model of scientific explanation can be utilized to describe and
systematically structure such explanations as causation, as causal claims are the main pillars of
scientific explanation. Consequently, a cross-sectional quantitative research design was adopted and
‘The Deductive-Nomological’ (DN) model has been followed to explain the cause-effect relationship
proposed in this research (Popper et al., 1973). Furthermore, the research area is organizational and
managerial science, which relies on assumptions rather than deterministic rules (e.g., laws in natural
science). Therefore, a deductive-statistical explanation, as suggested by Hempel (1965), has been
followed.
A

CHAPTER 4. RESEARCH METHODOLOGY 126
In this explanatory research, a cross‐sectional, self-administrated survey was used to collect
firm-level data from the target population (Van de Ven, 2007; Wittenberg, 2001). This approach was
deployed to capture the respondents’ perceptions and attitudes toward the servitization
phenomenon. Cook and Campbell (1979) argue that this method of inquiry (quasi‐experimental cross‐
sectional survey) is the only one that allows the testing of statistical significance, and thus, the
establishment of co-variance or correlation between the presumed causes and effects of the
phenomenon.
4.1 Philosophical Standpoint
This current research approaches theory testing through empirical research. A set of testable
hypotheses have been postulated, drawing on prior literature and theoretical underpinnings. As this
thesis can be qualified as a scientific research endeavour, it inevitably follows a specific philosophy of
science that guides the researcher’s understanding of the nature of the phenomenon of interest
(ontology), the means used to facilitate the acquisition of such knowledge, and how this knowledge
can be understood (epistemology) (Van de Ven, 2007). The use of survey data will allow the developed
hypotheses to be tested in order to derive recommendations and conclusions. According to Bryman
and Bell (2003), the epistemological concerns with regard to what is or what should be considered
valid acceptable knowledge in a discipline should be identified in order to choose the right research
design. This thesis follows a post-positivistic epistemology, in which the researcher favours the belief
that human knowledge is based not on unchallengeable foundations, but rather on human conjecture.
Therefore, knowledge can be modified or withdrawn in light of further investigation. Post-positivism
refines the views and beliefs of positivism, and advocates the application of the methods of the natural
sciences to the study of social reality and beyond (Bryman and Bell, 2003).
Post-positivism acknowledges that the theories, hypotheses, background knowledge and
values of the researcher need to be taken account of and can influence what is observed (Reichardt
and Rallis, 1994). The post-positivist critical realist believes that the goal of science is to hold

CHAPTER 4. RESEARCH METHODOLOGY 127
steadfastly to the goal of correctly understanding reality, even though the author can never achieve
that goal. Because all measurement is fallible, the post-positivist emphasizes the importance of
multiple measures and observations, each of which may be subjects to different types of error.
Triangulation across these multiple sources can thus be used to try to obtain a better understanding
of what is happening in reality. According to post-positivism, reality does exist but can only be known
imperfectly because due to the researcher's limitations. Therefore, post-positivists pursue objectivity
by recognizing the possible effects of biases and understanding the structural changes that might
happen (Kuhn and Hawkins, 1963). Following this research philosophy, the ontological standpoint of
post-positivists is that reality exists but can only be known imperfectly and probabilistically. Therefore,
the logic of scientific discovery is falsifcationism (Popper, 2005).
4.2 Questionnaire Design and Data Collection
For this thesis, different types of data were collected from two sources: perceptual data from a firm-
level survey, and objective performance data from secondary sources (OSIRIS database). The
researcher employed a quasi‐experimental, cross‐sectional, self-administrated survey to collect firm-
level data from the target population (Van de Ven, 2007). Such data allows the testing of statistical
significance, and thus, the establishment of covariance or correlation between the postulated causes
and effects of the servitization phenomenon. Use of a survey‐based mode of inquiry is expected to
enable, even if restrictedly, the generalization of the study’s findings to a broader context (Jick, 1979).
This data collection instrument (a questionnaire) was developed based on the prior literature
and included the main measures and constructs though to drive servitization in manufacturing
companies. The main reason for using a survey to collect primary data was that data could be collected
from a wide range of participants cheaply and swiftly, saving time and enhancing effectiveness
(Saunders, Lewis, and Thornhill, 2014). The main objective of the data collection instrument was to
collect useful data to test the research hypotheses. Before the questionnaire development process
and the operationalization of constructs, initial, semi-structured orientation interviews were held with

CHAPTER 4. RESEARCH METHODOLOGY 128
three different senior service managers from different manufacturing businesses in the UK. This was
done in order to support the development of the questionnaire.
These initial interviews were followed by the operationalization and enumeration of the C‐
OAR‐SE method (Rossiter 2002) for scale development in case the researcher could not find a
measurement scale that suited the study’s empirical context. The servitization construct was
developed following the C‐OAR‐SE method. This method is used because it has total emphasis on
achieving high content validity of the item(s); therefore, it fits the research objectives better than the
psychometric approach, which is based on Churchill’s “scale development” procedure (Rossiter,
2011). Furthermore, The C-OAR-SE procedure has no limitation as it can be applied to all types of
construct, reflective and formative specially when measuring a subdimension of the construct using
single items, such as beliefs and perceptions (Rossiter, 2011). (For the most recent sample of the
research questionnaire, see Appendix A. After fully developing the survey, a draft version was
examined by three academic staff from University of West London (UWL), Swansea University and
Lancaster University, respectively, who were well oriented with the research topic. The feedback
received from those academics was very positive in terms of overall questionnaire design. The author
did receive some constructive feedback regarding the need for scale anchoring for the firm
performance items. These items were thus anchored on a scale ranging from “Strongly Decreased” to
“Strongly Increased” rather than “Very Successful” to “Not at all Successful.” The servitization scale
did appear to be reasonably appropriate for measuring servitization.
In January 2016, a pilot study was conducted in which the questionnaire was discussed with
industrial service experts. The questionnaire was piloted in a modular manner. First, so-called ‘dry-
runs’ were carried out to test the questionnaire using three selected manufacturing firms in the UK
that were not included in the final study. The pilot study was conducted to examine the acceptance
of the paper-based questionnaire, to test how comprehensible the research questionnaire was, and
to highlight any ambiguity in the wording, special expressions or industry specific jargon. The dry run

CHAPTER 4. RESEARCH METHODOLOGY 129
feedback received was to make some minor tweaks to some aspects of the questionnaire, for instance,
adding question number 11 asking if the manufacturing firm has a stand-alone service unit. This was
added as an indicator of an established servitization process. Later, content validity and reliability were
tested using both exploratory and confirmatory factor analysis, adding evidence for the adequacy of
the questionnaire used (Churchill and Iacobucci, 2005).
The final version of the questionnaire was completed after taking into consideration various
issues related to the design, layout and final implementation of the questionnaire. This was done in
order to increase survey response. A cover letter was included with the final questionnaire to
introduce the participants to the study objectives, explain some concepts and assure the respondent
that their confidentiality would be maintained (Smyth and Williamson, 2004). Each firm identified as
meeting our inclusion criteria was sent a mailing included a prepaid return envelope, a cover letter
and the the questionnaire, this questionnaire packet was sent through the postal system. The letter
asked the respondents to complete the questionnaire if possible or to pass it on to others potential
respondents who are appropriate.
The self-administered postal survey was adopted for its efficiency in gathering firm-level data
as well as for ease in coordinating and administrating the data collection process (Stevens and Loudon
2003). Purposive sampling was used to target the study population, which meant distributing the
questionnaire to those subjects who met the inclusion criteria and were related to the research
interests. Some of the shortcomings of postal questionnaires are that can be difficult to obtain a fully
representative or diversified sample, and it can be hard to exert control over the sample; however,
this technique is widely used in these types of studies (Stevens and Loudon, 2003).
In summary, to test our hypotheses, a questionnaire was drafted in English and pretested with
executives and managers, who were asked to review it for readability, ambiguity, and completeness
(Dillman, 2007). The questionnaire was also critiqued by three academics who were asked to review
the survey items (statements) for ambiguity and clarity, and to evaluate whether the individual items

CHAPTER 4. RESEARCH METHODOLOGY 130
appeared to be appropriate measures of their respective constructs (DeVellis, 2003). Minor changes
were made based on these pre-tests.
The questionnaire was developed in English and then back-translated into German and French
by two different groups of native speakers of those languages to ensure similarity in meaning and
semantic equivalence across languages (Schaffer and Riordan, 2003). The survey data was collected
between February 2016 and September 2017. Following Dillman’s Total Design Method (Dillman,
2007), initial mailings were followed by second mailings and follow-up phone calls if necessary. The
author adopted the following two-part approach to ensure the quality of the obtained data and to
achieve the best possible survey response rate. First, in the pre-screening stage, each potential
participant was contacted by phone to request his/her participation in the study; this prevented the
survey from being received as ‘cold.’ Second, three questions were introduced into the questionnaire
to subjectively check the quality of the information provided by the respondents and their knowledge
about the research topic (Kumar, Stern, and Anderson, 1993).
We received responses from 220 firms out of 1130 (19.5%), 20 of which were excluded due to
missing data or inconsistent datasets. The data preparation concentrated on the distribution of each
individual variable and construct. As suggested by Hair (1998, 2010), we looked at skewness, kurtosis
and outliers. Outliers showing extreme deviation from the mean – more than 2 times the standard
deviation – were removed (Hair, 1998; Hair, 2010). Further data screening for outliers, unengaged
responses, and normality issues were conducted, resulted in the exclusion of another 10 respondents.
We also excluded five cases where respondents had a low degree of knowledge regarding the research
topic; this was done based on the added question which reflects the respondent’s knowledge about
the research area as mentioned above.
It was ensured that all remaining firms had available financial data. Our final data set consisted
of 185 fully completed questionnaires, yielding an effective response rate of 16% (185/1130). This
response rate is considered satisfactory, and is comparable to similar management studies employing

CHAPTER 4. RESEARCH METHODOLOGY 131
same data collection instrument (Baruch, 1999; Gebauer, Edvardsson, and Bjurko, 2010; Kumar et al.,
1993; Wagner, Grosse-Ruyken, and Erhun, 2012).
4.3 Sample
The sampling for this research was done in accordance with Singleton and Straits’s (2005) three-stage
sampling procedure, which consists of identifying the target population, constructing the sample
frame, and using a probability or non‐probability sampling strategy.
The target population was identified based on the selection of servitized manufacturing firms
in business-to-business (B2B) settings as the study’s contextual locus, Given the globalized nature of
this focus, geographic restrictions were applied to include only profit-oriented manufacturing
companies from the USA and Europe plus Switzerland, following recommendations from Raddats and
Kowalkowski (2014) and Wagner et al. (2012). Key informant targeting techniques (Phillips, 1981)
were used to identify those involved in service business development and servitization strategy. The
survey was targeted toward senior managers in the marketing, operating and service departments, as
they were likely to be the most informed about strategic issues pertaining to servitization. The list of
companies was mainly drawn from the OSIRIS database (www.bvdinfo.com), which is a private
commercial database contains financial data, directors, contact persons, business news, the sector,
etc., for more than 44,000 publicly listed companies from around the world. This database has been
used in similar studies on servitization (Neely 2008; Raddats and Kowalkowski, 2014).
4.3.1 Population and Sampling Frame
following Singleton and Straits (2005), a three‐stage process was deployed to pinpoint the thesis
sampling design. The three stages include:
1. the identification of the target population,
2. the construction of an appropriate sampling frame,
3. the application of a probability or non‐probability based sampling strategy.

CHAPTER 4. RESEARCH METHODOLOGY 132
4.3.1.1 Target Population
The population of interest in this thesis and its empirical context, are those manufacturing
firms who are actively engaged in implementing servitization strategies for the last 3 year or more
which are also the study’s contextual locus, at this point it should be stated that given the globalized
nature of the target population, this these is applying some filtering and inclusion strategy to be used
for the OSIRIS database listing procedure. As presented in table 4-2 the author only included the
following countries France, Germany, Italy, Spain, Sweden, Switzerland, United Kingdom, United
States as they are considered leaders in introducing servitization in manufacturing (Neely 2008).
To further characterise the target population, author also targeted publicly listed companies
with primary US Standard Industrial Classification (SIC) codes in the range of 7–32 (see also table 4-1)
to cover all firms related to manufacturing resulting in 2,947 companies as this study target
population.
Table 0-1: Sample industry US SIC Code distribution.
US SIC
Industry N %
7. Mining of metal ores 4 2
10. Manufacture of food products 5 3
18. Printing and reproduction of recorded media 5 3
19. Manufacture of coke and refined petroleum products 4 2
20. Manufacture of chemicals and chemical products 11 6
21. Manufacture of basic pharmaceutical products and pharmaceutical preparations 14 8
22. Manufacture of rubber and plastic products 6 3
23. Manufacture of other non-metallic mineral products 2 1
24. Manufacture of basic metals 5 3
25. Manufacture of fabricated metal products, except machinery and equipment 12 6
26. Manufacture of computer, electronic and optical products 29 16
27. Manufacture of electrical equipment 25 13
28. Manufacture of machinery and equipment 36 19
29. Manufacture of motor vehicles, trailers and semi-trailers 4 2
30. Manufacture of other transport equipment 15 8
32. Other manufacturing 8 4
Total 185 100

CHAPTER 4. RESEARCH METHODOLOGY 133
4.3.1.2 Sampling Frame
After identifying the population of interest, the second‐stage of the sampling design was introduced
to identify the appropriate sampling frame. Following Singleton and Straits (2005), the sampling frame
is carried out in order to successfully identify the set of all subjects from which the sample can be
appropriately selected.
According to Van de Ven (2007) the
construction of the sampling frame may be achieved:
“… by either listing all the cases in the [target] population or by developing a rule that defines membership in the population. Oftentimes it is not possible to identify all members of a target population. A census listing of all members of a target population may not exist. Instead, researchers often rely on a rule stipulating criteria for inclusion and exclusion…” (p.182) for inclusion all companies retrieved from OSIRIS database should have their full financial data
available, therefore the author also ensured that the financial data of the publicly listed firms retrieved
from OSIRSIS data base are all available. This resulted of 2,105 company with full financial data.
Those manufacturing firms whose main activities included industrial services as a part of their
market offering were included. Industrial service manufacturers was distinguished from pure
manufacturing, their core offerings were identified by analysing the firm description and history fields
from the OSIRIS database, following Neely (2008). This distinguish between servitized firms and non-
servitized firms carried out examining the firm’s business descriptions. Using 5 sets of terms and
phrases identified through the grounded theory approach, an automated coding process was
developed using Excel SEATCH function. Strings of words that identified whether firms offered specific
services— e.g. IF(ISNUMBER(SEARCH(“serv*”,$D4)),1,0)—were developed and used to automatically
code the data set. A very conservative approach to coding was applied. all companies were
automatically classified as pure manufacturing firms unless there was clear evidence thy should be
classified as servitized firm. As a result of the coding process, 949 not servitized firms has been

CHAPTER 4. RESEARCH METHODOLOGY 134
identified and hence been removed from the dataset, Appendix B contains several examples of
business descriptions from the OSIRIS database. Finally, 1,156 firms were identified as servitized firms
that met the inclusion criteria.
Table 0-2: Search strategy and sample identification.
Product name Osiris
Update number 200
Software version 191.00
Data update 07/02/2016 (n° 2426)
Export date 07/02/2016
Cut-off date 31/03
Step result Search result
1. Listed/Unlisted companies: Publicly listed companies 57,029 57,029
2. World region/Country: France, Germany, Italy, Spain, Sweden, Switzerland, United Kingdom, United States
29,510 14,038
3. NACE Rev. 2 (Primary codes only): 10 - Manufacture of 36,348 4,696
food products, 11 - Manufacture of beverages, 12 -
Manufacture of tobacco products, 13 - Manufacture of
textiles, 14 - Manufacture of wearing apparel, 15 -
Manufacture of leather and related products, 16 -
Manufacture of wood and of products of wood and
cork, except furniture; manufacture of articles of
straw and plaiting materials, 17 - Manufacture of
paper and paper products, 18 - Printing and
reproduction of recorded media, 19 - Manufacture of
coke and refined petroleum products, 20 -
Manufacture of chemicals and chemical products, 21 -
Manufacture of basic pharmaceutical products and
pharmaceutical preparations, 22 - Manufacture of
rubber and plastic products, 23 - Manufacture of other
non-metallic mineral products, 24 - Manufacture of
basic metals, 25 - Manufacture of fabricated metal
products, except machinery and equipment, 26 -
Manufacture of computer, electronic and optical
products, 27 - Manufacture of electrical equipment, 28
- Manufacture of machinery and equipment nec, 29 -
Manufacture of motor vehicles, trailers and semi-
trailers, 30 - Manufacture of other transport
equipment, 31 - Manufacture of furniture, 32 - Other
manufacturing, 33 - Repair and installation of
machinery and equipment, 35 - Electricity, gas, steam
and air conditioning supply, 36 - Water collection,
treatment and supply
4. Profit Margin (%): All companies with a known value, Last year -3 60,941 2,947
5. Return on Total Assets (%): All companies with a known value, Last year -3 70,414 2,878

CHAPTER 4. RESEARCH METHODOLOGY 135
Table 4-2 continued
6. Total Assets: All companies with a known value, Last year -3 74,954 2,878
7. Net Income: All companies with a known value, Last year -3 75,353 2,878
8. Market Cap.: All companies with a known value, Last year -3 45,806 2,417
9. Number of employees: All companies with a known value, Last year -3 38,889 2,248
10. EBIT margin: All companies with a known value, Last year -3 58,148 2,241
11. Operating revenue per employee: All companies with a known value, Last year -3
35,999 2,241
12. Net assets turnover: All companies with a known value, Last year -3 64,236 2,211
13. Fixed Assets: All companies with a known value, Last year -3 70,823 2,211
14. Price / Book value ratio - current: min=-1, Last available year 43,026 2,105
15. Current Portion of LT Debt: All companies with a known value, Last year -3 29,609 1,156
Boolean search : 1 And 2 And 3 And 4 And 5 And 6 And 7 And 8 And 9 And 10 And 11 And 12 And 13 And 14 And 15
Note: Total represent only servitized firms (949 not servitized firms been removed from the dataset)
TOTAL 1,156
In our efforts to achieve a high response rate, the author was made aware of an international
industrial event specializing in Industry 4.0, which is synonymous with servitization. This global event
is carried out in Hanover, Germany on an annual basis, with an exhibitor list of 6,500 companies from
70 different countries (Hanover Messes, 2017). By comparing the published participant list with our
dataset, we found that 450 companies on our servitized list were also participating in the event.
Following a purposive sampling technique to efficiently identify knowledgeable and reliable
informants (Tongco, 2007), we attended the event, where we distributed a hard copy of the survey to
potential participants (in their preferred survey language). A total of 780 questionnaires were
distributed and 150 were collected manually over the course of the week-long event. The postal
survey was also distributed to those from the event who stated a preference for it and who provided
their contact details. The postal survey was then sent to a further 350 companies from our list
obtained from OSIRSIS dataset. The total number of distributed questionnaires was 1,130.

CHAPTER 4. RESEARCH METHODOLOGY 136
4.3.1.3 Sampling Strategy and Minimum Sample Requirements
Purposive sampling has been used in research for many years (Campbell 1955, Godambe 1982).
However, where possible, random or probability sampling is recommended as a means of informant
selection because randomization reduces biases and allows the results to be extended to the entire
sample population (Godambe, 1982; Smith, 1983; Tongco, 2007; Topp et al., 2004). Such research
results can also be applied beyond the community being studied (Bernard, 2002; Godambe, 1982;
Karmel and Jain, 1987). However, random sampling is not always feasible or efficient and in our case
Given the relatively manageable size of the study’s sampling frame, no particular probability‐based
sampling procedure was utilized. In this regard this thesis is using purposive sampling.
Data was also obtained to test the study’s model and hypotheses through the key informant
technique, which requires sending the survey for those respondents who are more likely to possess
an overarching, boundary-spanning view of their firms’ upstream and downstream activities in our
case (see Kumar et al., 1993; Seidler, 1974). Due to concerns expressed in previous studies about using
key informants (Phillips, 1981), we took steps to ensure that the key informants were well informed
about the research topic. This was done to ensure the quality of information obtained, to maximize
the response and to minimize non-response bias (Churchill and Iacobucci, 2005). First, the participants
were contacted by phone to ensure that the key informant was knowledgeable about the research
area. If not, he/she was asked to appoint or identify another more suitable person from the firm.
Second, following the recommendation of Kumar et al. (1993), three questions were added to the
questionnaire to check the quality of information provided by the participant and his/her level of
knowledge. The use of a single key informant for evaluating firm performance is consistent with prior
studies (Mohr and Spekman, 1994).
To determine the minimum sample size required for robust PLS-SEM, we followed the
recommendations of Hair et al. (2014) and Marcoulides and Saunders (2006), In their guideline, the
minimum sample size for a PLS-SEM analysis should be equal to the larger of the following. (10 times

CHAPTER 4. RESEARCH METHODOLOGY 137
rule): 1) 10 times the largest number of formative indicators used to measure one construct, or 2) 10
times the largest number of structural paths directed at a particular construct in the structural model.
The authors also recommended, however, that researchers follow more elaborate recommendations,
such as those provided by Cohen (1992), that also consider statistical power and effect sizes to
determine the optimal sample size. Alternatively, researchers should run individual power analyses,
using programs such as G*Power.
In this research, the maximum number of structural paths directed to the servitization
construct was six. Therefore, our minimum sample size must be at least 60. However, we carried out
an individual power analysis using G*Power software, with a statistical power of 0.8, an alpha of 0.05
and an effect size of 0.02, as those thresholds are widely used in similar management research (Cohen,
1992; Verma and Goodale, 1995). The power analysis yielded a minimum sample size of 114. The study
ended up achieving a sample size of 185 firms, meeting this minimum requirement.
It is worth mentioning that the sample consisted of companies from diverse industries,
increasing the heterogeneity of the sample (Avlonitis and Gounaris, 1997). This can lead to negative
effects on the quality of research findings (Dubinsky and Ingram, 1982; Bilkey, 1987). However, cross-
sectional samples showing heterogeneity are frequently used in research to enhance the
generalizability of the findings (Hooley et al., 1990; Kohli and Jaworski, 1992).

CHAPTER 4. RESEARCH METHODOLOGY 138
4.4 The C‐OAR‐SE Method for Scale Development
Measurement can be defined as the process of assigning numbers or labels to variables of units of
interest in order to numerically represent their conceptual properties (Singleton and Straits 2005).
According to Van de Ven (2007), measurement represents a problem of conceptualization. As such, it
is thought of as a process of moving from the abstract to the concrete by recasting theoretical
constructs into observable variables and subsequently devising replicable procedures and valid
indicators (i.e., indicators that capture the constructs’ intended meaning) in order to measure said
variables (Van de Ven, 2007).
In attempting to operationalize and enumerate the various theoretical constructs included in
this research, we principally drew upon the methodological rationale of Rossiter’s (2002) C‐OAR‐SE
method for scale development. Devised as an acronym to describe the method’s stages, C‐OAR‐SE
stands for ‘Construct definition, Object classification, Attribute classification, Rater identification,
Scale formation and Enumeration.’ As reported by Rossiter (2002), the method draws upon the work
of McGuire (1989) on the conceptualization of constructs as well as the work of Blalock (1964), Fornell
and Bookstein (1982), Cohen et al., (1990), Bollen and Lennox (1991), Law and Wong (1999) and
Edwards and Bagozzi (2000) on the classification of attributes. In addition to the method’s background,
our use of the method for scale development was further informed by the continuing academic
discourse that surrounds this relatively novel approach (e.g., Boorsboom et al., 2004; Diamantopoulos,
2005; Rossiter, 2005; Diamantopoulos et al., 2008; Bergkvist and Rossiter, 2009; Rossiter, 2011).
The C‐OAR‐SE method, as outlined by Rossiter (2002), is grounded in rationalism rather than
empiricism. As such, it thought to be in congruence with this thesis’s philosophical foundation of post-
positivism. According to the method’s rationale, each construct of interest may be defined in terms of
a focal object (henceforth referred to as ‘object,’ regardless of whether that object is of a physical or
perceptual nature), a dimension of judgment (referred to here as ‘attribute’) (McGuire, 1989) and the

CHAPTER 4. RESEARCH METHODOLOGY 139
judges or raters (referred to here as ‘rater entities’), who confer meaning to the construct (Rossiter,
2002).
The C-OAR-SE procedure is made up of six steps according to Rossiter (2011a, p. 2):
1. construct definition;
2. object representation;
3. attribute classification;
4. rater-entity identification;
5. selection of item-type and answer scale; and
6. enumeration and scoring rule
It’s important to stress that the C‐OAR‐SE method is considered superior to the psychometric
properties approach (Rossiter, 2011). Therefore, C-OAR-SE is a radical alternative to the traditional
empirically based psychometric approach, in which psychometric properties can be the Confirmatory
Factor Analysis, dimensionality, reliability, and validity of the construct proposed by Churchill (1979).
However, the C‐OAR‐SE method underscores the logical validity of the construct more than the
psychometric properties, in which logical validity refers to the extent a measure represents all facets
of a given construct. This approach is deemed to counter the shortcoming of psychometric approach,
which sometimes can lead to erroneous acceptance – or rejection – of many of our main theories and
hypotheses (Rossiter, 2011).
Under this methodological approach, six steps are advised in order to develop an appropriate
construct measure. These are summarized in figure 4-1 and are expanded upon in the section 4.7.2.1
on operationalization of the servitization construct.

CHAPTER 4. RESEARCH METHODOLOGY 140
Figure 0-1: Steps in the C‐OAR‐SE scale development method (Adapted from Rossiter 2002).

CHAPTER 4. RESEARCH METHODOLOGY 141
4.5 Data Analysis Techniques
4.5.1 Overview of Major Analysis Phases
The statistical examinations used in this thesis were divided into three main stages (see figure 4.2).
The first stage included exploratory and preparatory statistical analysis. This was done using factor
analysis to empirically extract components of the constructs of interest and also to support the
validation of a novel scale to measure servitization and the other reflective constructs presented in
Section 4.7. The second and third stages consisted of structural equation modelling, which was
fundamental to this research. It was divided into two major stages. The first stage of SEM analysis
predicted the statistical model, taking into account both causal moderation and direct effects. The
second assessed the mediating affect in the model through significance tests using bootstrapping and
the indirect effect.
Figure 0-2: Major analyses phases (Based on: Brunswicker, 2011).

CHAPTER 4. RESEARCH METHODOLOGY 142
4.5.2 Structural Equation Modelling (SEM) – Basic Features and Suitability for the
Research Problem
Nowadays, structural equation modelling (SEM) is a popular technique used by researchers across
disciplines, especially business and the social sciences (Henseler, Hubona, and Ray, 2015). SEM can be
viewed as a second-generation (2G) multivariate data analysis method (Kaplan and Haenlein, 2004).
There are two types of SEM, covariance- and variance-based SEM, and it is highly important to
distinguish between them. Henseler, Hubona and Ray (2015, p.2) describe the difference:
Covariance-based SEM estimates model parameters using the empirical variance-covariance matrix, and it is the method of choice if the hypothesized model consists of one or more common factors. In contrast, variance-based SEM first creates proxies, or linear combinations of observed variables, and then estimates the model parameters using these proxies. Variance-based SEM is the method of choice if the hypothesized model contains composites.
The main goal of using SEM is to examine complex causal relationships between constructs (Hair et
al., 2012). In order to determine when to use PLS-SEM instead of CB-SEM, researchers should focus
on the characteristics and objectives that distinguish the two methods (Hair et al., 2012). Table 4-3
provides a comparison of the two techniques that provided a rationale for choosing variance-based
SEM and its application, SEM-PLS. It also explains how SEM-PLS is appropriate for this thesis’s aims
and objectives.
Among variance-based SEM methods, partial least squares (PLS) path modelling is regarded
as the most fully developed and general system that seeks optimal linear predictive relationships
rather than causal mechanisms, thus privileging a prediction-relevance-oriented discovery process for
the statistical testing of causal hypotheses (Tenenhaus et al., 2005). This makes the technique suitable
for main objective of this thesis.
We used variance-based SEM software called SMARTPLS version 3. It was determined to be
more appropriate for this research than other statistical software packages such AMOS, multiple
regression and LISREL, in order to optimize the prediction precision (Hair et al., 2013).

CHAPTER 4. RESEARCH METHODOLOGY 143
In line with Hair et al. (2014), our rationale for using SEM-PLS to test the study model is as
follows:
The primary objective of applying structural modelling is prediction and explanation of target constructs, in line with our research objectives.
The theoretical framework of this research contains both reflective and formative constructs, and PLS-SEM can easily handle reflective and formative measurement models.
The theoretical foundation of servitization strategies and process is less developed.
This research uses a relatively small sample size and complex models. PLS-SEM works more efficiently with small samples.
The PLS model consists of two types of models (see figure 4-3). First, the structural model
(generally called the inner model in PLS-SEM) describes the relationships between latent variables
(constructs). Second, the measurement models represent the relationships between constructs and
their corresponding indicator variables (generally called the outer models in PLS-SEM).
Finally, the use of partial least squares (PLS) has an advantage over covariance-based SEM
such as LISREL, as it requires less rigid assumptions about the randomness of the sample and the
normality of the distribution of variables (Wold, 1975). Furthermore, it can accept smaller sample
sizes, as each causal subsystem’s sequence of paths is estimated separately (Anderson and Gerbing,
1988; Birkinshaw et al., 1995; Tsang, 2002; Wold, 1975).
Figure 0-3: Example of a PLS path model (Source: Henseler, Sinkovics, and Ringle, 2009, p. 285).
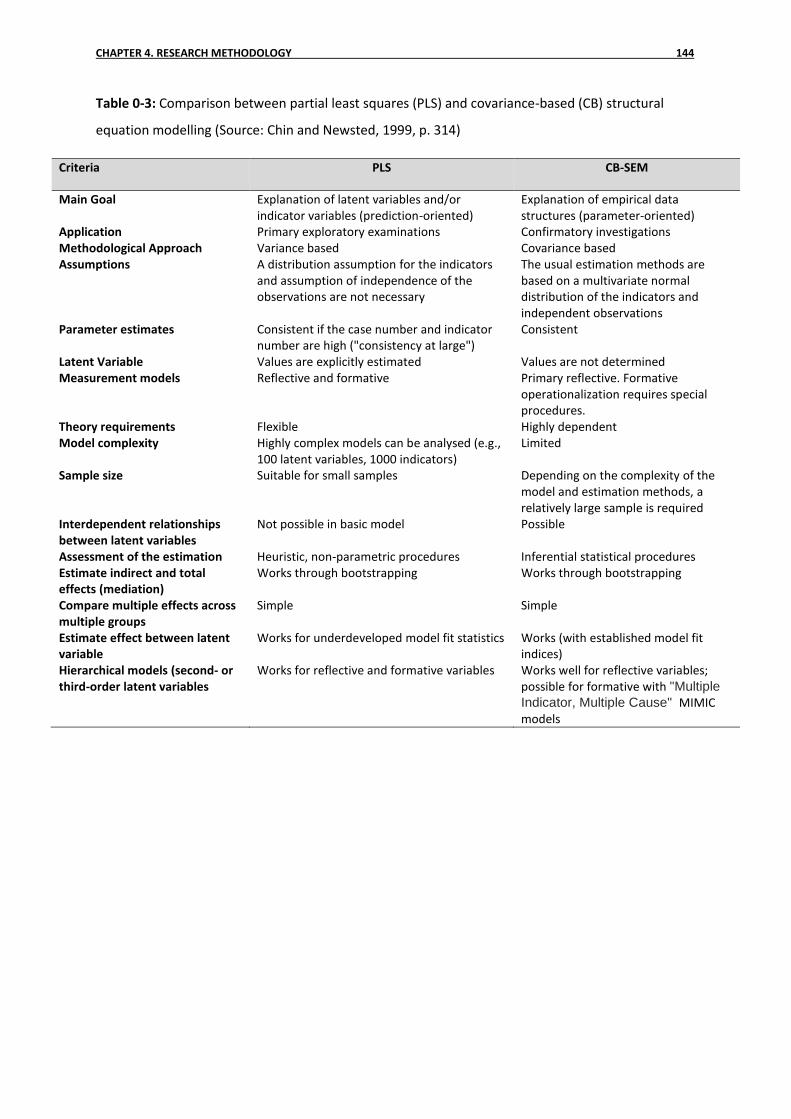
CHAPTER 4. RESEARCH METHODOLOGY 144
Table 0-3: Comparison between partial least squares (PLS) and covariance-based (CB) structural
equation modelling (Source: Chin and Newsted, 1999, p. 314)
Criteria PLS CB-SEM
Main Goal Explanation of latent variables and/or indicator variables (prediction-oriented)
Explanation of empirical data structures (parameter-oriented)
Application Primary exploratory examinations Confirmatory investigations Methodological Approach Variance based Covariance based Assumptions A distribution assumption for the indicators
and assumption of independence of the observations are not necessary
The usual estimation methods are based on a multivariate normal distribution of the indicators and independent observations
Parameter estimates Consistent if the case number and indicator number are high ("consistency at large")
Consistent
Latent Variable Values are explicitly estimated Values are not determined Measurement models Reflective and formative Primary reflective. Formative
operationalization requires special procedures.
Theory requirements Flexible Highly dependent Model complexity Highly complex models can be analysed (e.g.,
100 latent variables, 1000 indicators) Limited
Sample size Suitable for small samples Depending on the complexity of the model and estimation methods, a relatively large sample is required
Interdependent relationships between latent variables
Not possible in basic model Possible
Assessment of the estimation Heuristic, non-parametric procedures Inferential statistical procedures Estimate indirect and total effects (mediation)
Works through bootstrapping Works through bootstrapping
Compare multiple effects across multiple groups
Simple Simple
Estimate effect between latent variable
Works for underdeveloped model fit statistics Works (with established model fit indices)
Hierarchical models (second- or third-order latent variables
Works for reflective and formative variables Works well for reflective variables; possible for formative with "Multiple
Indicator, Multiple Cause" MIMIC models

CHAPTER 4. RESEARCH METHODOLOGY 145
4.5.3 Construct Types in PLS-SEM Modelling
Structural equation modelling (SEM) distinguishes between two measurement models: reflective and
formative (Edwards and Bagozzi, 2000). Figure 4-4 contrasts the two main construct types, which can
be incorporated in any structural equation model, and descriptions are provided below.
Reflective construct: In a reflective construct, indicators are caused by the latent variable.
Indicators usually have high inter-correlations, meaning they can be interchangeable.
Formative construct: In a formative construct, the indicators cause the construct (the arrows
point to the construct). Measures are not expected to correlate and they are also not
interchangeable.
According to Bagozzi (2011), whether the researcher chooses to employ formative or
reflective measurement, it is important to provide strong conceptual specifications of the constructs
that the indicators are proposed to measure. In the current research, the only constructs that were
measured formatively were the risk and firm performance constructs (see Section 4.7). The remaining
model constructs were measured reflectively. This was determined based on the prior literature and
Figure 0-4: Reflective versus formative indicators (Source: Bagozzi, 2011, p. 270).

CHAPTER 4. RESEARCH METHODOLOGY 146
following the recommendations of Diamantopoulos and Siguaw (2006) and Edwards and Bagozzi
(2000).
The above two constructs types also differ in that they are analysed using different statistical
techniques and face different reporting issues following the analysis phase. For instance, with a
formative construct, it is not required to test for reliability, internal consistency, or discriminant
validity, but it is required to report the multicollinearity using a tolerated VIF value, as its indicators
must be uncorrelated. In reflective constructs, on the other hand, it is paramount to report reliability,
internal consistency, and discriminant validity.
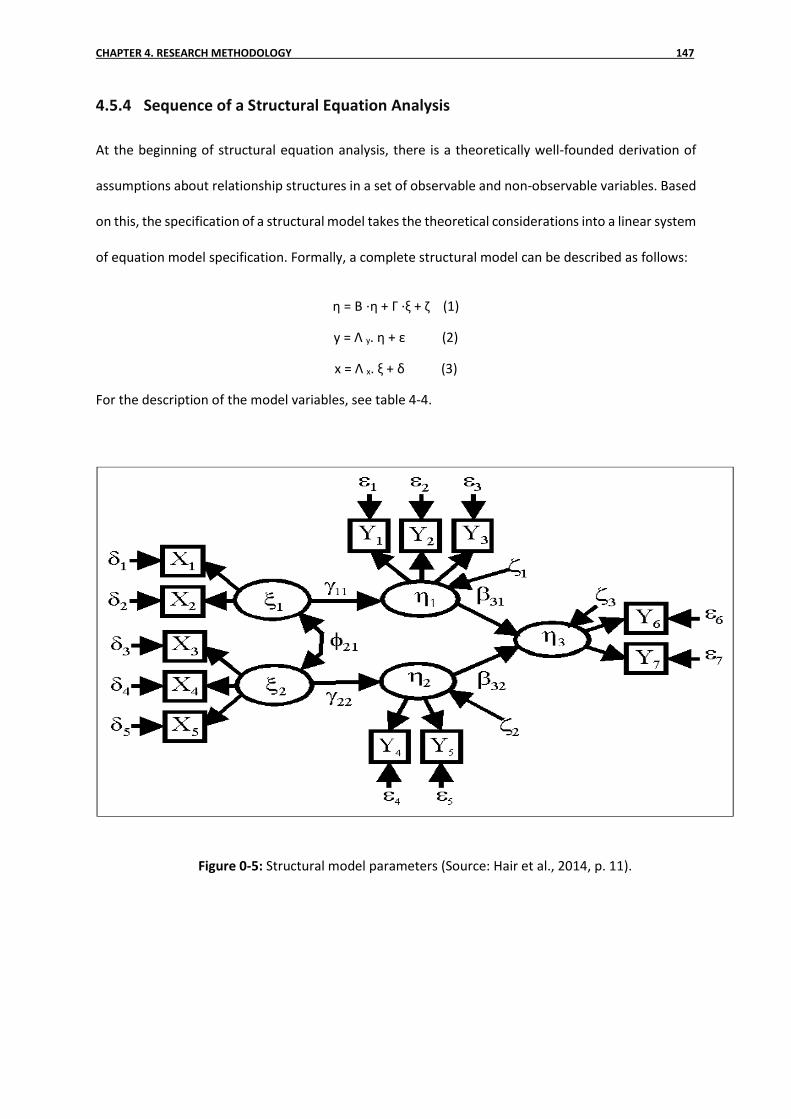
CHAPTER 4. RESEARCH METHODOLOGY 147
4.5.4 Sequence of a Structural Equation Analysis
At the beginning of structural equation analysis, there is a theoretically well-founded derivation of
assumptions about relationship structures in a set of observable and non-observable variables. Based
on this, the specification of a structural model takes the theoretical considerations into a linear system
of equation model specification. Formally, a complete structural model can be described as follows:
η = B ⋅η + Γ ⋅ξ + ζ (1)
y = Λ y. η + ε (2)
x = Λ x. ξ + δ (3)
For the description of the model variables, see table 4-4.
Figure 0-5: Structural model parameters (Source: Hair et al., 2014, p. 11).

CHAPTER 4. RESEARCH METHODOLOGY 148
Table 0-4: Nomenclature widely used in the SEM literature.
Abbreviation Greek pronunciation
Meaning
η Eta Latent endogenous variable, which is explained in the model ξ Ksi Latent exogenous variable, which is not explained in the model ε Epsilon Error term for an indicator y δ Delta Error term for an indicator X ζ psi Error term for a latent endogenous variable Γ Gamma matrix Γ contains the coefficients of the y’s on the x’s B Beta coefficient matrix B models the relationship between the endogenous
constructs γ Gamma Denotes the relationships between the exogenous and endogenous
variables. β Beta Denotes the relationships between endogenous variables. Λ Lambda Loadings matrix of indicators Y - Indicator for a latent endogenous variable X - Indicator for a latent exogenous variable
A set of Greek letters are usually used to describe the models. δ (Delta) is the measurement
error of an exogenous indictor variable (X), which is a measurement variable for the exogenous latent
construct ξ (psi). Similarly, Y is the measurement variable for endogenous latent construct η (Eta), with
the measurement error term ε (Epsilon). The relationship between the latent constructs is described
by path coefficient β (Beta). The paths from the exogenous to the endogenous variables are labelled
gamma (γ). Covariance between the latent exogenous constructs is usually described with Φ (Phi).
Examining the notions (1, 2, and 3 mentioned above) once more reveals that the model
integrates several multivariate approaches. Model (1) is the structural model with latent variables that
cannot be measured. It expresses the hypothesized relationship between the constructs. The
coefficient matrix B (with m * n Elements βjk) models the relationship between the endogenous
constructs. The coefficient matrix Γ (with m* n elements γjk) models the relationship between the
exogenous and endogenous variables.
After building the structural model, a subsequent examination is carried out to assess the
directional hypotheses manifested in the structural path of the model between the model constructs
and between the constructs and their indicators.

CHAPTER 4. RESEARCH METHODOLOGY 149
Statistical examination is carried out to assess the following:
Significance: How likely is it that the calculated relationships have happened accidentally?
Direction of action: Is there a positive or negative correlation between two directly related
constructs?
Strength: Which of the significant dependencies have the strongest influence on the
formation of the construct?
To ensure the quality criteria for SEM-PLS modelling, and in particular the study’s SBM, are
met, some tests must be performed. This incorporates testing of the measurement model, the
structural model and the overall model. Table 4-5 shows the tests used for systematic evaluation of
PLS-SEM results, as recommended by Hair et al. (2014). It is important to understand that these
analyses are complementary and work in a supportive manner to enhance the SBM model’s credibility
and reliability. The quality criteria tests are divided into three phases, as follows:
Evaluating the reflective measurement models.
Evaluating the formative measurement models.
Evaluating the structural model.

CHAPTER 4. RESEARCH METHODOLOGY 150
Table 0-5: Systematic evaluation of PLS-SEM results.
Evaluation of the Measurement Models
Reflective Measurement Models Formative Measurement Models
Internal consistency (composite reliability)
Indicator reliability
Convergent validity (average variance extracted)
Discriminant validity
Convergent validity
Collinearity among indicators
Significance and relevance of outer weights
Evaluation of the Structural Model
Coefficients of determination (R2)
Predictive relevance (Q2)
Size and significance of path coefficients
f2 effect size
q2 effect size
Table 4-6 shows the recommendations of many scholars with regards to judging the quality
criteria for PLS model. Table 4-7 also shows the cut off values for different psychometric characteristics
of the variables when tested using PLS method.
Table 0-6: Sources for recommended values for assessing PLS models.
Author(s) Criteria
Cohen (1992) f2
Diamantopoulos and Winklhofer (2001), Nunnally and Bernstein (1994) Cronbach’s Alpha
Fornell and Larcker (1981), Diamantopoulos and Siguaw (2006), Hair et al. (2014)
VIf, AVE
Chin (1998) R2, Communality
Ringle (2004), Chin (1998) q2, Q2
Petter et al. (2007) Weights, Multicollinearity
Berry and Feldman (1985) Construct Correlations
Hair et al. (2014) T- Values two-tailed, β, CR, AVE, Fornell-Larcker-
criterion, factor loading

CHAPTER 4. RESEARCH METHODOLOGY 151
Table 0-7: General guidelines for the quality criterion in PLS-SEM model.
Measurement Models Structural Model
Test criterion in PLS-SEM Reflective Construct Formative Construct Test criterion in PLS-SEM
Weights Irrelevant >0.2 or >0.1 Path Coefficient "β" >0.2
Loads > 0.7 or >0.4 Irrelevant d Coefficient of Determination "R2" >0.3
Multicollinearity Irrelevant
Construct Correlation <0.8 / VIF c <10 acceptable and 0.20 < VIF <5 best Effect Size "f2
, q2" >.02
Composite reliability (CR) >0.7 Irrelevant d Predictive Relevance "Q2"e >0
Construct validity Convergent validity/Discriminant validity Irrelevant d T- Values (2-tailed) P =.1
>1.65
Content validity Unidimensionality a Expert Validity T- Values(2-tailed) P =.05 >1.96
Convergent validity AVE b >0.5 Irrelevant d T- Values(2-tailed) P =.01 >2.57
Discriminant validity Fornell-Larcker- criterion Discriminant power >0.5 Construct Correlation <0.9 Goodness of fit (GoF) small >0.10
Internal consistency/Internal reliability Cronbach's Alpha >0.7 Irrelevant d GoF medium >0.25
Communality (R2 for the construct) >0.5 >0.5 GoF large >0.36

CHAPTER 4. RESEARCH METHODOLOGY 152
4.6 Measures
The constructs of interest were measured either using objective secondary data from the OSIRIS
database or multiple items from the questionnaire survey. The operationalization of the study’s
constructs was in line with the conceptual framework introduced in Chapter 3. Exploratory factor
analysis was carried out for all reflective constructs in the study in order to filter out any irrelevant
indictors.
Validation of the scales used in the study was carried using the standard procedures
recommended in the literature (Churchill, 1979; Straub, 1989). Scale items in a related domain were
pooled and subjected to factor analysis to assess their convergent and discriminant validity.
Convergent validity was deemed to be satisfactory if all items showed adequately high loading on their
corresponding single factor. Discriminant validity was deemed to be satisfactory when all scale items
showed no significant cross-loadings on other factors. In an iterative manner, any items with high
loadings on multiple factors were dropped in order to refine the study scales.
The reliability of the refined scales was also assessed using Cronbach’s alpha. A minimum
alpha value of 0.70 is recommended for new scales (Nunnally, 1988). The results of the reliability
assessment will be presented in this section in combination with the exploratory factor analysis. We
will present these results in conjunction with the operationalization of the study measures to enhance
the cohesiveness of the section.
4.6.1 Measurement Model Indicators Sources
This thesis questionnaire was built using an existing validated questionnaire. Table 4-8 shows the
source of the adapted questionnaire items. All constructs used to build the structural model were
adopted from the literature, except for the servitization construct, which was developed by the author
because no valid measurement scale was found in the servitization literature. Adaptation of previously
developed scales adds reliability because they have been previously tested in different contexts
(Churchill and Iacobucci, 2005).

CHAPTER 4. RESEARCH METHODOLOGY 153
Each construct included in the proposed model (SBM) was measured using indicators adopted
from the studies listed in table 4-8 below.
Table 0-8: Contributing literature for construct definition and operationalization.
Construct Total Number of Items
Items Source Journal ABS Ranking 2015
Absorptive capacity 6 All Kotabe et al., 2011 Journal of World Business
4
Value Co-creation
7 1 to 3 4 to 7
Yi and Gong, 2013 Grissemann and Stokburger-Sauer, 2012
Journal of Business Research Tourism Management
3
4
Servitization 14 All Developed By the author - -
Firm Performance
14 1,6,7
2,3,4,5
8 to 14
Tippins and Sohi, 2003 Gunday et al., 2011 Wang, Liang, Zhong, Xue, and Xiao, 2012
Strategic Management Journal International Journal of Production Economics Journal of Management Information Systems
4*
4
3
Open Innovation 14 All Mina et al., 2014 Research Policy 4
Risk
5 All Glover and Benbasat 2010 Strategic Management Journal
4*
Service Orientation of Organisational Culture
3 All Gebauer, 2008 Business-to-Business Marketing
2
Dynamism and Industry Clock Speed
5 1 to 3
4 and 5
Perrons, Matthew, and Platts, 2004
International Journal of Innovation Management
2
Control variable 3 All Zahra and Hayton, 2008 Journal of Business Venturing
4

CHAPTER 4. RESEARCH METHODOLOGY 154
4.6.2 Operationalization of Dependent Variables
4.6.2.2 Servitization
The construct of servitization needed to be developed using C‐OAR‐SE (Rossiter, 2002) because, to
our knowledge, no validated measurement scale for servitization exists in the literature. Using this
method, the servitization construct operationalization took into consideration both the study’s
research design and the empirical context, where we are investigating the impact of servitization in
manufacturing firms. First, we defined servitization in light of previous work (e.g., Antioco et al., 2008;
Baines, Lightfoot, and Smart, 2011; Brax and Visintin, 2017; Fischer et al., 2010; Gebauer et al., 2010;
Kowalkowski et al., 2017) to include all components relevant to the servitization construct. Then we
identified the raters who would support the scale judgment. These raters consisted of academics
familiar with the concept, as well as expert panel possessing good knowledge about the practice of
servitization.
We defined servitization as a strategy in which manufacturing firms adapt their business
models in order to sell capabilities through top management service orientation, proper investment
and proper mobilization of organizational resources in order to leverage a service-centric platform
business model approach. Figure 4-6 shows the servitization dimensions. In the first dimension, which
is related to top management service orientation, top leaders in manufacturing firms must have a
proper awareness of the opportunities that can arise from the addition of services to the current
portfolio, as well as of the need for this transformation (Oliva and Kallenberg, 2003). This must be
followed by identifying a starting point for assessing the current strategic asset that might help in
introducing service provision. Finally, top managers in the organization must have an aligned vision of
the company’s servitization future (Kowalkowski et al., 2012; Gebauer, 2008). This dimension is
measured using three questions, SERV_12 to SERV_14.
The second dimension is related to mobilizing the organization resources, where the
servitization vision is converted into strategic goals; transformation priorities are translated into a

CHAPTER 4. RESEARCH METHODOLOGY 155
roadmap of initial activities (Baines et al., 2017), which requires that employees understand the
benefits of the change; visible changes start to be adopted in work practice; and an evolving service
culture starts to emerge (Mathieu, 2001b; Barrnet et al., 2013). In addition, investments into renewing
resources and acquiring new capabilities start to materialize (Raddats et al., 2014). This dimension is
measured using items SERV_4 to SERV_7.
The third dimension is related to the market offering, which encapsulates the way firms
introduce servitization to their customers, what packages are available, and how the servitized
offering differs from the former one. This dimension is deeply related to the service design and the
contractual aspect of the market exchange. Building on the servitization topology presented in Section
2.7, a servitized market offering can consist of services that support products; services that support
processes; services that support operations; services delivered through platform architecture,
customer integration, or modularity in product and service design; and finally, services that help
customers change their business model (Baines et al., 2017), This dimension is measured using items
SERV_1, SERV_2, SERV_3, SERV_8, SERV_9, SERV_10, and SERV_11.
Figure 0-6: Servitization dimensions.
Resource mobilization
Market offering
Top management
service orientation
Servitization Dimensions

CHAPTER 4. RESEARCH METHODOLOGY 156
After the scale development, we used the qualified raters to test the servitization construct’s
dimensions and assess content validity prior to the data collection. This was carried out by performing
interviews with five expert raters in industrial services and three academic experts. We tested the
validity of the construct using the content validity index (average I-CVI). The I-CVI expresses the
proportion of agreement of the raters with regard to the relevancy of each item. Scores could be
between zero and one, and all dimensions exceeded the cut off value of .8 (Polit-O'Hara and Beck,
2006).
As advised by the C‐OAR‐SE method for testing construct reliability, the Proportional
Reduction in Loss index (PRL) was applied to asses inter-rater agreement (Rust and Cooil, 1994). The
PRL accounts for loss in confidence due to poor decisions by the raters, with values ranging between
zero and one. Inter-rater agreement in our panel was 0.85 between five judges, resulting in a PRL of
1. This is considered suitable for ensuring the reliability of the servitization construct (Rust and Cooil,
1994).
4.6.2.3 Open Innovation
The scale adopted to measure open innovation activities was adopted from Mina et al.’s (2014) study,
in which open innovation routines were grouped into four value chain activities:
technology development (joint technology development)
product development (joint product development)
manufacturing (joint manufacturing and sharing of equipment)
Commercialisation (joint bidding for new contracts and joint servicing of new markets)
Manufacturing companies were asked about their adoption of these open innovation
practices with both their customers and suppliers. A six-point Likert scale ranging between 1 (Not at
All) and 6 (To a Very Great Extent) was used for the assessment of the dependent variables.

CHAPTER 4. RESEARCH METHODOLOGY 157
In the survey, the respondents were asked to indicate the degree of importance of various
activities conducted with external parties in order to accelerate innovation.
The study’s measures of open innovation aim to pinpoint the importance of different partners
(customers, suppliers, universities, etc.) as sources of external knowledge. The scale also contains
indicators asking respondents about both the formal (contractual) and informal (non-contractual)
activities they performed to facilitate open innovation. After collecting our data, we assessed the
scope and the depth of the sample’s engagement in open innovation practices. We added up the
normalised scores for all scale items and then divided them by the total number of items. Firms that
did not engage in any activity got a score of 0. Firms with higher scores were considered to be more
open. The results show that a large proportion of our sample 73% reported engaging in open
innovation activities, while the rest had weak engagement in OI practice.
4.6.2.4 Absorptive Capacity
The absorptive capacity measurement scale was adopted from Kotabe et al. (2011). Absorptive
capacity has traditionally been measured using metrics such as R&D expenditures or the number of
employees in the R&D department, both of which are considered by some as inappropriate measures
(Zahra and George, 2002; Kotabe, Jiang, and Murray, 2011). In line with the prior literature (Wong,
Shaw, and Sher, 1999; Zahra and George, 2002). This thesis captured absorptive capacity through
variables that reflect knowledge acquisition, transformation and exploitation, using six items. The
scale ranged between 1 (Strongly Disagree) and 6 (Strongly Agree).
4.6.2.5 Value Co-Creation
The measurement scale for VCC was adopted from prior studies (Yi and Gong 2013; Grissemann and
Stokburger-Sauer, 2012) that drew on the SDL in the context of business-to-business service. The scale
emphasises seven generic attributes of value co-creation that are key for delivering value-in-use. The
scale reflects the shift from a goods-centric view to a service-centric view, which is based on the

CHAPTER 4. RESEARCH METHODOLOGY 158
identification and development of core competences for achieving competitive advantage through
developing relationships with key economic actors in the supply chain (e.g., customers and suppliers)
(Lambert et al., 2006). This construct also reflects the conceptualization of the VCC in a servitized
context, encapsulating customer engagement throughout the product life cycle, customization, co-
design and production, all pillars of value creation (or co-creation) in the manufacturing realm.
4.6.2.6 Firm Performance
The dependant construct firm performance was treated and operationalised as a second-order
formative construct consisting of two first-order reflective constructs: financial performance and
market performance (Ravichandran, Lertwongsatien and Lertwongsatien, 2005), where the
measurement scale of each first-order reflective construct was adapted from previous research
(Tippins and Sohi, 2003; Wang et al., 2012; Gunday et al., 2011).
To capture the financial performance variable, we used the self-evaluation of companies'
financial performance. Respondents indicated on a 6-point scale (1= poor and 7= excellent) how they
would rate the revenue generation, profit and market value situation of their company over the
previous three years compared to their direct competitors. This was carried out following the
recommendations in the literature (Dess, 1987; Eggert et al., 2011; Gebauer, Edvardsson, and Bjurko,
2010; Powell, 1995), where this construct was measured subjectively, which is a common and
accepted practice in research on companies and business units (Powell, 1995). Subjective measures
of firm performance have been found to be highly correlated with objective measures (Wang, Liang,
Zhong, Xue, and Xiao, 2012) and have thus been used by many prior studies of firm performance
(Coltman, Devinney, and Midgley, 2011; Gunday et al., 2011; Westerman et al., 2014; Zahra, 1991)
In particular, overall financial performance was measured subjectively using seven items, as
such profitability, ROI, ROS, ROA, sales growth, market value, and overall financial performance.
Respondents were asked to evaluate their firm’s financial performance over the past three years

CHAPTER 4. RESEARCH METHODOLOGY 159
compared to their direct rivals in the industry. The three-year bracket was chosen in order to minimize
the influence of short-term performance variations, and it does not require that the participants to
have long tenures in the targeted company (Ravichandran, Lertwongsatien and Lertwongsatien,
2005).
The rationale for explicitly asking respondents to evaluate their firm performance in
comparisons to rivals was to control for differences in performance resulting from industry and
strategic group effects (Hatten, Schendel, and Cooper, 1978). This approach also fit nicely within the
scope of our research, as our sample included manufacturing companies from more than 13
industries. Furthermore, it is considered an indirect approach for collecting sensitive data about
competitiveness and performance (e.g., Dess, 1987; Powell, 1992; Powell and Dent-Micallef, 1997;
Spanos and Lioukas, 2001).
Market-based performance was measured using a seven-item scale that assessed the success
of the firm in entering new markets and its speed in bringing new products and services to the market
during the past three years.
Although the use of subjective financial performance measures is generally considered
reliable (Dess and Robinson, 1984), we checked for the reliability of our self-reported performance
data to account for any potential reporting biases. To do so, we collected data on common accounting-
based measures from the OSIRIS database to objectively assess performance. The collected data was
for financial years 2013, 2014, and 2015, as our sample included companies that had been undergoing
the servitization transition for only 3 years. We subtracted the industry average (based on a firm’s 4-
digit SIC code) from each firm’s measurements to control for industry influence (Agle, Mitchell, and
Sonnenfeld, 1999). We then averaged 3 years of performance data to create composite firm-specific
measures. Operationalization of Independent Variables

CHAPTER 4. RESEARCH METHODOLOGY 160
4.6.2.7 Service Orientation of Organisational Culture
The measurement scale for service orientation of corporate culture was adopted from Gebauer (2008)
and drew on the existing literature (Homburg, Fassnacht, and Guenther, 2003). In this thesis, service
orientation of corporate culture was measured using three items focused on the values and behaviour
of service employees: in terms of ability to solve customer problems, insuring the service quality and
conveying good corporate culture.
4.6.2.8 Risk
The formative construct of risk was operationalized by adopting the scale measurements from Glover
and Benbasat (2010). The dimensionality of the risk construct was confirmed in prior literature
(Spiekermann and Paraschiv, 2002), where the authors suggested breaking down overall risk into the
attributes of operational risk, customer risk, financial risk, level of delivery risk, and overall risk. In
order to assess this construct’s dimensionality and reliability, the substantive validity assessment, CSV,
was performed by approaching five academics who have published in the field of industrial services,
operations management and/or scale development. Those academics represented ‘expert opinion’
holders and were selected based on their availability to collaborate with the author.
For the process of validating the risk scale, the five experts were given a list of 68 items,
including the risk items and the operational definitions of the proposed construct dimensions –
operational risk, customer risk, financial risk, level of delivery risk, and overall risk. The respondents
were asked to assign the items to the dimension they best reflected, and were asked whether this
definition reflected the meaning of the construct in question or it could be assigned to another
construct. The output of this procedure was analysed using two indices of substantive validity
proposed by Anderson and Gerbing (1991) which is presentedted in chapter 5.

CHAPTER 4. RESEARCH METHODOLOGY 161
4.6.3 Operationalization of Moderating Variables
4.6.3.1 Industry clock speed
The measurement scale for industry clock speed, as a measure of industry dynamism, was adopted
from past studies (Hauschild et al., 2011; Guimaraes, 2011; Fine, 1998; Perrons, Matthew, and Platts,
2004) and was further developed based on the literature (Fine, 1999; O'Connor, 1998, Shapiro, 2006).
In the scale, industry clock speed is measured by assessing the rate of new product introduction to
the marketplace, the rate of change of customer preferences, changes in the firm’s structure, and the
pace of technology change with a specific industry. These contingent changes are measures of industry
dynamism, which requires adaptation from firms. This construct was measured as an ordinal variable
classifying industry dynamism as high, medium, and low.
4.6.4 Operationalization of Control Variables
Since manufacturing firm performance can be influenced by industry and firm characteristics (Zirger
and Maidique, 1990), the study model also been controlled for several company-related variables
(age, size) and for industry specific variables such as industry type.
4.6.4.1 Company Age
Our reason for including company age as a control variable in our analysis is that more mature
manufacturing firms might be reluctant to pursue a servitization strategy. Zahra (1991) argues that
older companies may be more likely to face issues such as inertia and sunk costs in ongoing operations
that may hamper their ability to explore innovative strategies such as introducing service provision. In
this context, and following recommendations from the literature to control for firm age (e.g., Park and
Ro, 2011; Terjesen, Patel, and Covin, 2011), firm age was calculated as the natural logarithm of the
number of years between the observation year and the incorporation year. The natural logarithm was
used to obtain normal distribution.

CHAPTER 4. RESEARCH METHODOLOGY 162
4.6.4.2 Company Size
Our reason for including company size as a control variable in our analysis is that larger companies
usually have resource slack that allow them to entertain and accommodate servitization strategies.
Furthermore, larger firms tend to exhibit more market power to eliminate competition and build
barriers to entry, which is in turn reflected in higher-than-normal financial performance, competitive
advantage and increased ability to reap scale efficiencies (Hitt et al., 2002). Given these justifications,
and following the recommendations in the literature to control for firm size (e.g. Ettlie, 1998; Park and
Ro, 2011; Terjesen et al., 2011), the author also controlled for the effect of company size, using the
natural logarithm of the number of employees as our proxy for firm size.
4.6.4.3 Industry Effect
Manufacturing firms in different industries face different competitive challenges, causing them to take
different routes to pursue strategic decisions as such servitization (Dess, Ireland, and Hitt, 1990). The
payoff from venturing into servitization might also vary by industry type, causing heterogeneity in firm
performance. Therefore, it was paramount to include the industry type as a control variable, following
the recommendations of previous studies (e.g., Huang, Kristal, and Schroeder, 2008; Rungtusanatham
et al., 2005).
Industry effect was operationalized using a series of dummy variables at the 2-digit SIC level
to further partial out any industry effects, with the metal ore mining industry employed as the
reference group. Because industry is a categorical variable, the 16 SIC industries of interest were
converted into a set of dichotomous independent variables (Tabachnick and Fidell, 2001). These 15
dichotomous variables (K-1) were entered into the regressions as dummy variables, controlling for the
relevant industry.

163
CHAPTER5 Primary Analysis and Results
5.1 Research Constructs Psychometric Assessment
5.1.1 Servitization Construct Psychometric Assessment
To overcome the shortcomings in the existing research and since servitization cannot be
measured with only a single indicator, servitization is considered in this research as a complex
phenomenon and multidimensional concept (Baines, 2009). Therefore, servitization’s
operationalization was represented using multiple measures (Hair et al., 2010).
EFA was utilized to examine the convergence of the measurement items for the servitization
construct, confirming the validity of the three, theoretically-determined dimensions of the
measurement framework (Hair et al., 2010).
The EFA was carried out using principal component factoring and the orthogonal rotation
method, using and eigenvalue greater than 1 and a Varimax rotation solution for not correlated
variables (Kline, 2014), Varimax was used building on our finding of the items correlation matrix in the
EFA. The EFA input of 14 items of the servitization construct resulted in 12 items with loading well
above .40 on their respective main factor, without significant cross loadings (<.04). The SERV_7 and
SERV_9 indicators were dropped for insufficient loading (see table 5-2 and 5-3). These results were
deemed satisfactory (cut-off point at 0.4), with internal consistency/reliability alpha higher than 0.7

CHAPTER 5. PRIMARY ANALYSIS AND RESULTS 164
indicating practical significance (Hair, 2010; Tabachnick and Fidell, 2001). Two items had poor
loadings of < .40, indicating that they were irrelevant to their dimensions; these were excluded from
the final measurement model analysis.
Table 5-1 shows the suitability of the collected data for structure detection. To obtain
adequate results, all items in the servitization construct were included using a standardized form. This
was carried out to enhance content validity and eliminate unnecessary multicollinearity attributed to
scaling. Measure of Sampling Adequacy (MSA) showed satisfactory correlations in the data matrix.
This is important to justify the use of factor analysis (Hair et al., 2014). The Bartlett test of sphericity
and the Kaiser-Meyer-Olkin (KMO) measure were used to test the adequacy of the factor analysis.
KMO and the Barlett test yielded results in line with common standards (KMO=0.875; P (Barlett) =
0.000) confirmed the appropriateness of the factor analysis.
Table 0-1: KMO and Bartlett's test for servitization construct.
KMO and Bartlett's Test
Kaiser-Meyer-Olkin Measure of Sampling Adequacy .875
Bartlett's Test of Sphericity
Approx. Chi-Square 721.608
df 78
Sig. .000
Figure 5-1 shows the screen plot of the servitization construct indicating 3 main dimensions
when the screen plot cut from the elbow. This output is also inline with the construct
conceptualization. In this line graph of Eigen Values which is helpful for determining the number of
factors the EFA produced after grouping the servitization indcators. The Eigen Values are plotted in
descending order. The number of factors is chosen where the plot levels off (or drops) from cliff to
screen.

CHAPTER 5. PRIMARY ANALYSIS AND RESULTS 165
The first stage of the EFA was carried out after standardising all variables. The un-rotated
factor matrix was checked to obtain a good view of the number of factors extracted in the analysis.
The results indicated that there were three factors. At a later stage of the analysis, relying on the latent
root criterion to enhance the factor selection and using rotation optimisation, a total of three
dimensional measurement solutions were obtained that explained 73.32% of the overall variance.
Table 5-2 presents the rotated components matrix and the factor loadings for each
measurement item included in the analysis. A total of three factors were extracted, which is in line
with the construct conceptualization discussion in Chapter 2. It is also evidence of the content validity
of the servitization construct. The final three dimensions of the servitization construct were top
management service orientation, resource mobilization, and the market offering. The developed
Figure 0-1: Servitization construct (EFA) screen plot.

CHAPTER 5. PRIMARY ANALYSIS AND RESULTS 166
measurement instrument uses a seven-point scale, ranging from 1 (Extremely Disagree) to 7
(Extremely Agree) (Churchill, 1979).
Table 0-2: Servitization construct exploratory factor analysis
Rotated Component Matrixa
Component
1 2 3
SERV_1 .608
SERV_2 .803
SERV_3 .848
SERV_4 .873
SERV_5 .750
SERV_6 .717
SERV_7 .424
SERV_8 .668
SERV_9 .382
SERV_10 .552
SERV_11 .872
SERV_12 .835
SERV_13 .822
SERV_14 .822
Extraction Method: Principal Component Analysis Rotation Method: Varimax with Kaiser Normalization a Rotation converged in 6 iterations
Table 5-3 highlights the psychometric assessment of the servitization construct, as can be seen all the
indicators mean value range between 4.26 and 3.45 indicating good agreement between the study
subjects on the question asked with a standard deviation of a maximum of 1.30 , all factor loading
where above .4 for newly developed scale and a satisfactory Cronbach’s alpha of .90 enhancing the
scale reliability , the ten indictors managed to explain 54% of the variance in the servitization
construct, this results deemed to be satisfactory and indicate high relevance of this newly developed
scale.SERV_7 and SERV_9 were dropped from the final scale for poor factor loading , meaning they
don’t belong to the set of indictors that sufficiently measure servitization.

CHAPTER 5. PRIMARY ANALYSIS AND RESULTS 167
Table 0-3: Quality of the operationalisation of the reflective construct of servitization (n = 185)
Construct/Indicators Key Figures
Mean
Value a Standard
Deviation (SD) Factor
Loading Cronbach's α (alpha)
(Communality)b
Servitization 0.90 54.19% (47.85%)
Our firm has taken over some of our customers’ business processes. (SERV_1) 4.26 0.73 .608
Our firm has taken over the operational functions of our products in customers’ businesses. (SERV_2) 4.12 1.04 .703 Our service contracts related to our products are designed to share ‘risk and reward’ with our customers, so our customers pay for the product capabilities, outcomes and results. (SERV_3) 4.24 0.89
.748
Our employees don’t understand the benefits of building long-term relationships with our customers. (SERV_4) ® 4.24 0.94
.873
The organization is investing in the necessary skills and capabilities to provide servitized offerings. (SERV_5) 3.69 1.10
.750
Our business cases and key performance indicators are linked to our roadmap. (SERV_6) 4.12 1.00 .717 Our firm continuously innovates its internal capabilities and processes to deliver new services with our products. (SER_7) 3.71 1.04
.324
Our firm strategy is to build an industry platform to integrate suppliers and customers. (SERV_8) 3.88 1.04 .668
Our firm offers depend on the modularity of services and products. (SERV_9) 3.76 1.09 .302 Our firm delivers non-standardized service modules reflecting the requirements of the products we supply. (SERV_10) 4.11 1.14
.552
We help our customers to change their business model. (SERV_11) 4.11 0.95 .772 Our senior leaders are aligned around the strategic importance of servitization transformation. (SERV_12) 3.89 1.18
.835
Our senior leaders are actively promoting a vision of the future that involves servitized offerings. (SERV_13) 3.45 1.30
.822
We regularly review with the top team our progress on servitization transformation. (SERV_14) 4.04 1.05 .722

CHAPTER 5. PRIMARY ANALYSIS AND RESULTS 168
5.1.2 Open Innovation Construct Psychometric Assessment
Table 5-4 presents the psychometric assessment of the open innovation construct, after
performing an EFA it can be seen that all the indicators mean value range between 4.27 and 3.47
indicating good agreement between the study subjects on the question asked to measure the
construct, these value is in upper 25% percentile with a standard deviation of a maximum of 1.23 , all
factor loading where above .5 for a validated scale and a satisfactory Cronbach’s alpha of .94 adding
evidence to the internal consistency of the scale , indicating a closely related set of items enhancing
the scale reliability , the 12 indictors managed to explain 55% of the variance in the open innovation
construct, The sum of the squared factor loadings for all indicators in OI construct, also refer to as the
variance in that variable accounted for by all the factors, and this is called the communality. The
communality measures the percent of variance in a given variable explained by all the factors jointly
and may be interpreted as the reliability of the indicator. These results deemed to be satisfactory and
indicate high relevance of this scale. Two indictors (OI_2 and OI_3) were dropped due to poor factor
loading in the EFA, and this elimination enhanced the scale’s total variance extracted and Cronbach’s
alpha.

CHAPTER 5. PRIMARY ANALYSIS AND RESULTS 169
able 0-4: Quality of the operationalisation of the reflective construct of open innovation (n = 185)
Construct/Indicators Key Figures
Mean
Value a
Standard Deviation
(SD) Factor
Loading
Cronbach's α (alpha)
(Communality)b
Open Innovation 0.94 55.70% (49.40%)
To what extent is your company engaging directly with lead users and early adopters? (OI_1) 3.65 1.19 0.86
To what extent is your company participating in open source software development? (OI_2) 2.71 1.68 0.32 To what extent is your company exchanging ideas through submission websites and idea “jams” or idea competitions? (OI_3) 2.61 1.77 0.37 To what extent is your company participating in or setting up innovation networks/hubs with other firms, or sharing facilities with other organisations, inventors, researchers, etc.? (OI_4) 3.86 1.23 0.72
To what extent is your company involved with joint R&D? (OI_5) 3.47 1.15 0.83
To what extent is your company involved in joint purchasing of materials or inputs? (OI_6) 3.79 1.01 0.72
To what extent is your company involved in joint production of goods or services? (OI_7) 3.38 1.35 0.80
To what extent is your company involved in joint marketing/co-branding? (OI_8) 4.15 0.94 0.74
To what extent is your company participating in research consortia? (OI_9) 3.96 1.08 0.64
To what extent is your company involved in joint university research? (OI_10) 3.98 1.03 0.76
To what extent is your company licensing externally developed technologies? (OI_11) 4.27 0.86 0.78
To what extent is your company involved in outsourcing or contracting out R&D projects? (OI_12) 4.21 0.96 0.71
To what extent is your company providing contract research to others? (OI_13) 4.15 0.94 0.74
To what extent is your company involved in joint ventures, acquisitions and incubations? (OI_14) 3.96 1.08 0.62
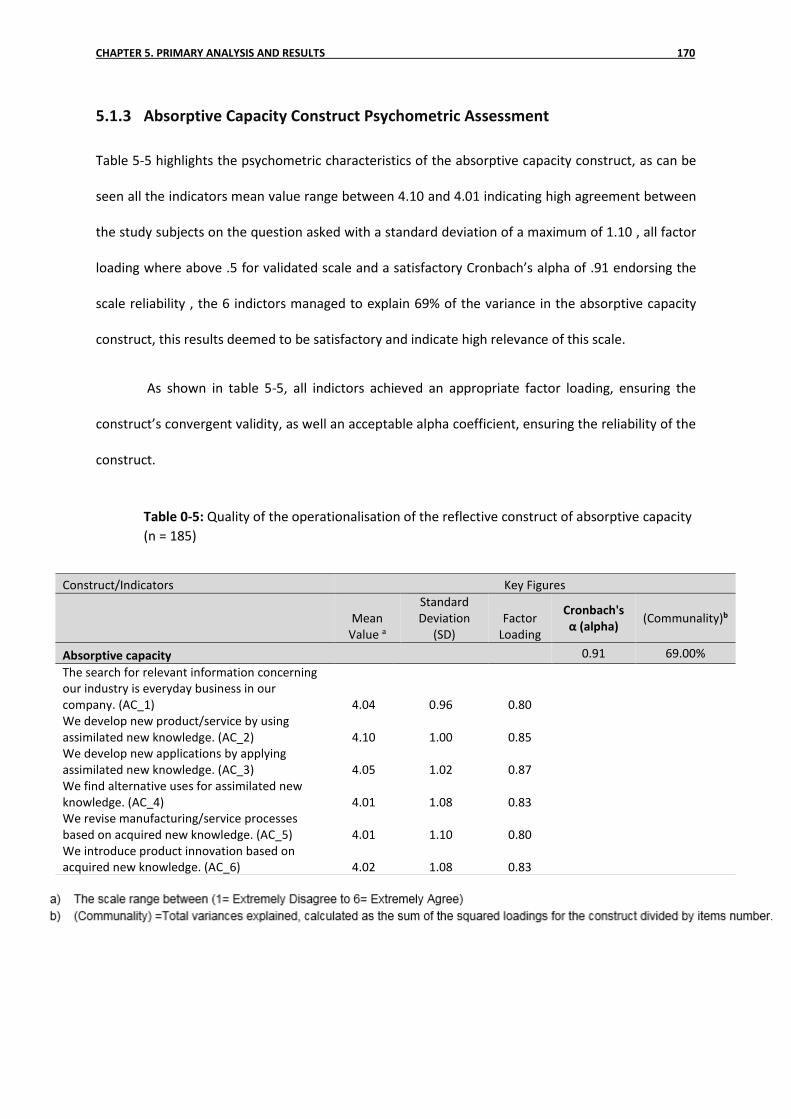
CHAPTER 5. PRIMARY ANALYSIS AND RESULTS 170
5.1.3 Absorptive Capacity Construct Psychometric Assessment
Table 5-5 highlights the psychometric characteristics of the absorptive capacity construct, as can be
seen all the indicators mean value range between 4.10 and 4.01 indicating high agreement between
the study subjects on the question asked with a standard deviation of a maximum of 1.10 , all factor
loading where above .5 for validated scale and a satisfactory Cronbach’s alpha of .91 endorsing the
scale reliability , the 6 indictors managed to explain 69% of the variance in the absorptive capacity
construct, this results deemed to be satisfactory and indicate high relevance of this scale.
As shown in table 5-5, all indictors achieved an appropriate factor loading, ensuring the
construct’s convergent validity, as well an acceptable alpha coefficient, ensuring the reliability of the
construct.
Table 0-5: Quality of the operationalisation of the reflective construct of absorptive capacity
(n = 185)
Construct/Indicators Key Figures
Mean
Value a
Standard Deviation
(SD) Factor
Loading
Cronbach's α (alpha)
(Communality)b
Absorptive capacity 0.91 69.00%
The search for relevant information concerning our industry is everyday business in our company. (AC_1) 4.04 0.96 0.80
We develop new product/service by using assimilated new knowledge. (AC_2) 4.10 1.00 0.85
We develop new applications by applying assimilated new knowledge. (AC_3) 4.05 1.02 0.87 We find alternative uses for assimilated new knowledge. (AC_4) 4.01 1.08 0.83 We revise manufacturing/service processes based on acquired new knowledge. (AC_5) 4.01 1.10 0.80 We introduce product innovation based on acquired new knowledge. (AC_6) 4.02 1.08 0.83

CHAPTER 5. PRIMARY ANALYSIS AND RESULTS 171
5.1.4 Value Co-Creation Construct Psychometric Assessment
Table 5-6 highlights the psychometric tests of the value co-creation construct, as can be seen all the
indicators mean value range between 4.51 and 4.08 indicating good agreement between the study
subjects on the question asked with a standard deviation of a maximum of 1.11 , all factor loading
where above .5 for validated scale and a satisfactory Cronbach’s alpha of .93 enhancing the scale
reliability , the 7 indictors managed to explain 59% of the variance in the value co-creation construct,
this results deemed to be satisfactory and indicate high relevance of this newly developed scale
As shown in table 5-6, all indictors achieved a high level of factor loading, with alpha
coefficients > 0.7 and adequate total variance explained. The Likert scale ranged between 1 (Strongly
Disagree) and 6 (Strongly Agree).
Table 0-6: Quality of the operationalisation of the reflective construct of value co-creation (n
= 185)
Construct/Indicators Key Figures
Mean
Value a
Standard Deviation
(SD) Factor
Loading
Cronbach's α (alpha)
(Communality)b
Value Co-creation 0.93 59.52%
Our firm tailors its product/service to our client’s needs. (VCC_1) 4.42 0.89 0.85
Our customer’s comments and concerns are highly valued by our firm. (VCC_2) 4.12 0.98 0.83 Our firm is responsive to its customer’s needs. (VCC_3) 4.28 0.92 0.69 Our firm offers a non-standardized level of service to its customers. (VCC_4) 4.08 1.11 0.66 Our client/end users are usually involved in the process of new product/service development. (VCC_5) 4.51 0.90 0.74 Our products/services are usually developed in light of customer/client wishes and suggestions. (VCC_6) 4.13 0.91 0.81 In order to acquire new know-how/technology we cooperate with our customers/clients (Never/Always). (VCC_7) 4.25 0.91 0.80

CHAPTER 5. PRIMARY ANALYSIS AND RESULTS 172
5.1.5 Service Orientation of Organisational Culture Construct Psychometric
Assessment
Table 5-7 highlights the psychometric assessment of the service orientation of orgnasiaional culture
construct, as can be seen all the indicators mean value range between 3.88 and 3.69 indicating good
agreement between the study subjects on the question asked with a standard deviation of a maximum
of 1.10 , all factor loading where above .5 for validated scale and a satisfactory Cronbach’s alpha of
.82 indcating a satsfactiory scale reliability , the 3 indictors managed to explain 74% of the variance in
the service orientation of orgnasiaional culture construct, this results deemed to be satisfactory and
indicate high relevance of this pre-tested scale
As shown in table 5-7, all three indictors achieved a high factor loading, with Cronbach's α
(alpha) exceeding the recommended value of 0.07.
Table 0-7: Quality of the operationalisation of the reflective construct of service orientation
of organisational culture (n = 185)
Construct/Indicators Key Figures
Mean Value a
Standard Deviation (SD)
Factor Loading
Cronbach's α (alpha)
(Communality)b
Service orientation of organisational culture 0.82 74.45%
Services are one of the core values of our corporate culture. (SC_1) 3.69 1.10
0.76
Our employee values are round solving customer problems. (SC_2) 3.76 1.09
0.90
Employees are aware of the importance of comprehensive and high-quality services and they act accordingly. (SC_3) 3.88 1.04
0.92

CHAPTER 5. PRIMARY ANALYSIS AND RESULTS 173
5.1.6 Industry clock speed Construct Psychometric Assessment
Table 5-8 highlights the psychometric assessment of the moderator construct industry clockspeed, as
can be seen all the indicators mean value range between 2.80 and 1.32, (the scale range between 1
low to 3 high) indicating good agreement between the study subjects on the question asked with a
standard deviation of a maximum of 1.28 , all factor loading where above .5 for validated scale and a
satisfactory Cronbach’s alpha of .90 were achieved, enhancing the scale reliability , the 3 indictors
managed to explain 60% of the variance in the industry clockspeed construct, this results deemed to
be satisfactory and indicate high relevance of this newly developed scale. Over all, all indicators
loadings were satisfactory with an acceptable reliability alpha coefficient.
Table 0-8: Quality of the operationalisation of the reflective construct of industry clock speed (n =
185).
Construct/Indicator Key Figures
Mean Value a
Standard Deviation (SD)
Factor Loading
Cronbach's α (alpha)
(Communality)b
Dynamism and Industry Clock Speed 0.90 60.63%
In our industry the change in customer preferences is …. (IC_1) 2.21 0.64 0.81
The change in our competitive situation is …. (IC_2) 2.25 0.71 0.82
In our industry the technological change is …. (IC_3) 1.32 1.28 0.76
The change in our firm structure is …. (IC_4) 2.80 0.20 0.77 In our industry the rate of new product/service introduction to market is …. (IC_5) 2.21 1.09 0.73

CHAPTER 5. PRIMARY ANALYSIS AND RESULTS 174
5.1.7 Firm Performance Construct Psychometric Assessment
As shown in table 5-9, the correlation between overall performance and the objective
profit/revenue ratio was 0.43 (p < 0.01). For market value and Tobin’s Q, the correlation was 0.58 (p
< 0.01). Significant correlations were also found between the study’s subjective market-based
performance and sales growth (0.38; p < 0.05) during the same three-year period. Our observation of
positive and significant correlations between subjective and objective financial performance measures
indicates that the archival data matched well with the respondents’ subjective evaluation (Geringer
and Hebert, 1991; Powell, 1995). This adds confidence regarding the validity of our survey measure of
performance.
Table 0-9: Correlations between subjective and objective performance measures.
(* p < 0.05), (** p < 0.01), (*** p < 0.001) (2-tailed). PER_5 = General Profitability/ PER_6= Market Value /PER_2= Overall firm performance Note: market performance is a normalised score for its measurement index
Table 5-10 shows the factor loadings of the reflective constructs. All indicators maintained a
high factor loading apart from one (PER_14), which was not included in the final set of indictors for
the market performance construct. The reliability of both reflective constructs showed acceptable
values (> 0.07). It noteworthy to mention that the second order formative construct of firm
performance cannot be evaluated for Cronbach's α (alpha).
PER_5 PER_6 PER_2
Net Profit Margin
Tobin’s Q
ROI Market
performance Sales
Growth
PER_5 1 PER_6 .18* 1 PER_2 .54** -.08 1 Net Profit Margin
.65** .03 .43** 1
Tobin’s Q .23 .58** .86** .39** 1 ROI .27* .36* .71** .67* .54** 1 Market Performance
.23* .38* .62** .24* .44** .39** 1
Sales Growth .21* .33* .66** .19* .28** .32** .38** 1

CHAPTER 5. PRIMARY ANALYSIS AND RESULTS 175
Table 0-10: Quality of the operationalisation of the reflective constructs of firm financial and market performance (n = 185)
Construct/Indicators Key Figures
Mean Value a
Standard Deviation (SD)
Factor Loading
Cronbach's α (alpha)
(Communality)b
Firm Performance 54.27% (47.68%)
Firm Financial Performance 0.845 58.11%
Sales growth (PER_1) 4.05 0.99 0.80
Return on asset (ROS) (PER_2) 3.96 0.99 0.83
Return on sales (ROS) (PER_3) 3.85 1.19 0.79
Return on investment (ROI) (PER_4) 4.36 0.94 0.60
Market value (PER_5) 4.04 1.05 0.77
General profitability (PER_6) 3.54 1.05 0.80
Overall firm performance (PER_7) 3.40 1.29 0.76
Firm Market Performance 0.853 60.00% (49.12%)
Entering new markets (PER_8) 4.14 2.80 0.72
Customer satisfaction (PER_9) 4.07 0.95 0.78
Speed to market (PER_10) 3.88 0.71 0.91
Product/service quality (PER_11) 3.68 1.36 0.82
Success rate for new product and service introduction (PER_12) 4.59 0.99 0.63
Market share (PER_13) 4.44 0.51 0.72 Percentage of new products/services in the existing product/service portfolio (PER_14) 1.50 1.20 0.26

CHAPTER 5. PRIMARY ANALYSIS AND RESULTS 176
5.1.8 Risk Construct Psychometric Assessment
The first of these indices was the proportion of substantive agreement, Psa, which is defined
as “the proportion of respondents who assign an item to its intended construct” (Anderson and
Gerbing, 1991, p. 734). The equation for this calculation is Psa = nc / N, where nc represents the
number of people assigning an item to its posited construct and N represents the total number of
respondents. The values for Psa can range between 0 and 1.0, with higher values indicating better
substantive validity.
The second index was the substantive-validity coefficient, Csv, which represents the extent to
which respondents assign an item to its posited construct more than to any other construct (Anderson
and Gerbing, 1991). The formula for this index is Csv = (nc – no) / N, where nc and N are defined as
with the previous index, and no indicates a higher number of assignments of the item to any other
construct. The values for this index range from -1.0 to 1.0, with larger values reflecting higher
substantive validity. A recommended threshold for the Csv index is 0.5 (Anderson and Gerbing, 1991).
Once the Psa and Csv scores had been calculated for each item, they were calculated for each
dimension of risk. Table 5-11 shows the results of the index calculations. The five dimensions of risk
achieved an aggregated Csv of above 0.5, adding evidence for the reliability and validity of the risk
measurement scale. It is also advised to test for multicollinearity between the items in a formative
construct, as well as the items’ weight (Hair et al., 2014). For this thesis, we assessed the related
measure of collinearity by calculating the variance inflation factor (VIF). In the context of a PLS-SEM
formative model, a tolerance value of 0.20 or lower and a VIF value of 5 or higher indicate a potential
collinearity problem (Hair, Ringle, and Sarstedt, 2011). The results showed no collinearity issue in the
risk construct, and thus no items were dropped from the scale (see table 5-11). This preserved the
construct's content from a theoretical perspective. All items weights were acceptable, being above
the threshold of 0.02 recommended by Hair et al. (2014).

CHAPTER 5. PRIMARY ANALYSIS AND RESULTS 177
Table 0-11: Quality of the operationalisation of the formative construct of risk (n = 185)
Construct/Indicators Key Figures
Weight a
Mean Value
Standard Deviation
(SD) psa-Index b csv- Index b VIF c
Risk 2.249
There is a risk that the financial cost associated with servitization may outweigh the benefits. (RK_1) ®
0.34 2.84 0.97 1.0 0.9 2.068
The performance of the solution we provide may not meet our customer’s expectations. (RK_2)
0.29 2.41 0.99 1.0 1.0 2.145
There is a risk that we will not be able to acquire the new capabilities needed to deliver the new solution. (RK_3) ®
0.39 2.31 0.92 1.0 0.8 1.654
There is a risk that our contract partner will be unable to fulfil contractual agreements. (RK_4) ®
0.42 2.43 0.99 0.8 0.8 1.688
The decision to implement servitization in our firm is very risky. (RK_5) ® 0.34 2.56 1.16 1.0 0.8 1.550

CHAPTER 5. PRIMARY ANALYSIS AND RESULTS 178
5.2 Measurement Model Reliability and Validity
The model depicted in figure 5-3 was tested using the Smart PLS 3.27 software program and all
descriptive analyses were conducted using SPSS (24). This thesis followed the recommendation of
Anderson and Gerbing (1988) to take a two-stage approach when testing structural models. The first
step tests the validity of the measurement model using confirmatory factor analysis (CFA) in order to
assess how well the observed indicators measure the underlying latent variables (Sümer, 2003). The
second step involves testing the hypothesised structural model that prescribes the relationships
among the latent variables.
In order to estimate the parameters in the outer measurement model, PLS-SEM with a path
weighting scheme for the inside approximation was used (Chin, 2010). This was followed by
nonparametric bootstrapping (Chin, 2010; Efron, 2000) with 5,000 resamplings to calculate the
standard errors of the estimates and the corresponding T-values and significance levels (Hair et al.,
2013).
For measurement validation, confirmatory factor analysis was performed on the study’s 8
reflective constructs and their corresponding survey items. The analysis yielded satisfactory results in
terms of construct reliability, unidimensionality, convergent validity, and discriminant validity.
With regards to the reliability of the study constructs and scales, table 5-12 shows the
Cronbach's alpha coefficients for the reflective constructs. The values ranged from 0.819 to 0.936, well
above the threshold of 0.7, establishing the reliability of all constructs (Nunnally and Bernstein, 1994).
The construct composite reliability (CR) range was between 0.893 and 0.948, well above the
cut-off value of 0.7 (Hair, 2010; Nunnally and Bernstein, 1994), supporting the unidimensionality of
each construct (Hair et al., 2013; Segers, 1997). Composite reliability is considered the most robust
measure of a construct's internal consistency because it prioritizes items by their reliability in
estimating measurement model (Hair et al., 2011). The average variance extracted (AVE) was range

CHAPTER 5. PRIMARY ANALYSIS AND RESULTS 179
between 0.616 and 0.689, well above the cut off value of 0.5, reflecting adequate unidimensionality.
Higher AVEs indicate that the observed items explain more variance than the error terms (Fornell and
Larcker, 1981).
To confirm convergent validity, all the item loadings needed to be greater than the threshold
of 0.40 for first and second order factors. This was the case, supporting the unidimensionality with
high internal consistency (i.e., loadings >.5, p < 0.01) of the items under each construct (Chin, 2010).
Table 0-12: Psychometric tests criteria summary
Cronbach's Alpha
Composite Reliability
Average Variance Extracted (AVE)
R Square
Total Variance Explained (Communality)
Communality
Absorptive Capacity 0.910 0.930 0.689 0.287 69.00% 4.13
Industry Clock Speed 0.901 0.924 0.670 - 60.63% 3.90
Open Innovation 0.936 0.948 0.725 0.259 55.70% 6.68
Firm Financial Performance
0.845 0.891 0.694 - 58.11% 5.28
Firm Market Performance
0.853 0.900 0.701 - 60.00% 6.41
Firm Performance - - - 0.770 54.27% 7.28
Service Culture 0.819 0.893 0.738 - 74.45% 2.23
Servitization 0.907 0.928 0.683 0.846 54.19% 6.50
Value Co-creation 0.932 0.943 0.650 0.654 59.52% 4.16
Discriminant validity was tested using the Fornell–Larcker criterion, as shown in table 5-13,
where the square root of the AVE of each construct should be higher than the construct's highest
correlation with any other construct in the model (Hair et al., 2014; Fornell and Larcker, 1981). This
was the case and so the discriminant validity is considered to be at a satisfactory level, meaning that
the study’s constructs were conceptually distinct from one another (Chin, 2010).

CHAPTER 5. PRIMARY ANALYSIS AND RESULTS 180
Table 0-13: Fornell-Larcker test for discriminant validity (n=185)
AC VCC OI IC SERV PER RK SC
Absorptive Capacity .830**
Value Co-creation .452** .806**
Open Innovation .528** .300** .852**
Industry Clock Speed .476** .492** .543** .819**
Servitization .657** .477** .534** .532** .827**
Firm Performance .533** .304** .492** .430** .540** .785**
Risk -.499** -.583** -.510** -.539** -.570** -.295** -----
Service Culture .309** .327** .305** .204** .544** .487** -.545** .859**
Note1: * Significant at the 0.05 level; ** significant at the 0.01 level (two-tailed test); Values shown on the diagonal and in bold are the square root of the average variance extracted (AVE) (for reflective constructs only). All values are greater than the corresponding correlations; non-bolded values are the latent variable correlations. Note2: The Risk construct is a formative construct and therefore the square root of the variance extracted is not relevant to calculate. Note3: Single-item control variables have been omitted from the analysis, as AVE is not relevant.
The author also carried out a collinearity assessment of the constructs by testing for
multicollinearity using the variance inflation factor (VIF) with a threshold of 5 (Cohen et al., 2013).
This resulted in a maximum VIF of 4.366, indicating that multicollinearity was not a serious problem
in the SEM analysis (see table 5-14).
Table 0-14: Outer collinearity statistics (VIF) (n=185).
Indicator VIF Indicator VIF Indicator VIF
AC1 2.049 IC3 2.278 SERV5 1.417
AC2 2.832 IC4 2.413 SERV6 3.183
AC3 3.269 IC5 2.894 SERV8 2.633
AC4 2.517 VCC1 3.970 SERV10 2.695
AC5 2.346 VCC2 2.886 SERV11 2.917
AC6 2.455 VCC3 2.959 SERV12 2.921
OI1 3.832 VCC4 3.540 SERV13 3.469
OI2 6.943 VCC5 3.578 SERV14 2.824
OI3 3.012 VCC6 2.556 PER1 4.650
OI4 1.828 VCC7 2.927 PER2 5.647
OI5 5.320 RK 1 2.068 PER3 2.340
OI6 2.813 RK 2 2.145 PER6 2.168
OI7 2.610 RK 3 1.654 PER7 2.595
OI8 2.722 RK4 1.688 PER8 1.741
OI9 1.932 RK 5 1.550 PER11 2.024
OI10 1.875 SERV1 2.209 PER12 1.667
OI11 2.566 SERV2 2.921 PER13 2.901
IC1 2.261 SERV3 3.048 PER14 2.691 IC2 2.646 SERV4 2.132 PER15 1.591

CHAPTER 5. PRIMARY ANALYSIS AND RESULTS 181
Following recommendation of Tenenhaus et al. (2005) to calculate the predictive power of
the structural model, the author calculated the SBM model’s global validity, or “goodness of fit” (GoF)
using the following formula:
GoF =√⊘ 𝐂𝐨𝐦𝐦𝐮𝐧𝐚𝐥𝐢𝐭𝐲 ×⊘ 𝑹𝟐𝐢𝐧𝐧𝐞𝐫.
The GoF is the geometric mean of two types of R2 value averages: the average communality, also
known as the average proportion of variance explained when regressing the reflective indicators on
their latent variables (Fornell and Larcker, 1981), and the R2 inner, which is the average R2 of the
endogenous latent variables. The SBM 𝐺𝑜𝐹 = √0.61 ∗ 0.56 = 0.59, as shown in table 5-15 the GoF
is considered adequate, very large and significant, exceeding the cut-off value of 0.36 suggested by
Cohen (1988) and Wetzels et al. (2009) for a large effect size.
Table 0-15: Goodness of Fit.
It noteworthy to mention that. When using PLS-SEM, it is important to recognize that the term fit
has different meanings in the contexts of CB-SEM and PLS-SEM. Fit statistics for CB-SEM are derived
from the discrepancy between the empirical and the model-implied (theoretical) covariance matrix,
whereas PLS-SEM focuses on the discrepancy between the observed (in the case of manifest variables)
or approximated (in the case of latent variables) values of the dependent variables and the values
predicted by the model in question (Hair et al., 2012).
Goodness of Fit
Communality R-Squared
0.69 0.287
0.61 -
0.56 0.259
0.54 0.768
0.74 -
0.54 0.846
0.60 0.654
Average 0.61 0.560
GoF 0.59
CHAPTER 5. PRIMARY ANALYSIS AND RESULTS 182
5.3 Common Method Variance Tests
A common criticism of the use of cross-sectional data is the possibility of common method bias, which
can be explained as “the variance that is attributable to the measurement method rather than to the
constructs the measurement represents” (Podsakoff et al., 2003, p.879). In order to reduce common
method variance (CMV) in our cross-sectional self-administrated survey, the author followed the
recommendations of Podsakoff et al. (2003). Firstly, the author used preventive means to control the
occurrence of CMV. Different response formats were used to measure the study variables. For
instance, the author used Likert scales to collect our independent and dependant variables. In
addition, some of the study’s control variables were based on objective secondary data, and therefore
CMV was not an issue (Craighead et al., 2011). Second, the author insured that the questionnaire was
short and concise to prevent participant fatigue (Podsakoff et al., 2003). Third, our study participants
were oblivious to the relationships underpinning our theoretical framework, reducing an over-
justification effect, illusory correlations and halo effects (Podsakoff et al., 2003). Fourth, the author
measured predictors and outcomes using different formats and scales. This measurement separation
is another means for reducing response biases such as halo effects, the consistency motif,
acquiescence, implicit theories and illusory correlations, all of which can result in common method
variance (Podsakoff et al., 2003). Finally, the author used reverse scoring for some items in the
measurement scale to counter the tendency of the respondents to agree with attitude statements
regardless of their actual content (Podsakoff et al., 2003).
In addition to the aforementioned questionnaire design strategies, Harman's single-factor test
was used post hoc for all of the reflective constructs (see table 5-16) to test for common method
variance (Podsakoff and Organ, 1986). The results indicated that no single dominant factor was
present, with the largest factor accounting for only 31.75% percent of the total variance. An
eigenvalue greater than 1.0 was used as the cut-off, and there was no apparent general factor. Some
researchers suggest that common method variance does not pose a serious threat to the

CHAPTER 5. PRIMARY ANALYSIS AND RESULTS 183
interpretation of results, even if the first factor accounts for as much as 50% of the total variance
(Rönkkö and Ylitalo, 2011). Thus, the test results suggest that the data are satisfactorily and to a great
extent free from common method variance.
Table 0-16: One-factor test for common method bias.
Total Variance Explained
Factor
Initial Eigenvalues Extraction Sums of Squared Loadings
Total % of Variance Cumulative % Total % of Variance Cumulative %
1 14.374 33.427 33.427 13.650 31.745 31.745
2 4.604 10.706 44.134
3 3.366 7.828 51.961
4 2.631 6.119 58.080
5 2.008 4.670 62.750
6 1.833 4.262 67.012
7 1.128 2.623 69.635
Extraction Method: Maximum Likelihood. Rotation = None Eigenvalues fixed at one
Common method variance (CMV) was also assessed using a PLS-specific technique, following
recommendation of Kock (2015). A full collinearity test was performed to ensure that the VIF between
the study’s constructs was less than a 3.3. Collinearity statistics shows that value co-creation construct
is slightly correlated with the firm performance construct and servitization, however the VIF is less
than 5 which is still satisfactory (Hair et al., 2014) (see table 5-17).
Overall, our analysis does not exclude the possibility of common method variance. However,
the author can presume that the study results were not severely affected by the existence of any CMV,
and therefore CMV is unlikely to have biased the study results.

CHAPTER 5. PRIMARY ANALYSIS AND RESULTS 184
Table 0-17: Inner VIF values.
Absorptive Capacity
Firm Performance Servitization Value Co-creation
Absorptive Capacity
2.963 2.822 1.404
Company Age
1.123
Industry Clock Speed
2.193
Industry
1.081
Moderating Effect Industry Clock Speed
1.110
Open Innovation 1.000 1.814 1.804 1.404 Risk
2.249
Service Culture
2.415
Servitization
3.289
Company Size
1.135
Value Co-creation
4.366 3.855
Table 5-18 summarizes the descriptive statistics and intercorrelations among the study
variables. As illustrated in tables 5-19 to 5-25, the CFA results validate the assumption that this thesis’s
measures of psychometric properties were acceptable and adequate for hypothesis testing (Bagozzi
and Yi, 1988). Further, it is safe to argue that there are no grounds to assume the unsuitability of the
chosen method.

CHAPTER 5. PRIMARY ANALYSIS AND RESULTS 185
Table 0-18: Means, standard deviations and intercorrelations among the study's variables (N=185)
Mean SD 1 2 3 4 5 6 7 8 9 10 11 12
1 Absorptive Capacity 4.04 0.87 1.
2 Value Co-creation 4.19 0.72 .452** 1.
3 Open Innovation 3.64 1 .528** .300** 1.
4 Industry Clock Speed 3.8 0.9 .476** .492** .543** 1.
5 Servitization 4 0.8 .657** .477** .534** .532** 1.
6 Financial Performance 3.88 0.71 .533** .304** .492** .430** .540** 1.
7 Risk 2.42 0.79 -.499** -.583** -.510** -.539** -.570** -.295** 1.
8 Service Culture 3.77 0.92 .309** .327** .305** .204** .544** .487** -.545** 1.
9 Size (LN employee)* 10 11 -.03 .00 .11 -.07 -.11 -.12 .03 -.07 1.
10 Company Age (LN)* 2.9 3.4 -.03 -.07 -.08 -.04 -.03 -.06 -.02 -.09 .01 1.
11 Industry 0.08 0.09 -.01 -.04 -.07 -.05 -.03 -.06 .03 -.05 -.09 -.06 1.
12 Market Performance 4.02 .81 .423** .321** .001 .391** .450** .523** -.321** .300** -.01** -.080** -020** 1
* Log transformed to reduce skewness. **p < 0.01 (2-tailed).

CHAPTER 5. PRIMARY ANALYSIS AND RESULTS 186
Table 0-19: Key figures for the reflective construct of servitization operationalised in the SBM model (n = 185)
Construct/Indicators Key Figures
Load Mean Standard
Error T- Value a*** CR b AVE c
Servitization 0.93 0.68
Our firm has taken over some of our customers’ business processes. (SERV_1) 0.789 0.788 0.030 26.063
Our firm has taken over the operational functions of our products in customers’ businesses. (SERV_2)
0.854 0.855 0.016 53.557
Our service contracts related to our products are designed to share ‘risk and reward’ with our customers, so our customers pay for the product’s capabilities, outcomes and results. (SERV_3)
0.869 0.870 0.024 36.464
Our employees do not understand the benefits of building long-term relationships with our customers through servitization. (SERV _4) ®
0.760 0.762 0.052 14.563
The organization is investing in the necessary skills and capabilities to provide servitized offerings. (SERV_5)
0.848 0.847 0.021 39.987
Our business cases and key performance indicators are linked to our roadmap. (SERV_6) 0.834 0.833 0.021 40.055
Our firm strategy is to build an industry platform to integrate suppliers and customers. (SERV_8)
0.789 0.788 0.030 26.063
Our firm delivers non-standardized service modules that reflect the requirements of the products we supply. (SERV_10)
0.854 0.855 0.016 53.557
We help our customers to change their business model. (SERV_11) 0.808 0.807 0.030 26.990
Our senior leaders are aligned around the strategic importance of servitization transformation. (SERV_12)
0.807 0.805 0.028 29.151
Our senior leaders are actively promoting a vision of the future that involves servitized offerings. (SERV_13)
0.878 0.877 0.030 22.880
We regularly review with the top management team our progress on servitization transformation. (SERV_14)
0.77 0.766 0.028 19.251

CHAPTER 5. PRIMARY ANALYSIS AND RESULTS 187
Table 0-20: Key figures for the reflective constructs of absorptive capacity and industry clock speed operationalised in the SBM model (n = 185)
Construct/Indicators Key Figures
Load Mean Standard
Error T- Value a*** CR b AVE c
Absorptive capacity 0.93 0.69
The search for relevant information concerning our industry is everyday business in our company. (AC_1)
0.800 0.799 0.034 23.626
We develop new product/service by using assimilated new knowledge. (AC_2) 0.853 0.853 0.020 43.600
We develop new applications by applying assimilated new knowledge. (AC_3) 0.870 0.869 0.021 40.914
We find alternative uses for assimilated new knowledge. (AC_4) 0.824 0.823 0.029 28.115
We revise manufacturing/service processes based on acquired new knowledge. (AC_5) 0.803 0.803 0.034 23.303
We introduce product innovation based on acquired new knowledge. (AC_6) 0.828 0.827 0.033 25.271
Construct/Indicators Key Figures
Load Mean Standard
Error T- Value a*** CR b AVE c
Dynamism and Industry Clock Speed 0.92 0.67
In our industry the change in customer preferences is …. (IC_1) 0.735 0.732 0.048 15.270
The change in our competitive situation is …. (IC_2) 0.822 0.819 0.033 24.647
In our industry the technological change is …. (IC_3) 0.812 0.811 0.030 26.795
The change in our firm structure is …. (IC_4) 0.844 0.843 0.025 34.350
In our industry the rate of new product/service introduction to market is …. (IC_5) 0.883 0.883 0.016 56.511

CHAPTER 5. PRIMARY ANALYSIS AND RESULTS 188
Table 0-21: Key figures for the reflective construct of value co-creation operationalised in the SBM model (n = 185)
Construct/Indicators Key Figures
Load Mean Standard
Error T- Value a*** CR b AVE c
Value Co-creation 0.93 0.65
Our firm tailors its product/service to our client’s needs. (VCC_1) 0.850 0.850 0.021 39.832
Our customers’ comments and concerns are highly valued by our firm. (VCC_2) 0.782 0.782 0.030 25.659
Our firm is responsive to the customer’s needs. (VCC_3) 0.814 0.813 0.027 29.633
Our firm offers a non-standardized level of service to the customer. (VCC_4) 0.844 0.843 0.021 39.456
Our clients/end users are usually involved in the process of new product/service development. (VCC_5)
0.827 0.826 0.023 36.017
Our products/services are usually developed in light of customer/client wishes and suggestions. (VCC_6)
0.704 0.703 0.047 14.867
In order to acquire new know-how/technology we cooperate with our customers/clients (Never/Always). (VCC_7)
0.803 0.802 0.029 27.875

CHAPTER 5. PRIMARY ANALYSIS AND RESULTS 189
Table 0-22: Key figures for the reflective construct of open innovation operationalised in the SBM model (n = 185)
Construct/Indicators Key Figures
Load Mean Standard
Error T- Value a*** CR b AVE c
Open Innovation 0.94 0.73
To what extent is your company engaging directly with lead users and early adopters. (OI_1) 0.859 0.858 0.021 41.467
To what extent is your company participating in or setting up innovation networks/hubs with other firms, such as sharing facilities with other organisations, inventors, researchers, etc. (OI_4)
0.911 0.910 0.014 63.102
To what extent is your company involved with joint R&D. (OI_5) 0.865 0.865 0.022 39.430
To what extent is your company involved in joint purchasing of materials or inputs. (OI_6) 0.732 0.729 0.044 16.811
To what extent is your company involved in joint production of goods or services. (OI_7) 0.894 0.892 0.020 45.454
To what extent is your company involved in joint marketing/co-branding. (OI_8) 0.837 0.834 0.032 26.310
To what extent is your company involved in joint university research. (OI_10) 0.852 0.852 0.019 45.085
To what extent is your company licensing externally developed technologies. (OI_11) 0.859 0.858 0.021 41.467
To what extent is your company involved in outsourcing or contracting out R&D projects. (OI_12) 0.785 0.774 0.062 12.742
To what extent is your company providing contract research to others. (OI_13) 0.803 0.790 0.049 16.342
To what extent is your company involved in joint ventures, acquisitions and incubations. (OI_14) 0.793 0.784 0.058 13.694

CHAPTER 5. PRIMARY ANALYSIS AND RESULTS 190
Table 0-23: Key figures for the reflective construct of service orientation of organisational culture operationalized in the SBM
model (n = 185)
Construct/Indicators Key Figures
Load Mean Standard
Error T- Value a*** CR b AVE c
Service orientation of organisation culture 0.89 0.74
Services are one of the core values of our corporate culture. (SC_1) 0.755 0.755 0.032 23.605
Our employee values are centred on solving customer problems. (SC_2) 0.900 0.900 0.020 45.465
Employees are aware of the importance of comprehensive and high-quality services and they act accordingly. (SC_3)
0.913 0.913 0.013 71.344
Table 0-24: Key figures for the formative construct of risk operationalised in the SBM model (n = 185)
Construct/Indicators Key Figures
Weigh
t Mean Standard
Error T- Value a***
Risk
There is a risk that the financial costs associated with servitization may outweigh the benefits. (RK_1) ® 0.336 0.336 0.119 2.811
The performance of the solution we provide may not meet our customers’ expectations. (RK_2) 0.341 0.340 0.115 5.710
There is a risk that we will not be able to acquire the new capabilities needed to deliver the new solution. (RK_3) ® 0.395 0.394 0.103 11.786
There is a risk that our contract partner will be unable to fulfil the contractual agreement. (RK_4) ® 0.291 0.294 0.118 2.467
The decision to implement servitization in our firm is very risky. (RK_5) ® 0.388 0.381 0.079 4.936

CHAPTER 5. PRIMARY ANALYSIS AND RESULTS 191
Table 0-25: Key figures for the reflective constructs of firm financial/market performance operationalised in the SBM model (n = 185)
Construct/Indicators Key Figures
Load Mean Standard Error T- Value a*** CR b AVE c
Firm performance
Firm Financial performance 0.89 0.69
Sales growth (PER_1) 0.834 0.833 0.025 33.351
Return on asset (ROS) (PER_2) 0.798 0.797 0.024 33.093
Return on sales (ROS) (PER_3) 0.858 0.857 0.017 50.860
Return on investment (ROI) (PER_4) 0.787 0.787 0.034 22.826
Market value (PER_6) 0.743 0.742 0.040 18.677
General profitability (PER_7) 0.790 0.790 0.026 30.859
Firm Market performance 0.90 0.70
Entering new markets (PER_8) 0.679 0.679 0.043 15.812
Customer satisfaction (PER_9) 0.781 0.780 0.009 19.157
Speed to market (PER_10) 0.824 0.813 0.008 22.324
Product/service quality (PER_11) 0.864 0.843 0.007 25.772
Success rate for new product and service introduction (PER_12) 0.807 0.826 0.009 16.443
Market share (PER_13) 0.724 0.703 0.010 13.415

CHAPTER 5. PRIMARY ANALYSIS AND RESULTS 192
5.4 Descriptive Data Analysis
5.4.1 Sample
Tables 5-26 and 5-27 provide a detailed breakdown of the sample and respondents. To
enhance the sample, the author also followed Neely’s (2013) recommendation and targeted
companies in the countries where there is high number of manufacturing firms undergoing the
servitization transition (USA, UK, Germany, France, Italy, Spain, Sweden, and Switzerland).
Approximately 27% of respondents were from Germany, 17% were from the United Kingdom; 16%
were from the USA, 10% were from Spain, 10% were from France, 8% were from Italy, 6% were from
Sweden and 6% were from Switzerland. All of those countries are considered leaders in the
servitization and digitalization transition (Neely, 2013).
Of the key informants, 48% were service managers, 27% were marketing managers and 25%
were operation managers. The respondents had an average of 8 (std. dev. = 3.43) years of employment
with their firm, indicating an adequate amount of experience and knowledge, with 86% and 14%
stating that they had a high or moderate level of knowledge, respectively, about the research area.
These respondents were the most likely to possess an overarching, boundary-spanning view of their
firm. All respondent firms indicated that they had been introducing services in their market offering
for more than three years, and that they had a standalone service unit. Of the firms, 81% had a service
share of totals revenue of between 20-30%, 15% had more than 30%, and 4% of firms had service
revenues of less than 20% of total revenue. These results indicate a strong service orientation in the
majority of our sample. This is in line with Fang et al.'s (2008) suggestion of 20% as the critical mass
required to see substantial returns from service provision. The sample consisted of well-established
manufacturing firms, averaging 18.3 (SD = 31) years in age. The firms had an average annual sales of
USD 15 billion (SD= USD 25 billion), an average of 36,187 (SD = 57,008) employees, and an average
return on equity (ROE) of 11 (SD = 3) percent. Finally, the study sample had an average of 5 (SD= 16)
percent growth in revenues over three years.

CHAPTER 5. PRIMARY ANALYSIS AND RESULTS 193
Table 0-26: Sample demographics.
Country N %
Germany 50 27
United Kingdom 32 17
USA 30 16
Spain 18 10
France 18 10
Italy 15 8
Sweden 11 6
Switzerland (Not EU) 11 6
Total 185 100
Respondent job title
Service manager 89 48
Marketing manager 50 27
Operation manager 46 25
Total 185 100
Service share of total revenue
Less than 20% 5 3
Between 20-30% 139 75
More than 30% 41 22
Total 185 100
Table 0-27: Descriptive statistics of survey respondents (n=185).
Frequency
Attributes Distribution Absolute Percentage
Gender
Male 129 69.73%
Female 56 30.27%
Years introducing services
>1 0 0.00%
Between 1-3 15 8.10%
>3 170 91.9%
Respondent in the top management
Yes 13 7.10%
No 172 92.90%
Respondent working experience
0-2 years 20 10.81%
2-5 years 5 2.70%
5-10 years 5 2.70%
10-15 years 98 52.97%
More than 15 years 57 30.81%

CHAPTER 5. PRIMARY ANALYSIS AND RESULTS 194
(Continuation of Table 5-27)
Frequency
Attributes Distribution Absolute Percentage
Years in your current position 0-2 years 9 4.86%
2-5 years 6 3.24%
5-10 years 45 24.32%
10-15 years 122 65.94%
More than 15 years 3 1.62%
Highest level of education High School Education 0 0.00%
Bachelor’s Degree 144 77.84%
Master’s Degree 30 16.22%
Professional Degree 6 3.24%
Doctorate Degree 3 1.62%
Others: 2 1.08%
Annual sales (Turnover in Millions £)
Less than 2 0 0.00%
Between 2 and 10 0 0.00%
Between 10 and 50 0 0.00%
More than 50 185 100%
Standalone service unit
Yes 183 98.91%
No 2 1.08%
Services can be purchased separately
Yes 14 7.57%
No 171 92.43%
Company age Between 0-5 0 0.00%
Between 6 and 9 0 0.00%
More than 10 185 100.00%
Respondent knowledge about research area
Low knowledgea 0 0.00%
Moderate knowledge 25 13.51%
High knowledge 160 86.49%
Does respondent participate in implementing servitization strategies?
Yes 163 88.11%
No 22 11.89%
a) Note five subjects have been excluded from the dataset for low knowledge about the research area.

CHAPTER 5. PRIMARY ANALYSIS AND RESULTS 195
5.4.2 Non-Response Bias
We also verified that our results we not subject to response bias. First, we used the chi-squared (χ2)
statistical test to examine where there was a significant association between the firm’s industry and
response status (responded vs. did not respond); this yielded a non-significant result (p >.05). Second,
we carried out multivariate analysis of variance (MANOVA) (see table 5-28) to compare responding
and non-responding firms in terms of ROE, size (number of staff), revenue and assets. The results
showed no significant differences between the two groups for any of the measures (p >.05).
Table 0-28: Non-response bias testing using MANOVA
Multivariate Tests
Effect Value F Hypothesis
df Error df Sig.
Partial Eta
Squared
respondent and non-respondent
Pillai's Trace .006 .879b 4.000 386.000 .544 .006
Wilks' Lambda .724 .879b 4.000 386.000 .544 .006
Hotelling's Trace .006 .879b 4.000 386.000 .544 .006
Roy's Largest Root .006 .879b 4.000 386.000 .544 .006
Design: respondent and non-respondent Exact statistic Computed using alpha = .05 Note: This test compares the two groups in terms of their assets (US millions), sales, size (overall number of employees),
ROE, and revenue growth.
Finally, following the recommendation of Armstrong and Overton (1977), t-tests were
employed to test early and late-returned questionnaires (see table 5-29). We grouped respondents
into three waves: 1) those who responded within the first 8 weeks, 2) those who responded in the
ninth week or later, and 3) those who responded during the industrial event. No statistically significant
differences were found between early and late respondents (p < .05). Finally, we compared the three
groups of respondents based on their replies to the questionnaire items, and the analysis showed a
significant difference (p <.05) for only 4% of the items. All in all, the results indicate no evidence of
response bias in our sample.

CHAPTER 5. PRIMARY ANALYSIS AND RESULTS 196
Table 0-29: T-tests comparing early and late responders to check for non-response bias.
In order to examine inter-rater reliability, we compared the data collected from the three
respondent groups (service managers, marketing managers, and operations managers). We analysed
the simple correlations between the three groups on the variables (Items) tested, yielding an average
simple correlation of 0.75. This is a moderate and significant correlation coefficient, indicating inter-
rater consensus on the study measures (see table 5-30).
Independent Samples Test
Variable
t-test for Equality of Means
t df Sig. (2-tailed) Mean Difference Std. Error Difference
Industry -.953 183. .342 -.56 .587
-.967 178.035 .335 -.56 .579
Company Age -.866 183. .388 -.029 .034
-.898 182.999 .370 -.029 .032
Size (number of employees)
.514 183. .608 .026 .051
.508 162.541 .612 .026 .052
Net Profit Margin -.254 183. .800 -.267 1.051
-.241 131.001 .81 -.267 1.106
Absorptive Capacity -.811 183. .418 -.104 .128
-.814 172.16 .417 -.104 .128
Open Innovation -.614 183. .54 -.091 .148
-.623 177.561 .534 -.091 .146
Servitization -.672 183. .502 -.08 .119
-.677 174.555 .499 -.08 .118
Firm Performance -.848 183. .398 -.09 .106
-.854 174.266 .394 -.09 .105
Risk .54 183. .59 .063 .117
.542 172.682 .588 .063 .117
Service Culture -.858 183. .392 -.118 .137
-.864 174.085 .389 -.118 .136
Value Co-creation -.88 183. .38 -.094 .107
-.888 175.41 .376 -.094 .106

CHAPTER 5. PRIMARY ANALYSIS AND RESULTS 197
Table 0-30: Correlations between respondent groups on constructs to check for inter-rater
reliability
Construct AC_ Operation Manager AC_ Marketing Manager
AC_ Service Manager 0.70** 0.63**
AC_ Marketing Manager 0.70** 1
VCC_ Operation Manager VCC_ Marketing Manager
VCC_ Service Manager 0.69** 0.66**
VCC_ Marketing Manager 0.77** 1
OI_ Operation Manager OI_ Marketing Manager
OI_ Service Manager 0.57** 0.79**
OI_ Marketing Manager 0.72** 1
Serv_ Operation Manager Serv_ Marketing Manager
Serv_ Service Manager 0.68** 0.74**
Serv_ Marketing Manager 0.59** 1
Perf_ Operation Manager Perf_ Marketing Manager
Perf_ Service Manager 0.72** 0.75**
Perf_ Marketing Manager 0.78** 1
Rk _ Operation Manager Rk _ Marketing Manager
Risk_ Service Manager 0.74** 0.75**
Risk _ Marketing Manager 0.73** 1
SC_ Operation Manager SC_ Marketing Manager
SC_ Service Manager 0.56** 0.77**
SC_ Marketing Manager 0.66** 1 **. Correlation is significant at the 0.01 level (2-tailed).

CHAPTER 5. PRIMARY ANALYSIS AND RESULTS 198
5.5 Testing the Research Models
5.5.1 Servitization Basic Model
This thesis used structural equation modelling (SEM) to test the research hypotheses. Smart PLS 3.27
software was used to estimate the study’s structural model. The resulting structural model led to the
following findings.
Table 5-33 shows the degree to which the research hypotheses were confirmed by the
findings. H1 postulated that value co-creation positively influences servitization, and the path
between value co-creation and servitization was significant and positive, with a medium effect size (β
= 0.31, t = 3.08, f2 = 0.25, p < 0.001), thus providing full confirmation of this relationship.
H2 postulated that value co-creation and firm performance are positively related. The results
yielded a significant and positive effect of value co-creation on firm performance, but a very small
effect size. f2 values of 0.02, 0.15, and 0.35 indicate a small, medium, or large effect, respectively, of
an exogenous construct on an endogenous construct (Hair et al., 2014). Based on the results (β = 0.16,
t = 1.55, f2 = 0.09, p < 0.05), H2 to achieved 25% confirmation. H3 postulated that open innovation has
a positive impact on servitization. The results suggest that the relationship between open innovation
and servitization is not significant, with very small effect size (β = -0.09, t = 0.42, f2 = 0.03, p = NS).
Therefore, H3 was not confirmed.
H4 postulated that open innovation positively influences value co-creation. The path between
open innovation and value co-creation was significant and positive, with a medium effect size (β =
0.28, t = 5.88, f2 = 0.26, p < 0.001), thus achieving full confirmation of this relationship.
For H5, which predicted that open innovation would positively influence the firm’s absorptive
capacity, the relationship was significant and positive, with open innovation is explaining 29% of the
variance (R2) in the absorptive capacity. Based on the results (β = 0.54, t = 7.24, R2 = 0.29, p < 0.001),
there was a 75% confirmation of this relationship. In general, and according to Hairs et al. (2014), in

CHAPTER 5. PRIMARY ANALYSIS AND RESULTS 199
general, R2 values of 0.75, 0.50, or 0.25 for the endogenous constructs can be described as
respectively substantial, moderate, and weak.
H6 predicted that open innovation would positively influence firm performance. However, the
path between open innovation and firm performance was not significant and had a small effect size
(β = 0.08, t = 1.05, f2 = 0.04, p = NS), thus providing no confirmation of this relationship.
For H7, which postulated that absorptive capacity positively influences servitization, the path
between them was significant and positive, with a medium effect size (β = 0.29, t = 2.56, f2 = 0.29, p <
0.001), thus achieving full confirmation of this relationship.
For H8, which predicted that absorptive capacity would positively influence firm performance,
the path between the two was significant and positive, with a medium effect size (β = 0.24, t = 4.27,
f2 = 0.19, p < 0.001), showing a 75% level of confirmation of this relationship.
H9 postulated that absorptive capacity positively influences value co-creation. The path
between absorptive capacity and value co-creation was significant and positive, with a large effect size
(β = 0.62, t =13.77, f2 = 0.37, p < 0.001), thus showing full confirmation of this relationship.
H10 predicted that a service orientation of organisational culture would positively influence
servitization. The path between a service orientation of organisational culture and servitization was
significant and positive, with a large effect size (β = 0.57, t = 10.69, f2 = 0.45, p < 0.001), achieving full
confirmation of this relationship.
H11 postulated that a service orientation of organisational culture has a positive impact on
open innovation. However, the relationship between the two was not significant, with a very small
path coefficient (β = 0.009, t = 0.56, p = NS). Therefore, H11 was not confirmed.
H12 postulated that a service orientation of organisational culture positively influences firm
performance. The results show a significant relationship between a service orientation of

CHAPTER 5. PRIMARY ANALYSIS AND RESULTS 200
organisational culture and firm performance, with a medium effect size (β = 0.11, t = 1.96, f2 = 0.12, p
< 0.05). H12 achieved a 50% level of confirmation.
For H13, which predicted that risk would negatively influence servitization, the path between
risk and servitization was significant and negative, with a medium effect size (β = -0.303, t = 8.31, f2 =
0.28, p < 0.001), achieving full confirmation of this relationship.
As table 5-31 shows and with regard to H14, which postulated that industry clock speed
moderates the relationship between servitization and firm performance, this relationship was
statistically significant (β = 0.15, t = 4.76, f2 = 0.32, p < 0.001). As shown in figure 5-2, industry clock
speed strengthens the positive relationship between servitization and firm performance. To test for
moderation and conduct the significance testing for the relationship between the interaction term
and industry clock speed, bootstrapping was performed which yielded a significant relationship. The
procedure included 185 bootstrap cases and 5,000 bootstrap samples, using the ‘no sign changes’
option and the product indicator approach. This approach was taken following the recommendations
of Hair et al. (2014), as our exogenous latent variable and moderator variable are both measured
reflectively.
Table 0-31: Industry clock speed’s moderating effect
Variables Path T Statistic P Value
Industry Clock Speed 0.152 4.764 0.001
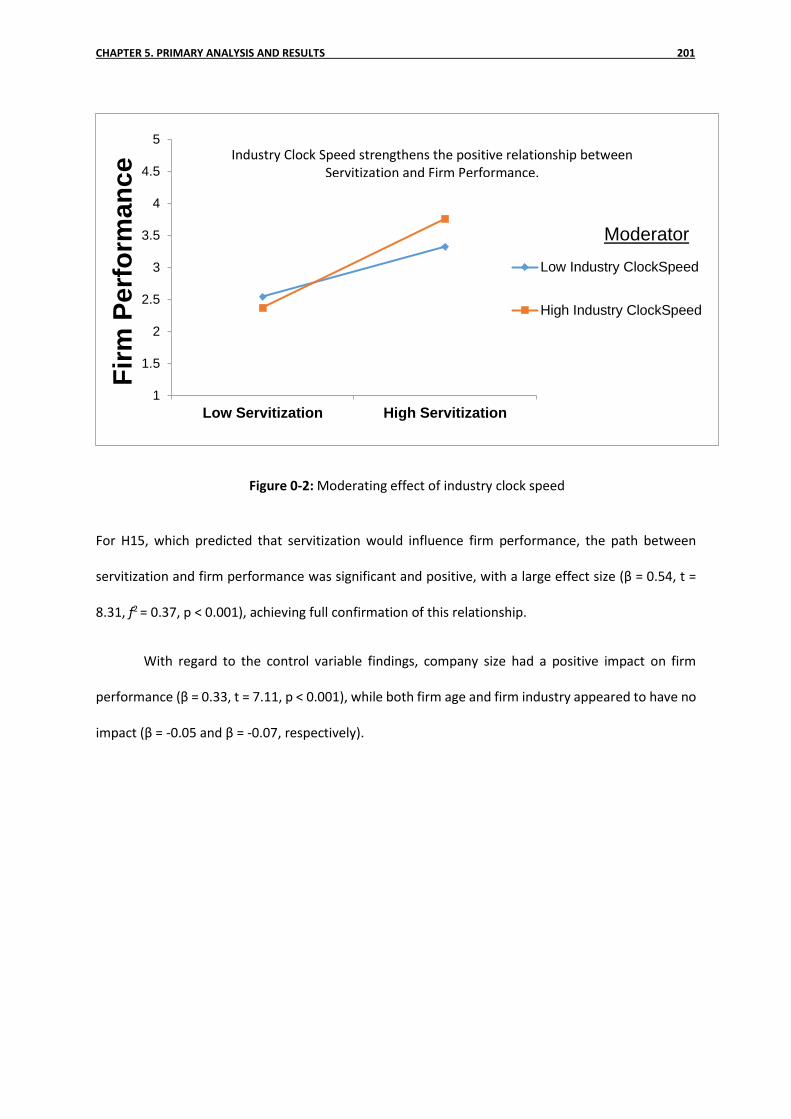
CHAPTER 5. PRIMARY ANALYSIS AND RESULTS 201
For H15, which predicted that servitization would influence firm performance, the path between
servitization and firm performance was significant and positive, with a large effect size (β = 0.54, t =
8.31, f2 = 0.37, p < 0.001), achieving full confirmation of this relationship.
With regard to the control variable findings, company size had a positive impact on firm
performance (β = 0.33, t = 7.11, p < 0.001), while both firm age and firm industry appeared to have no
impact (β = -0.05 and β = -0.07, respectively).
1
1.5
2
2.5
3
3.5
4
4.5
5
Low Servitization High Servitization
Fir
m P
erf
orm
an
ce
Moderator
Low Industry ClockSpeed
High Industry ClockSpeed
Industry Clock Speed strengthens the positive relationship between Servitization and Firm Performance.
Figure 0-2: Moderating effect of industry clock speed

CHAPTER 5. PRIMARY ANALYSIS AND RESULTS 202
Table 0-32: Significance of the path coefficients in the SBM structural model (Bootstrapped at 5000 sample)
Path Path Coefficient Mean Standard Error T-Value a P Value Significance
Value Co-creation ---⊕---> Servitization 0.311 0.316 0.059 3.080 0.001 ***
Value Co-creation ---⊕---> Firm Performance 0.161 0.160 0.073 1.548 0.040 **
Open Innovation ---⊕---> Servitization -0.086 -0.084 0.036 0.418 0.160 NS
Open Innovation ---⊕---> Value Co-creation 0.283 0.283 0.048 5.886 0.000 ***
Open Innovation ---⊕---> Absorptive Capacity 0.536 0.543 0.074 7.240 0.000 ***
Open Innovation ---⊕---> Firm Performance 0.076 0.079 0.043 1.050 0.180 NS
Absorptive Capacity ---⊕---> Servitization 0.289 0.282 0.044 2.557 0.011 **
Absorptive Capacity ---⊕---> Firm Performance 0.238 0.238 0.055 4.286 0.000 ***
Absorptive Capacity ---⊕---> Value Co-creation 0.621 0.620 0.045 13.775 0.000 ***
Service orientation of organisational culture ---⊕---> Servitization 0.572 0.569 0.054 10.697 0.000 ***
Service orientation of organisational culture ---⊕---> Open Innovation 0.009 0.009 0.001 0.566 0.520 NS
Service orientation of organisational culture ---⊕---> Firm Performance 0.110 0.117 0.094 1.963 0.030 **
Risk---⊝---> servitization -0.303 -0.313 0.038 8.314 0.000 ***
Industry Clock Speed ---⊕--->Servitization ⊛ Firm Performance 0.152 0.150 0.031 4.764 0.000 ***
Servitization ---⊕---> Firm Performance 0.544 0.543 0.063 8.316 0.000 ***

CHAPTER 5. PRIMARY ANALYSIS AND RESULTS 203
As discussed previously, PLS-SEM is regarded as a variance-based approach to SEM, where the
algorithm prediction’s objective is to maximize the R2 values of the (target) endogenous constructs
(Hairs et al., 2014). In this regard, the study’s structural model, and in particular the endogenous latent
variable in the model, achieved moderate to substantial explanatory power. The servitization
construct achieved an R2 of 0.85, meaning that the predictive constructs in the SBM managed to
explain 85% of the variance in the servitization construct. This is considered substantial explanatory
power. The study model also managed to explain 77% of the variance in the firm performance
construct, as shown in figure 5-3. The author also calculated the R2 for the study model while excluding
the control variables to unearth the true effect of the main model constructs (see table 5-34). The
analysis revealed that the control variables explained only 1% of the variance in the performance
construct.
Furthermore, the SBM explained 65% of the variance in value co-creation construct, which is
consider substantial. Open innovation and absorptive capacity achieved moderate explanatory power,
with R2 values of 29% and 26%, respectively.
As recommended by Hair et al. (2014), it is paramount to evaluate the magnitude of the R2
values as a criterion for the predictive accuracy of the structural model, where R2 values of 0.75, 0.50,
or 0.25 for the endogenous constructs represent substantial, moderate, and weak explanatory power,
respectively. As shown in figure 5-3, the SBM model managed to explain 77% of the variance in the
firm performance construct, 85% of the variance in the servitization construct, and 65% of the variance
in the value co-creation construct. These results are considered substantial. The SBM explained 29%
of the variance in absorptive capacity and 26% of the variance in open innovation, achieving moderate
explanatory power.

CHAPTER 5. PRIMARY ANALYSIS AND RESULTS 204
Table 5-35 shows the effect sizes for each explanatory latent variable on the study’s
endogenous variables. This analysis was carried out in two stages. In the first stage, the author
calculated the R2 for the endogenous variables by excluding a specified exogenous construct from the
SBM model. This was done to determine whether the excluded construct had a substantial impact on
the endogenous constructs. The author then calculated the effect size using the following equation:
𝑓2 =𝑅2 𝑖𝑛𝑐𝑙 − 𝑅2 𝑒𝑥𝑐𝑙
1 − 𝑅2 𝑖𝑛𝑐𝑙
Following guidelines for assessing effect size, 0.02, 0.15, and 0.35 represent small, medium,
and large effects, respectively (Cohen, 1988). The results of the analysis show that servitization had a
large effect on firm performance (f2 = 0.37), while a service orientation of organizational culture had a
large effect on servitization (f2 = 0.45). Risk, absorptive capacity, and value co-creation exhibited
medium-sized effects on servitization (f2 = 0.28, f2= 0.29, and f2 = 0.25, respectively).
To assess the SBM’s predictive relevance, the study followed the recommendation of Geisser
(1974) and Stone (1974) to use Stone-Geisser's Q2 value as an indicator of the model's predictive
relevance. To obtain the Q2 value, the blindfolding procedure was used for a certain omission distance
D. =. Blindfolding is a sample reuse technique that omits every dth data point in the endogenous
construct's indicators and estimates the parameters using the remaining data points (Chin, 1998;
Henseler et al., 2009; Tenenhaus et al., 2005). This thesis used the cross-validated redundancy as a
measure of Q2, since it includes the key element of the path model – the structural model – to predict
eliminated data points (Hair et al., 2014). The Q2 values estimated using the blindfolding procedure
are a measure of how well the path model can predict the originally observed values. Q2 values above
0 are considered significant and indicate good predictive relevance. As shown in table 5-36, all Q2‘s for
endogenous constructs in the SBM were above zero, providing additional evidence that SBM exhibits
good predictive relevance.

CHAPTER 5. PRIMARY ANALYSIS AND RESULTS 205
Following the same approach used to asses R2 values using f2 effect size, the relative impact
of predictive relevance can be compared by measuring the q2 effect size, which is calculated using the
following equation:
𝑞2 =𝑄2 𝑖𝑛𝑐𝑙 − 𝑄2 𝑒𝑥𝑐𝑙
1 − 𝑄2 𝑖𝑛𝑐𝑙
Similar to the f2 effect size measure of predictive relevance, q2 effect size values of 0.02, 0.15,
and 0.35 indicate that an exogenous construct has a small, medium, or large predictive relevance,
respectively, for a certain endogenous construct (Hair et al., 2014). As shown in table 5-37,
servitization showed a large q2 effect size, and thus large predictive relevance, on firm performance,
while value co-creation and absorptive capacity had a large q2 effect size on servitization.
Overall, as illustrated in figure 5-3, eight of the study hypotheses were fully supported (H1,
H4, H7, H9, H10, H13, H14, H15), 3 were rejected (H3, H6, H11), and 4 were partially supported (H2,
H5, H8, H12).

CHAPTER 5. PRIMARY ANALYSIS AND RESULTS 206
Figure 0-3: Research model testing results

CHAPTER 5. PRIMARY ANALYSIS AND RESULTS 207
Table 0-33: Degree of confirmation of the hypotheses in the SBM model (n = 185) (notes and legend on the following page)
NO. Relationship Significance Score1b ES/PCc Score 2d R2 Score 3e Total Score Degree of Confirmation
H1 Value Co-creation ---⊕---> Servitization *** 3 0.25 3 0.85 4 36
H2 Value Co-creation ---⊕---> Firm Performance ** 1 0.09 1 0.77 4 4
H3 Open Innovation ---⊕---> Servitization NS 0 0.03 1 0.85 4 0
H4 Open Innovation ---⊕---> Value Co-creation *** 3 0.26 3 0.65 4 36
H5 Open Innovation ---⊕---> Absorptive Capacity *** 3 0.54 4 0.29 2 24
H6 Open Innovation ---⊕---> Firm Performance NS 0 0.04 1 0.77 4 0
H7 Absorptive Capacity ---⊕---> Servitization *** 2 0.29 4 0.85 4 32
H8 Absorptive Capacity ---⊕---> Firm Performance *** 3 0.19 2 0.77 4 24
H9 Absorptive Capacity ---⊕---> Value Co-creation *** 3 0.37 4 0.65 4 48
H10 Service orientation of organisational culture ---⊕---> Servitization *** 3 0.45 4 0.85 4 48
H11 Service orientation of organisational culture ---⊕---> Open Innovation NS 0 0.09 0 0.26 2 0
H12 Service orientation of organisational culture ---⊕---> Firm Performance * 1 0.12 2 0.77 4 8
H13 Risk---⊝---> Servitization *** 3 0.28 3 0.85 4 36
H14 Industry Clock Speed ---⊕--->Servitization ⊛ Firm performance *** 3 0.32 4 0.77 4 48
H15 Servitization ---⊕---> Firm performance *** 3 0.37 4 0.77 4 48

CHAPTER 5. PRIMARY ANALYSIS AND RESULTS 208
(a) * p < 0.05, ** p < 0.01, *** p < 0.001, NS = not significant (two tailed t-test performed in the bootstrapping with 185 cases and 5000 samples)
(b) The significance levels NS, *, **, and *** are given values of 0, 1, 2, and 3 respectively on the score mapping image.
(c) ES= effect size, PC = path coefficient. Note that PC substitutes for ES when the latter cannot be calculated (highlighted in light grey).
(d) ES values between the intervals [0.00, 0.02], [0.02, 0.11], [0.11, 0.20], [0.20, 0.29] and [0.29, 1.00] have corresponding values of 0, 1, 2, 3 and 4 on the scoring image, respectively.
Note that PC values less than the cut-off of 0.20 are deemed unsatisfactory and are given a score of 0 on the scoring image.
PC values between the intervals [0.00, 0.20], [0.20, 0.30], [0.30, 0.40], [0.40, 0.50] and [0.50, 1.00] have corresponding values of 0, 1, 2, 3 and 4 on the scoring image, respectively.
(e) R2 values between the intervals [0.00, 0.04], [0.04, 0.22], [0.22, 0.40], [0.40, 0.58], and [0.58, 1.00] have corresponding values of 0, 1, 2, 3 and 4 on the scoring image, respectively.
(f) Total score is calculated by multiplying the image scores together (Score1*Score2*Score3), with the minimum score being 0 and the maximum score being 48.

CHAPTER 5. PRIMARY ANALYSIS AND RESULTS 209
Table 0-34: Comparison of the structural models
Results Full Model Control Variables Only Model Theoretical Variables Only Model
Number of paths in the model 18 3 15
Number of significant paths in the model 13 1 12
Variance explained in firm performance (percent) 77 2.3 76
Additional variance explained by the theoretical variables
77 – 2.3= 74.57percent
Additional variance explained by the control variables
77– 76 = 1 percent

CHAPTER 5. PRIMARY ANALYSIS AND RESULTS 210
Table 0-35: Coefficients of determination (R2) and effect sizes (f2) of the latent variables in the SBM model (n = 185)
Latent Variable to be Explored Explanatory Latent Variable R2 incla R2 exclb f2 d
Open Innovation Service orientation of organisational culture 0.26 ──C ──C
Value Co-creation
Open Innovation 0.65 0.56 0.26
Absorptive Capacity 0.65 0.52 0.37
Absorptive Capacity Open Innovation 0.29 ──C ──C
Service orientation of organisational culture 0.85 0.78 0.45 Open Innovation 0.85 0.85 0.03
Servitization Value Co-creation 0.85 0.81 0.25 Absorptive Capacity 0.85 0.81 0.29
Risk 0.85 0.81 0.28
Service orientation of organisational culture 0.77 0.74 0.12 Open Innovation 0.77 0.76 0.04
Firm Performance Value Co-creation 0.77 0.75 0.09 Absorptive Capacity 0.77 0.73 0.19 Servitization 0.77 0.68 0.37

CHAPTER 5. PRIMARY ANALYSIS AND RESULTS 211
Table 0-36: Predictive relevance of the endogenous constructs in the SBM model, measured by Stone‐Geisser Q² criterion.
Dependent Latent Variable Q² (=1-SSE/SSO)
Absorptive Capacity 0.18
Open Innovation 0.17
Firm Performance 0.42
Servitization 0.54
Value Co-creation 0.40

CHAPTER 5. PRIMARY ANALYSIS AND RESULTS 212
Table 0-37: Coefficients of determination (R2) and effect sizes (q2) of the latent variables in the SBM model (n = 185)
Latent Variable to be Explored Explanatory Latent Variable Q2 incl a Q2 exclb q2 d
Open Innovation Service orientation of organisational culture 0.17 ──C ──C
Value Co-creation
Open Innovation 0.40 0.36 0.07
Absorptive Capacity 0.40 0.23 0.28
Absorptive Capacity Open Innovation 0.18 ──C ──C
Service orientation of organisational culture 0.54 0.46 0.17 Open Innovation 0.54 0.54 0.00
Servitization Value Co-creation 0.54 0.29 0.54 Absorptive Capacity 0.54 0.40 0.30
Risk 0.54 0.51 0.07
Service orientation of organisational culture 0.42 0.40 0.03 Open Innovation 0.42 0.42 0.00
Firm Performance Value Co-creation 0.42 0.41 0.02 Absorptive Capacity 0.42 0.38 0.07 Servitization 0.42 0.32 0.17

CHAPTER 5. PRIMARY ANALYSIS AND RESULTS 213
5.5.2 Test for Mediating Effects
The SBM proposed research model has the potential to exhibit some mediation effects. The SBM
results provide support for six indirect effects (see table 5-38). Specifically, absorptive capacity may
mediate the relationship between open innovation and firm performance (β = 0.13, t = 2.38, p < 0.05),
absorptive capacity may mediate the relationship between open innovation and value co-creation (β
= 0.33, t = 7.22, p < 0.001), and more importantly, absorptive capacity may mediate the relationship
between open innovation and servitization (β = 0.16, t = 5.53, p < 0.001).
Furthermore, servitization may mediate the relationship between risk and firm performance
(β = -0.16, t = 2.78, p < 0.05), servitization may mediate the relationship between service orientation
of organisational culture and firm performance (β = -0.31, t = 8.82, p < 0.001), and servitization may
mediate the relationship between value co-creation and firm performance (β = -0.31, t = 11.26, p <
0.001).
The procedure used for the mediation analysis was based on bootstrapped SEM (n=5000
bootstrap resamples) (Zhao, Lynch Jr, and Chen, 2010), and was done to establish the statistical
significance of the indirect effect and measure its magnitude (Hayes, 2009). The procedure was also
based on the path coefficients and standard errors of the direct paths between, first, the independent
and mediating variables (IV → Mediator), and second, the mediator and dependent variables
(Mediator → DV) (see table 5-39). The indirect effect in this relationship was calculated as the product
of the direct paths from IV to Mediator and Mediator to DV.
For example, since servitization was found to mediate the relationship between value co-
creation and firm performance, the indirect effect of value co-creation on firm performance was
calculated as follows. First, the author calculated the direct effect of value co-creation (IV) on
servitization (M), resulting in β = 0.31. Second, the author calculated the direct effect of servitization
(M) on firm performance (DV), which was equal to β = 0.54. Finally, the indirect effect was calculated
by multiplying the effects (0.31*0.54 = 0.16). To calculate the total effect, the author added the

CHAPTER 5. PRIMARY ANALYSIS AND RESULTS 214
indirect effect to the direct effect. In this example, the total effect of value co-creation on firm
performance was equal to 0.16 (indirect effect) + 0.16 (direct effect) = 0.32. Table 5-40 and table 5-41
show the total effect of the variables on both the servitization construct and the firm performance
construct, as well as the ranking of the effects of the other variables in the SBM on those two
constructs (servitization and firm performance). These findings provide the basis for some of the
theoretical and practical conclusions presented in the following chapter.
Table 0-38: Specific indirect effects
Path Specific Indirect Effects
OI -> AC -> PER 0.129*
OI -> AC -> SERV -> PER 0.031
OI -> SERV -> PER -0.044
RISK -> SERV -> PER -0.157*
SC -> SERV -> PER 0.306*
OI -> AC -> VCC -> SERV -> PER 0.021
OI -> VCC -> SERV -> PER 0.018
OI -> AC -> VCC -> PER 0.029
OI -> VCC -> PER 0.025
OI -> AC -> SERV 0.157
OI -> AC -> VCC -> SERV 0.041
OI -> VCC -> SERV 0.136*
OI -> AC -> VCC 0.334* VCC -> SERV -> PER 0.167*
* Indicates 0.05 level of significance.

CHAPTER 5. PRIMARY ANALYSIS AND RESULTS 215
Table 0-39: Significance of mediated paths
Indirect effect Mediated path Path coefficient (indirect effect)
T statistic
OI -> PER OI -> AC -> PER 0.129 2.375**
OI -> VCC OI -> AC -> VCC 0.334 7.220***
OI -> SERV OI -> AC -> SERV 0.157 5.526***
RK -> PER RK -> SERV -> PER -0.157 2.786**
SC -> PER SC -> SERV -> PER 0.306 8.816***
VCC -> PER VCC -> SERV -> PER 0.164 11.257***
Note: Indirect effect estimates are based on bootstrapped SEM and reported in standardized form.
* p < 0.05, ** p < 0.01, *** p < 0.001
The PLS SEM analysis technique was used to calculate the extent to which a variable mediated
the relationship under investigation, the use of bootstrapping technique to test for mediation is
recommended by Preacher and Hayes (2004, 2008). Because bootstrapping fits perfectly with the PLS-
SEM method, as it does not require any assumptions to be made about the shape of the variables'
distribution or the sampling distribution. In addition, the approach exhibits higher levels of statistical
power compared with the Sobel test (Hair et al., 2014).
To address the issue of the extent to which the mediator variable absorbs some or all of the
direct effect between the exogenous and endogenous latent variables, the author estimated the size
of the indirect effect following Hair et al.’s (2014) recommendation of using variance accounted for
(VAF) to determine the size of the indirect effect in relation to the total effect, were VAF is calculated
as the ratio of the indirect effect to the total effect. If the ratio is greater than 1 it indicates full
mediation, while if the ratio is less than one it indicates partial mediation. In our study, absorptive
capacity appeared to be a full mediator between open innovation and firm performance (VAF=
0.13/0.08 = 1.6), and open innovation and servitization (VAF= 0.16/0.09 = 1.7), while absorptive
capacity partially mediated the relationship between open innovation and value co-creation (VAF=
0.28/0.33 = 0.84).

CHAPTER 5. PRIMARY ANALYSIS AND RESULTS 216
Another interesting finding was that servitization fully mediated the relationship between
service orientation of organizational culture and firm performance (VAF = 0.31/0.11 = 2.8).
Servitization partially mediated the relationship between risk and performance (VAF = -0.16/-0.09 =-
1.7), and it was found to mediate the relationship between value co-creation and firm performance
(VAF = 0.16/0.16 = 1). The results suggest that improving both servitization and value co-creation will
enhance firm performance.
Overall, the results obtained were deemed to be satisfactory and to have great theoretical
importance, as they were consistent with theoretical expectations. Therefore, the nomological validity
of the research model was confirmed, since servitization was shown to have a significant positive
impact on firm performance (R2 = 0.77). Servitization was also recognized as a strong mediator.
The direct, indirect and total effects of the significant variables on servitization and firm
performance are shown in table 5-40 and table 5-41, respectively. It can be seen from table 5-40 that
five latent constructs showed a significant relationship with servitization. Table 5-41 shows that four
latent constructs – value co-creation (indirect path coefficient = 0.16), service orientation of
organisational culture (indirect path coefficient = 0.31), risk (indirect path coefficient = –0.16) and
open innovation (indirect path coefficient =0.13) – had significant relationships with firm performance
(see Table 5-41 for the construct total effect and the ranking of construct effects).
Finally, the statistical examination of the research framework resulted in significant R², Q² and
GoF values. This indicates strong explanatory power and predictive relevance for the SBM. In other
words, the ability of the SBM model to predict firm performance in a servitized context has been
statistically confirmed.

CHAPTER 5. PRIMARY ANALYSIS AND RESULTS 217
Table 0-40: Total effect of the significant variables on servitization
Variables Direct Indirect Total Rank order
Absorptive Capacity 0.29*** - 0.29*** 4 Value Co-creation 0.31*** - 0.31*** 2 Service Culture 0.57*** - 0.57*** 1 Risk -0.30*** - -0.30*** 3 Open Innovation - 0.16* 0.16* 5
* p < 0.05, ** p < 0.01, *** p < 0.001
Direct and Indirect effects are reported in a rounded standardized form.
Table 0-41: Total effect of the significant variables on firm performance
Variables Direct Indirect Total Rank order
Servitization 0.54*** - 0.54*** 1 Absorptive Capacity 0.24*** - 0.24*** 4 Value Co-creation 0.16* 0.16* 0.32* 3 Service Culture 0.11 0.31*** 0.42*** 2 Risk - -0.16* -0.16* 5 Open Innovation - 0.13* 0.13* 6
* p < 0.05, ** p < 0.01, *** p < 0.001
Direct and Indirect effects are reported in rounded standardized form.
5.6 Groups Comparison and Analysis
In order to address and tackle heterogeneity in a sample, comparing several groups of respondents is
beneficial from a practical and theoretical perspective, as understanding group-specific effects
facilitates further differentiated findings. In this regard, group analyses were carried out to determine
whether the variances of the parameter estimates (from bootstrapping) differed significantly across
the study groups. Levene’s test was used to obtain the values for the comparison (Mooi and Sarstedt,
2011). Furthermore, Smart PLS has a functionality that addresses the group analysis calculation based
on resampling the path coefficients of the t-value according to the following formula:

CHAPTER 5. PRIMARY ANALYSIS AND RESULTS 218
p1 = Path coefficient from subsample 1
p2 = Path coefficient from subsample 2
se1 = Standard error of the parameter estimate of subsample 1
se2 = Standard error of the parameter estimate of subsample 2
m = Size subsample 1
n = Size subsample 2
To ensure robustness, the group comparison was carried in both group models using exactly
the same indicators (Chin, 2003). Table 5-42 shows the outcomes of the group comparison between
manufacturing firms that generate low revenue from service offerings –companies with less than 30%
of services from total revenue- (n=144) (see table 5-26) and those that generate high revenue from
service offerings (more than 30%) (n=41). As can be seen from the table 5-42, the path coefficients
were consistently highly significant for both groups. With regard to the coefficient of determination
for the structural model, both groups behaved analogously to the aggregated sample: The R2 of firm
performance was smaller in each group, but was still greater than or equal to the cut-off value of 0.2.
Therefore, for both samples, the explanatory power of the structural model was empirically
demonstrated.
An additional interesting finding was that the t-values for the group comparison showed
significant differences (p < 0.05) between the following two paths in the structural models:
Value Co-creation → Servitization: Value co-creation was shown to have a greater influence
on servitization in companies with a low degree of servitization than it does in companies with
a high degree of servitization.

CHAPTER 5. PRIMARY ANALYSIS AND RESULTS 219
Servitization → Firm Performance: The influence of servitization on firm performance was
found to be higher in companies with a low degree of service offerings than in companies with
a high degree of service offerings.
One striking feature of the findings is the degree of influence that servitization exerted on firm
performance in the comparison groups (low degree of servitization vs. high degree of servitization).
The implications of such findings, which can influence the service offering design and service
introduction, will be discussed in the following chapter.

CHAPTER 5. PRIMARY ANALYSIS AND RESULTS 220
Table 0-42: Comparison of path coefficients in the SBM for companies with low vs. high revenues from services (n = 144 and 41, respectively)
pathway
Key figures
Low (n = 144)
High (n = 41)
Group Comparison
Path coefficient
Standard error
T value a
Path coefficient
Standard error
T value a
T value a
Value Co-creation ------> Servitization
0.28
0.06
10.63***
0.15
0.15
1.79**
2.38***
Value Co-creation ------> Firm Performance
0.59
0.05
6.21***
0.59
0.11
3.85***
0.52 NS
Open Innovation ------> Servitization
0.12
0.06
4.05***
0.11
0.11
1.08 NS
1.78. NS
Open Innovation ------> Value Co-creation
0.12
0.06
4.77***
0.12
0.08
4.22***
0.75 NS
Open Innovation ------> Absorptive Capacity
0.09
0.05
5.24***
0.13
0.08
3.51***
0.60 NS
Open Innovation ------> Firm Performance
0.08
0.05
12.20***
0.08
0.13
3.80***
1.14 NS
Absorptive Capacity ----> Servitization
0.89
0.06
3.14***
0.89
0.12
2.50***
0.92 NS
Absorptive Capacity ----> Firm Performance
0.62
0.06
4.53***
0.61
0.14
3.19***
1.15 NS
Absorptive Capacity ----> Value Co-creation
0.60 0.05 5.91*** 0.53 0.09 1.58* 1.62**
Risk------> Servitization
-0.30 005 11.30*** -0.35 0.08 7.14*** 0.66 NS
Servitization ------> Firm Performance
0.50 005 9.30*** 0.35 0.08 7.24*** 3.81**

CHAPTER 5. PRIMARY ANALYSIS AND RESULTS 221
Table 5-42 continued
Key figure
Low (n = 144)
High (n = 41)
R2
R2
Open Innovation 0.21 0.22
Absorptive Capacity 0.42 0.63
Value Co-creation 0.28 0.40
Servitization 0.71 0.67
Firm Performance 0.65 0.62
* p < 0.05, ** p < 0.01, *** p < 0.001, NS = Not significant (error probability for one-tailed t-test).

CHAPTER 5. PRIMARY ANALYSIS AND RESULTS 222
5.7 Testing the SBM Model Using Objective Performance Data
To ensure the robustness of our findings and to further validate the study’s structural model (SBM),
the SBM was tested with firm performance data collected from the OSIRIS database. As discussed in
Section 4.7, prior management studies (e.g., Ravichandran, Lertwongsatien, and Lertwongsatien,
2005; Brown et al., 1995; Ge, Wang, and Wang, 2018) have used many different financial ratios and
stock market based metrics and variables to operationalise firm performance. In particular, return on
assets (ROA) and return on sales (ROS) have been widely used as indicators of financial performance,
measuring rate of return (Ravichandran, Lertwongsatien and Lertwongsatien, 2005).
Following such studies, the author used ROS and ROA as indicators of financial performance.
ROS represents the operational efficacy of the company, measuring the net contribution of the
revenues to profits, which highlights the operating costs associated with revenue generation. The
successful introduction of a servitized offer can be expected to improve the manufacturer’s efficiency
by streamlining business processes, outsourcing some operations, and cutting waste, thereby
reducing operating costs. The ROA ratio can be used to evaluate the ability of the company to deploy
its overall resources to a productive use. In a servitized context, ineffective plant operations and
bloated supply chains can increase the capital used to generate sustainable revenue streams,
compared with more streamlined supply chains that support product and service delivery. From a
capability perspective, as argued previously, delivering servitized offerings now requires the effective
use of the firm’s digital resources to cut cost and effectively utilize their capital assets.
Consistent with prior literature (Henderson and Venkatraman, 1993; Ravichandran,
Lertwongsatien, and Lertwongsatien, 2005), the author used sales growth as proxy for market-based
performance. In this thesis, sales growth was used to measure how well the manufactures were
performing in the marketplace, as determined by how often they introduce new products/services
whether they have effective customer targeting, and whether they satisfy customer needs. The
effective introduction of servitization can streamline and speed up the process of new product

CHAPTER 5. PRIMARY ANALYSIS AND RESULTS 223
development and enable better relations with customers, increasing the understanding of their needs
and responsiveness to their service requests, resulting in better performance in the marketplace.
After laying down the conceptual foundation of firm performance, the author introduced
three models with each of the three performance indicators (ROS, ROA, and sales growth) used as
dependent variables. These were considered appropriate measures, considering the
multidimensionality of the performance construct. Therefore, firm performance was operationalised
as a composite of the annual firm performance during the focal period of study (2013– 2015).
In the first mode, firm performance was operationalized as a reflective construct, with ROS
values for the years of 2013, 2014, and 2015 used as indicators for the construct. Similarly, ROA values
for 2013, 2014, and 2015 were used as indicators of firm performance in the second model, and the
average sales growth from 2013 to 2015 was used as an indicator of firm performance in the third
model. All other parameters were kept exactly as they were in the SBM model tested with subjective
firm performance measures. All three measurement models were supported and all indicator loadings
were significant and above the threshold of 0.4. No weaknesses were detected after assessing the
quality criteria of the measurement model.
The results of the structural models are presented in table 5-44. The results are to some extent
consistent with those obtained with the subjective performance measures; the relationships between
servitization and firm financial performance, and between servitization and firm market performance,
were supported in all three model, while all other structural paths maintained their significance. Each
of three models accounted for approximately 20 percent of the variance in firm performance (25
percent for ROS, 22 percent for ROA, and 19 percent for sales growth). Although lower than the
variance in firm performance explained by our original model (see table 5-43), these results are highly
similar to the results reported in other operational and strategic management literature that used
objectively measured financial ratios as indicators of firm performance (Ravichandran,
Lertwongsatien, and Lertwongsatien, 2005; Powell, 1995). Considering the problems associated with

CHAPTER 5. PRIMARY ANALYSIS AND RESULTS 224
using secondary data sources such as OSIRIS, and the fact that there are a host of factors in the
measurement model have not been accounted for that can also explain variance in firm financial and
market performance, the results reported here are significant and reinforce our finding that
servitization positively influences firm performance.
Table 0-43: Coefficient of determination of the endogenous constructs in the objective
models vs. SBM
Dependent Latent Variable R² SBM Model 1 (ROS)
Model 2 (ROA)
Model 3 (Sales Growth)
Open Innovation 0.26 0.25 0.26 0.24
Value Co-creation 0.65 0.63 0.63 0.62
Absorptive Capacity 0.29 0.29 0.28 0.29
Servitization 0.85 0.85 0.83 0.80
Firm Performance 0.77 0.25 0.22 0.19

CHAPTER 5. PRIMARY ANALYSIS AND RESULTS 225
Table 0-44: Model Comparison. Subjective firm performance measures vs. objective firm
performance measures (N=185)
* p < 0.05; ** p < 0.01; *** p < 0.001; NS = not significant.
Path SBM Model 1
(ROS)
Model 2
(ROA)
Model 3 (Sales
Growth) Significance
Value Co-creation ---⊕---> Servitization 0.31 0.32 0.29 0.38 ***
Value Co-creation ---⊕---> Firm Performance 0.16 0.16 0.19 0.15 **
Open Innovation ---⊕---> Servitization -0.09 -0.07 0.03 0.04 NS
Open Innovation ---⊕---> Value Co-creation 0.28 0.31 0.29 0.32 ***
Open Innovation ---⊕---> Absorptive Capacity 0.54 0.56 0.59 0.49 ***
Open Innovation ---⊕---> Firm Performance 0.08 0.07 0.04 0.09 NS
Absorptive Capacity ---⊕---> Servitization 0.29 0.35 0.21 0.30 **
Absorptive Capacity ---⊕---> Firm Performance 0.24 0.28 0.25 0.26 ***
Absorptive Capacity ---⊕---> Value Co-creation 0.62 0.70 0.45 0.76 ***
Service orientation of organisational culture ---⊕--->
Servitization
0.57 0.49 0.40 0.45
***
Service orientation of organisational culture ---⊕--->
Open Innovation
0.01 0.00 0.01 0.07
NS
Service orientation of organisational culture ---⊕--->
Firm Performance
0.11 0.17 0.20 0.21
**
Risk---⊝---> Servitization -0.30 -0.31 0.35 0.32 ***
Industry clock Speed ---⊕---> Servitization ⊛ Firm
Performance
0.15 0.170 0.20 0.20
***
Servitization ---⊕---> Firm Performance 0.54*** 0.29* 0.26* 0.23* ---

226
CHAPTER6 Conclusions, Implications and Critical
Discussion
6.1 Introduction
This chapter dwells on the conclusions relating to the research questions. It also presents the scientific
significance of this thesis and its original contribution to knowledge, in terms of theoretical and
managerial contribution, this chapter also outlines new avenues for future research and highlights
some limitations of this current research.
6.2 Overview of Research
As product market is currently suffering from both commoditization and stagnation manufacturing
companies are showing invigorated interest in offering innovative solutions by tapping into
servitization in order to sustain their competitive advantage and market performance. To achieve this,
manufacturers must develop a new set of resources and capabilities for that will allow them to
introduce industrial services. The introduction of servitization can be leveraged by capitalising on the
firm-specific learning and strategic capabilities that can help in the journey of business-model change
and organizational transformation. This thesis aimed to develop a model of servitization antecedents
to assist and guide manufacturing firms to formulate strategies to achieve and maintain superior
performance. To achieve this aim, the following four research questions were posed within the
context of manufacturing firms:

CHAPTER 6. CONCLUSIONS, IMPLICATIONS AND CRITICAL DISCUSSION 227
1. What is servitization and how can it be conceptualized, operationalized and measured?
2. What are the major internal and external factors driving servitization in manufacturing
companies?
3. What are the relationships between external industry factors, servitization, and organisational
performance in the context of manufacturing firms?
4. What is the existent relationship between servitization and firm performance and how they
are bounded by organisational context?
This thesis reviewed the theories of strategic management, operation management and marketing
and applied these theories within the context of servitized manufacturing firms. The theoretical
framework developed in this thesis is grounded by integrating RBV theory, transaction cost theory,
social network theory, attention based view theory contingency theory to achieve competitive
advantage. These theoretical perspectives were combined to provide the theoretical foundation to
study servitization and its antecedents. These theoretical lenses were also used in a complementary
manner in explaining the effects of external industry factors and internal servitization drivers, which
in turn determine organizational performance.
Prior empirical studies investigated the impact of servitization on the firm’s financial performance (e.g.
Eggert et al., 2014; Fang et al., 2008; Kastalli & Van Looy, 2013; Kohtamäki et al., 2013; Suarez et al.,
2013) have produced conflicting results and vividly addressed the “servitization paradox” (Gebauer et
al., 2005). Despite the valuable insight gained from the servitization literature, most of the evidence
reviewed is either anecdotal or based on case studies, and a large-scale empirical proof of the
relationship between the implementation of services, capabilities and firm performance is still scant,
vague and far from conclusive (Baines, 2015; Benedettini et al., 2015; Eggert et al., 2014).

CHAPTER 6. CONCLUSIONS, IMPLICATIONS AND CRITICAL DISCUSSION 228
This research was undertaken to extend the literature on servitization of manufacturing firms with a
view to providing insights into the major antecedents of servitization and how servitization can impact
organisational performance.
Having developed a theoretical framework, the methodological approach best suited to address
the hypothesised relationship were considered. Quantitative research design was followed. A
questionnaire was used to survey a large sample of senior managers regarding their firms servitization
practice and their internal servitization processes. This would help determine the relationship
between different servitization antecedents employed by manufacturing firms, and how this might
impact their firm performance. A total of 185 firm from different manufacturing sectors in the US and
Europe participated in this research. And PLS-SEM was used to statistically examine a framework for
direct causal relationships, causal moderating relationships and finally, mediating relationships
between the research model constructs.
This thesis empirical investigation of the relationships between the antecedents of servitization,
servitization and firm performance, was driven by multidimensional perspective that took into
consideration the interplay of both external and internal factors influencing servitization and firm
performance. This research main finding in this regard is that the introduction of servitization can be
leveraged by capitalising on the firm-specific learning and strategic capabilities that can help in the
journey of business-model change and organizational transformation. This research has shown that
such capabilities do enhance servitization and firm performance.

CHAPTER 6. CONCLUSIONS, IMPLICATIONS AND CRITICAL DISCUSSION 229
6.3 Conclusions Regarding the Research Questions
6.3.1 Servitization Conceptualization and Operationalization
The first research question guiding this research sought to find a workable definition of servitization
that can be applied specifically to manufacturing firms in B2B context. This research maintained the
definition of servitization as a change in the manufacturing business model, to incorporate more
service elements into its business model. To do so manufacturing firms have to undergo a
transformational process of shifting from a product-centric business model and logic to a service-
centric approach, making their customers’ needs their core focus, and provide them with solution
instead of products.
This research also introduced a novel operationalization of the servitization concept in which this
thesis examined the servitization construct. This construct found to be spanning three main
dimensions namely “top management service orientation”, “mobilization of organizational resources”
and the market offering”, these three pillars formed the base of the novel servitization scale
introduced to measure servitization. A list of 12 indicators for measuring the sevitization of
manufacturing firms were developed using the C-OAR-SE methoed and validated as apropertae.
6.3.2 Internal Anteceddents of Servitization
The second research question aimed to identify the major internal and external antecedents of
servitization. Building on prior literature (Baines, 2009; Gebauer et al., 2005, Kohtamäki et al., 2013)
The findings of this study illustrated that the most important antecedents od servitization are
as follows:
First, service orientation of organizational culture was shown to play the most important role
in enabling servitization, and servitization in turn augment the impact of a service orientation of
organizational culture on the bottom-line results. The results from our path analysis and the causal
relationships that explain the relationship between service orientation of organizational culture,

CHAPTER 6. CONCLUSIONS, IMPLICATIONS AND CRITICAL DISCUSSION 230
servitization and firm performance are significant. In line with Gebauer (2008), the study results reveal
that a service orientation of organisational culture is a key variable in the successful formulation and
implementation of a business strategy that includes servitized offerings. Consequently, from both the
practical and attention-based theoretical perspectives, achieving high managerial recognition and
improving the service orientation of the organizational culture are critical steps in offering
servitization. Both require a fundamental change in the product mindset prevalent in the pure
industrial context to more customer-centric approach (Kindström and Kowalkowski, 2015). Otherwise,
manufacturers are at risk of losing their strategic focus if they do not manage the transition properly
(Fang et al., 2008). It is also important to mention that the existing empirical evidence provides weak
support for a positive association between service culture and firm performance (Homburg et al.,
2003) because this relationship is mediated by the actual materialization of a service implementation,
by the introduction of servitization.
Second, value co-creation was found to be the second most important antecedent of servitization, as
it plays a critical role in redefining clients’ problems and discovering hidden demand (Kim and
Mauborgne, 1999; Matthyssens and Vandenbempt, 2008). One of the main premises of servitization
is that it creates customer-centric solutions (Normann and Ramirez, 1998), emphasising the need for
firms to change or renew their resources and capabilities in order to deliver value in use. Therefore,
manufacturing companies undergoing servitization must involve customers in their daily business
operations, bearing in mind that value creation can be better understood by taking the service
dominant (S-D) logic into account (Vargo and Lusch, 2004a; Edvardsson et al., 2011). Consequently,
manufacturing firms operating in a B2B context should focus on long-term relationship-building, which
leads to sustainable streams of revenue.
Third, risk, as perceived by the mangers involved in steering servitization strategies across
functions, was found to be the third most important factor, and it can hinder the implementation of
servitization, as shown by a strong negative effect of risk on servitization. For an in-depth

CHAPTER 6. CONCLUSIONS, IMPLICATIONS AND CRITICAL DISCUSSION 231
interpretation of the results concerning the weights of the risk construct items, see Chapter 4. It can
be concluded that the risk construct was highly marked by psychological risk, unjustified overall
implementation risk and financial risk perceptions. These findings confirm the previous literature
(Benedettini etal., 2015), which found that risk in a servitized context stems from the classic agency
problem (Makri and Neely, 2016). Therefore, this issue must be addressed when designing new
servitized offers.
There is also an important managerial implication related to the communication polices
adopted by businesses to establish the primary communication objectives for newly introduced
strategies. Such policies might include creating awareness of the benefits of servitization, promoting
service sales, enhancing internal and external collaboration with the product and service design
functions, encouraging or discouraging certain practices, and enhancing servitization acceptance
levels.
Furthermore, most servitization offers are induced by pull from customers and push from
technology to supply such an offer (Baines and Lightfoot, 2013). Therefore, manufacturers must
educate their customers about the benefits and risks of servitization, and whether services would
enhance the customers’ operational effectiveness and overall success.
Communication policies are considered vital in such context, as manufacturers must ensure
that their offer encapsulates 3 characteristics. First, the servitized offer must ensure customer
intimacy by combining detailed customer knowledge with operational flexibility; this will create the
best total solution for the customer. Second, operational excellence must be achieved by controlling
processes so as to effectively deliver the best total cost to the customer. Finally, they must ensure
product leadership by selling the best product on the market.

CHAPTER 6. CONCLUSIONS, IMPLICATIONS AND CRITICAL DISCUSSION 232
Fourth, absorptive capacity has been found as the fourth most important antecedent of
servitization, as this thesis results reveal that it can influence both servitization strategies and firm
performance. The study results also suggest that absorptive capacity is an important capability that
supports the growing demand from manufacturing firms for knowledge intensive services (KIS)
(Cusumano et al., 2015), in which acquiring, assimilating and exploiting external knowledge is
paramount and, more importantly, can help firms turn such knowledge into services that stimulate
growth (Macpherson and Holt, 2007).
Besides this finding, this reserch also confirmed that absorptive capacity in manufacturing
firms enhances firm financial and market performance, which is in line with Westerman et al.'s (2014)
findings. This relationship can be explained by the fact that absorptive capacity can play an enabler
role for servitization, as manufacturers are increasingly adapting their business models to incorporate
more capabilities to acquire external knowledge and apply it to commercial uses (Dellarocas, 2003),
to increase their value proposition (Lusch, Vargo, and Tanniru, 2010), and most importantly to unlock
operational agility and efficiency (BarNir, Gallaugher, and Auger, 2003), all leading to improved
financial performance (Gebauer et al., 2010).
Furthermore, the impact of open innovation on servitization and firm performance revealed
by the present study actually contradicts the current literature that advocates a direct positive impact
of openness on servitization and firm performance (e.g., Visnjic and Looy, 2013; Chesbrough, 2011);
these relationships failed to materialize in our causal examination, providing a new perspective into
the nature and the practice of open innovation in a servitized manufacturing context. Our findings also
showed how manufacturing firms tap into network partners they exploit as “value-generators”; these
partners provide a source of innovation and new commercial ideas that can generate high returns
through the introduction of service provision. An interesting explanation of such an effect can be
found in the very process by which manufacturers perform R&D, which is widely built on in-house
capabilities and resources – the closed innovation paradigm (see Section 3.3.2.2). This is done to

CHAPTER 6. CONCLUSIONS, IMPLICATIONS AND CRITICAL DISCUSSION 233
counter any negative effects from dual involvements in the process of acquiring new innovation. Gans
and Stern (2002), for example, found that a high degree of customer or partner involvement when
searching for innovative solutions could actually hinder a firm’s innovation stance and increase risk.
Such a phenomenon may lead manufacturing companies to be very risk averse and reluctant to
transcend firm boundaries, as the firm boundary theory and servitization literature suggest (Huikkola
and Kohtamäki, 2017).
Furthermore, servitization is in some respects viewed as a repositioning manoeuvre that
involves boundary (re)definition (Chandraprakaikul et al., 2010; Teece et al., 1997). In the
manufacturing context, requires designing a proper product-service offering and deciding which
value-adding activities should be performed internally; which should be outsourced to suppliers,
partners, distributors, and/or customers (Baines et al., 2005); and which can be designed
collaboratively, relying on open innovation activities (Neely, 2015).
This research, however, does not completely reject the importance of open innovation. In
some industries, openness can still offer a great deal of healthy interaction that facilitates the
combination, assimilation and transformation of knowledge inputs from diverse channels. It can also
give firms unique access to assets needed to generate value from new ideas (Christensen et al., 2005;
Teece, 1986). And as our results indicate, open innovation can influence servitization and firm
performance via the mediating effect of absorptive capacity.
Finally, this study results also provide novel insights into this relationship in the context of
servitized manufacturers. This thesis found that servitization plays a significant mediating role
between value co-creation and firm financial performance. This can be explained by the effect of
embedding value co-creation activities such as co-design and co-production aspects into the service
offering, which in turn enhances the customer experience, reduces down time and cuts costs for both
the manufacturer and the customer. Such a situation can be achieved by using predictive asset
management technologies and collaborative platforms. Thus, the main goal of value co-creation in a

CHAPTER 6. CONCLUSIONS, IMPLICATIONS AND CRITICAL DISCUSSION 234
servitized context is to increase the productivity and/or effectiveness of both the supplier and the
consumer, taking into consideration the idea that providing value in use is a dynamic process due to
changes in the customer’s objectives through the different stages of the relationship (Macdonald et
al., 2011).
6.3.3 Major External Factors in Influencing and Determining the Relationship
between Servtization and Firm Performance
The third research question aimed to ascertain the major factors of external environment, that might
influence the relationship between servitzation and firm performance. The study highlighted that
there is a major industry level forces influencing the servitization strategy and firm performance in
manufacturing firms. This factor is called industry dynamism and clock speed, which influence the
firm’s servitization strategies. This factor can be explained as the shift to service provision may be
motivated or influenced by changes in the firm environment, for instance, changes in competitive
pressure, technological changes, evolution of public regulations, and improvement of transportation
and telecommunications infrastructures (Crozet and Milet, 2017). A good example of the impact of
industry clock speed can be found in industries where product lifecycles are short, which is the case
in many industries. Manufacturers must keep up with market demands by introducing more products
and services, thus enhancing servitization. Interestingly enough, industry dynamism also affects
customer involvement and value co-creation. Therefore, in turbulent environments, a higher service
offering can lead to better performance, a finding that adds support to those of Fang et al. (2008). This
important external factor found in this thesis to play a moderator role between servitization and firm
performance.
While manufacturing firms formulating and implementing their servitization strategies. They
must adhere to the externalities in the surrounding, those rapid industrial changes can come in form
of, change in the technology landscape, manifested in introducing new digital technologies which
might change the rule of the game for incumbents, the change in the firm structure also plays a major
role in influencing servitization strategy, the mergers and acquisition happened every day in the

CHAPTER 6. CONCLUSIONS, IMPLICATIONS AND CRITICAL DISCUSSION 235
manufacturing firms needs special attention in order to acquire know how in service. Furthermore, in
servitization strategies must be revised on a regular basis to stay compatible with, and relevant to,
market needs and the ever evolving dynamic environment.
6.3.4 Servitization Impact on Firm Performance
The fourth research question aimed to examine the relationships between servitization and
firm performance. This research reveals a positive direct impact of servitization on firm performance
which is in line with prior empirical studies that investigated the same relationship (e.g., Eggert et al.,
2014; Fang et al., 2008; Kastalli and Van Looy, 2013; Kohtamäki et al., 2013; Suarez et al., 2013). This
research indicates that a higher degree of service offering leads to higher profitability and market
value for manufacturing firms. Furthermore, this thesis found that organizational performance may
vary considerably from one manufacturing firm to another, because of the level of servitization as high
level of servitizated companies were less financial sound than those with early stages of servitization
in other word low level of servitization. This performance discrepancy is taking place because of the
high financial commitments of those companies encounter when dealing with advance services and
long term contracts for asset management and solution offerings, while low servitized firms required
marginal financial commitment in less complex products and contracts. They difference between
those both strands of servitization is the level of internal resources integration and the internalization
of new external knowledge and the perceptions of the external industry structure they operate within.
In addition, this study found that the major two antecedents of the firm performance in
manufacturing context were, namely ‘servitization’ and ‘service orientation of organizational culture’,
and highly drive superior firm performance. This is particularly the case when manufacturing firms are
well equipped with a pool of learning capabilities in terms of the absorptive capacity and the
continuous development of R&D capabilities. These elements serve as inputs to the servitization
strategy and knowledge management system and determine the quality of the output (i.e.
organizational performance).

CHAPTER 6. CONCLUSIONS, IMPLICATIONS AND CRITICAL DISCUSSION 236
Figure 6-1 presents an integrated model of servitization of manufacturing firms which has been
developed as a result of this research. This framework presents a range of context-specific
antecedents of servitization which the interdependencies between major constructs of the model and
firm performance within the context of servitized manufacturing. These constructs are: external
industry factors and internal firm process. This research statistically inferring causality between those
articulated constructs of the model.
The framework, presented in Figure 6-1, highlights that there are positive relationships between
internal service orientations of organization culture, absorptive capacity with servitization. It also
shows that servitization has a positive impact on firm performance. It also highlights the role of
learning specific capabilities within the manufacturing firm, the model shows how industry clock speed
moderate the relationship between servitization and firm perfromace, in which manufacturing firms
need to deploy strategies that respond to the ever evolving external environment, which in returns
Figure 6-1: Research model

CHAPTER 6. CONCLUSIONS, IMPLICATIONS AND CRITICAL DISCUSSION 237
enhance firm performance. This study extends earlier research on the relative role of service
orientation of organizational culture and the internal risk assessment of the introduction of servitized
offering. The findings of this study suggest that, the integrated model of servitization appears to be a
powerful mechanism in efforts to enhance the performance of the manufacturing firms, particularly
when manufacturing firms are operating competitive landscape.
In sum, the findings of this research answered to a large extent the four research questions
presented in Chapter 1, helping to bridge some of the gaps in the existing discourse. To our knowledge,
this is the first survey research to investigate servitization by using a large set of firm-level data to
derive theoretical and practical implications with a high degree of objectivity.
This thesis opted to advance the servitization dialogue by providing systematic and robust
evidence of the impact of servitization on firm performance, as well as by answering question that
have remained controversial. Prior research has shown that many of the expected benefits of
servitization (in terms of higher revenues or higher profitability, for instance) fail to materialize in
many cases. This is called the “service paradox” (Gebauer, Fleisch, and Friedli, 2005). The present study
provides empirical evidence of a positive relationship between servitization and firm performance.
The study’s findings imply that that servitization is not a dichotomous concept – i.e. servitized
versus not servitized. Rather, servitization should be viewed as a multidimensional construct with
different levels of capabilities and interactions between variables. This means that it is highly
important to understand how manufacturers sense and look for new ideas, how they seize and
assimilate new knowledge, how they plan for risk and contingencies, and how they co-create value
with stakeholders. Some capabilities positively affect firm performance, while others do not. In
general, servitization was shown to be a highly valuable strategy for manufactures. However, the
results revealed that companies that are highly servitized show lower performance than those that
are moderately servitized. Consequently, it is vital to look at how companies introduce different
service offerings into to the marketplace and to understand that firms need to be very selective when

CHAPTER 6. CONCLUSIONS, IMPLICATIONS AND CRITICAL DISCUSSION 238
introducing complementary services. This can help in avoiding the service paradox, which was very
obvious in our group analyses, and which can affect firm performance and value growth (Crozet and
Milet, 2017).
The ramifications of the research findings with regard to the significant moderating effects
are that they show that the impact of a firm’s servitization strategies on firm performance is
contingent and confounded by factors residing outside the company. In this sense, servitization can
be expanded beyond a mere strategic choice introduced by management to enhance firm growth.
Industry clock speed and the industry dynamism limit how manufacturers introduce servitization and
whether they will benefit from service introduction. While industry clock speed can be used in
management studies as a proxy for competition and the pace of change (Fang et al., 2008; Martinez
et al., 2017), this research has shown that in a highly competitive industry, competing through services
enhances firm performance by providing a source of differentiation and innovativeness (Baines et al.,
2017).
6.4 Theoretical Contributions
This section highlights the theoretical implications of this research on the servitization literature and
its related theoretical underpinnings. Overcoming the shortcomings of inductive reasoning, the study
model was theoretically grounded and utilised appropriate theoretical frameworks (see Chapter 3),
thus laying the groundwork for its contribution to the servitization field.
First of all, this thesis attempted to suggest some interacting mechanisms between firm level
factors and industry factors. Thus, this thesis contributes to the RBV by providing more comprehensive
evidence for this theoretical perspective, in which a company’s strategic competitive advantage and
performance are a function of complex inimitable resources that are embedded within the
organization along with unique inputs and capabilities that adapt to the environmental changes
(Barney, 1991; Peteraf and Barney, 2003; Hamel and Prahalad, 2010). In addition, the study has shown
that the process of acquiring knowledge through absorptive capacity and organizational learning has

CHAPTER 6. CONCLUSIONS, IMPLICATIONS AND CRITICAL DISCUSSION 239
direct effects on servitization and firm performance, thus providing evidence that the usefulness of
firm resources varies with changes in firm knowledge (Penrose, 1959). Finally, it can be concluded that
the competitive advantage of a servitized manufacturing firm is dependent on its ability to achieve fit
or coherence among a set of competitive factors, both internal and external to the firm. This in turn
facilitates high performance. Manufacturing firms with high internal and external fit are likely to
outperform those servitized manufacturing firm with less fit.
A second related contribution is that the study findings provide general support for the
capability arguments put forth in the strategic management literature, complementing the dynamic
capability theory (DCT), which is in fact an extension of the RBV theory. DCT posits that the learning
process is a major source of value when building firm capabilities (Giniunienea and Jurksiene, 2015;
Grant, 1996), emphasising the view of organizational learning as the operational process of obtaining
information and converting it into knowledge (Franco and Haase, 2009). The dynamic capabilities
approach also helps explain why intangible assets, including a firm’s collective knowledge and
capabilities, have become the most valuable class of assets in a wide range of industries (Lev, 2001;
Hulten and Hao, 2008). The reason for this is that knowledge, capabilities and other intangibles are
not only scarce – they are often difficult to imitate.
As suggested by our findings, servitization also help firms to renew competencies so as to
achieve congruence with the changing business environment (Winter, 2006). As such, it can be viewed
as a potential strategy for growth and sustained profitability in highly competitive markets riddled
with deep uncertainty (Teece, 2017).
Furthermore, this research highlights the importance of recognizing that capabilities such as
asset orchestration and market co-creation are vital to resource allocation within manufacturing firms
(Katkalo, Pitelis, and Teece, 2010).

CHAPTER 6. CONCLUSIONS, IMPLICATIONS AND CRITICAL DISCUSSION 240
In this thesis, the author paid considerable attention to organizational learning and knowledge
absorption from partnerships and strategic alliances, which requires continued renewal of resources,
reconfiguring them as needed to innovate and respond to customer needs (Pisano and Teece, 2007;
Teece et al., 1997). The study findings also add to previous empirical research on the role of learning
specific capabilities, which has focused on the analysis of the transaction costs and mechanisms for
earning rents from such relationships (Dyer & Hatch, 2006).
The ability of manufacturers to create dynamic business models through servitization and its
integration mechanisms constitutes the ultimate source of competitive advantage (Takeuchi, 2006;
Spanos and Lioukas, 2001). While the importance of value co-creation in advancing servitization has
been recognized in the servitization literature (Kohtamäki et al., 2013), empirical work on value co-
creation and its impact on firm outcomes in a servitized context has remained very limited. The
present study extends the literature by demonstrating how value co-creation impacts servitization
and its interaction with firm learning processes and firm performance.
In addition to the aforementioned theoretical contributions, this thesis also has a great
contribution that will help advance industrial service research in the future. This contribution is the
development and the empirical validation of a multidimensional scale for assessing servitization. To
our knowledge, our study is one of the first attempts to do so. Our servitization construct significantly
advances the existing dimensions of servitization by including management’s cognitive ability to
understand the benefits of servitization, the importance of mobilizing firm resource, and market
offering modes. The new scale was validated and empirically tested for its content validity and
reliability (see Chapter 5), and by testing this scale across a wide range of industries, the author has
shown that it provides a fair degree of generalizability. Table 6-1 summarizes the study’s key
implications for servitization discourse.

CHAPTER 6. CONCLUSIONS, IMPLICATIONS AND CRITICAL DISCUSSION 241
Table 0-1: Implications for the servitization discourse
Finally, while some research has focused on the servitization–firm performance relationship,
the mechanisms by which servitization affects firm performance remain underexamined. Therefore,
the model developed in this thesis can serve as a basis for evaluation of servitization performance.
The theoretical contribution of this research can be extended to include the establishment of a new
conceptual servitization model dedicated to exploring the determinants of servitization in
manufacturing context.
6.5 Managerial Implications
This thesis finding gives a deep insight into the implantation of servitization within manufacturing
firms, this research dwells on the major antecedents of servitization and firm performance, the study
framework provides some pivotal management guidelines for further development of servitization in
manufacturing. The result of this research have some implications for decision makers where
servitization is concerned.
Space addressed
Principal points
Ontology of servitization
Servitization is a strategy involving business model change and novel tactics. Servitization is a strategy involving selective repositioning in the value chain, upstream and/or downstream.
Typology of servitization
There is more than one way for a manufacturer to servitize. At least four conceptually distinct servitization modes are identified: product, process, operational and platform-centric servitization.
Enablers of servitization
The main enabling factors, as empirically demonstrated, are service orientation of organizational culture, value co-creation, and absorptive capacity.
Barriers to servitization
Organizational risk, financial risk, customer acceptance risk, supply chain risk, and market barriers
Structure of servitization literature The existing body of knowledge would profit from using a more rigorous deductive approach, model building and confirmatory approaches that promote the research agenda beyond the descriptive and conceptual state
Servitization dimensions Top management service orientation, resource mobilization, and the market offering

CHAPTER 6. CONCLUSIONS, IMPLICATIONS AND CRITICAL DISCUSSION 242
Furthermore, from a pragmatic standpoint, this research makes several contributions to practice.
However, before articulating these practical implications, it is important to stress that the findings
presented here should be viewed as preliminary evidence regarding servitization practice. Therefore,
further research should be encouraged to both refine the study constructs and their measures, and
also to test the model with other data, before definitive guidelines for practitioners can be derived.
Nevertheless, as highlighted by Story et al. (2016), servitization has implications for various
stakeholders, and the research findings substantiate our conceptual model and offer several
managerial implications.
6.5.1 Enhancing Service Capabilities
Nowadays, decision makers in manufacturing firms are facing new challenges from the high
pace of dynamic market environments. Thus, they often face the question of whether and how to
pursue a servitization strategy to avoid the ‘commoditization trap,’ achieve higher performance,
enhance customer experience, and to spur and sustain competitive advantages.
The shift to data-driven, customer-centric business models that consider service infusion and
innovation as core capabilities can be enhanced by better management orientation toward identifying
challenges facing their industries and how such challenges can affect the servitized market offering.
Our findings highlight the importance of the firm’s service capabilities for enhancing the
synergy between learning capabilities and servitization initiatives; this will allow servitization to have
better impact on firm performance. Prior investment into organizational resources, skills, and
capabilities was one of aspects that the study’s participants agreed as the most important, in fact our
research shows that value co-creation is the most important aspect for composing value chain, from
research and development to after-sales.
The study also provides further evidence that the key to achieving sustainable business
performance does not lie directly in the type of organizational structure that managers set up for the

CHAPTER 6. CONCLUSIONS, IMPLICATIONS AND CRITICAL DISCUSSION 243
service business, but in the increase in service orientation in the organizational culture (Gebauer et
al., 2008). Therefore, the right implementation of routines and education to support a service culture
must occur.
An instructive managerial implication rests in the finding that industrial service providers
engaged in servitization must develop service infusion capabilities and, more importantly, ensure that
their portfolio includes the skills needed to handle the transition to a customer-centric business
model, while introducing the right performance measurement system to assess the services provided
(Gounaris and Venetis, 2002).
Another good managerial insight lies in prioritizing the antecedents of servitization strategies,
looking at how a micro-analytic exercise linking these antecedents with problem solving can help in
creating a better customised servitized solution. Furthermore, mangers should view increasing levels
of industry competition as an opportunity to diversify and differentiate through services – a strategy
that has been shown to be a good strategic move that leads to better performance (Lumpkin and Dess,
2001).
6.5.2 Leverageing Strategic Alliances and Partnerships between Stakeholders
In manufacturing context, the need to build and maintain strategic alliances and partnerships between
different stakeholders is considered paramount to acquire new innovative solution and latest
manufacturing capabilities that serve the servitized offerings and help maintain firm performance in
a cost effective way to safeguard the firm position from competition.
While it is unquestionable that firms should strive to design their servitized offers to perfectly
match their customers’ needs, firms must also take into account the importance of opening the firm
to external innovative ideas. Therefore, they should invest in measures that increase the efficiency of
internal R&D, external outsourcing processes, and strategic industry partnerships, which in returns

CHAPTER 6. CONCLUSIONS, IMPLICATIONS AND CRITICAL DISCUSSION 244
increase the barriers to entry. Doing so requires a special breed of mangers with the ability to manage
across the firm’s silos and outside firm boundaries (Teece, 2017).
While manufacturing environment marked with fierce competition, the strategic shift to
service provision can be challenging, therefore this study finding suggest that managers should
actively compare the actual progress of their servitization strategies against pre-developed key
performance indicators KPIs, bearing in mind that it is a sequential process in which knowledge
acquisition initiatives inform servitization design and implementation. It is also important to
understand that growth potential cannot be realized without sufficient human capital, knowledge
transfer and proper investment into capability renewal.
Yet another important aspect that is considered the cornerstone of servitization is the
contractual part of the market offering (Batista et al., 2017). Trusting relationships are a key factor in
the performance of contracts; establishing such relationships requires the right governance structures
to preserve the functional viability of the system and diminish any risk and uncertainty in the new
relationship (Coleman, 1988).
6.5.3 Introducing Services Enhance Firm Performance
Many of this thesis findings provide guidance to managers and consultants who are engaged in
implementing servitization in firms. It is paramount to have a clear servitization strategy to achieve
the desired performance outcomes; this is a prerequisite for ensuring financial soundness and also
achieving significant potential for value creation. As the findings suggest, the mediating role of
servitization clearly highlights how, in uncertain environments, servitization and absorptive capacity
can be leveraged as a source of sustainable competitive advantage; thus, mangers must pay more
attention to this relationship.
To be achieve financial success, the implementation of service technologies must be treated
as a business initiative (Smith and Milligan, 2002). Our findings show that top management
CHAPTER 6. CONCLUSIONS, IMPLICATIONS AND CRITICAL DISCUSSION 245
commitment and vision significantly foster servitization (Antioco et al., 2008). It is also argued here
that servitization strategies must be linked to proper reward and incentive system in manufacturing
firms. Nonetheless, most manufacturing incentive systems remain liked to R&D and operations, and
revolve around the core product offering.
From a managerial point of view, the author provides empirical evidence that industrial
services can help manufacturing companies enhance their bottom line. However, our findings also
indicate that industrial service offerings will not automatically improve a company’s financial and
market position. Rather, the performance outcomes of service provision depend on the context the
firm operates in and the pace of industry change. Our results also indicate that service managers
should clearly understand the strategic thrust of the organization and institute mechanisms to ensure
that learning capabilities are channelled toward areas that are important to the organization’s
servitization strategy.
Finally, it can be concluded that the empirical validation of the study’s integrative model will
help in implementing the right “means” to creating a positive performance impact from servitization.
This is because the model articulates some important managerial actions and tools for advancing and
implementing servitization by adjusting managerial practices in a goal-oriented manner. In addition,
the servitization measurement scale introduced in this thesis can serve as a step towards the
development of a prescriptive management tool to assess service capabilities and infusion inside the
firm.
6.6 Research Limitations and Future Directions
Despite the significant theoretical and pragmatic contributions of this thesis, the choice of empirical
setting –the deductive approach- raises some theoretical and methodological issues, and also points
to important avenues for future research.

CHAPTER 6. CONCLUSIONS, IMPLICATIONS AND CRITICAL DISCUSSION 246
First, from a methodological point of view, the study may be limited by being structured
around a cross‐sectional survey research design. Because of this, the cause–effect relationships
between constructs in the model must be viewed with caution. Although the author has established
associations between the causing and the caused constructs statistically, the sequential relationships
between the constructs were argued for based on existing theories. Consequently, the author
acknowledges that the only rigorous method for testing causal relationships among constructs is
through longitudinal studies. In this thesis, the author reasoned the SBM model using theoretical
arguments.
While the longitudinal approach has many benefits, it was not possible here due to practical
considerations. Similarly, it is also recognised that the study could profit from the benefits of a formal
case study approach. The absence of such an approach, however, was offset by the consideration of
extensive archival information in conjunction with verbal correspondence and informal meetings with
a significant number of the survey informants.
Second, as mentioned previously, the constructs that compose the model are represented as
latent variables that are not directly observable. Therefore, they are measured using indicators. The
issue is that a large number of indicators can reflect a construct, and given the constraint of survey
length, it is plausible that this thesis may not have sampled all items from a construct’s domain.
However, our sampling and inclusion criteria were based on a structural approach, where the author
aligned the construct indicators with our conceptual definitions to develop the measurement scales.
Recognizing this limitation, future research might refine our conceptual definition, operationalization
and measurement scale for the servitization construct by including other items that might prove
relevant to establishing the robustness of our results.
Third, in spite of multiple sources have been used to collect this thesis’s data as an effort to
triangulate our data, the author still acknowledge that better data triangulation is needed to further
support the study results.

CHAPTER 6. CONCLUSIONS, IMPLICATIONS AND CRITICAL DISCUSSION 247
Fourth, the stability of the relationship between servitization and firm performance over time
remains an untested area deserving of attention. This could be accomplished by using longitudinal
data to further test the results of this thesis and further confirm the causality claim.
Fifth, this thesis has emphasized insights derived from the RBV and dynamic capabilities
literature. However, a number of other theoretical perspectives address the contingencies influencing
organizational performance; this is an area that might stimulate additional empirical research.
Sixth, for cross-cultural/cross-national research, measurement equivalence is an important
methodological issue (Malhotra and Sharma, 2008). As some of the countries were represented by
very few participants in our sample (e.g., Sweden and Switzerland), the author refrained from
performing a measurement equivalence assessment using either a multi-country CFA or the
generalizability theory approach (Shavelson and Webb, 1991). Hence, the author considers this
shortcoming to be a rich new avenue for future research.
Seventh, in this thesis industrial services were considered a homogeneous offering, and
therefore a more fine-grained study is important in order to shed the light on the heterogeneity of
service offerings from manufacturing firms and the differential effects of various offerings on firm
performance.
In terms of future research opportunities, this thesis’s results put forward a number of areas
for management scholars to study. First, research can look at how some forms of servitization are
more accessible to particular manufacturing firms due to differences in digital capabilities. It is possible
that some manufacturing firms can become better at creating specific servitized offers as they become
more adept at integrating digital technologies, communicating and breaking down market and
customer needs.
Second, while this thesis has focused on eight relatively broad constructs to anchor the
proposed theoretical framework, manufacturing firms are constantly seeking innovative

CHAPTER 6. CONCLUSIONS, IMPLICATIONS AND CRITICAL DISCUSSION 248
configurations of different dynamic capabilities, communication channels, incentives, intellectual
property (IP), property rights and other intellectual assets that mirror the high-powered incentives of
markets (Foss, 2003). Therefore, complex theoretical models could be developed building on the
aforementioned factors that might influence servitization implementation.
The ever-evolving body of research concerning servitization and industrial marketing provides
rich ground for future research. Thus, a third main opportunity lies in investigating the micro-
foundation of the servitization business model using wider firm-level considerations. In other words,
the author has treated servitization as a straightforward process, but manufacturing firms are typically
engaged in a wider set of activities that are considered core to their business, and most certainly
mangers in reality engage with a combination of firm-level problems related to business model
innovation. This is especially true in a servitized context due to the multifaceted nature of the offering,
which in turn generates more complexities in the managerial problem sphere that need to be treated
with caution. Therefore, there are many pitfalls associated with servitization adoption that can lead
to unwanted consequences (Benedettini et al., 2015). This issue also deserves attention in future
research. Challenges facing digitalization and servitization in terms of cybersecurity and governance
can have an impact on firm performance (Huxtable and Schaefer, 2016); these issues provide another
interesting line of inquiry.
Recently, scholars have begun to challenge the assumptions about service-oriented growth
strategies in manufacturing, and have pointed out the importance of balancing business expansion
with standardization activities (Kowalkowski et al., 2015). A recent conceptualization suggested that
information can be a third dimension, alongside services and products, and that the value of big data
can be utilized in servitization (Opresnik and Taisch, 2015). Following this line of inquiry, the role of
technological trajectories in advancing servitization, the internet of things (IOT) and digitization is
another interesting avenue for further research.

CHAPTER 6. CONCLUSIONS, IMPLICATIONS AND CRITICAL DISCUSSION 249
Future research should also continue to investigate the means through which manufacturing
firms can facilitate higher levels of productivity through servitization. For instance, are there specific
types of resources (i.e., human, social, technological, etc.), organizational contexts (internal, external,
strategic, etc.), managerial cognitive abilities or additional capabilities that serve to influence firm
performance, and with what effects? Moreover, considerations beyond resource orchestration
capabilities that may influence the temporal lag between when resource costs are incurred and
benefits are realized by firms should be explored in future research.
Finally, adjacent literature streams from the fields of strategy, organizational change and
marketing, which have long dealt with issues that servitization touches upon, could potentially be
fruitful sources of insight, inspiration and future proposition‐building.

250
Reference List
Aboufoul, M. and Ruizalba, J. (2017). Towards a Conceptual Framework of the Impact of Servitization on Firm Performance. In: Servitization Spring Conference, Internationalisation through servitization. Lucerne: Switzerland.
Adler, J. H. (1965). Absorptive capacity: The concept and its determinants. 1st ed. Washington,
DC: Brookings Institution. Agle, B. R., Mitchell, R. K. and Sonnenfeld, J. A. (1999). Who matters to Ceos? An investigation of
stakeholder attributes and salience, corpate performance, and Ceo values. Academy of management journal, 42, pp.507-525.
Åhlström, P. and Nordin, F. (2006). Problems of establishing service supply relationships: evidence
from a high‐tech manufacturing company, Journal of Purchasing & Supply Management, 12(2), pp.75‐89.
Alchian, A.A. and Demsetz, H., (1972). Production, information costs, and economic
organization. The American economic review, 62(5), pp.777-795. Alvizos, E. (2012). Servitization Strategies & Firm Boundary Decisions. Ph.D. Thesis. The University
of Warwick. Anderson, J. C. and Gerbing, D. W. (1988). Structural equation modeling in practice: A review and
recommended two-step approach. Psychological bulletin, 103, p.411. Anderson, J.C. and Gerbing, D.W. (1991). Predicting the performance of measures in a
confirmatory factor analysis with a pretest assessment of their substantive validities. Journal of Applied Psychology, 76(5), pp.732.
Anderson, J. C. and Narus, J. A. (1995). Capturing the value of supplementary services. Harvard
Business Review, 73(1), pp.75–83. Anderson, N. and West, M. (1996). The team climate inventory: Development of the tci and its
applications in teambuilding for innovativeness. European Journal of Work and Organizational Psychology, 5(1), pp.53-66.
Antioco, M., Moenaert, R. K., Lindgreen, A., & Wetzels, M. G. (2008). Organizational antecedents
to and consequences of service business orientations in manufacturing companies. Journal of the Academy of Marketing Science, 36, pp.337-358.

REFERENCES 251
Araujo, L. and Spring, M. (2006). Services, products, and the institutional structure of production. Industrial Marketing Management, 35(7), pp.797–805.
Armistead, C. and Clark, G. (1991). A framework for formulating after-sales support strategy.
International Journal of Operations and Production Management, 11(3), pp.111–124. Armstrong, C.E. and Shimizu, K. (2007). A review of approaches to empirical research on the
resource based view of the firm, Journal of Management, 33 (6), pp.959‐986. Armstrong, J. S. and Overton, T. S. (1977). Estimating nonresponse bias in mail surveys. Journal of
marketing research, pp.396-402. Avlonitis, G and Gounaris, S (1997). Marketing orientation and company performance: a
comparative study of industrial vs. consumer goods companies, Industrial Marketing Management, 26 (5), pp. 385–402. DOI: 10.1016/S0019-8501(96)00121-6.
Babbie, E. (1992). The practice of social research. Belmont, CA: Wadsworth. Bagozzi, R.P., (2011). Measurement and meaning in information systems and organizational
research: Methodological and philosophical foundations. Mis Quarterly, pp.261-292. Bagozzi, R. P. & Yi, Y. (1988). On the evaluation of structural equation models. Journal of the
academy of marketing science, 16, pp.74-94. Ballantyne, D., and Varey, R. J. (2008). The service-dominant logic and the future of marketing.
Journal of the Academy of Marketing Science, 36(1), pp.11–14. Balsano, T.J., Goodrich, N.E., Lee, R.K., Miley, J.W., Morse, T.F. and Roberts, D.A., (2008). Identify
your innovation enablers and inhibitors. Research-Technology Management, 51(6), pp.23-33.
Bain, J. S. (1968). Industrial Organization. New York: John Wiley. Baines, T. (2015). from the editor: Exploring service innovation and the Servitization of the
manufacturing firm, Research-Technology Management, 58(5), pp.9–11. Baines T.S. and Lightfoot, H. (2013). Made to serve; Understanding what it takes for a
manufacturer to compete through servitization and Product-Service Systems’ Wiley. Baines, T. and Lightfoot, H.W. (2014). Servitization of the manufacturing firm: Exploring the
operations practices and technologies that deliver advanced services, International Journal of Operations & Production Management, 34(1), pp.2-35.
Baines, T. S., Lightfoot, H. W. (2014). Servitization of the manufacturing firm exploring the
operations practices and technologies that deliver advanced services. International Journal of Operations & Production Management, 34, pp.2-35.
Baines, T. S., Lightfoot, H. W., Benedettini, O., and Kay, J. M. (2009a). The servitization of
manufacturing: A review of literature and reflection on future challenges. Journal of Manufacturing Technology Management, 20(5), pp.547–567.
REFERENCES 252
Baines, T. S., Lightfoot, H. W., Evans, S., Neely, A., Greenough, R., Peppard, J., Roy, R., Shehab, E., Braganza, A., Tiwari, A., Alcock, J.R., Angus, J.P., Bastl, M., Cousens, A., Irving, P., Johnson, M., Kingston, J., Lockett, H., Martinez, V., Michele, P., Tranfield, D., Walton, I.M., and Wilson, H. (2007). State-of-the-art in product-service systems. Proceedings of the Institution of Mechanical Engineers (IMechE), Part B: Journal Engineering Manufacture, 221, pp.1543-1552.
Baines, T. S., Lightfoot, H. W., and Kay, J. M. (2009b). Servitized manufacture: Practical challenges
of delivering integrated products and services. Proceedings of the Institution of Mechanical Engineers, Part B: Journal of Engineering Manufacture, 223(9), pp.1207–1215.
Baines, T. S., Lightfoot, H., and Peppard, J. (2009c). Towards an operations strategy for product-
centric servitization. International Journal of Operations and Production Management, 29(5), pp. 494–519.
Baines, T.S., Lightfoot, H. and Smart, P. (2011b). Servitization within manufacturing: exploring the
provision of advanced services and their impact on vertical integration, Journal of Manufacturing Technology Management, 22(7), pp.947-954.
Baines, T., Ziaee Bigdeli, A., F. Bustinza, O., Guang Shi, V., Baldwin, J., Ridgway,
K., (2017). Servitization: revisiting the state-of-the-art and research priorities, International Journal of Operations & Production Management, 37 (2), pp.256-278, https://doi.org/10.1108/IJOPM-06-2015-0312.
Baird, I. and Thomas, H. (1985). Toward a Contingency Model of Strategic Risk Taking. Academy
of Management Review, 10(2), pp.230-243. Barley, S. (1990). The alignment of technology and structure through roles and networks.
Administrative Science Quarterly, 35(1), pp. 61–103. Barnett, N., Parry, G., Saad, M., Newnes, L. and Goh, Y. (2013). Servitization: Is a Paradigm Shift
in the Business Model and Service Enterprise Required. Strategic Change, 22(3-4), pp.145-156.
Barney, J (1991a). Firm resources and sustained competitive advantage. Journal of Management,
17(1), pp.99–120. Barney, J (1991b). Special theory forum: The resource-based model of the firm: origins,
implications, and prospects. Journal of Management, 17(1), pp.97–98. Barnir, A., Gallaugher, J. M. & Auger, P. (2003). Business process digitization, strategy, and the
impact of firm age and size: the case of the magazine publishing industry. Journal of Business Venturing, 18, pp.789-814.
Baron, R. and Kenny, D. (1986). The moderator-mediator variable distinction in social
psychological research: Conceptual, strategic, and statistical considerations. Journal of Personality and Social Psychology, 51(6), pp.1173-1182.
Barr, P., Stimpert, J. and Huff, A. (1992). Cognitive change, strategic action, and organizational
renewal. Strategic Management Journal, 13(S1), pp.15-36.
REFERENCES 253
Barreto, I. (2010). Dynamic capabilities: a review of past research and an agenda for the future, Journal of Management, 36(1), p. 256‐280.
Barringer, R., and BluedornC. (1999). The Relationship between Corporate Entrepreneurship and
Strategic Management, Strategic Management Journal, 20 (5), pp.421-444. Baruch, Y. (1999). Response rate in academic studies-A comparative analysis. Human relations,
52, pp.421-438. Barzel, Y. (1982). Measurement cost and the organization of markets. Journal of Law and
Economics, 25(1), pp.27–48. Bask, A. H., Tinnilä, M., and Rajahonka, M. (2010). Matching service strategies, business models
and modular business processes. Business Process Management Journal, 16(1), pp.153–180.
Bastl, M., Johnson, M., Lightfoot, H., and Evans, S. (2012). Buyer–supplier relationships in a
servitized environment: An examination with cannon and perreault’s framework. International Journal of Operations and Production Management, 32(6), pp.650–675.
Batista, L., Davis-Poynter, S., Ng, I. and Maull, R. (2017). Servitization through outcome-based
contract – A systems perspective from the defence industry. International Journal of Production Economics, 192, pp.133-143.
Benedettini, O., Neely, A., Swink, M. (2015). Why do servitized firms fail? A risk-based
explanation, International Journal of Operations & Production Management, 35(6), pp.946-979.
Benedettini, O., Swink, M. and Neely, A. (2017). Examining the influence of service additions on
manufacturing firms' bankruptcy likelihood. Industrial Marketing Management, 60, pp.112-125.
Bergkvist, L. and Rossiter, J.R. (2009). Tailor‐made single‐item measures of doubly concrete
constructs, International Journal of Advertising, 28(4), pp.607‐621. Bernard, H.R. (2002). Research Methods in Anthropology: Qualitative and quantitative methods.
3rd edition. AltaMira Press, Walnut Creek, California. Birchall, D. and Tovstiga, G. (2005). Capabilities for strategic advantage. 1st ed. Houndmills,
Basingstoke, Hampshire: Palgrave Macmillan. Birkinshaw, J., Morrison, A., and Hulland, J. (1995). Structural and competitive determinants of a
global integration strategy. Strategic Management Journal, 16(8), pp.637–655. Bitner, M. J. and Brown, S. W. (2008). The service imperative, Business Horizons, 51(1), pp. 39-46. Blalock, H.M. (1964). Causal inferences in nonexperimental research, University of North Carolina
Press, Chappel Hill, NC. Boal, K. and Bryson, J. (1987). Representation, testing and policy implications of planning
processes. Strategic Management Journal, 8(3), pp.211-231.

REFERENCES 254
Bollen, K. and Lennox, R. (1991). Conventional wisdom on measurement: a structural equation perspective, Psychological Bulletin, 110(2), pp. 305‐314.
Boorsboom, D., Mellenbergh, G.J. and van Heerden, J. (2004). The concept of validity,
Psychological Review, 111(4), pp.1061‐1071. Bonsu, S. K., and Darmody, A. (2008). Co-creating second life: market consumer cooperation in
contemporary economy. Journal of Macro marketing, 28(4), pp. 355–368. Boyer, K.K., Swink, M.L., (2008). Empirical elephants—why multiple methods are essential to
quality research in operations and supply chain management. Journal of Operations Management, 26 (3), pp.338–344.
Burgelman RA. (1994). Fading memories: a process theory of strategic business exit in dynamic
environments. Administrative Science Quarterly 39(1), pp.24– 56. Burgelman, RA, Kosnik, TJ & van den Poel, M (2004). Reading 11-1: Towards an innovation
capability framework. In: R. A. Burgelman, et al. (Eds.) Strategic management of technology and innovation (4th ed.). Boston, Mass.: McGraw-Hill.
Burns, R (2000). Introduction to Research Methods. 1st ed. London, Sage. CHRISTENSEN, C. M.,
BARTMAN, T. & VAN BEVER, D. 2016. The Hard Truth About Business Model Innovation. Mit Sloan Management Review, 58, pp.31-40.
Brady, T., Davies, A. and Gann, D. M. (2005a). Creating value by delivering integrated solutions,
International Journal of Project Management, 23(5), pp.360-365. Brännström, O. (2004). Market Offer Development ‐ Industrial experiences in a business‐to‐
business context, Department of Applied Physics and Mechanical Engineering, Division of Computer Aided Design. Luleå, Luleå University of Technology.
Brax, S. (2005). A manufacturer becoming service provider – challenges and a paradox. Managing
Service Quality, 15(2), pp.142–155. Brax, S., and Jonsson, K. (2009). Developing integrated solution offerings for remote diagnostics.
International Journal of Operations & Production Management, 29(5), pp.539–560. Brax, S. and Visintin, F. (2017). Meta-model of servitization: The integrative profiling approach.
Industrial Marketing Management, 60, pp.17-32. Brown, JS and Duguid, P (1998). Organizing knowledge. California Management Review, 40(3),
pp.90–111. Brown, JS and Duguid, P (2006). The social life of information. Boston, Mass.: Harvard Business
School Press. Brown, S. and Eisenhardt, K. (1995). Product Development: Past Research, Present Findings, and
Future Directions. The Academy of Management Review, 20(2), pp.343–378. Brown, JS and Hagel, J (2006). Creation nets: Getting the most from open innovation. The
McKinsey Quarterly (2), pp.40–51.

REFERENCES 255
Brunswicker, S. (2011). An Empirical Multivariate Examination of the Performance Impact of Open and Collaborative Innovation Strategies. PhD. Stuttgart University.
Bryman, A. and Bell, E. (2003). Business research methods. Oxford: Oxford University Press. Bvd. (2016). Osiris. [online] Available at: https://www.bvdinfo.com/en-gb/our-
products/data/international/osiris [Accessed 17 Dec. 2016]. Caldwell, N., and Howard, M. (Eds.). (2011). procuring complex performance: Studies of
innovation in product–service management. 4th ed. New York: Routledge. Campbell, D.T. (1955). The informant in quantitative research. The American Journal of Sociology
60, pp.339-342. Carlsson, S. A. (2008). An Attention-based view on DSS. In Encyclopaedia of Decision Making and
Decision Support Technologies, F. Adam and P. Humphreys Eds., Idea Publishing Group, Hershey, PA, pp. 38-45.
Cenamor, J., Sjödin, D.R. and Parida, V., (2017). Adopting a platform approach in servitization:
Leveraging the value of digitalization. International Journal of Production Economics, 192, pp.54-65.
Chakravarthy, B.S. (1986). Measuring Strategic Performance, Strategic Management Journal, 7,
pp.437-458. Chandler, A. D. (1990). Scale and scope. 2nd ed. London: Belknap. Chavez, R., Fynes, B., Gimenez, C. and Wiengarten, F. (2012). Assessing the effect of industry
clockspeed on the supply chain management practice‐performance relationship. Supply Chain Management: An International Journal, 17(3), pp.235-248.
Chen, J.X. (2010). An Empirical Test of the Effect of Manufacturing Service-Orientation on
Corporate Performance: A Comparison between Chinese and American Enterprises. Journal of Business Economics, 1, pp. 33-41.
Chen, Y. S., Lin, M. J. J., and Chang, C. H. (2009). The positive effects of relationship learning and
absorptive capacity on innovation performance and competitive advantage in industrial markets. Industrial Marketing Management, 38, pp.52-158. http://dx.doi.org/10.1016/j.indmarman.2008.12.003.
Chenhall, R. (2003). Management control systems design within its organizational context:
findings from contingency-based research and directions for the future. Accounting, Organizations and Society, 28(2-3), pp.127-168.
Chesbrough, HW (2003b). The era of open innovation. MIT Sloan Management Review, 44(3), pp.
35–41. Chesbrough, HW (2006c). Open Innovation - A new paradigm for understanding industrial
innovation. In: H. W. Chesbrough, W. Vanhaverbeke & J. West (Eds.) Open innovation: Researching a new paradigm: 1–12. Oxford: Oxford Univ. Press.

REFERENCES 256
Chesbrough, HW (Ed.) (2006d). Open innovation: The new imperative for creating and profiting from technology. Boston, Mass.: Harvard Business School Press.
Chesbrough, H. (2007). Business model innovation: it's not just about technology anymore.
Strategy & Leadership, 35(6), pp.12-17. Chesbrough, H. (2011). Open Services Innovation: Rethinking Your Business to Grow and Compete
in a New Era, Jossey Bass, San Francisco, CA. Chesbrough, H. and Crowther, A. (2006). Beyond high tech: early adopters of open innovation in
other industries. R and D Management, 36(3), pp.229-236. Chesbrough, H. and Spohrer, J. (2006). A research manifesto for services science, Communications
of the ACM, 49(7), pp.33‐40. Chesbrough, H., Vanhaverbeke, W. and West, J. (2014). New frontiers in open innovation. 1st ed.
Oxford: Oxford University Press. Chin, W. W. (1998b). The Partial Least Squares Approach to Structural Equation Modeling, in
Modern Methods for Business Research, G. A. Marcoulides (ed.), Mahwah, NJ: Erlbaum, pp.295- 358.
Chin, W. W. (2003). “PLS Graph 3.0,” Soft Modelling Inc., Houston, TX. Chin, W. W. (2010). “How to Write Up and Report PLS Analyses,” in Handbook of Partial Least
Squares: Concepts, Methods and Applications in Marketing and Related Fields, V. E. Vinzi, W. W. Chin, J. Henseler, and H. Wang (eds.), Berlin: Springer, pp.655- 690.
Chin, W. W., and Newsted, P. R. (1999). “Structural Equation Modeling Analysis with Small
Samples Using Partial Least Squares,” in Statistical Strategies for Small Sample Research, Rick Hoyle (ed.), Thousand Oaks, CA: Sage Publications, 1999, pp.307-341.
Cho, T. and Hambrick, D. (2006). Attention as the Mediator between Top Management Team
Characteristics and Strategic Change: The Case of Airline Deregulation. Organization Science, 17(4), pp.453-469.
Christensen, C. (2006). The Ongoing Process of Building a Theory of Disruption. Journal of Product
Innovation Management, 23(1), pp.39-55. Christensen CM, Johnson MW (2009). What Are Business Models and How Are They Built?
Harvard Business School Module Note 610-019. August 2009. http://www.hbs.edu/faculty/Pages/item.aspx?num=37729. Accessed December 4, 2016.
Churchill, G. A. (1979). A paradigm for developing better measures of marketing constructs.
Journal of marketing research, pp.64-73. Churchill, G. A., and Iacobucci, D. (2005). Marketing research: methodological foundations
(9thed.). Mason, Ohio: Thomson/South-Western. Clapham, S. and C. Schwenk (1991). Self-serving attributions, managerial cognition, and company
performance. Strategic Management Journal, 12, pp.219-229.

REFERENCES 257
Clark, K. and Fujimoto, T. (2005). Product development performance. 1st ed. Boston, Mass: Harvard Business School Press.
Cohen, J. (1988). Statistical power analysis for the behavioral sciences, Hillsdale, N.J., L. Erlbaum
Associates. Cohen, J., Cohen, P., West, S. G. and Aiken, L. S. (2013). Applied Multiple Regression/Correlation
Analysis for the Behavioral Sciences, Taylor & Francis. Cohen, M., Agrawal, N. and Agrawal, V. (2006). Winning in the aftermarket, Harvard Business
Review, 84(5), pp.129-138. Cohen, P., Cohen, J., Teresi, J., Marchi, M. and Velez, C.N. (1990). The problems in the
measurement of latent variables in structural equations causal models, Applied Psychological Measurement, 14(2), pp.183‐196.
Cohen, W. M., and Levinthal, D. A. (1989). Innovation and learning: The Two Faces of R&D. The
Economic Journal, 99, pp.569-596. http://dx.doi.org/10.2307/2233763. Cohen, W. M., and Levinthal, D. (1990). Absorptive capacity: A new perspective on learning and
innovation. Administrative Science Quarterly, 35, pp.128-152. http://dx.doi.org/10.2307/2393553.
Coleman, J. (1988). Social Capital in the Creation of Human Capital. American Journal of Sociology,
94, pp.S95-S120. Coltman, T., Devinney, T. M. and Midfley, D. F. (2011). Customer relationship management and
firm performance. Journal of Information Technology, 26, pp.205-219. Cook, T.D. and Cambell, D.T. (1979). Quasi‐experimentation: design and analysis for field settings,
Houghton Mifflin Company, Boston, MA.
Coreynen, W., Matthyssens, P. and Van Bockhaven, W. (2017). Boosting servitization through digitization: Pathways and dynamic resource configurations for manufacturers. Industrial Marketing Management, 60, pp.42-53.
Cova, B., Dalli, D., and Zwick, D. (2011). Critical perspectives on consumers’ role as ‘producers’: broadening the debate on value co creation in marketing processes. Marketing Theory, 11(3), pp.231–241.
Cova, B., and Salle, R. (2007). Introduction to the IMM special issue on ‘Project marketing and the
marketing of solutionsʼ: A comprehensive approach to project marketing and the marketing of solutions. Industrial Marketing Management, 36(2), pp.138–146.
Cova, B., and Salle, R. (2008). Marketing solutions in accordance with the S-D logic: Co-creating value with customer network actors. Industrial Marketing Management, 37(3), pp.270–277.
Craighead, C. W., Ketchen, D. J., Dunn, K. S. and Hult, G. T. M. 2011. Addressing common method variance: guidelines for survey research on information technology, operations, and supply chain management. IEEE Transactions on Engineering Management, 58, pp.578-588.

REFERENCES 258
Creswell, JW (2009). Research design: Qualitative, quantitative, and mixed methods approaches. 3rd ed. Los Angeles: SAGE.
Crozet, M., Milet, E., (2015). Should everybody be in services? The effect of servitization on
manufacturing firm performance. CEPII Work, pp.2015–2019. Crozet, M. and Milet, E. (2017). Should everybody be in services? The effect of servitization on
manufacturing firm performance. Journal of Economics & Management Strategy. [in press].
Cusumano, M., Kahl, S. and Suarez, E., (2014). Services, industry evolution, and the competitive
strategies of product firms. Strategic Management Journal, 36(4), pp. 559–575.
Daimler (2016) Annual Report 2016. Available at: https://www.daimler.com/documents/investors/reports/annual-report/daimler/daimler-ir-annualreport-2016.pdf. (Accessed: 9 January 2017).
Damanpour, F and Gopalakrishnan, S (1998). Theories of organizational structure and innovation
adoption: The role of environmental change. Journal of Engineering and Technology Management, 15, pp. 1–24.
Davidsson, N., Edvardsson, B., Gustafsson, A., and Witell, L. (2009). Degree of service-orientation
in the pulp and paper industry. International Journal of Services, Technology and Management, 11(1), pp.24–41.
Davies, A. (2004). Moving base into high-value integrated solutions: A value stream approach.
Industrial and Corporate Change, 13(5), pp727–756. Davies, A., and Brady, T. (2000). Organizational capabilities and learning in complex product
systems: Towards repeatable solutions. Research Policy, 29(7-8), pp.931-953. Davies, A., Brady, T. and Hobday, M. (2006). Charting a path toward integrated solutions, MIT
Sloan Management Review, 47(3), pp.39-48. Davies, A., Brady, T., and Hobday, M. (2007). Organizing for solutions: Systems seller vs. systems
integrator. Industrial Marketing Management, 36(2), pp.183–193. Dellarocas, C. (2003). The digitization of word of mouth: Promise and challenges of online
feedback mechanisms. Management science, 49, pp.1407-1424.
Den Hertog, P., van der AA, W., and de Jong, M. W. (2010). Capabilities for managing service innovation: towards a conceptual framework. Journal of Service Management, 21(4), pp.490–514.
Deshpande, R. and Webster, F. (1989). Organizational Culture and Marketing: Defining the
Research Agenda. Journal of Marketing, 53(1), p.3. Deshpande, R., Farley, J., and Webster, F. (1993). Corporate culture, customer orientation and
innovativeness in Japanese firms: A quadrad analysis. Journal of Marketing, 57(1), p.23-37.

REFERENCES 259
Dess, G. G. (1987). Consensus on strategy formulation and organizational performance: Competitors in a fragmented industry. Strategic Management Journal, 8, pp.259–277.
Dess, G. G. and Robinson, R. B. (1984). Measuring organizational performance in the absence of
objective measures: the case of the privately‐held firm and conglomerate business unit. Strategic management journal, 5, pp.265-273.
Dess, G. G., Ireland, R. D. and Hitt, M. A. (1990). Industry effects and strategic management research. Journal of management, 16, pp.7-27.
De Vita, G., Tekaya, A. and Wang, C.L. (2010). Asset specificity’s impact on outsourcing relationship performance: A disaggregated analysis by buyer‐supplier asset specificity dimensions, Journal of Business Research, 63(7), p.657‐666.
Diamantopoulos, A. (2005). The C‐OAR‐SE procedure for scale development in marketing: A
comment. International Journal of Research in Marketing, 22(1), pp. 1‐9. Diamantopoulos, A., and Siguaw, J. A. (2006). Formative versus reflective indicators in
organizational measure development: A comparison and empirical illustration. British Journal of Management, 17(4), pp.263-282. doi: DOI 10.1111/j.1467-8551.2006.00500.x.
Diamantopoulos, A. and Siguaw, J. A. (2006). Formative versus reflective indicators in
organizational measure development: A comparison and empirical illustration. British Journal of Management, 17, pp.263-282.
Diamantopoulos, A., Riefler, P. and Roth, K.P. (2008). Advancing formative measurement models, Journal of Business Research, 61(12), pp.1203‐1218.
Diamantopoulos, A. and Winklhofer, H.M. (2001). Index construction with formative indicators:
An alternative to scale development, Journal of Marketing Research, 38(2), pp.269‐277. Dillman, D.A., (2007). Mail and Internet Surveys: The Tailored Design Method 2007—Update with
New Internet, Visual, and Mixed-mode Guide, 2nd ed. John Wiley & Sons, New York. Doerr, K., Lewis, I., and Eaton, D. R. (2005). Measurement issues in performance-based logistics.
Journal of Public Procurement, 5(2), pp.164. Doherty, M. (1994). Probability versus Non-Probability Sampling in Sample Surveys, The New
Zealand Statistics Review March 1994 issue: 21-8. Available from: http://www.nss.gov.au/nss/home.NSF/75427d7291fa0145ca2571340022a2ad/768dd0fbbf616c71ca2571ab002470cd/$FILE/Probability%20versus%20Non%20Pro bability%20Sampling.pdf.
Donaldson, L., (2001). The Contingency Theory of Organizations. 3rd ed. Sage Publications.
Dosi, G. (1982). Technological paradigms and technological trajectories. Research Policy, 11(3), pp.147-162.
Dougherty D. (1992). A practice-centered model of organizational renewal through product
innovation. Strategic Management Journal, Summer Special Issue 13: pp.77–92.

REFERENCES 260
Duriau, V.J., Reger, R.K. and Pfarrer, M.D. (2007). A content analysis of the content analysis literature in organization studies: Research themes, data sources, and methodological refinements, Organizational Research Methods, 10(1), pp.5‐34.
Dyer, J., Cho, D. and Cgu, W. (1998). Strategic Supplier Segmentation: The Next “Best Practice” in
Supply Chain Management. California Management Review, 40(2), pp.57-77.
Dyer, J.H. and Hatch, N.W., (2006). Relation‐specific capabilities and barriers to knowledge transfers: creating advantage through network relationships. Strategic management journal, 27(8), pp.701-719.
Dyer, J. and Singh, H. (1998). The Relational View: Cooperative Strategy and Sources of Interorganizational Competitive Advantage. The Academy of Management Review, 23(4), p.660.
Edwards, J. R., and Bagozzi, R. P. (2000). On the nature and direction of relationships between constructs and measures. Psychological Methods, 5(2), pp.155-174. doi: Doi 10.1037//1082-989x.5.2.155.
Efron, B. (2000). An introduction to the bootstrap. Chapman & Hall/CRC: Boca Raton, Florida. Eggert, A., Hogreve, J., Ulaga, W. and Muenkhoff, E. (2011). Industrial services, product
innovations, and firm profitability: a multiple-group latent curve analysis, Industrial Marketing Management, 40(5), p.661-670.
Eggert, A., Hogreve, J., Ulaga, W. and Muenkhoff, E. (2014). Revenue and profit implications of
industrial service strategies, Journal of Service Research 17(1), pp. 23-39. Eggert, A., Thiesbrummel, C., and Deutscher, C. (2015). Heading for new shores: Do service and
hybrid innovations outperform product innovations in industrial companies? Industrial Marketing Management, 45, pp.173–183. http://dx.doi.org/10.1016/j.indmarman.2015.02. 013 February.
Eisenhardt, M., (1989). Agency Theory: An Assessment and Review. The Academy of Management
Review, 14(1), pp.57–74. Eisenhardt, K.M. (1985). Control: Organizational and economic approaches. Management
Science, 31(2), pp.34–149. Eisenhardt, K.M. and Martin, J.A. (2000). Dynamic capabilities: what are they?, Strategic
Management Journal, Vol. 21, No. 10/11, pp.1105‐1121. Elkington, J. (1994). Towards the Sustainable Corporation: Win-Win-Win Business Strategies for
Sustainable Development. California Management Review, pp.36, 90. http://dx.doi.org/10.2307/41165746
Enz, M. G., and Lambert, D. M. (2012). Using cross-functional, cross-firm teams to co-create value:
the role of financial measures. Industrial Marketing Management, 41(3), pp. 495–507. Ettlie, J. E. (1998). R&D and global manufacturing performance. Management Science, 44, pp.1-
11.
REFERENCES 261
European Commission. (2003). Commission Recommendation of 6 May 2003 concerning the definition of micro, small and medium-sized enterprises. Official Journal of the European Union, L, 124(36), 2003.
Fang, E., Palmatier, R.W., and Steenkamp, J.B. (2008). Effect of service transition strategies on firm value. Journal of Marketing, 72 (5), pp.1–14.
Faul, F., Erdfelder, E., Lang, A. G., and Buchner, A. (2007). G*Power 3: a flexible statistical power analysis program for the social, behavioral, and biomedical sciences. [Research Support, Non-U.S. Gov't]. Behav Res Methods, 39(2), pp.175-191.
Featherman, M.S. and Pavlou, P.A. (2003). Predicting e-services adoption: a perceived risk facets
perspective, International Journal of Human-Computer Studies, 59 (4), pp.451-74. Felin, T., and Foss, N. (2006). Individuals and Organizations: Thoughts on a Micro-foundations
Project for Strategic Management and Organizational Analysis, in Research Methodology in Strategy and Management, D. J. Ketchen and D. D. Bergh (eds.), Amsterdam: Elsevier Ltd., pp.253-288.
Felin, T. and Zenger, T. (2014). Closed or open innovation? Problem solving and the governance choice. Research Policy, 43(5), pp.914-925.
Fine, C. (1998). Clockspeed: Winning Industry Control in the Age of Temporary Advantage, Perseus
Books, New York, NY. Finne, M. (2014). Servitization and solution provision of manufacturing companies a
contingencies theoretical analysis. Ph.D. Aalto University.
Finne, M., Brax, S. and Holmström, J. (2013). Reversed servitization paths: a case analysis of two manufacturers. Service Business, 7(4), pp.513-537.
Finne, M., and Holmström, J. (2013). A manufacturer moving upstream: Triadic collaboration for
service delivery. Supply Chain Management: An International Journal, 18(1), pp.21-33.
Finne, M., Turunen, T., and Eloranta, V. (2015). Striving for network power: The perspective of solution integrators and suppliers. Journal of Purchasing and Supply Management, 21(1), pp.9–24
Fischer, T., Gebauer, H., Gregory, M., Ren, G., and Fleisch, E. (2010). Exploitation or exploration in service business development? Insights from a dynamic capabilities perspective. Journal of Service Management, 21(5), pp.591–624.
Fornell, C. and Bookstein, F.L. (1982). Two structural equation models: LISREL and PLS applied to
consumer exit‐voice theory”, Journal of Marketing Research, 19(4), pp. 440‐452. Fornell, C., and Larcker, D. F. (1981). Evaluating structural equation models with unobservable
variables and measurement error. Journal of Marketing Research, 18(1), pp.39–50. Fornell, C., and Larcker, D. F. (1981). Structural equation models with unobservable variables and
measurement error: Algebra and statistics. Journal of Marketing Research, 18(3), pp.328–388

REFERENCES 262
Foss, N. J. (2003). Selective intervention and internal hybrids: Interpreting and learning from the rise and decline of the Oticon spaghetti organization. Organization Science, 14, pp.331-349.
Fournier, S. (1998). Consumers and their brands: developing relationship theory in consumer
research. Journal of Consumer Research, 24(4), p.343–353. Frambach, R.T., Wels-Lips, I., and Gundlach, A. (1997). Proactive product service strategies – an
application in the European health market. Industrial Market Management, 26(4), pp.341–352.
Franco, M. and Haase, H. (2009). Entrepreneurship: an organisational learning approach. Journal of Small Business and Enterprise Development, 16(4), pp.628-641.
Füller, J. (2010). Refining virtual co-creation from a consumer perspective. California Management Review, 52(2), p.98–122.
Gawer, A. and Cusumano, M.A., (2014). Industry platforms and ecosystem innovation. Journal of
Product Innovation Management, 31(3), pp.417-433. Ge, J., Wang, G. and Wang, W., (2018). Moderation Effect of Investor and Manager
Heterogeneous Beliefs on the Relationship of Advertising and Firm Value. In Academy of Marketing Science World Marketing Congress, pp. 267-277. (In Press)
Gebauer, H., (2007). An Investigation of Antecedents for the Development of Customer Support
Services in Manufacturing Companies, Journal of Business-to-Business Marketing, 14:3, 59-96, DOI: 10.1300/J033v14n03_03.
Gebauer, H. (2008). Identifying service strategies in product manufacturing companies by
exploring environment-strategy configurations. Industrial Marketing Management, 37(3), pp.278–291.
Gebauer, H., Edvardsson, B., and Bjurko, M. (2010a). The impact of service orientation in
corporate culture on business performance in manufacturing companies. Journal of Service Management, 21, pp.237-259.
Gebauer, H., Edvardsson, B., Gustafsson, A., and Witell, L. (2010a). Match or mismatch: Strategy-
structure configurations in the service business of manufacturing companies. Journal of Service Research, 13(2), pp.198–215
Gebauer, H., Gustafsson, A., and Witell, L. (2011). Competitive advantage through service
differentiation by manufacturing companies. Journal of Business Research, 64(12), pp.1270–1280.
Gebauer, H., and Kowalkowski, C. (2012). Customer-focused and service-focused orientation in
organisational structures. Journal of Business & Industrial Marketing, 27(7), pp.527–537. Gebauer, H. and Friedli, T. (2005). Behavioural implications of the transition process from
products to services”, Journal of Business & Industrial Marketing, 20(2), pp.70-80.

REFERENCES 263
Gebauer, H. and Fleisch, E. (2007). An investigation of the relationship between behavioural processes, motivation, investments in the service business and service revenue, Industrial Marketing Management, 36(3), pp.337-348.
Gebauer, H., Fleisch, E. and Friedli T. (2005), Overcoming the service paradox in manufacturing
companies, European Management Journal, 23(1), pp.14-26.
Gebauer, H., Friedli, T. and Fleisch, E. (2006). Success factors for achieving high service revenues in manufacturing companies, Benchmarking: An International Journal, 13(3), pp.374-386.
Gebauer, H, Paiola, M. and Edvardsson, B. (2010). Service business development in small and medium capital goods manufacturing companies”, Managing Service Quality, 20 (2), pp.123-139.
Gebauer, H., Paiola, M., and Edvardsson, B. (2012). A capability perspective on service business development in small and medium-sized suppliers. Scandinavian Journal of Management, 28(4), 321–339. http://dx.doi.org/10.1016/j.scaman.2012.07.001.
Gebauer, H., Paiola, M. and Saccani, N. (2013). Characterizing service networks for moving from products to solutions, Industrial Marketing Management, Vol. 42 No. 1, pp.31-46.
George, G. and Bock, A. (2011). The Business Model in Practice and its Implications for
Entrepreneurship Research. Entrepreneurship Theory and Practice, 35(1), p.83-111.
George, G., Zahra, S. A., Wheatley, K. K., and Khan, R. (2001). The effects of alliance portfolio characteristics and absorptive capacity on performance: A study of biotechnology firms. Journal of High Technology Management Research, 12, pp.205-226. http://dx.doi.org/10.1016/S1047-8310(01)00037-2.
Geringer, J. M. and Hebert, L. (1991). Measuring performance of international joint ventures. Journal of international business studies, 22, pp.249-263.
Giniuniene, J. and Jurksiene, L. (2015). Dynamic Capabilities, Innovation and Organizational
Learning: Interrelations and Impact on Firm Performance. Procedia-Social and Behavioral Sciences, 213, pp. 985-991.
Glover, S. and Benbasat, I., 2010. A comprehensive model of perceived risk of e-commerce
transactions. International journal of electronic commerce, 15(2), pp.47-78. Goedkoop, M. J., van Halen, C., Te Riele, H., and Rommens, P. (1999). Product service systems-
Ecological and economic basics. Price water houseCoopers, Storrm C.S. and Pre Consultants: The Netherlands.
Godambe, V.P. (1982). Estimation in survey sampling: robustness and optimality. Journal of the American Statistical Association 77, pp.393-403.
Goffin, K and Mitchell, R (2005). Innovation Management: Strategy and implementation using the pentathlon framework. Houndmills, Basingstoke: Palgrave Macmiilan.

REFERENCES 264
Goffin, K., and New, C. (2001). Customer support and new product development: An exploratory study. International Journal of Operations and Production Management, 21(3), p. 275–301
Goh, Y.M., and McMahon, C. (2009). Improving reuse of in-service information capture and feedback. Journal of Manufacturing Technology Management, 20(5), pp. 626–639.
Gounaris, S. and Venetis, K. (2002). Trust in industrial service relationships: behavioral
consequences, antecedents and the moderating effect of the duration of the relationship. Journal of Services Marketing, 16 (7), pp. 636-655. DOI: 10.1108/08876040210447351.
Granovetter, M (1985). Economic action and social structure: The problem of embeddedness. American Journal of Sociology, 91 (3), pp.481–510.
Granovetter, M (1973). The strength of weak ties. American Journal of Sociology, 78(6), pp.1360–
1380. Granovetter, M (2005). The impact of social structure on economic outcomes. Journal of
Economic Perspectives, 19(1), pp.33–50. Grant, RM (1996). Toward a knowledge-based theory of the firm. Strategic Management Journal,
17(S2), pp.109–122. Grant, Robert M. (1996). Prospering in Dynamically-Competitive Environments: Organizational
Capability as Knowledge Integration, Organization Science, 7 (4), pp.375-387. Gregory, B. T., Harris, S. G., Armenakis, A. A. and Shook, C. L. (2009). Organizational Culture and
Effectiveness: A Study of Values, Attitudes, and Organizational Outcomes, Journal of Business Research, 62 (7), pp.673-679.
Grissemann, U. and Stokburger-Sauer, N. (2012). Customer co-creation of travel services: The role
of company support and customer satisfaction with the co-creation performance. Tourism Management, 33(6), pp.483-1492.
Grönroos, C. (2000). Service management and marketing – a customer relationship management
approach. Chichester: John Wiley. Grönroos, C. (2006). Adopting a service logic for marketing. Marketing Theory, 6(3), pp. 317–333. Grönroos, C. (2008). Service logic revisited: who creates value? and who co-creates? European
Business Review, 20(4), pp.298–314. Grönroos, C. (2011). Value co-creation in service logic: a critical analysis. Marketing Theory, 11(3),
pp.279–301. Grönroos, C. (2012). Conceptualising value co-creation: a journey to the 1970s and back to the
future. Journal of Marketing Management, 28(13/14), pp.1520–1534. Grönroos, C., and Ravald, A. (2011). Service as business logic: implications for value creation and
marketing. Journal of Service Management, 22(1), pp.5–22.

REFERENCES 265
Grönroos, C., and Voima, P. (2013). Critical service logic: making sense of value creation and co-creation. Journal of the Academy of Marketing Science, 41(2), 133–150.
Grönroos, C. and Gummertus, J. (2014). The Service Revolution and its Marketing Implications:
Service Logic vs Service-Dominant Logic. Managing Service Quality. 24(3), pp.206-229. Grönroos, C. and Helle, P. (2010). Adopting a service logic in manufacturing. Journal of Service
Management, 21(5), pp.564-590. Guimaraes, T. (2011). Industry clockspeed's impact on business innovation success
factors. European Journal of Innovation Management, 14(3), pp.322-344. Gunday, G., Ulusoy, G., Kilic, K. and Alpkan, L. (2011). Effects of innovation types on firm
performance. International Journal of Production Economics, 133(2), pp.662-676.
Hall, R. (1999). Becoming a preferred collaborator, Target, 15(2), pp.22-9. Hair, J. F. (2010). Multivariate data analysis: a global perspective, Upper Saddle River, N.J.;
London, Pearson Education.
Hair Jr, J.F., Hult, G.T.M., Ringle, C. and Sarstedt, M., (2014). A primer on partial least squares structural equation modeling (PLS-SEM). Los Angeles. Sage Publications.
Hair, J. F., Jr., Ringle, C. M., and Sarstedt, M. (2011). PLS-SEM: Indeed a silver bullet. Journal of
Marketing Theory and Practice, 19(2), pp.139–151. Hair, J. F., Jr., Ringle, C. M., and Sarstedt, M. (2012). Partial least squares: The better approach to
structural equation modeling? Long Range Planning, 45(5/6), pp.312– 319.
Hair, J. F., Jr., Ringle, C. M., and Sarstedt, M. (2013). Partial least squares structural equation modeling: Rigorous applications, better results and higher acceptance. Long Range Planning, 46(1/2), pp.1–12.
Hair, J. F., Jr., Sarstedt, M., Hopkins, L., and Kuppelwieser, V. (2014). Partial least squares structural equation modeling (PLS-SEM): An emerging tool in business research. European Business Review. 26(2), pp.106-121.
Hair, J. F., Jr., Sarstedt, M., Pieper, T. M., and Ringle, C. M. (2012). The use of partial least squares
structural equation modeling in strategic management research: A review of past practices and recommendations for future applications. Long Range Planning, 45(5/6), pp.320–340.
Hair, J. F., Jr., Sarstedt, M., Ringle, C. M., and Mena, J. A. (2012). An assessment of the use of partial least squares structural equation modeling in marketing research. Journal of the Academy of Marketing Science, 40(3), pp.414–433.
Hamel, G. and Prahalad, C. (2010). Competing for the future. Boston, Mass.: Harvard Business
School Press.
Handfield, R.B., Krause, D.R., Scannell, T.V. and Monczka, R.M. (2000). Avoid the pitfalls in supplier development, Sloan Management Review, 41(2), pp.37-49.

REFERENCES 266
HANNOVER MESSE (2017): Industrie 4.0, Industrial Automation, Energy, Industrial Supply and more. [online] Hannovermesse.de. Available at: http://www.hannovermesse.de/home [Accessed 24 April. 2016].
Hauschild, S., zu Knyphausen-Aufsess, D., and Rahmel, M., (2011). Measuring Industry Dynamics: Towards a Comprehensive Concept. Schmalenbach Business Review, 63, pp. 416-454.
Hayes, A. F. (2009). Beyond Baron and Kenny: Statistical mediation analysis in the new millennium. Communication monographs, 76, pp.408-420.
Helfat CE. (1997). Know-how and asset complementarity and dynamic capability accumulation.
Strategic Management Journal 18(5), pp.339–360. Helfat, C. E. and Peteraf, M. A. (2003). The dynamic resource-based view: Capability lifecycles.
Strategic Management Journal, 24, pp.997-1010. Helfat CE, Raubitschek RS. (2000). Product sequencing: co-evolution of knowledge, capabilities
and products. Strategic Management Journal, Special Issue 21(10/11), pp.961–979. Hempel, C (1965). Aspects of scientific explanation and other essays in the philosophy of science.
New York: Free Press [u.a.]. Hempel, C. (1970). Aspects of scientific explanation; and other essays in the philosophy of science.
1st Ed. New York: Free Press. Henderson R, Cockburn I. (1994). Measuring competence? Exploring firm effects in
pharmaceutical research. Strategic Management Journal, Winter Special Issue 15, pp.63–84.
Henseler, J., Ringle, C. M., and Sinkovics, R. R. (2009). The use of partial least squares path modeling in international marketing. Advances in international marketing, 20, pp.277–319.
Hill, T. (1977). On goods and servicies. Review of Income and Wealth, 23(4), pp.315-338. Hippel, E. (2006). Democratizing innovation. 1st ed. Cambridge, Mass.: MIT. Hobday, M., Davies, A. and Prencipe, A. (2005). Systems integration: a core capability of the
modern corporation. Industrial and Corporate Change, 14(6), pp.1109-1143. Hofer, C. (1975). Towards a contingency theory of business strategy, Academy of Management
Journal, 18 (4), pp. 784-810. Holbrook, M. B., and Hirschman, E. C. (1982). The experiential aspects of consumption: consumer
fantasies, feelings, and fun. Journal of Consumer Research, 9(2), pp.132–140. Holmstrom, B. (1979). Moral Hazard and Observability. The Bell Journal of Economics, 10(1), p.74. Holsti, O. R. (1969).Content analysis for the social sciences and humanities. Reading, MA: Addison-
Wesley
REFERENCES 267
Homburg, C., Fassnacht, M. and Guenther, C. (2003). The Role of Soft Factors in Implementing a Service-Oriented Strategy in Industrial Marketing Companies. Journal of Business-to-Business Marketing, 10(2), pp.23-51.
Homburg, C. and Pflesser, C. (2000). A Multiple Layer Model of Market-Oriented Organizational
Culture: Measurement Issues and Performance Outcomes, Journal of Marketing Research, 37, pp. 449-462.
Homburg, C., Harley K., and Workman Jr., J.P (1999). Strategic Consensus and Performance: The
Role of Strategy and Market-Related Dynamism, Strategic Management Journal, 20 (4), pp. 339–57.
Hoopes, D., Madsen, T.L. and Walker, G. (2003). Why is there a resource-based view? Toward a
theory of competitive heterogeneity, Strategic Management Journal, 24, pp. 889-902. Hsieh, Η. and Shannon, S.E. (2005). Three approaches to qualitative content analysis, Qualitative
Health Research, 15 (9), pp. 1277‐1288. Hu, C.P. and Wang, T. (2013). The Socio-Technical Capacity in Manufacturing Services Delivery
and Its Influence on Manufacturing Firm Performance. Forum on Science and Technology in China, 29, pp. 55-60.
Huang, X., Kristal, M. M. and Schroeder. G. 2008. Linking learning and effective process
implementation to mass customization capability. Journal of Operations Management, 26, pp.714-729.
Huff, A.S (1990). Mapping strategic thought, John Wiley & Sons, Chichester, NY. Hulten, C.R. and Hao, X., (2008). What is a Company Really Worth? Intangible Capital and the"
Market to Book Value" Puzzle (No. w14548). National Bureau of Economic Research. Huizingh, E. (2011). Open innovation: State of the art and future perspectives. Technovation,
31(1), pp.2-9. Hunt, D. M., Geiger‐Oneto, S., and Varca, P. E. (2012). Satisfaction in the context of customer co‐
production: a behavioral involvement perspective. Journal of Consumer Behaviour, 11(5), pp. 347–356.
Hunt, Shelby D. (2000). A General Theory of Competition: Resources, Competences, Productivity,
and Economic Growth, California, Thousand Oaks: Sage Publications.
Huxtable, J. and Schaefer, D. 2016. On Servitization of the Manufacturing Industry in the UK. Procedia CIRP, 52, pp.46-51.
Isaksson, O., Larsson, T.C. and Rönnbäckc, A. Ö. (2009). Development of product-service systems: challenges and opportunities for the manufacturing firm, Journal of Engineering Design, 20(4), pp.329-348.
Jacobides, MG, Knudsen, T and Augier, M (2006). Benefiting from innovation: Value creation,
value appropriation and the role of industry architectures. Research Policy, 35, pp.1200–1221.
REFERENCES 268
Jansen, J, van den Bosch, F and Volberda, H (2005). Exploratory innovation, exploitative innovation, and ambidexterity: The impact of environmental and organizational antecedents. Schmalenbach Business Review, 57, pp. 351–363.
Jaworski, B. J., and A. K. Kohli (1993). Market-orientation: Antecedents and Consequences,
Journal of Marketing, 57 (3), pp. 53-70 Jick, T.D., (1979). Mixing qualitative and quantitative methods: Triangulation in
action. Administrative science quarterly, 24(4), pp.602-611. Jimenez-Jimenez, D. and Sanz-Valle, R. (2011). Innovation, organizational learning, and
performance. Journal of Business Research, 64, pp.408- 417. Johansson, J.E., Krishnamurthy, C. and Schlissberg, H.E. (2003). Solving the solutions problem, The
McKinsey Quarterly, No. 3. Johne, A. and Storey, C. (1998). New service development: a review of the literature and
annotated bibliography, European Journal of Marketing 32: p. 184‐251. Johnstone, S., Dainty, A. and Wilkinson, A. (2008). In search of ‘product‐service’: Evidence from
aerospace, construction, and engineering, The Service Industries Journal, 28 (6), pp.861‐875.
Johnstone, S., Dainty, A. and Wilkinson, A. (2009). Integrating products and services through life:
An aerospace experience. International Journal of Operations & Production Management, 29 (5), pp.520‐538.
Jones, G. R. (1987). Organization-client transactions and organizational governance structures.
Academy of Management Journal, 30(2), pp.197–218. Jones, C., Hesterly, W. and Borgatti, S. (1997). A General Theory of Network Governance:
Exchange Conditions and Social Mechanisms. The Academy of Management Review, 22(4), p.911.
Kanninen, T., Penttinen, E., Tinnila, M. and Kaario, K. (2017). Exploring the dynamic capabilities
required for servitization the case process industry. Business Process Management Journal, 23, pp. 226-247.
Kaplan, A. M., and Haenlein, M. (2004). A Beginner’s Guide to Partial LeastSquares Analysis.
Understanding statsrtics, 3(4), pp. 283-297. Kaplan, R. and Norton, D. (2001). Transforming the Balanced Scorecard from Performance
Measurement to Strategic Management: Part I. Accounting Horizons, 15(1), pp.87-104. Karmel, T.S. and M. Jain. (1987). Comparison of purposive and random sampling schemes for
estimating capital expenditure. Journal of the American Statistical Association 82, pp.52-57.
Karpen, I. O., Bove, L. L., and Lukas, B. A. (2012). Linking service dominant logic and strategic
business practice: a conceptual model of a service-dominant orientation. Journal of Service Research, 15(1), pp.21–38.

REFERENCES 269
Katkalo, V.S., Pitelis, C.N. and Teece, D.J., 2010. Introduction: On the nature and scope of dynamic capabilities. Industrial and Corporate Change, 19(4), pp.1175-1186.
Katz, R. and Allen, T.J., (1982). Investigating the Not Invented Here (NIH) syndrome: A look at the
performance, tenure, and communication patterns of 50 R & D Project Groups. R&D Management, 12(1), pp.7-20.
Katz, D. and Kahn, R. (1978). The social psychology of organizations. 1st Ed. New York: Wiley. Kedia, B. L., and Bhagat, R. S. (1988). Cultural Constraints on Transfer of Technology across
Nations: Implications for Research in International and Comparative Management, Academy of Management Review (13:4), pp.559-571.
Kim, S. -H., Cohen, M. A., and Netessine, S. (2007). Performance contracting in after-sales service
supply chains. Management Science, 53(12), pp.1843–1858. Kindström, D. (2010). Towards a service-based business model - Key aspects for future
competitive advantage. European Management Journal, 28, pp.479-490. Kindström, D., and Kowalkowski, C. (2009). Development of industrial service offerings: a process
framework. Journal of Service Management, 20, pp.156-172. Kindström, D., Kowalkowski, C. and Sandberg, E. (2013). Enabling service innovation: a dynamic
capabilities approach, Journal of Business Research, 66(8), pp.1063-1073. Kindström, D., and Kowalkowski, C. (2014). Service innovation in product-centric firms: A
multidimensional business model perspective. The Journal of Business and Industrial Marketing, 29(2), pp.96–111.
King, A. and Lakhani, K. (2011). The Contingent Effect of Absorptive Capacity: An Open Innovation
Analysis. SSRN Electronic Journal. Klepper, S. (1996). Entry, exit, growth, and innovation over the product lifecycle. American
Economic Review 86(3), pp.562-583. Kline, P. (2014). An Easy Guide to Factor Analysis, Taylor & Francis. Kline, R. B. (2011). Principles and practice of structural equation modeling (3rd Ed.). New York:
Guilford Press. Kocoglu, I., Akgün, A. and Keskin, H. (2015). The Differential Relationship between Absorptive
Capacity and Product Innovativeness: A Theoretically Derived Framework. International Business Research, 8(7), p.108.
Kogut, B. and Zander, U. (1992). Knowledge of the Firm, Combinative Capabilities, and the
Replication of Technology. Organization Science, 3(3), pp.383-397. Kohtamäki, M., Partanen, J., Parida, V., and Wincent, J. (2013). Non-linear relationship between
industrial service offering and sales growth: The moderating role of network capabilities. Industrial Marketing Management, 42(8), pp.1374–1385. doi:10.1016/j.indmarman.2013.07.018

REFERENCES 270
Komulainen, H., (2014). The role of learning in value co-creation in new technological B2B services. Journal of Business & Industrial Marketing, 29(3), pp.238-252.
Kotabe, M., Jiang, C.X. and Murray, J.Y., (2011). Managerial ties, knowledge acquisition, realized
absorptive capacity and new product market performance of emerging multinational companies: A case of China. Journal of World Business, 46(2), pp.166-176.
Kotler, P. and Keller, K. (2006). Marketing Management Pearson Prentice Hall. Kotler, P. and Keller, K. (2012). Marketing management. 1st ed. Boston, Mass.: Prentice
Hall/Pearson. Kowalkowski, C., Gebauer, H., Kamp, B. and Parry, G. (2017). Servitization and deservitization:
Overview, concepts, and definitions. Industrial Marketing Management, 60, pp.4-10. Kowalkowski, C., Gebauer, H. and Oliva, R. (2017). Service growth in product firms: Past, present,
and future. Industrial Marketing Management, 60, pp.82-88. Kowalkowski, C., Kindström, D., Alejandro, T. B., Brege, S., and Biggemann, S. (2012). Service
infusion as agile incrementalism in action. Journal of Business Research, 65(6), pp.765–772.
Kowalkowski, C., Kindström, D. and Gebauer, H. (2013a). ICT as a catalyst for service business
orientation, Journal of Business and Industrial Marketing, 28 (6), pp. 506-513. Kowalkowski, C., Windahl, C., Kindström, D., and Gebauer, H. (2015). What service transition?
Rethinking established assumptions about manufacturers' service-led growth strategies. Industrial Marketing Management, 45, pp.59–69.
Kowalkowski, C., Witell, L. and Gustafsson, A. (2013b). Any way goes: identifying value
constellations for service infusion in SMEs, Industrial Marketing Management, 42 (1), pp.18-30.
Kranz, J., Hanelt, A. and Kolbe, L. (2016). Understanding the influence of absorptive capacity and
ambidexterity on the process of business model change - the case of on-premise and cloud-computing software. Information Systems Journal, 26(5), pp.477-517.
Kuhn, F (2006). Performance prediction for high-tech start-ups: Toward the quantifcation of an
integrative framework using fuzzy theory. Doctor thesis. The University of Warwick.
Kuhn, T.S. and Hawkins, D., (1963). The structure of scientific revolutions. American Journal of Physics, 31(7), pp.554-555.
Kumar, N., Stern, L. W. and Anderson, J. C. (1993). Conducting interorganizational research using
key informants. Academy of management journal, 36, pp.1633-1651. Kwong, K., and Wong, K. (2013). Partial Least Squares Structural Equation Modeling (PLS-SEM)
Techniques Using SmartPLS. Journal of Marketing Bulletin, 24(1-32). Lane, P. J., and Lubatkin, M. (1998). Relative absorptive capacity and interorganizational learning.
Strategic Management Journal, 19, pp.461-477. http://dx.doi.org/10.1002/(SICI)1097-0266(199805)19:5<461::AID-SMJ953>3.0.CO;2-L
REFERENCES 271
Lane, P. J., Salk, J. E., and Lyles, M. A. (2001). Absorptive capacity, learning and performance in international joint ventures. Strategic Management Journal, 22, pp.1139-1161. http://dx.doi.org/10.1002/smj.206
Latour, B. (1991). Technology is society made durable. A sociology of monsters: essays on power,
technology and domination, J. Law. London, Routledge: pp.103‐131. Laursen, K and Salter, A (2006). Open for innovation: The role of openness in explaining
innovation performance among U.K. manufacturing firms. Strategic Management Journal, 27(2), pp.131–150.
Law, K.S. and Wong, C.S. (1999). Multidimensional constructs in structural equation analysis: An
illustration using job perception and job satisfaction constructs, Academy of Management Review, 23(4), pp.741‐755.
Lawrence, P. and Lorsch, J. (1967). Differentiation and integration in complex organizations,
Administrative Science Quarterly, 12(1), pp. 1-47. Lazzarotti, V. and Manzini, R., (2009). Different modes of open innovation: a theoretical
framework and an empirical study. International journal of innovation management, 13(04), pp.615-636.
Leahy, D. and Neary, J. (2007). Absorptive capacity, R&D spillovers, and public policy.
International Journal of Industrial Organization, 25(5), pp.1089-1108. Lee, S., Yoo, S. and Kim, D. (2016). When is servitization a profitable competitive strategy?.
International Journal of Production Economics, 173, pp.43-53. Leiblein, M.J. and Miller, D.J. (2003). An empirical examination of transaction‐ and firm‐level
influences on the vertical boundaries of the firm, Strategic Management Journal, 24 (9), pp. 839‐859.
Lemke, F., Clark, M., and Wilson, H. (2011). Customer experience quality: an exploration in
business and consumer contexts using repertory grid technique. Journal of the Academy of Marketing Science, 39(6), pp.846–869.
Leo, P.Y., and Philippe, J. (2001). Offer of services by goods exporters: Strategic and marketing
dimensions. The Service Industries Journal, 21(2), pp.191–116. Lev, B. (2001). Intangibles: Management, measurement, and reporting. Washington, D.C.:
Brookings Institution Press Levinthal, D. (1988). A survey of agency models of organizations. Journal of Economic Behavior &
Organization, 9(2), pp.153-185. Levitt, T. (1969). The marketing mode, McGraw‐Hill, New York. Levitt, T. (1972). Production‐line approach to service, Harvard Business Review 50(5), p. 41. Levitt, T. (1983). After the sale is over. Harvard Business Review, 61(1), pp. 87–93.

REFERENCES 272
Levy, O. (2005). The influence of top management team attention patterns on global strategic posture of firms. Journal of Organizational Behavior, 26, pp. 797-819.
Lewis, M., Brandon-Jones, A., Slack, N., and Howard, M. (2010). Competing through operations
and supply: The role of classic and extended resource-based advantage. International Journal of Operations & Production Management, 30(9–10), pp.1032–1058.
Lewis, M. and Howard, M. (2009). Beyond products and services: shifting value generation in the
automotive supply chain. International Journal of Automotive Technology and Management, 9(1), pp. 4-17.
Li, H.T., Li, H.S. and Tian, Y.Z. (2013). The Impact Mechanism of the Servitization of Manufacturing
on Business Performance. Journal of Harbin Engineering University, 34, pp. 933-938. Lichtenthaler, U. (2008). Open Innovation in Practice: An Analysis of Strategic Approaches to
Technology Transactions. IEEE Transactions on Engineering Management, 55(1), pp.148-157.
Lichtenthaler, U. (2009). Absorptive capacity, environmental turbulence, and the
complementarity of organizational learning processes. Academy of Management Journal, 52(4), pp. 822–846.
Lichtenthaler, U. and Lichtenthaler, E. (2009). A Capability-Based Framework for Open
Innovation: Complementing Absorptive Capacity. Journal of Management Studies, 46(8), pp.1315-1338.
Lindahl, M., Sakao, T. and Carlsson, E., (2014). Actor's and System Maps for Integrated Product
Service Offerings–Practical Experience from Two Companies. Procedia CIRP, 16, pp.320-325.
Lindberg, N. and Nordin, F. (2008). From products to services and back again: Towards a new
service procurement logic. Industrial Marketing Management, 37(3), pp.292-300. Lindell, M. and D. Whitney (2001). Accounting for common method variance in cross-sectional
research designs. Journal of Applied Psychology 86(1), pp.114–121.
Loasby, B. J. (1998). The organisation of capabilities. Journal of Economic Behavior & Organization, 35(2), pp.139–160.
Lockett, H., Johnson, M., Evans, S., and Bastl, M. (2011). Product service systems and supply
network relationships: An exploratory case study. Journal of Manufacturing Technology Management, 22(3), p.293–313
Loomba, A. P. S. (1996). Linkages between product distribution and service support functions.
International Journal of Physical Distribution and Logistics Management, 26(4), p. 4–22. Lovelock, C., and Gummesson, E. (2004). Whither services marketing: In search of a new paradigm
and fresh perspectives. Journal of Service Research, 7(1), pp. 20–41.

REFERENCES 273
Lowry, P. B., and Gaskin, J. (2014). Partial Least Squares (PLS) Structural Equation Modeling (SEM) for Building and Testing Behavioral Causal Theory: When to Choose It and How to Use It. IEEE Transactions on Professional Communication, 57(2), pp.123-146. Doi: Doi 10.1109/Tpc.2014.2312452.
Lumpkin, GT and Dess, GG (1996). Clarifying the entrepreneurial orientation construct and linking
it to performance. Academy of Management Review, 21(1), pp. 135–172. Lumpkin, G.T. and Dess, G.G., (2001). Linking two dimensions of entrepreneurial orientation to
firm performance: The moderating role of environment and industry life cycle. Journal of business venturing, 16(5), pp.429-451.
Lusch, R. F., Vargo, S. L., and O’Brien, M. (2007). Competing through service: Insights from service-
dominant logic. Journal of Retailing, 83(1), pp.5–18. Lusch, R. F., Vargo, S. L., and Tanniru, M. (2010). Service, value networks and learning. Journal of
the academy of marketing science, 38, pp.19-31. Macdonald, E. K., Wilson, H., Martinez, V., and Toossi, A. (2011). Assessing value-in-use: a
conceptual framework and exploratory study. Industrial Marketing Management, 40(5), pp. 671–682.
Makri, C. and Neely, A., (2016). Critical incidents in complex service contracts: Safety challenges
and means of prevention. Cambridge Service Alliance, pp. 1-13 Maier, M. and Rechtin, E. (2002). The art of systems architecting. Boca Raton: CRC Press. Malhotra, M. K. and Sharma, S. (2008). Measurement equivalence using generalizability theory:
An examination of manufacturing flexibility dimensions. Decision Sciences, 39, pp.643-669.
Malhotra, N. K., Kim, S. S., and Patil, A. (2006). Common method variance in IS research: A comparison of alternative approaches and a reanalysis of past research. Management Science, 52(12), pp.1865-1883. DOI 10.1287/mnsc.1060.0597
Manzini, E. and Vezzoli, C. (2002). Product-Service Systems and Sustainability. Opportunities for
sustainable solutions, United Nations Environment Programme, Division of Technology Industry and Economics.
Manzini, E. and Vezzoli, C. (2003). A strategic design approach to develop sustainable product
service systems: examples taken from the ‘environmentally friendly innovation' Italian prize. Journal of Cleaner Production, 11(8), pp. 851-857.
Mathieu, V. (2001a). Product services: From a service supporting the product to a service
supporting the client. Journal of Business & Industrial Marketing, 16(1), 39–58. http://dx.doi.org/10.1108/08858620110364873.
Mathieu, V. (2001b). Service strategies within the manufacturing sector: Benefits, costs and
partnership. International Journal of Service Industry Management, 12(5), pp.451–475. http://dx.doi.org/10.1108/EUM0000000006093.

REFERENCES 274
Matthyssens, P. and Vandenbempt, K. (1998). Creating competitive advantage in industrial services, Journal of Business and Industrial Marketing, 13 (4/5), pp. 339-355.
Matthyssens, P., and Vandenbempt, K. (2008). Moving from basic offerings to value-added
solutions: Strategies, barriers and alignment. Industrial Marketing Management, 37(3), pp.316–328. http://dx.doi.org/10.1016/j.indmarman.2007.07.008.
Matthyssens, P., and Vandenbempt, K. (2010). Service addition as business market strategy:
Identification of transition trajectories. Journal of Service Management, 21(5), 693–714. http://dx.doi.org/10.1108/09564231011079101.
Mattsson, L. -G. (1973). Systems selling as a strategy on industrial markets. Industrial Marketing
Management, 3(2), pp.107–120. Marcoulides, G. A., and Saunders, C. (2006). PLS: A silver bullet? Mis Quarterly, 30(2), pp.Iii-Ix. Markeset, T. and Kumar, U. (2005). Product support strategy: Conventional versus functional
products. Journal of Quality in Maintenance Engineering, 11(1), pp. 53-67. Marshall, M. N. (1996). Sampling for qualitative research. [Research Support, Non-U.S. Gov't].
Family Practice, 13(6), p. 522-525. Martinez-Conesa, I., Soto-Acosta, P. and Carayannis, E.G., (2017). On the path towards open
innovation: Assessing the role of knowledge management capability and environmental dynamism in SMEs. Journal of Knowledge Management, 21(3).
Martinez, M. (2013). Co-creation of Value by Open Innovation: Unlocking New Sources of
Competitive Advantage. Agribusiness, 30(2), p.132-147. Martinez, V., Bastl, M., Kingston, J., and Evans, S. (2010). Challenges in transforming
manufacturing organisations into product-service providers. Journal of Manufacturing Technology Management, 21(4), 449–469. http://dx.doi.org/10.1108/1741038101 1046571.
McAuley, J., Duberley, J. and Johnson, P. (2007). Organization theory. Harlow, England: Prentice
Hall/Financial Times. McGuire, W.J. (1989). The structure of individual attitudes and attitude systems, in Pratkanis,
A.R., Breckler, S.J. and Greenwald, A.G. (Eds.), Attitude structure and function, pp. 37‐68, Erlbaum, Hillsdale, NJ.
Min, L., Wang, J. and Luo, Q. (2015). Does the Servitization Strategy Improve the Performance of
Manufacturing Enterprises in China?. American Journal of Industrial and Business Management, 05(05), pp.281-287.
Mina, A., Bascavusoglu-Moreau, E. and Hughes, A., (2014). Open service innovation and the firm's
search for external knowledge. Research Policy, 43(5), pp.853-866. Minbaeva, D., Pedersen, T., Björkman, I., Fey, C. F., and Park, H. J. (2003). MNC knowledge
transfer, subsidiary absorptive capacity, and HRM. Journal of International Business Studies, 34 (6), pp.586–599.

REFERENCES 275
Mintzberg, H. (1991). Learning 1, Planning 0 Reply to Igor Ansoff, Strategic Management Journal, 12 (6), pp. 463-466.
Mintzberg, H. and Waters, J. (1985). Of strategies, deliberate and emergent. Strategic
Management Journal, 6(3), pp.257-272. Mohr, J. and Spekman, R. (1994). Characteristics of partnership success: Partnership attributes,
communication behavior, and conflict resolution techniques. Strategic Management Journal, 15(2), pp.135-152.
Mooi, E. and Sarstedt, M., (2011). A concise guide to market research: The process, data, and
methods using IBM SPSS statistics. Mont, O. K. (2002). Clarifying the concept of product–service system. Journal of Cleaner
Production, 10(3), pp.237–245. http://dx.doi.org/10.1016/S0959-6526(01)00039–7. Mont, O. and Lindhqvist, T. (2003). The role of public policy in advancement of product service
systems, Journal of Cleaner Production, 11 (8), pp. 905-914. Monteverde K. and Teece DJ. (1982a). Supplier switching costs and vertical integration in the
automobile industry. Bell Journal of Economics 13. Pp. 206–213. Morgan, R.M. and Hunt, S.D. (1994). The commitment-trust theory of relationship marketing.
Journal of Marketing, 58 (July), pp. 20-38. Morse, J., Field, P. and Field, P. (1995). Qualitative research methods. 1st ed. Thousand Oaks,
Calif.: Sage Publications. Morris, M., Schindehutte, M., and Allen, J. (2005). The entrepreneur’s business model: Toward a
unified perspective, Journal of Business Research, 58, pp. 726-35. Munch, GL and Verkuilen, J (2005). Research Designs. In: Kimberly Kempf-Leonard (Ed.)
Encyclopedia of social measurement, vol. 3: 385–395. San Diego, California: Academic Press.
Narver, J. and Slater, S. (1990). The Effect of a Market Orientation on Business
Profitability. Journal of Marketing, 54(4), p.20. Neely, A. (2007). The servitisation of manufacturing: An analysis of global trends. Paper presented
at the 14th European Operations Management Association conference, Ankara. Neely, A. (2008). Exploring the financial consequences of the servitisation of manufacturing.
Operations Management Research, 1(2), pp.103–118. Neely, A. (2013). Servitization in Germany: An International Comparison. Cambridge Service
Alliance, pp.1-10. Neely, A., Benedettini, O., and Visnjic, I. (2011). The servitisation of manufacturing: Further
evidence. Academic paper presented at the 18th European Operations Management Association conference, Cambridge.

REFERENCES 276
Neu, W.A., and Brown, S.W. (2005). Forming successful business-to-business services in goodsdominant firms. Journal of Service Research, 8(1), pp.3–17.
Neuendorf, K. A. (2002). The content analysis guidebook. Thousand Oaks, CA: Sage. Neuman, W (1994). Social Research Methods: Qualitative and Quantitative Approaches, Boston,
Allyn and Bacon. Newbert, S.L. (2007). Empirical research on the resource‐based view of the firm: an assessment
and suggestions for future research, Strategic Management Journal, 28 (2), pp. 121‐146. Ng, I.C.L., Maull, R., and Yip, N. (2009). Outcome-based contracts as a driver for systems thinking
and service-dominant logic in service science: Evidence from the defence industry. European Management Journal, 27(6), pp.377-387.
Ng, I. C. L., Nudurupati, S. S., and Tasker, P. (2010). Value co-creation in the delivery of outcome-
based contracts for business-to-business service. AIM Working Paper Series, No. 77-May 2010. AIM Research, London. Retrieved from http://www.aimresearch.org/index.php?page=wp-no-77.
Ng, I.C.L. and Smith, L.A. (2012). An integrative framework of value, in Vargo, S.L. and Lusch, R.F.
(Eds), Special Issue – Toward a Better Understanding of the Role of Value in Markets and Marketing, Emerald Group Publishing Limited, Bingley, pp. 207-243, (Review of Marketing Research, Volume 9).
Nordin, F (2006). Outsourcing services in turbulent contexts: Lessons from a multinational
systems provider, Leadership & Organization Development Journal, 27 (4), pp. 296‐315. Nordin, F., and Kowalkowski, C. (2010). Solutions offerings: A critical review and
reconceptualisation. Journal of Service Management, 21(4), pp.441–459. Nunnally, J.C. (1988). Psychometric Theory. McGraw-Hill Book Company, Engelwood-Cliffs, NJ. Nunnally, J. C. and Bernstein, I. H. (1994). Psychometric theory, McGraw-Hill. Nuttavuthisit, K. (2010). If you can’t beat them, let them join: the development of strategies to
foster consumers’ co-creative practices. Business Horizons, 53(3), pp.315–324. Ocasio, W. (1997). Toward an attention-based view of the firm. Strategic Management
Journal, 18, pp.187-206. O'Connor, GC (2008). Major innovation as a dynamic capability: A systems approach. The Journal
of Product Innovation Management, 25, pp.313–330. O'Connor, GC, Ravichandran, T and Robeson, D (2008). Risk management through learning:
Management practices for radical innovation success. Journal of High Technology Management Research, 19, pp.70–82.
Oliva, R., Gebauer, H. and Brann, J.M. (2012). Separate or integrate? Assessing the impact of
separation between product and service business on service performance in manufacturing firms, Journal of Business-to-Business Marketing, 19 (4), pp. 309-334.

REFERENCES 277
Oliva, R., and Kallenberg, R. (2003). Managing the transition from products to services. International Journal of Service Industry Management, 14(2), pp.160–172.
Oliver, R. L. (1999). Value as excellence in consumption experience. In M. B. Holbrook (Ed.),
Consumer value: A framework for analysis and research (p. 43–62). New York: Routledge. Oltra, M.J. and M. Flor (2003). The Impact of Technological Opportunities and Innovative
Capabilities on Firms' Output Innovation. Creativity & Innovation Management, 12 (3), pp.137-145.
Ooghe, H. and De Prijcker, S. (2008). Failure process and causes of company bankruptcy: a
typology, Management Decision, Vol. 46, No. 2, p. 223-242. Opresnik, D. and Taisch, M. (2015). The value of Big Data in servitization. International Journal of
Production Economics, 165, pp.174-184. O'Reilly, C and Tushman, M (2004). The ambidextrous organization. Harvard Business Review:
pp.74–81. Osterwalder, A., Pigneur, Y., and Tucci, C. L. (2005). Clarifying business models: Origins, present
and future of the concept, Communications of the Association for Information Science (CAIS), 16, pp. 1-25.
Ouchi, W. G. (1979). A conceptual framework for the design of organizational control
mechanisms. Management Science, 25(9), p. 833-848. Palmatier, Robert W., Rajiv P. Dant, and Dhruv Grewal (2007). A Comparative Longitudinal
Analysis of Theoretical Perspectives of Interorganizational Relationship Performance. Journal of Marketing 71 (October), pp. 172–94
Palo, T., and Tähtinen, J. (2011). A network perspective on business models for emerging
technology-based services, Journal of Business & Industrial Marketing, 26 (5), pp. 377–388.
Panesar, S.S., Markeset, T., and Kumar, R. (2008). Industrial service innovation growth and
barriers. International Journal of Services, Technology & Management, 9(2), pp.174–193. Parasuraman, A., Zeithaml, V., Berry, L. L., (1991b). Refinement and reassessment of the
SERVQUAL scale. Journal of Retailing, 67 (4), pp.420-450. Parida, V., Sjödin, D.R., Wincent, J. and Kohtamäki, M., (2014). Mastering the transition to
product-service provision: Insights into business models, learning activities, and capabilities. Research-Technology Management, 57 (3), pp.44-52.
Park, J.-K. and Ro, Y. K. (2011). The impact of a firm's make, pseudo-make, or buy strategy on
product performance. Journal of Operations Management, 29, pp.289-304. Parry, G., Bustinza, O. F., and Vendrell-Herrero, F. (2012). Servitisation and value coproduction in
the UK music industry: An empirical study of consumer attitudes. International Journal of Production Economics, 135(1), pp.320–332. http://dx.doi.org/10. 1016/j.ijpe.2011.08.006.

REFERENCES 278
Parveen, S., Senin, A. A., and Umar, A. (2015). Organization Culture and Open Innovation: A Quadruple Helix Open Innovation Model Approach. International Journal of Economics and Financial Issues, 5(S), pp.335-342.
Pawar, K. S., Beltagui, A., and Riedel, J. C. K. H. (2009). The PSO triangle: Designing product, service
and organisation to create value. International Journal of Operations and Production Management, 29(5), pp.468–493.
Payne, A.F., Storbacka, K. and Frow, P. (2008). Managing the co‐creation of value, Journal of the
Academy of Marketing Science, 36 (1), pp. 83‐96. Pekkarinen, S. and Ulkuniemi, P. (2008). Modularity in developing business services by platform
approach, International Journal of Logistics Management, 9 (1), pp. 84–103. Penrose, E. (1959). The theory of the growth of the firm, Basil Blackwell, Oxford. Penttinen, E., and Palmer, J. (2007). Improving firm positioning through enhanced offerings and
buyer–seller relationships. Industrial Marketing Management, 36(5), pp.552–564. Perrons, R.K., Richards, M.G. and Platts, K., 2004. The effect of industry clockspeed on make-buy
decisions in the face of radical innovations: An empirical test. International Journal of Innovation Management, 8(04), pp.431-454.
Peteraf, M. A., and Barney, J. B. 2003. Unraveling the Resource-Based Tangle. Managerial and
Decision Economics, 24, pp. 309-323. Petroni, G., Venturini, K., and Verbano, C. (2011). Open innovation and new issues in R&D
organization and personnel management. The International Journal of Human Resource Management, 23(1), pp.147-173.
Phillips, L. W. (1981). Assessing measurement error in key informant reports: A methodological
note on organizational analysis in marketing. Journal of Marketing Research, pp.395-415. Philippe, J. (2001). Offer of services by goods exporters: Strategic and marketing dimensions. The
Service Industries Journal, 21(2), pp.91–116. Pine, B. J., and Gilmore, J. H. (1998). Welcome to the experience economy. Harvard Business
Review, 76(July-August), pp.97–105. Podsakoff, P. M., Mackenzie, S. B., Lee, J.-Y. and Podsakoff, N. P. (2003). Common method biases
in behavioral research: a critical review of the literature and recommended remedies. Journal of applied psychology, 88, 879.
Polit-O'hara, D. and Beck, C. T. (2006). Essentials of Nursing Research: Methods, Appraisal, and
Utilization, Lippincott Williams & Wilkins. Popper, K. (1972). Objective Knowledge: An Evolutionary Approach. Revised Edition. Oxford
University Press. Popper, K. (2003). Objective knowledge. 1st ed. Oxford: Clarendon Press.

REFERENCES 279
Popper, K. (2005). Logic of scientific discovery. 1st ed. London: Routledge. Poppo, L., and Zenger, T. (1998). Testing alternative theories of the firm: Transaction cost,
knowledge-based, and measurement explanations for make-or-buy decisions in information services. Strategic Management Journal, 19(9), pp. 853–877
Porter, M. E. (1979). How Competitive Forces Shape Strategy. Harvard Business Review (March-
April), pp.137-145. Porter, M.E. (1980). Competitive Strategy: Techniques for Analyzing Industries and Competitors,
FreePress, New York, NY. Porter, M.E. (1985). Competitive advantage: creating and sustaining superior performance, Free
Press, New York. Porter, M.E. (2008). The five competitive forces that shape strategy, Harvard Business Review, 86
(1), pp. 78-93, 137. Porter ME, Heppelmann JE (2015) How Smart, Connected Products are Transforming Companies.
Harvard Business Review 93(10), pp.96–114. Potter, W. and Levine‐Donnerstein, D. (1999). Rethinking validity and reliability in content
analysis. Journal of Applied Communication Research, 27(3), pp.258-284. Potts, J., Hartley, J., Banks, J., Burgess, J., Cobcroft, R., Cunningham, S. and Montgomery, L. (2008).
Consumer Co‐creation and Situated Creativity. Industry & Innovation, 15(5), pp.459-474. Powell, T. (1995). Total quality management as competitive advantage: A review and empirical
study. Strategic Management Journal, 16(1), pp.15-37. Powell, T. (1992). Organizational alignment as competitive advantage. Strategic Management
Journal, 13(2), p.119-134. Powell, W. (1998). Learning from collaboration: knowledge and networks in the biotechnology
and pharmaceutical industries, California Management Review, 40 (3), pp. 228-240. Powell, W., Koput, K. and Smith-Doerr, L. (1996). Interorganizational Collaboration and the Locus
of Innovation: Networks of Learning in Biotechnology. Administrative Science Quarterly, 41(1), pp.116.
Prahalad, C.K. and Ramaswamy, V., (2000). Co-opting customer competence. Harvard business
review, 78(1), pp.79-90. Prahalad, C.K. and Ramaswamy, V. (2004). The Future of Competition, Co-Creating Unique Value
with Customers, Harvard Business School Press, Boston, MA. Quinn, J.B., Doorley, T.L. and Paquette, P.C. (1990). Beyond Products: Services‐Based Strategy,
Harvard Business Review 68(2), p. 58. Quinn, R. E. and Cameron, K. (1983). Organizational life cycles and shifting criteria of
effectiveness: Some preliminary evidence. Management Science, 29(1), pp.33-51.

REFERENCES 280
Quinn, R. E., and Rohrbaugh, J. (1983). A spatial model of effectiveness criteria: Towards a competing values approach to organizational analysis. Management Science, 29(3), pp.363-377.
Rabetino, R., Kohtamäki, M., Lehtonen, H., and Kostama, H. (2015). Developing the concept of
life-cycle service offering. Industrial Marketing Management, 49, pp. 53–66. Raddats, C. and Easingwood, C., (2010). Services growth options for B2B product-centric
businesses. Industrial Marketing Management, 39(8), pp.1334–1345. Raddats, C., and Kowalkowski, C. (2014). A reconceptualization of manufacturers' service
strategies. Journal of Business-to-Business Marketing, 21(1), pp.19–34. http://dx.doi.org/ 10.1080/1051712X.2013.857500.
Ramanujam, V., Venkatraman, N., and Camillus, J. (1986). Multi-objective assessment of
effectiveness of strategic planning a discriminate analysis approach. Academy of Management Review, 29 (2), pp.347-372.
Ranjan, K. and Read, S. (2014). Value co-creation: concept and measurement. Journal of the
Academy of Marketing Science, 44(3), pp.290-315. Ravichandran, T., Lertwongsatien, C. and Lertwongsatien, C. (2005). Effect of Information Systems
Resources and Capabilities on Firm Performance: A Resource-Based Perspective. Journal of Management Information Systems, 21(4), pp.237-276.
Redlich, T., Krenz, P., Basmer, S., Buxbaum-Conradi, S., Wulf, S. and Wulfsberg, J. (2014). The
Impact of Openness on Value Co-creation in Production Networks. Procedia CIRP, 16, pp.44-49.
Reichardt, C. and Rallis, S. (1994). Qualitative and quantitative inquiries are not incompatible: A
call for a new partnership. New Directions for Program Evaluation, 1994(61), pp.85-91. Reilly, M., and Scott, P. S. (2010). Dynamic capabilities, absorptive capability and knowledge
sharing: a research agenda into explicating the antecedent factors conducive to subsidiary bargaining power. Paper presented at the 37th Annual Conference of the Academy of International Business AIB-UKI (UK & Ireland Chapter), Dublin, Ireland.
Reinartz, W., and Ulaga, W. (2008). How to sell services more profitably. Harvard Business Review,
86(5), pp.90–96. Richardson, G. B. (1972). The organization of industry. Economic Journal, 82, pp.883–896. Richardson, J. (2008). The business model: An integrative framework for strategy execution,
Strategic Change, 17(5/6), p.133-144. Robinson, T., Clarke‐Hill, C.M. and Clarkson, R. (2002). Differentiation through service: a
perspective from the commodity chemicals sector, Service Industries Journal, 22, (3), pp. 149‐166.

REFERENCES 281
Rosenkopf L, Nerkar A. (1999). Beyond local search: boundary-spanning, exploration and impact in the optical disc industry. Working paper, The Wharton School, University of Pennsylvania, Philadelphia, PA.
Rosenthal, S.R. (1992). Effective Product Design and Development. Irwin, Homewood, IL. Rossiter, J.R. (2002). The C‐OAR‐SE procedure for scale development in marketing, International
Journal of Research in Marketing, 19 (4), pp. 305‐335. Rossiter, J.R. (2005). Reminder: a horse is a horse, International Journal of Research in Marketing,
22(1), pp. 23‐25. Rossiter, J.R. (2011). Marketing measurement revolution: The C‐OAR‐SE method and why it must
replace psychometrics, European Journal of Marketing, 45(1), pp.1561‐1588. Rotharmel, F. (2013). Strategic management. New York: McGraw-Hill Irwin. Rothenberg, S. (2007). Sustainability through servicizing. MIT Sloan Management Review, 48(2),
p.83–91. Ruizalba, J., Soares, A., Rodríguez, M., and Jamilena, D. A (2016). Servitization strategies and co-
creation. In: Servitization Spring Conference 2016, 16-17 May 2016, Manchester. Ruiz-Alba, J., Soares, A., Rodríguez-Molina, M. and Frías-Jamilena, D., (2018). Servitization
strategies from customers’ perspective: the moderating role of co-creation. Journal of Business & Industrial Marketing. (In press)
Rungtusanatham, M., Forza, C., Koka, B., Salvador, F. and Nie, W. (2005). TQM across multiple
countries: convergence hypothesis versus national specificity arguments. Journal of Operations Management, 23, pp.43-63.
Rust, R.T. and Cooil, B. (1994). Reliability measures for qualitative data: Theory and implications.
Journal of Marketing Research, pp.1-14. Rust, R.T. and Miu, C. (2006). What academic research tells us about service, Communications of
the ACM, 49 (7), pp.49-54 Sakao, T., Sandström, G.Ö. and Matzen, D. (2009). Framing research for service orientation of
manufacturers through PSS approaches, Journal of Manufacturing Technology Management, 20 (5), pp. 754‐778.
Salter, A. and Tether, B.S. (2006). Innovation in Services: Through the Looking Glass of Innovation
Studies, Background paper for Advanced Institute of Management (AIM) Research’s Grand Challenge on Service Science, Advanced Institute of Management (AIM).
Saunders, M., Lewis, P., & Thornhill, A. (2012). Research methods for business students (6th Ed.).
Harlow, England; New York: Pearson. Schaffer, B. S. & Riordan, C. M. 2003. A review of cross-cultural methodologies for organizational
research: A best-practices approach. Organizational research methods, 6, 169-215.

REFERENCES 282
Schein, E. H. (1985). Organizational Culture and Leadership (1st ed.). San Francisco: Jossey-Bass. Schein, E.H. (2004). Organizational Culture and Leadership, 3rd Ed., Jossey-Bass, San Francisco,
CA. Schilling, M. A. (2009). Protecting or diffusing a technology platform: Trade offs in appropriability,
network externalities, and architectural control. In Platforms, markets and innovation, ed. A. Gawer, 192–218. Cheltenham, UK: Edward Elgar.
Schlesinger, L. and Heskett, J. (1991). The service-driven service company, Harvard Business
Review, 69 (5), pp. 71-81. Schmenner, R.W. (2009). Manufacturing, service, and their integration: Some history and theory,
International Journal of Operations & Production Management, 29 (5), pp. 431‐443. Schmidt, T. (2010). Absorptive capacity - one size fits all? A firm-level analysis of absorptive
capacity for different kinds of knowledge. Managerial and Decision Economics, 31, pp.1-18.
Schnell, R, Hill, PB & Esser, E (1993). Methoden der empirischen Sozialforschung (4th ed.).
München: Oldenbourg. Schroeder, A. and Kotlarsky, J. (2015). Digital resources and their role in advanced service
provision – a VRIN analysis, Proceedings of the Spring Servitization Conference, pp. 67-74.
Seidler, J. (1974). On using informants: a technique for collecting quantitative data and controlling
measurement error in organization analysis. American Sociological Review 39, pp.816-831.
Sharma, D. and Molloy, R. (1999). The Truth About Customer Solutions, Booz Allen & Hamilton:
14. Sharma, S. and Mahajan, V. (1980). Early Warning Indicators of Business Failure. Journal of
Marketing, 44(4), p.80. Shavelson, R.J. and Webb, N.M., (1991). Generalizability theory: A primer. Sage. Sheth, J. and Sisodia, R. (2005). A Dangerous Divergence: Marketing and Society. Journal of Public
Policy & Marketing, 24(1), pp.160-162. Silvestro, R. and Lustrato, P. (2015). Exploring the “mid office” concept as an enabler of mass
customization in services. International Journal of Operations & Production Management, 35(6), pp.866-894.
Simard, C. and West, J., (2006). Knowledge networks and the geographic locus of innovation.
Open innovation: researching a new paradigm, pp.220-240. Singleton, Jr., R. A. and Straits, B.C. (2005). Approaches to Social Research (3rd Ed.), Oxford
University Press, New York.

REFERENCES 283
Skarp, F., & Gadde, L. -E. (2008). Problem solving in the upgrading of product offerings — A case study from the steel industry. Industrial Marketing Management, 37(6), pp.725–737.
Slack, N. (2005). Operations strategy: will it ever realize its potential?” Gestão & Produção, 12 (3),
pp. 323‐332. Slack, N., Lewis, M. and Bates, H. (2004). The two worlds of operations management research and
practice: can they meet, should they meet?, International Journal of Operations & Production Management, 24 (4), pp. 372‐387.
Slater, S.F. and Narver, J.C., (1994). Does competitive environment moderate the market
orientation-performance relationship?. The Journal of Marketing, pp.46-55. Smith, A. (1776). An Inquiry into the Nature and Causes of the Wealth of Nations, W. Strahan & T.
Cadell, London. Smith, L., R. S. Maull and I. Ng (2012). Servitization and Operations Management: A Service
Dominant Logic Approach, International Journal of Operations & Production Management, 34:2, p. 242-269.
Smith, S. and Milligan, A. (2002). Uncommon Practice: People who Deliver a Great Brand
Experience, Financial Times Prentice Hall. Smith, T.M.F. (1983). On the validity of inferences from nonrandom sample. Journal of the Royal
Statistical Society. Series A (General) 146, pp.394-403. Smyth, M., and Williamson, E. (2004). Researchers and their "subjects”: ethics, power, knowledge,
and consent. Bristol, UK: Policy Press. Sousa, R., Voss, C.A., (2008). Contingency research in operations management practices. Journal
of Operations Management, 26 (6), pp.697–713. Spanos YE, and Lioukas S. (2001). An examination into the causal logic of rent generation:
contrasting Porter’s competitive strategy framework and the Resource-based perspective. Strategic Management Journal 22 (10), pp.907– 934.
Spiekermann, S. and Paraschiv, C., (2002). Motivating human–agent interaction: Transferring insights from behavioral marketing to interface design. Electronic Commerce Research, 2(3), pp.255-285.
Spithoven, A., Clarysse, B. and Knockaert, M. (2011). Building absorptive capacity to organise
inbound open innovation in traditional industries. Technovation, 31(1), pp.10-21. Spring, M. and Araujo, L. (2009). Service, services and products: re-thinking operations strategy,
International Journal of Operations & Production Management, 29, (5), pp.444-467. Spring, M., and Araujo, L. (2013). Beyond the service factory: Service innovation in manufacturing
supply networks. Industrial Marketing Management, 42(1), pp.59–70. Spring, M. and Araujo, L. (2017). Product biographies in servitization and the circular economy.
Industrial Marketing Management, 60, pp.126-137.

REFERENCES 284
Stevens, R. E., and Loudon, D. L. (2003). Surveying the Service Sector: A Pilot Study of the Effectiveness of Mail vs. Internet Approaches. Services Marketing Quarterly, 25(1), pp.75-84
Story, V. M., Raddats, C., Burton, J., Zolkiewski, J., and Baines, T. (2016). Capabilities for advanced services: A multi-actor perspective. Industrial Marketing Management. In press.
Stoughton, M., and Votta, T. (2003). Implementing service-based chemical procurement: Lessons
and results. Journal of Cleaner Production, 11, pp.839–849. Stremersch, S., Wuyts, S., and Frambach, R.T. (2001). The Purchasing of Full-Service Contracts: An
Exploratory Study within the Industrial Maintenance Market. Industrial Marketing Management, 30(1), pp.1-12.
Stock, G.N., N.P. Greis and W.A. Fischer (2001). Absorptive capacity and new product
development. Journal of High Technology Management Research 12 (1), pp.77-91. Straub, D.W., (1989). Validating instruments in MIS research. MIS quarterly, pp.147-169. Sümer, N. (2003). Personality and behavioral predictors of traffic accidents: testing a contextual
mediated model. Accident Analysis & Prevention, 35, pp.949-964. Suarez, F., Cusumano, M. and Kahl, S. (2013). Services and the Business Models of Product Firms:
An Empirical Analysis of the Software Industry. Management Science, 59(2), pp.420-435. Saunders, M., Lewis, P. and Thornhill, A. (2014). Research methods for business students. Harlow,
Essex, England: Pearson Education Limited. Symeou, P. and Kretschmer, T. (2013). Absorptive Capacity and Firm Performance: The
Moderating Impact of Modes of Diversification. In: 35th DRUID Celebration Conference. Barcelona, Spain.
Tabachnick, B. G. and Fidell, L. S. (2001). Using Multivariate Statistics, Allyn and Bacon. Takeuchi, H., (2006). The new dynamism of the knowledge-creating company. Knowledge
Economy, 1, pp.1-10. Tan, A. (2010). Service-oriented product development strategies. PhD. Technical University of
Denmark (DTU). Teece, D.J. (1986). Profiting from technological innovation: Implications for integration,
collaboration, licensing and public policy, Research Policy, 15 (6), pp. 285‐305. Teece, D.J. (2007). Explicating dynamic capabilities: the nature and microfoundations of
(sustainable) enterprise performance, Strategic Management Journal, 28 (13), pp.1319-1350.
Teece, D. J. (2010). Business models, business strategy and innovation, Long Range Planning, 43,
pp.172-194. Teece, D. (2017). Business models and dynamic capabilities. Long Range Planning. (In Press)

REFERENCES 285
Teece, D.J., Pisano, G. and Shuen, A. (1997). Dynamic capabilities and strategic management, Strategic Management Journal, 18 (7), pp. 509‐533.
Teece, D.J., Rumelt, R., Dosi, G. and Winter, S., (1994). Understanding corporate coherence:
Theory and evidence. Journal of economic behavior & organization, 23(1), pp.1-30. Tenenhaus, M., Esposito Vinzi, V., Chatelin, Y.-M., and Lauro, C. (2005). PLS path modeling.
Computational Statistics & Data Analysis, 48(1), pp.159–205. Terjesen, S., Patel, P. C. and Covin, J. G. (2011). Alliance diversity, environmental context and the
value of manufacturing capabilities among new high technology ventures. Journal of Operations Management, 29, pp.105-115.
Theyel, N. (2013). Extending open innovation throughout the value chain by small and medium-
sized manufacturers. International Small Business Journal, 31(3), pp.256-274. Thornhill, S (2006). Knowledge, innovation and firm performance in high- and low-technology
regimes. Journal of Business Venturing, 21, pp.687–703. Tidd, J (2001). Innovation management in context: Environment, organization and performance.
International Journal of Management Reviews, 3(3), pp.169–183. Tidd, J and Bessant, JR (2009). Managing innovation: Integrating technological, market and
organizational change (4th ed.). Chichester: Wiley. Tidd, J. and Bessant, J. (2016). Managing innovation. 1st ed. Chichester, West Sussex: Wiley. Tippins, M.J. and Sohi, R.S., (2003). IT competency and firm performance: is organizational
learning a missing link?. Strategic management journal, 24(8), pp.745-761. Tobin, J (1958). Estimation of relationships for limited dependent variables. Econometrica, 26(1),
pp.24–36. Todorova, G and Durisin, B (2007). Absorptive capacity: Valuing a reconceptualization. Academy
of Management Review, 32(3), pp.774–786. Tongco, M. (2007). Purposive Sampling as a Tool for Informant Selection. Ethnobotany Research
and Applications, 5, p.147. Topp, L., B. Barker & L. Degenhardt. (2004). The external validity of results derived from ecstasy
users recruited using purposive sampling strategies. Drug and Alcohol Dependence 73, pp.33-40.
Tripsas, M. and Gavetti, G., (2000). Capabilities, cognition, and inertia: Evidence from digital
imaging. Strategic management journal, pp.1147-1161. Tsai, K. (2009). Collaborative networks and product innovation performance: Toward a
contingency perspective. Research Policy, 38(5), pp.765-778.

REFERENCES 286
Tsai, W. (2001). Knowledge transfer in intraorganizational networks: Effects of network position and absorptive capacity on business unit innovation and performance. The Academy of Management Journal, 44(5), pp.996–1004.
Tsang, E. (2002). Acquiring knowledge by foreign partners from international joint ventures in a
transition economy: Learning-by-doing and learning myopia. Strategic Management Journal, 23(9), pp.835–854.
Tseng M.M.; Piller, F. (2003): Towards the customer centric enterprise, in M. Tseng and F. Piller
(eds.) The Customer Centric Enterprise, New York/Berlin: Springer, pp. 1-20. Tsinopoulos, C., Sousa, C. and Yan, J. (2017). Process innovation: open innovation and the
moderating role of the motivation to achieve legitimacy. Journal of product innovation management. (In press).
Tukker, A. (2004). Eight types of product-service system: Eight ways to sustainability? Experiences
from suspronet. Business Strategy and the Environment, 13 (4), pp. 246-260. Tukker, A. and Tischner, U. (2006). Product-services as a research field: past, present and future.
Reflections from a decade of research. Journal of Cleaner Production, 14(17), pp.1552-1556.
Turunen, T. (2011). Organizational forms in servitized manufacturing companies. In Proceedings
of the 18th international annual EurOMA conference. UK: Cambridge (3–6). Turunen, T. and Finne, M. (2014). The organisational environment’s impact on the servitization
of manufacturers. European Management Journal, 32(4), pp.603-615. Turunen, T., and Toivonen, M. (2011). Organizing customer-oriented service business in
manufacturing. Operations Management Research, 4(1), p.74. Tushman, M., Lakhani, K. and Lifshitz-Assaf, H. (2012). Open Innovation and Organization
Design. Journal of Organization Design, 1(1). Ueda, K., Takenaka, T. and Fujita, K. (2008). Toward value co-creation in manufacturing and
servicing. CIRP Journal of Manufacturing Science and Technology, 1(1), pp.53-58. Ulaga, W., and Loveland, J. M. (2014). Transitioning from product to service-led growth in
manufacturing firms: Emergent challenges in selecting and managing the industrial sales force. Industrial Marketing Management, 43(1), pp.113–125
Ulaga, W., and Reinartz, W. J. (2011). Hybrid offerings: How manufacturing firms combine goods
and services successfully. Journal of Marketing, 75(6), pp.5–23. Utterback, JM (2006). Mastering the dynamics of innovation. Boston, Mass.: Harvard Business
School. Uzzi, B (1997). Social structure and competition in interfirm networks: The paradox of
embeddedness. Administrative Science Quarterly, 42, pp. 35–67.

REFERENCES 287
Vandermerwe, S. and Rada, J. (1988). Servitization of Business: Adding Value by Adding Services, European Management Journal 6(4), pp. 315‐324.
Van de Ven, A.H. (2007). Engaged Scholarship. A Guide for Organizational and Social Research,
Oxford, Oxford University Press New York. Van de Vrande, V., C. Lemmens, W. Vanhaverbeke. (2006). Choosing governance modes for
external technology sourcing. R&D Management, 36(3), pp.347-363. Vargo, S.L. (2007). On A Theory of Markets and Marketing: From Positively Normative to
Normatively Positive. Australasian Marketing Journal, 15(1), pp.53- 60. Vargo, S.L. and Lusch, R.F. (2004). Evolving to a New Dominant Logic for Marketing, Journal of
Marketing 68(1), pp.1-17. Vargo, S. L., and Lusch, R. F. (2008). Service-dominant logic: continuing the evolution. Journal of
the Academy of Marketing Science, 36(1), pp.1–10. Vargo, S. L., Maglio, P. P., and Akaka, M. A. (2008). On value and value co-creation: a service
systems and service logic perspective. European Management Journal, 26(3), pp.145–152.
Vaus, DA de (2001). Research design in social research. London: SAGE. Vega-Jurado, J., Gutiérrez-Gracia, A., Fernández-de-Lucio, I. and Manjarrés-Henríquez, L. (2008).
The effect of external and internal factors on firms’ product innovation. Research Policy, 37(4), pp.616-632.
Vendrell‐Herrero, F., Parry, G., Bustinza, O. F., and O'Regan, N. (2014). Servitization as a Driver
for Organizational Change. Strategic Change, 23(5-6), pp.279-285. Veugelers, R. (1997). Internal R&D expenditures and external technology sourcing. Research
Policy, 26, pp.303-315. Viitamo, Esa (2013). Servitization as a Productive Strategy of a Firm: Evidence from the Forest-
Based Industries. ETLA Reports No 14. 7 August 2013. Viljakainen, A. and Toivonen, M., (2014). The futures of magazine publishing: Servitization and co-
creation of customer value. Futures, 64, pp.19-28. Visnjic, I. (2010). Servitization: When is service oriented business model innovation effective?
Service Science Management and Engineering, pp. 30-32. Visnjic-Kastalli, I., and Van Looy, B. (2013). Servitization: Disentangling the impact of service
business model innovation on manufacturing firm performance. Journal of Operations Management, 31(4), pp.169–180.
Visnjic, I., Wiengarten, F. and Neely, A. (2016). Only the Brave: Product Innovation, Service
Business Model Innovation, and Their Impact on Performance. Journal of Product Innovation Management, 33(1), pp.36-52.

REFERENCES 288
Vladimirova, D., Evans, S. and Martinez, V. (2011b). Drivers of transformation towards servitized organisational forms: a conceptual framework”, in: 25th Annual British Academy of Management (BAM) Conference “Building and Sustaining High Performance Organisations in a Challenging Environment, 13-15 September 2011, Aston Business School, Birmingham, UK.
Vladimirova, D.K., (2012). Transformation of traditional manufacturers towards servitized
organisations. Ph.D. Thesis. Cranfield University. Volberda, H. W., Foss, N. J., and Lyles, M. A. (2010). Absorbing the Concept of Absorptive Capacity:
How to Realize Its Potential in the Organization Field. Organization Science, 21(4), pp.931-951.
Voola, R. & O'cass, A. (2010). Implementing competitive strategies: the role of responsive and
proactive market orientations. European Journal of Marketing, 44, pp.245-266. Wagner, S. M., Grosse-Ruyken, P. T. & Erhun, F. (2012). The link between supply chain fit and
financial performance of the firm. Journal of Operations Management, 30, pp.340-353. Walker, H., Chicksand, D., Radnor, Z. and Watson, G. (2015). Theoretical perspectives in
operations management: An analysis of the literature, International Journal of Operations and Production Management, 35(8), pp.1182–1206. doi: 10.1108/ijopm-02-2014-0089.
Wang, N., Liang, H., Zhong, W., Xue, Y., and Xiao, J. (2012). Resource structuring or capability
building? An empirical study of the business value of information technology. Journal of Management Information Systems, 29, pp.325-367. doi:10.2753/MIS0742-1222290211.
Ward, Y. and Graves, A. (2007). Through-life management: The provision of total customer
solutions in the aerospace industry. International Journal of Services, Technology and Management, 8(6), pp.455-477.
Weber, R. (1990). Basis content analysis (2nd ed.), Sage Publications, Thousand Oaks, CA. Weigelt, C., and Sarkar, M.B. (2012). Performance implications of outsourcing for technological
innovations: Managing the efficiency and adaptability trade-off. Strategic Management Journal, 33, pp.189-216.
Weijermars, R., (2009). Competitive advantage from applying an E&P clockspeed
accelerator. First Break, 27(6). Wernerfelt, B. (1984). A resource‐based view of the firm. Strategic Management Journal, 5 (2),
pp. 171‐180. Westerman, G., Bonnet, D. and McAfee, A. (2014). Leading Digital: Turning Technology into
Business Transformation, Harvard Business Review Press. Whelan-Berry, K.S. and Somerville, K.A. (2010). Linking Change Drivers and the Organisational
Change Process: A Review and Synthesis, Journal of Change Management, 10 (2), pp. 175-193.

REFERENCES 289
Wiklund, J, Patzelt, H & Shepherd, D (2009). Building an integrative model of small business growth. Small Business Economics, 32, p. 351–374.
Wiklund, J & Shepherd, D (2005). Entrepreneurial orientation and small business performance: A
configurational approach. Journal of Business Venturing, 20: 71–91. Wikström, S. (1996a). The customer as co‐producer. European Journal of Marketing, Vol. 30 No.
4, p. 6‐19. Wilkinson, A., Dainty, A., and Neely, A. (2009). Changing times and changing timescales: The
servitization of manufacturing. International Journal of Operations & Production Management, 29(5).
Williams, A. (2007). Product service systems in the automobile industry: contribution to system
innovation?, Journal of Cleaner Production, 15, pp.1093-110. Williamson, O.E. (1975). Markets and hierarchies, analysis and antitrust implications: a study in
the economics of internal organization, Free Press, New York. Williamson, O.E. (1981). "The Economics of Organization: The Transaction Cost Approach," The
American Journal of Sociology, 87(3), pp. 548-577. Williamson, O.E. (1983a). Credible commitments: Using hostages to support exchange, American
Economic Review, 73 (4), pp. 519‐540. Williamson, O.E. (1983b), Organizational innovation: the transaction cost approach, in Ronen, J.
(Ed.), Entrepreneurship, Lexington Books, Lexington, MA, p. 101‐133. Williamson, O.E. (1985). The economic institutions of capitalism, Free Press, New York. Williamson, O.E. (1988). The logic of economic organization. Journal of Law, Economics and
Organization, 4 (1), pp. 65‐93. Williamson, O.E. (1989). Transaction cost economics. in Schnalen, R. and Willing, R. (Eds),
Handbook of Industrial Organization, pp. 136‐182, Elsevier Science, Amsterdam. Williamson, O.E. (1991). Comparative economic organization: The analysis of discrete structural
alternatives, Administrative Science Quarterly, 36 (2), pp. 269‐296. Williamson, O.E. (1996). The mechanisms of governance, Oxford University Press, Oxford. Williamson, O.E. (1998), Transaction Cost Economics: how it works; where it is headed, De
Economist, 146 (1), pp. 23‐58. Williamson, O.E. (1999). Strategy research: Governance and competence perspectives, Strategic
Management Journal, 20 (12), pp. 1087‐1108. Williamson, O.E. (2000). The New Institutional Economics: Taking stock, looking ahead, Journal of
Economic Literature, 38 (3), pp. 595‐613.

REFERENCES 290
Windahl, C., and Lakemond, N. (2006). Developing integrated solutions: The importance of relationships within the network. Industrial Marketing Management, 35(7), pp. 806–818.
Windahl, C., and Lakemond, N. (2010). Integrated solutions from a service-centered perspective:
Applicability and limitations in the capital goods industry. Industrial Marketing Management, 39(8), pp.1278–1290.
Winig, L. (2016). GE’s Big Bet on Data and Analytics Seeking opportunities in the Internet of
Things, GE expands into industrial analytics. MIT Sloan Management Review., p.1-16. Winter, S. G. (2006). The logic of appropriability: From Schumpeter to Arrow to Teece. Research
Policy, 35, pp.1100–1106. Winter, S. G. (2003). Understanding dynamic capabilities. Strategic Management Journal, 24,
pp.991-995. Wise, R., and Baumgartner, P. (1999). Go downstream – the new profit imperative in
manufacturing. Harvard Business Review, 77(5), pp.133–141. Wittenberg, R. (2001). Introduction to quantitative research methods. An investigative approach.
Kolner Zeitschrift Fur Soziologie Und Sozialpsychologie, 53(4), pp.806-807. Wold, H. (1975a). PLS path models with latent variables: the nipals approach. In H. M. Blalock, A.
Aganbegian, F. M. Borodkin, R. Boudon, and V. Cappecchi (Eds.), Quantitative sociology: international perspectives on mathematical and statistical modeling. New York: Academic Press
Wolpert, J.D. (2002). Breaking out of the innovation box. Harvard Business Review, 80(8), pp.77–
83. Yi, Y., and Gong, T. (2013). Customer value co-creation behavior: Scale development and
validation. Journal of Business Research, 66(9), pp.1279-1284. doi: DOI 10.1016/j.jbusres.2012.02.026
Zahay, D., Griffin, A., and Fredericks, E. (2004). Sources, uses, and forms of data in the new
product development process. Industrial Marketing Management 33, pp.657-666. http://dx.doi.org/10.1016/j.indmarman.2003.10.002
Zahra, S. A. (1991). Predictors and financial outcomes of corporate entrepreneurship: An
exploratory study. Journal of business venturing, 6, pp.259-285. Zahra, SA and George, G (2002). Absorptive capacity: A review, reconceptualization, and
extension. Academy of Management Review, 27(2), pp.185–203. Zahra, S. and Hayton, J. (2008). The effect of international venturing on firm performance: The
moderating influence of absorptive capacity. Journal of Business Venturing, 23(2), pp.195-220.
Zahra, S., Ireland, R. and Hitt, M. (2000). International Expansion by New Venture Firms:
International Diversity, Mode of Market Entry. Academy of Management Journal, 43(5), pp.925-950.

REFERENCES 291
Zahra, S. A., Sapienza, H. J. and Davidsson, P. (2006). Entrepreneurship and dynamic capabilities:
a review, model and research agenda. Journal of Management Studies, 43, pp.917–55. Zhang, X., and Chen, R. (2008). Examining the mechanism of the value cocreation with customers.
International Journal of Production Economics, 116(2), pp.242–250. Zhao, X., Lynch Jr, J. G. and Chen, Q. (2010). Reconsidering Baron and Kenny: Myths and truths
about mediation analysis. Journal of consumer research, 37, pp.197-206. Zhong, H. (2014). Game analysis of product-service integration. Journal of Industrial Engineering
and Management, 7(5). Zhou, Y.C. (2010) Research on the Implementation of Servitization Strategy of Manufacturing
Enterprise and Its Impact on the Performance. Ph.D. Thesis, Northwest University, Xi’an. Zhu, F., and Furr, N., (2017). Products to Platforms: Making the Leap. [online] Available at:
https://hbr.org/2016/04/products-to-platforms-making-the-leap [Accessed 17 Jan. 2017].
Zirger, B. J. and Maidique, M. A. (1990). A model of new product development: An empirical test.
Management science, 36 (7), pp.867-883. Zott, C., Amit, R., (2010). Business model design: an activity system perspective. Long Range Plan.
43 (2–3), pp. 216–226. Zott, C., Amit, R., Massa, L., (2011). The business model: recent developments and future
research. Journal of Management. 37 (4), pp.1019–1042.

292
APPENDIX A Study Questionnaire

Statement of Voluntary Consent To participate as a subject in the study described below Date: February 2016 Name of Study: Antecedents of Servitization Strategies in Manufacturing Firms and Servitization’s Impact on Firm Performance. A Theoretical and Empirical Analysis I am currently undertaking my doctoral thesis at the Claude Littner business school of the University of West London in England. Purpose of Study: Increasing the understanding of the current servitization strategies in manufacturing firms and their transition to service provision, especially the impact of servitization on firm performance. In essence servitization is a transformation journey - it involves firms (often manufacturing firms) developing the capabilities they need to provide services and solutions that supplement their traditional product offerings. As a volunteer participant in the above mentioned research, I understand that I will be asked to complete a survey that will ask questions related to my company servitization strategies. The survey typically takes about 10 to 15 minutes to complete. The information I provide will be used exclusively for this project and will in no way be associated with my name, address or any other identifiable information. I understand that I may withdraw from this study at any time and that any data given will not be used. The participant right to confidentiality will be always respected and any legal requirements on data protection will be adhered to. As well as data gathered will be stored securely and only used in anonymised and cumulative form for the purposes outlined above. After this research draw to close, the data will be destroyed. All participating companies will receive a collective results report once the data analysis process is complete. The results will, among other things, allow you to see the impact of servitization strategies on firm performance across many industries. This research is not funded by any corporate organization and does not represent any interests in any industry. I fully recognize that the survey requires the sacrifice of valuable time on your behalf, and I deeply appreciate your attention and contribution. For any clarification or inquiry, I remain at your disposal. Primary Researcher(s): Mohamad AbouFoul Contact Information: Mobile number: 07424045470, Email address: [email protected]

Part (1)
1) Company Name:------------------------------------------
2) Gender ☐Male ☐female
3) Your position in the company
☐CEO
☐Service Manager
☐Head of marketing
☐Head of operations
☐Others: (please specify)----------------------------------
4) Are you in the top management team of the company? ☐Yes ☐No
5) Please specify the number of years of working experience in the current industry:
☐0-2 years
☐2-5 years
☐5-10 years
☐10-15 years
☐More than 15 years
6) Please specify the total of years in your current position:
☐0-2 years
☐2-5 years
☐5-10 years
☐10-15 years
☐More than 15 years
7) Indicate your highest level of education
☐High School Education
☐Bachelor’s Degree
☐Master’s Degree
☐Professional Degree
☐Doctorate Degree
☐Others: (please specify)----------------------------------
8) Number of employee in the company 2017
☐Less than < 10
☐Between 10 and 49
☐Between 50 and 249
☐More than 250

9) Annual sales (Turnover in Millions £)
☐Less than <2
☐Between 2 and 10
☐Between 10 and 50
☐More than 50
10) Company sector (please specify your prevailing activity, Please choose ONLY one).
US SIC
Industry
7. Mining of metal ores
10. Manufacture of food products
18. Printing and reproduction of recorded media
19. Manufacture of coke and refined petroleum products
20. Manufacture of chemicals and chemical products
21. Manufacture of basic pharmaceutical products and pharmaceutical preparations
22. Manufacture of rubber and plastic products
23. Manufacture of other non-metallic mineral products
24. Manufacture of basic metals
25. Manufacture of fabricated metal products, except machinery and equipment
26. Manufacture of computer, electronic and optical products
27. Manufacture of electrical equipment
28. Manufacture of machinery and equipment
29. Manufacture of motor vehicles, trailers and semi-trailers
30. Manufacture of other transport equipment
32. Other manufacturing
11) Please specify the percentage share of services of total sales in 2016
☐0 %
☐Between 0% and 10%
☐Between 10% and 20%
☐Between 20% and 30%
☐More than 30%
12) Do you have a standalone service unites: ☐Yes ☐No
13) Some of our services can be purchased separate from our products: ☐Yes ☐No ☐Not
applicable
14) What is the age of your company?
☐Between 0-5
☐Between 6 and 9
☐More than 10
15) Are you participating in designing and implementing sertvitization strategies? ☐Yes ☐No

Part (2)
Section (1)
For each statement, show the extent of your agreement by selecting the box that reflects your
current view of your expectation as a whole.
Strongly disagree
(1)
Disagree
(2)
Somewhat disagree
(3)
Somewhat agree
(4)
Agree
(5)
Strongly agree
(6)
Our firm has taken over some of our customers’ business processes.
Our firm has taken over the operational functions of our products in customers’ businesses.
Our service contracts related to our products are designed to share ‘risk and reward’ with our customers, so our customers pay for the product’s capabilities, outcomes and results.
Our employees don’t understand the benefits of building long-term relationships with our customers.
The organization is investing in the necessary skills and capabilities to provide servitized offerings.
Our business cases and key performance indicators are linked to our roadmap.
Our firm continuously innovates its internal capabilities and processes to deliver new services with our products.
Our firm strategy is to build an industry platform to integrate suppliers and customers.
Our firm offers depend on the modularity of services and products.

Our firm delivers non-standardized service modules that reflect the requirements of the products we supply.
We help our customers to change their business model.
Our senior leaders are aligned around the strategic importance of servitization transformation.
Our senior leaders are actively promoting a vision of the future that involves servitized offerings.
We regularly review with the top management team our progress on servitization transformation.
Section (2)
For each statement, show the extent of your agreement by selecting the box that reflects your
current view of your expectation as a whole.
We have the capability to….
Strongly disagree
(1)
Disagree
(2)
Somewhat disagree
(3)
Somewhat agree
(4)
Agree
(5)
Strongly agree
(6)
The search for relevant information concerning our industry is everyday business in our company.
We develop new product/service by using assimilated new knowledge.
We develop new applications by applying assimilated new knowledge.
We find alternative uses for assimilated new knowledge.
We revise manufacturing/service processes based on acquired new knowledge.

We introduce product innovation based on acquired new knowledge.
Section (3)
For each statement, show the extent of your agreement by selecting the box that reflects your
current view of your expectation as a whole.
Strongly disagree
(1)
Disagree
(2)
Somewhat disagree
(3)
Somewhat agree
(4)
Agree
(5)
Strongly agree
(6)
Our firm tailors its product/service to our client’s needs.
Our customer’s comments and concerns are highly valued by our firm.
Our firm is responsive to its customer’s needs.
Our firm offers a non-standardized level of service to its customers.
Our client/end users are usually involved in the process of new product/service development.
Our products/services are usually developed in light of customer/client wishes and suggestions.
In order to acquire new know-how/technology we cooperate with our customers/clients (Never/Always).

Section (4)
For each statement, show the extent of your agreement by selecting the box that reflects your
current view of your expectation as a whole.
Section (5)
For each statement, show the extent of your agreement by selecting the box that reflects your
current view of your expectation as a whole.
Strongly disagree
(1)
Disagree
(2)
Somewhat disagree
(3)
Somewhat agree
(4)
Agree
(5)
Strongly agree
(6)
There is a risk that the financial cost associated with servitization may outweigh the benefits.
The performance of the solution we provide may not meet our customer’s expectations.
There is a risk that we will not be able to acquire the new capabilities needed to deliver the new solution.
There is a risk that our contract partner will be unable to fulfil contractual agreements.
The decision to implement servitization in our firm is very risky.
Low (1)
Medium (2)
High (3)
In our industry the change in customer preferences is….
The change in our competitive situation is ….
In our industry the technological change is ….
The change in our firm structure is ….
In our industry the rate of new product/service introduction to market is ….

Section (6)
For each statement, show the extent of your agreement by selecting the box that reflects your
current view of your expectation as a whole.
Strongly disagree
(1)
Disagree
(2)
Somewhat disagree
(3)
Somewhat agree
(4)
Agree
(5)
Strongly agree
(6)
Services are one of the core values of our corporate culture.
Our employee values are centred on solving customer problems.
Employees are aware of the importance of comprehensive and high-quality services and they act accordingly.
Section (7)
For each statement, show the extent of your agreement by selecting the box that reflects your
current view of your expectation as a whole.
Not at all
(1)
To a small extent
(2)
To some extent
(3)
To a moderate
Extent (4)
To a great
extent (5)
To a very great extent
(6)
To what extent is your company engaging directly with lead users and early adopters?
To what extent is your company participating in open source software development?
To what extent is your company exchanging ideas through submission websites and idea “jams” or idea competitions?
To what extent is your company participating in or setting up innovation networks/hubs with other firms, or sharing facilities with other organisations, inventors, researchers, etc.?
To what extent is your company involved with joint R&D?
To what extent is your company involved in joint purchasing of materials or inputs?
To what extent is your company involved in joint production of goods or services?

To what extent is your company involved in joint marketing/co-branding?
To what extent is your company participating in research consortia?
To what extent is your company involved in joint university research?
To what extent is your company licensing externally developed technologies?
To what extent is your company involved in outsourcing or contracting out R&D projects?
To what extent is your company providing contract research to others?
To what extent is your company involved in joint ventures, acquisitions and incubations?

Section (8)
For each statement, show the extent of your agreement by selecting the box that reflects your
current view of your expectation as a whole.
Compared to our competitors, In the past 3 years our…
Strongly decreased
(1)
decreased (2)
Somewhat decreased
(3)
Somewhat increased
(4)
Increased (5)
Strongly increased
(6)
Sales growth
Return on asset (ROS).
Return on sales (ROS).
Return on investment (ROI).
Market value.
General profitability.
Over all firm performance.
Entering new markets.
Customer satisfaction.
Speed to market.
Product/service quality.
Success rate for new product and service introduction.
Percentage of new products/services in the existing product/service portfolio.
Market share.
Please specify your knowledge about this survey area
☐Low knowledge
☐Moderate knowledge
☐High knowledge
Many thanks for answering the questions!!

303
APPENDIX B Firms Business Description

APPENDIX B. STUDY QUESTIONNAIRE 304
304
Example of servitized firms business description OSIRIS database Siemens AG is a technology company with activities in the fields of electrification, automation and
digitalization. The Company is also a supplier of systems for power generation and transmission, as
well as medical diagnosis. It operates through nine segments: Power and Gas; Wind Power and
Renewables; Energy Management; Building Technologies; Mobility; Digital Factory; Process Industries
and Drives; Healthineers, and Financial Services. The Company's product groups include automation,
building technologies, drive technology, healthcare, mobility, energy, financing, consumer products
and services. Its services include industry services, energy services, healthcare services, rail and road
solutions services, logistics and airport solutions services, home appliances services, and building
technologies services. Its market-specific solutions are focused on markets, such as aerospace,
automotive, data centers, fiber industry, food and beverage, and machinery and plant construction.
3M Company is a technology company. The Company operates through five segments. Its Industrial
segment serves markets, such as automotive original equipment manufacturer and automotive
aftermarket, electronics, appliance, paper and printing, packaging, food and beverage, and
construction. It’s Safety and Graphics segment serves markets for the safety, security and productivity
of people, facilities and systems. Its Health Care segment serves markets that include medical clinics
and hospitals, pharmaceuticals, dental and orthodontic practitioners, health information systems, and
food manufacturing and testing. It’s Electronics and Energy segment serves customers in electronics
and energy markets, including solutions for electronic devices; electrical products;
telecommunications networks, and power generation and distribution. Its Consumer segment serves
markets that include consumer retail, office business to business, home improvement, drug and
pharmacy retail, and other markets.

APPENDIX B. STUDY QUESTIONNAIRE 305
305
Example of not servitized firms business description Nabaltec AG is a Germany-based company that develops, manufactures and distributes functional
fillers for the plastics industry and raw materials for technical ceramics. The Company operates
through two segments: Functional Fillers and Technical Ceramics. The Functional Fillers segment
develops, produces and distributes halogen-free, flame retardant fillers on the basis of aluminum
hydroxide und the APYRAL trade name, as well as on the basis of magnesium hydroxide, under the
APYMAG brand. The Technical Ceramics segment produces calcined aluminum oxides and sintered
mullites, as well as complete ceramic bodies. In addition to that, the Company also performs chemical
and physical tests for inorganic raw materials and technical materials, mineral raw materials, mineral-
or ceramic-bound construction materials and inorganic binding agents, plus the analysis of geological
samples, filter dusts and fly ashes.
Allied Motion Technologies Inc. designs, manufactures and sells precision and specialty motion
control components and systems used in a range of industries. The Company serves various markets,
including vehicle, medical, aerospace and defense, electronics and industrial. It focuses on motion
control applications. It is engaged in developing electro-magnetic, mechanical and electronic motion
technology. It operates in the design and manufacture of motion control products, marketed to
original equipment manufacturers and end users segment. Its products are used in the handling,
inspection, and testing of components and final products, such as printers, tunable lasers and
spectrum analyzers for the fiber optic industry, and test and processing equipment for the
semiconductor manufacturing industry. Its products are used in a range of medical, industrial and
commercial aviation applications, such as dialysis equipment, industrial ink jet printers and cash
dispensers.

Last Page
Copyright © 2022 FDOKUMEN