Microbial Communities of Seawater and Coastal Soil ... - MDPI

Journal of Marine Systems xxx (2012) xxx–xxx
MARSYS-02295; No of Pages 13
Contents lists available at SciVerse ScienceDirect
Journal of Marine Systems
j ourna l homepage: www.e lsev ie r .com/ locate / jmarsys
Antarctic seawater temperature evaluation based on stable isotope measurements onAdamussium colbecki shells: kinetic effects vs. isotopic equilibrium
A. Trevisiol a,⁎, A. Bergamasco b, P. Montagna c,d,e, M. Sprovieri f, M. Taviani c,g
a University of Siena, Earth Science Department, Via Laterina, 8-53100 Siena, Italyb Institute of Marine Sciences, National Research Council, Arsenale-Tesa 104, Castello 2737/F-30122 Venice, Italyc Institute of Marine Sciences, National Research Council, Via Gobetti 101-40129 Bologna, Italyd Lamont-Doherty Earth Observatory, Columbia University, 61 Route 9W-10964 Palisades, USAe Laboratoire des Sciences du Climat et de l'Environnement, Bât. 12, Avenue de la Terrasse-91198 Gif-sur-Yvette, Francef Institute for Coastal Marine Environment, National Research Council, Via del Mare, 3-91021 Torretta Granitola (TP), Italyg Woods Hole Oceanographic Institution, Woods Hole, 266 Woods Hole Road-MA 02543, USA
⁎ Corresponding author.E-mail address: [email protected] (A. Trev
0924-7963/$ – see front matter © 2012 Published by Elhttp://dx.doi.org/10.1016/j.jmarsys.2012.10.012
Please cite this article as: Trevisiol, A., eAdamussium colbecki shells: kinetic effects
a b s t r a c t
a r t i c l e i n f oArticle history:Received 24 September 2011Received in revised form 7 October 2012Accepted 12 October 2012Available online xxxx
Keywords:Adamussium colbeckiBivalveRoss SeaAntarctic Shelf watersStable isotopesGrowth rateTemperature proxy
A year-long controlled growth experiment of 60 specimens of the Antarctic bivalve Adamussium colbecki wasconducted in Terra Nova Bay (Ross Sea) to evaluate its reliability as a suitable archive of water mass proper-ties. Nine shells were sub-sampled for stable oxygen and carbon isotope analysis to study the inter and intraspecimen variations. Slow-growing A. colbecki precipitate their calcitic shells close to the expected oxygenand carbon isotopic equilibrium, whereas the fast-growing individuals are strongly influenced by biogeneticand kinetic effects. The equation of Kim and O'Neil (1997) is considered a fair approximation for theδ18O-temperature relationship in slow-growing individuals. The reconstructed temperature is closer to themean experimental summer temperature than the annual one. This fact is interpreted as reflecting a possiblewinter decrease of shell growth, the salinity variation and the corrections for negative temperature on cali-brating the δ18O-temperature relationship. Our results support the hypothesis that A. colbecki might repre-sent a good archive for encoding Antarctic Shelf water summer temperature information. Furtherimprovements in adopting A. colbecki as a paleotemperature archive will require the evaluation of the sea-sonal variability in shell growth rate through culturing slow-growing A. colbecki individuals at near-freezing temperatures to calibrate a species-specific δ18O-temperature equation.
© 2012 Published by Elsevier B.V.
1. Introduction
Terra Nova Bay (Ross Sea) is a sector of Antarctica subjected tostrong katabatic wind events that drive a decrease in temperatureand an increase in salinity during polynya phenomena, especially attimes of sea ice formation and brine rejection (Del Negro andBergamasco, 2008; Jacobs and Giulivi, 1998; Petrelli et al., 2008).The newly formed high salinity shelf waters (HSSW) sink and fillthe deep Drigalsky Basin (Fusco et al., 2009). These localized andtime-constrained phenomena (Bergamasco et al., 2002, 2004;Petrelli et al., 2008) strongly influence a) the whole western RossSea and, after spilling over the shelf break, and b) ocean ventilationduring Antarctic Bottom Water formation (Celussi et al., 2010;Rivaro et al., 2010). Moreover, deep ventilation controls the dynamicsand equilibrium of the thermohaline circulation, and thus plays animportant role in climate modulation (Ganachaud and Wunsch,2000).
isiol).
sevier B.V.
t al., Antarctic seawater te..., J. Mar. Syst. (2012), http:/
A project aiming at coupling HSSW time series, its formation andspreading (Orsi andWiederwohl, 2009; Orsi et al., 2001), versus biolog-ical signals encoded in organisms, was launched in 2005 (Polar DOVE:Polar Deep Ocean VEntilation Project; PNRA, 2006, 2007). The experi-ment discussed here was specifically set to verify the feasibility ofusing the endemic Antarctic pectinid Adamussium colbecki (Smith,1902) (Mollusca, Bivalvia) as a reliable bio-recorder of water masschemical and physical characteristics both at high time resolution(seasonal–monthly) and high accuracy. Among the common Antarcticbenthic species A. colbecki presents the advantage that its biology,population distribution and growing patterns are relatively wellknown, providing a robust basis to be a target species for environ-mental studies (Berkman, 1990; Cattaneo-Vietti et al., 1997; Chiantoreet al., 2003; Heilmayer and Brey, 2003; Heilmayer et al., 2003;Lohmann et al., 2001). In particular A. colbecki was selected as a suit-able candidate for running in situ controlled growth experiments be-cause of:
1) longevity (individuals living up to 20 years: Berkman, 1990) thatpermits exploring a wide temporal window and comparing differ-ent decades;
mperature evaluation based on stable isotope measurements on/dx.doi.org/10.1016/j.jmarsys.2012.10.012
2 A. Trevisiol et al. / Journal of Marine Systems xxx (2012) xxx–xxx
2) abundance in the Antarctic coastal benthos (with density exceed-ing 60 individuals/m2: Berkman, 1990; Chiantore et al., 2003);
3) wide bathymetric range (0–1355 m: Schiaparelli and Linse,2006); thus encompassing a variety of oceanographic situationsand pressure regimes;
4) geographic range, being circumpolar in its distribution (Schiaparelliand Linse, 2006) in principle making our results applicable to otherAntarctic basins;
5) environmental adaptability, regarding substrates and hydrologicalrequirements.
Furthermore, pectinids, including A. colbecki or allied species inthe genus Adamussium (Thiele, 1934) (Berkman et al., 1998; Beu andTaviani, in press; Quaglio et al., 2010; Taviani et al., 1998), are knownfrom Cenozoic deposits in Antarctica representing a valid source ofpalaeoenvironmental information (e.g., Beu and Dell, 1989; CapeRoberts Science Team, 1998, 1999; Jonkers, 1998a, 1998b, 2003;Staubwasser et al., 2004; Taviani, 2001; Taviani and Beu, 2001, 2003;Taviani et al., 2001; Taviani et al., 2010). More specifically, fossilAntarctic bivalves have been convincingly proven to be useful inestablishing past key environmental seawater conditions based uponstable isotope and other chemical signatures in their shells (e.g.,Lavelle, 2001; Lavelle et al., 2001; Marcano et al., 2009; Taviani andZahn, 1998; Whitehead et al., 2006).
In fact, it is generally accepted that stable oxygen and carbon isotopicratios (δ18O, δ13C), as well as minor and trace element composition ofbiogenic carbonate, are suitable to obtain information on temperature,salinity and primary production (Lynch-Stieglitz, 2003). The use of stableisotope ratios as environmental proxies dates back to the 1950s (Epsteinet al., 1953), having been applied with success to foraminifera, corals,ostracoda and molluscs (Lea, 2003). From the initial studies, it appearedfundamental to establish whether the biogenic carbonates mineralise inisotopic equilibrium with the surrounding water, i.e. the δ18O and δ13Care the same as those of inorganic carbonate (calcite or aragonite) precip-itated in thermodynamic equilibrium with the ambient seawater (Kimand O'Neil, 1997). In the case of isotopic equilibrium, it is possible to es-tablish a relation among carbonate δ18O, water temperature and waterδ18O (δ18Ow, related to salinity), and, to a certain degree, between δ13Cand primary production (Fenger et al., 2007; Gillikin et al., 2006;Hickson et al., 1999; Maier and Titshack, 2010). However, in case ofnon-isotopic equilibrium, i.e. in the presence of biogenic and kineticeffects (Adkins et al., 2003; McConnaughey, 1989), it is still possibleto define a relationship between isotope ratios and environmentalconditions, but it is necessary to perform species-specific calibra-tions (Wanamaker et al., 2006). This calibration exercise for mol-luscs is usually conducted through growth experiments, both in thefield (Hickson et al., 1999; Owen et al., 2002b; Schöne et al., 2007)or under controlled conditions in the laboratory (Owen et al.,2002a; Wanamaker et al., 2007).
We carried out a controlled growth experiment with some A. colbeckispecimens that were growing for one year in Terra Nova Bay, near moor-ing instruments recording in continuum water temperature, salinity andcurrent velocity. The shells of six A. colbecki that survived the experimentwere sampled for δ18O and δ13C along the maximum growth direction.We collected carbonate material of the shell portions formed during theculturing period as well as shell material produced during approximatelytwo years prior to the culture period for inter-specimen comparison. Inaddition, three A. colbecki shells were sampled in two different portionscharacterised by different growth rate for intra specimen comparison.The objective of these analyses was to verify whether A. colbecki precipi-tates its shell in isotopic equilibrium with the ambient seawater, using astatistically significant set of specimens living in controlled conditionsand characterised by different annual growth rates and ages. This paperaims to extend the results by Barrera et al. (1990) obtained on a singleadult specimen of A. colbecki without direct comparison with in-situambient conditions, and to integrate the sclerocronological study by
Please cite this article as: Trevisiol, A., et al., Antarctic seawater teAdamussium colbecki shells: kinetic effects ..., J. Mar. Syst. (2012), http:/
Heilmayer et al. (2003) based on δ18O measurements of 2 specimens ofA. colbecki.
Thepresentwork focuses on theuse of δ18O analysis ofA. colbecki shellmaterial as a temperature proxy, paying attention to the differences inisotopic equilibrium among specimens and evaluating experimental ac-curacy and natural variability. We compare different temperature equa-tions, known in the literature, and establish which one better explainsthe δ18O vs. temperature relationship for A. colbecki, discussing potentialreasons for the differences betweenmeasured and expected temperatureat different time scale.We also consider the impacts of salinity, changes ingrowth rate and specific polar conditions on the δ18O vs. temperature re-lationship. In this paper we focus on δ18O and the seawater physico-chemical parameters using the δ13C data of A. colbecki solely to verifythe isotopic equilibrium conditions. Unfortunately, the lack of seawaterδ13C and chlorophyll data during the experiment prevented the interpre-tation of δ13C vs. primary production relationship (Gillikin et al., 2006;Hickson et al., 1999; Krantz et al., 1987) in the region of interest(Rhodes et al., 2009).
2. Materials and methods
2.1. Experimental design and instrumental records
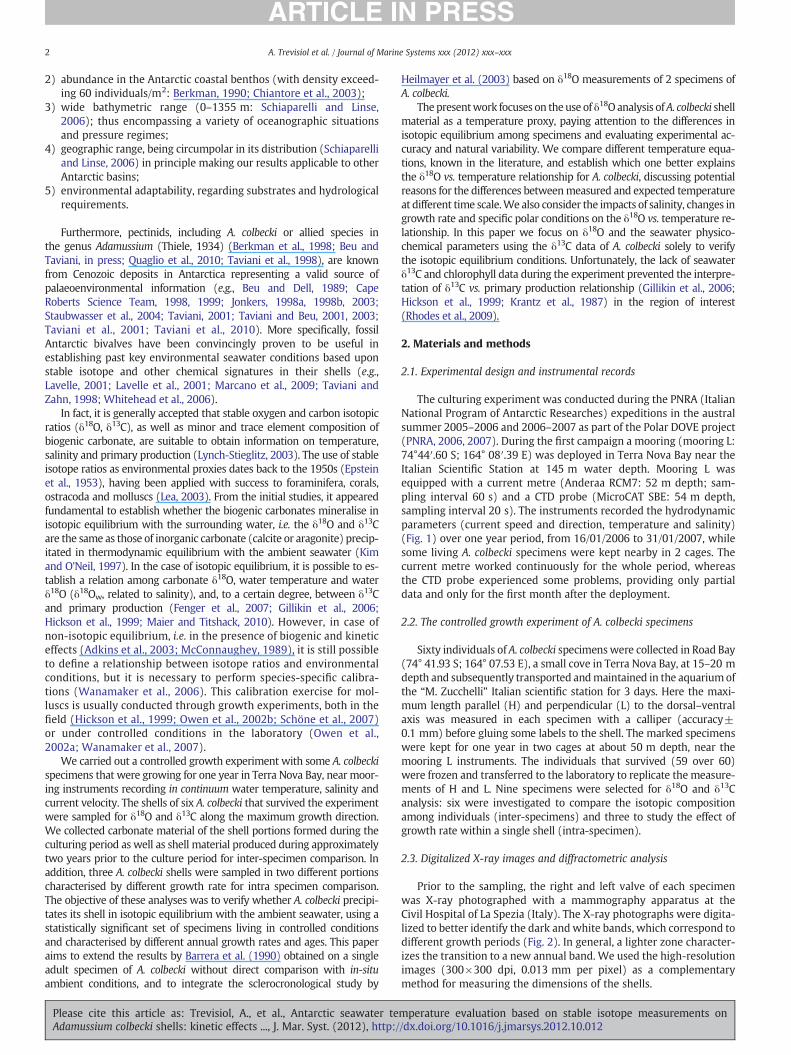
The culturing experiment was conducted during the PNRA (ItalianNational Program of Antarctic Researches) expeditions in the australsummer 2005–2006 and 2006–2007 as part of the Polar DOVE project(PNRA, 2006, 2007). During the first campaign a mooring (mooring L:74°44′.60 S; 164° 08′.39 E) was deployed in Terra Nova Bay near theItalian Scientific Station at 145 m water depth. Mooring L wasequipped with a current metre (Anderaa RCM7: 52 m depth; sam-pling interval 60 s) and a CTD probe (MicroCAT SBE: 54 m depth,sampling interval 20 s). The instruments recorded the hydrodynamicparameters (current speed and direction, temperature and salinity)(Fig. 1) over one year period, from 16/01/2006 to 31/01/2007, whilesome living A. colbecki specimens were kept nearby in 2 cages. Thecurrent metre worked continuously for the whole period, whereasthe CTD probe experienced some problems, providing only partialdata and only for the first month after the deployment.
2.2. The controlled growth experiment of A. colbecki specimens
Sixty individuals of A. colbecki specimenswere collected in Road Bay(74° 41.93 S; 164° 07.53 E), a small cove in Terra Nova Bay, at 15–20 mdepth and subsequently transported andmaintained in the aquariumofthe “M. Zucchelli” Italian scientific station for 3 days. Here the maxi-mum length parallel (H) and perpendicular (L) to the dorsal–ventralaxis was measured in each specimen with a calliper (accuracy±0.1 mm) before gluing some labels to the shell. The marked specimenswere kept for one year in two cages at about 50 m depth, near themooring L instruments. The individuals that survived (59 over 60)were frozen and transferred to the laboratory to replicate the measure-ments of H and L. Nine specimens were selected for δ18O and δ13Canalysis: six were investigated to compare the isotopic compositionamong individuals (inter-specimens) and three to study the effect ofgrowth rate within a single shell (intra-specimen).
2.3. Digitalized X-ray images and diffractometric analysis
Prior to the sampling, the right and left valve of each specimenwas X-ray photographed with a mammography apparatus at theCivil Hospital of La Spezia (Italy). The X-ray photographs were digita-lized to better identify the dark andwhite bands, which correspond todifferent growth periods (Fig. 2). In general, a lighter zone character-izes the transition to a new annual band. We used the high-resolutionimages (300×300 dpi, 0.013 mm per pixel) as a complementarymethod for measuring the dimensions of the shells.
mperature evaluation based on stable isotope measurements on/dx.doi.org/10.1016/j.jmarsys.2012.10.012
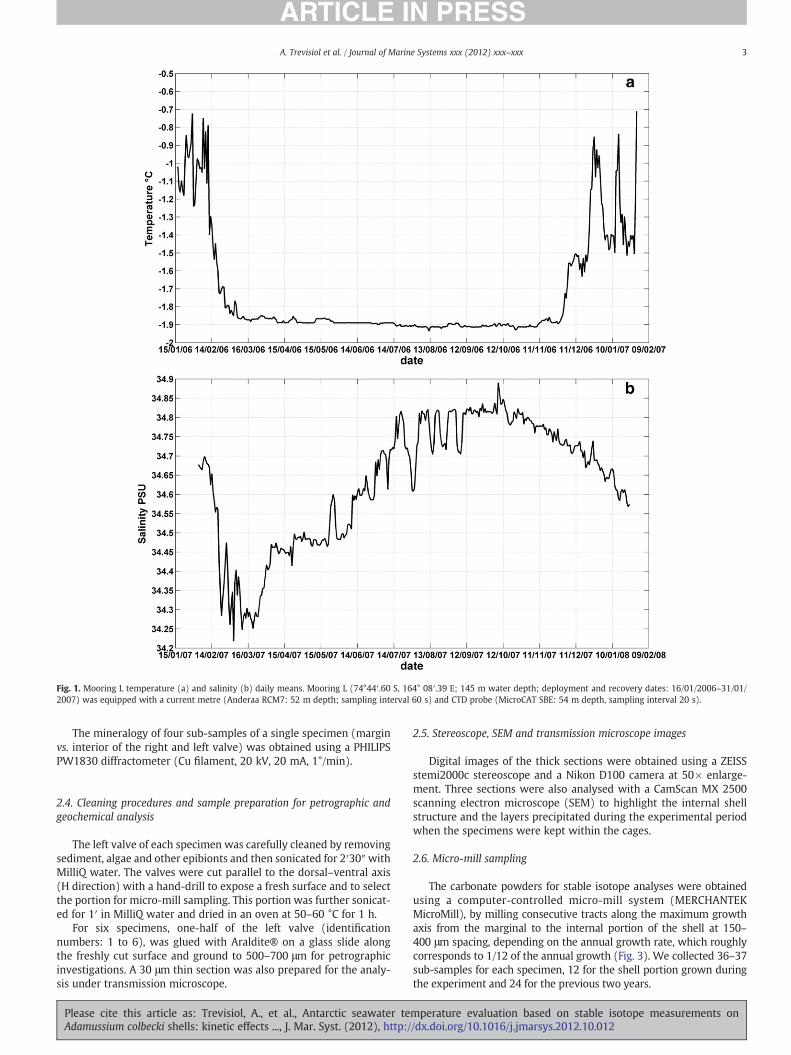
Fig. 1. Mooring L temperature (a) and salinity (b) daily means. Mooring L (74°44′.60 S, 164° 08′.39 E; 145 m water depth; deployment and recovery dates: 16/01/2006–31/01/2007) was equipped with a current metre (Anderaa RCM7: 52 m depth; sampling interval 60 s) and CTD probe (MicroCAT SBE: 54 m depth, sampling interval 20 s).
3A. Trevisiol et al. / Journal of Marine Systems xxx (2012) xxx–xxx
The mineralogy of four sub-samples of a single specimen (marginvs. interior of the right and left valve) was obtained using a PHILIPSPW1830 diffractometer (Cu filament, 20 kV, 20 mA, 1°/min).
2.4. Cleaning procedures and sample preparation for petrographic andgeochemical analysis
The left valve of each specimen was carefully cleaned by removingsediment, algae and other epibionts and then sonicated for 2′30″withMilliQ water. The valves were cut parallel to the dorsal–ventral axis(H direction) with a hand-drill to expose a fresh surface and to selectthe portion for micro-mill sampling. This portion was further sonicat-ed for 1′ in MilliQ water and dried in an oven at 50–60 °C for 1 h.
For six specimens, one-half of the left valve (identificationnumbers: 1 to 6), was glued with Araldite® on a glass slide alongthe freshly cut surface and ground to 500–700 μm for petrographicinvestigations. A 30 μm thin section was also prepared for the analy-sis under transmission microscope.
Please cite this article as: Trevisiol, A., et al., Antarctic seawater teAdamussium colbecki shells: kinetic effects ..., J. Mar. Syst. (2012), http:/
2.5. Stereoscope, SEM and transmission microscope images
Digital images of the thick sections were obtained using a ZEISSstemi2000c stereoscope and a Nikon D100 camera at 50× enlarge-ment. Three sections were also analysed with a CamScan MX 2500scanning electron microscope (SEM) to highlight the internal shellstructure and the layers precipitated during the experimental periodwhen the specimens were kept within the cages.
2.6. Micro-mill sampling
The carbonate powders for stable isotope analyses were obtainedusing a computer-controlled micro-mill system (MERCHANTEKMicroMill), by milling consecutive tracts along the maximum growthaxis from the marginal to the internal portion of the shell at 150–400 μm spacing, depending on the annual growth rate, which roughlycorresponds to 1/12 of the annual growth (Fig. 3). We collected 36–37sub-samples for each specimen, 12 for the shell portion grown duringthe experiment and 24 for the previous two years.
mperature evaluation based on stable isotope measurements on/dx.doi.org/10.1016/j.jmarsys.2012.10.012
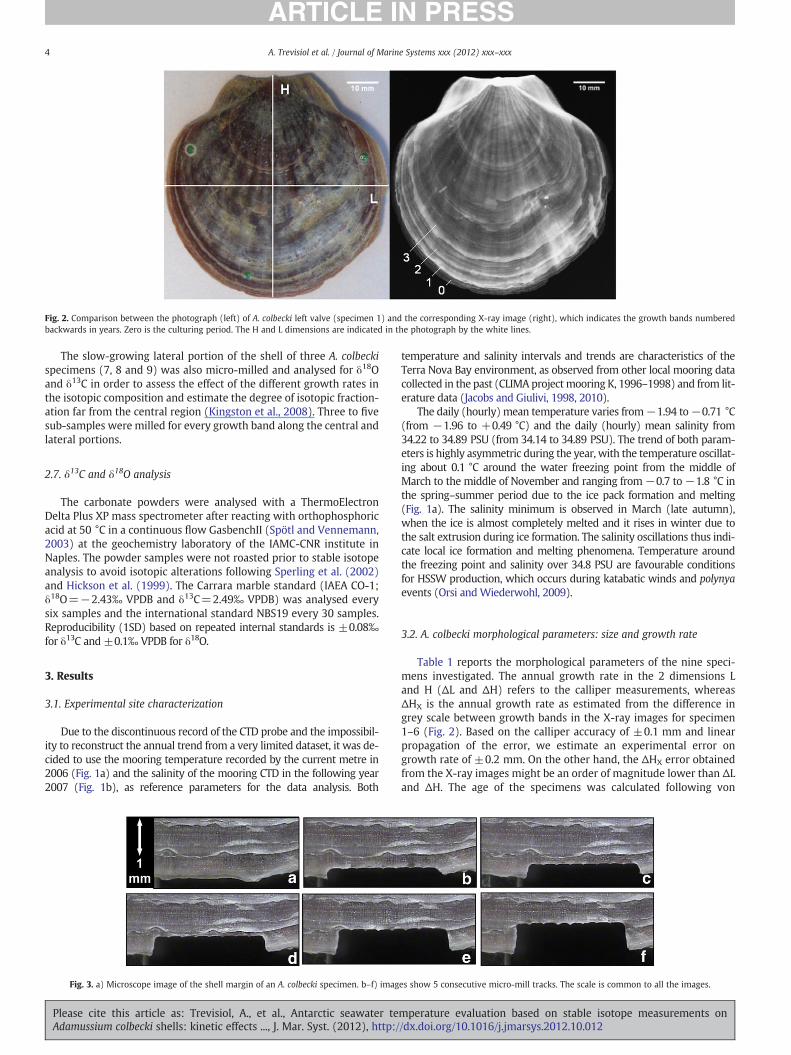
Fig. 2. Comparison between the photograph (left) of A. colbecki left valve (specimen 1) and the corresponding X-ray image (right), which indicates the growth bands numberedbackwards in years. Zero is the culturing period. The H and L dimensions are indicated in the photograph by the white lines.
4 A. Trevisiol et al. / Journal of Marine Systems xxx (2012) xxx–xxx
The slow-growing lateral portion of the shell of three A. colbeckispecimens (7, 8 and 9) was also micro-milled and analysed for δ18Oand δ13C in order to assess the effect of the different growth rates inthe isotopic composition and estimate the degree of isotopic fraction-ation far from the central region (Kingston et al., 2008). Three to fivesub-samples were milled for every growth band along the central andlateral portions.
2.7. δ13C and δ18O analysis
The carbonate powders were analysed with a ThermoElectronDelta Plus XP mass spectrometer after reacting with orthophosphoricacid at 50 °C in a continuous flow GasbenchII (Spötl and Vennemann,2003) at the geochemistry laboratory of the IAMC-CNR institute inNaples. The powder samples were not roasted prior to stable isotopeanalysis to avoid isotopic alterations following Sperling et al. (2002)and Hickson et al. (1999). The Carrara marble standard (IAEA CO-1;δ18O=−2.43‰ VPDB and δ13C=2.49‰ VPDB) was analysed everysix samples and the international standard NBS19 every 30 samples.Reproducibility (1SD) based on repeated internal standards is ±0.08‰for δ13C and ±0.1‰ VPDB for δ18O.
3. Results
3.1. Experimental site characterization
Due to the discontinuous record of the CTD probe and the impossibil-ity to reconstruct the annual trend from a very limited dataset, it was de-cided to use the mooring temperature recorded by the current metre in2006 (Fig. 1a) and the salinity of the mooring CTD in the following year2007 (Fig. 1b), as reference parameters for the data analysis. Both
Fig. 3. a) Microscope image of the shell margin of an A. colbecki specimen. b–f) imag
Please cite this article as: Trevisiol, A., et al., Antarctic seawater teAdamussium colbecki shells: kinetic effects ..., J. Mar. Syst. (2012), http:/
temperature and salinity intervals and trends are characteristics of theTerra Nova Bay environment, as observed from other local mooring datacollected in the past (CLIMA projectmooring K, 1996–1998) and from lit-erature data (Jacobs and Giulivi, 1998, 2010).
The daily (hourly) mean temperature varies from−1.94 to−0.71 °C(from −1.96 to +0.49 °C) and the daily (hourly) mean salinity from34.22 to 34.89 PSU (from 34.14 to 34.89 PSU). The trend of both param-eters is highly asymmetric during the year, with the temperature oscillat-ing about 0.1 °C around the water freezing point from the middle ofMarch to the middle of November and ranging from−0.7 to−1.8 °C inthe spring–summer period due to the ice pack formation and melting(Fig. 1a). The salinity minimum is observed in March (late autumn),when the ice is almost completely melted and it rises in winter due tothe salt extrusion during ice formation. The salinity oscillations thus indi-cate local ice formation and melting phenomena. Temperature aroundthe freezing point and salinity over 34.8 PSU are favourable conditionsfor HSSW production, which occurs during katabatic winds and polynyaevents (Orsi andWiederwohl, 2009).
3.2. A. colbecki morphological parameters: size and growth rate
Table 1 reports the morphological parameters of the nine speci-mens investigated. The annual growth rate in the 2 dimensions Land H (ΔL and ΔH) refers to the calliper measurements, whereasΔHX is the annual growth rate as estimated from the difference ingrey scale between growth bands in the X-ray images for specimen1–6 (Fig. 2). Based on the calliper accuracy of ±0.1 mm and linearpropagation of the error, we estimate an experimental error ongrowth rate of ±0.2 mm. On the other hand, the ΔHX error obtainedfrom the X-ray images might be an order of magnitude lower than ΔLand ΔH. The age of the specimens was calculated following von
es show 5 consecutive micro-mill tracks. The scale is common to all the images.
mperature evaluation based on stable isotope measurements on/dx.doi.org/10.1016/j.jmarsys.2012.10.012
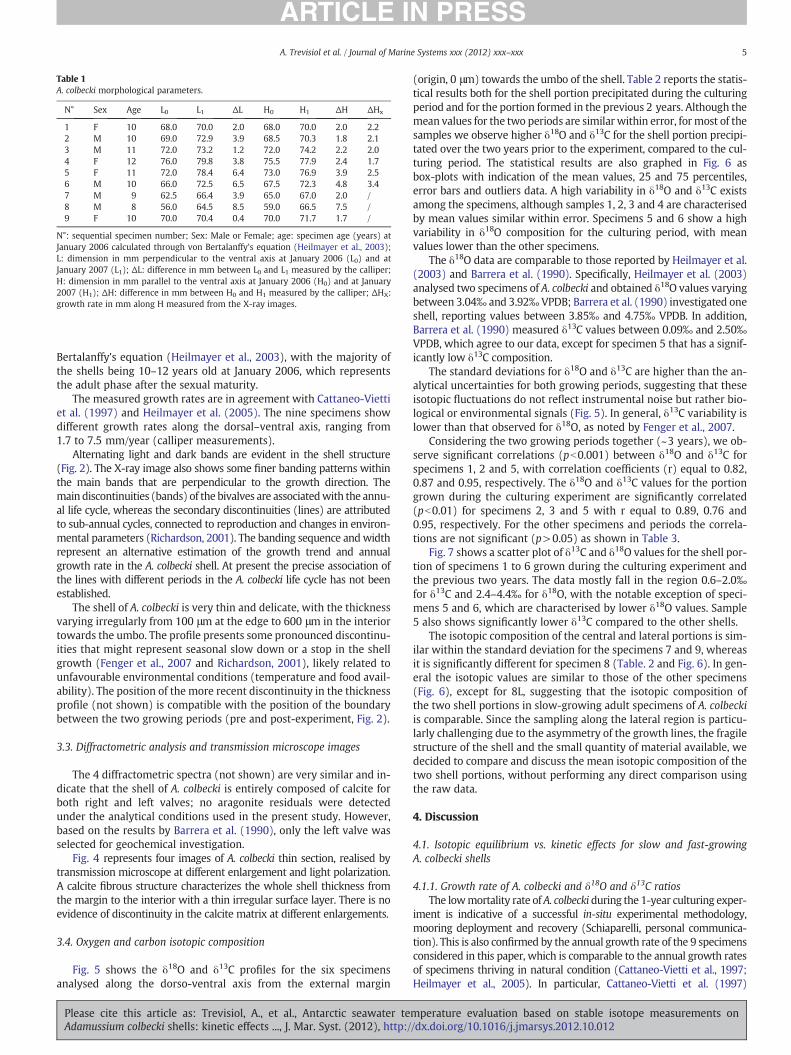
Table 1A. colbecki morphological parameters.
N° Sex Age L0 L1 ΔL H0 H1 ΔH ΔHx
1 F 10 68.0 70.0 2.0 68.0 70.0 2.0 2.22 M 10 69.0 72.9 3.9 68.5 70.3 1.8 2.13 M 11 72.0 73.2 1.2 72.0 74.2 2.2 2.04 F 12 76.0 79.8 3.8 75.5 77.9 2.4 1.75 F 11 72.0 78.4 6.4 73.0 76.9 3.9 2.56 M 10 66.0 72.5 6.5 67.5 72.3 4.8 3.47 M 9 62.5 66.4 3.9 65.0 67.0 2.0 /8 M 8 56.0 64.5 8.5 59.0 66.5 7.5 /9 F 10 70.0 70.4 0.4 70.0 71.7 1.7 /
N°: sequential specimen number; Sex: Male or Female; age: specimen age (years) atJanuary 2006 calculated through von Bertalanffy's equation (Heilmayer et al., 2003);L: dimension in mm perpendicular to the ventral axis at January 2006 (L0) and atJanuary 2007 (L1); ΔL: difference in mm between L0 and L1 measured by the calliper;H: dimension in mm parallel to the ventral axis at January 2006 (H0) and at January2007 (H1); ΔH: difference in mm between H0 and H1 measured by the calliper; ΔHX:growth rate in mm along H measured from the X-ray images.
5A. Trevisiol et al. / Journal of Marine Systems xxx (2012) xxx–xxx
Bertalanffy's equation (Heilmayer et al., 2003), with the majority ofthe shells being 10–12 years old at January 2006, which representsthe adult phase after the sexual maturity.
The measured growth rates are in agreement with Cattaneo-Viettiet al. (1997) and Heilmayer et al. (2005). The nine specimens showdifferent growth rates along the dorsal–ventral axis, ranging from1.7 to 7.5 mm/year (calliper measurements).
Alternating light and dark bands are evident in the shell structure(Fig. 2). The X-ray image also shows some finer banding patterns withinthe main bands that are perpendicular to the growth direction. Themain discontinuities (bands) of the bivalves are associatedwith the annu-al life cycle, whereas the secondary discontinuities (lines) are attributedto sub-annual cycles, connected to reproduction and changes in environ-mental parameters (Richardson, 2001). The banding sequence andwidthrepresent an alternative estimation of the growth trend and annualgrowth rate in the A. colbecki shell. At present the precise association ofthe lines with different periods in the A. colbecki life cycle has not beenestablished.
The shell of A. colbecki is very thin and delicate, with the thicknessvarying irregularly from 100 μm at the edge to 600 μm in the interiortowards the umbo. The profile presents some pronounced discontinu-ities that might represent seasonal slow down or a stop in the shellgrowth (Fenger et al., 2007 and Richardson, 2001), likely related tounfavourable environmental conditions (temperature and food avail-ability). The position of the more recent discontinuity in the thicknessprofile (not shown) is compatible with the position of the boundarybetween the two growing periods (pre and post-experiment, Fig. 2).
3.3. Diffractometric analysis and transmission microscope images
The 4 diffractometric spectra (not shown) are very similar and in-dicate that the shell of A. colbecki is entirely composed of calcite forboth right and left valves; no aragonite residuals were detectedunder the analytical conditions used in the present study. However,based on the results by Barrera et al. (1990), only the left valve wasselected for geochemical investigation.
Fig. 4 represents four images of A. colbecki thin section, realised bytransmission microscope at different enlargement and light polarization.A calcite fibrous structure characterizes the whole shell thickness fromthe margin to the interior with a thin irregular surface layer. There is noevidence of discontinuity in the calcite matrix at different enlargements.
3.4. Oxygen and carbon isotopic composition
Fig. 5 shows the δ18O and δ13C profiles for the six specimensanalysed along the dorso-ventral axis from the external margin
Please cite this article as: Trevisiol, A., et al., Antarctic seawater teAdamussium colbecki shells: kinetic effects ..., J. Mar. Syst. (2012), http:/
(origin, 0 μm) towards the umbo of the shell. Table 2 reports the statis-tical results both for the shell portion precipitated during the culturingperiod and for the portion formed in the previous 2 years. Although themean values for the two periods are similar within error, formost of thesamples we observe higher δ18O and δ13C for the shell portion precipi-tated over the two years prior to the experiment, compared to the cul-turing period. The statistical results are also graphed in Fig. 6 asbox-plots with indication of the mean values, 25 and 75 percentiles,error bars and outliers data. A high variability in δ18O and δ13C existsamong the specimens, although samples 1, 2, 3 and 4 are characterisedby mean values similar within error. Specimens 5 and 6 show a highvariability in δ18O composition for the culturing period, with meanvalues lower than the other specimens.
The δ18O data are comparable to those reported by Heilmayer et al.(2003) and Barrera et al. (1990). Specifically, Heilmayer et al. (2003)analysed two specimens of A. colbecki and obtained δ18O values varyingbetween 3.04‰ and 3.92‰ VPDB; Barrera et al. (1990) investigated oneshell, reporting values between 3.85‰ and 4.75‰ VPDB. In addition,Barrera et al. (1990) measured δ13C values between 0.09‰ and 2.50‰VPDB, which agree to our data, except for specimen 5 that has a signif-icantly low δ13C composition.
The standard deviations for δ18O and δ13C are higher than the an-alytical uncertainties for both growing periods, suggesting that theseisotopic fluctuations do not reflect instrumental noise but rather bio-logical or environmental signals (Fig. 5). In general, δ13C variability islower than that observed for δ18O, as noted by Fenger et al., 2007.
Considering the two growing periods together (~3 years), we ob-serve significant correlations (pb0.001) between δ18O and δ13C forspecimens 1, 2 and 5, with correlation coefficients (r) equal to 0.82,0.87 and 0.95, respectively. The δ18O and δ13C values for the portiongrown during the culturing experiment are significantly correlated(pb0.01) for specimens 2, 3 and 5 with r equal to 0.89, 0.76 and0.95, respectively. For the other specimens and periods the correla-tions are not significant (p>0.05) as shown in Table 3.
Fig. 7 shows a scatter plot of δ13C and δ18O values for the shell por-tion of specimens 1 to 6 grown during the culturing experiment andthe previous two years. The data mostly fall in the region 0.6–2.0‰for δ13C and 2.4–4.4‰ for δ18O, with the notable exception of speci-mens 5 and 6, which are characterised by lower δ18O values. Sample5 also shows significantly lower δ13C compared to the other shells.
The isotopic composition of the central and lateral portions is sim-ilar within the standard deviation for the specimens 7 and 9, whereasit is significantly different for specimen 8 (Table. 2 and Fig. 6). In gen-eral the isotopic values are similar to those of the other specimens(Fig. 6), except for 8L, suggesting that the isotopic composition ofthe two shell portions in slow-growing adult specimens of A. colbeckiis comparable. Since the sampling along the lateral region is particu-larly challenging due to the asymmetry of the growth lines, the fragilestructure of the shell and the small quantity of material available, wedecided to compare and discuss the mean isotopic composition of thetwo shell portions, without performing any direct comparison usingthe raw data.
4. Discussion
4.1. Isotopic equilibrium vs. kinetic effects for slow and fast-growingA. colbecki shells
4.1.1. Growth rate of A. colbecki and δ18O and δ13C ratiosThe lowmortality rate of A. colbecki during the 1-year culturing exper-
iment is indicative of a successful in-situ experimental methodology,mooring deployment and recovery (Schiaparelli, personal communica-tion). This is also confirmed by the annual growth rate of the 9 specimensconsidered in this paper, which is comparable to the annual growth ratesof specimens thriving in natural condition (Cattaneo-Vietti et al., 1997;Heilmayer et al., 2005). In particular, Cattaneo-Vietti et al. (1997)
mperature evaluation based on stable isotope measurements on/dx.doi.org/10.1016/j.jmarsys.2012.10.012
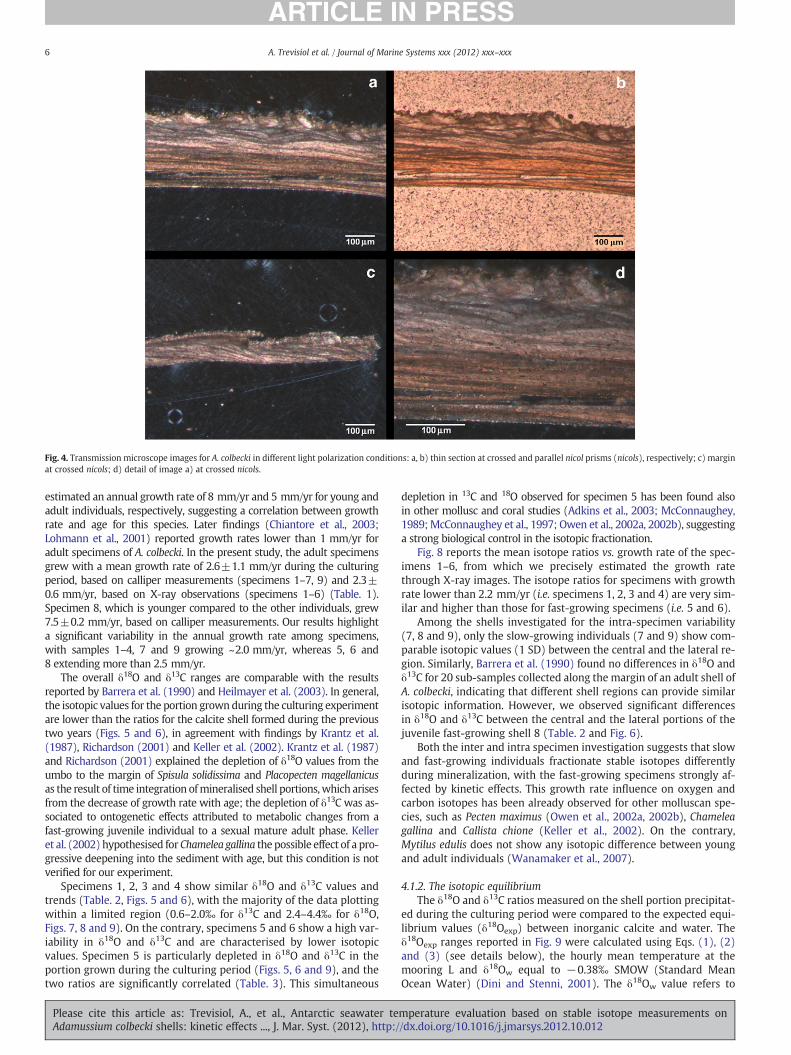
Fig. 4. Transmission microscope images for A. colbecki in different light polarization conditions: a, b) thin section at crossed and parallel nicol prisms (nicols), respectively; c) marginat crossed nicols; d) detail of image a) at crossed nicols.
6 A. Trevisiol et al. / Journal of Marine Systems xxx (2012) xxx–xxx
estimated an annual growth rate of 8 mm/yr and 5 mm/yr for young andadult individuals, respectively, suggesting a correlation between growthrate and age for this species. Later findings (Chiantore et al., 2003;Lohmann et al., 2001) reported growth rates lower than 1 mm/yr foradult specimens of A. colbecki. In the present study, the adult specimensgrew with a mean growth rate of 2.6±1.1 mm/yr during the culturingperiod, based on calliper measurements (specimens 1–7, 9) and 2.3±0.6 mm/yr, based on X-ray observations (specimens 1–6) (Table. 1).Specimen 8, which is younger compared to the other individuals, grew7.5±0.2 mm/yr, based on calliper measurements. Our results highlighta significant variability in the annual growth rate among specimens,with samples 1–4, 7 and 9 growing ~2.0 mm/yr, whereas 5, 6 and8 extending more than 2.5 mm/yr.
The overall δ18O and δ13C ranges are comparable with the resultsreported by Barrera et al. (1990) and Heilmayer et al. (2003). In general,the isotopic values for the portion grownduring the culturing experimentare lower than the ratios for the calcite shell formed during the previoustwo years (Figs. 5 and 6), in agreement with findings by Krantz et al.(1987), Richardson (2001) and Keller et al. (2002). Krantz et al. (1987)and Richardson (2001) explained the depletion of δ18O values from theumbo to the margin of Spisula solidissima and Placopecten magellanicusas the result of time integration ofmineralised shell portions,which arisesfrom the decrease of growth rate with age; the depletion of δ13C was as-sociated to ontogenetic effects attributed to metabolic changes from afast-growing juvenile individual to a sexual mature adult phase. Kelleret al. (2002) hypothesised for Chamelea gallina the possible effect of a pro-gressive deepening into the sediment with age, but this condition is notverified for our experiment.
Specimens 1, 2, 3 and 4 show similar δ18O and δ13C values andtrends (Table. 2, Figs. 5 and 6), with the majority of the data plottingwithin a limited region (0.6–2.0‰ for δ13C and 2.4–4.4‰ for δ18O,Figs. 7, 8 and 9). On the contrary, specimens 5 and 6 show a high var-iability in δ18O and δ13C and are characterised by lower isotopicvalues. Specimen 5 is particularly depleted in δ18O and δ13C in theportion grown during the culturing period (Figs. 5, 6 and 9), and thetwo ratios are significantly correlated (Table. 3). This simultaneous
Please cite this article as: Trevisiol, A., et al., Antarctic seawater teAdamussium colbecki shells: kinetic effects ..., J. Mar. Syst. (2012), http:/
depletion in 13C and 18O observed for specimen 5 has been found alsoin other mollusc and coral studies (Adkins et al., 2003; McConnaughey,1989;McConnaughey et al., 1997; Owen et al., 2002a, 2002b), suggestinga strong biological control in the isotopic fractionation.
Fig. 8 reports the mean isotope ratios vs. growth rate of the spec-imens 1–6, from which we precisely estimated the growth ratethrough X-ray images. The isotope ratios for specimens with growthrate lower than 2.2 mm/yr (i.e. specimens 1, 2, 3 and 4) are very sim-ilar and higher than those for fast-growing specimens (i.e. 5 and 6).
Among the shells investigated for the intra-specimen variability(7, 8 and 9), only the slow-growing individuals (7 and 9) show com-parable isotopic values (1 SD) between the central and the lateral re-gion. Similarly, Barrera et al. (1990) found no differences in δ18O andδ13C for 20 sub-samples collected along the margin of an adult shell ofA. colbecki, indicating that different shell regions can provide similarisotopic information. However, we observed significant differencesin δ18O and δ13C between the central and the lateral portions of thejuvenile fast-growing shell 8 (Table. 2 and Fig. 6).
Both the inter and intra specimen investigation suggests that slowand fast-growing individuals fractionate stable isotopes differentlyduring mineralization, with the fast-growing specimens strongly af-fected by kinetic effects. This growth rate influence on oxygen andcarbon isotopes has been already observed for other molluscan spe-cies, such as Pecten maximus (Owen et al., 2002a, 2002b), Chameleagallina and Callista chione (Keller et al., 2002). On the contrary,Mytilus edulis does not show any isotopic difference between youngand adult individuals (Wanamaker et al., 2007).
4.1.2. The isotopic equilibriumThe δ18O and δ13C ratios measured on the shell portion precipitat-
ed during the culturing period were compared to the expected equi-librium values (δ18Oexp) between inorganic calcite and water. Theδ18Oexp ranges reported in Fig. 9 were calculated using Eqs. (1), (2)and (3) (see details below), the hourly mean temperature at themooring L and δ18Ow equal to −0.38‰ SMOW (Standard MeanOcean Water) (Dini and Stenni, 2001). The δ18Ow value refers to
mperature evaluation based on stable isotope measurements on/dx.doi.org/10.1016/j.jmarsys.2012.10.012
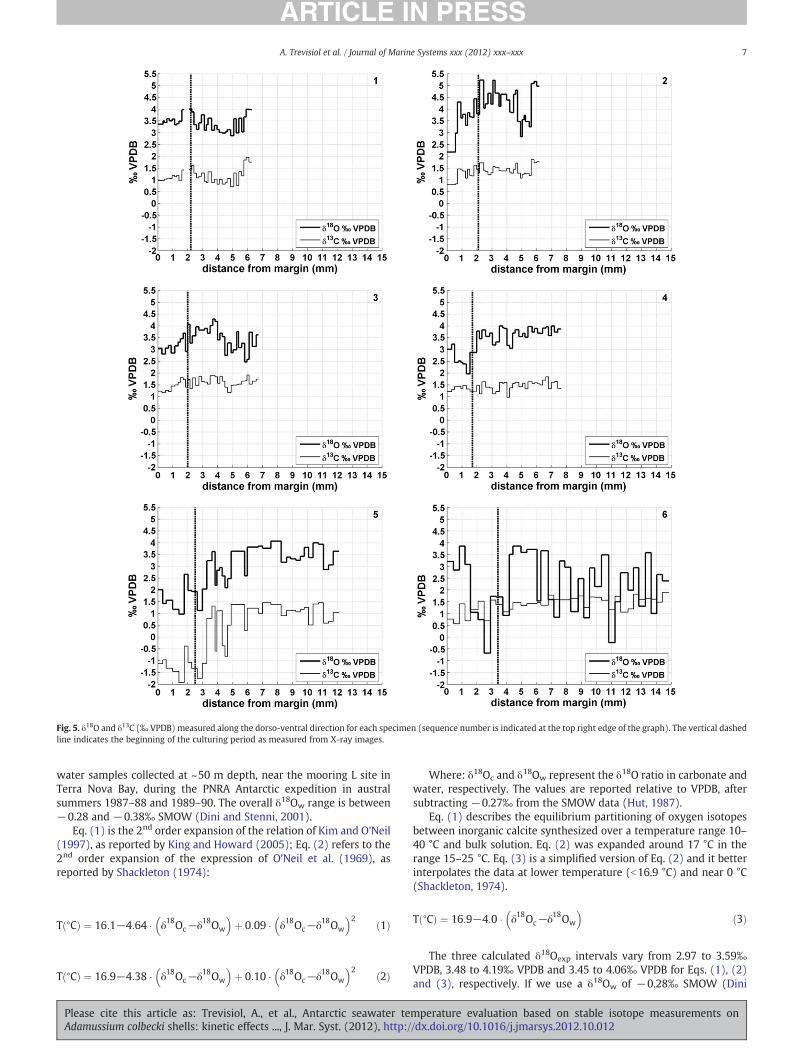
Fig. 5. δ18O and δ13C (‰ VPDB) measured along the dorso-ventral direction for each specimen (sequence number is indicated at the top right edge of the graph). The vertical dashedline indicates the beginning of the culturing period as measured from X-ray images.
7A. Trevisiol et al. / Journal of Marine Systems xxx (2012) xxx–xxx
water samples collected at ~50 m depth, near the mooring L site inTerra Nova Bay, during the PNRA Antarctic expedition in australsummers 1987–88 and 1989–90. The overall δ18Ow range is between−0.28 and −0.38‰ SMOW (Dini and Stenni, 2001).
Eq. (1) is the 2nd order expansion of the relation of Kim and O'Neil(1997), as reported by King and Howard (2005); Eq. (2) refers to the2nd order expansion of the expression of O'Neil et al. (1969), asreported by Shackleton (1974):
T ∘Cð Þ ¼ 16:1−4:64 � δ18Oc−δ18Ow
� �þ 0:09 � δ18Oc−δ18Ow
� �2 ð1Þ
T ∘Cð Þ ¼ 16:9−4:38 � δ18Oc−δ18Ow
� �þ 0:10 � δ18Oc−δ18Ow
� �2 ð2Þ
Please cite this article as: Trevisiol, A., et al., Antarctic seawater teAdamussium colbecki shells: kinetic effects ..., J. Mar. Syst. (2012), http:/
Where: δ18Oc and δ18Ow represent the δ18O ratio in carbonate andwater, respectively. The values are reported relative to VPDB, aftersubtracting −0.27‰ from the SMOW data (Hut, 1987).
Eq. (1) describes the equilibrium partitioning of oxygen isotopesbetween inorganic calcite synthesized over a temperature range 10–40 °C and bulk solution. Eq. (2) was expanded around 17 °C in therange 15–25 °C. Eq. (3) is a simplified version of Eq. (2) and it betterinterpolates the data at lower temperature (b16.9 °C) and near 0 °C(Shackleton, 1974).
T ∘Cð Þ ¼ 16:9−4:0 � δ18Oc−δ18Ow
� �ð3Þ
The three calculated δ18Oexp intervals vary from 2.97 to 3.59‰VPDB, 3.48 to 4.19‰ VPDB and 3.45 to 4.06‰ VPDB for Eqs. (1), (2)and (3), respectively. If we use a δ18Ow of −0.28‰ SMOW (Dini
mperature evaluation based on stable isotope measurements on/dx.doi.org/10.1016/j.jmarsys.2012.10.012
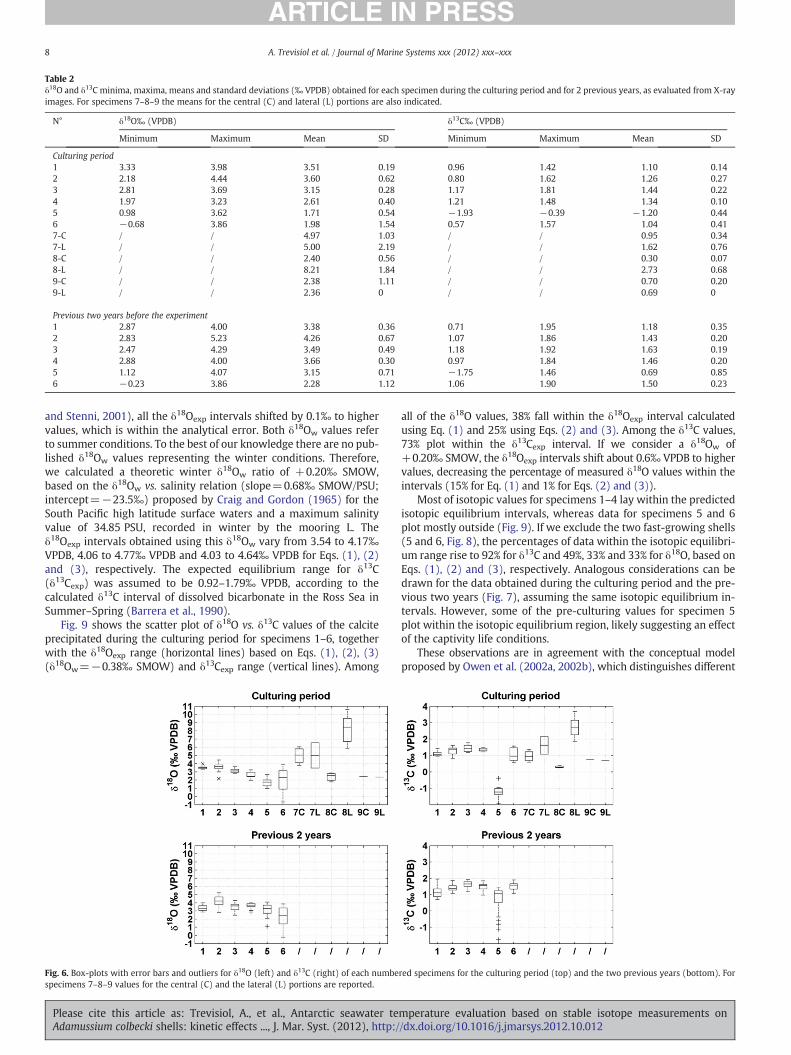
Table 2δ18O and δ13C minima, maxima, means and standard deviations (‰ VPDB) obtained for each specimen during the culturing period and for 2 previous years, as evaluated from X-rayimages. For specimens 7–8–9 the means for the central (C) and lateral (L) portions are also indicated.
N° δ18O‰ (VPDB) δ13C‰ (VPDB)
Minimum Maximum Mean SD Minimum Maximum Mean SD
Culturing period1 3.33 3.98 3.51 0.19 0.96 1.42 1.10 0.142 2.18 4.44 3.60 0.62 0.80 1.62 1.26 0.273 2.81 3.69 3.15 0.28 1.17 1.81 1.44 0.224 1.97 3.23 2.61 0.40 1.21 1.48 1.34 0.105 0.98 3.62 1.71 0.54 −1.93 −0.39 −1.20 0.446 −0.68 3.86 1.98 1.54 0.57 1.57 1.04 0.417-C / / 4.97 1.03 / / 0.95 0.347-L / / 5.00 2.19 / / 1.62 0.768-C / / 2.40 0.56 / / 0.30 0.078-L / / 8.21 1.84 / / 2.73 0.689-C / / 2.38 1.11 / / 0.70 0.209-L / / 2.36 0 / / 0.69 0
Previous two years before the experiment1 2.87 4.00 3.38 0.36 0.71 1.95 1.18 0.352 2.83 5.23 4.26 0.67 1.07 1.86 1.43 0.203 2.47 4.29 3.49 0.49 1.18 1.92 1.63 0.194 2.88 4.00 3.66 0.30 0.97 1.84 1.46 0.205 1.12 4.07 3.15 0.71 −1.75 1.46 0.69 0.856 −0.23 3.86 2.28 1.12 1.06 1.90 1.50 0.23
8 A. Trevisiol et al. / Journal of Marine Systems xxx (2012) xxx–xxx
and Stenni, 2001), all the δ18Oexp intervals shifted by 0.1‰ to highervalues, which is within the analytical error. Both δ18Ow values referto summer conditions. To the best of our knowledge there are no pub-lished δ18Ow values representing the winter conditions. Therefore,we calculated a theoretic winter δ18Ow ratio of +0.20‰ SMOW,based on the δ18Ow vs. salinity relation (slope=0.68‰ SMOW/PSU;intercept=−23.5‰) proposed by Craig and Gordon (1965) for theSouth Pacific high latitude surface waters and a maximum salinityvalue of 34.85 PSU, recorded in winter by the mooring L. Theδ18Oexp intervals obtained using this δ18Ow vary from 3.54 to 4.17‰VPDB, 4.06 to 4.77‰ VPDB and 4.03 to 4.64‰ VPDB for Eqs. (1), (2)and (3), respectively. The expected equilibrium range for δ13C(δ13Cexp) was assumed to be 0.92–1.79‰ VPDB, according to thecalculated δ13C interval of dissolved bicarbonate in the Ross Sea inSummer–Spring (Barrera et al., 1990).
Fig. 9 shows the scatter plot of δ18O vs. δ13C values of the calciteprecipitated during the culturing period for specimens 1–6, togetherwith the δ18Oexp range (horizontal lines) based on Eqs. (1), (2), (3)(δ18Ow=−0.38‰ SMOW) and δ13Cexp range (vertical lines). Among
Fig. 6. Box-plots with error bars and outliers for δ18O (left) and δ13C (right) of each numbespecimens 7–8–9 values for the central (C) and the lateral (L) portions are reported.
Please cite this article as: Trevisiol, A., et al., Antarctic seawater teAdamussium colbecki shells: kinetic effects ..., J. Mar. Syst. (2012), http:/
all of the δ18O values, 38% fall within the δ18Oexp interval calculatedusing Eq. (1) and 25% using Eqs. (2) and (3). Among the δ13C values,73% plot within the δ13Cexp interval. If we consider a δ18Ow of+0.20‰ SMOW, the δ18Oexp intervals shift about 0.6‰ VPDB to highervalues, decreasing the percentage of measured δ18O values within theintervals (15% for Eq. (1) and 1% for Eqs. (2) and (3)).
Most of isotopic values for specimens 1–4 lay within the predictedisotopic equilibrium intervals, whereas data for specimens 5 and 6plot mostly outside (Fig. 9). If we exclude the two fast-growing shells(5 and 6, Fig. 8), the percentages of data within the isotopic equilibri-um range rise to 92% for δ13C and 49%, 33% and 33% for δ18O, based onEqs. (1), (2) and (3), respectively. Analogous considerations can bedrawn for the data obtained during the culturing period and the pre-vious two years (Fig. 7), assuming the same isotopic equilibrium in-tervals. However, some of the pre-culturing values for specimen 5plot within the isotopic equilibrium region, likely suggesting an effectof the captivity life conditions.
These observations are in agreement with the conceptual modelproposed by Owen et al. (2002a, 2002b), which distinguishes different
red specimens for the culturing period (top) and the two previous years (bottom). For
mperature evaluation based on stable isotope measurements on/dx.doi.org/10.1016/j.jmarsys.2012.10.012
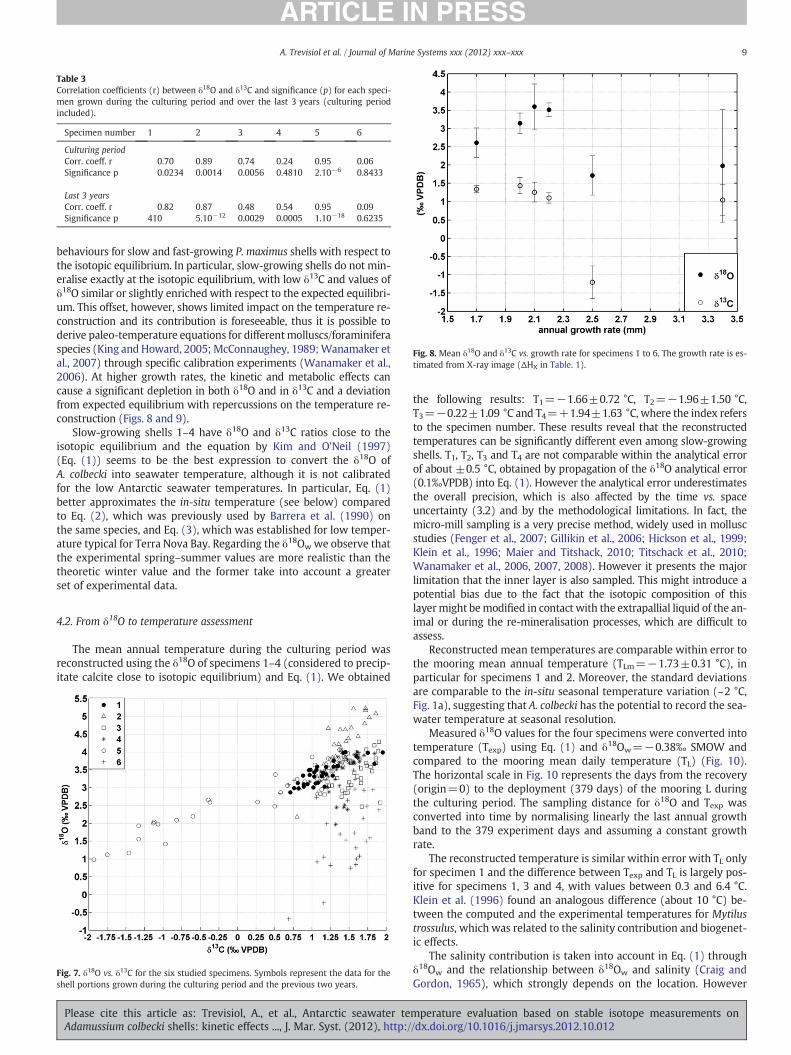
Fig. 8. Mean δ18O and δ13C vs. growth rate for specimens 1 to 6. The growth rate is es-timated from X-ray image (ΔHX in Table. 1).
Table 3Correlation coefficients (r) between δ18O and δ13C and significance (p) for each speci-men grown during the culturing period and over the last 3 years (culturing periodincluded).
Specimen number 1 2 3 4 5 6
Culturing periodCorr. coeff. r 0.70 0.89 0.74 0.24 0.95 0.06Significance p 0.0234 0.0014 0.0056 0.4810 2.10−6 0.8433
Last 3 yearsCorr. coeff. r 0.82 0.87 0.48 0.54 0.95 0.09Significance p 410 5.10−12 0.0029 0.0005 1.10−18 0.6235
9A. Trevisiol et al. / Journal of Marine Systems xxx (2012) xxx–xxx
behaviours for slow and fast-growing P. maximus shells with respect tothe isotopic equilibrium. In particular, slow-growing shells do not min-eralise exactly at the isotopic equilibrium, with low δ13C and values ofδ18O similar or slightly enriched with respect to the expected equilibri-um. This offset, however, shows limited impact on the temperature re-construction and its contribution is foreseeable, thus it is possible toderive paleo-temperature equations for differentmolluscs/foraminiferaspecies (King and Howard, 2005; McConnaughey, 1989;Wanamaker etal., 2007) through specific calibration experiments (Wanamaker et al.,2006). At higher growth rates, the kinetic and metabolic effects cancause a significant depletion in both δ18O and in δ13C and a deviationfrom expected equilibrium with repercussions on the temperature re-construction (Figs. 8 and 9).
Slow-growing shells 1–4 have δ18O and δ13C ratios close to theisotopic equilibrium and the equation by Kim and O'Neil (1997)(Eq. (1)) seems to be the best expression to convert the δ18O ofA. colbecki into seawater temperature, although it is not calibratedfor the low Antarctic seawater temperatures. In particular, Eq. (1)better approximates the in-situ temperature (see below) comparedto Eq. (2), which was previously used by Barrera et al. (1990) onthe same species, and Eq. (3), which was established for low temper-ature typical for Terra Nova Bay. Regarding the δ18Ow we observe thatthe experimental spring–summer values are more realistic than thetheoretic winter value and the former take into account a greaterset of experimental data.
4.2. From δ18O to temperature assessment
The mean annual temperature during the culturing period wasreconstructed using the δ18O of specimens 1–4 (considered to precip-itate calcite close to isotopic equilibrium) and Eq. (1). We obtained
Fig. 7. δ18O vs. δ13C for the six studied specimens. Symbols represent the data for theshell portions grown during the culturing period and the previous two years.
Please cite this article as: Trevisiol, A., et al., Antarctic seawater teAdamussium colbecki shells: kinetic effects ..., J. Mar. Syst. (2012), http:/
the following results: T1=−1.66±0.72 °C, T2=−1.96±1.50 °C,T3=−0.22±1.09 °C and T4=+1.94±1.63 °C, where the index refersto the specimen number. These results reveal that the reconstructedtemperatures can be significantly different even among slow-growingshells. T1, T2, T3 and T4 are not comparable within the analytical errorof about ±0.5 °C, obtained by propagation of the δ18O analytical error(0.1‰VPDB) into Eq. (1). However the analytical error underestimatesthe overall precision, which is also affected by the time vs. spaceuncertainty (3.2) and by the methodological limitations. In fact, themicro-mill sampling is a very precise method, widely used in molluscstudies (Fenger et al., 2007; Gillikin et al., 2006; Hickson et al., 1999;Klein et al., 1996; Maier and Titshack, 2010; Titschack et al., 2010;Wanamaker et al., 2006, 2007, 2008). However it presents the majorlimitation that the inner layer is also sampled. This might introduce apotential bias due to the fact that the isotopic composition of thislayermight bemodified in contact with the extrapallial liquid of the an-imal or during the re-mineralisation processes, which are difficult toassess.
Reconstructed mean temperatures are comparable within error tothe mooring mean annual temperature (TLm=−1.73±0.31 °C), inparticular for specimens 1 and 2. Moreover, the standard deviationsare comparable to the in-situ seasonal temperature variation (~2 °C,Fig. 1a), suggesting that A. colbecki has the potential to record the sea-water temperature at seasonal resolution.
Measured δ18O values for the four specimens were converted intotemperature (Texp) using Eq. (1) and δ18Ow=−0.38‰ SMOW andcompared to the mooring mean daily temperature (TL) (Fig. 10).The horizontal scale in Fig. 10 represents the days from the recovery(origin=0) to the deployment (379 days) of the mooring L duringthe culturing period. The sampling distance for δ18O and Texp wasconverted into time by normalising linearly the last annual growthband to the 379 experiment days and assuming a constant growthrate.
The reconstructed temperature is similar within error with TL onlyfor specimen 1 and the difference between Texp and TL is largely pos-itive for specimens 1, 3 and 4, with values between 0.3 and 6.4 °C.Klein et al. (1996) found an analogous difference (about 10 °C) be-tween the computed and the experimental temperatures for Mytilustrossulus, which was related to the salinity contribution and biogenet-ic effects.
The salinity contribution is taken into account in Eq. (1) throughδ18Ow and the relationship between δ18Ow and salinity (Craig andGordon, 1965), which strongly depends on the location. However
mperature evaluation based on stable isotope measurements on/dx.doi.org/10.1016/j.jmarsys.2012.10.012
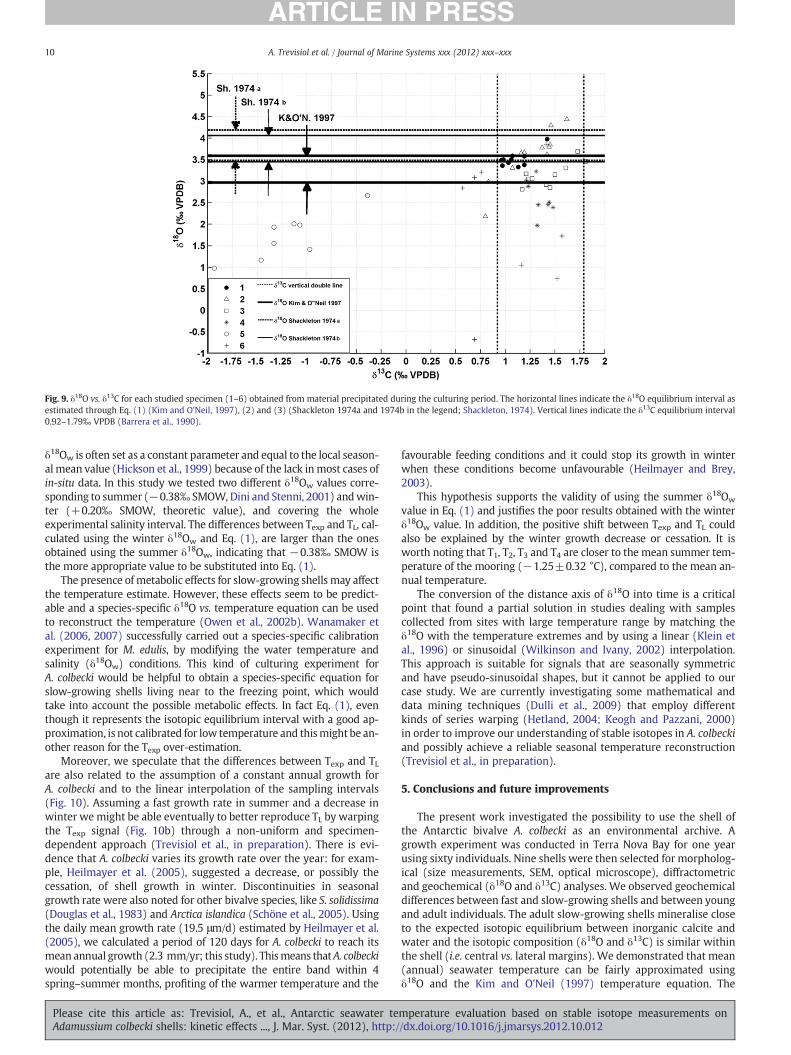
Fig. 9. δ18O vs. δ13C for each studied specimen (1–6) obtained from material precipitated during the culturing period. The horizontal lines indicate the δ18O equilibrium interval asestimated through Eq. (1) (Kim and O'Neil, 1997), (2) and (3) (Shackleton 1974a and 1974b in the legend; Shackleton, 1974). Vertical lines indicate the δ13C equilibrium interval0.92–1.79‰ VPDB (Barrera et al., 1990).
10 A. Trevisiol et al. / Journal of Marine Systems xxx (2012) xxx–xxx
δ18Ow is often set as a constant parameter and equal to the local season-al mean value (Hickson et al., 1999) because of the lack in most cases ofin-situ data. In this study we tested two different δ18Ow values corre-sponding to summer (−0.38‰ SMOW, Dini and Stenni, 2001) andwin-ter (+0.20‰ SMOW, theoretic value), and covering the wholeexperimental salinity interval. The differences between Texp and TL, cal-culated using the winter δ18Ow and Eq. (1), are larger than the onesobtained using the summer δ18Ow, indicating that −0.38‰ SMOW isthe more appropriate value to be substituted into Eq. (1).
The presence of metabolic effects for slow-growing shells may affectthe temperature estimate. However, these effects seem to be predict-able and a species-specific δ18O vs. temperature equation can be usedto reconstruct the temperature (Owen et al., 2002b). Wanamaker etal. (2006, 2007) successfully carried out a species-specific calibrationexperiment for M. edulis, by modifying the water temperature andsalinity (δ18Ow) conditions. This kind of culturing experiment forA. colbecki would be helpful to obtain a species-specific equation forslow-growing shells living near to the freezing point, which wouldtake into account the possible metabolic effects. In fact Eq. (1), eventhough it represents the isotopic equilibrium interval with a good ap-proximation, is not calibrated for low temperature and thismight be an-other reason for the Texp over-estimation.
Moreover, we speculate that the differences between Texp and TLare also related to the assumption of a constant annual growth forA. colbecki and to the linear interpolation of the sampling intervals(Fig. 10). Assuming a fast growth rate in summer and a decrease inwinter we might be able eventually to better reproduce TL by warpingthe Texp signal (Fig. 10b) through a non-uniform and specimen-dependent approach (Trevisiol et al., in preparation). There is evi-dence that A. colbecki varies its growth rate over the year: for exam-ple, Heilmayer et al. (2005), suggested a decrease, or possibly thecessation, of shell growth in winter. Discontinuities in seasonalgrowth rate were also noted for other bivalve species, like S. solidissima(Douglas et al., 1983) and Arctica islandica (Schöne et al., 2005). Usingthe daily mean growth rate (19.5 μm/d) estimated by Heilmayer et al.(2005), we calculated a period of 120 days for A. colbecki to reach itsmean annual growth (2.3 mm/yr; this study). Thismeans thatA. colbeckiwould potentially be able to precipitate the entire band within 4spring–summer months, profiting of the warmer temperature and the
Please cite this article as: Trevisiol, A., et al., Antarctic seawater teAdamussium colbecki shells: kinetic effects ..., J. Mar. Syst. (2012), http:/
favourable feeding conditions and it could stop its growth in winterwhen these conditions become unfavourable (Heilmayer and Brey,2003).
This hypothesis supports the validity of using the summer δ18Ow
value in Eq. (1) and justifies the poor results obtained with the winterδ18Ow value. In addition, the positive shift between Texp and TL couldalso be explained by the winter growth decrease or cessation. It isworth noting that T1, T2, T3 and T4 are closer to the mean summer tem-perature of the mooring (−1.25±0.32 °C), compared to the mean an-nual temperature.
The conversion of the distance axis of δ18O into time is a criticalpoint that found a partial solution in studies dealing with samplescollected from sites with large temperature range by matching theδ18O with the temperature extremes and by using a linear (Klein etal., 1996) or sinusoidal (Wilkinson and Ivany, 2002) interpolation.This approach is suitable for signals that are seasonally symmetricand have pseudo-sinusoidal shapes, but it cannot be applied to ourcase study. We are currently investigating some mathematical anddata mining techniques (Dulli et al., 2009) that employ differentkinds of series warping (Hetland, 2004; Keogh and Pazzani, 2000)in order to improve our understanding of stable isotopes in A. colbeckiand possibly achieve a reliable seasonal temperature reconstruction(Trevisiol et al., in preparation).
5. Conclusions and future improvements
The present work investigated the possibility to use the shell ofthe Antarctic bivalve A. colbecki as an environmental archive. Agrowth experiment was conducted in Terra Nova Bay for one yearusing sixty individuals. Nine shells were then selected for morpholog-ical (size measurements, SEM, optical microscope), diffractometricand geochemical (δ18O and δ13C) analyses. We observed geochemicaldifferences between fast and slow-growing shells and between youngand adult individuals. The adult slow-growing shells mineralise closeto the expected isotopic equilibrium between inorganic calcite andwater and the isotopic composition (δ18O and δ13C) is similar withinthe shell (i.e. central vs. lateral margins). We demonstrated that mean(annual) seawater temperature can be fairly approximated usingδ18O and the Kim and O'Neil (1997) temperature equation. The
mperature evaluation based on stable isotope measurements on/dx.doi.org/10.1016/j.jmarsys.2012.10.012
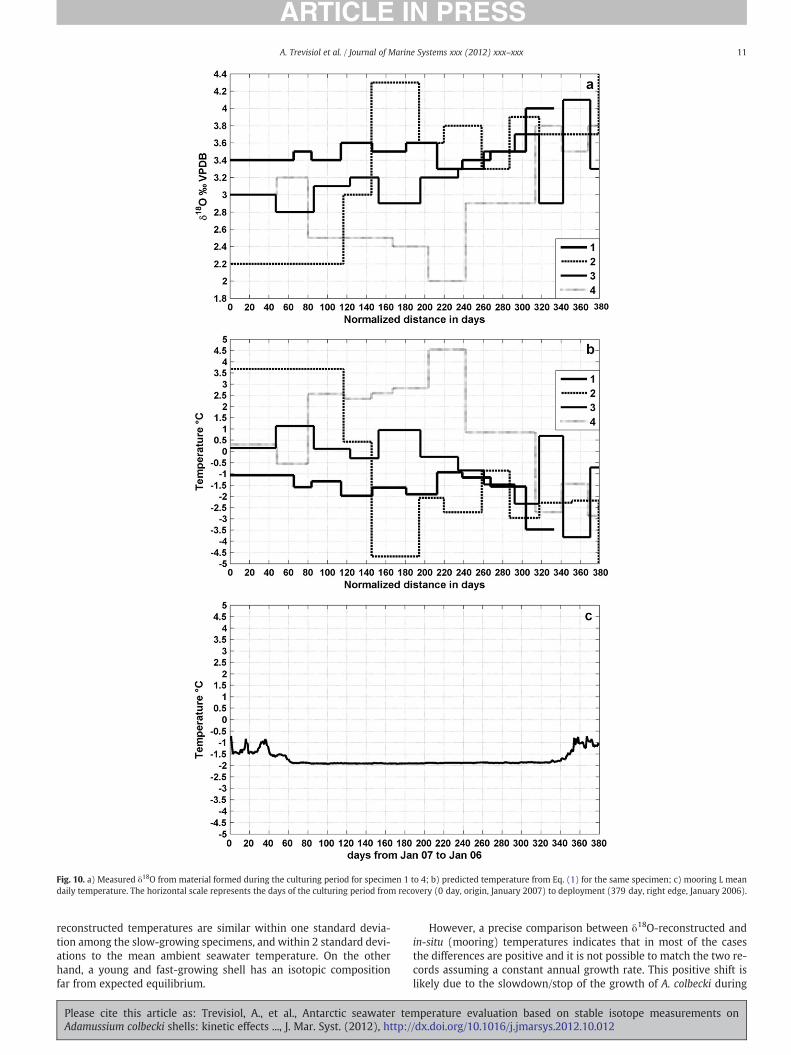
Fig. 10. a) Measured δ18O from material formed during the culturing period for specimen 1 to 4; b) predicted temperature from Eq. (1) for the same specimen; c) mooring L meandaily temperature. The horizontal scale represents the days of the culturing period from recovery (0 day, origin, January 2007) to deployment (379 day, right edge, January 2006).
11A. Trevisiol et al. / Journal of Marine Systems xxx (2012) xxx–xxx
reconstructed temperatures are similar within one standard devia-tion among the slow-growing specimens, and within 2 standard devi-ations to the mean ambient seawater temperature. On the otherhand, a young and fast-growing shell has an isotopic compositionfar from expected equilibrium.
Please cite this article as: Trevisiol, A., et al., Antarctic seawater teAdamussium colbecki shells: kinetic effects ..., J. Mar. Syst. (2012), http:/
However, a precise comparison between δ18O-reconstructed andin-situ (mooring) temperatures indicates that in most of the casesthe differences are positive and it is not possible to match the two re-cords assuming a constant annual growth rate. This positive shift islikely due to the slowdown/stop of the growth of A. colbecki during
mperature evaluation based on stable isotope measurements on/dx.doi.org/10.1016/j.jmarsys.2012.10.012

12 A. Trevisiol et al. / Journal of Marine Systems xxx (2012) xxx–xxx
winter, 2) biogenetic effects, present also for slow-growing shells,and 3) the poor fit of the Kim and O'Neil (1997) paleo-temperatureequation at very low temperatures (e.g., below 0 °C). This wouldmean that this species is recording only the summer temperature var-iations in its carbonate shell, which would justify the observed posi-tive differences.
It is possible to use δ18O as temperature proxy in A. colbecki for dif-ferent years (growth bands), but limiting the survey window to thesummer season. To increase the time resolutionwe are currently tryingto apply data mining techniques on δ18O data, allowing warping datasequences and overlapping to temperature records. Improvements intemperature reconstructions can be potentially achieved through1) controlled growth experiments with chemiluminescent techniques(Lartaud et al., 2010), which enable investigators to precisely dateshell growth bands, 2) laboratory aquaculture experiments to calibratespecies-specific δ18O–temperature equations (Wanamaker et al., 2007)and 3) alternative sampling techniques, such as laser ablation ICPMS fortrace element analysis (Montagna et al., 2006; Vander Putten et al.,2000).
Acknowledgements
Thanks are due to Mariachiara Chiantore, Stefano Schiaparelli andStefano Aliani who supply the A. colbecki specimens used in this study,helping during the culturing experiment and providing useful biologicalinformation. Claudio Mazzoli provided support with the micro-mill de-vice at the Geoscience Department of University of Padova. CarloAlberto Ricci performed the diffractometric analysis at the Earth ScienceDepartment of Siena University and Luca Peruzzo helped with the SEMand microscope images at the CNR–IGG of Padova. We deeply appreci-ate the contribution of Sandra Donnici, Sandro Carniel and MauroSclavo (ISMAR–CNR Venezia) in the laboratory analyses and in the sci-entific discussion on the results. Paolo Montagna is grateful for fundingsupport from the Marie Curie International Outgoing Fellowship. ThePolar Dove project was financed by PNRA (Programma Nazionale diRicerche in Antartide). We thank Massimo Enrico Ferrario, Loïc Micheland an anonymous reviewer for constructive comments that consider-ably improved this manuscript. This is ISMAR–CNR Bologna scientificcontribution n. 1768.
References
Adkins, J.F., Boyle, E.A., Curry, W.B., Lutringer, A., 2003. Stable isotopes in deep-seacorals and a new mechanism for “vital effects”. Geochim. Cosmochim. Acta 67(6), 1129–1143.
Barrera, E., Tevesz, M.J.S., Carter, J.G., 1990. Variations in oxygen and carbon isotopiccompositions and microstructure of the shell of Adamussium colbecki (Bivalvia).Palaios 5, 149–159.
Bergamasco, A., Defendi, V., Zambianchi, E., Spezie, G., 2002. Evidence of dense wateroverflow on the Ross Sea shelf-break. Antarct. Sci. 14, 271–277.
Bergamasco, A., Defendi Budillon, G., Spezie, G., 2004. Downslope flow observationsnear Cape Adare shelf-break. Antarct. Sci. 16, 199–204.
Berkman, P.A., 1990. The Population Biology of the Antarctic scallop, Adamussiumcolbecki (Smith, 1902) at New Harbor, Ross Sea. In: Kerry, K.R., Hempel, G. (Eds.),Antarctic Ecosystems. Ecological Change and Conservation. Springer, Berlin, NY,pp. 281–288.
Berkman, P.A., Andrews, J.T., Bjoerk, S., Colhoun, E.A., Emslie, S.D., Goodwin, I.D., Hall,B.L., Hart, C.P., Hirakawa, K., Igarashi, A., Ingòlfsson, O., Lòpez-Martinez, J., Lyons,W.B., Mabin, M.C.G., Quilty, P., Taviani, M., Yoshida, Y., 1998. Circum-Antarcticcoastal environmental shifts during the Late Quaternary reflected by emergedmarinedeposits. Antarct. Sci. 10, 345–362.
Beu, A.G., Dell, R.K., 1989. Mollusca. In: Barrett, P.J. (Ed.), Antarctic Cenozoic historyfrom the CIROS-1 drillhole, McMurdo Sound: New Zealand Department of Scientif-ic and Industrial Research Bulletin, 245, pp. 135–141.
Beu, A.G., Taviani, M., in press. Early Miocene Mollusca from McMurdo Sound, Antarc-tica (ANDRILL 2A drill core), with a review of Antarctic Oligocene and NeogenePectinidae (Bivalvia). Palaeontology.
Cape Roberts Science Team, 1998. Miocene strata in CRP-1, Cape Roberts Project.Antarctica. Terra Antarct. 5, 83–124.
Cape Roberts Science Team, 1999. Studies from the Cape Roberts Project, Ross Sea,Antarctica. Initial report on CRP-2/2A. Terra Antarct. 6 (i-xii), 1–173.
Please cite this article as: Trevisiol, A., et al., Antarctic seawater teAdamussium colbecki shells: kinetic effects ..., J. Mar. Syst. (2012), http:/
Cattaneo-Vietti, R., Chiantore, M.C., Albertelli, G., 1997. The population structure andecology of the Antarctic scallop Adamussium colbecki (Smith, 1902) at Terra NovaBay (Ross Sea, Antarctica). Sci. Mar. 61, 14–24.
Celussi, M., Bergamasco, A., Cataletto, B., Fonda Umani, S., Del Negro, P., 2010. Watermasses' bacterial community structure and microbial activities in the Ross Sea,Antarctica. Antarct. Sci. 22 (4), 361–370.
Chiantore, M.C., Cattaneo-Vietti, R., Heilmayer, O., 2003. Antarcic scallop (Adamussiumcolbecki) annual growth rate at Terra Nova Bay. Polar Biol. 26, 416–419.
Craig, H., Gordon, L.I., 1965. Deuterium and Oxygen 18 Variations in the Ocean and theMarine Atmosphere. In: Tongiorgi, E. (Ed.), Stable Isotopes in Oceanographic Stud-ies and Paleotemperatures. Cons. Naz. di Ric, Spoleto, Italy, pp. 9–130.
Del Negro, P., Bergamasco, A., 2008. Microorganisms within growing frazil ice. TerraAntarct. Rep. 14, 241–246.
Dini, M., Stenni, B., 2001. Oxygen Isotope Characterization of Terra Nova Bay Seawater. In:Faranda, F., Guglielmo, L., Ianora, A. (Eds.), Ross Sea Ecology Italiantartide Expeditions(1987–1995). Springer-Verlag, Berlin Heidelberg, pp. 27–37.
Douglas, S.J., Douglas, F.W., Michael, A.A., 1983. Growth history and ecology of the At-lantic surf clam, Spisula solidissima (Dillwyn), as revealed by stable isotopes andannual shell increments. J. Exp. Mar. Biol. Ecol. 73, 225–242.
Dulli, S., Furini, S., Peron, E., 2009. Data Mining: Metodi e strategie. Springer-Verlag,Milano.
Epstein, S., Buchsbaum, R., Lowenstam, H.A., Urey, H.C., 1953. Revised carbonate-waterisotopic temperature scale. Geol. Soc. Am. Bull. 64, 1315–1326.
Fenger, T., Surge, D., Schone, B., Milner, N., 2007. Sclerochronology and geochemical vari-ation in limpet shells (Patella vulgata): a newarchive to reconstruct coastal sea surfacetemperature. Geochem. Geophys. Geosyst. 8 (7), Q07001. http://dx.doi.org/10.1029/2006GC001488.
Fusco, G., Budillon, G., Spezie, G., 2009. Surface heat fluxes and thermohaline vari-ability in the Ross Sea and in Terra Nova Bay polynya. Cont. Shelf Res. 29,1887–1895.
Ganachaud, A., Wunsch, C., 2000. Improved estimates of global ocean circulation, heattransport and mixing from hydrographic data. Nature 408, 453–457.
Gillikin, D.P., Lorrain, A., Bouillon, S., Willenz, P., Dehairs, F., 2006. Stable carbon isoto-pic composition of Mytilus edulis shells: relation to metabolism, salinity, δ13C(DIC)and phytoplankton. Org. Geochem. 37, 1371–1382.
Heilmayer, O., Brey, T., 2003. Saving by freezing? Metabolic rates of Adamussiumcolbecki in a latitudinal context. Mar. Biol. 143, 477–484.
Heilmayer, O., Brey, T., Chiantore, M.C., Cattaneo-Vietti, R., Arntz, W.E., 2003. Age andproductivity of the Antarctic scallop, Adamussium colbecki, in Terra Nova Bay(Ross Sea, Antarctica). J. Exp. Mar. Biol. Ecol. 288, 239–256.
Heilmayer, O., Honnen, C., Jacob, U., Chiantore, M.C., Cattaneo-Vietti, R., Brey, T., 2005.Temperature effects on summer growth rates in the Antarctic scallop, Adamussiumcolbecki. Polar Biol. 28, 523–527.
Hetland, M.L., 2004. In: Last, M., Kandel, A., Bunke, H. (Eds.), A Survey of RecentMethods for Efficient Retrieval of Similar Time Sequences: Data Mining in Time Se-ries Databases, Maschine Perception & Artificial Intelligence, 57, pp. 23–42.
Hickson, J.A., Johnson, A.L.A., Heaton, T.H.E., Balson, P.S., 1999. The shell of the QueenScallop Aequipecten opercularis (L.) as a promising tool for palaeoenvironmentalreconstruction: evidence and reasons for equilibrium stable-isotope incorporation.Palaeogeogr. Palaeoclimatol. Palaeoecol. 154, 325–337.
Hut, G., 1987. Consultants Group Meeting on Stable Isotope Reference Samples for Geo-chemical and Hydrological Investigations. Rep. to Dir. Gen., Int. At. Energy Agency,Vienna, p. 42.
Jacobs, S.S., Giulivi, C.F., 1998. Interannual ocean and sea ice variability in the Ross Sea.Antarct. Res. Ser. 75, 135–150.
Jacobs, S.S., Giulivi, C.F., 2010. Largemultidecadal salinity trends near the Pacific–Antarcticcontinental margin. J. Climate 23, 4508–4524.
Jonkers, H.A., 1998a. Stratigraphy of Antarctic Cenozoic pectinid-bearing deposits.Antarct. Sci. 18, 161–170.
Jonkers, H.A., 1998b. The Cockburn Island Formation; Late Pliocene interglacial sedi-mentation in the James Ross Basin, northern Antarctic Peninsula. Newsl. Stratigr.36, 63–76.
Jonkers, H.A., 2003. Late Cenozoic–Recent Pectinidae (Mollusca: Bivalvia) of the South-ern Ocean and neighbouring regions. Monogr. Mar. Mollusca 5 (viii), 125.
Keller, N., Del Piero, D., Longinelli, A., 2002. Isotopic composition, growth rates and bi-ological behaviour of Chamellea gallina and Callista chione from the Gulf of Trieste(Italy). Mar. Biol. 140, 9–15.
Keogh, E.J., Pazzani, M., 2000. Scaling Up Dynamic Time Warping for Data MiningApplications. In Proc. 6th Int. Conf. on Knowledge Discovery and DataMining, Boston.
Kim, S.-T., O'Neil, J.R., 1997. Equilibrium and non-equilibrium oxygen isotope effects insynthetic carbonates. Geochim. Cosmochim. Acta 61, 3461–3475.
King, A.L., Howard, W.R., 2005. δ18O seasonality of planktonic foraminifera from South-ern Ocean sediment traps: Latitudinal gradients and implications for paleoclimatereconstructions. Mar. Micropaleontol. 56, 1–24.
Kingston, A.W., Gröcke, D.R., Burchell, M., 2008. Amultiaxial growth analysis of stable iso-topes in the modern shell of Saxidomus gigantea : implications for sclerochronologystudies. Geochem. Geophys. Geosyst. 9, 1–9.
Klein, R.T., Lohmann, K.C., Thayer, C.W., 1996. Bivalve skeletons record sea-surfacetemperature and δ18O via Mg/Ca and 18O/16O ratios. Geology 2, 415–418.
Krantz, D.E., Douglas, F.W., Douglas, S.J., 1987. Ecological and Paleoenvironmental in-formation using stable isotope profile from living and fossil molluscs. Palaeogeogr.Palaeoclimatol. Palaeoecol. 249–266.
Lartaud, F., Chauvaud, L., Richard, J., Toulot, A., Bollinger, C., Testut, L., Paulet, Y.-M., 2010.Experimental growth pattern calibration of Antarctic scallop shells (Adamussiumcolbecki, Smith 1902) to provide a biogenic archive of high-resolution records of envi-ronmental and climatic changes. J. Exp. Mar. Biol. Ecol. 393, 158–167.
mperature evaluation based on stable isotope measurements on/dx.doi.org/10.1016/j.jmarsys.2012.10.012
13A. Trevisiol et al. / Journal of Marine Systems xxx (2012) xxx–xxx
Lavelle, M., 2001. Molluscan Oxygen Isotope Estimates of Seasonality and CenozoicAntarctic Marine Temperatures. In: Florindo, F., Cooper, A.K. (Eds.), The GeologicRecord of the Antarctic Ice Sheet from Drilling, Coring and Seismic Studies:Quarderni di Geofisica, 16, i–ix, pp. 115–116.
Lavelle, M., Fielding, C.R., Hall, M.A., Thomson, M.R.A., 2001. Molluscan stable isotopetemperature estimates of the southwestern Ross Sea during the Early Oligoceneand Early Miocene, CRP-2/2A and CRP-3, Victoria Land Basin, Antarctica. TerraAntarct. 8, 439–444.
Lea, D.W., 2003. In: Holland, H.D., Turekian, K.K. (Eds.), Elemental and IsotopicProxies of Past Ocean Temperatures. Treatise on Geochemistry, 6. Elsevier Ltd,pp. 1–26.
Lohmann, K.C., Berkman, P.A., Marcano, M.C., 2001. A High Resolution δ18O Record ofGrowth Banding in Adamussium colbecki: A Proxy for Reconstruction of Coastal Sa-linities and Continental Temperatures on Annual to Century Time Scales. In:Berkman, P.A., Tipton-Everett, L.R. (Eds.), Latitudinal Ecosystem (LAT-ECO) Re-sponses to Climate Across Victoria Land, Antarctica. Report of a National ScienceFoundation Workshop. BPRC Report No. 20. Byrd Polar Research Center, The OhioState University, Columbus, Ohio, pp. 96–98.
Lynch-Stieglitz, J., 2003. In: Holland, H.D., Turekian, K.K. (Eds.), Tracers of Past OceanCirculation. Treatise on Geochemistry, 6. Elsevier Ltd, pp. 433–451.
Maier, E., Titshack, J., 2010. Spondylus gaederopus: a new Mediterranean climatearchive — based on high resolution oxygen and carbon isotope analysis.Palaeogeogr. Palaeoclimatol. Palaeoecol. 291, 228–238.
Marcano, M.C., Mukasa, S., Lohmann, K.G., Stefano, C., Taviani, M., Andronikov, A., 2009.Chronostratigraphic and paleoenvironmental constraints derived from the Sr87/Sr/86 and δ18O signal of Miocene bivalves, Southern McMurdo Sound, Antarctica.Glob. Planet. Chang. 69, 124–132.
McConnaughey, T., 1989. 13C and 18O isotopic disequilibrium in biological carbonates:I. Patterns. Geochim. Cosmochim. Acta 53, 151–162.
McConnaughey, T.A., Burdett, J.,Whelan, J.F., Paull, C.K., 1997. Carbon isotopes in biologicalcarbonates: respiration and photosynthesis. Geochim. Cosmochim. Acta 61, 611–622.
Montagna, P., McCulloch, M., Taviani, M., Mazzoli, C., Vendrell, B., 2006. Phosphorus in cold-water corals as a proxy for seawater nutrient chemistry. Science 312, 1788–1791.
O'Neil, J.R., Clayton, R.N., Mayeda, T.K., 1969. Oxygen isotope fractionation in divalentmetal carbonates. J. Chem. Phys. 51, 5547–5558.
Orsi, A.H.,Wiederwohl, C.L., 2009. A recount of Ross Seawaters. Deep-Sea Res. II 56, 778–795.Orsi, A.H., Jacobs, S.S., Gordon, A.L., Visbeck, M., 2001. Cooling and ventilating the abys-
sal ocean. Geophys. Res. Lett. 28, 2923–2926.Owen, R., Kennedy, H., Richardson, C., 2002a. Isotopic partitioning between scallop
shell calcite and seawater: effect of shell growth rate. Geochim. Cosmochim. Acta66 (10), 1727–1737.
Owen, R., Kennedy, H., Richardson, C., 2002b. Experimental investigation intopartitioning of stable isotopes between scallop (Pecten maximus) shell calcite andsea water. Palaeogeogr. Palaeoclimatol. Palaeoecol. 185, 163–174.
Petrelli, P., Bindoff, N.L., Bergamasco, A., 2008. The sea ice dynamics of Terra Nova Bayand Ross Ice Shelf Polynyas during a spring and winter simulation. J. Geophys. Res.113, C09003. http://dx.doi.org/10.1029/2006JC004048.
PNRA, 2006. Rapporto di Campagna 2005–2006. http://www.pnra.it/biblioteca/rapporti_campagna.htm.
PNRA, 2007. Rapporto di Campagna 2006–2007. http://www.pnra.it/biblioteca/rapporti_campagna.htm.
Quaglio, F., Whittle, R.J., Gazdzicki, A., Simões, M.G., 2010. A new fossil Adamussium(Bivalvia: Pectinidae) from Antarctica. Pol. Polar Res. 31, 291–302.
Rhodes, R.H., Bertler, N.A.N., Baker, J.A., Sneed, S.B., Oerter, H., Arrigo, K.R., 2009. Sea ice vari-ability and primary productivity in the Ross Sea, Antarctica, from methylsulphonatesnow record. Geophys. Res. Lett. 36, L10704. http://dx.doi.org/10.1029/2009GL037311.
Richardson, C.A., 2001. Molluscs as archives of environmental change. Oceanogr. Mar.Ann. Rev. 39, 103–164.
Rivaro, P., Massolo, S., Bergamasco, A., Castagno, P., Budillon, G., 2010. Chemical evi-dence of the changes of the Antarctic Bottom Water ventilation in the westernRoss Sea between 1997 and 2003. Deep-Sea Res. I 57, 639–652.
Schiaparelli, S., Linse, K., 2006. A reassessment of the distribution of the common Ant-arctic scallop Adamussium colbecki (Smith, 1902). Deep-Sea Res. II 53, 912–920.
Schöne, B.R., Houk, S.D., Castro, A.D.F., Fiebig, J., Oschmann, W., Kröncke, I., Dreyer, W.,Gosselck, F., 2005. Daily growth rates in shells of Arctica islandica: assessing sub-seasonal environmental controls on a long-lived bivalve mollusk. Palaios 20, 78–92.
Please cite this article as: Trevisiol, A., et al., Antarctic seawater teAdamussium colbecki shells: kinetic effects ..., J. Mar. Syst. (2012), http:/
Schöne, B.R., Rodland, D.L., Wehrmann, A., Heidel, B., Oschmann, W., Zhang, Z., Fiebig, J.,Beck, L., 2007. Combined sclerochronologic and oxygen isotope analysis of gastro-pod shells (Gibbula cineraria, North Sea): life-history traits and utility as a high-resolution environmental archive for kelp forests. Mar. Biol. 150, 1237–1252.
Shackleton, N.J., 1974. Attainment of Isotopic Equilibrium Between Ocean Water andthe Benthonic Foraminifera Genus Uvigerina: Isotopic Changes in the Ocean Duringthe last Glacial: Colloques International du C. N. R. S., 219, pp. 203–209.
Sperling, M., Weldeab, S., Schmiedl, G., 2002. Drying of samples may alter foraminiferalisotopic ratios and faunistic composition. Micropaleontology 48, 87–91.
Spötl, C., Vennemann, T.W., 2003. Continuous-flow isotope ratio mass spectrometricanalysis of carbonate minerals. Rapid Commun. Mass Spectrom. 17, 1004–1006.
Staubwasser, M., Henderson, G.M., Berkman, P., Hall, B.A.L., 2004. Ba, Ra, Th, and U inmarine mollusc shells and the potential of 226Ra/Ba dating of Holocene marine car-bonate shells. Geochim. Cosmochim. Acta 68, 89–100.
Taviani, M., 2001. East Antarctic Marine Environments and Climatic Conditions inthe Last 30 million Years as Inferred from Macropaleontological Data (CapeRoberts Project). In: Florindo, F., Cooper, A.K. (Eds.), The Geologic Record ofthe Antarctic Ice Sheet from Drilling, Coring and Seismic Studies: Quaderni diGeofisica, 16, i–ix, pp. 179–180.
Taviani, M., Beu, A.G., 2001. Paleogene macrofossils from CRP-3 drillhole, Victoria LandBasin, Antarctica. Terra Antarct. 8, 423–434.
Taviani, M., Beu, A.G., 2003. The palaeoclimatic significance of Cenozoic marine mac-rofossil assemblages from Cape Roberts Project drillholes, McMurdo Sound,Victoria Land Basin, East Antarctica. Palaeogeogr. Palaeoclimatol. Palaeoecol.198, 131–143.
Taviani, M., Zahn, R., 1998. The stable isotope record of Pleistocene and Miocene bi-valves in the CRP-1 drillhole, Victoria Land Basin, Antarctica. Terra Antarct. 5,419–423.
Taviani, M., Beu, A.G., Lombardo, C., 1998. Pleistocene macrofossils from CRP-1drillhole, Victoria Land Basin, Antarctica. Terra Antarct. 5, 485–491.
Taviani, M., Beu, A.G., Jonkers, H.A., 2001. Macrofossils from CRP-2/2A, Victoria LandBasin, Antarctica. Terra Antarct. 7, 513–526.
Taviani, M., Hannah, M., Harwood, D.M., Ishman, S.E., Johnson, K., Olney, M.,Riesselman, C., Tuzzi, E., Askin, R., Beu, A.G., Blair, S., Cantarelli, V., Ceregato, A.,Corrado, S., Mohr, B., Nielsen, S.H.H., Persico, D., Petrushak, S., Raine, J.I., Warny,S., ANDRILL-SMS Science Team, 2010. Palaeontological characterisation and analy-sis of the AND-2A core, ANDRILL Southern McMurdo Sound Project, Antarctica.Terra Antarct. 15, 113–146.
Titschack, J., Zuschin, M., Spötl, C., Baal, C., 2010. The giant oyster Hyotissa hyotis fromnorthern Red Sea as a decadal-scale archive for seasonal environmental fluctua-tions in coral reef habitats. Coral Reefs 29, 1061–1075.
Trevisiol, A., Bergamasco, A., Peron, E., Furini, S., Dulli, S. Dynamic Time Warping ap-plied to A. colbecki δ18O signal for Antarctic water temperature reconstruction atseasonal resolution. In preparation.
Vander Putten, E., Dehairs, F., Keppens, E., Baeyens, W., 2000. High resolution distribu-tion of trace elements in the calcite shell layers of modern Mytilus edulis: environ-mental and biological controls. Geochim. Cosmochim. Acta 64, 997–1011.
Wanamaker Jr., A.D., Kreutz, K.J., Borns Jr., H.W., Introne, D.S., Feindel, S., Barber, B.J., 2006. Anaquaculture-based method for calibrated bivalve isotope paleothermometry. Geochem.Geophys. Geosyst. 7 (9), Q09011. http://dx.doi.org/10.1029/2005GC001189.
Wanamaker Jr., A.D., Kreutz, K.J., Borns, H.W., Introne, D.S., Feindel, S., Funder, S., Rawson,P.D., Barber, B.J., 2007. Experimental determination of salinity, temperature, growth,and metabolic effects on shell isotope chemistry of Mytilus edulis collected fromMaine and Greenland. Paleoceanography 22, PA2217. http://dx.doi.org/10.1029/2006PA001352.
Wanamaker, A.D.J., Kreutz, K.J., Wilson, T., Borns, H.W.J., Introne, D.S., Feindel, S., 2008.Experimentally determined Mg/Ca and Sr/Ca ratios in juvenile bivalve calcite forMytilus edulis: implications for paleotemperature reconstructions. Geo-Mar. Lett.28, 359–368.
Whitehead, J.M., Ehrmann, W., Harwood, D.M., Hillebrand, C.-D., Quilty, P.G., Hart, C.,Taviani, M., Thorn, V., McMinn, A., 2006. Late Miocene paleoenvironment of theLambert Graben embayment, East Antarctica, evident from: mollusc paleontology,sedimentology and geochemistry. Glob. Planet. Chang. 50, 127–147.
Wilkinson, B.H., Ivany, L.C., 2002. Paleoclimatic inference from stable isotope profiles ofaccretionary biogenic hardparts — a quantitative approach to the evaluation of in-complete data. Palaeogeogr. Palaeoclimatol. Palaeoecol. 185, 95–114.
mperature evaluation based on stable isotope measurements on/dx.doi.org/10.1016/j.jmarsys.2012.10.012
Copyright © 2022 FDOKUMEN