Anomalous and normal diffusion of proteins and lipids in crowded lipid membranes
21
Anomalous and normal diffusion of proteins and lipids in crowded lipid membranes Matti Javanainen, a Henrik Hammaren, a Luca Monticelli, b Jae-Hyung Jeon, a Markus S. Miettinen, c Hector Martinez-Seara, a Ralf Metzler ad and Ilpo Vattulainen * ae Received 27th April 2012, Accepted 1st June 2012 DOI: 10.1039/c2fd20085f Lateral diffusion plays a crucial role in numerous processes that take place in cell membranes, yet it is quite poorly understood in native membranes characterized by, e.g., domain formation and large concentration of proteins. In this article, we use atomistic and coarse-grained simulations to consider how packing of membranes and crowding with proteins affect the lateral dynamics of lipids and membrane proteins. We find that both packing and protein crowding have a profound effect on lateral diffusion, slowing it down. Anomalous diffusion is observed to be an inherent property in both protein-free and protein-rich membranes, and the time scales of anomalous diffusion and the exponent associated with anomalous diffusion are found to strongly depend on packing and crowding. Crowding with proteins also has a striking effect on the decay rate of dynamical correlations associated with lateral single-particle motion, as the transition from anomalous to normal diffusion is found to take place at macroscopic time scales: while in protein-poor conditions normal diffusion is typically observed in hundreds of nanoseconds, in protein-rich conditions the onset of normal diffusion is tens of microseconds, and in the most crowded systems as large as milliseconds. The computational challenge which results from these time scales is not easy to deal with, not even in coarse-grained simulations. We also briefly discuss the physical limits of protein motion. Our results suggest that protein concentration is anything but constant in the plane of cell membranes. Instead, it is strongly dependent on proteins’ preference for aggregation. 1 Introduction Lateral diffusion of lipids and proteins 1,2 is one of the most significant dynamic processes in cell membranes, as it governs a variety of phenomena such as formation of membrane protein complexes and self-assembly of functional nano-scale membrane domains known as lipid rafts. 3 Understanding how these complex processes take place in native cell membranes under biologically relevant conditions a Department of Physics, Tampere University of Technology, P.O. Box 692, FI–33101 Tampere, Finland. E-mail: ilpo.vattulainen@tut.fi b INSERM, UMR-S665, DSIMB 75015, Universit e Paris Diderot - Paris 7, UFR Life Sciences, Paris, France c Fachbereich Physik, Freie Universit € at Berlin, 14195 Berlin, Germany d Institute for Physics & Astronomy, University of Potsdam, Karl-Liebknecht-Strasse 24/25, D-14476 Potsdam-Golm, Germany e MEMPHYS Center for Biomembrane Physics, University of Southern Denmark, Odense, Denmark This journal is ª The Royal Society of Chemistry 2013 Faraday Discuss. PAPER www.rsc.org/faraday_d | Faraday Discussions Downloaded by SCD Université Paris 7 on 10 October 2012 Published on 01 June 2012 on http://pubs.rsc.org | doi:10.1039/C2FD20085F View Online / Journal Homepage
-
Upload
independent -
Category
Documents
-
view
1 -
download
0
Transcript of Anomalous and normal diffusion of proteins and lipids in crowded lipid membranes

PAPER www.rsc.org/faraday_d | Faraday DiscussionsD
ownl
oade
d by
SC
D U
nive
rsité
Par
is 7
on
10 O
ctob
er 2
012
Publ
ishe
d on
01
June
201
2 on
http
://pu
bs.r
sc.o
rg |
doi:1
0.10
39/C
2FD
2008
5FView Online / Journal Homepage
Anomalous and normal diffusion of proteinsand lipids in crowded lipid membranes
Matti Javanainen,a Henrik Hammaren,a Luca Monticelli,b
Jae-Hyung Jeon,a Markus S. Miettinen,c Hector Martinez-Seara,a
Ralf Metzlerad and Ilpo Vattulainen*ae
Received 27th April 2012, Accepted 1st June 2012
DOI: 10.1039/c2fd20085f
Lateral diffusion plays a crucial role in numerous processes that take place in cell
membranes, yet it is quite poorly understood in native membranes characterized
by, e.g., domain formation and large concentration of proteins. In this article, we
use atomistic and coarse-grained simulations to consider how packing of
membranes and crowding with proteins affect the lateral dynamics of lipids and
membrane proteins. We find that both packing and protein crowding have a
profound effect on lateral diffusion, slowing it down. Anomalous diffusion is
observed to be an inherent property in both protein-free and protein-rich
membranes, and the time scales of anomalous diffusion and the exponent
associated with anomalous diffusion are found to strongly depend on packing
and crowding. Crowding with proteins also has a striking effect on the decay rate
of dynamical correlations associated with lateral single-particle motion, as the
transition from anomalous to normal diffusion is found to take place at
macroscopic time scales: while in protein-poor conditions normal diffusion is
typically observed in hundreds of nanoseconds, in protein-rich conditions the
onset of normal diffusion is tens of microseconds, and in the most crowded
systems as large as milliseconds. The computational challenge which results from
these time scales is not easy to deal with, not even in coarse-grained simulations.
We also briefly discuss the physical limits of protein motion. Our results suggest
that protein concentration is anything but constant in the plane of cell
membranes. Instead, it is strongly dependent on proteins’ preference for
aggregation.
1 Introduction
Lateral diffusion of lipids and proteins1,2 is one of the most significant dynamicprocesses in cell membranes, as it governs a variety of phenomena such as formationof membrane protein complexes and self-assembly of functional nano-scalemembrane domains known as lipid rafts.3 Understanding how these complexprocesses take place in native cell membranes under biologically relevant conditions
aDepartment of Physics, Tampere University of Technology, P.O. Box 692, FI–33101 Tampere,Finland. E-mail: [email protected], UMR-S665, DSIMB 75015, Universit�e Paris Diderot - Paris 7, UFR Life Sciences,Paris, FrancecFachbereich Physik, Freie Universit€at Berlin, 14195 Berlin, GermanydInstitute for Physics & Astronomy, University of Potsdam, Karl-Liebknecht-Strasse 24/25,D-14476 Potsdam-Golm, GermanyeMEMPHYS Center for Biomembrane Physics, University of Southern Denmark, Odense,Denmark
This journal is ª The Royal Society of Chemistry 2013 Faraday Discuss.

Dow
nloa
ded
by S
CD
Uni
vers
ité P
aris
7 o
n 10
Oct
ober
201
2Pu
blis
hed
on 0
1 Ju
ne 2
012
on h
ttp://
pubs
.rsc
.org
| do
i:10.
1039
/C2F
D20
085F
Online
is key to unlocking many of the cellular functions. In this work, we focus on one ofthe central issues in this context, that is, the effects of lipid packing and proteincrowding on lipid and protein diffusion.In cell membranes, their local surface density depends quite substantially on lipidcomposition. Membrane regions rich in polyunsaturated lipids are loosely packed,while in cholesterol and sphingolipid rich regions the packing of lipids is muchtighter.4–6 Especially the latter situation is appealing since the concept of lipid raftsis largely based on the interplay of cholesterol and sphingolipids that are abundantin these highly ordered and packed domains. Considering the heterogeneity of cellmembranes and the spatially varying membrane density in the membrane plane,there is reason to expect that lateral diffusion also depends on lipid packing. Exper-iments on model membranes support this view.7,8
Meanwhile, given that in native membranes the (molar) ratio of proteins andlipids has been suggested9,10 to vary roughly between 1 : 50 and 1 : 100, it is obviousthat membranes in living cells can be crowded with proteins.11 What does this meanin practice? Assuming a typical phospholipid whose area per lipid is 0.64 nm2 and analpha-helical transmembrane peptide/protein whose diameter is 3 nm, then for aprotein-to-lipid number ratio of 1 : 50, the average distance between the proteins’surfaces is about 3.2 nm. This suggests that in membranes crowded with proteins,membrane-mediated protein–protein interactions may play decisive roles in lateraldiffusion.Packing and crowding may also play a role in the nature of diffusion, since in
other biological contexts, such as in the cytoplasm of living cells it has been foundthat diffusion of individual molecules at ‘‘short’’ time scales is anomalous12,13 (alsocalled subdiffusion), with the average mean-squared displacement scaling as apower-law ta in time t with an anomalous scaling exponent a < 1.14 Similar behaviorhas been suggested very recently for membrane channels in plasma membranes ofhuman kidney cells.15 At long times, if molecular motion is not confined to a certainregion, one expects a random walk-like normal diffusion with a ¼ 1.While most of the discussion relates to normal diffusion occurring at long times
and large length scales, the concept and the biological relevance of crowding-induced anomalous diffusion have recently received increased attention, openingup new vistas for interesting implications. In the cytoplasm of living cells anomalousdiffusion of tracers such as labelled messenger RNA,12 lipid granules,13 or chromo-somal loci16 have been observed on time scales of tens of seconds, in accordance withcontrol experiments in dense dextran17 or protein solutions.18 At longer times thisanomalous motion is of the type of viscoelastic subdiffusion. As found by Goldingand Cox12 as well as Guigas and Weiss,19 viscoelastic subdiffusion leads to increasedrecurrence of the position coordinate and may lead to increased local reaction ratesof diffusing reactants. Anomalous diffusion may also lead to dynamical localisation,as argued for chromosomal separation in eukaryotes from measurements of the telo-mere motion,20 with similar consequences for the membrane channels investigated inref. 15. Finally, anomalous diffusion would strongly influence the dynamics ofsurface-bulk exchange.21,22
As far as membrane proteins and lipids are concerned, the current understandingof their lateral diffusion is almost completely based on considerations in rather ideal-ized conditions compared to a real biological environment, as the issues due to, e.g.,crowding, have not been clarified. Nonetheless, recent progress has provided a greatdeal of new insight into the mechanisms and physical laws associated with lipid andprotein motion under protein-poor conditions. For instance, atomistic simulationsrecently showed23 that the so-called free-volume theories24–26 often used to interpretlipid diffusion data are incomplete, as they do not account for the proper diffusionmechanism of lipids. Unlike assumed earlier, the mechanism by which lipids diffusein the plane of a membrane turned out to be a concerted one, based on tens of lipidsmoving in unison as loosely defined dynamical clusters.23,27 These predictions basedon simulations were recently verified by quasi-elastic neutron scattering
View
Faraday Discuss. This journal is ª The Royal Society of Chemistry 2013

Dow
nloa
ded
by S
CD
Uni
vers
ité P
aris
7 o
n 10
Oct
ober
201
2Pu
blis
hed
on 0
1 Ju
ne 2
012
on h
ttp://
pubs
.rsc
.org
| do
i:10.
1039
/C2F
D20
085F
Online
experiments.28 Also, it has been found that not only lipid diffusion but also proteinmotion is based on concerted effects, as atomistic as well as coarse-grained simula-tions have highlighted membrane proteins to diffuse as dynamical clusters togetherwith about 100 lipids around them,29 the size of the complex being much larger thanthe size of the protein itself. As the current paradigm of membrane protein diffusionin protein-poor membranes is based on the Saffman–Delbr€uck model,30 whichdescribes the protein diffusion coefficient in terms of physical parameters such asprotein size, even the understanding of lateral diffusion in protein-poor conditionsis an important goal.However, when more complex situations have been considered, experiments haveshown that in native cell membranes the diffusion of proteins and lipids can bedistinctly different compared to simplified model systems.31–36 One of the strikingfindings is that if identical proteins undergo lateral diffusion in the membranes ofseemingly identical cells, the diffusion coefficients determined for individual proteinsin different regions of a membrane may be quite different, differing by a factor offive.33 This conclusion seems to hold true regardless of the fact that the motion ofthe proteins has been followed up to macroscopic time scales. Meanwhile, diffusionof lipids can also be quite complex. Recent super-resolution microscopy studies ofliving cells have shown that the motion of lipids can be slowed down significantlyon time scales of the order of milliseconds and length scales of tens of nanometers,34
suggesting that there are unknown mechanisms to confine diffusion of specific lipidtypes.While these two examples are just suggestive, they highlight the complexity of
molecular motion in membrane systems. There are many factors that can affecthow rapidly molecules diffuse in membranes, and it is quite plausible that manyof them contribute at the same time. First, the roles of the actin and cytoskeletonnetworks are often important, as they create domains that confine molecularmotion.35 Specific lipid–protein and protein–protein interactions can alsocontribute, slowing down diffusion through complex formation. Lipids in thevicinity of membrane proteins are known to diffuse much more slowly comparedto lipids far from proteins.29 Furthermore, it is clear that crowding can have an influ-ence on lateral molecular motion, since with large enough protein concentrations themotion of lipids and proteins will be blocked.32,37,38 Overall, one can conclude thatthe complexity of native cell membranes renders studies of protein and lipid diffu-sion quite difficult, and care is warranted when the results are being interpreted.The main objective of this work is to shed light on the implications of crowding on
the dynamics of lipids and membrane proteins. This broad topic embraces consider-ations of how lateral diffusion coefficients depend on crowding of proteins andmolecular packing of lipids, and how the time scales of anomalous diffusion andits exponent relate to crowded conditions. For lipids, anomalous diffusion hasbeen identified in previous studies,39–41 but its biological significance has remainedunclear. As for membrane proteins, recent simulations have identified anomalousdiffusion to be an intrinsic property of protein motion under crowding,38 thoughits biological relevance is not understood.Here we have considered these topics from two complementary viewpoints. First,
we have elucidated crowding in the sense of packing through atomistic simulations ofprotein-free lipid monolayers, with a purpose to understand how membrane densityaffects lipid dynamics in the membrane plane. In a biological context, this is a rele-vant question, e.g., during the respiratory cycle during which the monolayer-likelung surfactant is first expanded and then compressed. Second, we investigatedhow crowding of membrane proteins affects lateral dynamics in tensionless lipid bila-yers. This topic is biologically highly relevant since—as mentioned above—nativecell membranes are rich in proteins.We have found that anomalous diffusion is an inherent property in both protein-
free and protein-rich membranes, and that the time scales of anomalous diffusionand the anomalous diffusion exponents of lipids and proteins strongly depend on
View
This journal is ª The Royal Society of Chemistry 2013 Faraday Discuss.

Dow
nloa
ded
by S
CD
Uni
vers
ité P
aris
7 o
n 10
Oct
ober
201
2Pu
blis
hed
on 0
1 Ju
ne 2
012
on h
ttp://
pubs
.rsc
.org
| do
i:10.
1039
/C2F
D20
085F
Online
packing/crowding. Strikingly, while in protein-poor conditions normal diffusion isobserved in hundreds of nanoseconds, in protein-rich (crowded) conditions the onsetof normal diffusion takes place in tens of microseconds, and in the most crowdedsystems quite likely on time scales that are no less than milliseconds. Given thatthe time scales associated with normal diffusion are so long, this matter has to beaccounted for in analysis of diffusion data, and especially in simulations wherethe time scale problem is very severe even with coarse-grained simulation models.Moving on, we also discuss physical limits of protein motion, paying attention tothe optimal protein concentration where protein diffusion would be fast enoughto enable sufficiently rapid motion over large length scales and also promoteprotein–protein collisions needed for protein complex formation.View
2 Methodology
2.1 Langmuir monolayers
We used atomistic molecular dynamics (MD) simulations to consider seven Lang-muir monolayer systems with a mean molecular area ranging from 44 �A2 to 68�A2, with a uniform spacing of 4 �A2. With this range of compression, the monolayerstates cover liquid condensed to liquid expanded phases. Further compression wasfound to result in monolayer buckling, while further expansion induced formationof holes.The studied systems consisted of two monolayers separated by a water slab and a
thick vacuum region to separate the monolayers from one another (see Fig. 1 forsnapshots of individual monolayers in the systems). The monolayers contained100 lipid molecules each, with the composition of 60 mol% dipalmitoylphosphatidyl-choline (DPPC), 20 mol% palmitoyloleoylphosphatidylcholine (POPC), 10 mol%palmitoyloleoylphosphatidylglycerol (POPG), and 10 mol% cholesterol, in
Fig. 1 Snapshots of the monolayer systems at a water–air interface at two different compres-sions: a fairly compressed system with hAi ¼ 48 �A2 is shown above and a system with a lowersurface pressure and hAi ¼ 64 �A2 is depicted below. Lipids are drawn in the liquorice schemewith DPPC presented in green, POPC in white, POPG in yellow, and cholesterol in orange.Water is shown using the van der Waals scheme. For clarity, lipids on the sides have notbeen truncated but there are still periodic boundaries on both sides. Snapshots have beenrendered with VMD.
Faraday Discuss. This journal is ª The Royal Society of Chemistry 2013

Dow
nloa
ded
by S
CD
Uni
vers
ité P
aris
7 o
n 10
Oct
ober
201
2Pu
blis
hed
on 0
1 Ju
ne 2
012
on h
ttp://
pubs
.rsc
.org
| do
i:10.
1039
/C2F
D20
085F
Online
agreement with experimental measurements on the human lung surfactant.42 Exten-sive hydration was achieved with 7235 water molecules. A concentration of 150mMol of NaCl was included in order to mimic physiological conditions. Additionalsodium ions were added to neutralize the negative charges in POPG head groups.Two systems with mean molecular areas equal to 48 �A2 and 64 �A2 are representedin Fig. 1, showing clearly the difference in the ordering of their tails.As described in our earlier work,43 the force fields used for lipids followed theBerger description,44 for cholesterol we used the description of Holtje et al.,45 andfor water we used the TIP3P model.46 Salt and counterions were described by theGROMACS force field.All simulations were conducted using the GROMACS simulation package.47 The
leap-frog integrator was employed in all simulations with a time step of 2 fs. NVTconditions were applied with temperature kept constant at 310 K with the Nos�e–Hoover thermostat48 with a time constant of 0.5 ps. Electrostatics were handledwith the PME algorithm49 of the order of 4. The cut-off used between real andinverse space calculations was 1 nm. The Lennard-Jones potential was cut-off at 1nm and the neighbor list for the long-range interactions with a radius of 1 nmwas updated every 10 steps. All bonds were constrained with LINCS50 of the orderof 4. Further details of the simulation model and protocol can be found from ref. 43.Three sets of simulations were performed with different sampling frequencies in
order to obtain information of lipid motion over a wide range of time scales fromtens of femtoseconds to hundreds of nanoseconds. The shortest simulations wereran for 500 ps with data collected every 10 fs. The values for the second set were10 ns and 100 fs, respectively. Finally, all the systems were simulated for at least100 ns with coordinates saved every 10 ps. As the regime of normal diffusion wasnot achieved even after 100 ns, the simulations of the limiting cases of the mostexpanded and the most compressed systems were further extended to 660 ns and610 ns, respectively. Data corresponding to the first 10% of the trajectories were dis-carded in all analyses.
View
2.2 Membrane proteins in lipid bilayers
To consider the joint lateral diffusion of proteins and lipids in membranes, we usedcoarse-grained (CG) models for two different one-component lipid bilayers to hostmembrane proteins. The first set of bilayers was composed of dilinoleoylphosphati-dylcholine (DLPC) lipids, while the second one was comprised of dipalmitoylphos-phatidylcholine (DPPC) lipids. These bilayers were simulated with a varying numberof NaK channel (2AHY) proteins embedded in the membranes. The starting struc-tures consisted of proteins positioned in a grid in the membrane plane.The choice of these lipids and proteins was based on careful testing that concluded
their properties to be distinctly different with respect to protein aggregation. InDLPC bilayers, NaK channels were found to avoid aggregation due to the minorhydrophobic mismatch between the proteins and the lipid bilayer. In DPPC bilayers,the situation was completely different, as NaK proteins were observed to preferforming aggregates due to their larger hydrophobic mismatch. Therefore, the choiceof lipids and proteins in our models is not based on their biological relevance butinstead is just pragmatic: with these choices we can model two different scenarios,one preferring protein aggregation (DPPC) and another avoiding it (DLPC). Inthis spirit, the DPPC and DLPC systems are from here on referred to as aggregating(A) and non-aggregating (NA), respectively. Snapshots of chosen systems in the endof simulations are shown in Fig. 2.Both systems were studied with multiple protein-to-lipid ratios (1 : 50, 1 : 75,
1 : 100, 1 : 150, and 1 : 200 in each leaflet, see Table 1) to consider diffusion atdifferent levels of crowding. In addition, systems with a single protein embeddedin a bilayer were also considered to describe dilute (protein-poor) conditions thatwe here denote as a protein-to-lipid ratio as 1 : infinity. The simulated systems
This journal is ª The Royal Society of Chemistry 2013 Faraday Discuss.

Fig. 2 Snapshots of protein–lipid systems with selected protein-to-lipid ratios. The aggre-gating DPPC system (A) is shown on the left hand side and the non-aggregating DLPC(NA) system on the right. The upper images show the system with a protein-to-lipid ratio of1 : 50 in each leaflet, and the lower ones the case with the protein-to-lipid ratio of 1 : 100 perleaflet. In each case, the simulated system has been repeated four times (2 � 2) with periodicboundary conditions to better visualize large-scale ordering. Snapshots correspond to theend of each respective simulation. Proteins are colored in yellow and lipids in brown. Pictureshave been rendered with VMD.
Table 1 Details of the simulated protein–lipid systems. ‘‘A’’ stands for aggregating, ‘‘NA’’ for
non-aggregating, and ‘‘INF’’ stands for infinity. The number of proteins refers to the total
number in the bilayer. The number of lipids in the 1 : INF system is 2045 (DPPC) or 3000
(DLPC)
DPPC (A)
Protein-to-lipid ratio 1 : 50 1 : 75 1 : 100 1 : 150 1 : 200 1 : INF
No. of proteins 16 16 9 9 4 1
Size in x/y (nm) 27.4 31.3 26.1 30.9 23.4 25.1
Size in z (nm) 9.5 9.3 9.5 9.3 9.6 9.4
DLPC (NA)
Protein-to-lipid ratio 1 : 50 1 : 75 1 : 100 1 : 150 1 : 200 1 : INF
No. of proteins 16 16 9 9 4 1
Size in x/y (nm) 27.2 31.2 26.1 30.7 23.3 30.1
Size in z (nm) 9.3 9.4 9.2 9.3 9.2 9.1
Dow
nloa
ded
by S
CD
Uni
vers
ité P
aris
7 o
n 10
Oct
ober
201
2Pu
blis
hed
on 0
1 Ju
ne 2
012
on h
ttp://
pubs
.rsc
.org
| do
i:10.
1039
/C2F
D20
085F
View Online
contained one, four, nine, or sixteen proteins depending on the protein-to-lipid ratio.For comparison with experimental studies, the surface area covered by proteins wasin the different DPPC–NaK systems as follows: 2.4% (1 : infinity), 11% (1 : 200),15% (1 : 150), 21% (1 : 100), 27% (1 : 75), and 34% (1 : 50). The system dimensionsranged between 23 and 31 nm along the bilayer (xy-plane). The thickness of thesystem along membrane normal direction (z) was about 10 nm. These values arelisted in Table 1.The molecules were modelled with a CG force field derived from MARTINI51–53
and modified for membrane peptides and proteins.54 The starting structure of the
Faraday Discuss. This journal is ª The Royal Society of Chemistry 2013

Dow
nloa
ded
by S
CD
Uni
vers
ité P
aris
7 o
n 10
Oct
ober
201
2Pu
blis
hed
on 0
1 Ju
ne 2
012
on h
ttp://
pubs
.rsc
.org
| do
i:10.
1039
/C2F
D20
085F
Online
protein was also based on the earlier work discussed elsewhere.54 The simulationswere carried out using the GROMACS simulation package.47 The A-systems weresimulated for 26 ms and the NA-systems for 10 ms. Data were collected every 100ps. The time step was fixed to 40 fs in all simulations. Data corresponding to the firstmicrosecond of simulation were discarded in all diffusion analysis to account forequilibration. Below, the time scales reported for the CG models are the real simu-lation times without a commonly used scaling factor of four51–53 that is used toaccount for the faster dynamics in CG models compared to atomistic ones.However, the diffusion coefficients reported below have been scaled by this factor.The electrostatics were handled by potentials shifted to zero in the interval from0 to 1.2 nm. The Lennard-Jones interactions were shifted in between 0.9 and 1.2 nm.Neighbor lists with a radius of 1.2 nm were updated every 10 steps. NPT ensemblewas adapted and pressure was held constant at 1 bar with the Parrinello–Rahmanbarostat55 with a time constant of 4 ps and compressibility of 4 � 10�5 bar�1. Thex and y directions were coupled together and z separately. The system was alsocoupled to a heat bath at 310 K produced by the Nos�e–Hoover thermostat48 witha time constant of 1 ps. No constraints were applied to the bonds.
View
2.3 Mean-squared displacement
The mean-squared displacement (MSD) curves act as a starting point for the diffu-sion analysis. The MSD can be calculated as
MSD(t) ¼ h[ri(t + t0) � ri(t0)]2i, (1)
where ri(t) is the location of the examined particle i at time t. Angular bracketsdenote averaging over both time and the set of examined particles. Lateral diffusioncoefficient describing the pace of motion in the xy (membrane) plane is obtainedfrom the MSD as
DL ¼ limt!N
MSDðtÞ4t
: (2)
TheMSD in eqn (1) is based on a time average taken over the time series r(t) of thelipid motion. While viscoelastic subdiffusion is ergodic in the sense that in the limitof long measurement times the ensemble average and the time average of the MSDare identical for free motion56–58 (in contrast to anomalous diffusion with scale-freewaiting time distributions59 as observed in ref. 15), for finite measurement timesthe amplitude of the time averaged MSD fluctuates around the ergodic value.57
A smooth curve may be obtained by averaging the time averaged MSD over indi-vidual trajectories. Further, it is important to mention that the long-time limit ineqn (2) means that DL should be determined from the region where MSD(t) � ta
with a ¼ 1.In Langmuir monolayers, the MSD curves were computed for the 90 phospholipid
molecules in each monolayer (diffusion of cholesterol was not included in the anal-ysis). The two monolayers in each system (separated by vacuum) were consideredindependently, and the motion of the centre of mass (COM) of the examined mono-layer was discarded before the analysis. This choice was made to avoid possibleissues, which could arise from the motion of the leaflet as a whole,60,61 and therefore,in practice, the motion of each lipid’s COM was determined with respect to thecenter of mass of the monolayer in which the given lipid resides. Data used in furtheranalysis were based on an average of MSD results of the two monolayers.In protein–bilayer systems, the integral proteins anchor the leaflets to one another,
and hence the possible motion of the two bilayer leaflet COMs (compared to eachother) is expected to be much slower compared to membrane protein-free systems.Given this, in bilayer systems we first removed the COM motion of the membrane
This journal is ª The Royal Society of Chemistry 2013 Faraday Discuss.

Dow
nloa
ded
by S
CD
Uni
vers
ité P
aris
7 o
n 10
Oct
ober
201
2Pu
blis
hed
on 0
1 Ju
ne 2
012
on h
ttp://
pubs
.rsc
.org
| do
i:10.
1039
/C2F
D20
085F
Online
(by accounting for all lipids and proteins, but not water) and then determined thedisplacements of particles’ COM to compute the MSDs.View
2.4 Exponent associated with mean-squared displacement
We assume the mean-squared displacement to scale as a power-law in time asfollows:
MSD(t) � ta, (3)
where a ¼ a(t) is the time-dependent anomalous diffusion exponent. By definition,the exponent can be obtained as the slope of log(MSD) versus log(t). In practice, theMSD data are first translated to a logarithmic scale. However, as particle locationsare sampled at constant time intervals in our simulations, the data obtained are notuniformly spaced in the logarithmic description. To fix this issue for further analysis,a smoothing spline was fitted to the log–log data and the spline was sampled atconstant intervals in the logarithmic scale. This fitting procedure also smoothedroughness in the data which occurs when data saved from different sets of simula-tions with different saving frequencies overlap.The time dependence of a was calculated by fitting a straight line to a moving
window containing 20 data points (represented in a log–log scale) both backwardand forward of the examined moment of time. This interval corresponds to 0.41time units in logarithmic scale with a base of 10.In a further step the anomalous motion should be scrutinised through additional,
complementary analysis tools to diagnose precisely the nature of the stochasticmotion of lipids and proteins. For instance, one may analyse moment ratios,62 thevelocity autocorrelation,57 or apply the p-variation method.63 The results of analysisbased on these tools will be discussed elsewhere.
3 Results
3.1 Diffusion in Langmuir monolayers
The MSD curves obtained from the longest simulations are shown in Fig. 3. Thedata of the most compressed and the most expanded systems have been calculatedfrom the whole trajectory (>600 ns), resulting in better statistical quality comparedto the other cases where simulations lasted for 100 ns. Still, in all cases the MSD dataare fairly smooth.
Fig. 3 MSD curves of phospholipids in the monolayer systems, with colors corresponding todifferent compression states. Dashed lines show the time range used in fitting eqn (2) to thedata.
Faraday Discuss. This journal is ª The Royal Society of Chemistry 2013

Dow
nloa
ded
by S
CD
Uni
vers
ité P
aris
7 o
n 10
Oct
ober
201
2Pu
blis
hed
on 0
1 Ju
ne 2
012
on h
ttp://
pubs
.rsc
.org
| do
i:10.
1039
/C2F
D20
085F
Online
The data in Fig. 3 bring about a very important point which one should pay atten-tion to in all the discussion below. That is, the MSDs in Fig. 3 are seemingly linear intime, therefore supporting the idea that one could use eqn (2) to determine the diffu-sion coefficient. However, as the data and the discussion below show, this is not thecase. Nonetheless, for the time being, let us assume that the assumption of MSD(t)�t1 holds. Possible issues related to the calculation of the diffusion coefficient whenthe exponent is less than one will be addressed and discussed later in the Discussion.The diffusion coefficients obtained from fitting eqn (2) to theMSD data are showninFig. 4. The diffusion coefficients are consistent with the expected behavior that lipiddynamics are faster the looser the packing in a monolayer. The diffusion coefficientsare also in agreement with experimentally and computationally measured values forlipid diffusion in monolayers, if the effect of cholesterol is taken into account (seediscussion in ref. 43). Notably, even in the most packed system (44 �A2) the diffusioncoefficient is several orders of magnitude larger compared to diffusion in the gel(solid-like) phase, where diffusion coefficients in lipid bilayers are1 of the order of10�16–10�11 cm2 s�1, highlighting that all systems considered here are fluid.
View
3.2 Self-assembly of membrane proteins in bilayers
Before considering lateral diffusion in lipid bilayers with membrane proteins, it iscrucial to have well-defined systems that have equilibrated. To this end, the aggrega-tion tendency of membrane proteins was investigated by calculating the number ofclose contacts between proteins during the simulations. The calculation was per-formed every 100 ns, analyzing the first 10 ms of all systems. Two proteins wereconsidered to be in close contact if the distance between their centres of mass inthe xy-plane was smaller than 1.7 times the initial maximum distance between thebeads of a protein and its COM.While protein radius is not easy to define, accordingto our benchmarks on the validity of the chosen criterion, the chosen value wasfound to best describe the limit at which there is a contact between two proteins.The calculated aggregation maps are shown in Fig. 5.The results (Fig. 5) confirm the conclusion which was readily hinted by Fig. 2:
proteins in A-systems start to form aggregates already after a few hundred nanosec-onds and almost all proteins become connected to each other during the first micro-second. The clusters of proteins are also stable in the A-system. This result alsosupports our choice to discard the first microsecond of simulation data from theanalysis as the formation of protein aggregates takes about a microsecond.In the NA-system, proteins tend to stay unconnected for up to microseconds and
some of them remain separated from other proteins during the whole 10 ms
Fig. 4 Diffusion coefficients of phospholipids in Langmuir monolayer systems as a function ofmean area per molecule.
This journal is ª The Royal Society of Chemistry 2013 Faraday Discuss.

Fig. 5 The number of close contacts that each protein has with other proteins. The two upperfigures show the behavior in the aggregating DPPC system (A) with protein-to-lipid ratios of1 : 75 (top) and 1 : 100 (second from top). The two lower plots show the number of closecontacts in the non-aggregating DLPC system (NA) with similar protein-to-lipid ratios of1 : 75 (second from bottom) and 1 : 100 (bottom). Note that the color bars are scaled differ-ently in systems with a different total number of proteins.
Dow
nloa
ded
by S
CD
Uni
vers
ité P
aris
7 o
n 10
Oct
ober
201
2Pu
blis
hed
on 0
1 Ju
ne 2
012
on h
ttp://
pubs
.rsc
.org
| do
i:10.
1039
/C2F
D20
085F
View Online
simulation. The aggregates in the NA-system are also able to break apart once theyare formed.The difference in protein behavior between the two lipid–protein systems, and
especially the time it takes to form aggregates, cannot be explained by the speedof lateral dynamics. The proteins in DLPC (NA) membranes have higher diffusioncoefficients compared to the DPPC (A) membranes (data to be shown below), thusin the NA-systems the proteins meet other proteins on time scales shorter than thosein the A-systems. Yet, the aggregates form faster in the A-systems, which confirmsthe higher aggregation tendency of proteins in the DPPC bilayer.
3.3 Diffusion in aggregating (A) protein system
With the first microsecond of data discarded, a total of 25 ms of simulation time wasconsidered for MSD calculation of the aggregating NaK–DPPC system. The MSDcurves for lipids are shown in Fig. 6 and for proteins in Fig. 7.Fig. 6 suggests that the dynamics of lipids are faster in the less crowded systems, as
expected. Diffusion slows down even for minor protein concentrations, and thiseffect is the stronger the larger is the concentration of proteins.The effect of crowding on protein motion is even more dramatic than in the case of
lipids, see Fig. 7. The system with a protein-to-lipid ratio of 1 : 200 shows a drasticslowing down of diffusion.The lipid diffusion coefficients determined from the MSD curves with different
levels of crowding are listed in Fig. 8. The diffusion coefficients decrease almost line-arlywith increasing protein-to-lipid ratio. The decrease arises in part from the effect ofblocking: as the protein content increases, there is less space for lipid motion, slowingdown diffusion. Confinement of lipids in cages formed by proteins strengthens thiseffect (see Fig. 2), and it is likely that lipid–protein interactions play a role, too. Inexperiments, in line with our data, proteins have been found to cause a significantreduction in lateral diffusion rate of phospholipids in the plane of membranes.8
Faraday Discuss. This journal is ª The Royal Society of Chemistry 2013

Fig. 6 MSD curves of lipids in the DPPC (A) systems with different protein-to-lipid ratios.Dashed lines show the time range used in fitting eqn (2) to the data.
Fig. 7 MSD curves of proteins in the DPPC (A) systems. The time range used for fitting eqn(2) is shown with a pair of dashed lines.
Fig. 8 Diffusion coefficients of lipids in membranes with different protein-to-lipid ratios: datafor DPPC (red) and DLPC (blue). INF stands for infinity. The diffusion coefficients in x and ydirections have been drawn with dashed and dotted lines of the same color, respectively, fullcurve being the average.
Dow
nloa
ded
by S
CD
Uni
vers
ité P
aris
7 o
n 10
Oct
ober
201
2Pu
blis
hed
on 0
1 Ju
ne 2
012
on h
ttp://
pubs
.rsc
.org
| do
i:10.
1039
/C2F
D20
085F
View Online
The values for the diffusion coefficient in x and y directions were also calculated inorder to examine the possible anisotropic effects of wall-like structures formed byprotein aggregation. These coefficients are also shown in Fig. 8. Not surprisingly,
This journal is ª The Royal Society of Chemistry 2013 Faraday Discuss.

Dow
nloa
ded
by S
CD
Uni
vers
ité P
aris
7 o
n 10
Oct
ober
201
2Pu
blis
hed
on 0
1 Ju
ne 2
012
on h
ttp://
pubs
.rsc
.org
| do
i:10.
1039
/C2F
D20
085F
Online
in some systems lateral diffusion is not uniform in both directions in the plane. Thesedifferences in x and y directions may also in part be due to finite size effects.However, the differences are relatively small.The diffusion of proteins is even more affected by crowding, see Fig. 9. First, forthe aggregating proteins, the dependence of protein diffusion coefficient on protein-to-lipid ratio is stronger than linear. Second, its values span two orders of magnitudein the case of the DPPC (A) system. A seemingly minor increase in protein contentfrom 1 : infinity to 1 : 200 slows diffusion down by a factor of four. In the mostcrowded DPPC–NaK system protein motion has virtually stopped, which isdescribed by a very low value of the diffusion coefficient (about 1 � 10�10 cm2
s�1). When the diffusion coefficients of lipids and proteins are compared to eachother, the diffusion of proteins is slower by a factor of 5 (protein-poor) to 30(protein-rich conditions).If the diffusion of membrane proteins could be described in terms of hard disks
moving on a plane, then the protein diffusion coefficient would decrease linearlyfor increasing area fraction covered by proteins.64 Based on Fig. 9, this behaviorholds approximately well at small protein-to-lipid ratios but breaks down around1 : 150, where protein clustering becomes evident. Clearly, aggregation of proteinsplays a profound role in protein diffusion under crowding, and theoretical workto describe this behavior would be welcome.Experiments have shown quite generally that the lateral diffusion coefficient of
membrane proteins decreases for increasing protein concentration,32,37,65 in agree-ment with our data.
View
3.4 Diffusion in non-aggregating (NA) protein systems
The analysis on the non-aggregating protein–DLPC system was performed similarlyas on the aggregating protein–DPPC system. The diffusion coefficients are depictedin Fig. 8 and 9.Diffusion coefficients of lipids in the non-aggregating systems are 1.5 to 5 times
higher than the values in the aggregating DPPC membranes. In the limit of smallprotein concentration (1 : infinity), aggregation of proteins cannot affect lipid diffu-sion, thus the main reason why DLPC and DPPC diffuse at a different pace in thislimit is the different viscosity (or alternatively a different membrane fluiditydescribed also by a different average area per lipid) of these lipid bilayers. If changesin membrane viscosities are assumed to be similar in DPPC and DLPC bilayers with
Fig. 9 Diffusion coefficients of NaK channel proteins in membranes with different protein-to-lipid ratios. Curves show lateral diffusion coefficients in DPPC (red) and DLPC membranes(blue). INF stands for infinity.
Faraday Discuss. This journal is ª The Royal Society of Chemistry 2013

Dow
nloa
ded
by S
CD
Uni
vers
ité P
aris
7 o
n 10
Oct
ober
201
2Pu
blis
hed
on 0
1 Ju
ne 2
012
on h
ttp://
pubs
.rsc
.org
| do
i:10.
1039
/C2F
D20
085F
Online
increasing protein density, then in the 1 : 50 ratio, the diffusion of DPPC is sloweddown by a factor of 3.6 compared to DLPC, and this difference is due to proteinaggregation.Protein diffusion in the DPPC system is slowed down by a factor of 1.5 to 10compared to DLPC, as the protein-to-lipid ratio is increased from 1 : infinity to1 : 50, respectively. Again in the dilute protein system, the difference in protein diffu-sion coefficients is due to different membrane viscosities in the DLPC and DPPCbilayers. The remaining part is due to aggregation, or changes in membrane viscosityassociated with aggregation.
3.5 Anomalous diffusion exponent
3.5.1 Langmuir monolayer systems. As data on lipid diffusion in Langmuirmonolayers were collected in multiple simulations with different data saving inter-vals, it was first combined for the log–log plots. The smoothed data, spanning almost8 orders of magnitude, are shown in Fig. 10.We can readily find three different regimes in Fig. 10. First, there is a regime cor-
responding to superdiffusive ballistic motion at very short time scales. In this regime,the exponent a ¼ 2. Anomalous diffusion follows after a transition period and ischaracterized by an exponent smaller than one. Finally, at long times, one finds atransition towards normal diffusion characterized by an exponent a ¼ 1.For further analysis, let us focus on how a behaves in time, see Fig. 11. It is readily
seen that the level of compression has a profound effect on the nature of diffusivemotion. At very short times the behavior in the monolayers subject to differentpacking conditions is similar, characterizing ballistic motion. However, the curvesdescribing different packing conditions start to separate from each other in a timescale of hundreds of femtoseconds.Subsequently, superdiffusion changes into subdiffusion in about 1 picosecond,
and one finds a plateau consistent with subdiffusion with an exponent that isapproximately constant over several orders of magnitude in time, starting between1 and 10 picoseconds. The subdiffusion exponents of the most compressed andthe most expanded systems were found to be quite low: 0.30 and 0.57, respectively.The tighter the packing, the smaller the exponent.After the subdiffusive regime, the exponents start to grow, expected to level off at
a value of one, thus describing normal random walk like diffusion at long times. Inthe most expanded system the long-time regime was almost reached during the simu-lations, and one can estimate that the onset of normal diffusion (sonset) in this case is
View
Fig. 10 Mean-squared displacements of lipids in Langmuir monolayers shown on a log–logscale. The dashed gray lines show normal diffusion behavior with a ¼ 1. Color code used inthe curves is as follows: 44 �A2 (blue), 48 �A2 (brown), 52 �A2 (green), 56 �A2 (orange), 60 �A2
(cyan), 64 �A2 (black), and 68 �A2 (red).
This journal is ª The Royal Society of Chemistry 2013 Faraday Discuss.

Fig. 11 Time evolution of the exponent a associated with the mean-squared displacement oflipids in Langmuir monolayers. Color code used in the curves is as follows: 44 �A2 (blue), 48 �A2
(brown), 52 �A2 (green), 56 �A2 (orange), 60 �A2 (cyan), 64 �A2 (black), and 68 �A2 (red). Dashedblack line shows the expected extrapolation to ballistic behaviour (a ¼ 2), and the dashedred and blue lines show extrapolation to normal diffusion (a ¼ 1) at long times. Dotted redand blue lines guide the eye to the estimated time scales in which normal diffusion is reached,and also to the subdiffusion exponent. Dashed gray line shows the normal diffusion exponent.Error bars (considering the standard error of the mean) in the value of a are very small at shorttimes (�0.01) and increase slightly at longer times (�0.03).
Dow
nloa
ded
by S
CD
Uni
vers
ité P
aris
7 o
n 10
Oct
ober
201
2Pu
blis
hed
on 0
1 Ju
ne 2
012
on h
ttp://
pubs
.rsc
.org
| do
i:10.
1039
/C2F
D20
085F
View Online
close to 1 microsecond. Other, more compressed systems are expected to behavesimilarly but less rapidly, and our best educated guess based on the data inFig. 11 suggests that the onset of normal diffusion ranges in these cases from about1 to 10 microseconds.
3.5.2 Aggregating protein systems. For the DPPC system with protein aggrega-tion, the time evolution of a for lipid motion is shown in Fig. 12. The correspondingcurve for protein diffusion is depicted in Fig. 13.We stress that the data in this case have been collected at fairly long intervals of
100 picoseconds in order to focus on the long-time motion. Therefore, a plateauassociated with subdiffusion is not included in Fig. 12 and 13 (compared toFig. 11). It would appear at short times (<1 ns) if data of particle positions hadbeen saved more frequently.
Fig. 12 Exponent characterizing lipid motion in the aggregating DPPC systems. Curves arecolored as follows: 1 : 50 (blue), 1 : 75 (red), 1 : 100 (green), 1 : 150 (black), 1 : 200 (orange),and 1 : infinity (cyan). Error bars (considering the standard error of the mean) in the valueof a are the smallest at short times (<0.01) and increase up to about �0.01 at 3 ms. Extrapola-tions at the longest times (shown by dashed lines) are based on a conservative estimate of a(t)between about 10–20 ms.
Faraday Discuss. This journal is ª The Royal Society of Chemistry 2013

Fig. 13 Exponent characterizing protein motion in the aggregating DPPC systems. Curves arecolored as follows: 1 : 50 (blue), 1 : 75 (red), 1 : 100 (green), 1 : 150 (black), 1 : 200 (orange),and 1:infinity (cyan). Error bars are about �0.01 at short times and about �0.02 at the longesttimes.
Dow
nloa
ded
by S
CD
Uni
vers
ité P
aris
7 o
n 10
Oct
ober
201
2Pu
blis
hed
on 0
1 Ju
ne 2
012
on h
ttp://
pubs
.rsc
.org
| do
i:10.
1039
/C2F
D20
085F
View Online
Let us first focus on lipid motion (Fig. 12). At times of the order of 1–100 ns, theexponent in every case increases towards one, reflecting a tendency to aim forrandom walk like motion. In the most dilute system with just a single membraneprotein, the regime of normal diffusion is indeed reached in about 100 ns. However,in other systems where crowding of proteins becomes more prominent, the exponentfalls down and reaches a minimum at 1–10 ms, the exponent being the smaller themore crowded the membrane is, and the time at which the minimum is observedincreasing for increasing crowding. We discuss this in more detail below.The collisions of lipids with proteins become more and more frequent for
increasing protein concentration, giving rise to dynamical correlations in lipidmotion, which in turn is manifested as anomalous diffusion (a < 1) where the motionof lipids has a memory. We find that the anomalous diffusion exponent decreases forincreasing protein concentration, in agreement with experiments by Horton et al.66
At very long times the lipids will undergo a random walk characterized by a¼ 1, andtherefore one can expect the curves in Fig. 12 to eventually recover to a value of one.How long this takes is not clear, though. The data in Fig. 12 suggest that for inter-mediate crowding (1 : 200, 1 : 150, 1 : 100) normal diffusion would be observed attimes of the order of 10 ms. For the most crowded systems (1 : 75, 1 : 50), the timescale of reaching normal diffusion is considerably larger, and our best educatedguess based on interpolation of the data is that normal diffusion would be observedat times of the order of 100 ms or even milliseconds.Let us come back to Fig. 12 and discuss why the anomalous diffusion exponent
decreases at intermediate times. The data below (Fig. 16) for the non-aggregatedlipid–protein system do not highlight a similar major decrease in a, thus the dropin the exponent cannot be due to lipid–protein collisions as such. Instead, it turnedout that the decrease in a is largely due to lipids whose motion is confined due toproteins around them. As Fig. 2 shows, there are membrane regions where the lipidsare surrounded by proteins from all possible directions, confining their motion to alimited part of the membrane. This is illustrated in Fig. 14, which shows a trajectoryof a single tagged lipid during a 25 ms simulation. The motion of the lipid is clearlyrestricted, allowing it to access only part of the membrane surface. If the confine-ment would continue over a period longer than the simulation time, then MSDwould converge to a constant value, implying that one would have a situation whereMSD(t) � t0. The data in Fig. 12 suggest that the waiting time of lipids to escapeconfined regions is large, but it is smaller than the simulation time. This is also sup-ported by the data in Fig. 15, which depicts time-averaged MSDs of all lipids in theDPPC system one by one, and, more importantly, the distribution of the single-particle-based anomalous diffusion exponents at times of 10 ns and 1 ms. The
This journal is ª The Royal Society of Chemistry 2013 Faraday Discuss.
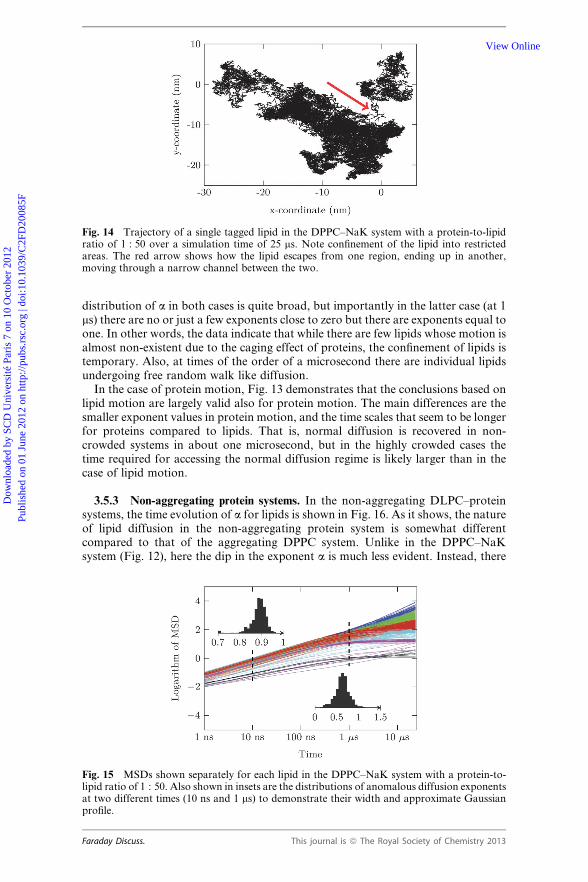
Fig. 14 Trajectory of a single tagged lipid in the DPPC–NaK system with a protein-to-lipidratio of 1 : 50 over a simulation time of 25 ms. Note confinement of the lipid into restrictedareas. The red arrow shows how the lipid escapes from one region, ending up in another,moving through a narrow channel between the two.
Dow
nloa
ded
by S
CD
Uni
vers
ité P
aris
7 o
n 10
Oct
ober
201
2Pu
blis
hed
on 0
1 Ju
ne 2
012
on h
ttp://
pubs
.rsc
.org
| do
i:10.
1039
/C2F
D20
085F
View Online
distribution of a in both cases is quite broad, but importantly in the latter case (at 1ms) there are no or just a few exponents close to zero but there are exponents equal toone. In other words, the data indicate that while there are few lipids whose motion isalmost non-existent due to the caging effect of proteins, the confinement of lipids istemporary. Also, at times of the order of a microsecond there are individual lipidsundergoing free random walk like diffusion.In the case of protein motion, Fig. 13 demonstrates that the conclusions based on
lipid motion are largely valid also for protein motion. The main differences are thesmaller exponent values in protein motion, and the time scales that seem to be longerfor proteins compared to lipids. That is, normal diffusion is recovered in non-crowded systems in about one microsecond, but in the highly crowded cases thetime required for accessing the normal diffusion regime is likely larger than in thecase of lipid motion.
3.5.3 Non-aggregating protein systems. In the non-aggregating DLPC–proteinsystems, the time evolution of a for lipids is shown in Fig. 16. As it shows, the natureof lipid diffusion in the non-aggregating protein system is somewhat differentcompared to that of the aggregating DPPC system. Unlike in the DPPC–NaKsystem (Fig. 12), here the dip in the exponent a is much less evident. Instead, there
Fig. 15 MSDs shown separately for each lipid in the DPPC–NaK system with a protein-to-lipid ratio of 1 : 50. Also shown in insets are the distributions of anomalous diffusion exponentsat two different times (10 ns and 1 ms) to demonstrate their width and approximate Gaussianprofile.
Faraday Discuss. This journal is ª The Royal Society of Chemistry 2013

Fig. 16 Exponents determined from running fits for the MSD of lipids in non-aggregatingDLPC–protein systems. Curves are colored as in earlier plots: 1 : 50 (blue), 1 : 75 (red),1 : 100 (green), 1 : 150 (black), 1 : 200 (orange), and 1 : infinity (cyan). Normal diffusionbehavior with a¼ 1 is shown with a gray dashed line. Error bars are as in Fig. 12. Extrapolationat long times (shown by a dashed line) in the 1 : 50 case is based on a conservative estimate ofa(t) between 1–5 ms.
Dow
nloa
ded
by S
CD
Uni
vers
ité P
aris
7 o
n 10
Oct
ober
201
2Pu
blis
hed
on 0
1 Ju
ne 2
012
on h
ttp://
pubs
.rsc
.org
| do
i:10.
1039
/C2F
D20
085F
View Online
is almost a plateau covering about one order of magnitude in time from a few tens ofnanoseconds to a few hundred nanoseconds. The plateau is a common feature in allnon-aggregating systems. The system with a single protein (1 : infinity) finds thenormal diffusion regime in about 100 ns, whereas in the multi-protein systems thediffusion becomes normal with a ¼ 1 at much longer times. Even minor crowding(1 : 200) increases the onset of normal diffusion to about 1 ms. In more crowdedsystems it is more difficult to estimate how long it takes to get to the normal diffusionregime, but, again based on an educated guess, it ranges roughly between 10 and 100microseconds.Importantly, in the dilute case (1 : infinity) the time dependence of a in the aggre-
gating and non-aggregating systems is almost identical (see Fig. 12 and 16). Thedifferences between the DLPC–protein and DPPC–protein systems under crowdingare therefore not due to different dynamics of the lipid molecules but rather resultfrom alterations caused by the aggregation tendency of the proteins. Furthermore,also important to stress is that atomistic Langmuir monolayer simulations andcoarse-grained lipid bilayer models are largely consistent with each other: in Lang-muir monolayers with an area per lipid comparable to tensionless lipid bilayers (60–68 �A2), normal diffusion is accessed in 100–1000 ns, which is also the case in coarse-
Fig. 17 Exponents determined from running fits for the MSD of proteins in non-aggregatingDLPC–protein systems. Curves are colored as in earlier plots: 1 : 50 (blue), 1 : 75 (red), 1 : 100(green), 1 : 150 (black), 1 : 200 (orange), and 1 : infinity (cyan). Normal diffusion behavior witha ¼ 1 is shown with a gray dashed line. Error bars are as in Fig. 13.
This journal is ª The Royal Society of Chemistry 2013 Faraday Discuss.

Dow
nloa
ded
by S
CD
Uni
vers
ité P
aris
7 o
n 10
Oct
ober
201
2Pu
blis
hed
on 0
1 Ju
ne 2
012
on h
ttp://
pubs
.rsc
.org
| do
i:10.
1039
/C2F
D20
085F
Online
grained model studies. The time scales predicted by the coarse-grained models aretherefore in the right ballpark (regarding the order of magnitude).The plots for protein motion, see Fig. 17, show slightly different behaviorcompared to the aggregating system (Fig. 13). The diffusion exponents a forDLPC–protein membranes are larger than in the case of the aggregating DPPCsystem and they reach a ¼ 1 to some extent faster.
4 Discussion and conclusions
Cell membranes modulate or even govern a variety of cellular functions. The keymolecules either responsible or at least involved in these functions are lipids andmembrane proteins. To understand their full role in cellular functions, one has tounderstand the principles that control their lateral dynamics as the formation offunctional nanoscale membrane domains (with a specific set of proteins and lipids)is based on lateral diffusion. However, while this dynamical process has been paid agreat deal of attention to, most of the previous studies have been based on ratheridealized conditions where the complexity of native membranes has not been takeninto account. One of the great challenges in this spirit is to understand the effects ofcrowding on lipid and protein diffusion.Here we have considered this topic from two complementary viewpoints, eluci-
dating the effects of lipid packing through considerations of Langmuir monolayers,as well as the effects of protein crowding in lipid bilayers.Simulations of Langmuir monolayers in the absence of proteins indicated that the
motion of lipids is to do with quite substantial memory effects manifested as anom-alous diffusion that persist over a broad range of time. We observed that the anom-alous diffusion exponent depends on the packing of the monolayer; increasingpacking leading to smaller exponent. In the same spirit, also the transition fromanomalous to normal diffusion was found to depend on how strongly the lipidsare packed, as increasing packing increases the onset of normal (random walklike) diffusion. What is quite stunning is the magnitude of the characteristic timeneeded to cross over from anomalous to normal diffusion (sonset). Even in fluidmonolayers where packing of lipids is low (like in the liquid-expanded phase), sonsetwas found to be several hundred nanoseconds, and in the most compact monolayersof the order of microseconds.In simulations of lipid bilayers the objective was to further our understanding of
proteins’ role in lateral diffusion, when proteins either aggregate or stay apart fromeach other. We observed the influence of protein crowding on lateral diffusion to bestrong. Increasing protein concentration slowed down both lipid and protein diffu-sion, the slowing down being as large as a factor of 10 for lipids and 20–100 forproteins. Recent simulation results by Domanski et al. are consistent with thispicture.38 We also explored the extent to which protein crowding can affect sonset,thereby slowing down lateral dynamics. The observed effects associated with anom-alous diffusion demonstrated the roles of blocking (entropy) and protein self-orga-nization (aggregation). The system that promoted protein aggregation expressed thestrongest effects manifested as lipid and protein confinement, complemented by thelargest values we observed for sonset.All simulated scenarios point to the fact that in systems that are highly packed or
crowded with proteins, the time it takes to access the regime of normal diffusion islarge. In protein-poor systems this ranges from 100 to 1000 ns. In protein-richsystems with significant crowding, sonset can be of the order of milliseconds. Exper-iments using biotinylated avidin lipid anchors as a crowding agent suggest66
that sonset could actually be much larger, of the order of 100 ms. Is this a potentialproblem? In simulations it is, since availability of computer resources needed toaccess millisecond simulations are not common. If one wanted to explore lipidand/or protein diffusion in native-like membranes with a significant concentrationof proteins, one should carry out simulations that last for several milliseconds.
View
Faraday Discuss. This journal is ª The Royal Society of Chemistry 2013
Dow
nloa
ded
by S
CD
Uni
vers
ité P
aris
7 o
n 10
Oct
ober
201
2Pu
blis
hed
on 0
1 Ju
ne 2
012
on h
ttp://
pubs
.rsc
.org
| do
i:10.
1039
/C2F
D20
085F
Online
Shorter simulations would not provide quantitatively reliable data for normal diffu-sion. This stems from the fact that the definition of the lateral diffusion coefficient isvalid only in the limit of long times (see eqn (2)) for random walk like diffusion,when a ¼ 1. If a < 1, as in anomalous diffusion, the diffusion coefficient is notwell defined. This is the case, e.g., when the simulation time is less than sonset. Inpractice the simulation time should however be considerably longer, at least 10 �sonset, to gather decent statistics for MSD up to times that are much longer thanthe onset of normal diffusion sonset.The above implies that the reader should consider our data for diffusion coeffi-cients with reservation, too. Despite our best efforts and quite substantial computerresources, even the longest of our simulations covered less than 30 microseconds.Therefore, at least the diffusion coefficients of the most crowded protein systems(1 : 50, 1 : 75, and 1 : 100) studied in this work are questionable. Quite likely theyare qualitatively in order, but quantitatively they are certainly compromised sincein those cases we were not able to gauge the times where a ¼ 1.What is even more stunning are the conclusions of our atomistic Langmuir mono-
layer simulations, which set the minimal standard for atomistic simulations of lipiddiffusion in fluid membranes: the simulations should last at least for 1000 ns. This isnot good news given that the simulation time scale of typical atomistic MD simula-tions of lipid membranes is currently of the order of 100 ns. Of course, one can usesuch data for consideration of lateral diffusion, and one can extract the diffusioncoefficient too, but one should keep in mind that the quantity obtained in thismanner will be an effective one, describing subdiffusive behavior instead of long-time (hydrodynamic) normal diffusion. The comparison of subdiffusive data deter-mined from simulations with long-time scale diffusion data measured in experimentswould also be problematic, and comparison of trends would then be more meaning-ful instead of comparing just quantitative numbers.Quite unfortunately, the above scenario is yet the optimistic one, if one considers
the challenge to simulate long enough times. The above discussed views hold as longas the lipids and proteins diffuse in a well-defined membrane domain. If themembrane is characterized by formation of domains with different properties, orif there is a need to consider diffusion in a membrane coupled to an actin-basedmembrane skeleton, then one has to account for effects of domain boundariesthat typically slow down diffusion from one domain to another. The hydrodynamiclong-time diffusion would then take place at times much larger than those associatedwith diffusion inside a single membrane domain. It is quite plausible that if onewanted to consider lateral diffusion of proteins in heterogeneous membranes withconsiderable domain formation, including the effects of actin-based confinement,then the true normal diffusion in the hydrodynamic long-time limit would beobserved only in simulations of the order of seconds or minutes. While these timescales are just an educated guess, they highlight the size of the challenge.Finally, let us briefly discuss physical limits of protein motion. Following the ideas
of Dill et al., is there an optimal concentration of membrane proteins that wouldmaximize the speed of biochemical reactions?67 On the one hand, protein diffusionshould then be fast enough to enable sufficiently rapid motion over large lengthscales. This idea would be best fulfilled in protein-poor membranes. On the otherhand, the optimal conditions should also promote protein–protein collisions neededfor protein complex formation, and this idea in turn would favor crowding. Usinghard sphere models for proteins in cytosol, Dill et al. predicted that the optimalprotein volume concentration would be 19%, compared to 20% observed in cells.67
In 2D membranes the validity of the hard disk model is less obvious, but what isobvious is that the protein concentration cannot be too high, since otherwise proteindiffusion would become too slow as the data in Fig. 9 also demonstrate. Actually,what is striking in Fig. 9 is the slowing down of diffusion in the aggregatingDPPC–NaK system, where protein diffusion slows down rather steeply down to aprotein-to-lipid ratio of 1 : 150. This corresponds to an area fraction of 15%
View
This journal is ª The Royal Society of Chemistry 2013 Faraday Discuss.

Dow
nloa
ded
by S
CD
Uni
vers
ité P
aris
7 o
n 10
Oct
ober
201
2Pu
blis
hed
on 0
1 Ju
ne 2
012
on h
ttp://
pubs
.rsc
.org
| do
i:10.
1039
/C2F
D20
085F
Online
occupied by the proteins. Similar diffusion in the non-aggregated DLPC–NaKsystem is observed with the protein-to-lipid ratio of 1 : 50, corresponding to aprotein area fraction of 34%. If cells want to maximize their membrane protein diffu-sion without sacrificing chances for biochemical reactions (in terms of proteincomplex formation), then our data suggest that protein concentration is anythingbut constant in the membrane plane but is strongly dependent on proteins’ prefer-ence for aggregation.Acknowledgements
We acknowledge Mark Sansom and Phillip Stansfeld for sharing their membraneprotein models. We wish to thank CSC – IT Centre for Science (Espoo, Finland)for computing resources. The Academy of Finland and the European ResearchCouncil (project 290974 CROWDED-PRO-LIPIDS) is acknowledged for financialsupport.
References
1 P. F. F. Almeida and W. L. C. Vaz, Handbook of Biological Physics, Elsevier, Amsterdam,1995, ch. 6, pp. 305–357.
2 I. Vattulainen and O. G. Mouritsen, Diffusion in condensed matter: Methods, materials,models, Springer-Verlag, Berlin, 2nd edn, 2005, pp. 471–509.
3 D. Lingwood and K. Simons, Science, 2010, 327, 46–50.4 E. Falck, M. Patra, M. Karttunen, M. T. Hyvonen and I. Vattulainen, Biophys. J., 2004, 87,1076–1091.
5 P. S. Niemela, S. Ollila, M. T. Hyvonen, M. Karttunen and I. Vattulainen, PLoS Comput.Biol., 2007, 3, 304–312.
6 S. Ollila, M. T. Hyvonen and I. Vattulainen, J. Phys. Chem. B, 2007, 111, 3139–3150.7 A. Filippov, G. Oradd and G. Lindblom, Biophys. J., 2007, 93, 3182–3190.8 J. B. de la Serna, G. Oradd, L. A. Bagatolli, A. C. Simonsen, D. Marsh, G. Lindblom andJ. Perez-Gil, Biophys. J., 2009, 97, 1381–1389.
9 A. D. Dupuy and D. M. Engelman, Proc. Natl. Acad. Sci. U. S. A., 2008, 105, 2848.10 K. Jacobson, O. G. Mouritsen and R. G. W. Anderson, Nat. Cell Biol., 2007, 9, 7.11 T. A. Ryan, J. Myers, D. Holowska, B. Baird and W. W. Webb, Science, 1988, 239, 61–64.12 I. Golding and E. C. Cox, Phys. Rev. Lett., 2006, 96, 098102.13 J.-H. Jeon, V. Tejedor, S. Burov, E. Barkai, C. Selhuber-Unkel, K. Berg-Sorensen,
L. Oddershede and R. Metzler, Phys. Rev. Lett., 2011, 106, 048103.14 R. Metzler and J. Klafter, Phys. Rep., 2000, 339, 1.15 A. V. Weigel, B. Simon, M.M. Tamkun and D. Krapf, Proc. Natl. Acad. Sci. U. S. A., 2011,
108, 6438–6443.16 S. Weber, A. J. Spakowicz and J. A. Theriot, Phys. Rev. Lett., 2010, 104, 238102.17 J. Szymanski and M. Weiss, Phys. Rev. Lett., 2009, 103, 038102.18 W. Pan, L. Filobelo, N. D. Q. Pham, O. Galkin, V. V. Uzunova and P. G. Vekilov, Phys.
Rev. Lett., 2009, 102, 058101.19 G. Guigas and M. Weiss, Biophys. J., 2008, 94, 90–94.20 I. Bronstein, Y. Israel, E. Kepten, S. Mai, Y. Shav-Tal, E. Barkai and Y. Garini, Phys. Rev.
Lett., 2009, 103, 018102.21 M. A. Lomholt, I. M. Zaid and R. Metzler, Phys. Rev. Lett., 2007, 98, 200603.22 I. M. Zaid, M. A. Lomholt and R. Metzler, Biophys. J., 2009, 97, 710–721.23 E. Falck, T. Rog, M. Karttunen and I. Vattulainen, J. Am. Chem. Soc., 2008, 130, 44.24 P. F. F. Almeida, W. L. C. Vaz and T. E. Thompson, Biochemistry, 1992, 31, 6739–
6747.25 D. Turnbull and M. H. Cohen, J. Chem. Phys., 1961, 34, 120–125.26 D. Turnbull and M. H. Cohen, J. Chem. Phys., 1970, 52, 3038–3041.27 T. Apajalahti, P. Niemela, P. N. Govindan, M. S. Miettinen, E. Salonen, S. J. Marrink and
I. Vattulainen, Faraday Discuss., 2010, 144, 411–430.28 S. Busch, C. Smuda, L. C. Pardo and T. Unruh, J. Am. Chem. Soc., 2010, 132, 3232.29 P. S. Niemela, M. Miettinen, L. Monticelli, H. Hammaren, P. Bjelkmar, T. Murtola,
E. Lindahl and I. Vattulainen, J. Am. Chem. Soc., 2010, 132, 7574.30 P. G. Saffman and M. Delbr€uck, Proc. Natl. Acad. Sci. U. S. A., 1975, 72, 3111–3113.31 M. Weiss, H. Hashimoto and T. Nilsson, Biophys. J., 2003, 84, 4043.32 M. Frick, K. Schmidt and B. J. Nichols, Curr. Biol., 2007, 17, 462–467.
View
Faraday Discuss. This journal is ª The Royal Society of Chemistry 2013

Dow
nloa
ded
by S
CD
Uni
vers
ité P
aris
7 o
n 10
Oct
ober
201
2Pu
blis
hed
on 0
1 Ju
ne 2
012
on h
ttp://
pubs
.rsc
.org
| do
i:10.
1039
/C2F
D20
085F
Online
33 S. Wieser, J. Weghuber, M. Sams, H. Stockinger and G. J. Schutz, Soft Matter, 2009, 5,3287–3294.34 C. Eggeling, C. Ringemann, R. Medda, G. Schwarzmann, K. Sandhoff, S. Polyakova,V. N. Belov, B. Hein, C. von Middendorff, A. Schonle and S. W. Hell, Nature, 2009,457, 1159–1162.
35 K. Ritchie, X.-Y. Shan, J. Kondo, K. Iwasawa, T. Fujiwara and A. Kusumi, Biophys. J.,2005, 88, 2266–2277.
36 V. Mueller, C. Ringemann, A. Honigmann, G. Schwartzmann, R. Medda, M. Leutenegger,S. Polyakova, V. N. Belov, S. W. Hell and C. Eggeling, Biophys. J., 2011, 101, 1651–1660.
37 S. Ramadurai, A. Holt, V. Krasnikov, G. van den Bogaart, J. A. Killian and B. Poolman, J.Am. Chem. Soc., 2009, 131, 12650–12656.
38 J. Domanski, S. J. Marrink and L. V. Schafer, Biochim. Biophys. Acta, Biomembr., 2012,1818, 984–994.
39 E. Flenner, J. Das, M. C. Rheinstadter and I. Kosztinh, Phys. Rev. E, 2009, 79, 011907.40 T. Akimoto, E. Yamamoto, K. Yasuoka, Y. Hirano and M. Yasui, Phys. Rev. Lett., 2011,
107, 178103.41 G. R. Kneller, K. Baczynski and M. Pasenkiewicz-Gierula, J. Chem. Phys., 2011, 135,
141105.42 R. Veldhuizen, K. Nag, S. Orgeig and F. Possmayer, Biochim. Biophys. Acta, Mol. Basis
Dis., 1998, 1408, 90–108.43 M. Javanainen, L. Monticelli, J. de la Serna and I. Vattulainen, Langmuir, 2010, 26, 15436–
15444.44 O. Berger, O. Edholm and F. Jahnig, Biophys. J., 1997, 72, 2002–2013.45 M. Holtje, T. Forster, B. Brandt, T. Engels, W. von Rybinski and H.-D. Holtje, Biochim.
Biophys. Acta, Biomembr., 2001, 1511, 156–167.46 W. L. Jorgensen, J. Chandrasekhar, J. D. Madura, R. W. Impey and M. L. Klein, J. Chem.
Phys., 1983, 79, 926.47 B. Hess, C. Kutzner, D. van der Spoel and E. Lindahl, J. Chem. Theory Comput., 2008, 4,
435–447.48 D. J. Evans and B. L. Holian, J. Chem. Phys., 1985, 83, 4069.49 T. Darden, D. York and L. Pedersen, J. Chem. Phys., 1993, 98, 10089.50 B. Hess, H. Bekker, H. J. C. Berendsen and J. Fraaije, J. Comput. Chem., 1997, 18, 1463–
1472.51 S. J. Marrink, A. H. de Vries and A. E. Mark, J. Phys. Chem. B, 2004, 108, 750–760.52 S. J. Marrink, H. J. Risselada, S. Yefimov, D. P. Tieleman and A. H. de Vries, J. Phys.
Chem. B, 2007, 111, 7812–7824.53 L. Monticelli, S. K. Kandasamy, X. Periole, R. G. Larson, D. P. Tieleman and S.-
J. Marrink, J. Chem. Theory Comput., 2008, 4, 819–834.54 M. Sansom, K. Scott and P. Bond, Biochem. Soc. Trans., 2008, 36, 27–32.55 M. Parrinello and A. Rahman, J. Appl. Phys., 1981, 52, 7182–7190.56 W. Deng and E. Barkai, Phys. Rev. E, 2009, 79, 011112.57 S. Burov, J.-H. Jeon, R. Metzler and E. Barkai, Phys. Chem. Chem. Phys., 2011, 13, 1800–
1812.58 J.-H. Jeon and R. Metzler, Phys. Rev. E, 2012, 85, 021147.59 Y. He, S. Burov, R. Metzler and E. Barkai, Phys. Rev. Lett., 2008, 101, 058101.60 M. Patra, M. Karttunen, M. T. Hyv€onen, E. Falck, P. Lindqvist and I. Vattulainen,
Biophys. J., 2003, 84, 3636–3645.61 M. Patra, M. Karttunen, M. T. Hyv€onen, E. Falck and I. Vattulainen, J. Phys. Chem. B,
2004, 108, 4485–4494.62 V. Tejedor, O. Benichou, R. Voituriez, R. Jungmann, F. Simmel, C. Selhuber-Unkel,
L. B. Oddershede and R. Metzler, Biophys. J., 2010, 98, 1364–1372.63 M. Magdziarz, A. Weron, K. Burnecki and J. Klafter, Phys. Rev. Lett., 2009, 103, 180602.64 B. A. Scalettar, J. R. Abney and J. C. Owicki, Proc. Natl. Acad. Sci. U. S. A., 1988, 85,
6726–6730.65 D. F. Kusic, E. L. Elson and M. P. Sheetz, Biophys. J., 1999, 76, 314–322.66 M. R. Horton, F. Hofling, J. O. Radler and T. Franosch, Soft Matter, 2010, 6, 2648–2656.67 K. A. Dill, K. Ghosh and J. D. Schmit, Proc. Natl. Acad. Sci. U. S. A., 2011, 108, 17876–
17882.
View
This journal is ª The Royal Society of Chemistry 2013 Faraday Discuss.