Annual report - SP Medical
98
Annual report ’16 SP Group A/S, Snavevej 6-10, DK-5471 Søndersø. CVR no. 15 70 13 15
-
Upload
khangminh22 -
Category
Documents
-
view
0 -
download
0
Transcript of Annual report - SP Medical
Annual report
’16
SP Group A/S, Snavevej 6-10, DK-5471 Søndersø. CVR no. 15 70 13 15
Contents
Company details
2 Group chart
Management’s review
3 SP Group in brief
4 Financial highlights
6-7 Letter to the shareholders
8-13 The year in outline and outlook for 2017
14-23 Business areas
14-15 Coatings
16-23 Plastics
24-25 SP Group’s locations and acquisitions in 2014-2016
26-27 Risk management
28-31 Corporate governance
28-29 Corporate governance
30-31 Directorships
32-33 Shareholder information
34 Quality control
35-38 CSR reporting
Statements
39 Statement by Management on the annual report
40-41 Independent auditor’s report
Consolidated financial statements and parent company financial statements
42 Income statement
43 Statement of comprehensive income
44-45 Balance sheet
46-47 Statement of changes in equity
48 Cash flow statement
49-95 Notes
The cover photo shows ClearVialTM – a transparent alternative to
glass for both liquid and freeze-dried pharmaceuticals – produced
by MedicoPack A/S.
ClearVialTM is made from COC (Cyclic Olefin Copolymer) and COP
(Cyclic Olefin Polymer), which are new, highly transparent plastics
materials, which replace glass in a vast number of pharmaceutical
products.

Company details
Company details
The Company
SP Group A/S
Snavevej 6-10
DK-5471 Søndersø
Tel.: +45 70 23 23 79
Fax: +45 70 23 23 52
CVR no.: 15 70 13 15
Financial year: 1 January to 31 December
Registered o&ce: Municipality of Northern Funen
Website: www.sp-group.dk
E-mail: [email protected]
Board of Directors
Niels Kristian Agner (Chairman)
Erik Preben Holm (Deputy Chairman)
Hans Wilhelm Schur
Erik Christensen
Hans-Henrik Eriksen
Executive Board
Frank Gad, CEO
Jørgen Hønnerup Nielsen, CFO
Auditors
Ernst & Young
Godkendt Revisionspartnerselskab
Osvald Helmuths Vej 4
DK-2000 Frederiksberg
Annual general meeting
The annual general meeting is scheduled to be held on 27 April 2017
at 12 o’clock at SP Group A/S, Snavevej 6-10, 5471 Søndersø,
Denmark

Group chart
Activities
SP Group manufactures moulded plastic components and performs coatings on plastic and metal components. SP Group is a leading supplier of
plastic-manufactured products to Danish industries and has increasing exports and growing production from own factories in Denmark, Poland, Latvia,
Sweden, Slovakia, China and Brazil. In addition, SP Group has sales and service companies in Sweden, Norway, the Netherlands and Canada. SP Group
is listed on NASDAQ Copenhagen, employed an average of 1,559 people in 2016 and had approx. 1,300 registered shareholders at year-end 2016.
SP Group’s two business areas carry on activities in the following areas: Coatings and Plastic solutions.
Coatings: This segment develops and produces fluoroplastic coatings (Teflon®), PTFE and other refined materials for a number of customers’ products
and production plants. The customers are primarily in the healthcare, cleantech, food and oil and gas industries.
Plastic solutions: This segment o;ers solutions using one or more of the following technologies: reaction injection moulding (Polyurethane and Telene),
vacuum forming, injection moulding and blow moulding – all described in further detail below.
• Polyurethane (PUR) and Composite: Manufacturing of moulded products in solid, foamed, flexible and light-foam PUR for a number of industries,
including the cleantech industry. Add to this ventilation equipment, ergonomic mats and striping products.
• Vacuum and Extrusion: Via traditional vacuum forming, High-pressure and Twinsheet, manufacturing of thermo-formed plastic components for, e.g.,
refrigerators and freezers, cars, buses and other rolling stock (automotive) and the cleantech and medical device industries.
• Injection moulding: Manufacturing of injection-moulded plastic precision components for a wide range of industries. The business area also produces
FDA-registered products for customers in the medical device industry.
• Blow moulding: Manufacturing of blow-moulded plastic precision components for customers in the medical device industry. This segment also
produces packaging for FDA registered products within the pharmaceutical and medical industry.
SP Group A/S
Surface solutions Plastic solutions
Coatings
Accoat A/S
Accoat do Brasil Ltda.
Polyurethane (PUR) and Composite
Tinby A/S
Tinby Sp. z o.o.
Tinby Co., Ltd.
Tinby Denmark A/S
Tinby Inc.
Tinby Skumplast A/S
Ergomat A/S
Ergomat-Nederland B.V.
Ergomat Sweden AB
Ergomat Inc.
Ergomat Canada Inc.
Ergomat Sp. z o.o.
TPI Polytechniek B.V.
Brdr. Bourghardt AB
Baltic Rim Ltd.
SP Medical A/S
MedicoPack A/S
SP Medical Poland Sp. z o.o.
Vacuum forming and Extrusion
Gibo Plast A/S
SP Extrusion
Plexx AS/Opido AB
Injection moulding and Blow moulding
SP Moulding Poland Sp. z o.o.
SP Moulding (Suzhou) Co., Ltd.
Sander Tech ApS
SP Moulding A/S
Gibo Sp. z o.o.
We act as an innovative,
reliable and competitive partner
for our customers
Ulstrup Plast A/S
Ulstrup Plast s.r.o.
2 SP Group

SP Group in brief
Subsidiaries in
11 countries on 4 continents
The average number of employees
increased from 1,452 to
1,559 committed employees
Headquarters in Denmark
established in 1972
Products are marketed and sold in
more than 80 countries
In 2016, revenue grew 15.1% to
DKK 1,519 million
In 2016, revenue from own brands
grew 13.7% to
DKK 252 million
In 2016, the EBITDA margin increased
by 1.1 percentage point to
13.4 %
In 2016, EBITDA was up 24.6% to
DKK 203 million
Management’s review / SP Group 3

Group financial highlights
DKK ’000 2016 2015 2014 2013 2012
INCOME STATEMENT
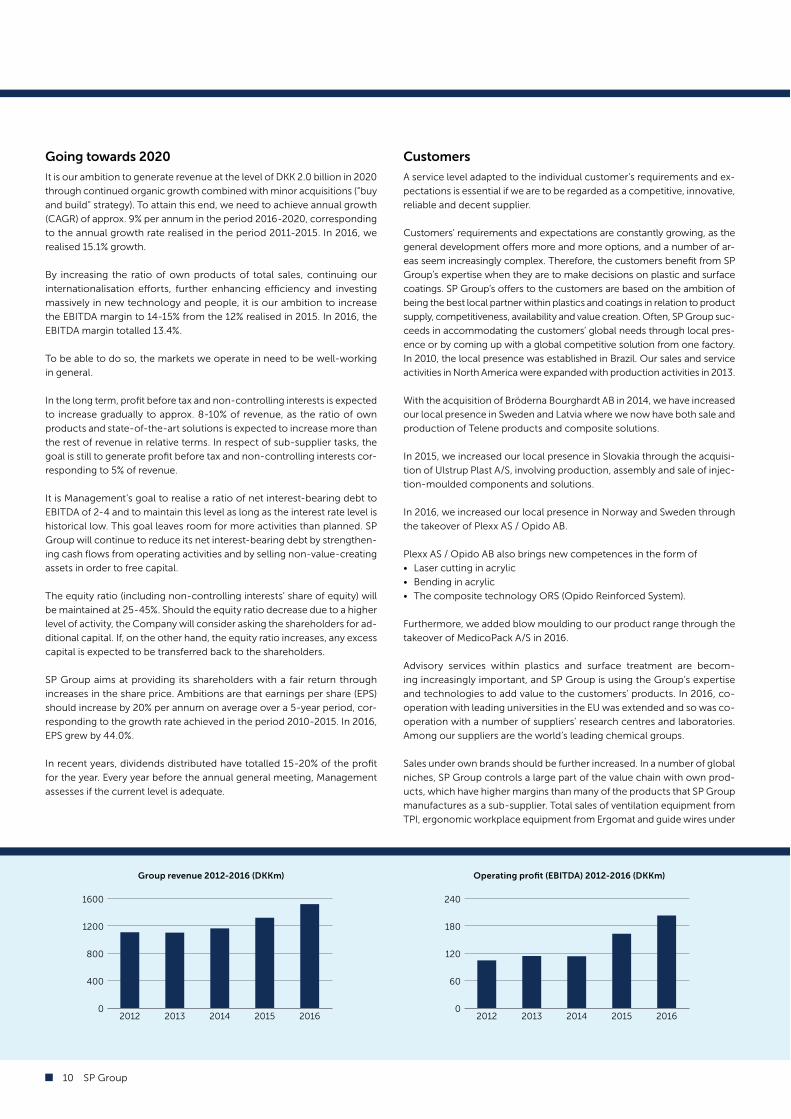
Revenue 1,519,044 1,319,768 1,164,942 1,102,053 1,108,527
Profit before depreciation and amortisation (EBITDA) 202,857 162,788 113,496 114,180 105,179
Depreciation, amortisation and impairment losses -69,442 -72,011 -53,329 -48,838 -47,066
Profit/loss before net financials (EBIT) 133,415 90,777 60,167 65,342 58,113
Net financials -10,799 -10,122 -8,691 -15,180 -16,502
Profit/loss before tax and non-controlling interests 122,616 80,655 51,476 50,162 41,611
Profit/loss for the year 93,387 61,112 39,809 39,077 31,837
SP Group A/S’ share hereof 92,420 60,584 39,020 39,039 31,563
Earnings per share, DKK per share (EPS) 41.87 28.98 19.87 19.91 15.66
Diluted earnings per share, DKK per share (EPS, diluted) 40.33 28.00 19.25 18.74 15.34
BALANCE SHEET
Non-current assets 669,136 635,072 574,845 538,012 511,864
Total assets 1,200,671 1,077,888 943,421 884,740 836,333
Equity 427,636 391,098 266,731 243,996 227,046
Equity, including non-controlling interests 428,976 393,561 276,361 252,326 240,131
Investments in property, plant and equipment, excl. acquisitions 107,035 73,238 77,791 67,242 120,754
CASH FLOW STATEMENT
Cash flows from operating activities 140,439 171,743 64,101 66,903 100,094
Cash flows from investing activities, incl. acquistions -80,126 -116,350 -67,342 -60,135 -87,624
Cash flows from financing activities -124,102 -18,403 9,985 -54,859 882
Change in cash and cash equivalents -63,789 36,990 6,744 -48,091 13,352
FINANCIAL RATIOS
Net interest-bearing debt (NIBD) 407,711 403,423 467,197 430,030 395,399
NIBD/EBITDA 2.0 2.5 4.1 3.8 3.8
Operating profit (EBITDA margin), % 13.4 12.3 9.7 10.4 9.4
Profit margin (EBIT margin), % 8.8 6.9 5.2 5.9 5.2
Profit before tax and non-controlling interests in % of revenue 8.1 6.1 4.4 4.6 3.8
Return on invested capital, including goodwill, % 15.5 11.5 8.4 9.8 9.6
Return on invested capital, excluding goodwill, % 18.6 13.6 9.8 11.7 11.7
Return on equity (ROE), excluding non-controlling interests, % 22.6 18.4 15.3 16.6 15.1
Equity ratio, excluding non-controlling interests, % 35.6 36.3 28.3 27.6 27.1
Equity ratio, including non-controlling interests, % 35.7 36.5 29.3 28.5 28.7
Financial gearing 1.0 1.0 1.7 1.7 1.6
Cash flow per share, DKK 61.3 79.4 31.6 32.1 48.7
Total dividends for the year per share, DKK 6.0 4.0 3.5 3.0 2.5
Listed price, DKK per share, year-end 674.0 373.5 219.5 230.0 120.0
Net asset value per share, DKK per share. year-end 192 178 135 125 115
Listed price/net asset value, year-end 3.52 2.10 1.63 1.84 1.04
Average number of employees 1,559 1,452 1,255 1,136 1,062
Number of shares, year-end 2,278,000 2,224,000 2,024,000 2,024,000 2,024,000
Portion relating to treasury shares, year-end 46,359 22,819 43,993 77,815 48,746
The key figures and ratios for 2012-2016 have been prepared in accordance with IFRS. Financial ratios are calculated in accordance with the Danish Finance
Society’s guidelines on the calculation of financial ratios “Recommendations and Financial Ratios 2015”. See page 57 for definitions.
4 SP Group
250
350
450
550
650
750
JAN FEB MAR APR MAJ JUN JUL AUG SEP OKT NOV DEC
0
100
200
300
400
500
2012 2013 2014 2015 20160
100
200
300
400
500
2012 2013 2014 2015 2016
0
10
20
30
40
50
60
2012 2013 2014 2015 20160
25
50
75
100
125
150
2012 2013 2014 2015 2016
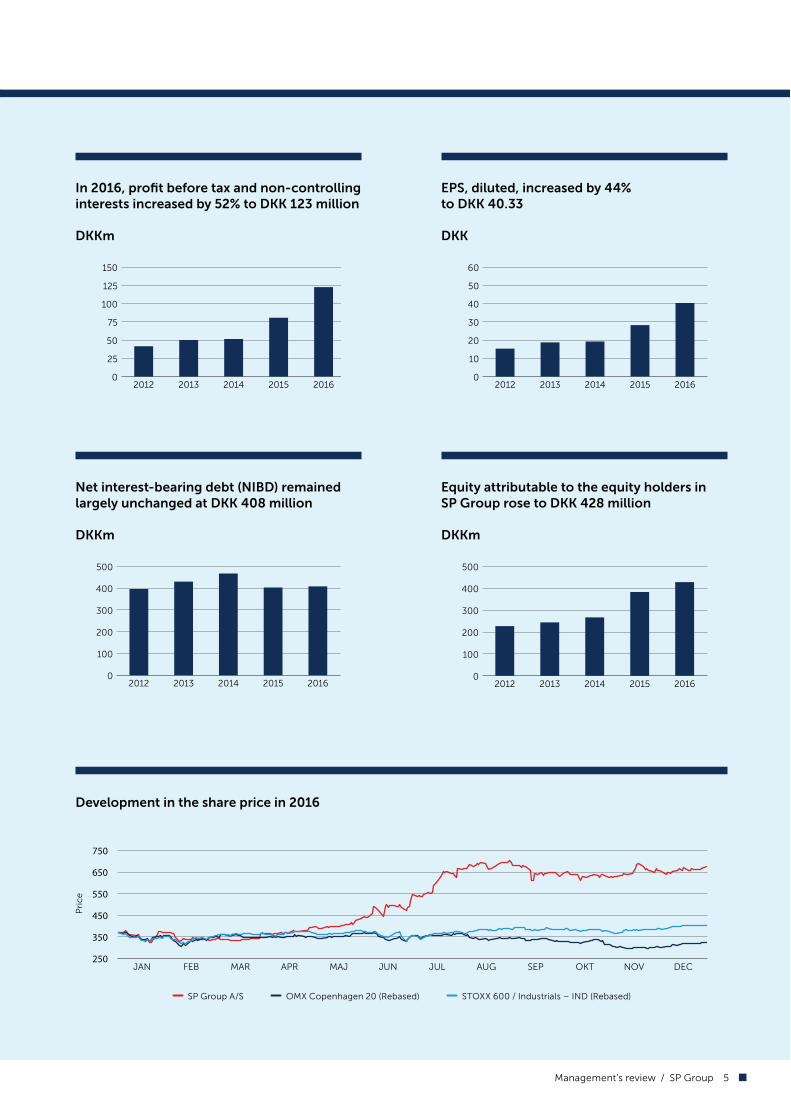
Development in the share price in 2016
Pri
ce
SP Group A/S OMX Copenhagen 20 (Rebased) STOXX 600 / Industrials – IND (Rebased)
Equity attributable to the equity holders in
SP Group rose to DKK 428 million
DKKm
Net interest-bearing debt (NIBD) remained
largely unchanged at DKK 408 million
DKKm
In 2016, profit before tax and non-controlling
interests increased by 52% to DKK 123 million
DKKm
EPS, diluted, increased by 44%
to DKK 40.33
DKK
Management’s review / SP Group 5

Dear shareholders and other stakeholders
2016 was an interesting year in a turbulent world. Growth in the global
economy was lower than expected at the beginning of the year, among
other reasons due to regional turmoil in various parts of the world and
volatile raw material prices.
The British decision to leave the EU (Brexit) and the presidential election
in USA contributed to the general unrest as well.
The central banks’ cure is still low interest rates and massive cash injec-
tions to the markets.
Even through the low growth rates in the economy have naturally af-
fected SP Group’s and our customers’ development, we nevertheless
managed to realise reasonable results.
Sales of our own brands rose by 13.7% and now account for 16.6% of
revenue.
Sales to our international customers increased by 9.5% and now account
for 50.9% of total sales.
Revenue in Denmark increased by 21.5%.
Total revenue amounted to DKK 1,519 million, which is up 15.1% on 2015.
Organic growth came at 6.4%.
EBITDA increased by 24.6% to DKK 202.9 million, and EBIT increased by
47.0% to DKK 133.4 million.
Profit before tax and non-controlling interests rose by 52.0% to DKK 122.6
million, which is our best financial performance so far and the first time
it exceeds DKK 100 million.
EPS, diluted, increased by 44.0% to DKK 40.33 per share.
Cash flows from operating activities were positive by DKK 140.4 million.
Net interest-bearing debt went up by DKK 4.3 million to DKK 407.7 million
at the end of 2016, which corresponds to 2.0 times EBITDA for the year.
2016 was an eventful year, see below:
• Our sales to the healthcare industry increased by 12.1% and now ac-
count for 40.4% of revenue
• Our sales to the cleantech industry increased by 16.6% and now ac-
count for 25.9% of revenue
• Our sales to the food-related industry increased by 15.3% and now
account for 15.2% of revenue
• Our sales to the oil and gas industry rose by 36.7% and now account
for 0.5% of revenue
• Our sales to the automotive industry went up by 11.7% and now ac-
count for 3.0% of revenue
• We entered into a number of contracts and partnership agreements
holding a good potential for the future
• We aspire to be an innovative, trustworthy and competitive partner to our
customers, also when they decide to outsource their own production
• In July, we took over MedicoPack A/S, which is a well-managed blow
moulding business with production and assembly activities in Langesk-
ov on Funen. The entity has own products and exports 85% of total
sales. Customers are primarily global businesses in the medical device
and healthcare industry. Management and the 80 committed employ-
ees stay on
• In October, we took over assets and injection moulding activities from
Aasum Plast & Metal A/S. Production activities have subsequently been
transferred to SP Moulding’s and Ulstrup Plast’s existing plants. The
plant in Aasum has been shut down and the leases vacated
• In November, Gibo Plast A/S acquired all of the shares in Norwegian-
Swedish Plexx AS / Opido AB, which is a well-functioning vacuum
forming business with production in Sweden and a sales o&ce in Nor-
way. The entity has a strong market position in the Norwegian and
Swedish markets and a good deal of exports to the rest of Europe.
Management and the 45 committed employees stay on
• Revenue from the acquired activities and businesses totalled, in the
financial year preceding the acquisitions, approx. DKK 175 million, and
EBITDA totalled DKK 13 million
• In two transactions, we acquired the remaining 20% of the shares in
Bröderna Bourghardt AB, Sweden, from David Bourghardt Holding AB.
David Bourghardt continues as CEO
• In September, we issued 54,000 new shares to honour requests made
to exercise warrants to subscribe for shares under the 2012 and 2013
warrant programmes. As a result, DKK 9.0 million was contributed as
equity to the Company
• In H2, we discontinued loss-making production activities. In connec-
tion with the phasing-out of the loss-making activities, we managed
to sell most of the production equipment at carrying amounts, which
has reduced the size of the year’s net investment. Also, we managed
to obtain new projects to be carried through at the vacated premises
• In Poland, we expanded SP Moulding and Gibo Plast by adding more
square metres and buying new machinery
• In Poland, SP Medical is presently expanding its cleanroom facilities,
meaning that we will be able also in future to injection-mould in clean-
rooms in Poland
• We won a number of new, major customers and did not lose any major
customers in 2016
• We launched a number of new and improved products in 2016 (guide
wires, ergonomic mats and farm ventilation equipment). Moreover,
we have developed new products to be launched in 2017. We further
developed our medical device expertise in Denmark, Poland, Slovakia,
Brazil and China
• We invested a total of net DKK 61.2 million in new equipment, includ-
ing equipment worth DKK 19.1 million that is held under finance leases
• We sold more new moulds to our customers than ever before
• We expensed DKK 5.7 million in respect of a complaint discussion with
a customer. We expect to find a mutually satisfactory solution within
the limit of the provision made
• Last, but not least, we got many new shareholders: almost 50% more
than at the beginning of 2016
• The price of the SPG share rose from 373.5 to 674.0 at the end of 2016,
providing our shareholders with a return on their investments of 80.5%
• We distributed DKK 4.00 per share in dividend. The total return on the
shareholders’ investment came at 81.5%, which is considerably above
the general return on investments in the market
These are the results on which we will base our future activities.
Based on the financial performance in 2016 (NIBD/EBITDA = 2.0, EBITDA
% = 13.4, EBIT % = 8.8 and an equity ratio including non-controlling
interests = 35.7%) and the outlook for 2017, the Board of Directors rec-
ommends to the company in general meeting that dividend of DKK 6.00
per share be distributed. The Board of Directors is otherwise mandated
to distribute extraordinary dividend (on-account dividend) provided that
the Company’s and the Group’s financial position so allows.
An interesting and eventful year
6 SP Group
The central banks’ low-interest policy and the fiscal relief packages con-
tinue to have a positive and stabilising e;ect on the global economy, and
we only hope that the authorities will not overreact once they begin to
tighten again.
In 2016, our tax expenses amounted to DKK 29.2 million, corresponding
to an e;ective tax rate of 23.8%. We pay tax in the country where the
income is earned in accordance with national and international transfer
pricing rules, and it is our goal to act as a responsible member of society
in all areas where we operate. Our tax policy is available at the website
www.sp-group.dk. In 2016, we paid tax in all foreign jurisdictions in which
we operate permanently.
The reduction of the duties on production (“PSO duties”) in Denmark, as
adopted by the Danish Parliament, is an important step towards restoring
the competitiveness of Danish business enterprises. A reduction of the
corporate income tax and shareholders’ tax ought to follow.
We will continue to adjust our capacity, make more e&cient – and pursue
new opportunities in the medical device industry, the cleantech indus-
try and food-related industries – and move labour-intensive production
from Western Europe to Poland, Slovakia and Latvia as well as make mas-
sive investments in people and technology in Europe, USA and China.
Plastics is the material of the future, and only our own lack of creativity
sets the limits to the application of plastics in society in future.
I want to thank our many good and loyal customers and other business
partners. Thanks to shareholders and lenders for backing us up. Also,
thanks to our employees for their committed contribution and readiness to
change. We will continue to put all our creativity into further improving our
solutions for the benefit of our customers, shareholders and employees.
Frank Gad
CEO
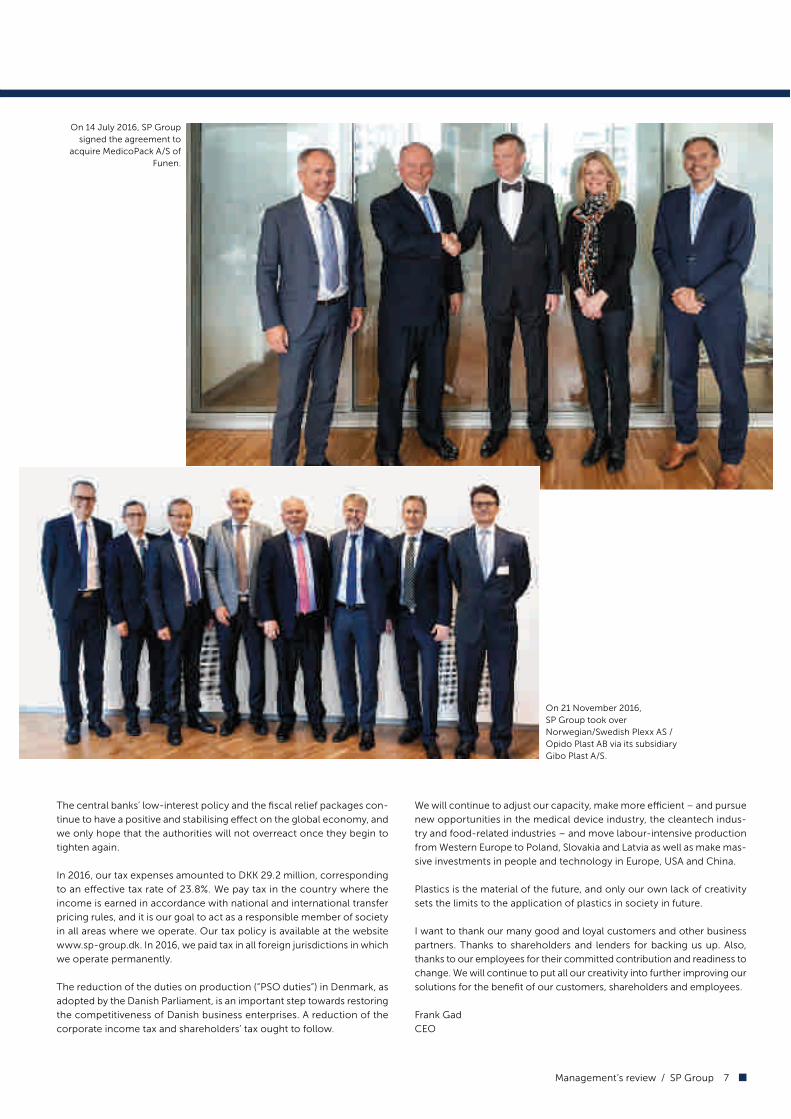
On 21 November 2016,
SP Group took over
Norwegian/Swedish Plexx AS /
Opido Plast AB via its subsidiary
Gibo Plast A/S.
On 14 July 2016, SP Group
signed the agreement to
acquire MedicoPack A/S of
Funen.
Management’s review / SP Group 7

The year in outline
2016 in outline
The Group’s revenue increased by 15.1% to DKK 1,519.0 million from DKK
1,319.8 million in 2015. The change is primarily due to a higher volume.
Organic growth accounted for 6.4% of revenue. Exchange rate fluctua-
tions, especially with regard to RMB and BRL, decreased revenue. The
currency e;ect accounts for approx. 0.3% of the 15.1% revenue growth.
Acquired activities and businesses account for 9.0%.
Sales of plastic solutions increased by 16.2%, and sales of surface coatings
decreased by 1.4%.
International sales increased by 9.5% and now account for 50.9% of rev-
enue (against 54.5% in 2015). Revenue growth was particularly marked in
Europe and Australia. This is the fourth year in a row our direct interna-
tional sales make up more than 50% of revenue.
Sales to our Danish customers increased by 21.5%.
Sales to the healthcare industry increased by 12.1% and were broadly
based on customers, products, geographies and technology. Sales to the
healthcare industry now account for 40.4% of our sales (against 41.5%
in 2015).
Sales of own brands went up by 13.7%. SP Group realised a significant
increase in the sale of ergonomic products (+6.1%), guide wires (+9.1%)
and farm ventilation components (+2.5%). MedicoPack also sells own
products, contributing DKK 17.2 million to the year’s revenue.
The Group’s EBITDA rose by 24.6% to DKK 202.9 million. The EBITDA mar-
gin came at 13.4%, representing an improvement of 1.1 percentage points
relative to 2015. During the year under review, considerable resources
were dedicated to the commissioning of new production facilities and
the relocation of the production activities from Aasum Plast & Metal A/S,
adversely a;ecting operating profit for the year. Investments in property,
plant and equipment amounted to net DKK 61.2 million, which is down
DKK 12.0 million on 2015.
Amortisation, depreciation and impairment losses amounted to DKK 69.4
million, which is DKK 2.6 million less than in 2015.
EBIT amounted to DKK 133.4 million, corresponding to 8.8% of revenue.
EBIT increased by DKK 42.6 million relative to 2015.
The Group’s financial expenses, net, increased from DKK 10.1 million in
2015 to DKK 10.8 million in 2016 as a result of foreign exchange adjust-
ments. Lending margins were slightly lower than in 2015.
Diluted earnings per share amounted to DKK 40.33, which is an increase
of 44.0% compared to 2015.
At the end of 2016, interest-bearing debt can be specified by currency
as follows:
DKK DKK 362 million
EUR DKK 61 million
PLN DKK -1 million
USD DKK -9 million
SEK DKK 5 million
BRL DKK -1 million
RMB DKK -9 million
Total DKK 408 million
Cash flows
Cash flows from operating activities fell to DKK 140.4 million (against DKK
171.7 million in 2015), primarily due to increased operating income and
changes in the net working capital.
Cash flows from investing activities amounted to DKK 80.1 million, partly
relating to capacity and competency development in the medical device
industry (approx. DKK 10 million), the cleantech industry (approx. DKK
15 million), food-related industries (approx. DKK 4.0 million) and partly
relating to the acquisition of a property (DKK 15 million). Further, all of the
shares in MedicoPack A/S and in Plexx AS / Opido AB were acquired for
a total of DKK 34.6 million. DKK 1.8 million was spent on acquiring assets
and activities from Aasum Plast & Metal A/S.
Repayment of non-current liabilities totalled DKK 94.9 million, 20% of
the shares in Bröderna Bourghardt AB in Sweden were acquired for DKK
7.6 million, new shares were issued in the amount of DKK 8.9 million, a
mortgage credit loan of DKK 5.1 million was taken over, and a deposit of
DKK 3.1 million was returned.
Dividends totalling DKK 9.6 million were distributed to the shareholders,
and treasury shares were acquired for DKK 29.6 million, net.
The change in cash and cash equivalents was negative by DKK 63.8 million.
Balance sheet
The balance sheet total went up from DKK 1,077.9 million to DKK 1,200.7
million, which is primarily attributable to the acquisition of new machinery
and entities and an increase in the gross working capital.
Net interest-bearing debt (NIBD) rose to DKK 407.7 million from DKK 403.4
million, accounting for 2.0 times the year’s EBITDA.
It is Management’s opinion that the Company still has adequate capital
resources and su&cient liquidity for purposes of its plans and operations.
The Company has enjoyed a long-term and fruitful working relationship
with its financial business partners, which is expected to continue.
The capital structure changed in the year, meaning that the current in-
terest-bearing debt has increased from 19.1% to 23.7% of the balance
sheet total and that the long-term interest-bearing debt has decreased
from 22.6% to 14.8% of the balance sheet total. The equity interest has
decreased from 36.5% to 35.7%, and non-interest bearing debt has in-
creased from 22.0% to 25.8%.
Net interest-bearing debt thus decreased from 37.4% to 33.9% of the bal-
ance sheet total.
Equity was adversely a;ected by the acquisition of a non-controlling inter-
est, DKK 7.6 million, acquisition of treasury shares, DKK 29.6 million, net,
and dividend distributions, DKK 9.6 million. Value adjustments of financial
instruments held to hedge future cash flows, primarily forward contracts
(PLN against EUR), adversely a;ecting comprehensive income and, hence,
equity by DKK 22.2 million. Foreign exchange adjustments of the foreign
entities adversely a;ecting equity by DKK 4.9 million, and issue of 54,000
new shares a;ected equity positively by DKK 8.9 million.
Q4 2016
In Q4 2016, SP Group’s sales totalled approx. DKK 421.6 million, which is
18.1% more than in the same period the year before. This is the first time
ever that SP Group has sold for more than DKK 0.4 billion in one quarter.
8 SP Group

EBITDA came at DKK 52.1 million, which is up 4.2% on the same period
the year before.
EBIT totalled DKK 33.4 million, which is up DKK 5.7 million on the same
period the year before.
Profit before tax and non-controlling interests amounted to DKK 31.4 mil-
lion, which is an increase of DKK 6.0 million compared to the same period
the year before.
The EBITDA margin in Q4 totalled 12.3%, and profit before tax and non-
controlling interests amounted to 7.4% of revenue.
The financial performance in Q4 was adversely a;ected by the provision
made in respect of a complaint discussion with a customer. Without that
provision, the EBITDA margin would have been 13.7% in Q4.
Amortisation, depreciation and impairment losses totalled DKK 18.7 mil-
lion, which is up DKK 3.6 million on the same period the year before.
In Q4, cash flows from operating activities amounted to DKK 26.6 million
(2015: DKK 55.4 million). Cash flows from investing and financing activities
were negative by DKK 102.5 million (2015: DKK 46.1 million). Accordingly,
the change in liquidity was negative by DKK 75.9 million (2015: positive
by DKK 9.3 million).
Follow-up on expectations previously expressed
The profit of DKK 122.6 million before tax and non-controlling interests
corresponds to the expectations expressed on 17 November 2016 as to
“a profit before tax and non-controlling interests at the level of DKK 120
million”. Revenue came at DKK 1,519.0 million, which corresponds to the
expectations expressed on 17 November 2016 as to “full-year revenue for
2016 at the level of DKK 1.5 billion”.
Expectations previously expressed:
30 March 2016: Slightly higher profit before tax and non-controlling
interests and a slightly higher level of activity are ex-
pected for 2016.
28 April 2016: See above.
14 June 2016: Revenue at the level of DKK 1,400-1,450 million and
profit before tax and non-controlling interests at the
level of DKK 100 million are now expected.
14 July 2016: SP Group acquires MedicoPack A/S e;ective 14 July
2016 and now expect revenue at the level of DKK
1,450-1,500 million and profit before tax and non-
controlling interests at the level of DKK 100 million.
23 August 2016: SP Group now expects revenue at the level of DKK
1.5 billion and profit before tax and non-controlling
interests at the level of DKK 100-120 million.
17 November 2016: SP Group now expects revenue at the level of DKK
1.5 billion and profit before tax and non-controlling
interests at the level of DKK 120 million.
Events after the balance sheet date
On 6 January 2017, Tinby A/S took over all of the shares in LM Skumplast
A/S, Tjæreborg, which o;ers customised PUR (Polyurethane) and PIR
(Polyisocyanurate) solutions. Management and the employees stay on.
The entity has changed name to Tinby Skumplast A/S.
On 21 March 2017, SP Group took over all of the shares in MM Composite
A/S, which o;ers customised composite solutions. The entity carries on
Suyan Jin at SP Moulding’s pro-
duction site in Suzhou, China.
In September Adnan Said Usün (left) celebrated
his 40th anniversary at Accoat. To the right
managing director Mads Juhl.
production activities in USA (Iowa) and in Funen (Nørre Aaby and Ejby).
Management and the employees stay on.
No such significant events have occurred after the balance sheet date
until the publication of this annual report which have not already been
incorporated in this annual report or which could change the assessment
of the Group’s and the Company’s financial position.
Outlook for 2017
The global economy is expected to grow in 2017 too, but it is still fragile
and associated with political and economic uncertainty. In the neighbour-
ing markets in Europe, a low growth rate is expected in the economy in
general, as a number of countries still have grave government deficits and
high indebtedness.
Brexit is expected to only marginally a;ect the development of SP Group
directly, but will a;ect a number of our customers and, hence, us indirectly.
New barriers to trade, if any, between USA and the EU will have a strong
adverse e;ect on the development of SP Group.
We will launch a number of new products and solutions for our custom-
ers, particularly in the healthcare, cleantech and food-related industries.
These new solutions are expected to contribute to growth and earnings.
In connection with the signing of a new logistics agreement with a cus-
tomer, we will no longer buy components and resell them without a mar-
gin. This will reduce full-year revenue by approx. DKK 70 million. The
e;ect in 2017 is assessed to be approx. DKK 55 million.
A high investment level will be maintained in 2017. The largest single invest-
ment is expected to be made in relation to the medical device activities.
Amortisation and depreciation charges are expected to be at a higher
level than in 2016.
Financial expenses are expected to be realised at the same level as in 2016.
Combined with strict cost control and early capacity adjustment as well
as continued strong focus on risk management, cash management and
capital management, this contributes to creating a good basis for the
Group going forward.
For 2017, profit before tax and non-controlling interests at the level of DKK
140-160 million and revenue at the level of DKK 1.7 billion are expected.
Management’s review / SP Group 9
0
60
120
180
240
2012 2013 2014 2015 20160
400
800
1200
1600
2012 2013 2014 2015 2016
Going towards 2020
It is our ambition to generate revenue at the level of DKK 2.0 billion in 2020
through continued organic growth combined with minor acquisitions (“buy
and build” strategy). To attain this end, we need to achieve annual growth
(CAGR) of approx. 9% per annum in the period 2016-2020, corresponding
to the annual growth rate realised in the period 2011-2015. In 2016, we
realised 15.1% growth.
By increasing the ratio of own products of total sales, continuing our
internationalisation e;orts, further enhancing e&ciency and investing
massively in new technology and people, it is our ambition to increase
the EBITDA margin to 14-15% from the 12% realised in 2015. In 2016, the
EBITDA margin totalled 13.4%.
To be able to do so, the markets we operate in need to be well-working
in general.
In the long term, profit before tax and non-controlling interests is expected
to increase gradually to approx. 8-10% of revenue, as the ratio of own
products and state-of-the-art solutions is expected to increase more than
the rest of revenue in relative terms. In respect of sub-supplier tasks, the
goal is still to generate profit before tax and non-controlling interests cor-
responding to 5% of revenue.
It is Management’s goal to realise a ratio of net interest-bearing debt to
EBITDA of 2-4 and to maintain this level as long as the interest rate level is
historical low. This goal leaves room for more activities than planned. SP
Group will continue to reduce its net interest-bearing debt by strengthen-
ing cash flows from operating activities and by selling non-value-creating
assets in order to free capital.
The equity ratio (including non-controlling interests’ share of equity) will
be maintained at 25-45%. Should the equity ratio decrease due to a higher
level of activity, the Company will consider asking the shareholders for ad-
ditional capital. If, on the other hand, the equity ratio increases, any excess
capital is expected to be transferred back to the shareholders.
SP Group aims at providing its shareholders with a fair return through
increases in the share price. Ambitions are that earnings per share (EPS)
should increase by 20% per annum on average over a 5-year period, cor-
responding to the growth rate achieved in the period 2010-2015. In 2016,
EPS grew by 44.0%.
In recent years, dividends distributed have totalled 15-20% of the profit
for the year. Every year before the annual general meeting, Management
assesses if the current level is adequate.
Customers
A service level adapted to the individual customer’s requirements and ex-
pectations is essential if we are to be regarded as a competitive, innovative,
reliable and decent supplier.
Customers’ requirements and expectations are constantly growing, as the
general development o;ers more and more options, and a number of ar-
eas seem increasingly complex. Therefore, the customers benefit from SP
Group’s expertise when they are to make decisions on plastic and surface
coatings. SP Group’s o;ers to the customers are based on the ambition of
being the best local partner within plastics and coatings in relation to product
supply, competitiveness, availability and value creation. Often, SP Group suc-
ceeds in accommodating the customers’ global needs through local pres-
ence or by coming up with a global competitive solution from one factory.
In 2010, the local presence was established in Brazil. Our sales and service
activities in North America were expanded with production activities in 2013.
With the acquisition of Bröderna Bourghardt AB in 2014, we have increased
our local presence in Sweden and Latvia where we now have both sale and
production of Telene products and composite solutions.
In 2015, we increased our local presence in Slovakia through the acquisi-
tion of Ulstrup Plast A/S, involving production, assembly and sale of injec-
tion-moulded components and solutions.
In 2016, we increased our local presence in Norway and Sweden through
the takeover of Plexx AS / Opido AB.
Plexx AS / Opido AB also brings new competences in the form of
• Laser cutting in acrylic
• Bending in acrylic
• The composite technology ORS (Opido Reinforced System).
Furthermore, we added blow moulding to our product range through the
takeover of MedicoPack A/S in 2016.
Advisory services within plastics and surface treatment are becom-
ing increasingly important, and SP Group is using the Group’s expertise
and technologies to add value to the customers’ products. In 2016, co-
operation with leading universities in the EU was extended and so was co-
operation with a number of suppliers’ research centres and laboratories.
Among our suppliers are the world’s leading chemical groups.
Sales under own brands should be further increased. In a number of global
niches, SP Group controls a large part of the value chain with own prod-
ucts, which have higher margins than many of the products that SP Group
manufactures as a sub-supplier. Total sales of ventilation equipment from
TPI, ergonomic workplace equipment from Ergomat and guide wires under
Group revenue 2012-2016 (DKKm) Operating profit (EBITDA) 2012-2016 (DKKm)
10 SP Group

0
52
104
156
208
260
2012 2013 2014 2015 20160
140
280
420
560
700
2012 2013 2014 2015 2016
Revenue under own brands 2012-2016 (DKKm)
Ergonomics Animal housing ventilation Guide wires MedicoPack
the SP Medical brand as well as own products from MedicoPact increased
by 13.7% to approx. DKK 252 million from 2015 to 2016. We have developed
a number of new products, which were marketed in 2016. In addition to
increasing the sale of the existing products, the Group will continue to
develop several new products under own brands.
Growth must also be generated from customers and growth industries. An
obvious example is the healthcare industry. Sales to this industry totalled
DKK 613.1 million in 2016. Sales to this industry are to be further increased
through the committed business units SP Medical and MedicoPack as the
primary drivers. The figure on the bottom of the page shows the develop-
ment in total healthcare sales, which accounted for 40.4% of revenue in
2016. Sales to this industry increased by 12.1% in 2016.
SP Group has also established an international position as a supplier of
cleantech solutions, a position which we plan to strengthen.
The figure on the next page shows the development in sales to the clean-
tech industry, which accounted for 25.9 % of revenue in 2016. Sales to the
cleantech industry increased by 16.6 % in 2016.
A number of our customers are food manufacturers or suppliers to food
manufacturers. This area is called “food-related industries”. Sales to food-
related industries accounted for 15.2% of revenue in 2016 and amounted to
DKK 231.6 million. Trends in sales to food-related industries are shown on
the next page. In 2016, sales to food-related industries increased by 15.3%.
The healthcare, cleantech and food-related industries accounted for ap-
prox. 82% of total revenue in 2016.
During recent years, we have developed a number of unique services to the
oil and gas industry. Sales to this industry went up by 36.7% in 2016 and now
account for 0.5% of the Group’s revenue. Sales to the automotive industry
increased by 11.7% to DKK 45.7 million and now account for 3.0% of revenue.
The geographic expansion will continue through increased sales from the
factories in Denmark, Latvia, Slovakia, Poland, Brazil, China and USA with
particular focus on markets in Europe, the Americas and Asia. International
sales have increased over the past 10 years from approx. 30% to approx.
51% of revenue, and this ratio is to be further increased.
E$ciency and rationalisationIn 2016, the Group’s production structure was further rationalised and
made more e&cient.
Our competency development e;ort will continue at the factories in China,
Poland, Latvia, Slovakia, Sweden, Brazil, USA and Denmark so that we can
meet our customers’ needs in a more e&cient, better and less costly way.
In Denmark, SP Moulding has taken over the activities in Aasum Plast &
Metal A/S and transferred them to SP Moulding’s facilities. Aasum’s factory
in Aasum has been closed down and the leases vacated.
In Poland, SP Medical has expanded its cleanroom facilities and increased
the production of guide wires, plastic components and assembly activities.
In Poland, SP Moulding has expanded its injection-moulding and assembly
facilities, now also o;ering 2K injection moulding (dual component).
In USA and Poland, Ergomat has increased its production of ergonomic
mats through improved productivity and increased capacity.
In Latvia and Sweden, Brdr. Bourghardt has increased capacity and en-
hanced e&ciency.
Ulstrup Plast has increased capacity and enhanced e&ciency in Denmark
and Slovakia.
In Denmark, SP Moulding, SP Medical, SP Extrusion, Tinby, MedicoPack
and Gibo Plast have all enhanced e&ciency and increased capacity.
In China, Tinby and SP Moulding have increased capacity and enhanced
e&ciency. Now, SP Moulding also o;ers 2K moulding in China.
In Brazil, Accoat has maintained capacity and e&ciency, but has decided
to reduce capacity in Denmark due to the changed market conditions.
In the Netherlands, TPI has expanded its business based on a larger organi-
sation, which has increased capacity.
The reliability of delivery (on-time delivery) from all factories was increased
and has now reached 98-99% and should be further improved. The level
of quality is measured on an ongoing basis, and constant e;orts are being
made to improve quality.
Apart from capacity adjustments, we focus on adjusting general costs on
an ongoing basis. SP Group’s goal is for all production facilities to manu-
facture and deliver better, less costly and faster. Steps are taken on a current
basis to reduce the consumption of materials and resources (reduction
of CO2 emissions, etc.) and to reduce break-in periods and switch-over
times in production. The current Lean process will continue with focus on
improving processes and flows and strengthening our employees’ com-
petencies.
Finally, SP Group will constantly and critically analyse the Group’s activities.
If activities and businesses are unable to attain reasonable earnings, they
will be closed down or sold.
Revenue from healthcare products 2012-2016 (DKKm)
Management’s review / SP Group 11

OTHERS
15%
HEALTHCARE(Medico, Ergonomics)
40%CLEANTECH
26%
FOOD-RELATED
15%
3%AUTOMOTIVE
1%OIL & GAS
0
50
100
150
200
250
300
350
400
2012 2013 2014 2015 20160
30
60
90
120
150
180
210
240
2012 2013 2014 2015 2016
• More than 1,000 customers in total
• The largest customer accounts for 12% (2015: 12%)
• The 10 largest customers account for 50% (2015: 47%)
• The 20 largest customers account for 60% (2015: 60%)
SP Group’s sales in 2016 broken down by customer group:
Revenue from cleantech products 2012-2016 (DKKm) Revenue from food-related industries 2012-2016 (DKKm)
12 SP Group
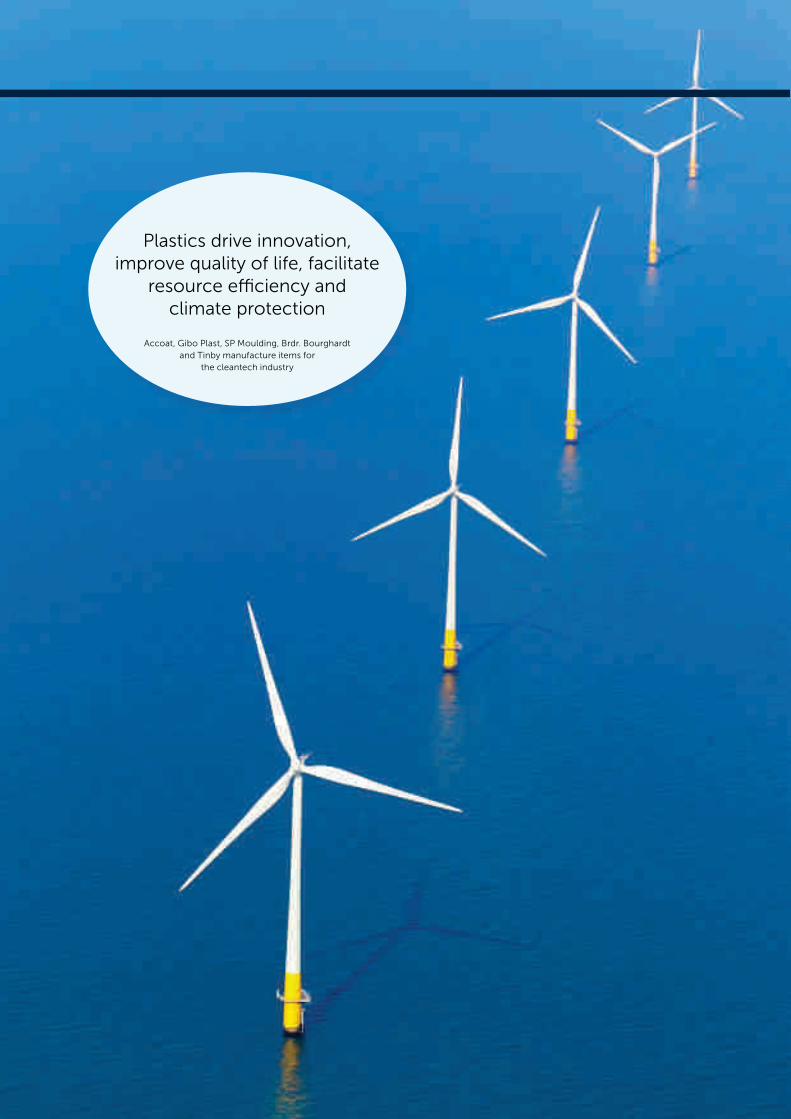
Accoat, Gibo Plast, SP Moulding, Brdr. Bourghardt
and Tinby manufacture items for
the cleantech industry
Plastics drive innovation,
improve quality of life, facilitate
resource e&ciency and
climate protection

Coatings
• End-to-end solutions
• New tasks in the food industry
• More tasks in the medical device industry
Name: Accoat A/S
Website: www.accoat.dk
Location: Kvistgård in the northern part of Sealand,
Stoholm in Jutland and São Paulo in Brazil
Executive Board: Mads Juhl, CEO
Activities: Accoat manufactures coatings for a number of
industries’ products and production facilities.
The components that are coated cover a wide field –
from very small needles to big tank installations.
Description: Accoat develops and manufactures environmentally
friendly technical solutions for industrial and pharma-
ceutical purposes, including fluoroplastics coatings
(Teflon®), PTFE and other refined materials.
Environment/quality: Reference is made to the list of certificates on page 34
2016 in outline
Revenue decreased by 1.4% to DKK 136.8 million. Revenue from the food
and medical device industries has been on the increase. Revenue from
the oil and gas industry has gone up as well, whereas revenue from the
cleantech industry decreased due to a continued low level of activity in
emerging markets.
EBITDA improved in 2016 relative to 2015 due to considerable focus on
costs and e&ciency-enhancing measures. EBITDA rose from DKK 13.6
million in 2015 to DKK 16.2 million in 2016.
In 2017, Accoat will continue to focus its marketing e;orts on the food,
medical device and chemical industries.
Growth is expected in the coming years, but since much of the activity
is project-based, growth rates will depend on whether investments in
cleantech in developing countries and in the oil and gas industry in gen-
eral will once again increase. The productive capacity has been adjusted
to the level of activity in the areas in question. For instance, Accoat has
been trimmed to be able to meet the demand for state-of-the-art fluo-
roplastics coatings on competitive terms.
Accoat’s coating factory in Brazil is still o;ering coating solutions for the
medical device industry.
The plant in Kvistgård is flexible and therefore able to handle most types
of components, and it holds one of the largest furnaces in Europe for
sintering of fluoroplastics coatings. Accoat’s factory in Stoholm is dedi-
cated to coating of pipes.
With these plants, Accoat ranks among the most present-day, environ-
mentally friendly coating businesses in Europe.
Accoat is going to start up production in Poland in 2017.
During the year, Accoat serviced customers in 19 countries.
Markets and products
In 2016, Accoat coated a range of di;erent products such as medical de-
vice equipment, chemical reactors, tanks, thermocouples, ovens, baking
machines, filling machines, engine components, ventilation equipment as
well as equipment for the oil and gas industry. In principle, Accoat is able
to coat all kinds of items, but has decided to focus especially on high-
build (multiple-layer) corrosion-protective coatings as well as non-stick
and low-friction coatings. In these areas, Accoat is a market leader in
Scandinavia and ranks among the four largest players in Europe.
The penetration barriers on the high-build coating market are high, as it
requires great expertise and costly facilities to manufacture coatings in
environmentally friendly synthetic materials. Accoat develops and tests
coatings in its own laboratory to be able to document properties and
product life. The market is driven by the fact that fluoroplastics coatings
can improve the application, strength and product life of a number of
products. Accoat is adding value to its customers.
For instance, coatings may facilitate the cleaning of surfaces, both re-
ducing the use of detergents, water and time and resulting in shorter
production stoppage during cleaning. Coatings may also make products
and production equipment oil- and water-repellent, heat insulating, elec-
trically insulating or resistant to chemicals. In some industries, coatings
are required in order to comply with safety requirements.
Customers also experience that they can replace expensive materials
such as Titanium with other, less costly surface-treated materials. Con-
sequently, the overall demand for coatings, including nano coatings, is
expected to increase.
As Accoat has been approved by the Danish Veterinary and Food Admin-
istration to manufacture food contact materials, it meets the require-
ments in relation to coatings approved for food.
Strategy
Accoat continues to strengthen its product development, improves the
properties of coatings and develops and tests new products and pro-
cesses together with its customers and leading universities.
14 SP Group

Plate heat exchangers coated with
Accolan for improved e&ciency and
longer lifetime.
Freeze dryer coated with Accofal
for the medico industry.
Mogens Hansen and Tommy Petersen
preparing surface coating of a 31 metre long
steel band to be used in a bakery oven.
Paint does not adhere
to non-stick coatings
from Accoat.
Moreover, Accoat is involved in research-related projects, including a
project supported by, among other parties, Innovation Fund Denmark
(Innovationsfonden).
Marketing is directed at selected customers and customer groups. We
are already very good at what we do, and we will be even better. We have
extensive experience in supplying production-optimising coatings for the
food industry, improving the properties of medical devices and, not least,
delivering unique corrosion-protective coatings to the chemical industry
and the cleantech industry.
Accoat delivers globally, but focuses on direct sales e;orts in European
markets.
Sales are strengthened through more systems selling where Accoat ad-
vises its customers on the construction of components and on the choice
of materials before the components are coated. End-to-end solutions are
easy for the customers, and we o;er and supply such solutions.
Accoat’s e;orts to develop customised processes and products are made
in close co-operation with its customers and suppliers.
Outlook for 2017
Accoat expects an increasing level of activity and higher EBITDA in 2017.
However, the markets are very unstable, and the current price of oil has
a great impact on the investment propensity in the oil and gas industry.
Development in Coatings 2014-2016
DKKm 2016 2015 2014
Revenue 136.8 138.8 167.9
Profit before net financials, depreciation
and amortisation (EBITDA) 16.2 13.6 18.8
Profit before net financials (EBIT) 8.8 4.0 9.7
Segment assets 76.1 77.7 95.0
Average number of employees 68 67 75
Management’s review / SP Group 15

Composite
PUR and Telene
(Reaction Injection Moulding)
Vacuum Forming
3D
Low investment High investment
Labor intensitive High automation
Ite
m s
ize
Quantities
Injection Moulding and
Blow Moulding
Extrusion
Plastics
• New tasks in the healthcare industry
• New tasks in the cleantech industry
• More tasks in food-related industries
All plastic entities in SP Group provide customised solutions in close co-operation with the customers.
The choice of production technology depends, among other things,
on the size of the component and the number to be produced:
Often, a product starts its life cy-
cle in PUR. Once the product has
penetrated the market to a certain
extent, “Mark II” is made in vacuum,
and much later when the production
reaches a high amount, “Mark III” is
injection-moulded.
We therefore report the plastic enti-
ties in:
• Injection moulding (SP Moulding,
SP Medical, Sander Tech and Ulstrup
Plast)
• Blow moulding (MedicoPack)
• Vacuum forming (Gibo Plast and
Plexx / Opido)
• PUR (Ergomat, Tinby, TPI Polytech-
niek and Bröderna Bourghardt)
• Extrusion (SP Extrusion),
collectively called PLASTICS.
Know-how, quality assurance, documentation
Advisors Raw material Moulds and machines Electricity and gas Components Transportation
S u p p l i e r s
Choice of raw
materials and
process
Design and
construction of
mould
Choice of
production
equipment
Production
• Injection moulding
• Vacuum forming
• Reaction injection
moulding
• Composite
• Injection blow
moulding
• Extrusion blow
moulding
• Extrusion
• Composite
• 3D print
• Milling and cutting
• Coatings
Finishing
treatment
• Welding
• Laser engraving
• 3D scanning
• Assembly
• Packaging
• Logistics
On-time
delivery
The customer’s
product idea
SP Group’s value creation
16 SP Group

2016 in outline
Revenue grew by 16.2% to DKK 1,382.3 million, thus exceeding the ex-
pectations expressed at the beginning of the year.
Operating profit measured by EBITDA amounted to DKK 190.4 million,
which is 21.3% up on 2015 and the highest ever.
Earnings are positively a;ected by corporate acquisitions.
Very large investments were made in 2016, adversely a;ecting earnings.
The investments are expected to contribute positively to results of opera-
tions from 2017 onwards.
The substantial profit increase is particularly attributable to Ergomat, TPI
Polytechniek, SP Medical and Ulstrup Plast. In the financial statements
for 2015, Ulstrup Plast was presented for six months only. Also Tinby,
Bröderna Bourghardt, SP Moulding, Gibo Plast and SP Extrusion reported
improved financial performance.
The acquisition of Plexx / Opido and MedicoPack also contributed posi-
tively on the top and bottom lines.
Outlook for 2017
The Plastics segment is expected to realise revenue and earnings growth.
Activities are expected to be expanded in China, USA, the Netherlands,
Poland, Sweden, Latvia, Slovakia, Norway and Denmark.
Development in Plastics 2014-2016
DKKm 2016 2015 2014
Revenue 1,382.3 1,189.8 999.3
Profit before net financials,
depreciation and amortisation (EBITDA) 190.4 157.0 104.4
Profit before net financials (EBIT) 132.1 97.8 63.4
Segment assets 946.0 846.1 740.8
Average number of employees 1,484 1,375 1,166
DivibaX®
Unique mixing devices focusing on
sta; and patient safety.
The connection device provides a 100%
safe mix of powders and fluids between
vials and IV containers produced by
MedicoPack A/S.
Management’s review / SP Group 17

Injection moulding and Blow moulding
• Global progress
• Reasonable results of operations
• Many new tasks
• Acquisition of MedicoPack
Name: SP Moulding A/S, Sander Tech ApS, Ulstrup Plast
A/S, SP Medical A/S and MedicoPack A/S
Website: www.sp-moulding.dk, www.up.dk,
www.sp-medical.dk and www.medicopack.com
Location: Juelsminde, Stoholm, Karise, Lynge, Langeskov,
Sieradz (Poland), Zdunska Wola (Poland),
Pobedim (Slovakia) and Suzhou (China)
Executive Board: Frank Gad, CEO of SP Moulding A/S, Jens Birklund
Andersen, Director of Sander Tech ApS, Søren
Ulstrup, CEO of Ulstrup Plast A/S, Kenny Rosendahl,
Director of SP Medical A/S, and Torben Bruhn,
CEO of MedicoPack A/S
Activities: SP Moulding, Sander Tech and Ulstrup Plast are
leading Danish manufacturers of injection-moulded
plastic precision components for a wide range of
industrial business enterprises. SP Moulding (Suzhou)
Co., Ltd. Ltd. In China, SP Moulding Poland Sp. z o.o.
and Ulstrup Plast s.r.o. Manufacture technical plastics
and perform assembly work. The business unit SP
Medical manufactures products in Karise and Zdun-
ska Wola (Poland) to customers in the medical device
industry. MedicoPack develops, produces and sells
packaging material and pharmaceutical disposable
equipment within injection and infusion therapy to
the global pharmaceutical and healthcare industry.
Description: In addition to the actual moulding, which is carried
out in modern production facilities, the business
area handles all finishing such as 3D scanning, laser
engraving, ultrasound welding, surface treatment
and compression. SP Moulding and SP Medical
also handle partial or full assembly, packaging and
consignment for a large number of customers.
MedicoPack’s production technology is based on
blow moulding, IBM (Injection Blow Moulding) and
EBM (Extrusion Blow Moulding), and the entity has a
leading position in the area of production of pack-
aging material for pharmaceutical purposes.
Environment/quality: Reference is made to the list of certificates on page 34.
2016 in outline
The improved economic trends combined with a number of new solu-
tions and the sale of a number of new moulds resulted in an increase in
the level of activity and higher operating profit.
SP Moulding saw a healthy entry of a number of new industrial customers
in Europe, the Americas and Asia, and business with existing customers
increased in both Europe and Asia.
SP Medical entered into a number of new agreements with both new and
existing customers in the medical device industry.
In 2011, SP Medical fitted a new injection-moulding factory in Poland for
purposes of manufacturing medical device products. In 2014 and 2015,
the factory was fitted with more machinery. New expanded cleanroom
facilities in Poland were ready for production in 2016.
In 2016, considerable amounts were invested in new, state-of-the-art
production equipment (robots, special-purpose machines, injection-
moulding machines, 3D scanning, energy savings and IT) as well as break-
in of new projects.
Both SP Moulding, SP Medical and Ulstrup Plast have entered into agree-
ments on the purchase of injection-moulding machines to be delivered
in 2017. The machines are to be used to expand activities with existing
customers.
For the fifth year in succession, SP Moulding has been elected the pre-
ferred supplier by one of its major, international customers, which is lead-
ing in its field in Europe as well as globally.
Following several years’ preparations, SP Moulding’s factory in Stoholm
has become TS 16.949-certified.
MedicoPack, which was acquired in July 2016, exports approx. 90% of its
sales. Large investments in MedicoPack have been initiated.
Markets and products
With approx. 400 injection-moulding machines (including more than 30
two- and three-component machines), SP Moulding, SP Medical and
Ulstrup Plast are, combined, the largest independent injection-mould-
ing business in Denmark and rank among the largest two in the Nordic
countries. The market is still characterised by many small suppliers and
excess capacity in certain areas, and a number of customers are turn-
ing to low-wage areas. However, several groups with own production of
injection-moulded plastics choose to outsource activities to specialists
such as SP Moulding, SP Medical and Ulstrup Plast. Moreover, the market
share is increased by substituting plastics for other materials.
SP Moulding and Ulstrup Plast enjoy obvious advantages in the Northern
European market due to their size and expertise in injection moulding
and design, product development, international sourcing of moulds and
raw materials as well as additional services such as welding, laser engrav-
ing, print, 3D print, 3D scanning, full assembly, packaging and dispatch
of finished products, often in close co-operation between the factories
in Poland, Slovakia, China and Denmark. As price remains an important
parameter, the production e&ciency needs to be further enhanced. In
Europe and China, SP Moulding is a minor supplier of technical plastics,
18 SP Group

but there is a potential in both regions for considerable growth by virtue
of SP Moulding’s overall know-how.
SP Medical addresses a potential market of approx. DKK 15 billion with
annual growth of 5-7%. SP Medical ranks among the two or three larg-
est Nordic suppliers of injection-moulded plastics to the medical device
industry, and in the niche of PTFE-coated guide wires for urology and
radiology, etc., SP Medical is among the three largest suppliers in Eu-
rope. SP Medical also manufactures medical components and equipment
and surface treats products with function-enhancing coatings. With its
expertise and quality standards, SP Medical have good opportunities to
increase its market shares.
MedicoPack develops, produces and sells packaging material and phar-
maceutical disposable equipment within injection and infusion therapy
to the global pharmaceutical and healthcare industry. Production activi-
ties take place, e.g., in cleanrooms and under sanitary, controlled condi-
tions where quality control and documentation are key competences.
The production technology is based on blow moulding, IBM (Injection
Blow Moulding) and EBM (Extrusion Blow Moulding), and the entity has
a leading position in the area of production of packaging material for
pharmaceutical purposes.
Strategy
SP Moulding and Ulstrup Plast will increase exports from the three Dan-
ish factories to the neighbouring markets, and the Polish and Slovakian
factories will strengthen the marketing of technical plastics and assem-
bly activities in the growth markets in Eastern and Western Europe. In
China, production capacity has been expanded, and sales are growing.
SP Moulding and Ulstrup Plast will continue to move labour-intensive
tasks from Western Europe to Poland, Slovakia and China and to invest
massively in technology and people.
In all markets, SP Moulding and Ulstrup Plast are planning to win market
shares by improved customer services, intensified participation in the
customers’ product development activities and targeted e;orts directed
at growth sectors. Competences should be strengthened continually so
that SP Moulding and Ulstrup Plast can di;erentiate themselves in future
as well. In all plants, the production e&ciency enhancement programme
will continue, e.g. by means of Lean projects, more automation and focus
on energy and raw material consumption, disposals as well as switch-
over times. SP Moulding will continue its participation in the strengthen-
ing of the position in Northern Europe where relevant.
SP Medical will continue to intensify its marketing e;orts vis-à-vis new cus-
tomers, especially benefiting from the fact that, given its Polish factory, the
entity has become increasingly competitive in relation to labour-intensive
tasks. The medical device expertise must be strengthened on an ongoing
basis, and the cleanroom production in Denmark and Poland must be ex-
panded. In China, “white room production” has been established.
MedicoPack will continue to strengthen and expand co-operation with
existing and new customers at a global level. Development activities fo-
cus on close co-operation with the customers in order to continually
improve and optimise existing packaging solutions and develop new,
pioneer packaging concepts. Clear Vial™ and DivibaX® are the product
series most recently launched.
SP Moulding’s factory in
Juelsminde manufac-
tures the bar chair shell
for Muuto. The shell con-
tains 25% wood fibres.
SP Moulding’s factory in
Stoholm manufactures
mink fur drying devices.
Chris Frensel Nielsen and Jørn T. Jensen,
SP Moulding, Juelsminde.
SP Moulding’s factory in Juelsminde
manufacture snu; boxes for AG Snus.
Guide wires – a medico
product manufactured
by SP Medical.
Both Ulstrup Plast, Slovakia, and SP Moulding, Poland, celebrated their 10th anniversary in 2016.
Management’s review / SP Group 19
Polyurethane and Composite
• Higher activity
• New products
• Expansion in the Netherlands, Poland, USA, China and Latvia
Name: The business area consists of four activities with
polyurethane (PUR) as the common denominator:
Ergomat A/S, Tinby A/S, TPI Polytechniek B.V. and
Bröderna Bourghardt AB.
Websites: www.ergomat.com, www.tinby.dk,
www.tpi-polytechniek.com, www.bourghardt.se
Location: Søndersø, Zdunska Wola (Poland), ‘s-Hertogenbosch
(the Netherlands), Helsingborg (Sweden), Cleveland
(USA), Montreal (Canada), Suzhou (China) and Liepaja
(Latvia).
Executive Board: Claus Lendal, Managing Director of Ergomat A/S,
Torben Nielsen, Managing Director of Tinby A/S,
Loïc van der Heijden, Managing Director of TPI
Polytechniek B.V., and David Bourghardt, Managing
Director of Bröderna Bourghardt AB
Ergomat A/S develops and sells ergonomic solutions under own
brands – Ergomat® mats and DuraStripe® striping tape
– to global corporate customers. Ergomat has sales
companies in Europe and North America. Its products
are manufactured in Poland and USA.
Tinby A/S manufactures moulded products in solid, foamed and
flexible PUR as well as laminated plastics and vacuum
film for, e.g. the graphics, medical device, furniture,
refrigerator and cleantech industries. In Poland, Tinby
Sp. z o.o. further manufactures light-foam products
for TPI. The entities in USA and China manufacture
light-foam products and other plastic solutions pri-
marily for the cleantech industry.
TPI develops and sells components for ventilation of
Polytechniek B.V. industrial buildings as well as pig and poultry houses,
primarily products under the TPI brand, which are
manufactured by Tinby in Poland. Global sales are
handled from the Netherlands. Sales in Scandinavia
are handled from Denmark.
Brdr. Bourghardt AB is a specialist in composite processes - composite
and manual lamination - and uses modern lacquering
methods. Brdr. Bourghardt is Scandinavia’s leading
manufacturer of Telene® products.
Description: PUR is manufactured by mixing two special liquids,
which react, and by pressing the mixture into a
mould forming the required component. Expertise
comprises knowing the scope for variation and mak-
ing the best of the material. The process is also called
Reaction Injection Moulding – or just RIM.
Environment/quality: Reference is made to the list of certificates on page 34.
2016 in outline
To Ergomat, 2016 was excellent with 6.1% revenue growth, primarily
driven by USA, but sales in the European market increased as well. Sales
to the Asian market were disappointing.
Tinby experienced handsome growth in global activities. Tinby has facto-
ries in Poland of approx. 16,000 sqm. and a factory in China of 2,400 sqm.
In USA, Tinby has established a factory of 1,000 sqm., which is primarily
used for cleantech production. In Denmark, Tinby has production facili-
ties of approx. 4,500 sqm. in Søndersø.
In 2016, TPI experienced project delays in Eastern Europe, but saw sales
progress in the other markets. For instance, the Asian market and the
markets in North Africa developed positively. Inventories in Denmark have
been moved to the Netherlands to maintain a high degree of flexibility
and a continued high service level.
For Bröderna Bourghardt, with a sales organisation in Sweden and pro-
duction activities in Latvia, 2016 was characterised by increased volumes
and launch of new projects within the technologies Telene and com-
posites in the European market. Bröderna Bourghardt has increased its
productive capacity by 25% in order to respond to the expected growth
in 2017.
Markets and products
Ergomat consolidated its position as one of the three largest suppliers of
ergonomic mats and striping products (DuraStripe) in Europe and North
America. Ergomat is characterised by being a pioneer when it comes
to better working environment and lean production. In 2015, Ergomat
introduced a unique mat concept in USA, Ergomat Deluxe, with in-built
LED lighting. This product is a hit, particularly in the automotive industry.
Ergomat experienced progress in Europe in 2016, not least in Germany,
France, the UK, Italy, Sweden and Eastern Europe. Sales failed in Asia, in
particular in Japan, primarily owing to the devaluation of the YEN.
Ergomat is operating actively in more than 60 countries through own
o&ces and local distributors.
Tinby is Scandinavia’s leading supplier of moulded components in solid,
foamed, flexible Polyurethane and combinations thereof. Tinby’s com-
ponents are used for cleantech tasks, in medical device products, in-
struments, furniture, graphic machines, ventilation, coatings, window
and construction profiles, insulation caps and cabinets. Tinby develops
special raw materials aimed at narrow and broad product solutions and
masters a number of technologies for product refinement, including
combination technologies, in-mould coating, varnishing and coatings.
Besides the PUR activities, Tinby has a vast number of special productions
aimed at the cleantech industry.
20 SP Group

With the development of raw materials and technologies, Tinby has suc-
ceeded in attracting a large number of tasks, particularly within clean-
tech, and its geographical focus has also resulted in considerable growth.
TPI is the leading supplier in Europe of light-foamed chimneys, air intake
and components for the agricultural and industrial sectors. PUR is espe-
cially suitable for these purposes, as the material is light, well insulating
and does not develop condensation when the temperature changes.
Eastern European markets are still interesting, and sales in the Middle
East, Asia and North America are expected to increase in the coming
years. Once again, TPI has launched several new products to expand and
broaden its existing product range. Due to these new products, TPI will be
able to increase its position in the global market for ventilation equipment
for pig and poultry houses.
Bröderna Bourghardt is the leading manufacturer in Scandinavia of items
in Telene (impact-resistant plastic suitable for large items) and manufac-
tures state-of-the-art products in composite material. The products are
sold to o;-highway companies and marine applications.
Strategy
More direct sales, intensified marketing and more external distributors in
selected markets are to increase Ergomat’s sales. Ergomat will increas-
ingly cultivate commercial and service enterprises and the administrative
and health sectors and strengthen the e;orts in the Americas, Eastern
Europe and Asia.
Plagiarism and increased competition require development of new prod-
ucts and concepts, and Ergomat will di;erentiate itself by o;ering inte-
grated solutions across existing products and by o;ering supplementary
services.
In Poland, Tinby now has production at four locations totalling approx.
16,000 sqm.
Tinby’s 2,400 sqm. factory in China, established in 2010, continues to
develop positively. In 2016, additional activities were initiated.
Tinby’s establishment in North America in connection with Ergomat’s
facilities was initiated and audited in 2014. The production facilities and
service centre comprise approx. 1,000 sqm.
TPI expects increased sales in Europe in 2017 because of its launch of
a number of new projects. TPI also expects a higher level of activity in
the Americas and Asia. Strong focus on developing new products will be
maintained.
Bröderna Bourghardt will increase its focus on sales and technical sup-
port to existing as well as potential customers. With the current capacity,
the opportunities to increase production output and make production
technologies even more well-known are still fine. The entity continually
works on developing processes and materials. Bröderna Bourghardt also
aims to develop one or several products under own brand.
TPI Polytechniek’s wind hoods
made in polyurethane are used,
e.g., in poultry houses.
Tinby manufactures BasKette
stripping basket for Kettegear.
Tinby’s own
product insulat-
ing caps made in
Polyurethane.
Pause chair for Magnus Olesen. Seat and
back in flexible PUR. Manufactured by
Tinby.
These mats are among the most durable in the world and have a unique
capability to facilitate cleaning and withstand strong chemicals.
Management’s review / SP Group 21

Vacuum forming and Extrusion
• Improved results of operations in 2016
• New tasks in several industries
• Expansion in Poland
• Acquisition of Plexx AS / Opido AB in Norway and Sweden
2016 in outline
Activities have increased, and Gibo Plast succeeded in ensuring a hand-
some improvement in operating profit and the level of activity. 2016 was
an eventful year, as Gibo Plast worked intensely on implementing e&cien-
cy-enhancing measures in Denmark as well as Poland. Large amounts and
many e;orts were invested in strengthening the expertise in the produc-
tion of tools for prototype devices and production of vacuum-formed
plastics, which facilitate better and more e;ective servicing of existing
and new customers by reducing time-to-market in connection with new
plastic components. To strengthen competences in Scandinavia, Gibo
Plast late in the year acquired Plexx AS / Opido AB with a sales o&ce in
Norway and production activities in Sweden. This acquisition also secured
competences within ORS (Opido Reinforced System), which is vacuum-
formed parts with PUR foam on the back side and laser cutting and hot
bending of items.
In Poland, investments were made in new, more e;ective production
machinery. As expected, investments in new plants and the relocation
of parts of the production to Poland have entailed lower costs and im-
proved results of operations.
Gibo Plast is one of the largest vacuum-forming facilities in Scandinavia
and is able to perform complex tasks. In close co-operation with Tinby,
Gibo has developed a number of interesting solutions for our custom-
ers, uniting the entities’ expertise. In addition, Gibo further developed
its competences in prototype devices and tools so that it can now itself
develop and manufacture production tools for vacuum forming. This
was in order to increase competitiveness through a very short time-to-
market for new plastic components.
Markets and products
The value of the Scandinavian market for vacuum-formed plastics is as-
sessed to be approx. DKK 5-600 million. The market is undergoing dras-
tic change, as a number of traditional users of vacuum-formed plastics
are put under pressure by competitors in low-wage areas and therefore
move their production to Southern and Eastern Europe or Asia. On the
other hand, many components made of materials such as glass fibre,
wood and metal may very well be replaced by plastics, as plastics are
lighter and easier to mould, allowing of growing demand.
An example is Gibo Plast’s transport boxes, which are used by automo-
tive, food and electronics businesses to transport particularly sensitive
goods or semi-manufactured products both internally and over long
distances. The boxes are lighter than wooden boxes, easier to clean
and designed so that the components do not touch each other and can
easily be moved by industrial robots. Another example is wind turbines
where the design qualities of thermo-formed plastics are pronounced.
Plastic sheets come in all colours and with a countless number of dif-
ferent surfaces. Moreover, the components may be provided with tech-
nical properties, e.g. the ability to resist heat, cold temperatures, wind,
weather and blows.
Within traditional vacuum forming, Gibo Plast is a market leader in
Scandinavia and ranks among the 10 largest suppliers in Europe. Within
the High-pressure and Twinsheet technologies, its position has been
strengthened. Gibo Plast is able to handle components of many di;er-
ent sizes and masters both large-scale production and minor series with
customised, logo-embossed components. The o;er to the customers is
supplemented by 3D CAD/CAM design, CNC milling, decoration, surface
treatment, 3D scanning, assembly, gluing and packaging.
Name: Gibo Plast A/S, Plexx AS, Opido AB
Websites: www.giboplast.com, www.plexx.no, www.opido.se
Location: Skjern, Ljungby (Sweden), Kråkerøy (Norway) and
Sieradz (Poland)
Executive Board: CEO Jan Kyster Madsen (Gibo Plast),
CEO Arild S. Johnsen (Plexx / Opido) and
CEO Andreas Lagestig (Opido)
Activities: Gibo Plast and PlexxOpido develop, design and
produce thermo-formed plastic components for re-
frigerators and freezers, cars, buses and other rolling
stock (automotive) as well as in the medical device,
lighting equipment and cleantech industries. Gibo
Plast is both specialised in traditional vacuum form-
ing and the state-of-the-art forming methods High-
pressure and Twinsheet. Opido AB is also specialised
in ORS (Opido Reinforced System) with fortified and
sound-absorbing vacuum-formed components as
well as laser cutting and hot bending.
Description: Vacuum forming means that plastic sheets are
warmed up and then formed using vacuum and/or
high pressure. The products are then processed by
way of cutting, milling (CNC milling) and, eventu-
ally, assembled to the finished product.
Environment/quality: Reference is made to the list of certificates on page 34.
22 SP Group

Strategy
Gibo Plast regularly invests in new vacuum-forming machines with ro-
bots and CNC-controlled millers. The production lines can manufacture
plastic components of up to 4.2 x 2.5 x 0.7 metres, making Gibo Plast a
market leader in Northern Europe in the area of forming of large com-
ponents. The components replace metal and glass fibre components in
wind turbines, buses and trains. Plastic components in high volumes with
high quality standards are manufactured on automated production lines
where the production machinery is operated by robots. This ensures a
high, uniform quality.
The acquisition of Plexx / Opido should be seen as a strengthening of
Gibo Plast’s activities in Europe, especially the Scandinavian market.
In 2011, the first assembly activities were established in Poland, and in
2012, the first vacuum-forming machines were moved to the newly built
factory in Poland. Today, the factory is an independently operating pro-
duction unit characterised by a very high service and quality level.
Together with the continued improvement of the productivity in Skjern,
these initiatives have contributed significantly to improving Gibo Plast’s
profitability in 2016 and are expected to do so in 2017 as well. Gibo Plast
has 12,000 sqm at the plant in Skjern, 9,700 sqm at the plant in Poland
and 6,000 sqm at the plant in Sweden and 800 sqm in Norway.
Gibo Plast has a balanced customer portfolio and a good exposure to a
number of industries. The entity is making targeted e;orts to attract new
customers, while at the same time strengthening its relationship with ex-
isting customers. Gibo Plast will increasingly contribute to the customers’
development phase so that new projects and solutions can be designed
and implemented in co-operation with the customers.
Gibo Plast will use the location in the neighbouring areas to cultivate
new markets in Eastern and Central Europe. Marketing on existing and
new markets will be focused on disseminating knowledge of plastics in
sectors which have traditionally been using glass fibre, metals and wood,
and especially on the High-pressure and Twinsheet technologies allow-
ing greater freedom in design and flexible production of complicated,
large-sized components. The ORS system contributes with fortified and
sound-absorbing vacuum-formed components. Gibo Plast is testing new
plastic technologies on a regular basis. Gibo Plast has developed new
projects for customers in the automotive and cleantech industries, which
are expected to contribute positively to sales and earnings in 2017.
Close working cooperation between SP Group and VELUX Group.Emil Nilsson performing a quality check on an acrylic panel to be put in a
video-conferencing system made by Opido Plast AB, Sweden.
Monika Knap at Gibo’s factory in Poland.
Vacuumformed crane door from Gibo
Plast. The crane is placed on the founda-
tion for wind turbines at sea. Gibo’s sister
company, Tinby, strengthens the cavity of
the door with foamed Polyurethane.
Management’s review / SP Group 23

SP Group’s locations
North and
South America
Sales in North and
South America account
for 10% of global sales
in 2016
Sale and production
Denmark (8)
Poland (6)
China (2)
Brazil (1)
USA (1)
Latvia (1)
Slovakia (1)
Sweden (1)
Sale and distribution
The Netherlands (1)
Sweden (1)
Canada (1)
Norway (1)
Acquisitions in 2014-2016
2014
24 February 2014
Bröderna Bourghardt AB
(80% of the shares)
7 April 2015
SP Moulding, China (the
remaining 25% of the shares)
2015
1 January 2015
Scanvakuum ApS
(the activities)
13 March 2015
Sander Tech ApS
10%
1 July 2015
Ulstrup Plast A/S
24 SP Group

Europe
Sales in Europe
account for 81% of
global sales
Asia
Sales in Asia and
Australia account
for 9% of global sales
2016
5 April 2016
10% of the shares in Bröderna
Bourghardt AB (option)
14 July 2016
MedicoPack A/S
15 October 2016
Aasum Plast & Metal A/S
(the plastic activities)
8 December 2016
The remaining 10% of the shares
in Bröderna Bourghardt AB
21 November 2016
Plexx AS / Opido AB
9%
81%
Management’s review / SP Group 25
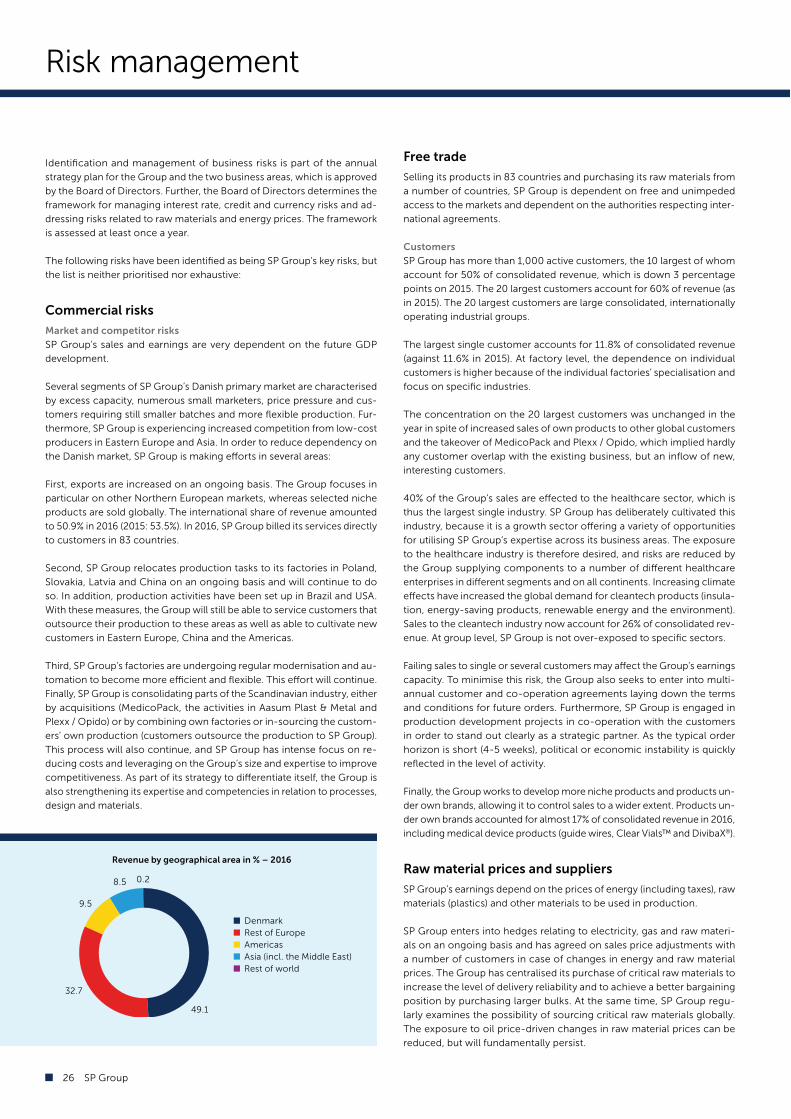
Risk management
Identification and management of business risks is part of the annual
strategy plan for the Group and the two business areas, which is approved
by the Board of Directors. Further, the Board of Directors determines the
framework for managing interest rate, credit and currency risks and ad-
dressing risks related to raw materials and energy prices. The framework
is assessed at least once a year.
The following risks have been identified as being SP Group’s key risks, but
the list is neither prioritised nor exhaustive:
Commercial risks
Market and competitor risks
SP Group’s sales and earnings are very dependent on the future GDP
development.
Several segments of SP Group’s Danish primary market are characterised
by excess capacity, numerous small marketers, price pressure and cus-
tomers requiring still smaller batches and more flexible production. Fur-
thermore, SP Group is experiencing increased competition from low-cost
producers in Eastern Europe and Asia. In order to reduce dependency on
the Danish market, SP Group is making e;orts in several areas:
First, exports are increased on an ongoing basis. The Group focuses in
particular on other Northern European markets, whereas selected niche
products are sold globally. The international share of revenue amounted
to 50.9% in 2016 (2015: 53.5%). In 2016, SP Group billed its services directly
to customers in 83 countries.
Second, SP Group relocates production tasks to its factories in Poland,
Slovakia, Latvia and China on an ongoing basis and will continue to do
so. In addition, production activities have been set up in Brazil and USA.
With these measures, the Group will still be able to service customers that
outsource their production to these areas as well as able to cultivate new
customers in Eastern Europe, China and the Americas.
Third, SP Group’s factories are undergoing regular modernisation and au-
tomation to become more e&cient and flexible. This e;ort will continue.
Finally, SP Group is consolidating parts of the Scandinavian industry, either
by acquisitions (MedicoPack, the activities in Aasum Plast & Metal and
Plexx / Opido) or by combining own factories or in-sourcing the custom-
ers’ own production (customers outsource the production to SP Group).
This process will also continue, and SP Group has intense focus on re-
ducing costs and leveraging on the Group’s size and expertise to improve
competitiveness. As part of its strategy to di;erentiate itself, the Group is
also strengthening its expertise and competencies in relation to processes,
design and materials.
Free trade
Selling its products in 83 countries and purchasing its raw materials from
a number of countries, SP Group is dependent on free and unimpeded
access to the markets and dependent on the authorities respecting inter-
national agreements.
Customers
SP Group has more than 1,000 active customers, the 10 largest of whom
account for 50% of consolidated revenue, which is down 3 percentage
points on 2015. The 20 largest customers account for 60% of revenue (as
in 2015). The 20 largest customers are large consolidated, internationally
operating industrial groups.
The largest single customer accounts for 11.8% of consolidated revenue
(against 11.6% in 2015). At factory level, the dependence on individual
customers is higher because of the individual factories’ specialisation and
focus on specific industries.
The concentration on the 20 largest customers was unchanged in the
year in spite of increased sales of own products to other global customers
and the takeover of MedicoPack and Plexx / Opido, which implied hardly
any customer overlap with the existing business, but an inflow of new,
interesting customers.
40% of the Group’s sales are e;ected to the healthcare sector, which is
thus the largest single industry. SP Group has deliberately cultivated this
industry, because it is a growth sector o;ering a variety of opportunities
for utilising SP Group’s expertise across its business areas. The exposure
to the healthcare industry is therefore desired, and risks are reduced by
the Group supplying components to a number of di;erent healthcare
enterprises in di;erent segments and on all continents. Increasing climate
e;ects have increased the global demand for cleantech products (insula-
tion, energy-saving products, renewable energy and the environment).
Sales to the cleantech industry now account for 26% of consolidated rev-
enue. At group level, SP Group is not over-exposed to specific sectors.
Failing sales to single or several customers may a;ect the Group’s earnings
capacity. To minimise this risk, the Group also seeks to enter into multi-
annual customer and co-operation agreements laying down the terms
and conditions for future orders. Furthermore, SP Group is engaged in
production development projects in co-operation with the customers
in order to stand out clearly as a strategic partner. As the typical order
horizon is short (4-5 weeks), political or economic instability is quickly
reflected in the level of activity.
Finally, the Group works to develop more niche products and products un-
der own brands, allowing it to control sales to a wider extent. Products un-
der own brands accounted for almost 17% of consolidated revenue in 2016,
including medical device products (guide wires, Clear Vials™ and DivibaX®).
Raw material prices and suppliers
SP Group’s earnings depend on the prices of energy (including taxes), raw
materials (plastics) and other materials to be used in production.
SP Group enters into hedges relating to electricity, gas and raw materi-
als on an ongoing basis and has agreed on sales price adjustments with
a number of customers in case of changes in energy and raw material
prices. The Group has centralised its purchase of critical raw materials to
increase the level of delivery reliability and to achieve a better bargaining
position by purchasing larger bulks. At the same time, SP Group regu-
larly examines the possibility of sourcing critical raw materials globally.
The exposure to oil price-driven changes in raw material prices can be
reduced, but will fundamentally persist.
49.1
32.7
9.5
8.5 0.2
Denmark
Rest of Europe
Americas
Asia (incl. the Middle East)
Rest of world
Revenue by geographical area in % – 2016
26 SP Group

Restructuring the production system
Production systems are changed on an ongoing basis, partly by invest-
ing in new production equipment and partly by modifying systems and
distribution of tasks. This means that the Group gradually obtains im-
proved specialisation of the production at each plant and that e&ciency
is enhanced. There is a risk that implementing these changes may cause
delays and disruptions and thus inflict extra expenses on the Group or
a;ect business volumes. There is also a risk that relocating production
equipment and production tasks may cause delays and price increases.
Through careful planning, SP Group aims at minimising expenses and
the time spent restructuring the production systems. A smooth and swift
implementation of these processes is necessary to increase the Group’s
profitability.
Key personnel
SP Group is dependent on a number of key personnel in the management
team and among the Group’s specialists. SP Group seeks to retain key
personnel by o;ering them challenging tasks, a basic salary in conform-
ity with applicable market conditions and incentive schemes rewarding
outstanding performance.
Insurance
SP Group has an extensive insurance programme in place, which reflects
the scope of the Group’s activities and their geographical location. Once
a year, the insurance programme is examined together with the Group’s
global advisor to make adjustments that support the Group’s develop-
ment on an ongoing basis, thereby minimising any detrimental impact on
the Group’s financial performance. Once a year, the insurance policy is
reviewed by the Board of Directors and adjusted as required.
Environmental performance
The production plants are subject to a number of environmental require-
ments in all countries, and further, a number of environmental and quality
assurance systems have been implemented by the plants on a voluntary
basis. SP Group complies with applicable environmental requirements,
but cannot guarantee - in spite of extensive safety procedures - that the
general as well as the working environment will not be a;ected in case of
accident. (Moreover, reference is made to pages 35-38 on CSR and page
34 on environmental certification).
Financial risks
The Group’s cash flows and borrowings are managed centrally in accord-
ance with the policies approved by the Board of Directors. The Group
does not engage in speculation in financial risks.
Interest rate risks
Interest rate risks primarily relate to interest-bearing net debt, i.e. mortgage
debt, lease liabilities and bank debt less cash. At year-end, net interest-
bearing debt totalled DKK 407.7 million. Approx. 20% of the debt earns in-
terest at a fixed rate for minimum 2-5 years, including the mortgage credit
debt earning interest at an average rate of approx. 1.3%. A one-percentage
point increase in the general interest level will result in an increase in the
Group’s annual interest expenses before tax of approx. DKK 3.0 million.
SP Group focuses on increasing cash flows from operating activities so
that the net interest-bearing debt can be reduced and the Group can
finance investments via operating activities. The Group also aims at reduc-
ing debt by selling non-value-creating assets and activities.
Credit risks
SP Group systematically monitors the credit rating of customers and busi-
ness partners and makes use of credit insurance and factoring to partially
hedge credit risks. No individual customers or business partners pose an
unusual credit risk to the Group. As the Group’s customers and business
partners are normally well-reputed companies operating in many di;er-
ent business sectors and countries, the overall credit risk is reduced. SP
Group has not realised any noticeable credit losses in the past five years.
Currency risks
In accordance with the policies approved by the Board of Directors, SP
Group carries through currency transactions to hedge commercial agree-
ments. Hedging takes place by means of borrowing, forward exchange
contracts or options, and Management regularly assesses the need for
hedging each individual transaction.
In general, there is a good balance between income and expenses. Ap-
prox. 80% of sales are thus recognised in DKK or EUR, and approx. 60% of
the Group’s fixed costs are incurred in DKK or EUR. The most critical com-
mercial currency risk is indirect and relates to the customers’ sales outside
Europe. Similarly, purchasing is primarily conducted in DKK and EUR.
Exports from Europe to USA are settled in USD on a 12-month forward
selling basis (project orders up to 36 months).
Moreover, there is a currency risk between PLN and EUR and between RMB
and USD, as the Group has increasing exports from Poland and China, which
are settled in EUR and USD, respectively. In order to hedge the currency
risk between PLN and EUR, EUR is sold against PLN on forward contracts
for up to 48 months (hedging). At year-end 2016, the Group had hedged
approx. 99% of the expected net cash flows in the coming 36 months and
10% of the expected net cash flows in the subsequent 12-month period.
15% of the Group’s financing is raised in EUR, and the remaining debt is
mainly raised in DKK.
Liquidity risks
It is the Group’s objective to have su&cient cash resources to be able
to continually make appropriate arrangements in case of unforeseen
changes in cash outflows.
It is Management’s opinion that, considering its current operations, the
Company still has adequate capital resources and su&cient liquidity for
purposes of its plans and operations. The Company’s long-term coopera-
tion with its financial business partners is fruitful and constructive. This is
expected to be continued. The Group has neither neglected nor been in
breach of loan agreements in the financial year or the comparative year.
Bröderna Bourghardt manufactures this front part for Volvo buses in TELENE.
Management’s review / SP Group 27
Corporate governance
Proper and decent management
Proper and decent management is a precondition for SP Group being able
to create long-term value for its shareholders, customers, employees and
other stakeholders. Management sets up clear strategic and financial goals
and provides information on goal achievement on an ongoing basis in or-
der for all stakeholders to be able to evaluate the development and future of
the Group. It is essential to Management that SP Group meets its stakehold-
ers at eye level and that the shareholders can exercise their rights freely.
The Board of Directors and the Executive Board strive to act openly in
relation to their work and their approach to management. Management
follows the recommendations for corporate governance issued by the
Committee on Corporate Governance in 2013 (last update November
2014) based on the “comply or explain” principle. At http://www.sp-group.
dk/investor+relations/corporate+governance, the Board of Directors sys-
tematically describes “the Company’s position on the recommendations
on corporate governance of May 2013” in the “Corporate governance” sec-
tion. SP Group complies with the majority of the recommendations but has
chosen a di;erent practice in some areas, which is more suitable for SP
Group. The main deviation involves the following:
SP Group has not set any mandatory retirement age for members of the
Board of Directors. SP Group finds that a mandatory retirement age is
discriminating and that the capacity and contribution of each member
are more important than their birth certificates.
In a few areas, SP Group has not formalised procedures and policies to
the same extent as suggested by the Committee on Corporate Govern-
ance. For instance, SP Group has neither introduced an actual stakeholder
policy (but has a clear attitude to and policies for communication) nor
prepared any separate engagement description for the Chairman (instead,
this is part of the rules of procedure for the Board of Directors).
The Board of Directors has considered appointing committees under the
auspices of the Board of Directors, but found that, due to the size of the
Group, SP Group does not need such committees, with the exception of
an Audit Committee whose members are the collective Board of Direc-
tors, chaired by Hans-Henrik Eriksen.
Duties of the Board of Directors
In 2016, the Board of Directors held 13 meetings, two of which had focus
on strategy and budgets, respectively. At the strategy meeting in December,
the Board of Directors also discussed business risks and the management
of such risks at group level and in the individual business areas. Once a year,
the Board of Directors determines the framework for managing interest
rate, credit and currency risks and risks related to raw materials and energy
prices, and the Board of Directors follows up on the implementation of
this framework on an ongoing basis. Discussion and revision of the rules
of procedure is a routine procedure at the board meeting in June. All board
members attend to the functions of the Audit Committee. Separate meet-
ings in the Audit Committee are held in connection with board meetings.
The Board of Directors assesses the Group’s financial position, goals,
dividend policy and share structure on an ongoing basis. The dividend
policy is specified in the “Shareholder information” section, and the fi-
nancial goals are specified in the “Strategic development” section. The
Board of Directors assesses that the financial structure is appropriate for
the present size and challenges of SP Group, and the Board of Directors
targets an equity ratio of 25-45% to ensure an e&cient capital structure. It
is expected that the equity ratio will have increased to 25-45% at the end
of 2017. If the equity ratio increases any excess capital, is expected to be
paid out to the shareholders.
The Board of Directors receives a weekly report from the Executive Board,
which details a number of recurring areas, including cash flows and devel-
opments in the business areas. In addition, the Board of Directors receives
quarterly and monthly reports, including detailed financial follow-up.
Composition of the Board of Directors
The board members elected by the shareholders are up for election each
year. 4-5 members is an appropriate number, as the Board of Directors
can thus work e&ciently and gather quickly while at the same time being
diverse enough to represent di;erent experiences.
The Board of Directors is composed of persons with relevant insight into
the plastics industry and management experience from internationally
operating production enterprises. Hans W. Schur is connected to a major
shareholder in the Company, but cannot be considered a majority share-
holder. Thus, no member of the Board of Directors has any other interest
in SP Group than safeguarding the shareholders’ interests, and SP Group
finds that the current board members possess the qualifications and ex-
perience necessary to manage the Group and act as an e&cient sounding
board vis-à-vis the Executive Board. Of the board members elected by
the company in general meeting, only Hans-Henrik Eriksen is found to
be independent in accordance with the criteria defined by the Commit-
tee on Corporate Governance. The other four board members have been
members of the Board of Directors for more than 12 years.
At the ordinary general meeting in 2017, Erik Christensen will retire after
15 years’ committed and competent e;ort as board member, and Bente
Overgaard will be nominated for the position as a new, independent mem-
ber of the Board of Directors.
At the annual general meeting in 2009, the two employee representatives
on the Board of Directors resigned as their term of o&ce expired. No new
representatives have been elected in accordance with the rules of election
of group representatives for SP Group’s Board of Directors. In the coming
year, the Board of Directors will therefore only consist of the members
elected by the shareholders.
Remuneration of Management
The Company’s remuneration policy has been approved by the general
meeting, most recently in 2014. The Board of Directors has no incen-
tive programmes, but receives an ordinary remuneration determined by
the annual general meeting. As announced at the latest annual general
meeting, it is recommended that remuneration for 2016 be fixed at DKK
400,000 to the Chairman, DKK 250,000 to the Deputy Chairman and DKK
200,000 to other members. Moreover, it is proposed that the Chairman
of the Audit Committee should receive a separate fee of DKK 50,000 in
addition to the directors’ fee. The members of the Board of Directors will
not receive any remuneration for any ad hoc tasks, but their travelling
expenses in connection with meetings, etc. will be reimbursed.
The Board of Directors will propose that directors’ fees for 2017 are in-
creased to DKK 450,000 for the Chairman, DKK 275,000 for the Deputy
Chairman and DKK 225,000 for other board members. Moreover, it is
proposed that the Chairman of the Audit Committee is still to receive a
separate fee of DKK 50,000 in addition to the directors’ fee. Directors’ fees
were most recently adjusted with e;ect for 2012.
Remuneration of the Executive Board is negotiated by the Chairman and
adopted by the Board of Directors. The remuneration consists of a basic
salary and usual benefits such as company-paid telephone, car, etc. In
2016, the total remuneration was DKK 5.8 million against DKK 5.4 million in
28 SP Group

2015. Members of the Executive Board make pension contributions them-
selves. The Company must give at least 24 months’ notice of dismissal to
CEO Frank Gad and at least 12 months’ notice to CFO Jørgen Hønnerup
Nielsen. If the members of the Executive Board are dismissed in connec-
tion with a takeover of SP Group (including a merger or other combination),
the Company will not be obliged to pay any further severance pay.
Members of the Executive Board are not eligible for any short-term in-
centive schemes such as bonus schemes. However, SP Group has set up
long-term incentive schemes.
In 2012, the Board of Directors issued 100,000 warrants to the Executive
Board and executives in the Group. Frank Gad received 20,000 warrants,
and Jørgen Nielsen received 10,000 warrants. The remaining 70,000
warrants were distributed among 22 executive o&cers. The issued war-
rants can be exercised to subscribe for shares in the period 1 April 2015
to 31 March 2018; however, exercise can only take place during the first
two weeks in those periods where Management is allowed to trade the
Company’s shares in accordance with the Company’s internal rules. The
exercise price is fixed at DKK 120 based on the listed price immediately
before and after the publication of the annual report on 28 March 2012.
Moreover, an addition of 7.5% p.a. is added calculated from 1 April 2012
and until the warrants can be exercised at the earliest. The programme
will not represent a value to the executives until the shareholders have
ascertained increasing share prices. The grant in 2012 was made based on
the mandate granted to the Board of Directors by the company in general
meeting in 2011. Only 98,612 of the 100,000 warrants issued have vested
or been purchased. Both Frank Gad and Jørgen Nielsen exercised their
warrants in 2015. So did most of the other executive o&cers. At year-end
2016, 1,000 warrants under the 2012 programme were outstanding. All
warrants are presently hedged by means of treasury shares.
In 2013, the Board of Directors issued 100,000 warrants to the Executive
Board and executives in the Group. Frank Gad received 17,000 warrants,
and Jørgen Nielsen received 8,000 warrants. The remaining 75,000 war-
rants were distributed among 23 executive o&cers. The issued warrants
can be exercised to subscribe for shares in the period 1 April 2016 to
31 March 2019; however, exercise can only take place during the first
two weeks in those periods where Management is allowed to trade the
Company’s shares in accordance with the Company’s internal rules. The
exercise price is fixed at DKK 145 based on the listed price immediately
before and after the publication of the annual report on 22 March 2013.
Moreover, an addition of 7.5% p.a. is added calculated from 1 April 2013
and until the warrants are exercised. The programme will not represent a
value to the executives until the shareholders have ascertained increasing
share prices. The grant in 2013 was made based on the mandate granted
to the Board of Directors by the company in general meeting in 2013.
Only 96,334 of the 100,000 warrants issued have vested. At year-end
2016, 12,000 warrants under the 2013 programme were outstanding. All
warrants are presently hedged by means of treasury shares.
In 2014, the Board of Directors issued 50,000 warrants to the Executive
Board and executives in the Group. Frank Gad received 6,000 warrants,
and Jørgen Nielsen received 4,000 warrants. The remaining 40,000 war-
rants were distributed among 26 executives. The issued warrants can be
exercised to subscribe for shares in the period 1 April 2017 to 31 March
2020; however, exercise can only take place during the first two weeks
in those periods where Management is allowed to trade the Company’s
shares in accordance with the Company’s internal rules. The exercise price
is fixed at DKK 280 based on the listed price immediately before the pub-
lication of the annual report on 27 March 2014 and up to 29 April 2014.
Moreover, an addition of 7.5% p.a. is added calculated from 1 April 2014
and until the warrants are exercised. The programme will not represent a
value to the executives until the shareholders have ascertained increasing
share prices. The grant in 2014 was made based on the mandate granted
to the Board of Directors by the company in general meeting in 2013. Ap-
prox. 85% of the warrants are currently hedged by treasury shares.
In 2015, the Board of Directors issued 50,000 warrants to the Executive
Board and executive o&cers in the Group. Frank Gad received 6,000 war-
rants, and Jørgen Nielsen received 4,000 warrants. The remaining 40,000
warrants were distributed among 26 executives. The issued warrants can
be exercised to subscribe for shares in the period 1 April 2018 to 31 March
2021; however, exercise can only take place during the first two weeks
in those periods where Management is allowed to trade the Company’s
shares in accordance with the Company’s internal rules. The exercise price
is fixed at DKK 255 based on the listed price immediately before the pub-
lication of the annual report on 26 March 2015 and up to 27 April 2015.
Moreover, an addition of 7.5% p.a. is added calculated from 1 April 2015
and until the warrants are exercised. The programme will not represent a
value to the executives until the shareholders have ascertained increasing
share prices. The grant in 2015 was made based on the mandate granted
to the Board of Directors by the company in general meeting in 2013.
In 2016, the Board of Directors issued 59,000 warrants to the Executive
Board and executive o&cers in the Group. Frank Gad received 6,000
warrants, and Jørgen Nielsen received 4,000 warrants. The remaining
49,000 warrants were distributed among 29 executives. The issued war-
rants can be exercised to subscribe for shares in the period 1 April 2019
to 31 March 2022; however, exercise can only take place during the first
two weeks in those periods where Management is allowed to trade the
Company’s shares in accordance with the Company’s internal rules. The
exercise price is fixed at DKK 390 based on the listed price immediately
before the publication of the annual report on 30 March 2016 and up
to 28 April 2016. Moreover, an addition of 7.5% p.a. is added calculated
from 1 April 2016 and until the warrants are exercised. The programme
will not represent a value to the executives until the shareholders have
ascertained increasing share prices. The grant in 2016 was made based
on the mandate granted to the Board of Directors by the company in
general meeting on 28 April 2016.
Loïc van der Heijden, managing director at TPI Polytechniek (to the right) to-
gether with managing director at Tinby in Poland, Adam Czyzynski. In 2016, TPI
Polytechniek celebrated its 20th anniversary.
In November, TPI Polytechniek was represented once again at the EuroTier Trade
Fair in Hanover, Germany.
Management’s review / SP Group 29
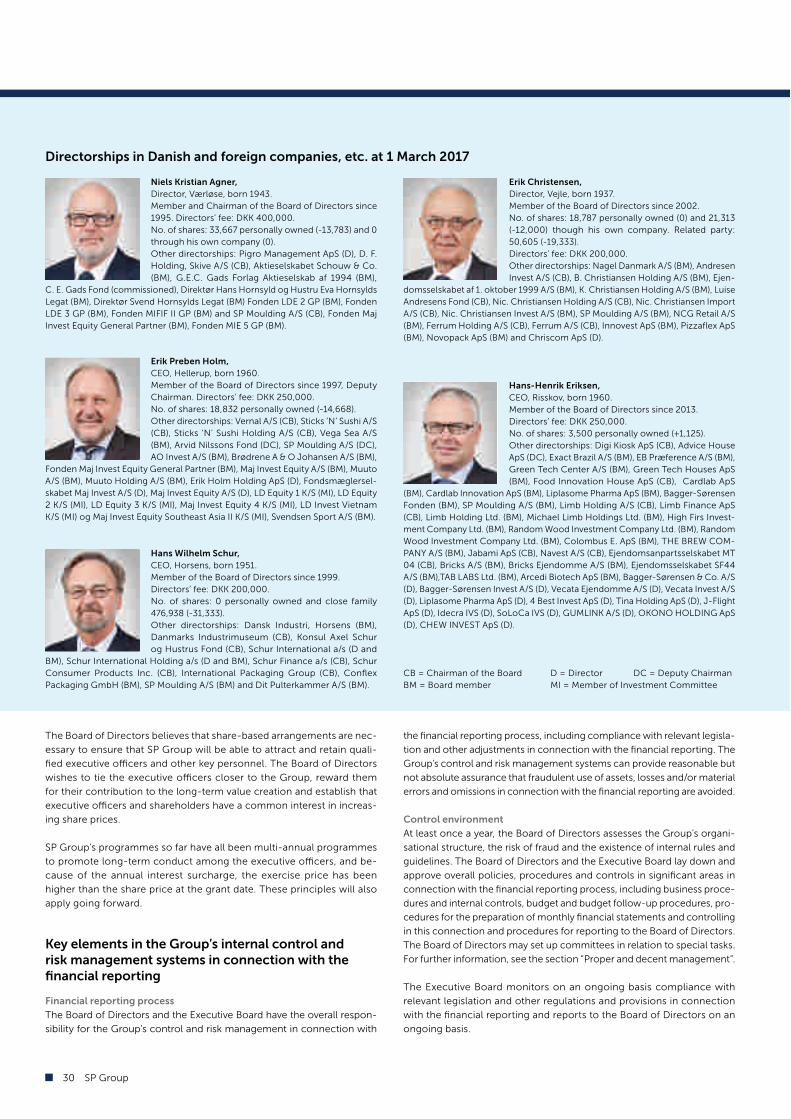
The Board of Directors believes that share-based arrangements are nec-
essary to ensure that SP Group will be able to attract and retain quali-
fied executive o&cers and other key personnel. The Board of Directors
wishes to tie the executive o&cers closer to the Group, reward them
for their contribution to the long-term value creation and establish that
executive o&cers and shareholders have a common interest in increas-
ing share prices.
SP Group’s programmes so far have all been multi-annual programmes
to promote long-term conduct among the executive o&cers, and be-
cause of the annual interest surcharge, the exercise price has been
higher than the share price at the grant date. These principles will also
apply going forward.
Key elements in the Group’s internal control and
risk management systems in connection with the
financial reporting
Financial reporting process
The Board of Directors and the Executive Board have the overall respon-
sibility for the Group’s control and risk management in connection with
the financial reporting process, including compliance with relevant legisla-
tion and other adjustments in connection with the financial reporting. The
Group’s control and risk management systems can provide reasonable but
not absolute assurance that fraudulent use of assets, losses and/or material
errors and omissions in connection with the financial reporting are avoided.
Control environment
At least once a year, the Board of Directors assesses the Group’s organi-
sational structure, the risk of fraud and the existence of internal rules and
guidelines. The Board of Directors and the Executive Board lay down and
approve overall policies, procedures and controls in significant areas in
connection with the financial reporting process, including business proce-
dures and internal controls, budget and budget follow-up procedures, pro-
cedures for the preparation of monthly financial statements and controlling
in this connection and procedures for reporting to the Board of Directors.
The Board of Directors may set up committees in relation to special tasks.
For further information, see the section “Proper and decent management”.
The Executive Board monitors on an ongoing basis compliance with
relevant legislation and other regulations and provisions in connection
with the financial reporting and reports to the Board of Directors on an
ongoing basis.
Directorships in Danish and foreign companies, etc. at 1 March 2017
Niels Kristian Agner,
Director, Værløse, born 1943.
Member and Chairman of the Board of Directors since
1995. Directors’ fee: DKK 400,000.
No. of shares: 33,667 personally owned (-13,783) and 0
through his own company (0).
Other directorships: Pigro Management ApS (D), D. F.
Holding, Skive A/S (CB), Aktieselskabet Schouw & Co.
(BM), G.E.C. Gads Forlag Aktieselskab af 1994 (BM),
C. E. Gads Fond (commissioned), Direktør Hans Hornsyld og Hustru Eva Hornsylds
Legat (BM), Direktør Svend Hornsylds Legat (BM) Fonden LDE 2 GP (BM), Fonden
LDE 3 GP (BM), Fonden MIFIF II GP (BM) and SP Moulding A/S (CB), Fonden Maj
Invest Equity General Partner (BM), Fonden MIE 5 GP (BM).
Erik Christensen,
Director, Vejle, born 1937.
Member of the Board of Directors since 2002.
No. of shares: 18,787 personally owned (0) and 21,313
(-12,000) though his own company. Related party:
50,605 (-19,333).
Directors’ fee: DKK 200,000.
Other directorships: Nagel Danmark A/S (BM), Andresen
Invest A/S (CB), B. Christiansen Holding A/S (BM), Ejen-
domsselskabet af 1. oktober 1999 A/S (BM), K. Christiansen Holding A/S (BM), Luise
Andresens Fond (CB), Nic. Christiansen Holding A/S (CB), Nic. Christiansen Import
A/S (CB), Nic. Christiansen Invest A/S (BM), SP Moulding A/S (BM), NCG Retail A/S
(BM), Ferrum Holding A/S (CB), Ferrum A/S (CB), Innovest ApS (BM), Pizzaflex ApS
(BM), Novopack ApS (BM) and Chriscom ApS (D).
Erik Preben Holm,
CEO, Hellerup, born 1960.
Member of the Board of Directors since 1997, Deputy
Chairman. Directors’ fee: DKK 250,000.
No. of shares: 18,832 personally owned (-14,668).
Other directorships: Vernal A/S (CB), Sticks ‘N’ Sushi A/S
(CB), Sticks ‘N’ Sushi Holding A/S (CB), Vega Sea A/S
(BM), Arvid Nilssons Fond (DC), SP Moulding A/S (DC),
AO Invest A/S (BM), Brødrene A & O Johansen A/S (BM),
Fonden Maj Invest Equity General Partner (BM), Maj Invest Equity A/S (BM), Muuto
A/S (BM), Muuto Holding A/S (BM), Erik Holm Holding ApS (D), Fondsmæglersel-
skabet Maj Invest A/S (D), Maj Invest Equity A/S (D), LD Equity 1 K/S (MI), LD Equity
2 K/S (MI), LD Equity 3 K/S (MI), Maj Invest Equity 4 K/S (MI), LD Invest Vietnam
K/S (MI) og Maj Invest Equity Southeast Asia II K/S (MI), Svendsen Sport A/S (BM).
Hans Wilhelm Schur,
CEO, Horsens, born 1951.
Member of the Board of Directors since 1999.
Directors’ fee: DKK 200,000.
No. of shares: 0 personally owned and close family
476,938 (-31,333).
Other directorships: Dansk Industri, Horsens (BM),
Dan marks Industrimuseum (CB), Konsul Axel Schur
og Hustrus Fond (CB), Schur International a/s (D and
BM), Schur International Holding a/s (D and BM), Schur Finance a/s (CB), Schur
Consumer Products Inc. (CB), International Packaging Group (CB), Conflex
Packaging GmbH (BM), SP Moulding A/S (BM) and Dit Pulterkammer A/S (BM).
Hans-Henrik Eriksen,
CEO, Risskov, born 1960.
Member of the Board of Directors since 2013.
Directors’ fee: DKK 250,000.
No. of shares: 3,500 personally owned (+1,125).
Other directorships: Digi Kiosk ApS (CB), Advice House
ApS (DC), Exact Brazil A/S (BM), EB Præference A/S (BM),
Green Tech Center A/S (BM), Green Tech Houses ApS
(BM), Food Innovation House ApS (CB), Cardlab ApS
(BM), Cardlab Innovation ApS (BM), Liplasome Pharma ApS (BM), Bagger-Sørensen
Fonden (BM), SP Moulding A/S (BM), Limb Holding A/S (CB), Limb Finance ApS
(CB), Limb Holding Ltd. (BM), Michael Limb Holdings Ltd. (BM), High Firs Invest-
ment Company Ltd. (BM), Random Wood Investment Company Ltd. (BM), Random
Wood Investment Company Ltd. (BM), Colombus E. ApS (BM), THE BREW COM-
PANY A/S (BM), Jabami ApS (CB), Navest A/S (CB), Ejendomsanpartsselskabet MT
04 (CB), Bricks A/S (BM), Bricks Ejendomme A/S (BM), Ejendomsselskabet SF44
A/S (BM),TAB LABS Ltd. (BM), Arcedi Biotech ApS (BM), Bagger-Sørensen & Co. A/S
(D), Bagger-Sørensen Invest A/S (D), Vecata Ejendomme A/S (D), Vecata Invest A/S
(D), Liplasome Pharma ApS (D), 4 Best Invest ApS (D), Tina Holding ApS (D), J-Flight
ApS (D), Idecra IVS (D), SoLoCa IVS (D), GUMLINK A/S (D), OKONO HOLDING ApS
(D), CHEW INVEST ApS (D).
CB = Chairman of the Board D = Director DC = Deputy Chairman
BM = Board member MI = Member of Investment Committee
30 SP Group

Risk assessment
At least once a year, the Board of Directors makes an overall assessment of
risks relating to the financial reporting process. As part of the risk manage-
ment, the Board of Directors considers the risk of fraud and the measures
to be taken in order to reduce and/or eliminate such risks. In this con-
nection, Management’s incentive/motive, if any, for fraudulent financial
reporting or other fraud is discussed.
Audit committee
The duties of the Audit Committee are attended to by all members of the
Board of Directors. Hans-Henrik Eriksen, who is an independent mem-
ber, possesses accounting and audit qualifications. Hans-Henrik Eriksen is
Chairman of the Audit Committee and state authorised public accountant.
Auditors
To perform the audit, an audit firm of state authorised public accountants
is appointed at the annual general meeting upon the Board of Directors’
recommendation. The auditors are representatives of the general public.
The auditors prepare long-form audit reports to the collective Board of Di-
rectors at least twice a year and immediately after identifying any matters
that the Board of Directors should address. The auditors participate in the
meetings of the Board of Directors in connection with the presentation of
Ownership interests end of March 2017:
Board of Directors % of
and Executive Own Related share
Board: Private company parties Total capital
Niels Kristian Agner 33,667 33,667 1.8
Erik Preben Holm 18,832 18,832 0.8
Hans Wilhelm Schur 476,938 476,938 20.9
Erik Christensen 18,787 21,313 50,605 90,705 4.0
Hans-Henrik Eriksen 3,500 3,500 0.2
Frank Gad 89,966 277,273 3,990 371,229 16.3
Jørgen Nielsen 26,695 26,695 1.2
191,447 298,586 531,533 1,021,566 44.8
Executive Board Management team
Frank Gad, CEO
Born in 1960, MSc in Economics and Business Admin-
istration, Frederiksberg.
Salary in 2016: DKK 3.9 million and a car.
Share-based salary in 2016: DKK 0.
Frank Gad took up his position in November 2004 and
is the CEO of SP Moulding A/S and Chairman of the
Board of Directors of the most significant subsidiaries
of SP Group.
Previous employment: CEO of FLSmidth A/S (1999-2004), CEO of Mærsk Con-
tainer Industri A/S (1996-1999) and employment at Odense Staalskibsværft (1985-
1999), Executive Vice President at the time of resignation.
External directorships: Director of Frank Gad ApS, Gadplast ApS and Gadmol ApS.
Shares in SP Group: 89,966 personally owned (0) and 277,273 (-11,000) through
his own company. Close family: 3,990 (0).
Jørgen Hønnerup Nielsen, CFO
Born in 1956, Graduate Diploma in Business Adminis-
tration, Odense.
Salary in 2016: DKK 1.6 million and a car.
Share-based salary in 2016: DKK 0.
Jørgen Nielsen joined Tinby in 1987 and has been em-
ployed in SP Group since 2002. Jørgen Nielsen was
admitted as member of the Group Executive Board at
1 March 2007.
Previous employment: Rasm. Holbeck og Søn A/S 1985-87, Revisionsfirmaet Knud
E. Rasmussen 1978-85.
External directorships: None.
Shares in SP Group: 26,695 personally owned (-505).
Other executive o$cers in SP Group are:
Jens Hinke, Director of R&D in SP Group A/S until 31 March 2017
Mads Juhl, Managing Director of Accoat A/S
Lars Ravn Bering, Managing Director of Gibo Plast A/S until 30 April 2016
Jan Kyster Madsen, CEO of Gibo Plast A/S and SP Extrusion A/S from 1 May 2016
Torben Nielsen, Managing Director of Tinby A/S
Adam Czyzynski, Managing Director of Tinby Sp. z o.o., Poland
Jeroen van der Heijden, Chairman, TPI Polytechniek B.V., the Netherlands
Loïc van der Heijden, Managing Director of TPI Polytechniek B.V., the Netherlands
Claus Lendal, Managing Director of Ergomat A/S
David Bourghardt, Managing Director of Brdr. Bourghardt AB, Sweden
Søren Ulstrup, CEO, Ulstrup Plast A/S
Torben Krøyer Bruhn, CEO of MedicoPack A/S. From 14 July 2016, under the
auspices of SP Group A/S
Arild S. Johnsen, CEO of Plexx AS / Opido AB. From 21 November 2016, under
the auspices of SP Group A/S
Andreas Lagestig, CEO of Opido AB. From 21 November 2016, under the
auspices of SP Group A/S
Kenny Rosendahl, Director of SP Medical A/S
Mogens Laigaard, Director of SP Medical A/S, guidewire department
Jan R. Sørensen, Managing Director of SP Moulding (Suzhou) Co., Ltd., China
Jens Birklund Andersen, Director of SP Moulding A/S, Stoholm, and of
Sander Tech ApS
Jesper R. Holm, Director of SP Moulding A/S, Juelsminde
Iwona Czyzynski, Plant Manager, SP Medical Sp. z o.o., Poland
Renato Miom, Plant Manager, Accoat do Brasil Ltda., Brazil
Anie Simard,Vice President, Ergomat Inc., USA
Monika Karczewska, Plant Manager, SP Moulding Sp. z o.o., Poland
April Zhu, Plant Manager, Tinby Co. Ltd., China
Mia Mørk, Executive Assistant, SP Group A/S
Martin Baca, Managing Director of Ulstrup Plast s.r.o., Slovakia
Pawel Michalski, Plant Manager, SP Medical Sp. z o.o., Poland
Dominika Rytczak, Plant Manager, Gibo Sp. z o.o., Poland
Przemyslaw Tuzikiewicz, Plant Manager, Tinby Sp. z o.o., Poland
Jacek Staszczyk, Plant Manager, Ergomat Sp. z o.o., Poland
long-form audit reports to the Board of Directors. Prior to the recommen-
dation for appointment at the annual general meeting, the Board of Direc-
tors makes an assessment, in consultation with the Executive Board, of
the auditor’s independence, competences, etc. All major subsidiaries are
audited by the Company’s auditors or by their foreign business partners.
Management’s review / SP Group 31
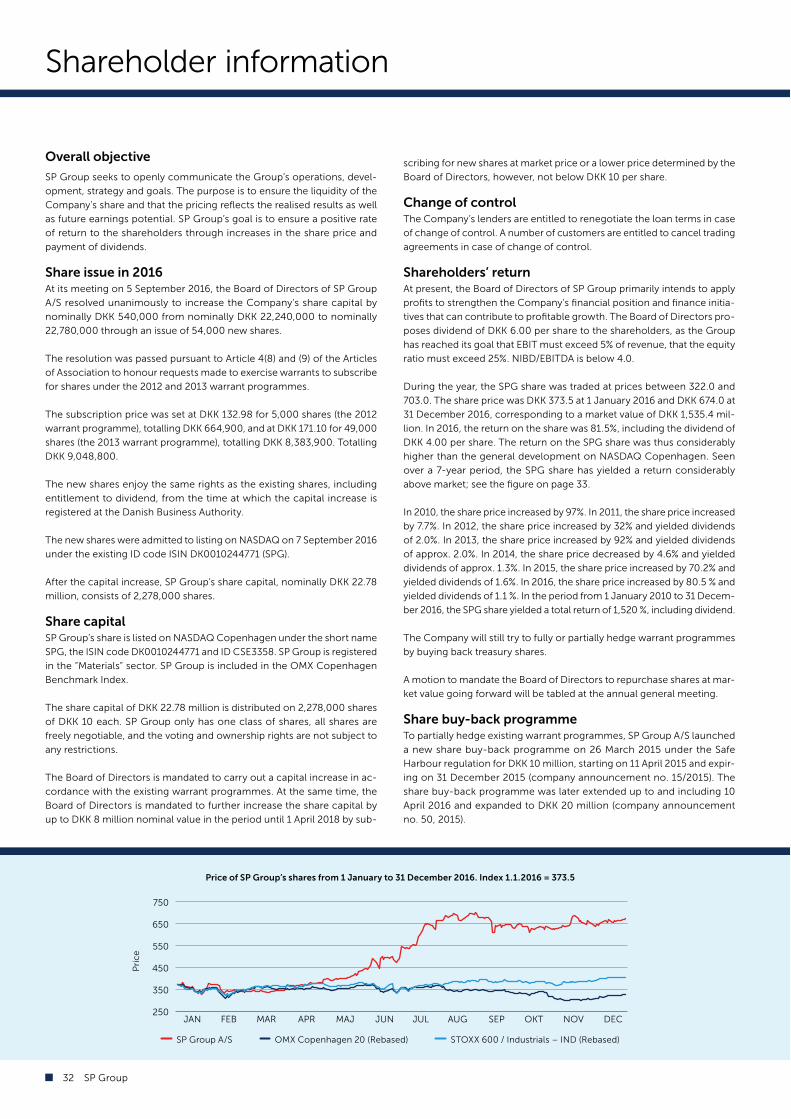
250
350
450
550
650
750
JAN FEB MAR APR MAJ JUN JUL AUG SEP OKT NOV DEC
Shareholder information
Overall objective
SP Group seeks to openly communicate the Group’s operations, devel-
opment, strategy and goals. The purpose is to ensure the liquidity of the
Company’s share and that the pricing reflects the realised results as well
as future earnings potential. SP Group’s goal is to ensure a positive rate
of return to the shareholders through increases in the share price and
payment of dividends.
Share issue in 2016At its meeting on 5 September 2016, the Board of Directors of SP Group
A/S resolved unanimously to increase the Company’s share capital by
nominally DKK 540,000 from nominally DKK 22,240,000 to nominally
22,780,000 through an issue of 54,000 new shares.
The resolution was passed pursuant to Article 4(8) and (9) of the Articles
of Association to honour requests made to exercise warrants to subscribe
for shares under the 2012 and 2013 warrant programmes.
The subscription price was set at DKK 132.98 for 5,000 shares (the 2012
warrant programme), totalling DKK 664,900, and at DKK 171.10 for 49,000
shares (the 2013 warrant programme), totalling DKK 8,383,900. Totalling
DKK 9,048,800.
The new shares enjoy the same rights as the existing shares, including
entitlement to dividend, from the time at which the capital increase is
registered at the Danish Business Authority.
The new shares were admitted to listing on NASDAQ on 7 September 2016
under the existing ID code ISIN DK0010244771 (SPG).
After the capital increase, SP Group’s share capital, nominally DKK 22.78
million, consists of 2,278,000 shares.
Share capital SP Group’s share is listed on NASDAQ Copenhagen under the short name
SPG, the ISIN code DK0010244771 and ID CSE3358. SP Group is registered
in the “Materials” sector. SP Group is included in the OMX Copenhagen
Benchmark Index.
The share capital of DKK 22.78 million is distributed on 2,278,000 shares
of DKK 10 each. SP Group only has one class of shares, all shares are
freely negotiable, and the voting and ownership rights are not subject to
any restrictions.
The Board of Directors is mandated to carry out a capital increase in ac-
cordance with the existing warrant programmes. At the same time, the
Board of Directors is mandated to further increase the share capital by
up to DKK 8 million nominal value in the period until 1 April 2018 by sub-
scribing for new shares at market price or a lower price determined by the
Board of Directors, however, not below DKK 10 per share.
Change of controlThe Company’s lenders are entitled to renegotiate the loan terms in case
of change of control. A number of customers are entitled to cancel trading
agreements in case of change of control.
Shareholders’ return At present, the Board of Directors of SP Group primarily intends to apply
profits to strengthen the Company’s financial position and finance initia-
tives that can contribute to profitable growth. The Board of Directors pro-
poses dividend of DKK 6.00 per share to the shareholders, as the Group
has reached its goal that EBIT must exceed 5% of revenue, that the equity
ratio must exceed 25%. NIBD/EBITDA is below 4.0.
During the year, the SPG share was traded at prices between 322.0 and
703.0. The share price was DKK 373.5 at 1 January 2016 and DKK 674.0 at
31 December 2016, corresponding to a market value of DKK 1,535.4 mil-
lion. In 2016, the return on the share was 81.5%, including the dividend of
DKK 4.00 per share. The return on the SPG share was thus considerably
higher than the general development on NASDAQ Copenhagen. Seen
over a 7-year period, the SPG share has yielded a return considerably
above market; see the figure on page 33.
In 2010, the share price increased by 97%. In 2011, the share price increased
by 7.7%. In 2012, the share price increased by 32% and yielded dividends
of 2.0%. In 2013, the share price increased by 92% and yielded dividends
of approx. 2.0%. In 2014, the share price decreased by 4.6% and yielded
dividends of approx. 1.3%. In 2015, the share price increased by 70.2% and
yielded dividends of 1.6%. In 2016, the share price increased by 80.5 % and
yielded dividends of 1.1 %. In the period from 1 January 2010 to 31 Decem-
ber 2016, the SPG share yielded a total return of 1,520 %, including dividend.
The Company will still try to fully or partially hedge warrant programmes
by buying back treasury shares.
A motion to mandate the Board of Directors to repurchase shares at mar-
ket value going forward will be tabled at the annual general meeting.
Share buy-back programmeTo partially hedge existing warrant programmes, SP Group A/S launched
a new share buy-back programme on 26 March 2015 under the Safe
Harbour regulation for DKK 10 million, starting on 11 April 2015 and expir-
ing on 31 December 2015 (company announcement no. 15/2015). The
share buy-back programme was later extended up to and including 10
April 2016 and expanded to DKK 20 million (company announcement
no. 50, 2015).
SP Group A/S OMX Copenhagen 20 (Rebased) STOXX 600 / Industrials – IND (Rebased)
Price of SP Group’s shares from 1 January to 31 December 2016. Index 1.1.2016 = 373.5
Pri
ce
32 SP Group
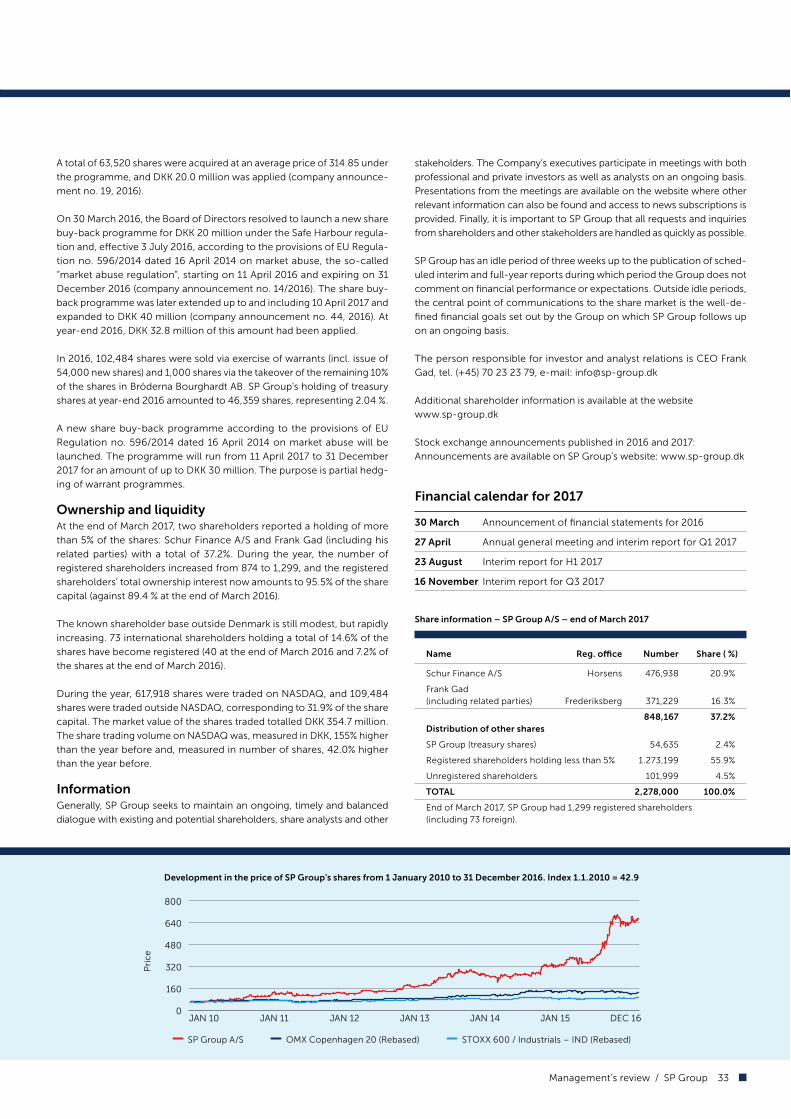
0
160
320
480
640
800
JAN 10 JAN 11 JAN 12 JAN 13 JAN 15JAN 14 DEC 16
A total of 63,520 shares were acquired at an average price of 314.85 under
the programme, and DKK 20.0 million was applied (company announce-
ment no. 19, 2016).
On 30 March 2016, the Board of Directors resolved to launch a new share
buy-back programme for DKK 20 million under the Safe Harbour regula-
tion and, e;ective 3 July 2016, according to the provisions of EU Regula-
tion no. 596/2014 dated 16 April 2014 on market abuse, the so-called
“market abuse regulation”, starting on 11 April 2016 and expiring on 31
December 2016 (company announcement no. 14/2016). The share buy-
back programme was later extended up to and including 10 April 2017 and
expanded to DKK 40 million (company announcement no. 44, 2016). At
year-end 2016, DKK 32.8 million of this amount had been applied.
In 2016, 102,484 shares were sold via exercise of warrants (incl. issue of
54,000 new shares) and 1,000 shares via the takeover of the remaining 10%
of the shares in Bröderna Bourghardt AB. SP Group’s holding of treasury
shares at year-end 2016 amounted to 46,359 shares, representing 2.04 %.
A new share buy-back programme according to the provisions of EU
Regulation no. 596/2014 dated 16 April 2014 on market abuse will be
launched. The programme will run from 11 April 2017 to 31 December
2017 for an amount of up to DKK 30 million. The purpose is partial hedg-
ing of warrant programmes.
Ownership and liquidityAt the end of March 2017, two shareholders reported a holding of more
than 5% of the shares: Schur Finance A/S and Frank Gad (including his
related parties) with a total of 37.2%. During the year, the number of
registered shareholders increased from 874 to 1,299, and the registered
shareholders’ total ownership interest now amounts to 95.5% of the share
capital (against 89.4 % at the end of March 2016).
The known shareholder base outside Denmark is still modest, but rapidly
increasing. 73 international shareholders holding a total of 14.6% of the
shares have become registered (40 at the end of March 2016 and 7.2% of
the shares at the end of March 2016).
During the year, 617,918 shares were traded on NASDAQ, and 109,484
shares were traded outside NASDAQ, corresponding to 31.9% of the share
capital. The market value of the shares traded totalled DKK 354.7 million.
The share trading volume on NASDAQ was, measured in DKK, 155% higher
than the year before and, measured in number of shares, 42.0% higher
than the year before.
InformationGenerally, SP Group seeks to maintain an ongoing, timely and balanced
dialogue with existing and potential shareholders, share analysts and other
Financial calendar for 2017
30 March Announcement of financial statements for 2016
27 April Annual general meeting and interim report for Q1 2017
23 August Interim report for H1 2017
16 November Interim report for Q3 2017
Share information – SP Group A/S – end of March 2017
Name Reg. o$ce Number Share ( %)
Schur Finance A/S Horsens 476,938 20.9%
Frank Gad
(including related parties) Frederiksberg 371,229 16.3%
848,167 37.2%
Distribution of other shares
SP Group (treasury shares) 54,635 2.4%
Registered shareholders holding less than 5% 1.273,199 55.9%
Unregistered shareholders 101,999 4.5%
TOTAL 2,278,000 100.0%
End of March 2017, SP Group had 1,299 registered shareholders
(including 73 foreign).
SP Group A/S OMX Copenhagen 20 (Rebased) STOXX 600 / Industrials – IND (Rebased)
Development in the price of SP Group’s shares from 1 January 2010 to 31 December 2016. Index 1.1.2010 = 42.9
Pri
ce
stakeholders. The Company’s executives participate in meetings with both
professional and private investors as well as analysts on an ongoing basis.
Presentations from the meetings are available on the website where other
relevant information can also be found and access to news subscriptions is
provided. Finally, it is important to SP Group that all requests and inquiries
from shareholders and other stakeholders are handled as quickly as possible.
SP Group has an idle period of three weeks up to the publication of sched-
uled interim and full-year reports during which period the Group does not
comment on financial performance or expectations. Outside idle periods,
the central point of communications to the share market is the well-de-
fined financial goals set out by the Group on which SP Group follows up
on an ongoing basis.
The person responsible for investor and analyst relations is CEO Frank
Gad, tel. (+45) 70 23 23 79, e-mail: [email protected]
Additional shareholder information is available at the website
www.sp-group.dk
Stock exchange announcements published in 2016 and 2017:
Announcements are available on SP Group’s website: www.sp-group.dk
Management’s review / SP Group 33

Quality control
At the end of 2016, all the Group’s production sites in Denmark, Latvia,
Poland, Slovakia, Sweden and China were ISO 9001-certified.
ISO ISO ISO
Site 9001 14001 18000 Others
Gibo
– Denmark x x x TS 16949 planned
– Poland x x x DIN 6701
Plexx Opido
– Sweden x x
SP Moulding
– Juelsminde x x
– Stoholm x x TS 16949
– Poland x x ISO 26000 planned
– China x x x
SP Medical
– Karise x x ISO 13485
– Poland x x ISO 13485
Brdr. Bourghardt
– Latvia x x
Tinby
– Denmark x x x
– Poland x x x
– China x x
Accoat
– Stoholm x x
– Kvistgaard x x
– Brazil Customer audit
Ulstrup Plast
– Lynge x
– Slovakia x
MedicoPack
- Denmark x ISO 13485,
ISO 50001 and
ISO 15378
R & D
Things are moving fast, really fast, also when it comes to development of
plastics and plastics technologies. Demand for environmentally friendly
plastics solutions is growing in line with the continual improvement of
the qualities of plastics. It is a long time ago plastics were chosen just
because the material was cheap. Today, plastics are more often chosen
due to the unique qualities of this material. A good example is the wind
turbine industry, which uses composites, a combination of plastics and
other materials.
At SP Group, we optimise our production technologies, aiming at staying
competitive on a global scale based on high-volume production. Our R
& D department takes part in this trend, but our focus is on composites.
Together with our customers, universities and producers of raw materi-
als, we constantly strive at pushing the boundaries and creating value for
everybody. In our work with composites, three important factors need
to be optimised:
1. The adhesion between the individual components: By joining forces
with a university and another business enterprise, we have developed
a “nanoglue”, which is presently being tested by our customers. We
have filed patent applications in respect of this technology in several
countries.
2. Choice of components: We participate in two projects where graphene
is used as filling material. A new non-stick, antistatic coating based on
graphene has been developed and sold. Activated graphene may be
used as a reactive component in PUR and considerably improve the
mechanical qualities of PUR. At present, we are testing this solution in
cooperation with a university.
3. Manufacturing technologies: Additive Manufacturing (AM), or so-
called “layer upon layer” manufacturing, also known as 3D print, has
so far mostly been used for manufacturing of prototypes. Demand for
large items is on the increase, and so is demand for tailored solutions.
3D print makes it possible, at low start-up costs, to manufacture items
for moulds, and allowance may be made for individual solutions using
robot programming. A PUR graphene composite will be an obvious
choice of material.
It is very positive for SP Group that EUDP has approved a grant for a
3-year AM project in which we are participating. In the second phase of
the project, a 3D printer will be installed at Gibo in Skjern for purposes
of manufacturing items with dimensions spanning several metres. The
project will a;ord SP Group a unique possibility of being at the cutting
edge, globally, in the area of 3D print of large industrial items.
Robot working at the factory in Juelsminde. Gibo Plast in Poland has installed a new vacuum-forming machine.
34 SP Group

Corporate social responsibility
Corporate social responsibility
It is important SP Group that we can increase the Group’s earnings and
growth in a responsible manner. With our presence in USA, Asia and sev-
eral countries in Europe, our production and activities a;ect both people
and the environment in various types of society.
We are proud that the Group can contribute financially to the communi-
ties of which we are part by being innovative and creating workplaces.
However, acknowledging that our products increase the consumption of
plastics, we actively assume responsibility for developing our production
in a manner that increasingly reduces any adverse impact on the environ-
ment and contributes to a sustainable development.
SP Group’s overall CSR and sustainability e;orts are in line with the 10
principles under the UN Global Compact regarding the environment,
human rights, employee rights and anti-corruption. SP Group’s largest
subsidiary, SP Moulding A/S, adhered to Global Compact in 2012 and is
making a systematic e;ort to comply with the 10 principles.
To ensure that we fulfil our responsibility ambition, we have adopted a
CSR policy, which reflects SP Group’s fundamental value proposition:
to come up with optimum plastic solutions to the benefit of both our
customers and society at large. In that way, the CSR policy constitutes a
framework for all our activities and our profile as a responsible place to
work and a responsible business partner.
Also, we have adopted a Supplier Code of Conduct, which is the basis
for positive cooperation with our suppliers with a view to promoting re-
sponsibility and sustainability in the supplier chain.
Below, we give an account of SP Group’s many e;orts and results in 2016.
For every area, we have also set targets for the coming year.
Environment and climate
In SP Group, we are systematically striving to reduce our impact on the
environment and promote a higher level of environmental responsibility.
In doing so, we make use of environmentally friendly technologies and
materials and a certified environmental management system.
SP Group continually focuses on reducing the e;ects of the Group’s
activities on the climate by reducing the water, electricity and heating
consumption, thus reducing CO2 emissions and optimising energy con-
sumption.
Our target is to contribute to environmental sustainability through our
customers’ use of SP Group’s products. Thus, more than 26% of our rev-
enue stems from the cleantech industry, which uses our products to:
• reduce energy consumption
• produce renewable energy
• purify smoke from coal-fired power plants and petrochemical plants.
Risk
SP Group’s primary environmental risk is associated with consumption of
resources and waste from production.
The production plants are subject to a number of environmental re-
quirements in all countries, and further, a number of environmental and
quality assurance systems have been implemented by the plants on a
voluntary basis.
SP Group believes the Group complies with all current environmental
regulations and that no enforcement orders remain unsolved anywhere
in production.
In spite of extensive safety procedures, the general as well as the working
environment may be a;ected in case of accident.
Reduction of energy, electricity and water
The most considerable impact on the environment occurs when the SP
Group entities consume energy, particularly power, during production.
To SP Group, it therefore makes sense to reduce the consumption of
energy, electricity and water.
By continuing to investing in energy-saving equipment and closely moni-
toring developments in key consumption indicators at all our plants, we
make sure that we can control and reduce the consumption of resources
as well as costs on an ongoing basis. By implementing resource-reducing
measures, the individual plants contribute to both cost reduction and a
positive, external environmental impact in their local community. These
measures led to a reduction in the consumption of resources in 2016.
Even through SP Group’s direct CO2 emissions are modest, we seek also
here to further the positive environmental impact by purchasing a signifi-
cant portion of the power we use in Denmark from plants which produce
renewable energy, primarily from wind turbines.
Distribution of employees by geographical area in 2016 (average) Distribution of employees by geographical area in 2015 (average)
Denmark
Sweden
Germany
Latvia
Poland
Slovakia
The Netherlands
China
Americas
Denmark
Sweden
Germany
Latvia
Poland
Slovakia
The Netherlands
China
Americas15 10
2 2658
612
126112
11 1239 34
574
529
23 26
111 115
Management’s review / SP Group 35

0
300
600
900
1200
1500
Plast Belægning Øvrige20
30
40
50
60
70
2012 2013 2014 2015 2016
2012 2013 2014 2015 2016
Less waste, more reuse
The increase in the price of raw materials and waste disposal expenses
has made SP Group increase focus on reducing the consumption of raw
materials and the waste percentage. Consequently, all plants now focus
on producing less waste and increasing reuse of plastic materials.
At SP Moulding’s and Ulstrup Plast’s factories, this is done by using de-
central grinders on all machines to ensure that remaining material from
the production of each component is grinded immediately and led down
a closed system together with the plastic material for the next compo-
nent. Gibo Plast and SP Medical use central grinders to ensure reuse of
surplus material in other product components. Also Tinby and Ergomat
have enhanced process e&ciency so that the rate of use has increased
and the amount of waste has gone down.
Since 2013, SP Group has been working on developing a product that
replaces wood from rain forests by plastics from sorted household waste
(Plastic Wood Compound).
The recycled plastics can be used for selected product types, thus con-
tributing to a distinctive reduction of the environmental impact – both in
the production phase and in connection with the customer’s subsequent
use and disposal of the product.
Environmentally friendly technologies
By using environmentally friendly technologies, SP Group seeks to show
that plastics – when produced and used with care – is an environmentally
better choice.
In environmental life cycle analyses, plastics generally rank higher than
most alternative materials, being for instance more light and flexible than
metal. When, for instance, plastic is used instead of metal on the exterior
parts of rolling stock such as agricultural machinery, tractors, combine
harvesters, buses and cars, the product life is prolonged. In addition, the
capacity of transport equipment is increased, reducing fuel consumption.
Thanks to its insulating properties, polyurethane can contribute to reduc-
ing waste of heat and ensuring e&cient ventilating systems. In addition,
environmental e;ects can be obtained by using fluoroplastics coatings as
corrosion protection, e.g. in flue gas purifying plants at coal-fired power
plants to avoid acid rainwater. Other coatings of surfaces with fluoroplas-
tics can generate considerable savings on cleaning materials and solvents
as well as water.
Environmental management system
It is SP Group’s strategy that all production entities must implement a
certifiable environmental management system that ensures:
• use of environment-friendly products in the production and develop-
ment processes
• minimisation of waste and refuse as well as resource consumption
• reuse, to the widest extent possible, of materials and products
• a satisfactory working environment where safety and environmental
impacts are prioritised.
Human rights
CSR policy
We wish to support and respect the protection of human rights interna-
tionally. In countries where there is a risk of human rights abuse, we will
strive to prevent any human rights abuse and take remedial action should
we encounter such abuse.
As SP Group wants to contribute to the protection of human rights in the
countries in which we operate, we attempt to promote measures that
have a positive impact on human rights and seek to mitigate any adverse
impact on human rights in our value chain and at our sub-suppliers.
Our e;orts are based on international human rights conventions and, in
the EU, also on the fundamental rights laid down in the EU Treaty.
Risk
SP Group is aware of the current and potential risks which our production,
activities and business partners may cause in relation to human rights.
Outcome
In 2016, SP Group was not involved in or experienced human rights abuse
in the Group or at sub-suppliers.
Privacy
SP Group makes sure that personal data regarding our employees and
customers are treated in a way which meets the statutory requirements
in relation to privacy and personal data protection. For instance, we have
taken security measures to protect personal data from being misused,
leaked or destroyed.
Discrimination
SP Group makes an active e;ort to discourage discrimination, both inter-
nally in relation to our employees and externally in our supplier chain. In
this connection, we also focus on equal treatment and equal opportuni-
ties for everyone.
Trade payables
Our suppliers are obliged to comply with a Supplier Code according to
which they must, among other things, promote the protection of hu-
man rights.
Distribution of employees (average) 2012-2016 Distribution of employees abroad (average) 2012-2016
Employees abroad – %
36 SP Group

To ensure that this requirement is met, we cooperate and enter into a
dialogue with our suppliers on a current basis, while at the same time
monitoring that they assume responsibility in this area. If some supplier
does not meet the requirements of our Supplier Code of Conduct, we
can forthwith terminate our agreement with the supplier.
Human resource issues
CSR policy
We acknowledge our employees’ rights in respect of freedom of associa-
tion and collective bargaining.
We want to ensure that our employees enjoy good conditions of em-
ployment in a secure and healthy working environment. We will strive
to ensure that our employees are o;ered development opportunities at
work, e.g. through continuing education and training.
We strongly disapprove forced labour and child labour. If we engage
youth workers aged 15-18, they are not allowed to perform dangerous
work or night work.
We respect di;erences in cultures and traditions and will not discriminate
against anyone at the workplace because of his or her age, sex, race,
complexion, religion or faith, national or social origin, union membership
or any other cause of discrimination.
Aiming at running all SP Group entities as sound entities and attractive
places of work, we make targeted e;orts to ensure basic employee rights
and a safe, respectful and stimulating working day for each individual
employee.
We base our e;orts on national and international rules and rights for
employees and, locally, take the measures that are needed to put the
requirements into practice.
Risk
SP Group is investigating on an ongoing basis if, in our production or via
sub-suppliers, we have a current or potential risk of becoming involved
in child labour or forced labour.
To minimise such risk, we do not employ minors in the Group. Any kind
of discrimination in working and employment conditions is prohibited
we well.
Outcome
In 2016, SP Group was not involved in or experienced any adverse impact
on employee rights in the Group or at sub-suppliers.
Sta< composition
On average, SP Group’s sta; outside Denmark increased by approx. 6.7%
to 985 employees in 2016. The number of employees in Denmark in-
creased from 529 to 574.
Globally, SP Group’s sta; increased from 1,498 at the beginning of the
year to 1,696 at year-end. On average, SP Group had 1,559 employees
in 2016. At year-end, 36.7% of the sta; was employed in Denmark, and
63.3% was employed outside Denmark.
The year saw a shift of approx. 0.7 percentage points as part of the in-
creased internationalisation of the business and the acquisition of Medi-
coPack with 80 Danish employees. Going forward, growth is expected
to be generated primarily in Eastern Europe, Asia and USA.
Diversity
The long-term goal is for SP Group to reflect society at large and, in par-
ticular, our customers, both in terms of gender, nationality and ethnic-
ity. This reflection of society is to contribute positively to the Company
being perceived as an attractive place of work for both customers and
current and future employees. In order for the Group to be able to fulfil
DuraStripe® from Ergomat.
Elżbieta Magdziarz and Justyna Sobieraj at SP Medical’s factory in Poland.
SP Medical, Poland, celebrated its 10th anniversary in 2016.
Management’s review / SP Group 37
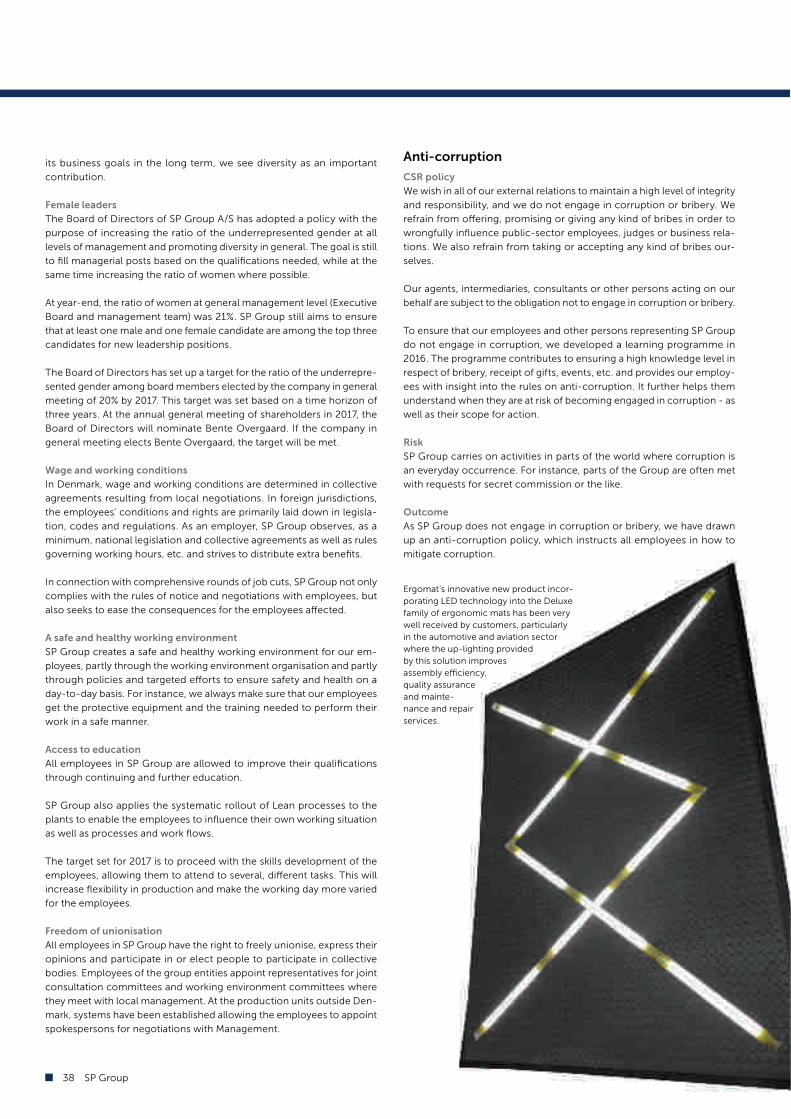
its business goals in the long term, we see diversity as an important
contribution.
Female leaders
The Board of Directors of SP Group A/S has adopted a policy with the
purpose of increasing the ratio of the underrepresented gender at all
levels of management and promoting diversity in general. The goal is still
to fill managerial posts based on the qualifications needed, while at the
same time increasing the ratio of women where possible.
At year-end, the ratio of women at general management level (Executive
Board and management team) was 21%. SP Group still aims to ensure
that at least one male and one female candidate are among the top three
candidates for new leadership positions.
The Board of Directors has set up a target for the ratio of the underrepre-
sented gender among board members elected by the company in general
meeting of 20% by 2017. This target was set based on a time horizon of
three years. At the annual general meeting of shareholders in 2017, the
Board of Directors will nominate Bente Overgaard. If the company in
general meeting elects Bente Overgaard, the target will be met.
Wage and working conditions
In Denmark, wage and working conditions are determined in collective
agreements resulting from local negotiations. In foreign jurisdictions,
the employees’ conditions and rights are primarily laid down in legisla-
tion, codes and regulations. As an employer, SP Group observes, as a
minimum, national legislation and collective agreements as well as rules
governing working hours, etc. and strives to distribute extra benefits.
In connection with comprehensive rounds of job cuts, SP Group not only
complies with the rules of notice and negotiations with employees, but
also seeks to ease the consequences for the employees a;ected.
A safe and healthy working environment
SP Group creates a safe and healthy working environment for our em-
ployees, partly through the working environment organisation and partly
through policies and targeted e;orts to ensure safety and health on a
day-to-day basis. For instance, we always make sure that our employees
get the protective equipment and the training needed to perform their
work in a safe manner.
Access to education
All employees in SP Group are allowed to improve their qualifications
through continuing and further education.
SP Group also applies the systematic rollout of Lean processes to the
plants to enable the employees to influence their own working situation
as well as processes and work flows.
The target set for 2017 is to proceed with the skills development of the
employees, allowing them to attend to several, di;erent tasks. This will
increase flexibility in production and make the working day more varied
for the employees.
Freedom of unionisation
All employees in SP Group have the right to freely unionise, express their
opinions and participate in or elect people to participate in collective
bodies. Employees of the group entities appoint representatives for joint
consultation committees and working environment committees where
they meet with local management. At the production units outside Den-
mark, systems have been established allowing the employees to appoint
spokespersons for negotiations with Management.
Anti-corruption
CSR policy
We wish in all of our external relations to maintain a high level of integrity
and responsibility, and we do not engage in corruption or bribery. We
refrain from o;ering, promising or giving any kind of bribes in order to
wrongfully influence public-sector employees, judges or business rela-
tions. We also refrain from taking or accepting any kind of bribes our-
selves.
Our agents, intermediaries, consultants or other persons acting on our
behalf are subject to the obligation not to engage in corruption or bribery.
To ensure that our employees and other persons representing SP Group
do not engage in corruption, we developed a learning programme in
2016. The programme contributes to ensuring a high knowledge level in
respect of bribery, receipt of gifts, events, etc. and provides our employ-
ees with insight into the rules on anti-corruption. It further helps them
understand when they are at risk of becoming engaged in corruption - as
well as their scope for action.
Risk
SP Group carries on activities in parts of the world where corruption is
an everyday occurrence. For instance, parts of the Group are often met
with requests for secret commission or the like.
Outcome
As SP Group does not engage in corruption or bribery, we have drawn
up an anti-corruption policy, which instructs all employees in how to
mitigate corruption.
Ergomat’s innovative new product incor-
porating LED technology into the Deluxe
family of ergonomic mats has been very
well received by customers, particularly
in the automotive and aviation sector
where the up-lighting provided
by this solution improves
assembly e&ciency,
quality assurance
and mainte-
nance and repair
services.
38 SP Group

Søndersø, 30 March 2017
Executive Board
Frank Gad Jørgen Hønnerup Nielsen
CEO CFO
Board of Directors
Niels K. Agner Erik Preben Holm
Chairman Deputy Chairman
Erik Christensen Hans Wilhelm Schur Hans-Henrik Eriksen
Statement by Management on the annual report
The Board of Directors and the Executive Board have today discussed and
approved the annual report for SP Group A/S for 2016.
The annual report has been prepared in accordance with International
Financial Reporting Standards as adopted by the EU and additional re-
quirements of the Danish Financial Statements Act.
It is our opinion that the consolidated financial statements and the parent
company financial statements give a true and fair view of the financial
position of the Group and the Company at 31 December 2016 and of the
results of the Group’s and the Company’s operations and cash flows for
the financial year 1 January – 31 December 2016.
In our opinion, the Management’s review includes a fair review of the
development in the Group’s and the Company’s activities and financial
circumstances, results of operations, cash flows and financial position
as well as a description of material risks and uncertainties that the Group
and the Company face.
We recommend that the annual report be approved at the annual general
meeting.
Management’s review / SP Group 39

Independent auditor’s report
To the shareholders of SP Group A/S
Opinion
We have audited the consolidated financial statements and the parent
company financial statements of SP Group A/S for the financial year 1
January – 31 December 2016, which comprise an income statement, bal-
ance sheet, statement of changes in equity, cash flow statement and notes,
including accounting policies, for the Group as well as the Company. The
consolidated financial statements and the parent company financial state-
ments are prepared in accordance with International Financial Reporting
Standards as adopted by the EU and additional requirements of the Danish
Financial Statements Act. In our opinion, the consolidated financial state-
ments and the parent company financial statements give a true and fair
view of the Group’s and the Company’s financial position at 31 December
2016 and of the results of the Group’s and the Company’s operations and
cash flows for the financial year 1 January – 31 December 2016 in accord-
ance with International Financial Reporting Standards as adopted by the
EU and additional requirements of the Danish Financial Statements Act.
Basis for opinion
We conducted our audit in accordance with International Standards on
Auditing (ISAs) and additional requirements applicable in Denmark. Our
responsibilities under those standards and requirements are further de-
scribed in the “Auditor’s responsibilities for the audit of the consolidated
financial statements and the parent company financial statements” section
of our report. As required by the International Ethics Standards Board for
Accountants’ Code of Ethics for Professional Accountants (IESBA Code)
and additional requirements applicable in Denmark, we are independent of
the Group, and we have fulfilled our other ethical responsibilities in accord-
ance with these requirements. We believe that the audit evidence we have
obtained is su&cient and appropriate to provide a basis for our opinion.
Key audit matters
Key audit matters are those matters that, in our professional judgement,
were of most significance in our audit of the consolidated financial state-
ments and the parent company financial statements for the financial year
ended 31 December 2016. These matters were addressed in the context of
our audit of the consolidated financial statements and the parent company
financial statements as a whole, and in forming our opinion thereon. We do
not provide a separate opinion on these matters. For each matter below, our
description of how our audit addressed the matter is provided in that context.
We have fulfilled our responsibilities described in the “Auditor’s responsi-
bilities for the audit of the consolidated financial statements and the par-
ent company financial statements” section, including in relation to these
matters. Accordingly, our audit included the performance of procedures
designed to respond to our assessment of the risks of material misstate-
ment of the consolidated financial statements and the parent company
financial statements. The results of our audit procedures, including the
procedures performed to address the matters below, provide the basis
for our audit opinion on the accompanying consolidated financial state-
ments and parent company financial statements as a whole.
Valuation of goodwill
The Group has recognised goodwill at a total amount of DKK 142,307
thousand in the balance sheet at 31 December 2016. The useful life of
goodwill is indefinite, and according to International Financial Reporting
Standards as adopted by the EU (IAS 36), goodwill must be tested for
impairment at least annually. There was no evidence of impairment of
goodwill in the financial year. The annual impairment test is key to our
audit, as it includes Management’s assumptions and estimates relating to,
for instance, future earnings.
Additional information about the goodwill recognised in the year appears
from note 14 to the consolidated financial statements.
In connection with our audit, we tested the impairment test prepared by
Management, which was performed in accordance with the discounted
cash flow model, and assessed whether the assumptions made by Man-
agement are substantiated. We assessed whether the calculation model
is relevant and assessed the discount factor level and growth rate applied
for extrapolation. The expected net cash flows are based on budgets for
the years 2017-2019 and a terminal value. We examined procedures for
the budget preparation and compared budgets with the Group’s strategic
e;orts in the individual areas. Further, we examined if the information dis-
closed in note 14 is adequate relative to applicable accounting standards.
Valuation of inventories
At 31 December 2016, the Group recognised inventories totalling DKK
282,572 thousand under “Assets”. Inventories are measured at the lower
of cost and the net realisable value. As the valuation of inventories in-
volves significant estimates and assessments on the part of Management,
the area is a key audit matter.
During our audit, we examined the Group’s business procedures for
the area, including calculations of cost. We obtained and reviewed the
Group’s analyses of age distribution and write-downs of obsolete in-
ventories and assessed if any sales of goods have produced a negative
contribution margin.
Statement on the Management’s review
Management is responsible for the Management’s review.
Our opinion on the consolidated financial statements and the parent
company financial statements does not cover the Management’s review,
and we do not express any form of assurance conclusion thereon.
In connection with our audit of the consolidated financial statements and
the parent company financial statements, our responsibility is to read the
Management’s review and, in doing so, consider whether the Manage-
ment’s review is materially inconsistent with the consolidated financial
statements or the parent company financial statements, or our knowledge
obtained during the audit, or otherwise appears to be materially misstated.
Moreover, it is our responsibility to consider whether the Management’s
review provides the information required under the Danish Financial
Statements Act.
Based on our procedures, we conclude that the Management’s review is
in accordance with the consolidated financial statements and the par-
ent company financial statements and has been prepared in accordance
with the requirements of the Danish Financial Statements Act. We did not
identify any material misstatement of the Management’s review.
Management’s responsibilities for the consolidated
financial statements and the parent company
financial statements
Management is responsible for the preparation of consolidated financial
statements and parent company financial statements that give a true and
fair view in accordance with International Financial Reporting Standards
40 SP Group
as adopted by the EU and additional requirements of the Danish Financial
Statements Act and for such internal control as Management determines
is necessary to enable the preparation of consolidated financial state-
ments and parent company financial statements that are free from mate-
rial misstatement, whether due to fraud or error.
In preparing the consolidated financial statements and the parent com-
pany financial statements, Management is responsible for assessing the
Group’s and the Company’s ability to continue as a going concern, dis-
closing, as applicable, matters related to going concern and using the
going concern basis of accounting in preparing the consolidated financial
statements and the parent company financial statements unless Manage-
ment either intends to liquidate the Group or the Company or to cease
operations, or has no realistic alternative but to do so.
Auditor’s responsibilities for the audit of the
consolidated financial statements and the
parent company financial statements
Our responsibility is to obtain reasonable assurance as to whether the
consolidated financial statements and the parent company financial
statements are free from material misstatement, whether due to fraud
or error, and to issue an auditor’s report that includes our opinion. Rea-
sonable assurance is a high level of assurance, but is not a guarantee that
an audit conducted in accordance with ISAs and additional requirements
applicable in Denmark will always detect a material misstatement when it
exists. Misstatements can arise from fraud or error and can be considered
material if it would be reasonable to expect that these – either individually
or collectively – could influence the economic decisions taken by the
users of financial statements on the basis of these consolidated financial
statements and parent company financial statements.
As part of an audit conducted in accordance with ISAs and additional
requirements applicable in Denmark, we exercise professional judge-
ment and maintain an attitude of professional scepticism throughout the
audit. We also:
• Identify and assess the risk of material misstatements in the consolidat-
ed financial statements and the parent company financial statements,
whether due to fraud or error, design and perform audit procedures
responsive to those risks and obtain audit evidence that is su&cient and
appropriate to provide a basis for our opinion. The risk of not detect-
ing a material misstatement resulting from fraud is higher than for one
resulting from error, as fraud may involve collusion, forgery, intentional
omissions, misrepresentations or the override of internal control.
• Obtain an understanding of internal control relevant to the audit in
order to design audit procedures that are appropriate in the circum-
stances, but not for the purpose of expressing an opinion on the ef-
fectiveness of the Group’s and the Company’s internal control.
• Evaluate whether the accounting policies used are appropriate and
whether the accounting estimates and the related disclosures made
by Management are reasonable.
• Conclude on whether Management’s use of the going concern basis of
accounting in preparing the consolidated financial statements and the
parent company financial statements is appropriate and, based on the
audit evidence obtained, conclude on whether a material uncertainty
exists relating to events or conditions, which could cast significant doubt
on the Group’s and the Company’s ability to continue as a going con-
cern. If we conclude that a material uncertainty exists, we are required
to draw attention in our auditor’s report to the related disclosures in
the consolidated financial statements and the parent company financial
statements or, if such disclosures are inadequate, to modify our opinion.
Our conclusions are based on the audit evidence obtained up to the date
of our auditor’s report. However, future events or conditions may cause
the Group and the Company to cease to continue as a going concern.
• Evaluate the overall presentation, structure and contents of the con-
solidated financial statements and the parent company financial state-
ments, including note disclosures, and whether the consolidated finan-
cial statements and the parent company financial statements reflect
the underlying transactions and events in a manner that gives a true
and fair view.
• Obtain su&cient and appropriate audit evidence regarding the financial
information for the Group’s entities or business activities to express an
opinion on the consolidated financial statements. We are responsible
for the direction, supervision and performance of the group audit. We
remain solely responsible for our audit opinion.
We communicate with those charged with governance regarding, among
other matters, the planned scope and timing of the audit and significant
audit findings, including any significant deficiencies in internal control
which we identify during our audit.
We also provide a statement to those charged with governance to the
e;ect that we have complied with relevant ethical requirements related
to independence and disclose to them all relations and other matters
that could reasonably be expected to impact our independence and, if
relevant, related safeguards.
Based on the matters communicated to those charged with governance, we
determine which matters were of most importance in our audit of the finan-
cial statements for the current period and therefore are key audit matters.
We describe such matters in our auditor’s report unless law or other regu-
lations rule out the publication thereof or, in the very rare cases where we
determine that the matter should not be disclosed in our auditor’s report,
because the disadvantages of so doing could reasonably be expected to
outweigh the advantages of disclosing such matters to the general public.
Copenhagen, 30 March 2017
Ernst & Young
Godkendt Revisionspartnerselskab
CVR no. 30 70 02 28
Peter Gath Morten Schougaard Sørensen
State Authorised Public Accountant State Authorised Public Accountant
Management’s review / SP Group 41

Income statement for 2016
COMPANY GROUP
2015 2016 Note DKK’000 2016 2015
13,762 9,233 Revenue 1,519,044 1,319,768
0 0 3,6 Production costs -1,053,294 -916,859
13,762 9,233 Contribution margin 465,750 402,909
4,634 4,532 4 Other operating income 1,719 363
-10,374 -8,906 5 External expenses -98,430 -88,101
-11,335 -11,446 5,6,7 Sta; costs -166,182 -152,383
-3,313 -6,587 Profit/loss before depreciation, amortisation and impairment losses (EBITDA) 202,857 162,788
-3,209 -3,309 8 Depreciation, amortisation and impairment losses -69,442 -72,011
-6,522 -9,896 Profit/loss before net financials (EBIT) 133,415 90,777
26,231 29,779 9 Dividends from subsidiaries - -
16,985 1,539 10 Other financial income 1,741 3,681
-20,889 -9,059 11 Financial expenses -12,540 -13,803
15,805 12,363 Profit before tax 122,616 80,655
356 2,988 12 Tax for the year -29,229 -19,543
16,161 15,351 Profit for the year 93,387 61,112
Attributable to:
The Company’s shareholders 92,420 60,584
Non-controlling interests 967 528
93,387 61,112
Earnings per share (EPS)
13 Earnings per share (DKK) 41.87 28.98
13 Earnings per share, diluted (DKK) 40.33 28.00
Recommended profit appropriation
8,896 13,668 Dividends
7,265 1,683 Retained earnings
16,161 15,351
42 SP Group

Statement of comprehensive income 2016
COMPANY GROUP
2015 2016 Note DKK’000 2016 2015
16,161 15,351 Profit for the year 93,387 61,112
Other comprehensive income:
Items which may be reclassified to the income statement:
0 0 Exchange rate adjustments relating to foreign subsidiaries -4,922 5,593
Value adjustments of hedging instruments:
-435 -305 Value adjustments for the year -32,298 10,848
0 0 Value adjustments transferred to revenue 8,833 5,822
1,125 1,222 Value adjustments transferred to financial expenses 1,222 1,125
-185 -217 12 Income taxes of other comprehensive income 4,192 -3,442
505 700 Other comprehensive income -22,973 19,946
16,666 16,051 Total comprehensive income 70,414 81,058
Attributable to:
The Company’s shareholders 69,564 80,548
Non-controlling interests 850 510
70,414 81,058
Accounts / SP Group 43

Balance sheet at 31/12/2016
COMPANY GROUP
2015 2016 Note DKK’000 2016 2015
106 28 Software 6,582 9,173
0 0 Customer files 15,297 15,344
0 0 Goodwill 142,307 139,028
0 0 Completed development projects 6,526 9,331
0 0 Development projects in progress 3,594 2,848
106 28 14 Intangible assets 174,306 175,724
67,695 80,232 Land and buildings 147,261 128,830
0 0 Plant and machinery 270,837 273,593
595 382 Fixtures and fittings, tools and equipment 26,269 22,080
0 0 Leasehold improvements 11,947 11,574
0 0 Property, plant and equipment under construction 30,172 15,993
68,290 80,614 15 Property, plant and equipment 486,486 452,070
426,335 463,141 16 Investments in subsidiaries - -
3,000 0 Deposits 381 3,486
7,484 2,871 25 Deferred tax assets 7,963 3,792
436,819 466,012 Other non-current assets 8,344 7,278
505,215 546,654 Non-current assets 669,136 635,072
0 0 17 Inventories 282,572 243,534
25 119 18 Trade receivables 165,600 123,226
34,501 25,275 Receivables from subsidiaries - -
0 0 19 Construction contracts 9,758 3,639
0 10,585 Income taxes receivable 34 401
7,809 45 20 Other receivables 13,072 19,911
2,278 1,883 Prepayments 6,774 8,342
44,613 37,907 Receivables 195,238 155,519
2,735 7,843 21 Cash 53,725 43,763
47,348 45,750 Current assets 531,535 442,816
552,563 592,404 Assets 1,200,671 1,077,888
44 SP Group

COMPANY GROUP
2015 2016 Note DKK’000 2016 2015
22,240 22,780 22 Share capital 22,780 22,240
277 853 23 Other reserves -1,540 21,440
-7,799 -28,515 Reserve for treasury shares -28,515 -7,799
217,497 221,752 Retained earnings 421,243 346,321
8,896 13,668 Dividend proposed for the year 13,668 8,896
241,111 230,538 Equity attributable to the Company’s shareholders 427,636 391,098
- - Equity attributable to non-controlling interests 1,340 2,463
241,111 230,538 Equity 428,976 393,561
53,910 73,806 24 Bank debt 77,114 54,924
97,906 37,166 24 Financial institutions 73,973 142,511
0 0 24 Finance lease liabilities 27,324 45,970
16,567 28,990 24 Other non-current liabilities 28,990 16,567
0 0 25 Deferred tax liabilities 20,927 19,397
168,383 139,962 Non-current liabilities 228,328 279,369
29,717 42,050 24 Current portion of non-current liabilities 60,145 54,995
23,267 79,768 Bank debt 224,818 151,067
0 0 19 Construction contracts 6,239 2,389
0 0 Prepayments received from customers 0 1,357
107 615 26 Trade payables 148,624 122,121
77,648 93,416 Payables to subsidiaries - -
0 0 Income taxes payable 3,869 6,585
0 0 27 Provisions 8,756 0
12,330 6,055 28 Other payables 84,006 60,237
0 0 Deferred income 6,910 6,207
143,069 221,904 Current liabilities 543,367 404,958
311,452 361,866 Liabilities 771,695 684,327
552,563 592,404 Equity and liabilities 1,200,671 1,077,888
29-31 Collateral and contingent liabilities, etc.
34-44 Other notes
Accounts / SP Group 45

Statement of changes in equity for 2016
GROUP
Equity capital Equity
attributable capital
Reserve to the attributable
for Company’s to non-
Share Other treasury Retained Proposed share- controlling Total
DKK’000 capital reserves shares earnings dividends holders interests equity
Equity at 01/01/2015 20,240 1,722 -10,992 248,677 7,084 266,731 9,630 276,361
Profit for the year 0 0 0 51,688 8,896 60,584 528 61,112
Exchange rate adjustments relating to
foreign subsidiaries 0 5,611 0 0 0 5,611 -18 5,593
Value adjustment of financial instruments
held to hedge future cash flows 0 10,848 0 0 0 10,848 0 10,848
Portion relating to value adjustments
transferred to revenue 0 5,822 0 0 0 5,822 0 5,822
Portion relating to value adjustments
transferred to financial expenses 0 1,125 0 0 0 1,125 0 1,125
Tax on other comprehensive income 0 -3,442 0 0 0 -3,442 0 -3,442
Comprehensive income for the financial year 0 19,964 0 51,688 8,896 80,548 510 81,058
Share-based payment 0 240 0 0 0 240 0 240
Share-based payment,
exercised arrangements 0 -758 0 758 0 0 0 0
Sale of warrants 0 272 0 0 0 272 0 272
Acquisition of treasury shares 0 0 -18,235 0 0 -18,235 0 -18,235
Sale of treasury shares, warrant programme 0 0 21,428 -9,898 0 11,530 0 11,530
Tax on purchase/sale of treasury shares 0 0 0 1,629 0 1,629 0 1,629
Acquisition of shares from
non-controlling shareholders 0 0 0 106 0 106 -6,606 -6,500
Cash capital increase 2,000 0 0 53,335 0 55,335 0 55,335
Distribution of dividends 0 0 0 0 -7,058 -7,058 0 -7,058
Distribution of dividends, treasury shares 0 0 0 26 -26 0 0
Non-controlling interests’ share
of dividends in subsidiaries 0 0 0 0 0 0 -1,071 -1,071
Other changes in equity 2,000 -246 3,193 45,956 -7,084 43,819 -7,677 36,142
Equity at 31/12/2015 22,240 21,440 -7,799 346,321 8,896 391,098 2,463 393,561
Profit for the year 0 0 0 78,752 13,668 92,420 967 93,387
Exchange rate adjustments relating to
foreign subsidiaries 0 -4,805 0 0 0 -4,805 -117 -4,922
Value adjustment of financial instruments
held to hedge future cash flows 0 -32,298 0 0 0 -32,298 0 -32,298
Portion relating to value adjustments
transferred to revenue 0 8,833 0 0 0 8,833 0 8,833
Portion relating to value adjustments
transferred to financial expenses 0 1,222 0 0 0 1,222 0 1,222
Tax on other comprehensive income 4,192 0 0 0 4,192 0 4,192
Comprehensive income for the financial year 0 -22,856 0 78,752 13,668 69,564 850 70,414
Share-based payment 0 210 0 0 0 210 0 210
Share-based payment,
exercised arrangements 0 -603 0 603 0 0 0 0
Sale of warrants 0 269 0 0 0 269 0 269
Acquisition of treasury shares 0 0 -38,267 0 0 -38,267 0 -38,267
Sale of treasury shares, warrant programme 0 0 17,551 -9,152 0 8,399 0 8,399
Tax on purchase/sale of treasury shares 0 0 0 2,684 0 2,684 0 2,684
Acquisition of shares from
non-controlling shareholders 0 0 0 -6,402 0 -6,402 -1,241 -7,643
Cash capital increase 540 0 0 8,394 0 8,934 0 8,934
Distribution of dividends 0 0 0 0 -8,853 -8,853 0 -8,853
Distribution of dividends, treasury shares 0 0 0 43 -43 0 0 0
Non-controlling interests’ share
of dividends in subsidiaries 0 0 0 0 0 0 -732 -732
Other changes in equity 540 -124 -20,716 -3,830 -8,896 -33,026 -1,973 -34,999
Equity at 31/12/2016 22,780 -1,540 -28,515 421,243 13,668 427,636 1,340 428,976
46 SP Group
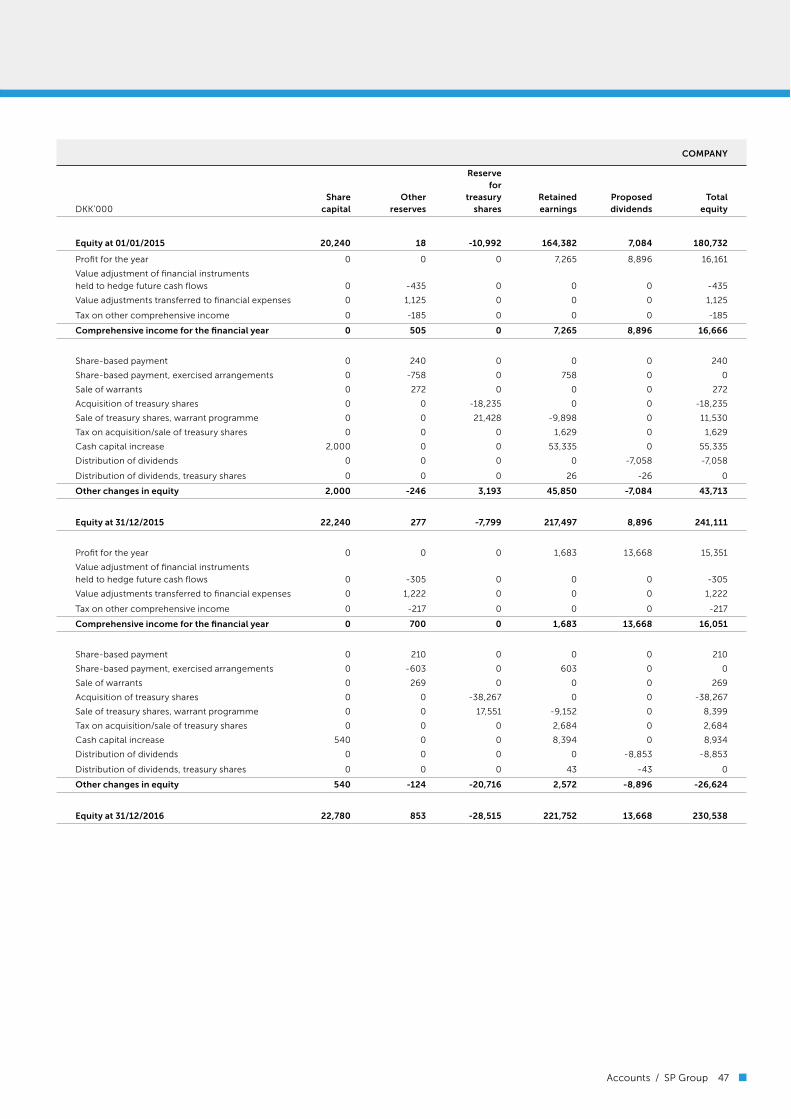
COMPANY
Reserve
for
Share Other treasury Retained Proposed Total
DKK’000 capital reserves shares earnings dividends equity
Equity at 01/01/2015 20,240 18 -10,992 164,382 7,084 180,732
Profit for the year 0 0 0 7,265 8,896 16,161
Value adjustment of financial instruments
held to hedge future cash flows 0 -435 0 0 0 -435
Value adjustments transferred to financial expenses 0 1,125 0 0 0 1,125
Tax on other comprehensive income 0 -185 0 0 0 -185
Comprehensive income for the financial year 0 505 0 7,265 8,896 16,666
Share-based payment 0 240 0 0 0 240
Share-based payment, exercised arrangements 0 -758 0 758 0 0
Sale of warrants 0 272 0 0 0 272
Acquisition of treasury shares 0 0 -18,235 0 0 -18,235
Sale of treasury shares, warrant programme 0 0 21,428 -9,898 0 11,530
Tax on acquisition/sale of treasury shares 0 0 0 1,629 0 1,629
Cash capital increase 2,000 0 0 53,335 0 55,335
Distribution of dividends 0 0 0 0 -7,058 -7,058
Distribution of dividends, treasury shares 0 0 0 26 -26 0
Other changes in equity 2,000 -246 3,193 45,850 -7,084 43,713
Equity at 31/12/2015 22,240 277 -7,799 217,497 8,896 241,111
Profit for the year 0 0 0 1,683 13,668 15,351
Value adjustment of financial instruments
held to hedge future cash flows 0 -305 0 0 0 -305
Value adjustments transferred to financial expenses 0 1,222 0 0 0 1,222
Tax on other comprehensive income 0 -217 0 0 0 -217
Comprehensive income for the financial year 0 700 0 1,683 13,668 16,051
Share-based payment 0 210 0 0 0 210
Share-based payment, exercised arrangements 0 -603 0 603 0 0
Sale of warrants 0 269 0 0 0 269
Acquisition of treasury shares 0 0 -38,267 0 0 -38,267
Sale of treasury shares, warrant programme 0 0 17,551 -9,152 0 8,399
Tax on acquisition/sale of treasury shares 0 0 0 2,684 0 2,684
Cash capital increase 540 0 0 8,394 0 8,934
Distribution of dividends 0 0 0 0 -8,853 -8,853
Distribution of dividends, treasury shares 0 0 0 43 -43 0
Other changes in equity 540 -124 -20,716 2,572 -8,896 -26,624
Equity at 31/12/2016 22,780 853 -28,515 221,752 13,668 230,538
Accounts / SP Group 47

Cash flow statement for 2016
COMPANY GROUP
2015 2016 Note DKK’000 2016 2015
-6,522 -9,896 Profit/loss before net financials (EBIT) 133,415 90,777
3,209 3,309 Amortisation, depreciation and impairment losses 69,442 72,011
240 210 Share-based payment 210 240
-4,742 -535 Value adjustments, etc. -11,552 6,208
14,376 27,292 31 Changes in net working capital -15,992 12,283
6,561 20,380 Cash generated from operations 175,523 181,519
16,398 1,124 Realised capital gain 0 16,398
587 415 Interest income, etc. received 865 639
-6,008 -5,850 Interest expenses, etc. paid -12,540 -13,803
4,188 -354 Income taxes received/paid -23,409 -13,010
21,726 15,715 Cash flows from operating activities 140,439 171,743
26,231 29,779 Dividends from subsidiaries - -
-12,000 0 Capital injection, subsidiary - -
-50,000 -24,453 Acquisition of entity -36,422 -59,712
-63 0 Acquisition of intangible assets -2,508 -6,088
-2,652 -15,555 Acquisition of property, plant and equipment -107,035 -73,238
0 0 Portion relating to finance leases 19,100 22,019
0 0 Sale of software and development projects 864 0
0 0 Sale of property, plant and equipment 45,875 669
-38,484 -10,229 Cash flows from investing activities -80,126 -116,350
0 0 Dividends to non-controlling shareholders -732 -1,071
-7,058 -8,853 Dividends distributed -8,853 -7,058
55,335 8,934 Payment, capital increase 8,934 55,335
0 0 Acquisition of non-controlling interests -7,643 -6,500
0 3,000 Deposits, adjustment 3,105 -105
-18,235 -38,267 Acquisition of treasury shares -38,267 -18,235
11,530 8,399 Sale of treasury shares 8,399 11,530
272 269 Sale of warrants 269 272
0 5,619 Raising of long-term loans 24,719 22,019
0 0 Portion relating to finance leases -19,100 -22,019
-27,466 -35,980 Instalments on non-current liabilities -94,933 -52,571
14,378 -56,879 Cash flows from financing activities -124,102 -18,403
-2,380 -51,393 Cash flows for the year -63,789 36,990
-18,152 -20,532 Cash and cash equivalents at 01/01/2016 -107,304 -144,294
-20,532 -71,925 32 Cash and cash equivalents at 31/12/2016 -171,093 -107,304
48 SP Group
List of notes
1. Accounting policies
2. Significant accounting estimates, assumptions and uncertainties
3. Production costs
4. Other operating income
5. Development costs
6. Sta; costs
7. Share-based payment
8. Depreciation, amortisation and impairment losses
9. Dividends from group entities
10. Other financial income
11. Financial expenses
12. Tax for the year
13. Earnings per share
14. Intangible assets
15. Property, plant and equipment
16. Investments in subsidiaries
17. Inventories
18. Trade receivables
19. Construction contracts
20. Other receivables
21. Cash
22. Share capital
23. Other reserves
24. Non-current liabilities
25. Deferred tax
26. Trade payables
27. Provisions
28. Other payables
29. Charges
30. Rental and lease liabilities
31. Recourse guarantee commitments and contingent liabilities
32. Changes in net working capital
33. Cash and cash equivalents
34. Fees to the Company’s auditor appointed by the general meeting
35. Related parties
36. Financial risks and financial instruments
37. Sale of financial assets
38. Segment information for the Group
39. Shareholder information
40. Acquisition of subsidiaries and activities in 2016
41. Acquisition of subsidiaries in 2015
42. Acquisition of subsidiaries after the balance sheet date
43. Events after the balance sheet date
44. Group chart at 31 December 2016
Notes
Accounts / SP Group 49
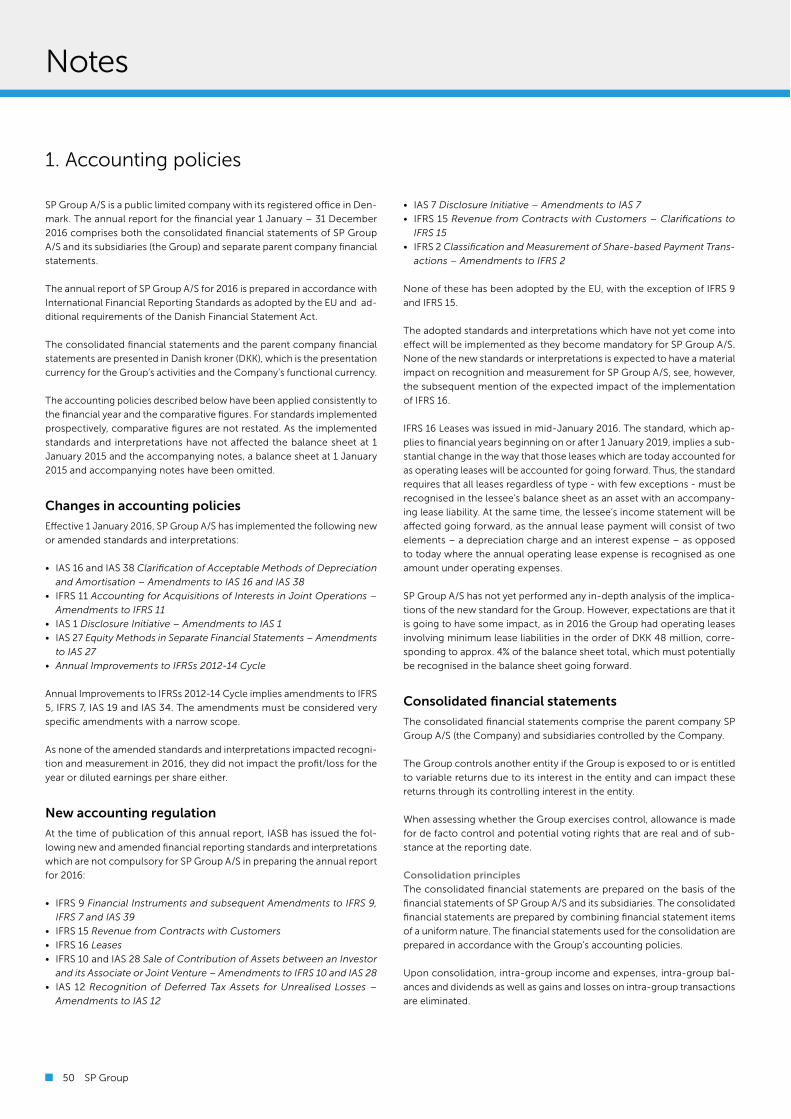
1. Accounting policies
SP Group A/S is a public limited company with its registered o&ce in Den-
mark. The annual report for the financial year 1 January – 31 December
2016 comprises both the consolidated financial statements of SP Group
A/S and its subsidiaries (the Group) and separate parent company financial
statements.
The annual report of SP Group A/S for 2016 is prepared in accordance with
International Financial Reporting Standards as adopted by the EU and ad-
ditional requirements of the Danish Financial Statement Act.
The consolidated financial statements and the parent company financial
statements are presented in Danish kroner (DKK), which is the presentation
currency for the Group’s activities and the Company’s functional currency.
The accounting policies described below have been applied consistently to
the financial year and the comparative figures. For standards implemented
prospectively, comparative figures are not restated. As the implemented
standards and interpretations have not a;ected the balance sheet at 1
January 2015 and the accompanying notes, a balance sheet at 1 January
2015 and accompanying notes have been omitted.
Changes in accounting policies
E;ective 1 January 2016, SP Group A/S has implemented the following new
or amended standards and interpretations:
• IAS 16 and IAS 38 Clarification of Acceptable Methods of Depreciation
and Amortisation – Amendments to IAS 16 and IAS 38
• IFRS 11 Accounting for Acquisitions of Interests in Joint Operations –
Amendments to IFRS 11
• IAS 1 Disclosure Initiative – Amendments to IAS 1
• IAS 27 Equity Methods in Separate Financial Statements – Amendments
to IAS 27
• Annual Improvements to IFRSs 2012-14 Cycle
Annual Improvements to IFRSs 2012-14 Cycle implies amendments to IFRS
5, IFRS 7, IAS 19 and IAS 34. The amendments must be considered very
specific amendments with a narrow scope.
As none of the amended standards and interpretations impacted recogni-
tion and measurement in 2016, they did not impact the profit/loss for the
year or diluted earnings per share either.
New accounting regulation
At the time of publication of this annual report, IASB has issued the fol-
lowing new and amended financial reporting standards and interpretations
which are not compulsory for SP Group A/S in preparing the annual report
for 2016:
• IFRS 9 Financial Instruments and subsequent Amendments to IFRS 9,
IFRS 7 and IAS 39
• IFRS 15 Revenue from Contracts with Customers
• IFRS 16 Leases
• IFRS 10 and IAS 28 Sale of Contribution of Assets between an Investor
and its Associate or Joint Venture – Amendments to IFRS 10 and IAS 28
• IAS 12 Recognition of Deferred Tax Assets for Unrealised Losses –
Amendments to IAS 12
• IAS 7 Disclosure Initiative – Amendments to IAS 7
• IFRS 15 Revenue from Contracts with Customers – Clarifications to
IFRS 15
• IFRS 2 Classification and Measurement of Share-based Payment Trans-
actions – Amendments to IFRS 2
None of these has been adopted by the EU, with the exception of IFRS 9
and IFRS 15.
The adopted standards and interpretations which have not yet come into
e;ect will be implemented as they become mandatory for SP Group A/S.
None of the new standards or interpretations is expected to have a material
impact on recognition and measurement for SP Group A/S, see, however,
the subsequent mention of the expected impact of the implementation
of IFRS 16.
IFRS 16 Leases was issued in mid-January 2016. The standard, which ap-
plies to financial years beginning on or after 1 January 2019, implies a sub-
stantial change in the way that those leases which are today accounted for
as operating leases will be accounted for going forward. Thus, the standard
requires that all leases regardless of type - with few exceptions - must be
recognised in the lessee’s balance sheet as an asset with an accompany-
ing lease liability. At the same time, the lessee’s income statement will be
a;ected going forward, as the annual lease payment will consist of two
elements – a depreciation charge and an interest expense – as opposed
to today where the annual operating lease expense is recognised as one
amount under operating expenses.
SP Group A/S has not yet performed any in-depth analysis of the implica-
tions of the new standard for the Group. However, expectations are that it
is going to have some impact, as in 2016 the Group had operating leases
involving minimum lease liabilities in the order of DKK 48 million, corre-
sponding to approx. 4% of the balance sheet total, which must potentially
be recognised in the balance sheet going forward.
Consolidated financial statements
The consolidated financial statements comprise the parent company SP
Group A/S (the Company) and subsidiaries controlled by the Company.
The Group controls another entity if the Group is exposed to or is entitled
to variable returns due to its interest in the entity and can impact these
returns through its controlling interest in the entity.
When assessing whether the Group exercises control, allowance is made
for de facto control and potential voting rights that are real and of sub-
stance at the reporting date.
Consolidation principles
The consolidated financial statements are prepared on the basis of the
financial statements of SP Group A/S and its subsidiaries. The consolidated
financial statements are prepared by combining financial statement items
of a uniform nature. The financial statements used for the consolidation are
prepared in accordance with the Group’s accounting policies.
Upon consolidation, intra-group income and expenses, intra-group bal-
ances and dividends as well as gains and losses on intra-group transactions
are eliminated.
Notes
50 SP Group

In the consolidated financial statements, the accounting items of subsidiar-
ies are recognised in full.
Non-controlling interests
On initial recognition, non-controlling interest are either measured at fair
value or at their proportionate share of the fair value of the acquiree’s
identifiable assets, liabilities and contingent liabilities. Choice of method
is made for each individual transaction. Non-controlling interests are sub-
sequently adjusted for their proportionate share of changes in the subsidi-
ary’s equity. Comprehensive income is allocated to the non-controlling
interests, irrespective of whether the non-controlling interest will thus
become negative.
Acquisitions and disposals of non-controlling interests in a subsidiary that
do not result in loss of control are accounted for in the consolidated fi-
nancial statements as equity transactions, and the di;erence between the
consideration and the carrying amount is allocated to the Company’s share
of equity.
Business combinations
Entities acquired or formed during the year are recognised in the consoli-
dated financial statements from the date of acquisition or formation. The
acquisition date is the date at which control of the entity is in fact acquired.
Divested or wound-up entities are recognised in the consolidated income
statement up to the date of the divestment or winding-up. The divest-
ment date is the date at which control of the entity does in fact pass to a
third party.
The purchase method is applied to acquisition of new entities over which
the Group obtains control, implying that identifiable assets, liabilities and
contingent liabilities of the acquirees are measured at fair value at the ac-
quisition date. However, non-currents assets acquired for the purpose of
resale are measured at fair value less anticipated selling costs. Restructur-
ing costs are only recognised in the pre-acquisition balance sheet if they
constitute a liability for the acquiree. Allowance is made for the tax e;ect
of revaluations made.
The cost of an entity consists in the fair value of the consideration paid for
the acquiree. If the final determination of the consideration is conditional
upon one or several future events, these are recognised at fair value at the
acquisition date. Expenses which are attributable to the acquisition of the
entity are recognised directly in profit/loss when incurred.
Positive di;erences (goodwill) between, on the one hand, the considera-
tion for the acquiree, the value of non-controlling interest in the acquiree
and the fair value of previously acquired equity investments and, on the
other hand, the fair value of the assets, liabilities and contingent liabilities
acquired are recognised as an asset under intangible assets and are tested
for impairment at least once a year. The asset is written down to the lower
of the carrying amount and the recoverable amount.
For negative di;erences (negative goodwill), the calculated fair values, the
calculated consideration for the entity, the value of non-controlling inter-
est in the acquiree and the fair value of previously acquired equity invest-
ments are reassessed. If the di;erence is still negative, the di;erence is
recognised as income in the income statement.
If uncertainties regarding the identification or measurement of acquired
assets, liabilities or contingent liabilities or the determination of the con-
sideration exist at the acquisition date, initial recognition will take place on
the basis of provisional values. The provisional values may be adjusted, or
additional assets or liabilities may be recognised, up to 12 months after the
acquisition if any such new information is provided on matters existing at
the acquisition date as would have a;ected the calculation of the values
at the acquisition date had the information been known.
Changes in estimates of contingent considerations are generally recog-
nised directly in profit/loss.
Gains or losses from divestment or winding-up
of subsidiaries and associates
Gains or losses from divestment or winding-up of subsidiaries which result
in loss of control or significant influence, respectively, are calculated as the
di;erence between, on the one hand, the fair value of the sales proceeds
or the settlement price and the fair value of any remaining investments
and, on the other hand, the carrying amount of net assets at the time of
divestment or winding-up, including goodwill, less any non-controlling in-
terests. The calculated gain or loss from such divestment or winding-up is
recognised in profit/loss together with accumulated exchange rate adjust-
ments, which were previously recognised in other comprehensive income.
Foreign currency translation
On initial recognition, transactions denominated in other currencies that
the individual entity’s functional currency are translated at the exchange
rates at the transaction date. Receivables, liabilities and other monetary
items denominated in foreign currencies that have not been settled at the
balance sheet date are translated at the exchange rates at the balance sheet
date. Foreign exchange di;erences arising between the exchange rates at
the transaction date and at the date of payment and the balance sheet date,
respectively, are recognised in the income statement as financial income
or financial expenses. Property, plant and equipment, intangible assets, in-
ventories and other non-monetary assets purchased in foreign currencies
and measured on the basis of historical cost are translated at the exchange
rates at the transaction date. Non-monetary items that are restated at fair
value are translated at the exchange rates at the date of restatement.
When entities that present their financial statements in a functional cur-
rency di;erent from DKK are recognised in the consolidated financial
statements, such entities’ income statement items are translated at aver-
age exchange rates on a monthly basis unless such rates vary significantly
from the actual exchange rates at the transaction dates. In the latter case,
the actual exchange rates are used. Balance sheet items are translated at
closing rates. Goodwill is considered to belong to the acquiree in question
and is translated at closing rates.
Foreign exchange di;erences arising on translation of foreign entities’ bal-
ance sheet items at the beginning of the year at closing rates and on trans-
lation of income statement items from average rates to closing rates are
recognised in other comprehensive income. Similarly, foreign exchange
di;erences arising from changes made directly in the foreign entity’s equity
are also recognised in other comprehensive income.
Accounts / SP Group 51

Where foreign subsidiaries are recognised in the consolidated financial
statements and where Danish kroner (DKK) is used as the functional cur-
rency, but where the financial statements are presented in a functional
currency other than DKK, monetary assets and liabilities are translated
at the exchange rates at the balance sheet date. Non-monetary assets
and liabilities measured based on historical cost are translated at the ex-
change rates at the transaction date. Non-monetary items measured at
fair value are translated at the exchange rates at the date of the latest fair
value adjustment. Income statement items are translated at the average
exchange rates of the months unless these di;er significantly from the ac-
tual exchange rates at the transaction date, except for items deriving from
non-monetary assets and liabilities translated at historical rates applicable
to the relevant non-monetary assets and liabilities.
Derivative financial instruments
On initial recognition, derivative financial instruments are measured at the
fair value at the date of settlement.
Subsequently, derivative financial instruments are measured at the fair
value at the balance sheet date. Positive and negative fair values of de-
rivative financial instruments are recognised in other receivables or other
payables, respectively.
Changes in the fair value of derivative financial instruments classified as
and qualifying for designation as hedges of the fair value of a recognised
asset or a recognised liability are recognised in the income statement to-
gether with changes in the value of the hedged asset or the hedged liability.
Changes in the fair value of derivative financial instruments classified as
and qualifying for designation as e;ective hedges of future transactions are
recognised in other comprehensive income. The ine;ective part is recog-
nised immediately in the income statement. When the hedged transactions
are realised, the accumulated changes are recognised as part of the cost
of the relevant transactions.
Derivative financial instruments not qualifying for designation as hedging
instruments are considered trading portfolios and are measured at fair
value with recognition of fair value adjustments on an ongoing basis in the
income statement under financial income or financial expenses.
Share-based payment
Share-based incentive schemes under which executive o&cers may only
opt to purchase shares in the Company (equity-settled share-based pay-
ment arrangements) are measured at the fair value of the equity instru-
ments at the grant date and are recognised in the income statement under
sta; costs over the vesting period. The counter entry is recognised directly
in equity.
The fair value of the equity instruments is measured by using the Black-
Scholes model with the parameters indicated in note 7.
Income taxes
Tax for the year, which consists of current tax for the year and changes in
deferred tax, is recognised in the income statement by the portion attribut-
able to the profit/loss for the year and directly in equity or other compre-
hensive income by the portion attributable to entries directly in equity or
in other comprehensive income, respectively. Exchange rate adjustments
in respect of deferred tax are recognised as part of the year’s deferred tax
adjustments.
Current tax payables and receivables are recognised in the balance sheet,
calculated as the estimated tax on the year’s taxable income, adjusted for
tax paid on account.
When calculating the current tax for the year, the tax rates and tax rules
e;ective at the balance sheet date are used.
Deferred tax is recognised in accordance with the balance-sheet liability
method on all temporary di;erences between the carrying amount and the
tax base of assets and liabilities, except for deferred tax on all temporary
di;erences arising on initial recognition of goodwill or on initial recogni-
tion of a transaction which is not a business combination and where the
temporary di;erence identified at the time of initial recognition neither
a;ects the profit/loss for the year nor the taxable income.
Deferred tax is recognised on all temporary di;erences related to invest-
ments in subsidiaries unless the Company is able to control when the de-
ferred tax is realised and it is probable that the deferred tax will not crystal-
lise as current tax in the foreseeable future.
Deferred tax is calculated based on the planned use of each asset and the
settlement of each liability, respectively.
Deferred tax is measured on the basis of the tax rates and tax laws ap-
plicable in the relevant countries, which – based on the tax rates and tax
laws enacted or substantially enacted by the end of the reporting period
– are expected to apply when the deferred tax is expected to crystallise
as current tax. Changes in deferred tax resulting from changed tax rates
or tax rules are recognised in the income statement unless the deferred
tax is attributable to transactions previously recognised directly in equity
or other comprehensive income. In the latter case, such changes are also
recognised directly in equity or other comprehensive income, respectively.
Deferred tax assets, including the tax base of tax loss carry-forwards, are
recognised in the balance sheet at the expected value of their realisation,
either as a set-o; against deferred tax liabilities or as net tax assets for set-
o; against future positive taxable income. At the balance sheet date, it is
assessed whether taxable income su&cient for the deferred tax asset to
be utilised is likely to be generated going forward.
The Parent is jointly taxed with all of its Danish subsidiaries. The current
Danish income tax charge is allocated between the jointly taxed entities in
proportion to their taxable income.
Discontinued operations and assets
classified as held for sale
Discontinued operations comprise material business or geographical seg-
ments already sold or planned to be held for sale.
Results from discontinued operations are presented in the income state-
ment as a separate item consisting of the profit/loss after tax of the relevant
operation and any gains or losses from fair value adjustments or sale of the
assets and liabilities related to the operation.
Notes
52 SP Group

Assets and groups of assets held for sale are presented separately in the
balance sheet as current assets. Liabilities directly related to the relevant
assets are presented as current liabilities in the balance sheet.
Assets held for sale are not depreciated, but are written down to the lower
of fair value less estimated selling costs and the carrying amount.
Income statement
Revenue
Revenue from the sale of goods for resale and manufactured goods is
recognised in the income statement when delivery and transfer of risk to
the buyer has taken place. Revenue is calculated exclusive of VAT, duties,
etc. charged on behalf of third parties as well as discounts.
Construction contracts for moulds and validations with a high degree of
individual adaptation are recognised in revenue as production is carried
out, which entails that revenue corresponds to the selling price of work
performed during the year (percentage-of-completion method).
When the outcome of a construction contract cannot be estimated re-
liably, revenue is recognised solely at an amount corresponding to the
expenses incurred if it is probable that they will be recovered.
Production costs
Production costs comprise expenses incurred in generating revenue for
the year. Commercial enterprises include cost of sales in production costs,
and manufacturing enterprises include costs of raw materials, consuma-
bles and production sta; as well as maintenance of the property, plant and
equipment and intangible assets applied in the manufacturing process.
Other operating income
Other operating income comprises income of a secondary nature to the
Group’s principal activities, including in particular external leases and com-
pensations.
Construction contracts for moulds and validations with a high degree of
individual adaptation are recognised in revenue as production is carried
out, which entails that revenue corresponds to the selling price of work
performed during the year (percentage-of-completion method).
When the outcome of a construction contract cannot be estimated reli-
ably, revenue is recognised solely at an amount corresponding to the costs
incurred if it is probable that they will be recovered.
External expenses
External expenses comprise expenses for sale, advertising, administration,
premises, bad debts, etc.
External expenses also include expenses relating to development projects
which do not satisfy the criteria for recognition in the balance sheet.
Sta< costs
Sta; costs comprise salaries and wages, social security costs, pension con-
tributions, etc. relating to the Company’s sta;.
Government grants
Government grants are recognised when it is considered probable that
the grant conditions have been met and that the grant will be received.
Grants to cover expenses incurred are recognised proportionally in the
income statement over the periods in which the related expenses are rec-
ognised. The grants are set o; against expenses incurred.
Financial income and financial expenses
Financial income and expenses comprise interest income and interest
expenses, the interest element of finance lease payments, realised and
unrealised capital gains and losses on securities, liabilities and transactions
denominated in foreign currencies, mortgage amortisation premium or
allowance on mortgage debt, etc. as well as surcharges and refunds under
the on-account tax scheme.
Interest income and expenses are accrued based on the principal amount
and the e;ective interest rate. The e;ective interest rate is the discount rate
used to discount expected future payments related to the financial asset or
the financial liability in order for the present value of such asset or liability
to match its carrying amount.
Dividends from equity investments are recognised once final title to the
dividends has been obtained. This is typically the date at which the general
meeting adopts distribution of dividend from the relevant entity.
Balance sheet
Goodwill
On initial recognition, goodwill is recognised and measured as the dif-
ference between, on the one hand, the cost of the acquiree, the value of
non-controlling interests in the acquiree and the fair value of previously
acquired investments and, on the other hand, the fair value of the acquired
assets, liabilities and contingent liabilities; see the description under the
section on consolidated financial statements.
When goodwill is recognised, it is allocated to those of the Group’s activi-
ties that generate separate payments (cash-generating units). The determi-
nation of cash-generating units follows the Group’s managerial structure,
internal financial management and reporting.
Goodwill is not amortised, but is tested for impairment at least annually,
see below.
Other intangible assets
Development projects regarding clearly defined and identifiable prod-
ucts and processes are recognised as intangible assets if it is probable
that the product or the process will generate future economic benefits
for the Group and if the development costs of each asset can be reliably
measured. Other development costs are expensed in the income state-
ment as incurred.
On initial recognition, development projects are measured at cost. The
cost of development projects comprises expenses, including salaries and
amortisation, which are directly attributable to the development projects
and which are required to complete the project, calculated from the date
at which the development project qualifies for recognition as an asset for
the first time.
Interest expenses on loans raised to finance the manufacturing of intangi-
ble assets are recognised in cost if they relate to the manufacturing period.
Other borrowing costs are recognised in the income statement.
Accounts / SP Group 53
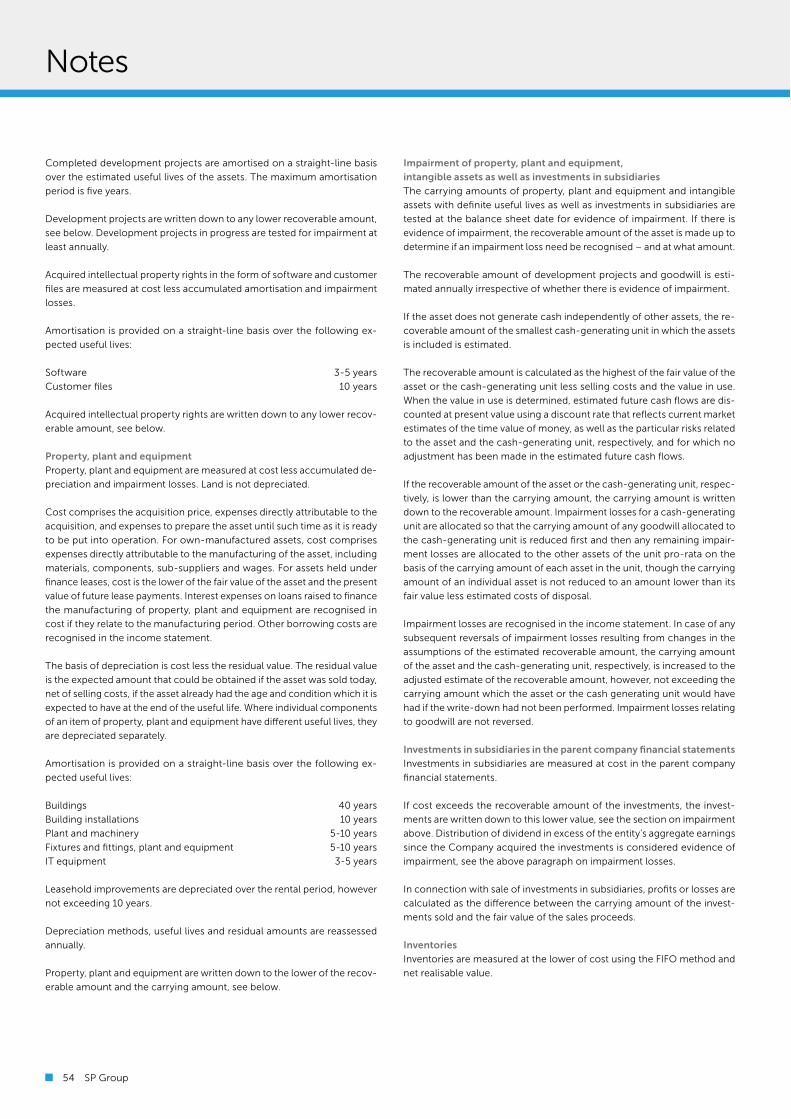
Completed development projects are amortised on a straight-line basis
over the estimated useful lives of the assets. The maximum amortisation
period is five years.
Development projects are written down to any lower recoverable amount,
see below. Development projects in progress are tested for impairment at
least annually.
Acquired intellectual property rights in the form of software and customer
files are measured at cost less accumulated amortisation and impairment
losses.
Amortisation is provided on a straight-line basis over the following ex-
pected useful lives:
Software 3-5 years
Customer files 10 years
Acquired intellectual property rights are written down to any lower recov-
erable amount, see below.
Property, plant and equipment
Property, plant and equipment are measured at cost less accumulated de-
preciation and impairment losses. Land is not depreciated.
Cost comprises the acquisition price, expenses directly attributable to the
acquisition, and expenses to prepare the asset until such time as it is ready
to be put into operation. For own-manufactured assets, cost comprises
expenses directly attributable to the manufacturing of the asset, including
materials, components, sub-suppliers and wages. For assets held under
finance leases, cost is the lower of the fair value of the asset and the present
value of future lease payments. Interest expenses on loans raised to finance
the manufacturing of property, plant and equipment are recognised in
cost if they relate to the manufacturing period. Other borrowing costs are
recognised in the income statement.
The basis of depreciation is cost less the residual value. The residual value
is the expected amount that could be obtained if the asset was sold today,
net of selling costs, if the asset already had the age and condition which it is
expected to have at the end of the useful life. Where individual components
of an item of property, plant and equipment have di;erent useful lives, they
are depreciated separately.
Amortisation is provided on a straight-line basis over the following ex-
pected useful lives:
Buildings 40 years
Building installations 10 years
Plant and machinery 5-10 years
Fixtures and fittings, plant and equipment 5-10 years
IT equipment 3-5 years
Leasehold improvements are depreciated over the rental period, however
not exceeding 10 years.
Depreciation methods, useful lives and residual amounts are reassessed
annually.
Property, plant and equipment are written down to the lower of the recov-
erable amount and the carrying amount, see below.
Impairment of property, plant and equipment,
intangible assets as well as investments in subsidiaries
The carrying amounts of property, plant and equipment and intangible
assets with definite useful lives as well as investments in subsidiaries are
tested at the balance sheet date for evidence of impairment. If there is
evidence of impairment, the recoverable amount of the asset is made up to
determine if an impairment loss need be recognised – and at what amount.
The recoverable amount of development projects and goodwill is esti-
mated annually irrespective of whether there is evidence of impairment.
If the asset does not generate cash independently of other assets, the re-
coverable amount of the smallest cash-generating unit in which the assets
is included is estimated.
The recoverable amount is calculated as the highest of the fair value of the
asset or the cash-generating unit less selling costs and the value in use.
When the value in use is determined, estimated future cash flows are dis-
counted at present value using a discount rate that reflects current market
estimates of the time value of money, as well as the particular risks related
to the asset and the cash-generating unit, respectively, and for which no
adjustment has been made in the estimated future cash flows.
If the recoverable amount of the asset or the cash-generating unit, respec-
tively, is lower than the carrying amount, the carrying amount is written
down to the recoverable amount. Impairment losses for a cash-generating
unit are allocated so that the carrying amount of any goodwill allocated to
the cash-generating unit is reduced first and then any remaining impair-
ment losses are allocated to the other assets of the unit pro-rata on the
basis of the carrying amount of each asset in the unit, though the carrying
amount of an individual asset is not reduced to an amount lower than its
fair value less estimated costs of disposal.
Impairment losses are recognised in the income statement. In case of any
subsequent reversals of impairment losses resulting from changes in the
assumptions of the estimated recoverable amount, the carrying amount
of the asset and the cash-generating unit, respectively, is increased to the
adjusted estimate of the recoverable amount, however, not exceeding the
carrying amount which the asset or the cash generating unit would have
had if the write-down had not been performed. Impairment losses relating
to goodwill are not reversed.
Investments in subsidiaries in the parent company financial statements
Investments in subsidiaries are measured at cost in the parent company
financial statements.
If cost exceeds the recoverable amount of the investments, the invest-
ments are written down to this lower value, see the section on impairment
above. Distribution of dividend in excess of the entity’s aggregate earnings
since the Company acquired the investments is considered evidence of
impairment, see the above paragraph on impairment losses.
In connection with sale of investments in subsidiaries, profits or losses are
calculated as the di;erence between the carrying amount of the invest-
ments sold and the fair value of the sales proceeds.
Inventories
Inventories are measured at the lower of cost using the FIFO method and
net realisable value.
Notes
54 SP Group

Goods for resale, raw materials and consumables are measured at cost,
comprising purchase price plus delivery costs. Cost of manufactured
goods and work in progress consists of costs of raw materials, consuma-
bles and direct labour costs as well as allocated fixed and variable indirect
production costs.
Variable indirect production costs include indirect materials and payroll
and are allocated based on pre-calculations of the goods actually pro-
duced. Fixed indirect production costs comprise costs of maintenance
and depreciation of machinery, factory buildings and equipment applied
for the manufacturing process as well as general costs relating to factory
administration and management. Fixed production costs are allocated on
the basis of the normal capacity of the production plant.
The net realisable value of inventories is calculated as the expected selling
price less costs of completion and expenses which must be incurred to
e;ect the sale.
Receivables
Receivables comprise trade receivables as well as other receivables. Re-
ceivables are categorised as loans and receivables which are financial as-
sets with fixed or determinable payments which are not listed at an active
market and which are not derivatives.
On initial recognition, receivables are measured at fair value and subse-
quently at amortised cost. Write-downs are made on an individual as well
as on a portfolio basis using a write-down account.
Construction contracts
Construction contracts are measured at the selling price of the work per-
formed less progress billings and anticipated losses. Construction con-
tracts entail a significant degree of design customisation of produced
goods. Moreover, before any work is commenced, a binding agreement
must have been entered into, which will imply a penalty or damages on
subsequent termination of the agreement.
The selling price is measured by reference to the percentage of comple-
tion at the end of the reporting period and the total expected income from
the contract. The percentage of completion is determined on the basis of
an assessment of the work performed, which is usually measured as the
proportion of contract costs incurred for work performed to date relative
to the total estimated contract costs.
When it is probable that the total contract costs will exceed the total con-
tract revenue, the anticipated loss on the contract is immediately recog-
nised as an expense and a provision.
When income and expenses on a construction contract cannot be deter-
mined reliably, contract revenue is recognised only to the extent of con-
tract costs incurred that it is probable will be recoverable.
Where the selling price of work performed exceeds progress billings on
construction contracts and anticipated losses, the excess amount is recog-
nised under receivables. If progress billings and anticipated losses exceed
the selling price of a construction contract, the deficit is recognised under
liabilities.
Prepayments from customers are recognised under liabilities.
Selling costs and expenses incurred in securing contracts are recognised
in the income statement as incurred.
Prepayments
Prepayments recognised under “Assets” comprise expenses incurred con-
cerning subsequent financial years. Prepayments are measured at cost.
Dividends
Dividends are recognised as a liability at the date when they are adopted
at the general meeting.
Reserve for treasury shares
Reserve for treasury shares comprises the cost of acquisition of the Com-
pany’s treasury shares. Dividend from treasury shares and gains and losses
on the disposal of treasury shares are taken directly to retained earnings
under equity.
Pension commitments, etc.
Under defined contribution plans, the Group pays fixed contributions to in-
dependent pension providers, etc. on an ongoing basis. The contributions
are recognised in the income statement in the period in which the em-
ployees have performed the work making them eligible for pension con-
tributions. Due amounts are recognised in the balance sheet as a liability.
Mortgage debt
At the time of borrowing, mortgage debt is measured at cost less transac-
tion costs incurred. Subsequently, mortgage debt is measured at amortised
cost. Consequently, the di;erence between the proceeds at the time of
borrowing and the repayable amount is recognised in the income state-
ment as a financial expense over the term of the loan using the e;ective
interest method.
Lease liabilities
Lease liabilities relating to assets held under finance leases are recognised
in the balance sheet as liabilities and measured at the lower of the fair value
of the leased asset and the present value of future lease payments at the
time of inception of the lease.
On subsequent recognition, lease liabilities are measured at amortised
cost. The di;erence between the present value and the nominal amount
of lease payments is recognised in the income statement as a financial
expense over the term of the lease.
Lease payments relating to operating leases are recognised in the income
statement on a straight-line basis over the lease term.
Financial liabilities
Financial liabilities comprise bank debt and trade and other payables.
On initial recognition, financial liabilities are measured at fair value less any
transaction costs. Subsequently, the liabilities are measured at amortised
cost using the e;ective interest method to the e;ect that the di;erence
between the proceeds and the nominal amount is recognised in the in-
come statement as a financial expense over the term of the loan.
Non-financial liabilities are measured at net realisable value.
Deferred income
Deferred income recognised under “Liabilities” comprises income received
in respect of subsequent financial years. Deferred income is measured at
cost.
Accounts / SP Group 55

Cash flow statement
The cash flow statement shows cash flows from operating, investing and
financing activities as well as cash and cash equivalents at the beginning
and the end of the financial year.
Cash flows from acquisition and divestment of enterprises are shown sepa-
rately under cash flows from investing activities. Cash flows from acquisi-
tions of entities are recognised in the cash flow statement from the date
of acquisition. Cash flows from disposals of entities are recognised up until
the date of disposal.
Cash flows from operating activities are presented using the indirect
method and calculated as the operating profit/loss adjusted for non-cash
operating items, changes in working capital as well as financial income,
financial expenses and income taxes.
Cash flows from investing activities comprise payments in connection
with acquisition and divestment of entities and financial assets as well as
acquisition, development, improvement and sale of intangible assets and
property, plant and equipment.
Cash flows from financing activities comprise changes in the Company’s
share capital and any related expenses as well as the raising and settlement
of loans, instalments on interest-bearing debt, purchase of treasury shares
and distribution of dividends.
Cash flows in currencies other than the functional currency are recog-
nised in the cash flow statement using average exchange rates for the
months unless they di;er significantly from the actual exchange rates at
the transaction dates. In the latter case, the actual exchange rates of each
day are applied.
Cash and cash equivalents comprise cash less short-term bank debt form-
ing an integral part of cash management.
Segment information
Segment information is prepared in compliance with the Group’s account-
ing policies and is based on the Group’s internal management reporting.
Segment income and segment expenses as well as segment assets and
segment liabilities consist of the financial statement items directly at-
tributable to each segment and the financial statement items that can be
allocated to each segment on a reliable basis. The unallocated financial
statement items primarily relate to assets and liabilities as well as income
and expenses related to in the Group’s administrative functions, investing
activities, income taxes, etc.
Non-current assets in the segments comprise assets used directly in the
operation of the segment, including intangible assets and property, plant
and equipment.
Current assets in the segments comprise assets used directly in the opera-
tion of the segment, including inventories, trade receivables, other receiva-
bles, prepayments and accrued income as well as cash.
Liabilities related to the segments comprise liabilities derived from the
operation of the segment, including trade payables, provisions and other
payables.
Transactions between the segments are priced at estimated fair values.
Notes
56 SP Group

Financial highlights
Financial highlights are defined and calculated in accordance with the Dan-
ish Finance Society’s “Recommendations & Financial Ratios 2015” and IAS
33 Earnings per share.
Key figures
The calculation of earnings per share and diluted earnings per share is
specified in note 13.
Net working capital (NWC) is defined as the value of inventories, receiv-
ables and other operating current assets less trade payables and other
short-term operating liabilities. Cash is not included in net working capital.
Net interest-bearing debt is defined as interest-bearing liabilities less inter-
est-bearing assets, including cash.
Ratios Calculation formula Ratios reflect
Operating profit/loss, =
EBITDA x 100 The Company’s operating profitability
EBITDA margin (%) Revenue expressed as the Company’s ability to
generate profits on operating activities
Profit margin, = Profit/loss before net financials (EBIT) x 100 The Company’s operating profitability
EBIT margin (%) Revenue expressed as the Company’s ability to
generate profits on operating activities
before net financials
Return on invested capital = Profit/loss before net financials (EBIT) x 100 The return generated by the Company
including goodwill (%) Average invested capital, incl. goodwill on investors’ funds through
operating activities
Return on invested capital =
Profit/loss before net financials (EBIT) x 100 The return generated by the Company
excl. goodwill (%) Average invested capital, excl. goodwill on investors’ funds through
operating activities
Return on equity =
Profit/loss for the year x 100 The Company’s ability to yield a return
Average equity to its shareholders considering the
Company’s capital base
Financial gearing =
Net interest-bearing debt The Company’s financial gearing expressed
Equity as the Company’s sensitivity to fluctuations
in the interest rate level, etc.
Equity ratio, excl. =
Equity ratio, excl. non-controlling interests x 100 The Company’s financial standing
non-controlling interests Total assets
Equity ratio, incl. =
Equity ratio, incl. non-controlling interests x 100 The Company’s financial standing
non-controlling interests Total assets
Equity value per share =
Equity ratio, excl. non-controlling interests The value of equity per share according to
Number of shares at year end the Company’s annual report
Cash flow per share =
Cash flows from operating activities Cash flows from operating activities
Average number of diluted shares generated per share by the Company
Accounts / SP Group 57

2. Significant accounting estimates, assumptions and judgements
Several financial statement items cannot be reliably measured, only esti-
mated. Such estimates comprise assessments based on the latest infor-
mation available at the time of the financial reporting. It may be necessary
to change previous estimates due to changes in the conditions on which
the estimate was based or due to additional information, further experi-
ence or subsequent events.
Significant accounting estimates
When applying the accounting policies described in note 1, Management
has made accounting estimates of, for example, valuation of goodwill,
valuation of development costs, valuation of inventories and valuation
of receivables, purchase price allocations in connection with corporate
acquisitions and valuation of investments in subsidiaries in the parent
company financial statements.
Assumptions and uncertainties relating to significant estimates are de-
scribed below. Management is not otherwise considered having made
accounting estimates that materially a;ect the annual report, nor are the
accounting estimates made considered to be associated with significant
uncertainty.
Changes in accounting estimates
No significant changes have been made in accounting estimates in the
financial year.
Significant assumptions and uncertainties
Recognition and measurement of assets and liabilities often depend on
future events subject to some uncertainty. In this connection, it is neces-
sary to assume a course of events, etc., reflecting Management’s assess-
ment of the most likely course of events. In the annual report for 2016 as
well as in annual reports for previous years, the following assumptions
and uncertainties should be noted as they have significantly a;ected the
assets and liabilities recognised in the annual report and may require cor-
rections in subsequent financial years if the courses of events assumed
are not realised as expected.
Recoverable amount of goodwill
An assessment of indication of impairment of recognised goodwill
amounts requires a calculation of the values in use of the cash-generat-
ing units to which the goodwill amounts are allocated. The determination
of the value in use requires an estimate of the expected future cash flows
in each cash-generating unit as well as a determination of a reasonable
discount rate. The carrying amount of goodwill amounted to DKK 142.3
million at 31 December 2016. For a further description of the applied
discount rates, etc., see note 14. The impairment tests performed show
that the value in use of the cash-generating units is significantly higher
than the carrying amount of the assets related to the units.
Capitalised development projects
An impairment test has been carried out of selected development pro-
jects that are in the early commercial phase. The impairment test is based
on a discount rate of 9.0% before tax and 7.5% after tax and expected
revenue and earnings on the projects. The carrying amount of develop-
ment projects amounts to DKK 10.1 million.
Inventories
Individual write-downs of inventories have been made based on turno-
ver ratio, defective goods, etc. No significant changes to estimates were
made in the year.
Receivables
The Group has made individual write-downs of receivables based on es-
timates of the credit quality of the debtors. The risk of bad debts is limited
as the Group’s debtors have taken out credit insurance.
Corporate acquisitions
In connection with corporate acquisitions, the acquiree’s identifiable as-
sets, liabilities and contingent liabilities must be recognised at fair value
in accordance with the acquisition method. The acquiree’s core assets
are usually goodwill, property, plant and equipment, intangible assets,
receivables and inventories. There are no active markets that can be used
to determine the fair value of a large part of the acquired assets and li-
abilities. This is particularly true for acquired intangible assets. The meth-
ods typically used are based on the net present value of expected future
net cash flows related to the asset, or the cost method, which is based
on, e.g., the replacement cost. Therefore, Management makes estimates
when determining the fair value of the acquired assets, liabilities and con-
tingent liabilities. Depending on the nature of the item, determining the
fair value can be associated with uncertainty and, potentially, be subject
to subsequent adjustment.
The fair value of the identifiable assets, liabilities and contingent liabilities
appears from note 40, Acquisition of subsidiaries and activities in 2016,
which also reflects the methods applied to determine the fair values of
the acquisitions made in 2016.
Investments in subsidiaries in the parent company financial statements
The assessment of the need for impairment write-down of investments
in subsidiaries requires the determination of values in use of the individual
subsidiaries. The determination of the value in use requires an estimate
of the expected future cash flows in each subsidiary as well as a deter-
mination of a reasonable discount rate. In connection with the valuation,
the same discount rate was used as in connection with the impairment
test for goodwill. Please see note 14. The tests performed show values
exceeding the carrying amount of the individual investments.
Notes
58 SP Group
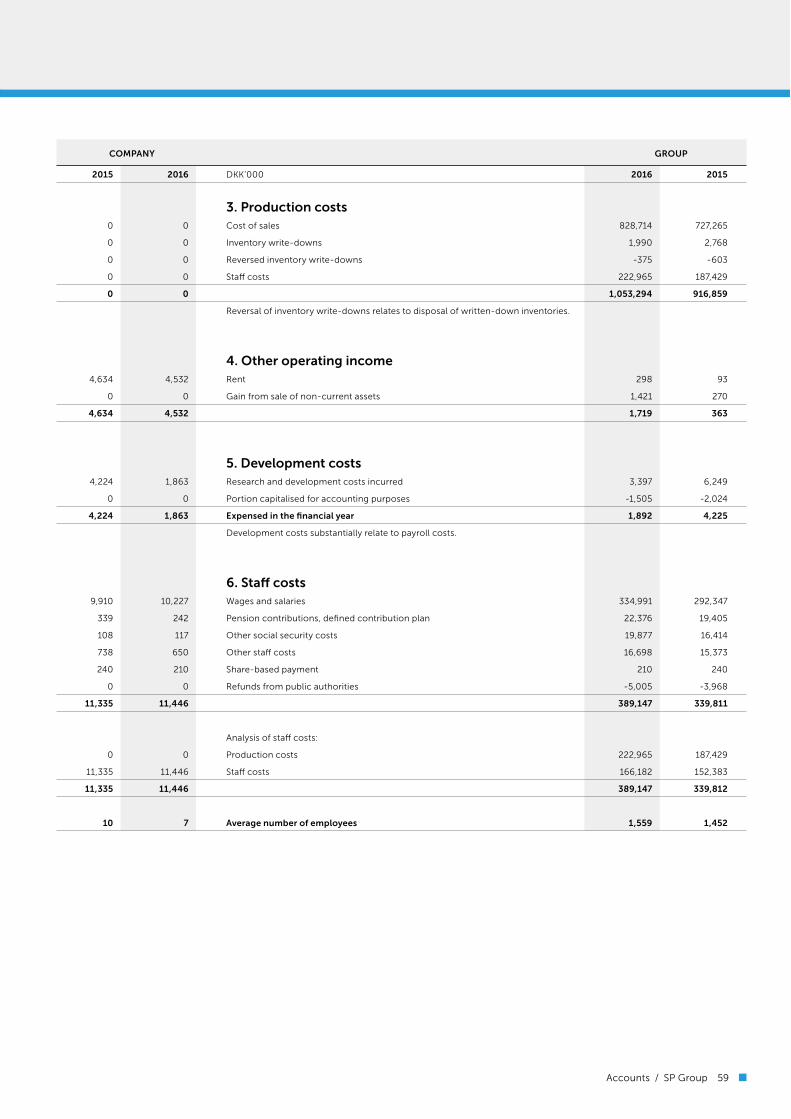
COMPANY GROUP
2015 2016 DKK’000 2016 2015
3. Production costs
0 0 Cost of sales 828,714 727,265
0 0 Inventory write-downs 1,990 2,768
0 0 Reversed inventory write-downs -375 -603
0 0 Sta; costs 222,965 187,429
0 0 1,053,294 916,859
Reversal of inventory write-downs relates to disposal of written-down inventories.
4. Other operating income
4,634 4,532 Rent 298 93
0 0 Gain from sale of non-current assets 1,421 270
4,634 4,532 1,719 363
5. Development costs
4,224 1,863 Research and development costs incurred 3,397 6,249
0 0 Portion capitalised for accounting purposes -1,505 -2,024
4,224 1,863 Expensed in the financial year 1,892 4,225
Development costs substantially relate to payroll costs.
6. Sta< costs
9,910 10,227 Wages and salaries 334,991 292,347
339 242 Pension contributions, defined contribution plan 22,376 19,405
108 117 Other social security costs 19,877 16,414
738 650 Other sta; costs 16,698 15,373
240 210 Share-based payment 210 240
0 0 Refunds from public authorities -5,005 -3,968
11,335 11,446 389,147 339,811
Analysis of sta; costs:
0 0 Production costs 222,965 187,429
11,335 11,446 Sta; costs 166,182 152,383
11,335 11,446 389,147 339,812
10 7 Average number of employees 1,559 1,452
Accounts / SP Group 59
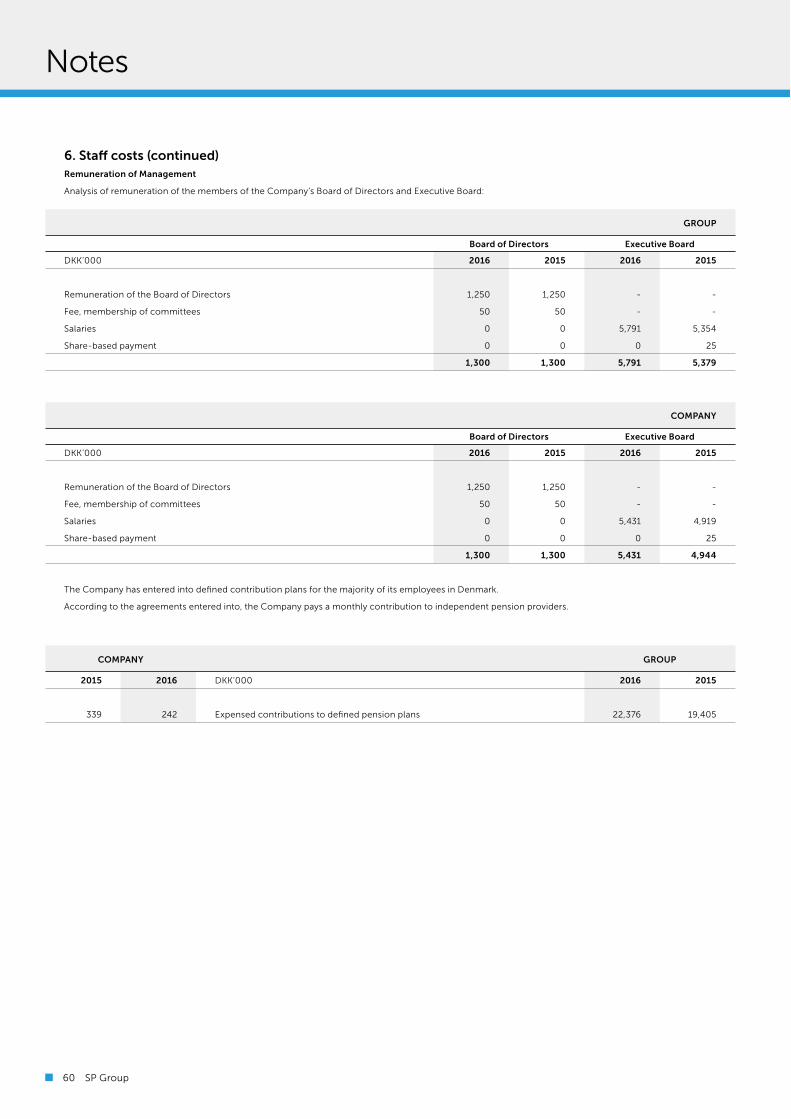
6. Sta< costs (continued)
Remuneration of Management
Analysis of remuneration of the members of the Company’s Board of Directors and Executive Board:
GROUP
Board of Directors Executive Board
DKK’000 2016 2015 2016 2015
Remuneration of the Board of Directors 1,250 1,250 - -
Fee, membership of committees 50 50 - -
Salaries 0 0 5,791 5,354
Share-based payment 0 0 0 25
1,300 1,300 5,791 5,379
COMPANY
Board of Directors Executive Board
DKK’000 2016 2015 2016 2015
Remuneration of the Board of Directors 1,250 1,250 - -
Fee, membership of committees 50 50 - -
Salaries 0 0 5,431 4,919
Share-based payment 0 0 0 25
1,300 1,300 5,431 4,944
The Company has entered into defined contribution plans for the majority of its employees in Denmark.
According to the agreements entered into, the Company pays a monthly contribution to independent pension providers.
COMPANY GROUP
2015 2016 DKK’000 2016 2015
339 242 Expensed contributions to defined pension plans 22,376 19,405
Notes
60 SP Group
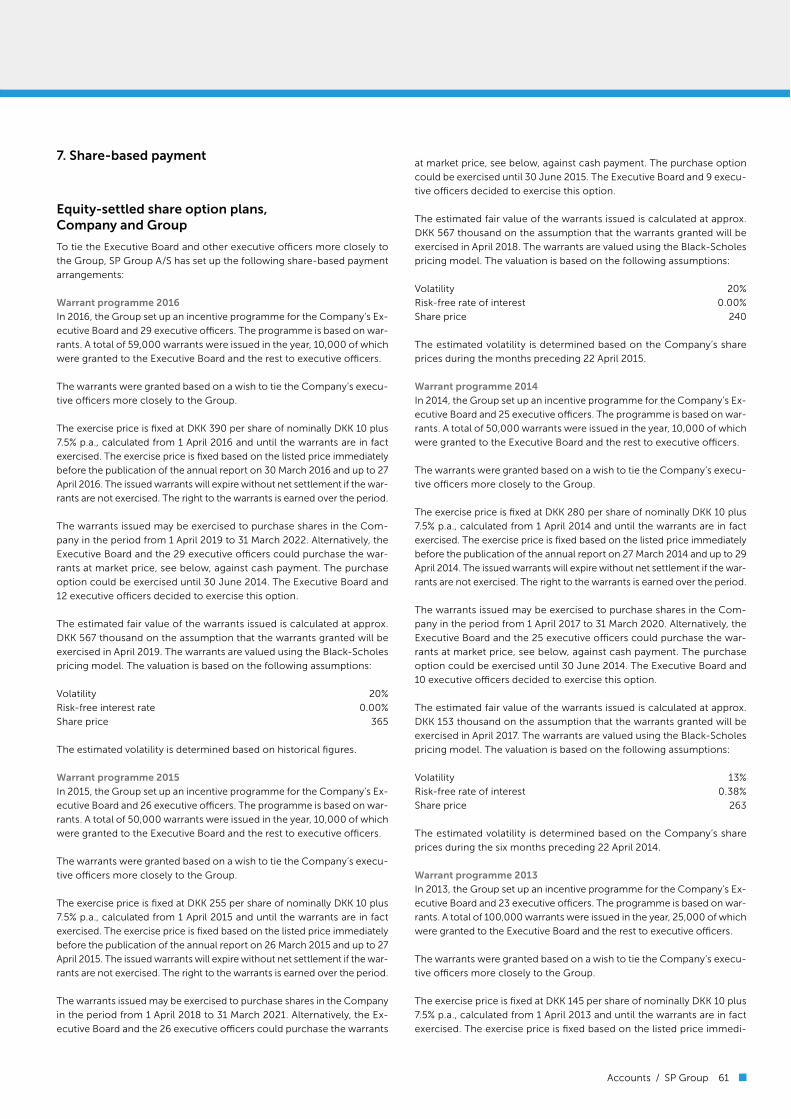
7. Share-based payment
Equity-settled share option plans,
Company and Group
To tie the Executive Board and other executive o&cers more closely to
the Group, SP Group A/S has set up the following share-based payment
arrangements:
Warrant programme 2016
In 2016, the Group set up an incentive programme for the Company’s Ex-
ecutive Board and 29 executive o&cers. The programme is based on war-
rants. A total of 59,000 warrants were issued in the year, 10,000 of which
were granted to the Executive Board and the rest to executive o&cers.
The warrants were granted based on a wish to tie the Company’s execu-
tive o&cers more closely to the Group.
The exercise price is fixed at DKK 390 per share of nominally DKK 10 plus
7.5% p.a., calculated from 1 April 2016 and until the warrants are in fact
exercised. The exercise price is fixed based on the listed price immediately
before the publication of the annual report on 30 March 2016 and up to 27
April 2016. The issued warrants will expire without net settlement if the war-
rants are not exercised. The right to the warrants is earned over the period.
The warrants issued may be exercised to purchase shares in the Com-
pany in the period from 1 April 2019 to 31 March 2022. Alternatively, the
Executive Board and the 29 executive o&cers could purchase the war-
rants at market price, see below, against cash payment. The purchase
option could be exercised until 30 June 2014. The Executive Board and
12 executive o&cers decided to exercise this option.
The estimated fair value of the warrants issued is calculated at approx.
DKK 567 thousand on the assumption that the warrants granted will be
exercised in April 2019. The warrants are valued using the Black-Scholes
pricing model. The valuation is based on the following assumptions:
Volatility 20%
Risk-free interest rate 0.00%
Share price 365
The estimated volatility is determined based on historical figures.
Warrant programme 2015
In 2015, the Group set up an incentive programme for the Company’s Ex-
ecutive Board and 26 executive o&cers. The programme is based on war-
rants. A total of 50,000 warrants were issued in the year, 10,000 of which
were granted to the Executive Board and the rest to executive o&cers.
The warrants were granted based on a wish to tie the Company’s execu-
tive o&cers more closely to the Group.
The exercise price is fixed at DKK 255 per share of nominally DKK 10 plus
7.5% p.a., calculated from 1 April 2015 and until the warrants are in fact
exercised. The exercise price is fixed based on the listed price immediately
before the publication of the annual report on 26 March 2015 and up to 27
April 2015. The issued warrants will expire without net settlement if the war-
rants are not exercised. The right to the warrants is earned over the period.
The warrants issued may be exercised to purchase shares in the Company
in the period from 1 April 2018 to 31 March 2021. Alternatively, the Ex-
ecutive Board and the 26 executive o&cers could purchase the warrants
at market price, see below, against cash payment. The purchase option
could be exercised until 30 June 2015. The Executive Board and 9 execu-
tive o&cers decided to exercise this option.
The estimated fair value of the warrants issued is calculated at approx.
DKK 567 thousand on the assumption that the warrants granted will be
exercised in April 2018. The warrants are valued using the Black-Scholes
pricing model. The valuation is based on the following assumptions:
Volatility 20%
Risk-free rate of interest 0.00%
Share price 240
The estimated volatility is determined based on the Company’s share
prices during the months preceding 22 April 2015.
Warrant programme 2014
In 2014, the Group set up an incentive programme for the Company’s Ex-
ecutive Board and 25 executive o&cers. The programme is based on war-
rants. A total of 50,000 warrants were issued in the year, 10,000 of which
were granted to the Executive Board and the rest to executive o&cers.
The warrants were granted based on a wish to tie the Company’s execu-
tive o&cers more closely to the Group.
The exercise price is fixed at DKK 280 per share of nominally DKK 10 plus
7.5% p.a., calculated from 1 April 2014 and until the warrants are in fact
exercised. The exercise price is fixed based on the listed price immediately
before the publication of the annual report on 27 March 2014 and up to 29
April 2014. The issued warrants will expire without net settlement if the war-
rants are not exercised. The right to the warrants is earned over the period.
The warrants issued may be exercised to purchase shares in the Com-
pany in the period from 1 April 2017 to 31 March 2020. Alternatively, the
Executive Board and the 25 executive o&cers could purchase the war-
rants at market price, see below, against cash payment. The purchase
option could be exercised until 30 June 2014. The Executive Board and
10 executive o&cers decided to exercise this option.
The estimated fair value of the warrants issued is calculated at approx.
DKK 153 thousand on the assumption that the warrants granted will be
exercised in April 2017. The warrants are valued using the Black-Scholes
pricing model. The valuation is based on the following assumptions:
Volatility 13%
Risk-free rate of interest 0.38%
Share price 263
The estimated volatility is determined based on the Company’s share
prices during the six months preceding 22 April 2014.
Warrant programme 2013
In 2013, the Group set up an incentive programme for the Company’s Ex-
ecutive Board and 23 executive o&cers. The programme is based on war-
rants. A total of 100,000 warrants were issued in the year, 25,000 of which
were granted to the Executive Board and the rest to executive o&cers.
The warrants were granted based on a wish to tie the Company’s execu-
tive o&cers more closely to the Group.
The exercise price is fixed at DKK 145 per share of nominally DKK 10 plus
7.5% p.a., calculated from 1 April 2013 and until the warrants are in fact
exercised. The exercise price is fixed based on the listed price immedi-
Accounts / SP Group 61

Development in the year
Analysis of the development in outstanding warrants:
Average Average
No. of No. of exercise price, exercise price,
warrants warrants warrants warrants
Number of shares 2016 2015 2016 2015
Outstanding warrants at 01/01 215,484 254,000 248 200
Granted in the financial year 59,000 50,000 484 317
Exercised in the financial year -102,484 -83,462 164 139
Expired/cancelled in the financial year 0 -5,054 - 149
172,000 215,484 373 248
Exercisable at 31/12 13,000 19,150
Of the outstanding warrants, 30,000 have been awarded to the Executive Board and 142,000 to executive o&cers.
The fair values of the warrants issued calculated at the grant date are recognised proportionally in the income statement as sta; costs over the period up to
the exercise date.
COMPANY GROUP
2015 2016 DKK’000 2016 2015
Equity-settled share option plans
Share-based payment recognised in the income statement,
240 210 equity-settled share option plan 210 240
Notes
ately before and after the publication of the annual report on 22 March
2013 and up to 18 April 2013. The issued warrants will expire without net
settlement if the warrants are not exercised. The right to the warrants is
earned over the period.
The warrants issued may be exercised to purchase shares in the Company
in the period from 1 April 2016 to 31 March 2019. Alternatively, the Ex-
ecutive Board and the 23 executive o&cers could purchase the warrants
at market price, see below, against cash payment. The purchase option
could be exercised until 19 June 2013. The Executive Board and two
executive o&cers decided to exercise this option.
The estimated fair value of the warrants issued is calculated at approx.
DKK 603 thousand on the assumption that the warrants granted will be
exercised in April 2016. The warrants are valued using the Black-Scholes
pricing model. The valuation is based on the following assumptions:
Volatility 19%
Risk-free rate of interest 0.13%
Share price 138
The estimated volatility is determined based on the Company’s share
prices during the six months preceding 22 March 2013.
Warrant programme 2012
In 2012, the Group set up an incentive programme for the Company’s Ex-
ecutive Board and 22 executive o&cers. The programme is based on war-
rants. A total of 100,000 warrants were issued in the year, 30,000 of which
were granted to the Executive Board and the rest to executive o&cers.
The warrants were granted based on a wish to tie the Company’s execu-
tive o&cers more closely to the Group.
The exercise price is fixed at DKK 120 per share of nominally DKK 10 plus
7.5% p.a., calculated from 1 April 2012 and until the warrants can be exer-
cised at the earliest. The exercise prise is fixed based on the listed price im-
mediately before and after the publication of the annual report on 28 March
2012. The issued warrants will expire without net settlement if the warrants
are not exercised. The right to the warrants is earned over the period.
The warrants issued may be exercised to purchase shares in the Company
in the period from 1 April 2015 to 31 March 2018. Alternatively, the Ex-
ecutive Board and the 22 executive o&cers could purchase the warrants
at market price, see below, against cash payment. The purchase option
could be exercised until 29 May 2012. CEO Frank Gad chose to exercise
the option.
The estimated fair value of the warrants issued is calculated at approx.
DKK 752 thousand on the assumption that the warrants granted will be
exercised in April 2015. The warrants are valued using the Black-Scholes
pricing model. The valuation is based on the following assumptions:
Volatility 31%
Risk-free rate of interest 0.51%
Share price 102
The estimated volatility is determined based on the Company’s share
prices during the six months preceding 30 March 2012.
62 SP Group

COMPANY GROUP
2015 2016 DKK’000 2016 2015
8. Amortisation, depreciation and impairment losses
132 78 Amortisation of intangible assets 8,260 10,426
0 0 Impairment losses in respect of intangible assets 0 5,017
3,077 3,231 Depreciation of property, plant and equipment 61,182 56,568
3,209 3,309 69,442 72,011
9. Dividends from subsidiaries
26,231 29,779 Dividends from subsidiaries - -
26,231 29,779 - -
10. Other financial income
16,398 1,124 Interest, etc. 865 639
587 415 Interest, subsidiaries - -
Interest income from financial assets
16,985 1,539 not measured at fair value through profit/loss 865 639
0 0 Exchange rate adjustments 876 3,042
16,985 1,539 1,741 3,681
11. Financial expenses
3,786 3,514 Interest, etc. 11,318 12,678
1,125 1,222 Value adjustment of hedging transactions 1,222 1,125
1,097 1,114 Interest, group entities - -
Interest expenses on financial liabilities
6,008 5,850 not measured at fair value through profit/loss 12,540 13,803
10,429 2,456 Write-down of investments in subsidiary - -
4,452 753 Exchange rate adjustments 0 0
20,889 9,059 12,540 13,803
Accounts / SP Group 63

COMPANY GROUP
2015 2016 DKK’000 2016 2015
12. Tax for the year
0 0 Current tax 24,204 17,280
-356 -2,988 Changes in deferred tax 5,025 2,263
-356 -2,988 29,229 19,543
The current income tax charge for the financial year is calculated based on
a tax rate of 22.0% (2015: 23.5%) for Danish entities. As regards foreign entities,
the current tax rate in the country in question is used.
Tax on other comprehensive income
Fair value adjustment of financial instruments held to
185 217 hedge future cash flows -4,192 3,442
185 217 -4,192 3,442
Analysis of tax on items recognised in other comprehensive income:
0 0 Current tax -1,716 0
185 217 Changes in deferred tax -2,476 3,442
185 217 -4,192 3,442
Reconciliation of tax rate
- - Danish corporate income tax rate 22.0 23.5
- - E;ect of di;erences in tax rates for foreign entities 2.1 0.7
- - E;ect of changed corporate income tax rate in Denmark -0.3 0.0
- - E<ective tax rate for the year 23.8 24.2
The Company’s tax rate in both 2016 and 2015 is materially a;ected by
tax-exempt dividends from subsidiaries.
Analysis of the estimated current tax charge for the year:
Denmark 3,000 500
Poland 6,683 5,891
USA 5,138 4,615
China 2,262 1,549
Latvia 234 0
Slovakia 1,219 472
Sweden 2,632 862
The Netherlands 1,572 1,775
Brazil 1,464 1,616
24,204 17,280
The current tax in Denmark is a;ected be the application of tax loss carry-forwards,
in particular from 2004, 2008 and 2009. Reference is made to note 25.
Notes
64 SP Group

GROUP
DKK’000 2016 2015
13. Earnings per share
The calculation of earnings per share is based on the following:
Profit attributable to the Company’s shareholders 92,420 60,584
Number of shares 2016 2015
Average number of shares issued 2,242,000 2,124,000
Average number of treasury shares issued -34,589 -33,406
Number of shares used to calculate earnings per share 2,207,411 2,090,594
Average dilution e<ect of outstanding warrants 84,374 73,266
Number of shares used to calculate diluted earnings per share 2,291,785 2,163,860
Accounts / SP Group 65
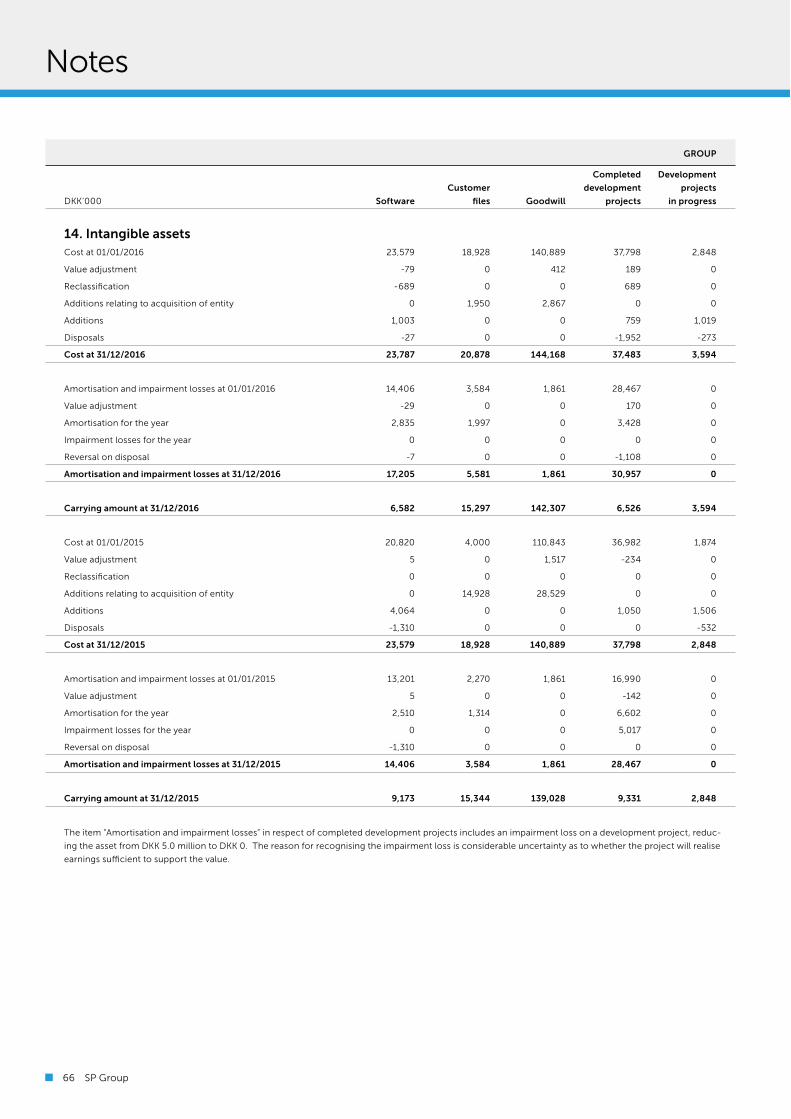
GROUP
Completed Development
Customer development projects
DKK’000 Software files Goodwill projects in progress
14. Intangible assets
Cost at 01/01/2016 23,579 18,928 140,889 37,798 2,848
Value adjustment -79 0 412 189 0
Reclassification -689 0 0 689 0
Additions relating to acquisition of entity 0 1,950 2,867 0 0
Additions 1,003 0 0 759 1,019
Disposals -27 0 0 -1,952 -273
Cost at 31/12/2016 23,787 20,878 144,168 37,483 3,594
Amortisation and impairment losses at 01/01/2016 14,406 3,584 1,861 28,467 0
Value adjustment -29 0 0 170 0
Amortisation for the year 2,835 1,997 0 3,428 0
Impairment losses for the year 0 0 0 0 0
Reversal on disposal -7 0 0 -1,108 0
Amortisation and impairment losses at 31/12/2016 17,205 5,581 1,861 30,957 0
Carrying amount at 31/12/2016 6,582 15,297 142,307 6,526 3,594
Cost at 01/01/2015 20,820 4,000 110,843 36,982 1,874
Value adjustment 5 0 1,517 -234 0
Reclassification 0 0 0 0 0
Additions relating to acquisition of entity 0 14,928 28,529 0 0
Additions 4,064 0 0 1,050 1,506
Disposals -1,310 0 0 0 -532
Cost at 31/12/2015 23,579 18,928 140,889 37,798 2,848
Amortisation and impairment losses at 01/01/2015 13,201 2,270 1,861 16,990 0
Value adjustment 5 0 0 -142 0
Amortisation for the year 2,510 1,314 0 6,602 0
Impairment losses for the year 0 0 0 5,017 0
Reversal on disposal -1,310 0 0 0 0
Amortisation and impairment losses at 31/12/2015 14,406 3,584 1,861 28,467 0
Carrying amount at 31/12/2015 9,173 15,344 139,028 9,331 2,848
The item “Amortisation and impairment losses” in respect of completed development projects includes an impairment loss on a development project, reduc-
ing the asset from DKK 5.0 million to DKK 0. The reason for recognising the impairment loss is considerable uncertainty as to whether the project will realise
earnings su&cient to support the value.
Notes
66 SP Group

COMPANY
Software Software
DKK’000 2016 2015
14. Intangible assets (continued)
Cost at 01/01 1,052 989
Additions 0 63
Disposals 0 0
Cost at 31/12 1,052 1,052
Amortisation and impairment losses at 01/01 946 814
Amortisation for the year 78 132
Reversal in connection with disposals 0 0
Amortisation and impairment losses at 31/12 1,024 946
Carrying amount at 31/12 28 106
Goodwill
Goodwill arising from business acquisitions, etc., is distributed at the acquisition date to the cash-generating
units which are expected to obtain financial benefits from the business combination.
The carrying amount of goodwill is distributed as follows by cash-generating units:
GROUP
DKK’000 2016 2015
Coatings 9,823 9,823
Plastics (excl. Ulstrup Plast A/S) 105,828 102,549
Plastics (Ulstrup Plast A/S) 26,656 26,656
142,307 139,028
Accounts / SP Group 67

14. Intangible assets (continued)
Goodwill
Goodwill is tested for impairment at least annually and if there is otherwise evidence of impairment. The annual impairment test is usually performed at 31
December.
No impairment losses were recognised in respect of goodwill in 2016 or 2015.
The recoverable amount of the cash-generating units to which the goodwill amounts relate is calculated on the basis of a calculation of value in use. In this
relation, the most significant uncertainties are attributable to the determination of discount factors and growth rates as well as the expectations as to sales in an
unstable market.
The discount factors determined reflect the market assessments of the time value of money expressed as a risk-free interest rate and the specific risks related to
the cash-generating unit.
The fixed sales prices, production costs and growth rates are based on historical experience as well as expectations as to future market changes. Revenue from
the segments is broken down by several industries and is therefore not particularly dependent on sectors or individual customers.
The calculation of the value in use is based on the cash flows stated in the most recent budget for 2017, approved by Management, and forecasts for 2018 and
2019. For financial years after the forecast period, cash flows have been extrapolated for the most recent forecast periods, adjusted for an expected growth rate.
The most significant parameters applied in calculating recoverable amounts are as follows:
2016 2015
Discount rate after tax 7.5% 7.5%
Discount rate before tax 9.0% 9.0%
Growth rate in the terminal period 2.0% 2.0%
The above parameters have been used for all three cash-generating units, as it is assessed that there are no material di;erences in the parameters a;ecting the
value in use in the individual cash-generating units.
Other intangible assets
Apart from goodwill, all intangible assets are considered to have definite useful lives over which the assets are amortised; see the description of accounting
policies.
Notes
68 SP Group

GROUP
Property, plant
Plant Fixtures, and equipment
Land and and fittings, tools Leasehold under
DKK’000 buildings equpiment and equipment improvements construction
15. Property, plant and equipment
Cost at 01/01/2016 224,984 764,510 92,640 30,275 15,993
Value adjustment 135 -8,059 -379 -937 -282
Additions relating to acquisition of entity 9,011 22,623 2,474 19 1,811
Additions 16,028 65,700 9,320 3,337 34,284
Disposals -57,253 -2,388 -693 -21,634
Cost at 31/12/2016 250,158 787,521 101,667 32,001 30,172
Depreciation and impairment losses at 01/01/2016 96,154 490,917 70,560 18,701 0
Value adjustment 0 -5,747 -240 -613 0
Depreciation for the year 6,743 44,642 7,221 2,576 0
Reversal on disposal 0 -13,128 -2,143 -610 0
Depreciation and impairment losses at 31/12/2016 102,897 516,684 75,398 20,054 0
Carrying amount at 31/12/2016 147,261 270,837 26,269 11,947 30,172
Portion relating to assets held under finance leases at 31/12/2016 0 44,685 274 0 0
Cost at 01/01/2015 217,907 696,156 85,635 27,691 23,298
Value adjustment 0 3,433 418 679 21
Additions relating to acquisition of entity 0 8,031 1,137 1,168 0
Additions 7,100 64,178 8,549 737 23,544
Disposals -23 -7,288 -3,099 0 -30,870
Cost at 31/12/2015 224,984 764,510 92,640 30,275 15,993
Depreciation and impairment losses at 01/01/2015 89,865 451,740 65,912 15,805 0
Value adjustment 0 1,717 235 465 0
Depreciation for the year 6,300 40,922 6,915 2,431 0
Reversal on disposal -11 -3,462 -2,502 0 0
Depreciation and impairment losses at 31/12/2015 96,154 490,917 70,560 18,701 0
Carrying amount at 31/12/2015 128,830 273,593 22,080 11,574 15,993
Portion relating to assets held under finance leases at 31/12/2015 0 77,503 227 0 0
Accounts / SP Group 69

COMPANY
Fixtures,
Land and fittings, tools
DKK’000 buildings and equipment
15. Property, plant and equipment
Cost at 01/01/2016 83,905 3,822
Additions 15,299 256
Disposals 0 0
Cost at 31/12/2016 99,204 4,078
Depreciation and impairment losses at 01/01/2016 16,210 3,227
Depreciation for the year 2,762 469
Reversal on disposal 0 0
Depreciation and impairment losses at 31/12/2016 18,972 3,696
Carrying amount at 31/12/2016 80,232 382
Portion relating to assets held under finance leases at 31/12/2016 0 0
Cost at 01/01/2015 81,438 3,637
Additions 2,467 185
Disposals 0 0
Cost at 31/12/2015 83,905 3,822
Depreciation and impairment losses at 01/01/2015 13,849 2,511
Depreciation for the year 2,361 716
Reversal on disposal 0 0
Depreciation and impairment losses at 31/12/2015 16,210 3,227
Carrying amount at 31/12/2015 67,695 595
Portion relating to assets held under finance leases at 31/12/2015 0 117
Notes
70 SP Group
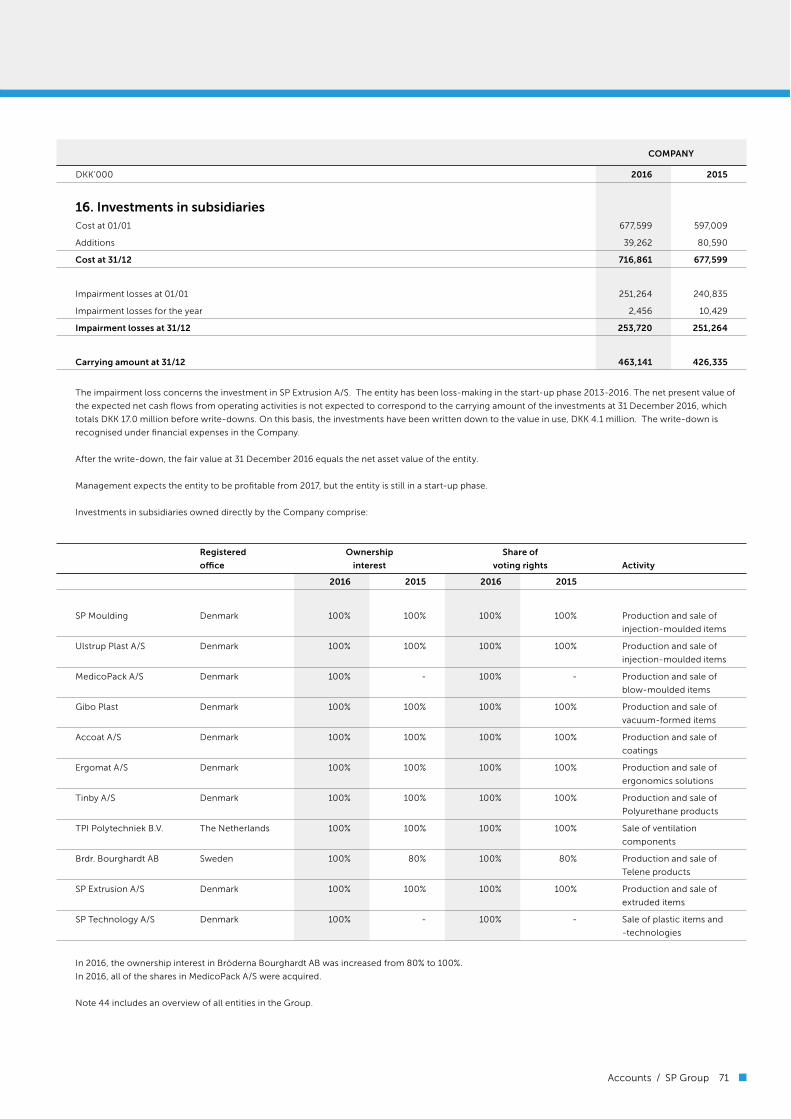
COMPANY
DKK’000 2016 2015
16. Investments in subsidiaries
Cost at 01/01 677,599 597,009
Additions 39,262 80,590
Cost at 31/12 716,861 677,599
Impairment losses at 01/01 251,264 240,835
Impairment losses for the year 2,456 10,429
Impairment losses at 31/12 253,720 251,264
Carrying amount at 31/12 463,141 426,335
The impairment loss concerns the investment in SP Extrusion A/S. The entity has been loss-making in the start-up phase 2013-2016. The net present value of
the expected net cash flows from operating activities is not expected to correspond to the carrying amount of the investments at 31 December 2016, which
totals DKK 17.0 million before write-downs. On this basis, the investments have been written down to the value in use, DKK 4.1 million. The write-down is
recognised under financial expenses in the Company.
After the write-down, the fair value at 31 December 2016 equals the net asset value of the entity.
Management expects the entity to be profitable from 2017, but the entity is still in a start-up phase.
Investments in subsidiaries owned directly by the Company comprise:
Registered Ownership Share of
o$ce interest voting rights Activity
2016 2015 2016 2015
SP Moulding Denmark 100% 100% 100% 100% Production and sale of
injection-moulded items
Ulstrup Plast A/S Denmark 100% 100% 100% 100% Production and sale of
injection-moulded items
MedicoPack A/S Denmark 100% - 100% - Production and sale of
blow-moulded items
Gibo Plast Denmark 100% 100% 100% 100% Production and sale of
vacuum-formed items
Accoat A/S Denmark 100% 100% 100% 100% Production and sale of
coatings
Ergomat A/S Denmark 100% 100% 100% 100% Production and sale of
ergonomics solutions
Tinby A/S Denmark 100% 100% 100% 100% Production and sale of
Polyurethane products
TPI Polytechniek B.V. The Netherlands 100% 100% 100% 100% Sale of ventilation
components
Brdr. Bourghardt AB Sweden 100% 80% 100% 80% Production and sale of
Telene products
SP Extrusion A/S Denmark 100% 100% 100% 100% Production and sale of
extruded items
SP Technology A/S Denmark 100% - 100% - Sale of plastic items and
-technologies
In 2016, the ownership interest in Bröderna Bourghardt AB was increased from 80% to 100%.
In 2016, all of the shares in MedicoPack A/S were acquired.
Note 44 includes an overview of all entities in the Group.
Accounts / SP Group 71
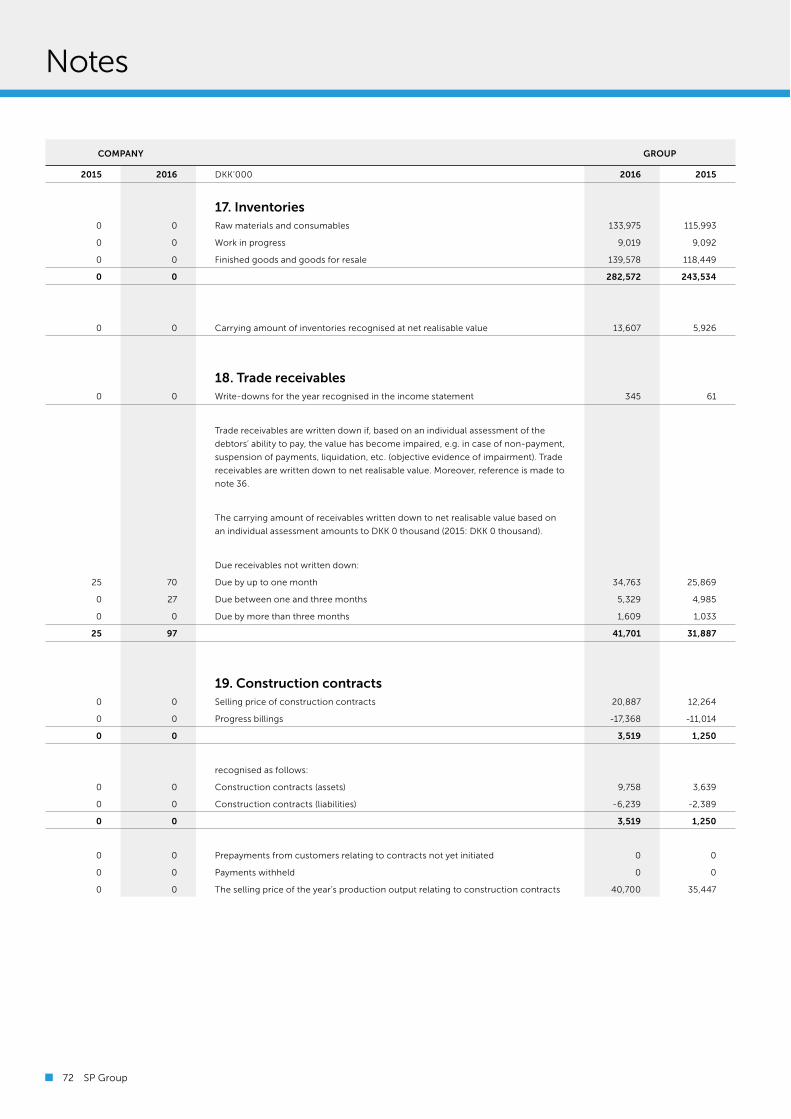
COMPANY GROUP
2015 2016 DKK’000 2016 2015
17. Inventories
0 0 Raw materials and consumables 133,975 115,993
0 0 Work in progress 9,019 9,092
0 0 Finished goods and goods for resale 139,578 118,449
0 0 282,572 243,534
0 0 Carrying amount of inventories recognised at net realisable value 13,607 5,926
18. Trade receivables
0 0 Write-downs for the year recognised in the income statement 345 61
Trade receivables are written down if, based on an individual assessment of the
debtors’ ability to pay, the value has become impaired, e.g. in case of non-payment,
suspension of payments, liquidation, etc. (objective evidence of impairment). Trade
receivables are written down to net realisable value. Moreover, reference is made to
note 36.
The carrying amount of receivables written down to net realisable value based on
an individual assessment amounts to DKK 0 thousand (2015: DKK 0 thousand).
Due receivables not written down:
25 70 Due by up to one month 34,763 25,869
0 27 Due between one and three months 5,329 4,985
0 0 Due by more than three months 1,609 1,033
25 97 41,701 31,887
19. Construction contracts
0 0 Selling price of construction contracts 20,887 12,264
0 0 Progress billings -17,368 -11,014
0 0 3,519 1,250
recognised as follows:
0 0 Construction contracts (assets) 9,758 3,639
0 0 Construction contracts (liabilities) -6,239 -2,389
0 0 3,519 1,250
0 0 Prepayments from customers relating to contracts not yet initiated 0 0
0 0 Payments withheld 0 0
0 0 The selling price of the year’s production output relating to construction contracts 40,700 35,447
Notes
72 SP Group
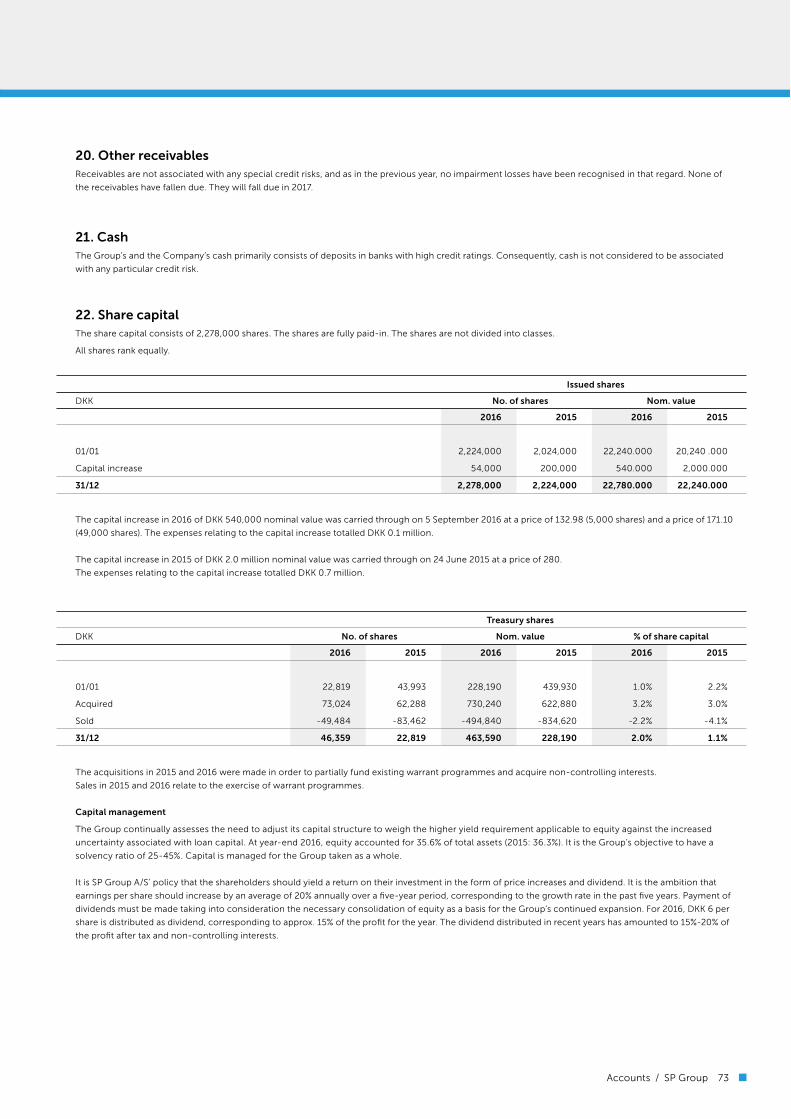
20. Other receivables
Receivables are not associated with any special credit risks, and as in the previous year, no impairment losses have been recognised in that regard. None of
the receivables have fallen due. They will fall due in 2017.
21. Cash
The Group’s and the Company’s cash primarily consists of deposits in banks with high credit ratings. Consequently, cash is not considered to be associated
with any particular credit risk.
22. Share capital
The share capital consists of 2,278,000 shares. The shares are fully paid-in. The shares are not divided into classes.
All shares rank equally.
Issued shares
DKK No. of shares Nom. value
2016 2015 2016 2015
01/01 2,224,000 2,024,000 22,240.000 20,240 .000
Capital increase 54,000 200,000 540.000 2,000.000
31/12 2,278,000 2,224,000 22,780.000 22,240.000
The capital increase in 2016 of DKK 540,000 nominal value was carried through on 5 September 2016 at a price of 132.98 (5,000 shares) and a price of 171.10
(49,000 shares). The expenses relating to the capital increase totalled DKK 0.1 million.
The capital increase in 2015 of DKK 2.0 million nominal value was carried through on 24 June 2015 at a price of 280.
The expenses relating to the capital increase totalled DKK 0.7 million.
Treasury shares
DKK No. of shares Nom. value % of share capital
2016 2015 2016 2015 2016 2015
01/01 22,819 43,993 228,190 439,930 1.0% 2.2%
Acquired 73,024 62,288 730,240 622,880 3.2% 3.0%
Sold -49,484 -83,462 -494,840 -834,620 -2.2% -4.1%
31/12 46,359 22,819 463,590 228,190 2.0% 1.1%
The acquisitions in 2015 and 2016 were made in order to partially fund existing warrant programmes and acquire non-controlling interests.
Sales in 2015 and 2016 relate to the exercise of warrant programmes.
Capital management
The Group continually assesses the need to adjust its capital structure to weigh the higher yield requirement applicable to equity against the increased
uncertainty associated with loan capital. At year-end 2016, equity accounted for 35.6% of total assets (2015: 36.3%). It is the Group’s objective to have a
solvency ratio of 25-45%. Capital is managed for the Group taken as a whole.
It is SP Group A/S’ policy that the shareholders should yield a return on their investment in the form of price increases and dividend. It is the ambition that
earnings per share should increase by an average of 20% annually over a five-year period, corresponding to the growth rate in the past five years. Payment of
dividends must be made taking into consideration the necessary consolidation of equity as a basis for the Group’s continued expansion. For 2016, DKK 6 per
share is distributed as dividend, corresponding to approx. 15% of the profit for the year. The dividend distributed in recent years has amounted to 15%-20% of
the profit after tax and non-controlling interests.
Accounts / SP Group 73

GROUP
Reserve Reserve Reserve
for for for
exchange share- hedging
rate based trans-
DKK’000 adjustments payment actions Total
23. Other reserves
Reserve at 01/01/2015 3,579 1,288 -3,145 1,722
Exchange rate adjustment relating to foreign entities 5,611 0 0 5,611
Recognition of share-based payment 0 240 0 240
Share-based payment, exercised arrangements 0 -758 0 -758
Sale of warrants 0 272 0 272
Value adjustments of financial instruments
held to hedge future cash flows, net 0 0 14,353 14,353
Reserve at 31/12/2015 9,190 1,042 11,208 21,440
Exchange rate adjustment relating to foreign entities -4,805 0 0 -4,805
Recognition of share-based payment 0 210 0 210
Share-based payment, exercised arrangements 0 -603 0 -603
Sale of warrants 0 269 0 269
Value adjustments of financial instruments 0
held to hedge future cash flows, net 0 0 -18,051 -18,051
Reserve at 31/12/2016 4,385 918 -6,843 -1,540
COMPANY
Reserve Reserve
for for
share- hedging
based trans-
DKK’000 payment actions Total
Reserve at 01/01/2015 1,288 -1,270 18
Recognition of share-based payment 240 0 240
Share-based payment, exercised arrangements -758 0 -758
Sale of warrants 272 0 272
Value adjustments of financial instruments
held to hedge future cash flows, net 0 505 505
Reserve at 31/12/2015 1,042 -765 277
Recognition of share-based payment 210 0 210
Share-based payment, exercised arrangements -603 0 -603
Sale of warrants 269 0 269
Value adjustments of financial instruments
held to hedge future cash flows, net 0 700 700
Reserve at 31/12/2016 918 -65 853
The reserve for exchange rate adjustments comprises all exchange rate adjustments arising from the translation of financial statements of entities with a
functional currency other than DKK.
The reserve for share-based payment comprises the accumulated value of the earned right to share option plans (equity-settled share option plans) meas-
ured at the fair value of the equity instruments at the grant date and recognised over the vesting period. The reserve is dissolved as the employees exercise
the earned right to acquire shares or as the options expire without having been exercised.
The hedging reserve comprises the accumulated net change in the fair value of hedging transactions that qualify for designation as hedges of future cash
flows where the hedged transaction has not yet been realised.
Notes
74 SP Group
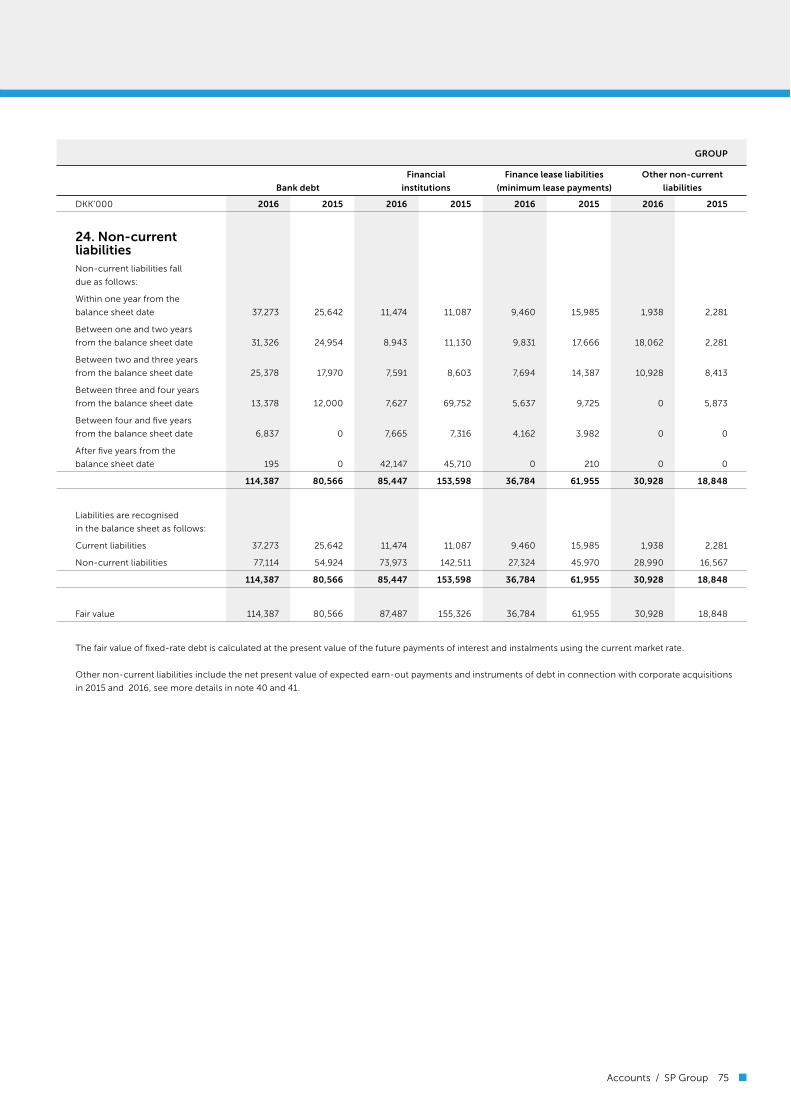
GROUP
Financial Finance lease liabilities Other non-current
Bank debt institutions (minimum lease payments) liabilities
DKK’000 2016 2015 2016 2015 2016 2015 2016 2015
24. Non-current liabilities
Non-current liabilities fall
due as follows:
Within one year from the
balance sheet date 37,273 25,642 11,474 11,087 9,460 15,985 1,938 2,281
Between one and two years
from the balance sheet date 31,326 24,954 8,943 11,130 9,831 17,666 18,062 2,281
Between two and three years
from the balance sheet date 25,378 17,970 7,591 8,603 7,694 14,387 10,928 8,413
Between three and four years
from the balance sheet date 13,378 12,000 7,627 69,752 5,637 9,725 0 5,873
Between four and five years
from the balance sheet date 6,837 0 7,665 7,316 4,162 3,982 0 0
After five years from the
balance sheet date 195 0 42,147 45,710 0 210 0 0
114,387 80,566 85,447 153,598 36,784 61,955 30,928 18,848
Liabilities are recognised
in the balance sheet as follows:
Current liabilities 37,273 25,642 11,474 11,087 9,460 15,985 1,938 2,281
Non-current liabilities 77,114 54,924 73,973 142,511 27,324 45,970 28,990 16,567
114,387 80,566 85,447 153,598 36,784 61,955 30,928 18,848
Fair value 114,387 80,566 87,487 155,326 36,784 61,955 30,928 18,848
The fair value of fixed-rate debt is calculated at the present value of the future payments of interest and instalments using the current market rate.
Other non-current liabilities include the net present value of expected earn-out payments and instruments of debt in connection with corporate acquisitions
in 2015 and 2016, see more details in note 40 and 41.
Accounts / SP Group 75
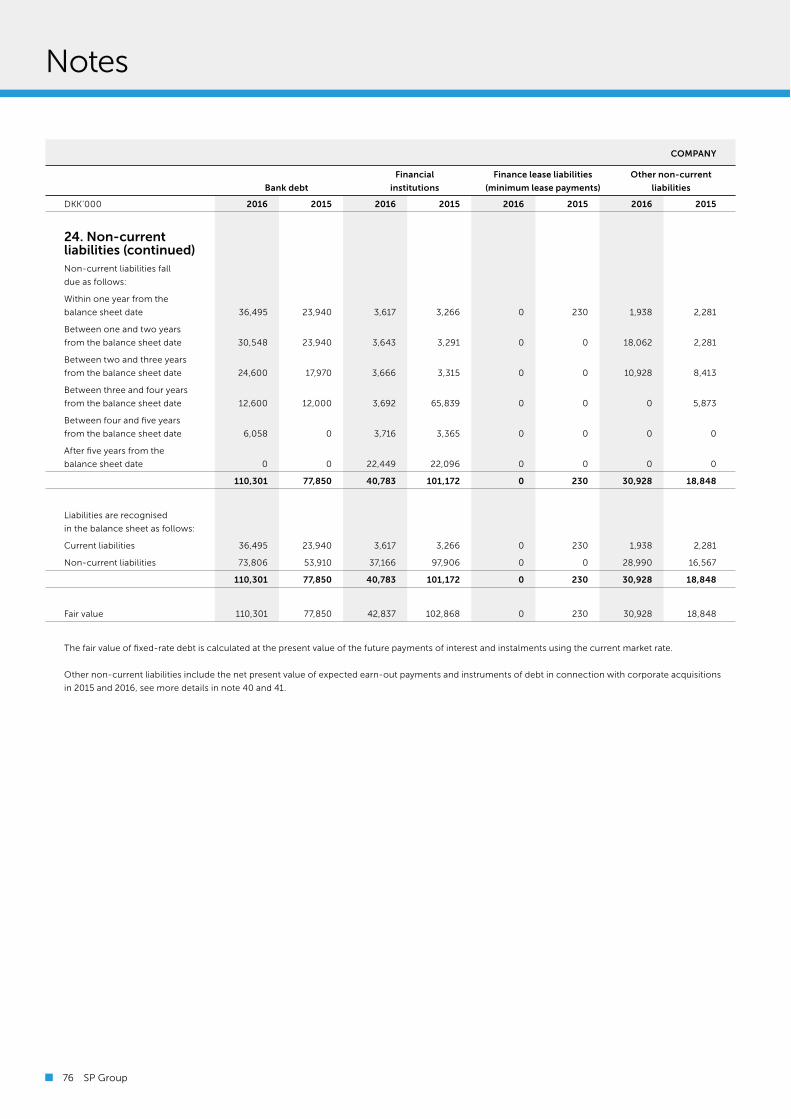
Notes
COMPANY
Financial Finance lease liabilities Other non-current
Bank debt institutions (minimum lease payments) liabilities
DKK’000 2016 2015 2016 2015 2016 2015 2016 2015
24. Non-current liabilities (continued)
Non-current liabilities fall
due as follows:
Within one year from the
balance sheet date 36,495 23,940 3,617 3,266 0 230 1,938 2,281
Between one and two years
from the balance sheet date 30,548 23,940 3,643 3,291 0 0 18,062 2,281
Between two and three years
from the balance sheet date 24,600 17,970 3,666 3,315 0 0 10,928 8,413
Between three and four years
from the balance sheet date 12,600 12,000 3,692 65,839 0 0 0 5,873
Between four and five years
from the balance sheet date 6,058 0 3,716 3,365 0 0 0 0
After five years from the
balance sheet date 0 0 22,449 22,096 0 0 0 0
110,301 77,850 40,783 101,172 0 230 30,928 18,848
Liabilities are recognised
in the balance sheet as follows:
Current liabilities 36,495 23,940 3,617 3,266 0 230 1,938 2,281
Non-current liabilities 73,806 53,910 37,166 97,906 0 0 28,990 16,567
110,301 77,850 40,783 101,172 0 230 30,928 18,848
Fair value 110,301 77,850 42,837 102,868 0 230 30,928 18,848
The fair value of fixed-rate debt is calculated at the present value of the future payments of interest and instalments using the current market rate.
Other non-current liabilities include the net present value of expected earn-out payments and instruments of debt in connection with corporate acquisitions
in 2015 and 2016, see more details in note 40 and 41.
76 SP Group

COMPANY GROUP
Deferred Deferred Deferred Deferred
tax tax tax tax
assets liabilities DKK’000 assets liabilities
25. Deferred tax
9,872 0 Deferred tax at 01/01/2015 4,246 13,019
0 0 Foreign exchange adjustment 221 140
0 0 Acquisition of entity 589 3,426
0 0 Other adjustments, reclassification of tax payable at 01/01 -60 -60
356 0 Change in deferred tax recognised in the income statement -1,045 1,218
-185 0 Change in deferred tax recognised in other comprehensive income -159 3,283
1,629 0 Change in deferred tax recognised in equity 0 -1,629
-4,188 0 Transfer, subsidiaries 0 0
7,484 0 Deferred tax at 31/12/2015 3,792 19,397
0 0 Foreign exchange adjustment -103 -35
0 0 Acquisition of entity 3,428 855
0 0 Other adjustments, reclassification of tax payable at 01/01 643 643
2,988 0 Change in deferred tax recognised in the income statement -1,195 3,829
-217 0 Change in deferred tax recognised in other comprehensive income 1,398 -1,078
2,684 0 Change in deferred tax recognised in equity 0 -2,684
-10,068 0 Transfer, subsidiaries 0 0
2,871 0 Deferred tax at 31/12/2016 7,963 20,927
COMPANY GROUP
2015 2016 DKK’000 2016 2015
Deferred tax is recognised in the balance sheet as follows:
7,484 2,871 Deferred tax assets 7,963 3,792
0 0 Deferred tax liabilities -20,927 -19,397
7,484 2,871 -12,964 -15,605
The Group’s tax assets primarily relate to tax losses in SP Moulding (Suzhou) Co. Ltd. in China and excess values for tax purposes in a few Polish, Swedish and
Slovakian subsidiaries. The tax asset is expected to be utilised within three years.
Accounts / SP Group 77
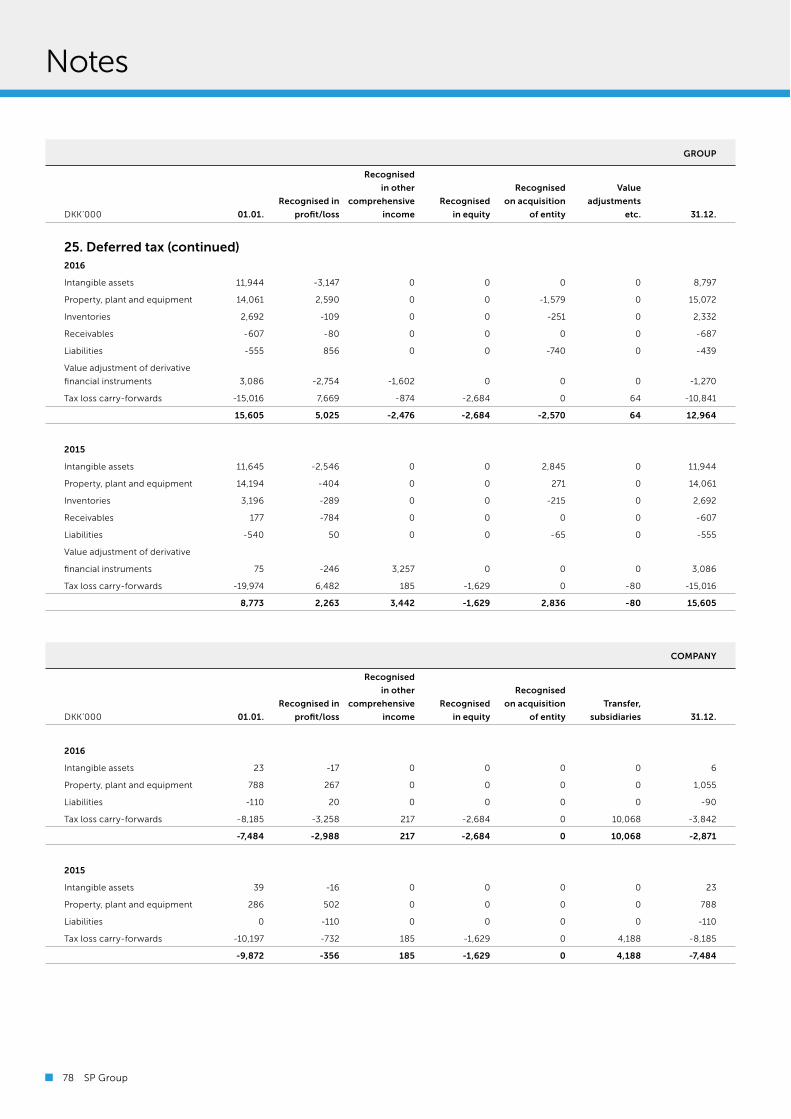
Notes
GROUP
Recognised
in other Recognised Value
Recognised in comprehensive Recognised on acquisition adjustments
DKK’000 01.01. profit/loss income in equity of entity etc. 31.12.
25. Deferred tax (continued)
2016
Intangible assets 11,944 -3,147 0 0 0 0 8,797
Property, plant and equipment 14,061 2,590 0 0 -1,579 0 15,072
Inventories 2,692 -109 0 0 -251 0 2,332
Receivables -607 -80 0 0 0 0 -687
Liabilities -555 856 0 0 -740 0 -439
Value adjustment of derivative
financial instruments 3,086 -2,754 -1,602 0 0 0 -1,270
Tax loss carry-forwards -15,016 7,669 -874 -2,684 0 64 -10,841
15,605 5,025 -2,476 -2,684 -2,570 64 12,964
2015
Intangible assets 11,645 -2,546 0 0 2,845 0 11,944
Property, plant and equipment 14,194 -404 0 0 271 0 14,061
Inventories 3,196 -289 0 0 -215 0 2,692
Receivables 177 -784 0 0 0 0 -607
Liabilities -540 50 0 0 -65 0 -555
Value adjustment of derivative
financial instruments 75 -246 3,257 0 0 0 3,086
Tax loss carry-forwards -19,974 6,482 185 -1,629 0 -80 -15,016
8,773 2,263 3,442 -1,629 2,836 -80 15,605
COMPANY
Recognised
in other Recognised
Recognised in comprehensive Recognised on acquisition Transfer,
DKK’000 01.01. profit/loss income in equity of entity subsidiaries 31.12.
2016
Intangible assets 23 -17 0 0 0 0 6
Property, plant and equipment 788 267 0 0 0 0 1,055
Liabilities -110 20 0 0 0 0 -90
Tax loss carry-forwards -8,185 -3,258 217 -2,684 0 10,068 -3,842
-7,484 -2,988 217 -2,684 0 10,068 -2,871
2015
Intangible assets 39 -16 0 0 0 0 23
Property, plant and equipment 286 502 0 0 0 0 788
Liabilities 0 -110 0 0 0 0 -110
Tax loss carry-forwards -10,197 -732 185 -1,629 0 4,188 -8,185
-9,872 -356 185 -1,629 0 4,188 -7,484
78 SP Group

COMPANY GROUP
2015 2016 DKK’000 2016 2015
26. Trade payables
107 615 Trade payables 148,624 122,121
The carrying amount is equal to the fair value of the liabilities.
27. Provisions (warranty commitments)
0 0 Provisions at 01/01 0 0
0 0 Additions on acquisitions 3,197 0
0 0 Additions 5,751 0
0 0 Disposals -192 0
0 0 Provisions at 31/12 8,756 0
Provisions relate to sold, but defective items. Provisions have been calculated based on
expected remedial costs. Such costs are expected to be incurred primarily during 2017.
28. Other payables
The item comprises payables relating to payroll, withholding taxes, social security
contributions, compensated absence commitments, derivative financial statement
instruments, VAT, duties, etc.
The compensated absence commitment represents the Group’s obligation to pay sal-
ary to employees during holidays which, at the balance sheet date, they are entitled to
spend in the subsequent financial year.
29. Collateral
Mortgage debt, DKK 81 million, is secured by way of mortgage on properties.
The mortgage also comprises such items of plant and machinery that are deemed
part of the properties.
Moreover, loans with banks and financial institutions are secured by way of a letter of
indemnity on real property and mortgages registered to the mortgagor with second-
ary liability, totalling a nominal amount of DKK 60 million (2015: DKK 60 million).
67,299 79,836 Carrying amount of mortgaged properties 137,739 128,435
Loans with banks and financial institutions are secured by way of a letter of indemnity
and mortgages on movable property registered to the mortgagor secured upon op-
erating equipment and fixtures and fittings, tools and equipment of a nominal amount
of DKK 27 million (2015: DKK 27 million).
0 0 Carrying amount of mortgaged operating equipment 6,930 8,392
0 0 Carrying amount of pledged receivables 0 15,307
Bank debt is secured by way of collateral on investments in the Company’s
Danish subsidiaries.
298,288 298,288 Carrying amount of pledged investments (cost) - -
Accounts / SP Group 79
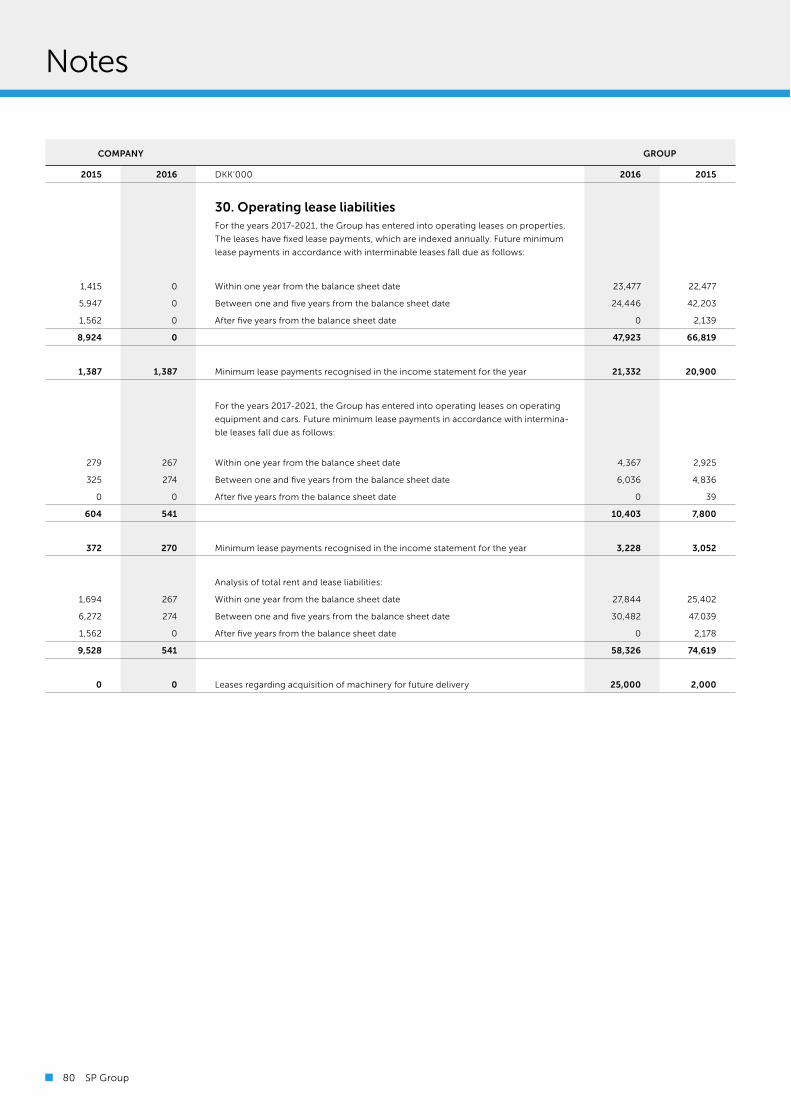
Notes
COMPANY GROUP
2015 2016 DKK’000 2016 2015
30. Operating lease liabilities
For the years 2017-2021, the Group has entered into operating leases on properties.
The leases have fixed lease payments, which are indexed annually. Future minimum
lease payments in accordance with interminable leases fall due as follows:
1,415 0 Within one year from the balance sheet date 23,477 22,477
5,947 0 Between one and five years from the balance sheet date 24,446 42,203
1,562 0 After five years from the balance sheet date 0 2,139
8,924 0 47,923 66,819
1,387 1,387 Minimum lease payments recognised in the income statement for the year 21,332 20,900
For the years 2017-2021, the Group has entered into operating leases on operating
equipment and cars. Future minimum lease payments in accordance with intermina-
ble leases fall due as follows:
279 267 Within one year from the balance sheet date 4,367 2,925
325 274 Between one and five years from the balance sheet date 6,036 4,836
0 0 After five years from the balance sheet date 0 39
604 541 10,403 7,800
372 270 Minimum lease payments recognised in the income statement for the year 3,228 3,052
Analysis of total rent and lease liabilities:
1,694 267 Within one year from the balance sheet date 27,844 25,402
6,272 274 Between one and five years from the balance sheet date 30,482 47,039
1,562 0 After five years from the balance sheet date 0 2,178
9,528 541 58,326 74,619
0 0 Leases regarding acquisition of machinery for future delivery 25,000 2,000
80 SP Group

COMPANY GROUP
2015 2016 DKK’000 2016 2015
31. Recourse guarantee commitments and contingent liabilities
Together with its subsidiaries, the Company has entered into bank commitments
under which the Company is liable for all draw-downs on credit facilities.
146,366 144,035 Subsidiaries’ bank debt
The Company has guaranteed the subsidiaries’ debt to financial institutions or
has joint and several liability.
52,931 45,093 Surety, guarantee and liability
Furthermore, the Company is jointly and severally liable for the subsidiaries’ lease
liabilities.
63,883 44,788 Minimum lease payments
On behalf of a subsidiary, the Company has provided a payment guarantee of
DKK 892 thousand to a supplier (2015: DKK 2,566 thousand).
The Company is jointly taxed with other Danish entities in the Group. As manage-
ment company, the Company has joint and several liability, together with the other
jointly taxed entities, for payment of Danish income taxes and withholding taxes
on dividends, interest and royalties. At 31 December 2016, the jointly taxed enti-
ties’ net liabilities to the Danish Customs and Tax Administration amounted to DKK 0
(31 December 2015: DKK 0.5 million).
32. Changes in net working capital
0 0 Change in inventories 11,561 21,320
7,988 -17,291 Change in receivables 12,905 -9,998
-22,364 -10,001 Change in trade payables, etc. -8,474 -23,605
-14,376 -27,292 15,992 -12,283
33. Cash and cash equivalents
2,735 7,843 Cash 53,725 43,763
-23,267 -79,768 Short-term bank debt -224,818 -151,067
-20,532 -71,925 -171,093 -107,304
34. Fees to the auditors appointed by the company in general meeting
External expenses include fees to the auditors appointed by the company
in general meeting:
Ernst & Young P/S
200 200 Statutory audit 1,632 1,296
63 0 Other assurance engagements 36 105
211 132 Tax and VAT advisory services 315 496
450 767 Other assistance 895 533
924 1,099 2,878 2,430
Accounts / SP Group 81

Notes
35. Related parties
Related parties exercising control over the Group and the Company
There are no related parties exercising control over SP Group A/S. Shareholders holding more than 5% of the share capital are disclosed in note 39.
For an outline of subsidiaries, see the group chart in note 44.
Related party transactions, Group
In previous years, the Group leased a production plant from a company in which members of the Group’s Executive Board and Board of Directors are indi-
rectly shareholders. Rent amounted to DKK 1,387 thousand in 2015. The lease, which was entered into in 2009, is non-terminable until 2021 (sale and lease
back arrangement). During the lease term, the Group is entitled to repurchase the property at the original selling price. Having decided to exercise this op-
tion, the Group repurchased the property for DKK 15 million at 1 January 2016. The Group did not carry through any other related party transactions in 2015
and 2016 apart from payment of remuneration of members of the Board of Directors and the Executive Board, see note 6.
Related party transactions, Company
Sale of Purchase of
Lease Lease goods and goods and Interest Interest
DKK’000 income expenses services services income expenses Receivables Payables
2016
From subsidiaries 4,532 129 8,787 120 415 1,114 25,275 93,416
2015
From subsidiaries 4,634 235 10,963 120 587 1,097 34,501 77,648
In addition, SP Group A/S received dividends from subsidiaries in the amount of DKK 29,799 thousand (2015: DKK 26,231 thousand).
Transactions with subsidiaries are eliminated in the consolidated financial statements in accordance with the accounting policies.
Rental income relates to the Company’s renting of properties to subsidiaries. The rent is fixed on a cost basis.
Sale of services relates to assistance provided to subsidiaries. Intra-group acquisitions and sales are made at cost plus a mark-up.
No security or guarantees have been provided for intra-group balances at the balance sheet apart from what is disclosed in note 29. Receivables as well as
payables will be settled in cash. The Group has not recorded any bad debts relating to related parties or made provisions for probable bad debts.
Remuneration of Management
For information on the remuneration of the Group’s Board of Directors and Executive Board, see note 6.
82 SP Group
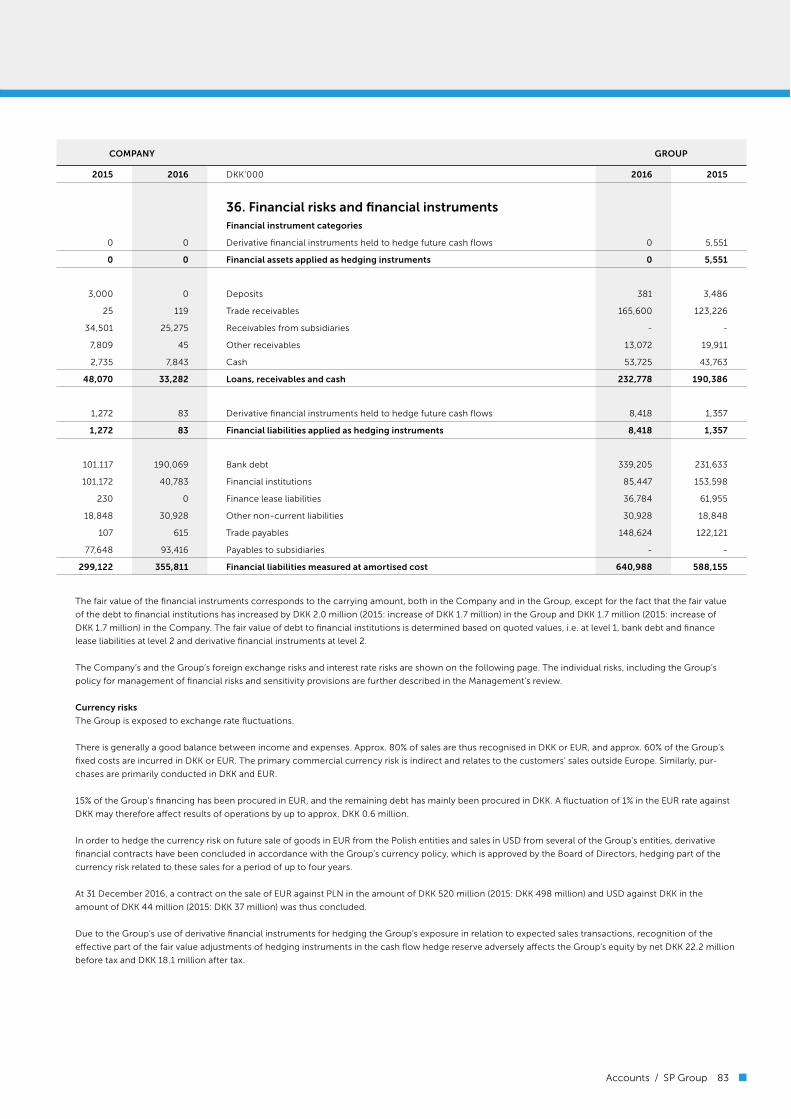
COMPANY GROUP
2015 2016 DKK’000 2016 2015
36. Financial risks and financial instruments
Financial instrument categories
0 0 Derivative financial instruments held to hedge future cash flows 0 5,551
0 0 Financial assets applied as hedging instruments 0 5,551
3,000 0 Deposits 381 3,486
25 119 Trade receivables 165,600 123,226
34,501 25,275 Receivables from subsidiaries - -
7,809 45 Other receivables 13,072 19,911
2,735 7,843 Cash 53,725 43,763
48,070 33,282 Loans, receivables and cash 232,778 190,386
1,272 83 Derivative financial instruments held to hedge future cash flows 8,418 1,357
1,272 83 Financial liabilities applied as hedging instruments 8,418 1,357
101,117 190,069 Bank debt 339,205 231,633
101,172 40,783 Financial institutions 85,447 153,598
230 0 Finance lease liabilities 36,784 61,955
18,848 30,928 Other non-current liabilities 30,928 18,848
107 615 Trade payables 148,624 122,121
77,648 93,416 Payables to subsidiaries - -
299,122 355,811 Financial liabilities measured at amortised cost 640,988 588,155
The fair value of the financial instruments corresponds to the carrying amount, both in the Company and in the Group, except for the fact that the fair value
of the debt to financial institutions has increased by DKK 2.0 million (2015: increase of DKK 1.7 million) in the Group and DKK 1.7 million (2015: increase of
DKK 1.7 million) in the Company. The fair value of debt to financial institutions is determined based on quoted values, i.e. at level 1, bank debt and finance
lease liabilities at level 2 and derivative financial instruments at level 2.
The Company’s and the Group’s foreign exchange risks and interest rate risks are shown on the following page. The individual risks, including the Group’s
policy for management of financial risks and sensitivity provisions are further described in the Management’s review.
Currency risks
The Group is exposed to exchange rate fluctuations.
There is generally a good balance between income and expenses. Approx. 80% of sales are thus recognised in DKK or EUR, and approx. 60% of the Group’s
fixed costs are incurred in DKK or EUR. The primary commercial currency risk is indirect and relates to the customers’ sales outside Europe. Similarly, pur-
chases are primarily conducted in DKK and EUR.
15% of the Group’s financing has been procured in EUR, and the remaining debt has mainly been procured in DKK. A fluctuation of 1% in the EUR rate against
DKK may therefore a;ect results of operations by up to approx. DKK 0.6 million.
In order to hedge the currency risk on future sale of goods in EUR from the Polish entities and sales in USD from several of the Group’s entities, derivative
financial contracts have been concluded in accordance with the Group’s currency policy, which is approved by the Board of Directors, hedging part of the
currency risk related to these sales for a period of up to four years.
At 31 December 2016, a contract on the sale of EUR against PLN in the amount of DKK 520 million (2015: DKK 498 million) and USD against DKK in the
amount of DKK 44 million (2015: DKK 37 million) was thus concluded.
Due to the Group’s use of derivative financial instruments for hedging the Group’s exposure in relation to expected sales transactions, recognition of the
e;ective part of the fair value adjustments of hedging instruments in the cash flow hedge reserve adversely a;ects the Group’s equity by net DKK 22.2 million
before tax and DKK 18.1 million after tax.
Accounts / SP Group 83

Notes
GROUP
Cash and cash Hedged Net
DKK’000 equivalents Receivables Liabilities portion position
36. Financial risks and financial instruments (continued)
EUR 17,590 83,700 -129,209 0 -27,918
PLN 11,828 5,826 -24,627 0 -6,973
USD 10,893 23,949 -14,032 0 20,810
CAD 1,251 862 -258 0 1,855
SEK 2,767 13,320 -21,770 0 -5,683
NOK 1,201 0 -8,980 0 -7,779
JPY 0 0 0 0 0
RMB 8,749 17,854 -12,326 0 14,277
CHF 4,338 1,022 0 0 5,360
GBP 255 171 -1 0 425
BRL 1,456 1,247 -278 0 2,425
31.12.2016 60,328 147,951 -211,481 0 -3,202
EUR 14,951 63,168 -150,872 0 -72,753
PLN 9,515 14,441 -18,376 0 5,580
USD 12,638 22,108 -20,876 0 13,870
CAD 3,902 1,082 -387 0 4,597
SEK 1,070 1,474 -6,934 4,182 -208
JPY 26 0 0 0 26
RMB 3,255 18,174 -14,347 0 7,082
GBP 43 113 -1 0 155
BRL 775 1,453 -466 0 1,762
31.12.2015 46,175 122,013 -212,259 4,182 -39,889
COMPANY
Cash and cash Hedged Net
DKK’000 equivalents Receivables Liabilities portion position
EUR 3,232 0 -17,850 0 -14,618
PLN 3,547 0 0 0 3,547
USD 0 0 -847 0 -847
SEK -75 0 0 0 -75
31.12.2016 6,704 0 -18,697 0 -11,993
EUR 2,334 0 -23 0 2,311
PLN 1 0 -55 0 -54
USD 399 0 0 0 399
SEK 0 0 -4,212 4,182 -30
31.12.2015 2,734 0 (4,290 4,182 2,626
84 SP Group

36. Financial risks and financial instruments (continued)
Interest rate risks
Interest rate risks primarily relate to interest-bearing net debt, i.e. mortgage debt and bank debt less cash and cash equivalents. At year-end, the Group’s net
interest-bearing debt totalled DKK 408 million. 80% of the Group’s debt is made up of floating-rate loans. A one percentage point increase in the general
interest level will result in an increase in the Group’s interest expenses before tax of approx. DKK 3.0 million.
SP Group focuses on increasing cash flows from operating activities so that the net interest-bearing debt can be reduced and the Group can finance invest-
ments via operating activities. The Group also aims at reducing debt by selling non-value-creating assets and activities.
The interest rate risk associated with financial assets and liabilities can be described as follows with the disclosure of date of interest rate adjustment or matu-
rity, whichever occurs first, and e;ective interest rates.
GROUP
Time of interest rate adjustment
or maturity
Within Between 1 After Fixed-interest E<ective
DKK’000 1 year and 5 years 5 years Total portion interest
Bank deposits 53,725 0 0 53,725 0 1.0 %
Financial institutions -24,934 -60,513 0 -85,447 0 1.3 %
Finance lease liabilities -17,039 -19,745 0 -36,784 0 1.8 %
Bank debt -339,205 0 0 -339,205 0 1.3 %
31.12.2016 -327,453 -80,258 0 -407,711 0
Bank deposits 43,763 0 0 43,763 0 1.0 %
Financial institutions -72,436 -81,162 0 -153,598 0 1.9 %
Finance lease liabilities -47,800 -14,155 0 -61,955 0 1.9 %
Bank debt -231,633 0 0 -231,633 0 1.8 %
31.12.2015 -308,106 -95,317 0 -403,423 0
The fair value of interest rate swaps outstanding at the balance sheet date entered into to hedge the interest rate exposure on floating-rate loans amounts to
DKK 83 thousand (31/12/2015: DKK 1,274 thousand). The interest rate swaps expire in 2017.
COMPANY
Time of interest rate adjustment
or maturity
Within Between 1 After Fixed-interest E<ective
DKK’000 1 year and 5 years 5 years Total portion interest
Bank deposits 7,843 0 0 7,843 0 0.0 %
Financial institutions -19,963 -20,820 0 -40,783 0 1.4 %
Bank debt -190,069 0 0 -190,069 0 1.3 %
31/12/2016 -202,189 -20,820 0 -223,009 0
Bank deposits 2,735 0 0 2,735 0 0.0 %
Financial institutions -53,186 -47,986 0 -101,172 0 2.2 %
Finance lease liabilities -230 0 0 -230 0 2.9 %
Bank debt -101,117 0 0 -101,117 0 1.8 %
31/12/2015 -151,798 -47,986 0 -199,784 0
The fair value of interest rate swaps outstanding at the balance sheet date entered into to hedge the interest rate exposure on floating-rate loans amounts to
DKK 83 thousand (31/12/2015: DKK 1,274 thousand). The interest rate swaps expire in 2017.
Accounts / SP Group 85

Notes
36. Financial risks and financial instruments (continued)
Credit risks
The Company’s primary credit risk is associated with trade receivables. SP Group systematically and continually monitors the credit rating of customers and
business partners. Credit risks are partially hedged through insurance and sale of invoices. No individual customers or business partners pose an unusual credit
risk to the Group. The customers and business partners are normally well-reputed companies operating in many di;erent business sectors and countries,
which reduces the overall credit risk. The maximum credit risk associated with financial assets is reflected in the carrying amounts in the balance sheet.
COMPANY GROUP
2015 2016 DKK’000 2016 2015
Due receivables not written down:
25 70 Due by up to one month 34,763 25,869
0 27 Due between one and three months 5,329 4,985
0 0 Due by more than three months 1,609 1,033
25 97 41,701 31,887
Liquidity risks
It is the Group’s objective to have su&cient cash resources to be able to continually making appropriate arrangements in case of unforeseen changes in cash
outflows. It is Management’s opinion that the Company still has adequate capital resources considering its operations and su&cient liquidity to meet its pre-
sent and future liabilities. The Company’s long-term cooperation with its financial business partners is fruitful and constructive. This is expected to continue.
The Group has neither neglected nor been in breach of loan agreements in the financial year or the comparative year. The Group has calculated its cash
resources at DKK 105 million at year-end 2016.
The term to maturity of financial liabilities is specified below. The amounts specified represent the amounts falling due exclusive of interest.
GROUP
Within Between After
DKK’000 1 years 1 and 5 years 5 years Total
2016
Non-derivative financial liabilities
Bank debt 262,091 76,919 195 339,205
Financial institutions 11,474 31,826 42,147 85,447
Finance lease liabilities 9,460 27,324 0 36,784
Other non-current liabilities 1,938 28,990 0 30,928
Trade payables 148,624 0 0 148,624
433,587 165,059 42,342 640,988
Derivative financial instruments
Derivative financial instruments held to hedge future cash flows 828 7,590 0 8,418
434,415 172,649 42,342 649,406
2015
Non-derivative financial liabilities
Bank debt 176,709 54,924 0 231,633
Financial institutions 11,087 96,801 45,710 153,598
Finance lease liabilities 15,985 45,760 210 61,955
Other non-current liabilities 2,281 16,567 0 18,848
Trade payables 122,121 0 0 122,121
328,183 214,052 45,920 588,155
Derivative financial instruments
Derivative financial instruments held to hedge future cash flows -2,691 -1,586 0 -4,277
325,492 212,466 45,920 583,878
86 SP Group

36. Financial risks and financial instruments (continued)
COMPANY
Within Between After
DKK’000 1 years 1 and 5 years 5 years Total
2016
Non-derivative financial liabilities
Bank debt 116,263 73,806 0 190,069
Financial institutions 3,617 14,717 22,449 40,783
Finance lease liabilities 0 0 0 0
Other non-current liabilities 1,938 28,990 0 30,928
Trade payables 615 0 0 615
122,433 117,513 22,449 262,395
Derivative financial instruments
Derivative financial instruments held to hedge future cash flows 3,327 83 0 3,410
125,760 117,596 22,449 265,805
2015
Non-derivative financial liabilities
Bank debt 47,207 53,910 0 101,117
Financial institutions 3,266 75,810 22,096 101,172
Finance lease liabilities 230 0 0 230
Other non-current liabilities 2,281 16,567 0 18,848
Trade payables 107 0 0 107
53,091 146,287 22,096 221,474
Derivative financial instruments
Derivative financial instruments held to hedge future cash flows 2,136 1,274 0 3,410
55,227 147,561 22,096 224,884
Derivative financial instruments are measured in accordance with a valuation method according to which all material data are based on observable market
data, i.e. level 2. Apart from this, the Group has no assets and liabilities measured at fair value.
37. Sale of financial assets
As in previous years, the Group sold selected trade receivables as part of its credit and risk management. The Group’s continued involvement is limited to
administration of sold receivables and a limited guarantee regarding the risk of delayed payment. Thus, the Group has only maintained an insignificant risk
exposure. The sale has not a;ected the income statement.
Accounts / SP Group 87

Notes
38. Segment information for the Group
Segments
Segments are reported in accordance with the internal reporting to those charge with governance in the Group, which are the members of the Board of
Directors. which are the members of the Board of Directors.
Segments are specified on the basis of the financial and operational reporting reviewed by the Executive Board. The segments are specified by di;erences in
products and services.
Segment information is prepared in accordance with the Group’s accounting policies and IFRS and is based on the Group’s internal management reporting.
For management and reporting purposes, the Group is organised in two business segments which are considered the Group’s primary basis of segmentation.
Transfers of sale of goods, etc. between the segments are calculated using actual transfer prices corresponding to estimated market prices of the goods,
services, etc. in question.
Business segments – 2016
DKK’000 Coatings Plastics Other *) Group
Revenue, external customers 129,413 1,381,634 7,997 1,519,044
Revenue among segments 7,422 703 -8,125 0
Revenue 136,835 1,382,337 -128 1,519,044
Profit/loss before depreciation, amortisation and impairment losses (EBITDA) 16,176 190,403 -3,722 202,857
Depreciation, amortisation and impairment losses -7,337 -58,315 -3,790 -69,442
Profit/loss before net financials (EBIT) 8,839 132,088 -7,512 133,415
Financial income and financial expenses -10,799
Profit before tax 122,616
Tax for the year -29,229
Profit for the year 93,387
Additions of non-current property, plant and equipment and intangible assets 919 93,069 15,555 109,543
Segment assets 76,144 945,979 109,234 1,131,357
Non-allocated assets 69,314
1,200,671
Segment liabilities, non-interest-bearing 23,143 217,592 6,587 247,322
Non-allocated liabilities 524,373
771,695
*) Comprises eliminations and non-allocated overhead costs.
Disclosure of significant customers
11.8% (2015: 11.6%) of the Group’s revenue is attributable to one customer in the Coatings and Plastics segments.
The ten largest customers account for 49.7% (2015: 46.9%) of the Group’s revenue. Similarly, the 20 largest customers account for 60.1% of revenue (2015: 59.6%).
88 SP Group
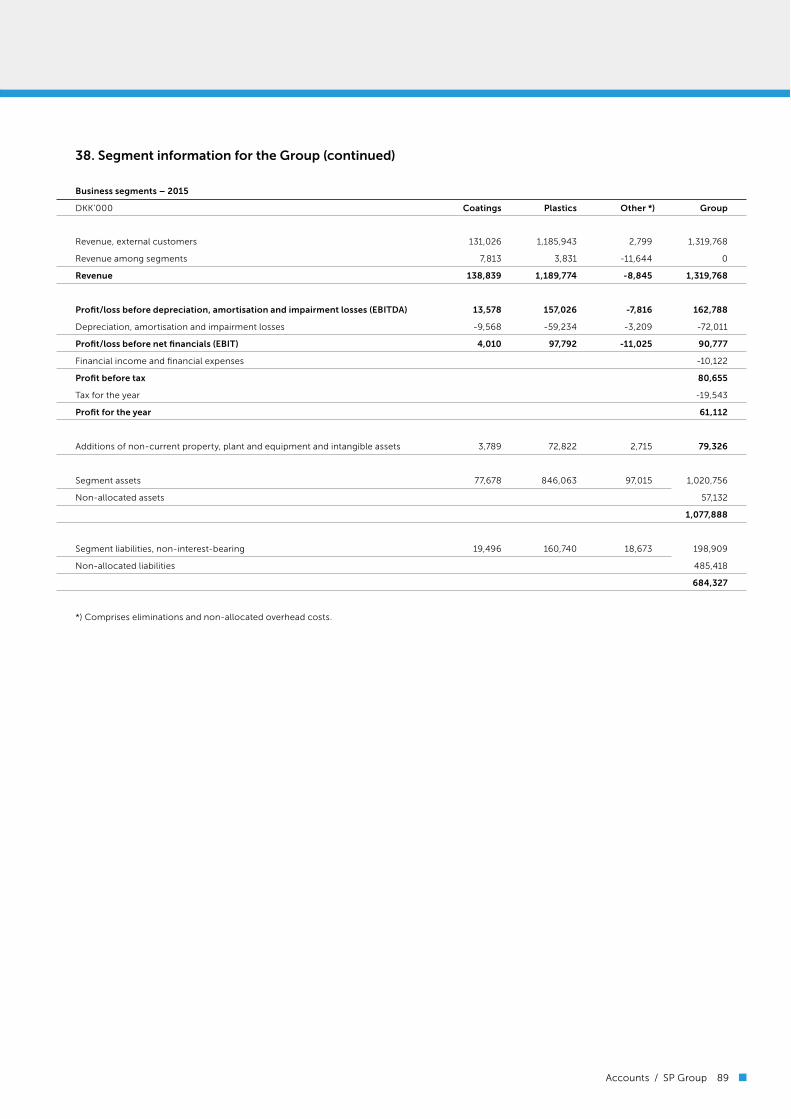
38. Segment information for the Group (continued)
Business segments – 2015
DKK’000 Coatings Plastics Other *) Group
Revenue, external customers 131,026 1,185,943 2,799 1,319,768
Revenue among segments 7,813 3,831 -11,644 0
Revenue 138,839 1,189,774 -8,845 1,319,768
Profit/loss before depreciation, amortisation and impairment losses (EBITDA) 13,578 157,026 -7,816 162,788
Depreciation, amortisation and impairment losses -9,568 -59,234 -3,209 -72,011
Profit/loss before net financials (EBIT) 4,010 97,792 -11,025 90,777
Financial income and financial expenses -10,122
Profit before tax 80,655
Tax for the year -19,543
Profit for the year 61,112
Additions of non-current property, plant and equipment and intangible assets 3,789 72,822 2,715 79,326
Segment assets 77,678 846,063 97,015 1,020,756
Non-allocated assets 57,132
1,077,888
Segment liabilities, non-interest-bearing 19,496 160,740 18,673 198,909
Non-allocated liabilities 485,418
684,327
*) Comprises eliminations and non-allocated overhead costs.
Accounts / SP Group 89

38. Segment information for the Group (continued)
Geographical segments
The Group’s activities are primarily located in Denmark, rest of Europe, the Americas and Asia. The following table shows the Group’s sale of goods by geo-
graphical market.
DKK’000 2016 2015
Denmark 745,227 614,240
Rest of Europe 497,817 430,623
Americas 144,389 145,438
Asia (incl. the Middle East) 129,110 126,371
Rest of world 2,501 3,096
1,519,044 1,319,768
Sale of goods 1,478,344 1,284,321
The selling price of the year’s production output relating to construction contracts 40,700 35,447
1,519,044 1,319,768
The below table specifies the carrying amounts and the year’s additions of non-current property, plant and equipment and intangible assets by geographical
market on the basis of the physical location of the assets.
Additions of intangible
assets and property,
Non-current assets plant and equipment
DKK’000 2016 2015 2016 2015
Denmark 450,521 482,468 47,937 45,165
Sweden 28,280 5,858 2,075 1,311
Latvia 304 226 29 29
Slovakia 11,611 4,919 8,675 2,222
The Netherlands 29,030 24,485 2,509 2,044
Poland 109,543 79,740 46,492 23,137
North America 18,395 18,641 279 586
China 11,505 12,809 1,547 4,804
Brazil 1,984 2,134 0 28
661,173 631,280 109,543 79,326
Notes
90 SP Group

39. Shareholder information
At the end of March 2017, SP Group A/S registered the following shareholders as holding more than 5% of the voting share capital or of the nominal value of
the share capital:
Schur Finance A/S, Horsens (20,9%)
Frank Gad (including related parties), Frederiksberg (16,3%)
40. Acquisition of subsidiary in 2016
E;ective 14 July 2016, the Group acquired the activity in the Danish company MedicoPack A/S, which is a manufacturer of blow-moulded plastics.
Revenue from the acquired activity is included in revenue for 2016 by approx. DKK 47 million, and a pre-tax profit of approx. DKK 5 million.
Total revenue for 2016 from the acquired activity is approx. DKK 100 million, and a pre-tax profit of approx. DKK 3 million.
The fair value of assets and liabilities at the date of acquisition has been distributed as follows (DKK’000):
Property, plant and equipment 14,472
Inventories 15,435
Trade receivables 17,432
Other receivables 895
Deferred tax asset 2,954
Cash 16,717
Trade payables -8,162
Payables to Seller -18,000
Other payables -10,670
Net assets taken over 31,073
Goodwill 0
Total consideration 31,073
Cash consideration 17,000
Debt instruments 14,073
Total consideration 31,073
The consideration amounts to DKK 31,073 thousand, of which DKK 17 million has been paid in cash plus liquid funds and bank debt taken over of DKK 16,717
thousand. Debt instruments totalling DKK 14,073 thousand have been issued. The purchase consideration is fixed.
Total debt instruments issued have been recognised at fair value at the acquisition date. The undiscounted amount is DKK 14.8 million. The debt instruments
will be settled in 2018 and 2019.
Costs of acquisition amounted to DKK 1.0 million and were expensed in 2016.
Acquired assets include trade receivables at a fair value of DKK 17,432 thousand, corresponding to the contractual gross receivable at the date of the acquisition,
which was received after a short credit period.
E;ective 15 October 2016, the Group acquired the plastics activities in the Danish company Aasum Plast & Metal A/S.
Revenue from the acquired activity is included in revenue for 2016 by approx. DKK 2 million, and a pre-tax profit of approx. DKK 0 million.
Total revenue for 2016 from the acquired activity is approx. DKK 9 million, and a pre-tax profit of approx. DKK 0 million.
The fair value of assets and liabilities at the date of acquisition has been distributed as follows (DKK’000):
Property, plant and equipment 1,600
Customer files 300
Inventories 600
Net assets taken over 2,500
Goodwill 1,000
Total consideration 3,500
The consideration totals DKK 3.5 million.
Costs of acquisition amounted to DKK 0.1 million and were expensed in 2016.
Accounts / SP Group 91

Notes
40. Acquisition of subsidiary in 2016 (continued)
E;ective 21 November 2016, the Group acquired the activity in the Norwegian company Plexx AS, which is a manufacturer of vacuum-formed plastics.
Revenue from the acquired activity is included in revenue for 2016 by approx. DKK 7 million, and a pre-tax profit of approx. DKK 1 million.
Total revenue for 2016 from the acquired activity is approx. DKK 70 million, and a pre-tax profit of approx. DKK 2 million.
The fair value of assets and liabilities at the date of acquisition has been distributed as follows (DKK’000):
Property, plant and equipment 19,866
Customer files 1,650
Inventories 11,442
Trade receivables 15,624
Other receivables 3,053
Cash 3,111
Deferred tax -856
Lease liabilities -4,469
Bank debt -4,069
Trade payables -13,852
Income taxes payable -265
Other payables -8,767
Net assets taken over 22,468
Goodwill 1,867
Total consideration 24,335
Cash consideration 19,450
Debt instruments 4,885
Total consideration 24,335
The consideration amounts to DKK 24,335 thousand, of which DKK 19,450 thousand has been paid in cash less liquid funds and bank debt taken over of DKK
958 thousand. Debt instruments totalling DKK 4,885 thousand. The purchase consideration is fixed.
Debt instruments totalling DKK 4,885 thousand have been issued and recognised at fair value at the acquisition date. The undiscounted amount is DKK 5,010
thousand and falls due in 2017.
Costs of acquisition amounted to DKK 0.7 million and were expensed in 2016.
Acquired assets include trade receivables at a fair value of DKK 15,624 thousand, corresponding to the contractual gross receivable at the date of the acquisi-
tion, which was received after a short credit period.
After recognition of identifiable assets, liabilities and contingent liabilities at fair value, goodwill arising on the acquisition is calculated at DKK 1,867 thousand.
Goodwill represents the expected value of synergies and know-how from the combination with SP Group. Goodwill is not depreciable for tax purposes.
41. Acquisition of activities and subsidiaries in 2015
E;ective 1 January 2015, the Group acquired the activity in Scanvakuum ApS, which is a manufacturer of vacuum-formed plastics.
E;ective 13 March 2015, the Group acquired all of the shares in Sander Tech ApS, which is a manufacturer of injection-moulded plastics.
E;ective 29 June 2015 (18%) and 1 July 2015 (82%), the Group acquired all of the shares in Ulstrup Plast A/S, which is a manufacturer of injection-moulded
plastics as well as a supplier of related services such as assembly, packaging, logistics, manufacture of tools and advisory services.
Revenue from the acquired activity and subsidiaries is included in revenue for 2015 by approx. DKK 70 million, and a pre-tax profit of approx. DKK 6 million.
Total revenue for 2015 from the acquired activity and subsidiaries is approx. DKK 120 million, and a pre-tax profit of DKK 17 million.
92 SP Group

41. Acquisition of activities and subsidiaries in 2015 (continued)
The fair value of assets and liabilities at the date of acquisition has been distributed as follows (DKK’000):
Property, plant and equipment 10,521
Customer files 14,928
Deposit 344
Inventories 14,344
Trade receivables 26,866
Other receivables 343
Deferred tax asset 20
Prepaid expenses 199
Cash 4
Deferred tax -2,857
Bank loans and overdrafts -5,616
Trade payables -8,736
Income taxes payable -1,879
Other payables -4,320
Net assets taken over 44,161
Goodwill 28,529
Total consideration 72,690
Cash consideration 54,100
Debt instrument 10,983
Contingent consideration 7,607
Total consideration 72,690
The consideration amounts to DKK 72,690 thousand, of which DKK 54.1 million has been paid in cash less liquid funds and bank debt taken over of DKK 5,612
thousand. Debt instruments totalling DKK 10,983 thousand have been issued. In addition, there is a conditional cash consideration of DKK 7,607 thousand.
The debt instruments issued, DKK 10,983 thousand, have been recognised at fair value at the acquisition date. The undiscounted amount is DKK 12 million.
The contingent consideration of DKK 7,607 thousand has been recognised at fair value at the date of acquisition and at the maximum amount which may
become payable, as it is expected that the criteria for future earnings will be met. The undiscounted amount is DKK 8.0 million.
Costs of acquisition amounted to DKK 1.0 million and were expensed in 2015.
Acquired assets include trade receivables at a fair value of DKK 26,866 thousand, corresponding to the contractual gross receivable at the date of the acquisi-
tion, which was received after a short credit period.
After recognition of identifiable assets, liabilities and contingent liabilities at fair value, goodwill arising on the acquisition is calculated at DKK 28,529 thousand.
Goodwill represents the expected value of synergies and know-how from the combination with SP Group. Goodwill is not depreciable for tax purposes.
Accounts / SP Group 93

42. Acquisition of subsidiaries after the balance sheet date
E;ective 6 January 2017, the Group acquired the activity in the Danish company LM Skumplast A/S, which is a manufacturer of plastics.
E;ective 21 March 2017, the Group acquired the activity in the Danish company MM Composite A/S, which is a manufacturer of composite plastics.
For the time being, the fair value of assets and liabilities at the date of acquisition has been distributed as follows (DKK’000):
Property, plant and equipment 33,293
Customer files 22,000
Other non-currents assets 2,700
Deposit 0
Inventories 24,290
Trade receivables 22,075
Other receivables 1,800
Deferred tax asset 0
Prepaid expenses 0
Cash 5,519
Deferred tax -7,462
Leasing debt -4,500
Bank debt -7,500
Trade payables -21,167
Income taxes payable -2,545
Other payables -10,851
Net assets taken over 57,652
Goodwill 50,719
Total consideration 108,371
Cash consideration 47,340
Debt instruments 27,812
Contingent consideration 33,219
Total consideration 108,371
EBITDA totalled approx. DKK 14 million in the past financial year in the acquired entities.
The purchase consideration is DKK 108,371 thousand, of which DKK 47,340 has been paid in cash. Debt instruments totalling DKK 27,812, which fall due in
the period 2017-2020, have been issued. Add to this a conditional purchase consideration of DKK 33,219 thousand.
The debt instruments totalling DKK 27,812 have been recognised at the fair value at the time of acquisition. The undiscounted amount is DKK 29,860 thou-
sand.
The conditional purchase consideration of DKK 33,219 thousand has been recognised at the fair value at the time of acquisition and at the maximum amount
that can be paid out, as expectations are that the criteria for future earnings will be met. The undiscounted amount is DKK 35.0 million.
Costs of acquisition are expected to amount to DKK 1.0 million, which will be expensed in 2017.
After recognition of identifiable assets, liabilities and contingent liabilities at fair value, goodwill arising on acquisition has been calculated at DKK 50,719
thousand. Goodwill, which represents the expected value of synergies and knowhow resulting from the combination with SP Group, is not depreciable for
tax purposes.
43. Events after the balance sheet date
Besides the abovementioned corporate acquisitions , no events have occurred after the balance sheet date and until the publication of this annual report
which have not already been incorporated or disclosed in this annual report or which could change the assessment of the Group’s and the Company’s finan-
cial position.
94 SP Group

44. Group chart at 31 December 2016
Nominal share Ownership
capital (’000) interest
SP Group A/S Denmark DKK 22,780
SP Moulding Denmark DKK 50,000 100%
SP Medical Sp. z o.o. Poland PLN 1,000 100%
SP Moulding Poland Sp. z o.o. Poland PLN 1,100 100%
Sander Tech ApS Denmark DKK 80 100%
SP International A/S Denmark DKK 5,600 100%
SP Moulding (Suzhou) Co., Ltd. China USD 4,080 100%
Ulstrup Plast A/S Denmark DKK 1,590 100%
Ulstrup Plast s.r.o. Slovakia EUR 7 100%
MedicoPack A/S Denmark DKK 20 100%
Gibo Plast Denmark DKK 30,000 100%
Gibo Sp. z o.o. Poland PLN 3,005 100%
Plexx AS Norway NOK 3,541 100%
Opido AB Sweden SEK 100 100%
Accoat A/S Denmark DKK 10,000 100%
Accoat do Brasil Brazil BRL 392 100%
Ergomat A/S Denmark DKK 10,000 100%
Ergomat Sp. z o.o. Poland PLN 2,005 100%
Ergomat-Nederland B.V. The Netherlands EUR 75 100%
Ergomat Sweden AB Sweden SEK 100 60%
Ergomat Inc. The US USD 360 100%
Ergomat Canada Inc. Canada CAD 0 100%
Tinby A/S Denmark DKK 10,000 100%
Tinby Sp. z o.o. Poland PLN 50 100%
Tinby Denmark A/S Denmark DKK 500 100%
Tinby Co., Ltd. China USD 210 100%
Tinby Inc. The US USD 100 100%
TPI Polytechniek B.V. The Netherlands EUR 113 100%
TPI Polytechniek ApS Denmark DKK 125 100%
Bröderna Bourghardt AB Sweden SEK 100 100%
Baltic Rim, SIA Latvia EUR 3 100%
SP Extrusion A/S Denmark DKK 6,000 100%
SP Technology ApS Denmark DKK 200 100%
In 2016, Accoat Technology was transferred from Accoat A/S to SP Group A/S, which has subsequently changed name to SP Technology ApS
In 2016, the ownership interest in Bröderna Bourghardt AB was increased from 80% to 100%
In 2016, all of the shares in MedicoPack A/S and Plexx AS were acquired
In 2017, all of the shares in LM Skumplast A/S were acquired. This entity has subsequently changed name to Tinby Skumplast A/S
In 2017, all of the shares in MM Composite A/S were acquired
Accounts / SP Group 95

SP Group A/S
Snavevej 6-10
DK-5471 Søndersø
Telephone: +45 70 23 23 79
Fax: +45 70 23 23 52
Website: www.sp-group.dk
E-mail: [email protected]
CVR no.: 15 70 13 15