ANNUAL REPORT - Morningstar Document Library
311
ASSET MANAGEMENT ANNUAL REPORT Royal London Equity Funds ICVC Annual Report for the year ended 31 August 2018
-
Upload
khangminh22 -
Category
Documents
-
view
1 -
download
0
Transcript of ANNUAL REPORT - Morningstar Document Library
ASSET MANAGEMENT
ANNUAL REPORT
Royal London Equity Funds ICVCAnnual Report for the year ended 31 August 2018
Royal London Equity Funds ICVC2
CompanyRoyal London Equity Funds ICVCRegistered in England with Company Number IC000807
Registered office:55 Gracechurch Street, London, EC3V 0RL
DirectorsThe Authorised Corporate Director (ACD) is Royal London Unit Trust Managers Limited which is the sole director.
Place of business and Registered office:55 Gracechurch Street, London, EC3V 0RL
Authorised and regulated by the Financial Conduct Authority; a member of The Investment Association (IA).
T: 020 7506 6500F: 020 7506 6503
Directors: A.S. Carter R.S. James (resigned 31 December 2017) R.A.D. Williams A. Hunt R. Kumar S. Spiller C.R. Read (appointed 11 January 2018)
Investment AdviserRoyal London Asset Management Limited
Place of business and Registered office:55 Gracechurch Street, London, EC3V 0RL
Authorised and Regulated by the Financial Conduct Authority.
DepositaryHSBC Bank plc8 Canada Square, Canary Wharf, London, E14 5HQ
Authorised and Regulated by the Financial Conduct Authority.
RegistrarDST Financial Services International Limited
The Register may be inspected at:DST House, St Nicholas Lane, Basildon, Essex, SS15 5FS
Authorised and Regulated by the Financial Conduct Authority.
Independent AuditorsPricewaterhouseCoopers LLPAtria One, 144 Morrison Street, Edinburgh, EH3 8EX
COMPANY INFORMATION
Royal London Equity Funds ICVC
Contents Page
Company Information 2
Directors’ Report* 3
Statement of Authorised Corporate Directors’ Responsibilities* 4
Statement of Depositary’s Responsibilities 5
Report of the Depositary 5
Independent Auditors’ Report 6
Summary of Significant Accounting Policies 8
Royal London European Opportunities Fund 10
Royal London UK Mid Cap Growth Fund 25
Royal London UK Opportunities Fund 40
Royal London Japan Tracker Fund 54
Royal London FTSE® 350 Tracker Fund 71
Royal London UK All Share Tracker Fund 87
Royal London US Tracker Fund 106
Royal London European Growth Fund 125
Royal London UK Dividend Growth Fund† 139
Royal London UK Equity Income Fund 154
Royal London UK Equity Fund 169
Royal London UK Smaller Companies Fund 184
Royal London Asia Pacific ex Japan Tracker Fund 199
Royal London Europe ex UK Tracker Fund 218
Royal London Emerging Markets Equity Tracker Fund 237
Royal London Global Equity Diversified Fund 258
Royal London Global Equity Select Fund 274
Fact File 287
Constitution 287
Investment Objectives and Policies 290
Appendix – Additional Information (unaudited) 293
Remuneration Policy (unaudited) 309
General Information 310
* The Authorised Corporate Director’s report comprises these items, together with the following for each individual sub-fund: Manager’s Investment Report; Investment Objective and Policy and Portfolio Statement.
† With effect 15 January 2018. Previously known as the Royal London UK Growth Fund.

Royal London Equity Funds ICVC 3
DIRECTORS’ REPORT
Royal London Equity Funds ICVC
We are pleased to present the Annual Report for the Royal London Equity Funds ICVC, covering the year from 1 September 2017 to 31 August 2018.
Royal London Equity Funds ICVC (‘the Company’) is authorised and regulated by the Financial Conduct Authority and is structured as an umbrella investment company, in that the Company proposes to issue shares linked to different sub-funds which have been established. The Company is a UCITS umbrella scheme.
The sub-funds in existence during the year from 1 September 2017 to 31 August 2018 were:
Royal London European Opportunities Fund (launched 30 October 2009)Royal London UK Mid Cap Growth Fund (launched 30 October 2009)Royal London UK Opportunities Fund (launched 30 October 2009)Royal London Japan Tracker Fund (launched 26 February 2010)Royal London FTSE® 350 Tracker Fund (launched 26 February 2010)Royal London UK All Share Tracker Fund (launched 26 February 2010)Royal London US Tracker Fund (launched 26 February 2010)Royal London European Growth Fund (launched 30 April 2010)Royal London UK Dividend Growth Fund (launched 30 April 2010)Royal London UK Equity Income Fund (launched 5 November 2010)Royal London UK Equity Fund (launched 5 November 2010)Royal London UK Smaller Companies Fund (launched 5 November 2010)Royal London Asia Pacific ex Japan Fund (launched 5 November 2010)Royal London Europe ex UK Tracker Fund (launched 4 June 2013)Royal London Emerging Markets Equity Tracker Fund (launched 12 June 2017)Royal London Global Equity Diversified Fund (launched 10 October 2017)Royal London Global Equity Select Fund (launched 10 October 2017)
An ICVC may comprise a single fund or may be structured as an umbrella with a number of different sub-funds, each with its own portfolio of underlying assets invested in accordance with the investment objective and policy applicable to that sub-fund.
Currently, the funds of an umbrella company are ring-fenced, and consequently creditors of the company may not look to all the assets of the company for payment regardless of the sub-fund in respect of which that creditor’s debt has arisen. Certain assets held or liabilities incurred by an umbrella company which are not attributable to a particular fund can be allocated between all of the funds in a manner which (the ACD) considers fair to shareholders.
Shareholders are not liable for the debts of the Company.
This report has been prepared in accordance with the requirements of the Collective Investment Schemes Sourcebook as issued and amended by the Financial Conduct Authority.
For and behalf of Royal London Unit Trust Managers Limited
Authorised Corporate Director
R. Kumar (Director)
A. Hunt (Director)
27 November 2018
Royal London Equity Funds ICVC4
Royal London Equity Funds ICVC
STATEMENT OF AUTHORISED CORPORATE DIRECTORS’ RESPONSIBILITIES IN RELATION TO THE FINANCIAL STATEMENTS OF THE COMPANY
The Open-Ended Investment Companies Regulations 2001 (SI 2001/1228) (“the OEIC Regulations”) and the Financial Conduct Authority Collective Investment Schemes Sourcebook (COLL) require the Authorised Corporate Director to prepare financial statements for each accounting period which give a true and fair view of the financial position of the Company for the period.
The financial statements are prepared on the basis that the Company will continue in operation unless it is inappropriate to assume this. In preparing the financial statements the Authorised Corporate Director is required to:
• select suitable accounting policies and then apply them consistently;
• make adjustments and estimates that are reasonable and prudent;
• comply with the requirements of the Statement of Recommended Practice for Authorised Funds issued by the Investment Management Association (now referred to as The Investment Association) in May 2014 (the 2014 SORP);
• comply with the requirements of the prospectus;
• follow United Kingdom Generally Accepted Accounting Practice and applicable accounting standards;
• keep proper accounting records which enable it to demonstrate that the financial statements as prepared comply with the above requirements; and
• take reasonable steps for the prevention and detection of fraud and other irregularities.
The Authorised Corporate Director is responsible for the management of the Company in accordance with its Prospectus and the FCA’s rules.
Royal London Equity Funds ICVC 5
Royal London Equity Funds ICVC
STATEMENT OF DEPOSITARY’S RESPONSIBILITIES
The Depositary must ensure that the Company is managed in accordance with the Financial Conduct Authority’s Collective Investment Schemes Sourcebook, the Open-Ended Investment Companies Regulations 2001 (SI 2001/1228), as amended, the Financial Services and Markets Act 2000, as amended, (together “the Regulations”), the Company’s Instrument of Incorporation and Prospectus (together “the Scheme documents”) as detailed below.
The Depositary must in the context of its role act honestly, fairly, professionally, independently and in the interests of the Company and its investors. The Depositary is responsible for the safekeeping of all custodial assets and maintaining a record of all other assets of the Company in accordance with the Regulations.
The Depositary must ensure that:
• the Company’s cash flows are properly monitored and that cash of the Company is booked into the cash accounts in accordance with the Regulations;
• the sale, issue, repurchase, redemption and cancellation of shares are carried out in accordance with the Regulations;
• the value of shares of the Company are calculated in accordance with the Regulations;
• any consideration relating to transactions in the Company’s assets is remitted to the Company within the usual time limits;
• the Company’s income is applied in accordance with the Regulations; and
• the instructions of the Authorised Fund Manager (“the AFM”), which is the UCITS Management Company, are carried out (unless they conflict with the Regulations).
The Depositary also has a duty to take reasonable care to ensure that Company is managed in accordance with the Regulations and Scheme documents in relation to the investment and borrowing powers applicable to the Company.
REPORT OF THE DEPOSITARY TO THE SHAREHOLDERS OF THE ROYAL LONDON EQUITY FUNDS ICVC
Having carried out such procedures as we consider necessary to discharge our responsibilities as Depositary of the Company, it is our opinion, based on the information available to us and the explanations provided, that in all material respects the Company, acting through the AFM:
(i) has carried out the issue, sale, redemption and cancellation, and calculation of the price of the Company’s shares and the application of the Company’s income in accordance with the Regulations and the Scheme documents of the Company; and
(ii) has observed the investment and borrowing powers and restrictions applicable to the Company.
HSBC Bank plcThis report is given on the basis that no breaches are subsequently advised to us before the distribution date. We therefore reserve the right to amend the report in the light of such circumstances.
HSBC Bank plc
27 November 2018

Royal London Equity Funds ICVC6
Royal London Equity Funds ICVC
INDEPENDENT AUDITORS’ REPORT TO THE SHAREHOLDERS OF ROYAL LONDON EQUITY FUNDS ICVC (“THE COMPANY”)
Report on the audit of the financial statementsOpinion In our opinion, Royal London Equity Funds ICVC ‘s financial statements:
• give a true and fair view of the financial position of the Company and each of the sub-funds as at 31 August 2018 and of the net revenue and the net capital gains/losses of its scheme property of the Company and each of the sub-funds for the year then ended; and
• have been properly prepared in accordance with United Kingdom Generally Accepted Accounting Practice (United Kingdom Accounting Standards, comprising FRS 102 “The Financial Reporting Standard applicable in the UK and Republic of Ireland”, and applicable law), the Statement of Recommended Practice for UK Authorised Funds, the Collective Investment Schemes sourcebook and the Instrument of Incorporation.
Royal London Equity ICVC (the “company”) is an Open Ended Investment Company (‘OEIC’) with 17 sub-funds. The financial statements of the company comprise the financial statements of each of the sub-funds. We have audited the financial statements, included within [i] the Annual Report, which comprise: the balance sheets as at 31 August 2018; the statement of total return and the statement of change in net assets attributable to shareholders for the year then ended; [ii] the distribution tables; the accounting policies; and [iii] the notes to the financial statements.
Basis for opinionWe conducted our audit in accordance with International Standards on Auditing (UK) (“ISAs (UK)”) and applicable law. Our responsibilities under ISAs (UK) are further described in the Auditors’ responsibilities for the audit of the financial statements section of our report. We believe that the audit evidence we have obtained is sufficient and appropriate to provide a basis for our opinion.
IndependenceWe remained independent of the Company in accordance with the ethical requirements that are relevant to our audit of the financial statements in the UK, which includes the FRC’s Ethical Standard, and we have fulfilled our other ethical responsibilities in accordance with these requirements.
Conclusions relating to going concernWe have nothing to report in respect of the following matters in relation to which ISAs (UK) require us to report to you when:
• the Authorised Corporate Director’s use of the going concern basis of accounting in the preparation of the financial statements is not appropriate; or
• the Authorised Corporate Director has not disclosed in the financial statements any identified material uncertainties that may cast significant doubt about the Company’s ability to continue to adopt the going concern basis of accounting for a period of at least twelve months from the date when the financial statements are authorised for issue.
However, because not all future events or conditions can be predicted, this statement is not a guarantee as to the Company’s ability to continue as a going concern.
Reporting on other information The other information comprises all of the information in the Annual Report other than the financial statements and our auditors’ report thereon. The Authorised Corporate Director is responsible for the other information. Our opinion on the financial statements does not cover the other information and, accordingly, we do not express an audit opinion or, except to the extent otherwise explicitly stated in this report, any form of assurance thereon.
In connection with our audit of the financial statements, our responsibility is to read the other information and, in doing so, consider whether the other information is materially inconsistent with the financial statements or our knowledge obtained in the audit, or otherwise appears to be materially misstated. If we identify an apparent material inconsistency or material misstatement, we are required to perform procedures to conclude whether there is a material misstatement of the financial statements or a material misstatement of the other information. If, based on the work we have performed, we conclude that there is a material misstatement of this other information, we are required to report that fact. We have nothing to report based on these responsibilities.
Authorised Corporate Director’s ReportIn our opinion, the information given in the Authorised Corporate Director’s Report for the financial year for which the financial statements are prepared is consistent with the financial statements.

Royal London Equity Funds ICVC 7
Royal London Equity Funds ICVC
INDEPENDENT AUDITORS’ REPORT TO THE SHAREHOLDERS OF ROYAL LONDON EQUITY FUNDS ICVC (“THE COMPANY”) (CONTINUED)
Responsibilities for the financial statements and the auditResponsibilities of the Authorised Corporate Director for the financial statementsAs explained more fully in the Statement of Authorised Corporate Directors’ Responsibilities in Relation to the Financial Statements of the Company set out on page 4, the Authorised Corporate Director is responsible for the preparation of the financial statements in accordance with the applicable framework and for being satisfied that they give a true and fair view. The Authorised Corporate Director is also responsible for such internal control as they determine is necessary to enable the preparation of financial statements that are free from material misstatement, whether due to fraud or error.
In preparing the financial statements, the Authorised Corporate Director is responsible for assessing the Company’s ability to continue as a going concern, disclosing as applicable, matters related to going concern and using the going concern basis of accounting unless the Authorised Corporate Director either intends to wind up or terminate the Company or individual sub-fund, or have no realistic alternative but to do so.
Auditors’ responsibilities for the audit of the financial statementsOur objectives are to obtain reasonable assurance about whether the financial statements as a whole are free from material misstatement, whether due to fraud or error, and to issue an auditors’ report that includes our opinion. Reasonable assurance is a high level of assurance, but is not a guarantee that an audit conducted in accordance with ISAs (UK) will always detect a material misstatement when it exists. Misstatements can arise from fraud or error and are considered material if, individually or in the aggregate, they could reasonably be expected to influence the economic decisions of users taken on the basis of these financial statements.
A further description of our responsibilities for the audit of the financial statements is located on the Financial Reporting Council’s website at: www.frc.org.uk/auditors responsibilities. This description forms part of our auditors’ report.
Use of this reportThis report, including the opinions, has been prepared for and only for the Company’s shareholders as a body in accordance with paragraph 4.5.12 of the Collective Investment Schemes sourcebook as required by paragraph 67(2) of the Open-Ended Investment Companies Regulations 2001 and for no other purpose. We do not, in giving these opinions, accept or assume responsibility for any other purpose or to any other person to whom this report is shown or into whose hands it may come save where expressly agreed by our prior consent in writing.
Other required reportingOpinion on matter required by the Collective Investment Schemes sourcebookIn our opinion, we have obtained all the information and explanations we consider necessary for the purposes of the audit.
Collective Investment Schemes sourcebook exception reportingUnder the Collective Investment Schemes sourcebook we are required to report to you if, in our opinion:
• proper accounting records have not been kept; or
• the financial statements are not in agreement with the accounting records and returns.
We have no exceptions to report arising from this responsibility.
PricewaterhouseCoopers LLPChartered Accountants and Statutory AuditorsEdinburgh
27 November 2018
Royal London Equity Funds ICVC8
1. Accounting policiesBasis of accounting The financial statements have been prepared under the historical cost basis, as modified by the revaluation of investments, in compliance with the Financial Conduct Authority’s Collective Investment Schemes sourcebook. They have been prepared in accordance with FRS102 and the Statement of Recommended Practice for Authorised Funds (SORP) for Financial Statements of Authorised Funds issued by the Investment Management Association (now referred to as The Investment Association) in May 2014 (the 2014 SORP).
As stated in the Statement of Authorised Corporate Directors’ Responsibilities in relation to the Report and Financial Statements of the Company on page 4, the Authorised Corporate Director continues to adopt the going concern basis in the preparation of the financial statements of the Company.
The accounting policies outlined below have been applied on a consistent basis throughout the year.
Further analysis of the distribution and the net asset position can be found within the Financial Statements of the individual sub-funds.
Basis of valuation of investments The investments of the Company have been valued at the closing bid price on 31 August 2018, the last valuation point in the accounting year.
Unquoted, suspended and delisted investments are valued based on the Authorised Corporate Director’s (ACD) opinion of fair value, the intention of which is to estimate market value.
Exchange rates Assets and liabilities denominated in foreign currencies have been converted to sterling at the bid-market closing rates of exchange on 31 August 2018.
Foreign income and expenditure has been converted into sterling at the rate of exchange ruling at the date of transaction.
Recognition of revenue Revenue from equities and non-equity shares (including preference shares) is recognised when the security is quoted ex-dividend. Revenue from unquoted equity investments is recognised when the dividend is declared. Interest and revenue from bank balances and deposits, stock lending (net of fees paid) and other securities is recognised on an accruals basis.
Underwriting commission is taken to revenue and recognised when the issue takes place, except where the sub-fund is required to take up all or some of the shares underwritten, in which case an appropriate proportion of the commission is deducted from the cost of those shares.
UK dividends are shown net of any associated tax credits attached to the income.
Overseas revenue received after the deduction of withholding tax is shown gross of tax, with the tax consequences shown within the tax charge.
Special dividends are treated as revenue or capital according to the nature of the event giving rise to the payment.
Dividends from UK REITs are split into PID (Property Income Distributions) and Non-PID components for tax purposes. Revenue arising from UK REITs’ tax-exempt rental business is known as PID revenue. PID revenue received by the Fund is subject to corporation tax and is included within the corporation tax charged to the Fund in note 5. A UK REIT may also carry out activities that give rise to taxable profits and gains, it is from these that the REIT will make a Non-PID distribution, these are treated for tax purposes in the same way as dividends from UK companies and are reflected under UK dividends within the revenue note.
Dividends received from US REITS are allocated between revenue and capital for distribution purposes. The split is based on the year-end tax reporting data issued by the US REIT available on the website www.REIT.com. Where the split of revenue and capital has not been announced at the accounting date a provisional split will be used. The provision will be calculated on the prior year’s aggregated dividend split for each US REIT.
Treatment of expenses Expenses are recognised on an accruals basis.
The underlying sub-funds may currently have up to four share classes. Each share class applies a different ACD fee, which can be found in the constitution starting on page 287. Consequently the level of expenses attributable to each share class will differ.
Taxation Provision is made for taxation at current rates on the excess of investment revenue over allowable expenses, with relief for overseas taxation taken where appropriate.
Deferred tax is provided on all timing differences that have originated but not reversed by the balance sheet date. Deferred tax is not recognised on permanent differences.
Deferred tax assets are recognised only to the extent that it is more likely than not that there will be taxable profits from which the future reversal of the underlying timing differences can be deducted.
Authorised funds are exempt from UK Capital Gains Tax. However, sub-funds which invest in certain types of Indian assets are, in certain circumstances, subject to Indian Capital Gains Tax. At year end 31 August 2018 the Royal London Emerging Markets Equity Tracker Fund was the only sub-fund with direct exposure to these type of assets.
Treatment of derivative contracts The unrealised gain/(loss) on open future contracts is disclosed in the portfolio statement, where such contracts are held by an individual sub-fund. The margins paid on these contracts are included in the amounts held at derivative clearing houses and brokers.
Motives and circumstances are used to determine whether returns on derivative contracts should be treated as capital or revenue. Where positions are undertaken to protect or enhance capital and the circumstances support this, the returns are included within net capital gains/losses in the Statement of Total Return. Where they are undertaken for generating or protecting revenue and the circumstances support this, the returns are treated as revenue and are included within the net revenue in the Statement of Total Return. The basis of apportionment is typically made by reference to the yield on the underlying security, index or other appropriate source.
Dilution levy In certain circumstances the ACD may charge a dilution levy on the sale or repurchase of shares. The levy is intended to cover certain dealing charges not included in the value of the sub-fund used in calculating the share price, which could have a dilutive effect.
Normally the Company will only charge such a levy on a sub-fund experiencing large levels of net purchases or net redemptions relative to its size. Any dilution levy is charged at the discretion of the ACD.
Cross holdingThere were no cross holdings in the current or prior year for any sub-funds within the ICVC.
Royal London Equity Funds ICVC
SUMMARY OF SIGNIFICANT ACCOUNTING POLICIES FOR THE YEAR ENDED 31 AUGUST 2018

Royal London Equity Funds ICVC 9
SUMMARY OF SIGNIFICANT ACCOUNTING POLICIES (CONTINUED)FOR THE YEAR ENDED 31 AUGUST 2018
Royal London Equity Funds ICVC
2. Distribution policies Basis of distributionRevenue produced by the sub-funds’ investments accumulates during each accounting period. If at the end of the accounting period, revenue exceeds expenses, the net revenue of each sub-fund is available to be distributed, at share class level, to shareholders.
The following sub-funds make distributions on a quarterly basis: UK Equity Income and UK Dividend Growth. UK Dividend Growth began quarterly distributions from the period commencing 1 March 2018.
The following sub-funds make distributions on a half yearly basis: European Opportunities, Japan Tracker, FTSE® 350 Tracker, UK All Share Tracker, European Growth, UK Equity, UK Smaller Companies, Asia Pacific ex Japan Tracker, Europe ex UK Tracker, Global Equity Diversified and Global Equity Select.
The following sub-funds make distributions on an annual basis: UK Mid Cap Growth, UK Opportunities, US Tracker and Emerging Markets Equity Tracker.
Marginal tax relief is not taken into account when determining the amount of revenue available for distribution.
Apportionment to multiple share classesThe allocation of revenue and expenses to each share class is based on the proportion of the sub-fund’s assets attributable to each share class on the day the revenue is earned or the expense is suffered. The ACD’s management charge is specific to each share class.
Policy for stock dividends The ordinary element of stock dividends is treated as capital so does not form part of the distribution, except in the case of UK Equity Income where stock dividend income is distributed.
In the case of an enhanced stock dividend the value of the enhancement is treated as capital and also does not form part of the distribution.
ExpensesIn determining the net revenue available for distribution, expenses related to the purchase and sale of investments are borne wholly by capital. In the case of UK Equity Income and UK Dividend Growth sub-funds, all expenses are borne by capital. The UK Dividend Growth sub-fund began charging expenses to capital from 1 March 2018.
EqualisationEqualisation applies only to shares purchased during the distribution period (Group 2 shares). It represents the accrued revenue included in the purchase price of the shares. After averaging it is returned with the distribution as a capital repayment. It is not liable to Income Tax but must be deducted from the cost of the shares for Capital Gains Tax purposes.
3. Risk management policies In accordance with its investment objective, the Company holds financial instruments such as equity shares, non-equity shares, cash and has short-term debtors and creditors. The risks arising from the Company’s financial instruments are summarised below and remain unchanged from the prior year. Further details can be found on pages 290 to 292.
Market risk The main risk arising from the Company’s financial instruments is market price risk which arises from the uncertainty about future prices.
The individual Fund Managers of the sub-funds review the portfolios in order to consider the asset allocation implications and to minimise the risk associated with particular countries or industry sectors, whilst continuing to follow the sub-funds’ investment objectives.
The ACD adheres to the investment guidelines and investment and borrowing powers established in the Prospectus and in the Rules governing the operations of ICVCs. In this way the ACD monitors and controls the exposure to risk from any type of security, market sector or individual issuer.
Credit and liquidity risk Credit risk is the risk that one party to a financial instrument will cause a financial loss for the other party by failing to discharge an obligation. This includes counterparty and issuer risk. Cash is held with reputable credit institutions and credit risk is assessed on a regular basis. Certain transactions in securities that the Company enters into expose it to the risk that a counterparty will not deliver the investment for a purchase, or cash for a sale after the Company has fulfilled its responsibilities. The Company only buys and sells investments through brokers which have been approved by the Manager as an acceptable counterparty and these are reviewed on an ongoing basis.
The Company’s assets comprise mainly readily available realisable securities, which can be sold to meet funding requirements if and when necessary.
The main liability of the Company is the redemption of any shares that investors wish to sell. Liquidity risk, mainly derived from the liability to shareholders, is minimised through holding cash and readily realisable securities which can meet the usual requirements of share redemptions. The liquidity risk for all sub-funds has been deemed insignificant therefore numerical disclosures are not required.
Currency risk The value of the Company’s investments may be affected by currency movements since a proportion of the assets are denominated in currencies other than sterling. The ACD may, from time to time, seek to mitigate the effect of these currency exposures by covering a proportion of its investments using forward currency hedges. However, no such arrangements were in place at the year end. The Company may also be subject to short-term exposure to exchange rate movements, for example where there is a delay between dealing and subsequent settlement. However, the ACD considers that this does not pose a significant risk given the short-term nature of this exposure. The risk of currency movements on the income property of the Company is minimised by converting income received in foreign currency into sterling on the date of transaction.
Interest rate riskThe Company’s exposure to interest rate risk is limited to balances held at the bank as disclosed in the balance sheet. Changes to the rate of interest applied on the underlying balances will affect the Company accordingly. All cash balances earn interest at a variable rate. Interest rate risk is considered insignificant so no disclosures have been made within the sub-funds.
Derivatives riskThe ACD may employ derivatives for the purpose of efficient portfolio management. All derivative trading is in the form of instruments listed on a regulated exchange. Financial futures are used in particular for efficient management of cashflow, i.e. to deal with the control of marginal cashflow monies – for example, investment of anticipated dividend receipts, as well as to effect re-allocations of assets. Futures allow the ACD to obtain market exposure quickly (thereby reducing risk) and cheaply (reducing cost).

Royal London Equity Funds ICVC10
Royal London European Opportunities Fund
Fund Performance12 months to 31 August 2018
1 year total return
%
3 year total return
%
5 year total return
%Royal London European Opportunities Fund, Class M Accumulation -0.05 41.32 57.51
Past performance is not necessarily a reliable indicator of future performance. The value of investments and the income from them is not guaranteed and may go down as well as up, and investors may not get back the amount originally invested.
Source: RLAM and Lipper, as at 31 August 2018. Returns are net of management fees. Please note that the performance table contains performance for fund share classes only. Investors should also note that the total return is calculated on the Fund’s official midday price whereas the Fund has been valued as at close of business for the Net Asset Value quoted within the Comparative Table. For wider comparisons such as Investment Association sector averages and peer group rankings, please refer to the latest factsheet at www.rlam.co.uk.
Performance OverviewThe return from the Fund was behind the broad European equity market during the 12-month period under review, using the FTSE® World Europe (ex UK) Index as a guide. Concern about world trade wars and protectionism impacted some holdings in the portfolio, which tends to be overweight global growth companies relative to the index.
Market and Portfolio CommentaryEuropean and global economic growth was generally supportive for equities during the term under review, although the eurozone economy slowed noticeably in the first half of this year after a strong run of activity in the latter months of 2017. Corporate earnings also tended to be broadly positive. However, concern about global protectionism was a negative theme as the US and China maintained heated rhetoric on world trade and imposed tariffs, some of which affected products imported from Europe. Political developments in the eurozone also were problematic, underlining the continued loss of support for mainstream parties and stronger backing for more extreme views; German and Italian elections ended with no clear outcome, and an openly eurosceptic and anti-immigrant government took office in Italy. The European Central Bank (ECB) maintained its programme of monetary stimulus, albeit at a reduced pace, while keeping interest rates unchanged; elsewhere, the US Federal Reserve continued its measured rate increases. The euro weakened against the dollar during the period as a whole, as the gap between US and eurozone policy rates widened.
Ubisoft Entertainment, LVMH and Davide Campari were prominent contributors to Fund returns. Video game developer Ubisoft continued to record rapid growth in revenue as digital sales of games increase and consumers devote more time and money to gaming, rather than traditional forms of entertainment. The stock performed particularly well in October as Ubisoft announced a buyback programme and in April as the company reported annual sales and profit that beat its own forecasts. LVMH, the world’s biggest luxury goods company, is benefiting from revived demand in China after a multiyear crackdown on corruption ended and released record full-year results, spurred by double-digit gains in revenue at most of its divisions. Sales growth remained strong at beverage company Davide Campari, supported by rising demand for brands including aperitif Aperol and Wild Turkey bourbon whiskey. Aperol maintained its double-digit annual sales growth, and the brand is becoming an increasingly significant contributor to group revenues.
The holdings of A.P. Moeller-Maersk, Valeo and Bayer detracted from performance. Maersk, owner of the world’s largest container shipping line, and Valeo, a maker of automotive components with activities in 33 countries, were hampered by the climate of high-profile US commentary on world trade, which included a threat to levy tariffs on vehicles imported into the country from Europe. Maersk also was hurt by a combination of pressure on freight rates and rising prices for ship fuel, and lowered its forecast for annual profit in July. Valeo was particularly weak in February, when the company reported results and guidance that fell short of market expectations, and in July, when it said higher costs and regulation in Europe
would curb growth. German life sciences company Bayer completed its takeover of US agrochemical company Monsanto in June, paying more than $60 billion; only two months later, in the first of a wave of lawsuits to go to trial, a US jury said Monsanto had failed to warn of health risks from an herbicide. Bayer stock fell sharply as Monsanto was ordered to pay almost $300 million to a man who said the product caused his illness.
The Fund established positions during the review period including flavourings and fragrances company Symrise and jet engine manufacturer Safran. Budget airline operator Ryanair Holdings, mechanical engineering company Duerr and Maersk were among allocations that were sold, and profits were taken on exposures including financial DNB and Ubisoft.
The Fund aims to achieve capital growth by investing in a concentrated portfolio of predominantly European company shares that the managers believe have the potential for above average growth and typically holds 30 to 40 positions. The managers prefer businesses, products or services that are able to grow faster than the broader economy, operate in markets with high barriers to entry, and generate strong cashflows.
Investment OutlookThe ECB will end its monetary stimulus after December; we expect rates to remain unchanged until the second half of 2019. Eurozone growth has returned to a solid, unspectacular pace which appears more sustainable. Upside is limited in part by exposure to external risks and political concerns.
Steve BoltonFund ManagerSebastien BeguelinAssistant Fund Manager31 August 2018Royal London Asset Management
Please note that Steven Bolton and Sebastien Beguelin started managing the Fund on 1 October 2017. The previous Fund Manager was Mike Fox.
The views expressed are the author’s own and do not constitute investment advice and are not an indication of future fund performance. Portfolio holdings are subject to change, for information only and are not investment recommendations.
Source: Royal London Asset Management, unless otherwise stated.
MANAGER’S INVESTMENT REPORT
Royal London Equity Funds ICVC 11
Royal London European Opportunities Fund
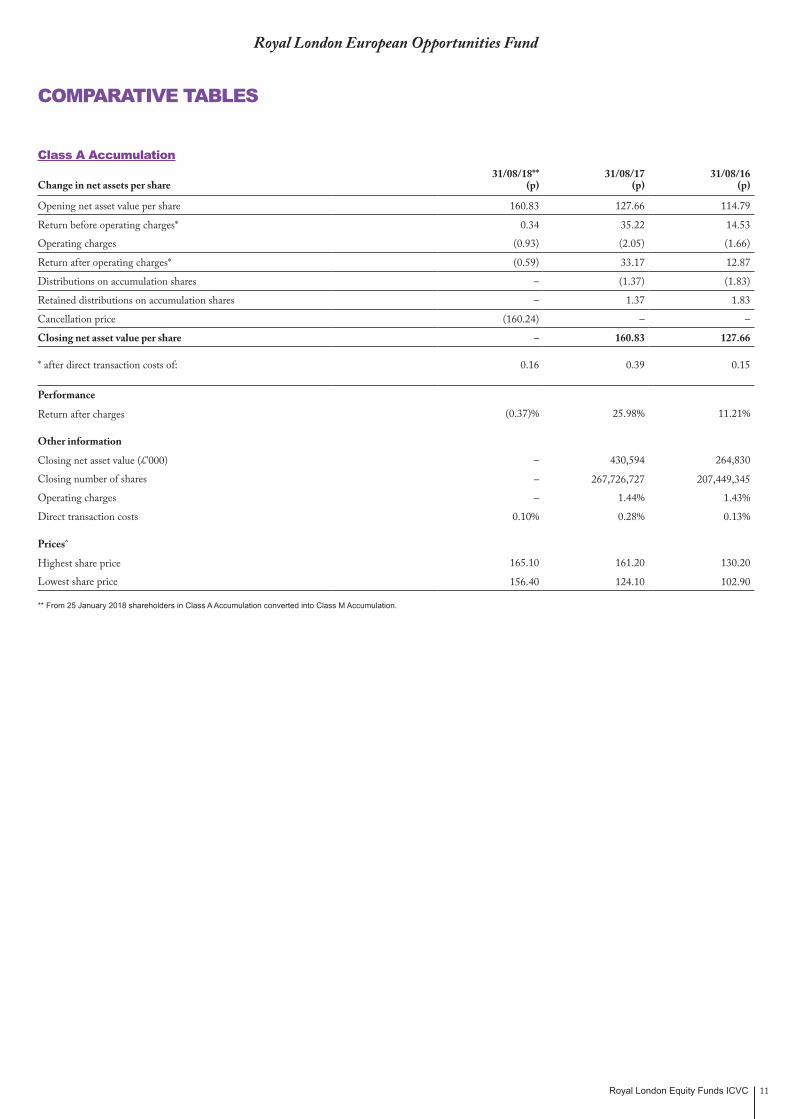
Class A Accumulation31/08/18** 31/08/17 31/08/16
Change in net assets per share (p) (p) (p)
Opening net asset value per share 160.83 127.66 114.79
Return before operating charges* 0.34 35.22 14.53
Operating charges (0.93) (2.05) (1.66)
Return after operating charges* (0.59) 33.17 12.87
Distributions on accumulation shares – (1.37) (1.83)
Retained distributions on accumulation shares – 1.37 1.83
Cancellation price (160.24) – –
Closing net asset value per share – 160.83 127.66
* after direct transaction costs of: 0.16 0.39 0.15
Performance
Return after charges (0.37)% 25.98% 11.21%
Other information
Closing net asset value (£'000) – 430,594 264,830
Closing number of shares – 267,726,727 207,449,345
Operating charges – 1.44% 1.43%
Direct transaction costs 0.10% 0.28% 0.13%
Prices^
Highest share price 165.10 161.20 130.20
Lowest share price 156.40 124.10 102.90
** From 25 January 2018 shareholders in Class A Accumulation converted into Class M Accumulation.
COMPARATIVE TABLES

Royal London Equity Funds ICVC12
Royal London European Opportunities Fund
COMPARATIVE TABLES (CONTINUED)
Class M Accumulation31/08/18 31/08/17 31/08/16
Change in net assets per share (p) (p) (p)
Opening net asset value per share 195.95 154.45 137.89
Return before operating charges* 0.09 42.77 17.59
Operating charges (1.40) (1.27) (1.03)
Return after operating charges* (1.31) 41.50 16.56
Distributions on accumulation shares (3.01) (2.74) (3.28)
Retained distributions on accumulation shares 3.01 2.74 3.28
Closing net asset value per share 194.64 195.95 154.45
* after direct transaction costs of: 0.19 0.48 0.18
Performance
Return after charges (0.67)% 26.87% 12.01%
Other information
Closing net asset value (£'000) 457,909 331 250
Closing number of shares 235,254,410 169,096 161,631
Operating charges 0.74% 0.74% 0.73%
Direct transaction costs 0.10% 0.28% 0.13%
Prices^
Highest share price 201.30 196.30 157.50
Lowest share price 177.90 150.40 124.00
^ The high and low prices disclosed are the high and low prices for the accounting period and not the calendar year. The net asset value per share price is based on the net asset value in the published financial statements and may be different due to the prior year end accounting adjustments.
It should be remembered that past performance is not a reliable indicator of future performance and that the value of shares, and the income derived from them, can vary.
Royal London Equity Funds ICVC 13
Royal London European Opportunities Fund
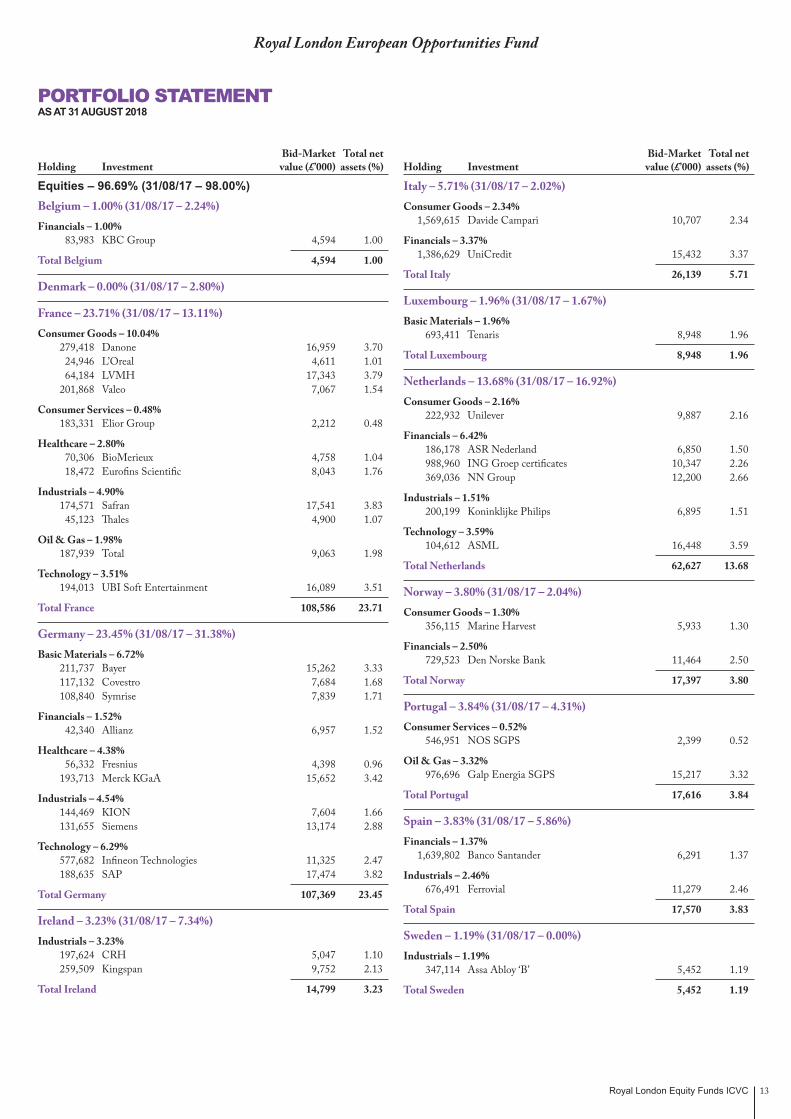
Equities – 96.69% (31/08/17 – 98.00%) Belgium – 1.00% (31/08/17 – 2.24%) Financials – 1.00% 83,983 KBC Group 4,594 1.00
Total Belgium 4,594 1.00
Denmark – 0.00% (31/08/17 – 2.80%)
France – 23.71% (31/08/17 – 13.11%) Consumer Goods – 10.04% 279,418 Danone 16,959 3.70 24,946 L’Oreal 4,611 1.01 64,184 LVMH 17,343 3.79 201,868 Valeo 7,067 1.54
Consumer Services – 0.48% 183,331 Elior Group 2,212 0.48
Healthcare – 2.80% 70,306 BioMerieux 4,758 1.04 18,472 Eurofins Scientific 8,043 1.76
Industrials – 4.90% 174,571 Safran 17,541 3.83 45,123 Thales 4,900 1.07
Oil & Gas – 1.98% 187,939 Total 9,063 1.98
Technology – 3.51% 194,013 UBI Soft Entertainment 16,089 3.51
Total France 108,586 23.71
Germany – 23.45% (31/08/17 – 31.38%) Basic Materials – 6.72% 211,737 Bayer 15,262 3.33 117,132 Covestro 7,684 1.68 108,840 Symrise 7,839 1.71
Financials – 1.52% 42,340 Allianz 6,957 1.52
Healthcare – 4.38% 56,332 Fresnius 4,398 0.96 193,713 Merck KGaA 15,652 3.42
Industrials – 4.54% 144,469 KION 7,604 1.66 131,655 Siemens 13,174 2.88
Technology – 6.29% 577,682 Infineon Technologies 11,325 2.47 188,635 SAP 17,474 3.82
Total Germany 107,369 23.45
Ireland – 3.23% (31/08/17 – 7.34%) Industrials – 3.23% 197,624 CRH 5,047 1.10 259,509 Kingspan 9,752 2.13
Total Ireland 14,799 3.23
Italy – 5.71% (31/08/17 – 2.02%) Consumer Goods – 2.34% 1,569,615 Davide Campari 10,707 2.34
Financials – 3.37% 1,386,629 UniCredit 15,432 3.37
Total Italy 26,139 5.71
Luxembourg – 1.96% (31/08/17 – 1.67%) Basic Materials – 1.96% 693,411 Tenaris 8,948 1.96
Total Luxembourg 8,948 1.96
Netherlands – 13.68% (31/08/17 – 16.92%) Consumer Goods – 2.16% 222,932 Unilever 9,887 2.16
Financials – 6.42% 186,178 ASR Nederland 6,850 1.50 988,960 ING Groep certificates 10,347 2.26 369,036 NN Group 12,200 2.66
Industrials – 1.51% 200,199 Koninklijke Philips 6,895 1.51
Technology – 3.59% 104,612 ASML 16,448 3.59
Total Netherlands 62,627 13.68
Norway – 3.80% (31/08/17 – 2.04%) Consumer Goods – 1.30% 356,115 Marine Harvest 5,933 1.30
Financials – 2.50% 729,523 Den Norske Bank 11,464 2.50
Total Norway 17,397 3.80
Portugal – 3.84% (31/08/17 – 4.31%) Consumer Services – 0.52% 546,951 NOS SGPS 2,399 0.52
Oil & Gas – 3.32% 976,696 Galp Energia SGPS 15,217 3.32
Total Portugal 17,616 3.84
Spain – 3.83% (31/08/17 – 5.86%) Financials – 1.37% 1,639,802 Banco Santander 6,291 1.37
Industrials – 2.46% 676,491 Ferrovial 11,279 2.46
Total Spain 17,570 3.83
Sweden – 1.19% (31/08/17 – 0.00%) Industrials – 1.19% 347,114 Assa Abloy ‘B’ 5,452 1.19
Total Sweden 5,452 1.19
PORTFOLIO STATEMENTAS AT 31 AUGUST 2018
Bid-Market Total net Holding Investment value (£’000) assets (%)
Bid-Market Total net Holding Investment value (£’000) assets (%)
Royal London Equity Funds ICVC14
Royal London European Opportunities Fund
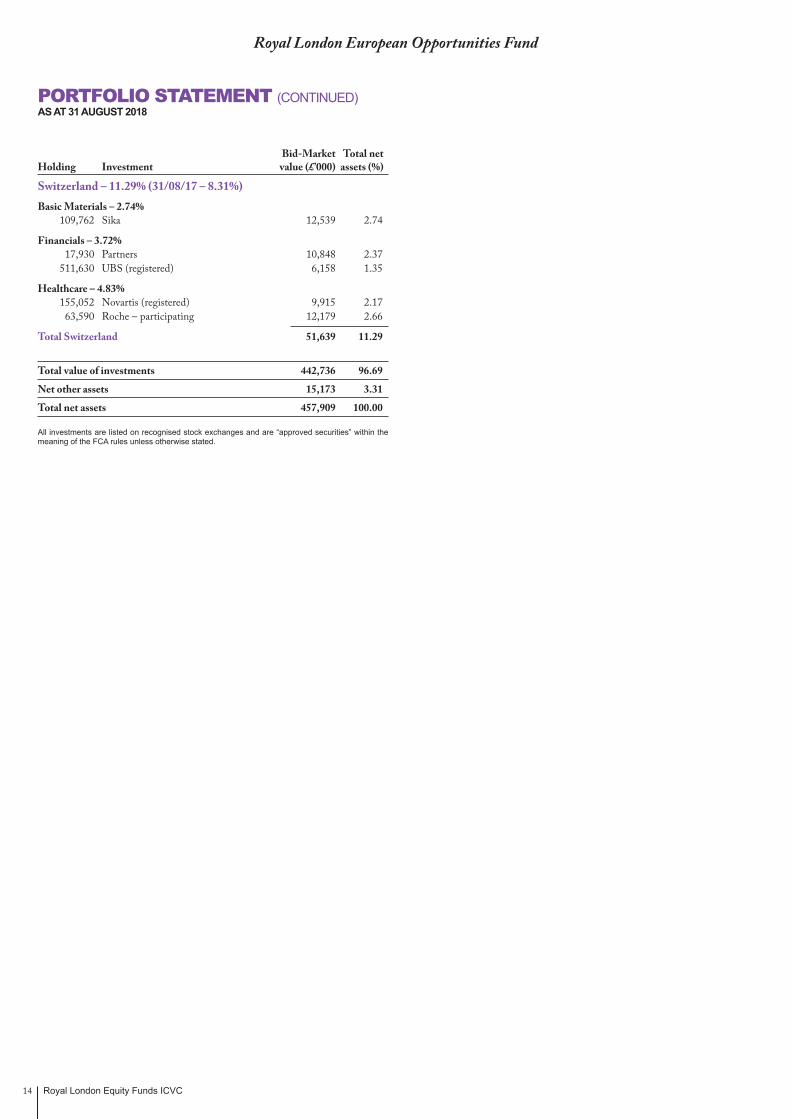
PORTFOLIO STATEMENT (CONTINUED)AS AT 31 AUGUST 2018
Switzerland – 11.29% (31/08/17 – 8.31%) Basic Materials – 2.74% 109,762 Sika 12,539 2.74
Financials – 3.72% 17,930 Partners 10,848 2.37 511,630 UBS (registered) 6,158 1.35
Healthcare – 4.83% 155,052 Novartis (registered) 9,915 2.17 63,590 Roche – participating 12,179 2.66
Total Switzerland 51,639 11.29
Total value of investments 442,736 96.69
Net other assets 15,173 3.31
Total net assets 457,909 100.00
All investments are listed on recognised stock exchanges and are “approved securities” within the meaning of the FCA rules unless otherwise stated.
Bid-Market Total net Holding Investment value (£’000) assets (%)

Royal London Equity Funds ICVC 15
Royal London European Opportunities Fund
SUMMARY OF MATERIAL PORTFOLIO CHANGESFOR THE YEAR ENDED 31 AUGUST 2018
Significant Purchases
Cost £’000
UniCredit 22,957
Safran 14,826
Merck KGaA 10,586
Tenaris 9,566
Total 9,378
Covestro 9,085
Siemens 8,979
Sika ‘B’ 8,655
Bayer 8,524
Danone 8,045
Subtotal 110,601
Total cost of purchases, including the above, for the year 274,439
Significant Sales
Proceeds £’000
UBI Soft Entertainment 14,642
Henkel 13,652
Ryanair 12,824
RELX 11,818
Infineon Technologies 9,929
Deutsche Telekom 9,652
KION 9,412
A.P. Moller-Maersk A/S 9,347
ASML 8,786
Unilever 8,499
Subtotal 108,561
Total proceeds from sales, including the above, for the year 246,291

Royal London Equity Funds ICVC16
Royal London European Opportunities Fund
FINANCIAL STATEMENTS
Statement of Total Returnfor the year ended 31 August 2018
Note £’000
Year ended31 August 2018
£’000 £’000
Year ended31 August 2017
£’000
Income Net capital (losses)/gains 2 (7,427) 75,825 Revenue 3 9,663 8,999
Expenses 4 (4,217) (4,804)Interest payable and similar charges (13) (2)
Net revenue before taxation 5,433 4,193 Taxation 5 (1,918) (773)
Net revenue after taxation 3,515 3,420
Total return before distributions (3,912) 79,245 Distributions 6 (6,262) (3,337)
Change in net assets attributable to shareholders from investment activities (10,174) 75,908
Statement of Change in Net Assets Attributable to Shareholdersfor the year ended 31 August 2018
£’000
Year ended31 August 2018
£’000 £’000
Year ended31 August 2017
£’000
Opening net assets attributable to shareholders 430,925 265,080
Amounts receivable on creation of shares 139,875 144,462 Amounts payable on cancellation of shares (109,821) (58,274)
30,054 86,188
Dilution levy charged 118 66 Change in net assets attributable to shareholders from investment activities (10,174) 75,908 Retained distributions on accumulation shares 6,985 3,683 Unclaimed distributions 1 –
Closing net assets attributable to shareholders 457,909 430,925
Royal London Equity Funds ICVC 17
Royal London European Opportunities Fund
FINANCIAL STATEMENTS (CONTINUED)
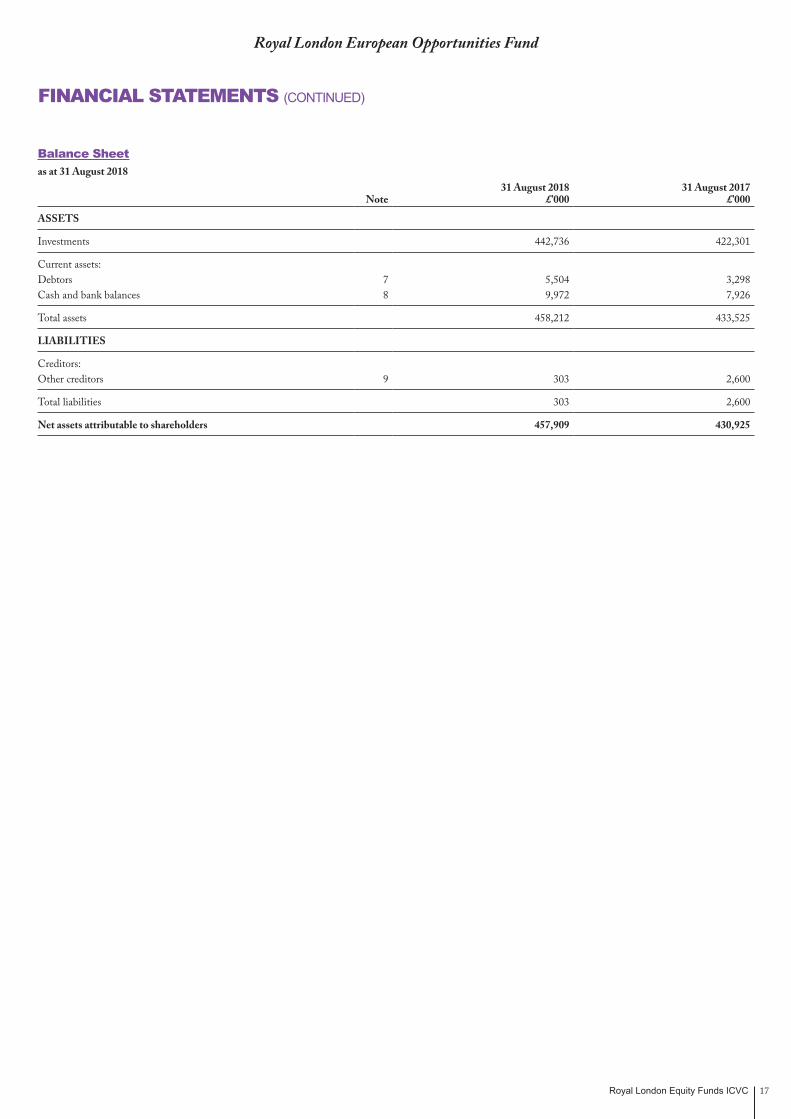
Balance Sheetas at 31 August 2018
Note31 August 2018
£’00031 August 2017
£’000
ASSETS
Investments 442,736 422,301
Current assets:Debtors 7 5,504 3,298Cash and bank balances 8 9,972 7,926
Total assets 458,212 433,525
LIABILITIES
Creditors:Other creditors 9 303 2,600
Total liabilities 303 2,600
Net assets attributable to shareholders 457,909 430,925
Royal London Equity Funds ICVC18
Royal London European Opportunities Fund
NOTES TO THE FINANCIAL STATEMENTSFOR THE YEAR ENDED 31 AUGUST 2018
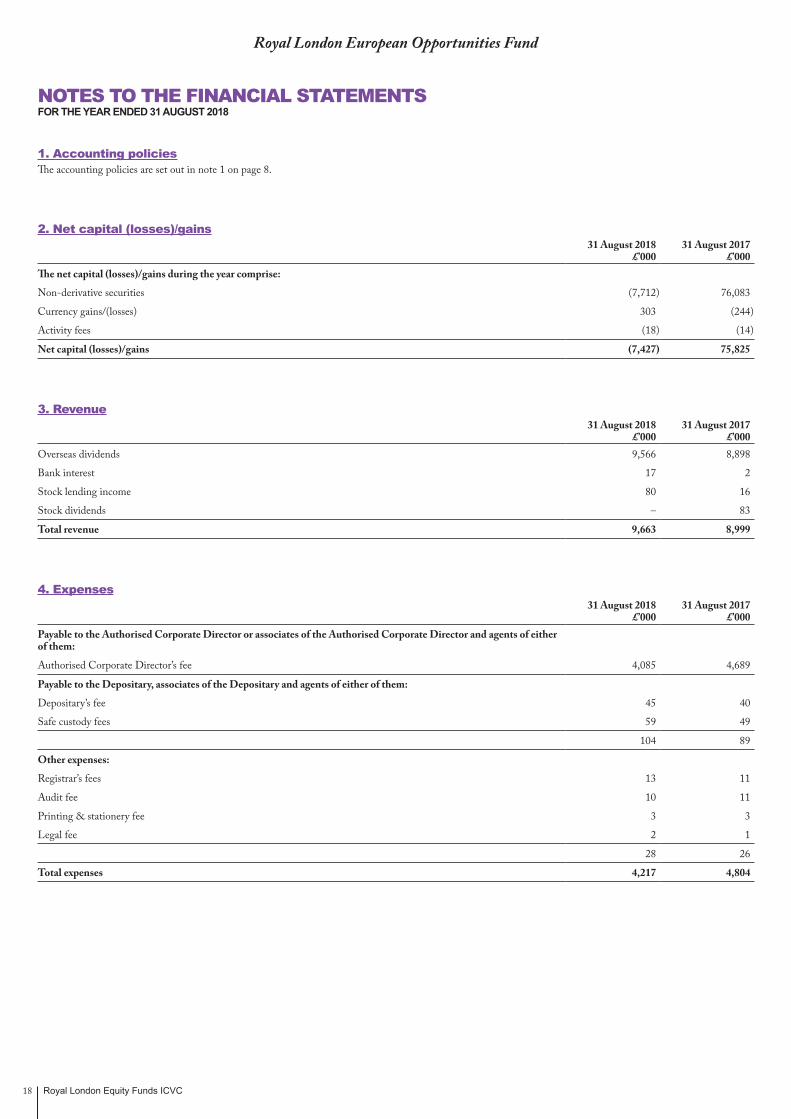
1. Accounting policiesThe accounting policies are set out in note 1 on page 8.
2. Net capital (losses)/gains31 August 2018
£’00031 August 2017
£’000The net capital (losses)/gains during the year comprise:
Non-derivative securities (7,712) 76,083
Currency gains/(losses) 303 (244)
Activity fees (18) (14)
Net capital (losses)/gains (7,427) 75,825
3. Revenue31 August 2018
£’00031 August 2017
£’000Overseas dividends 9,566 8,898
Bank interest 17 2
Stock lending income 80 16
Stock dividends – 83
Total revenue 9,663 8,999
4. Expenses31 August 2018
£’00031 August 2017
£’000Payable to the Authorised Corporate Director or associates of the Authorised Corporate Director and agents of either of them:
Authorised Corporate Director’s fee 4,085 4,689
Payable to the Depositary, associates of the Depositary and agents of either of them:
Depositary’s fee 45 40
Safe custody fees 59 49
104 89
Other expenses:
Registrar’s fees 13 11
Audit fee 10 11
Printing & stationery fee 3 3
Legal fee 2 1
28 26
Total expenses 4,217 4,804

Royal London Equity Funds ICVC 19
5. Taxationa) Analysis of charge for the year
31 August 2018£’000
31 August 2017£’000
Irrecoverable overseas tax 1,175 773
Swiss withholding tax reclaims written off 743 –
Current tax charge for the year 1,918 773
b) Factors affecting the current tax charge for the yearThe tax assessed for the year is higher (31/08/17: lower) than the standard rate of corporation tax in the UK for an Open Ended Investment Company (20%).
The differences are explained below:
Net revenue before taxation 5,433 4,193
Corporation tax at 20% (31/08/17: 20%) 1,087 839
Effects of:
Revenue not subject to taxation (1,779) (1,693)
Current year management expenses not utilised 712 870
Irrecoverable overseas tax 1,175 773
Swiss withholding tax reclaims written off 743 –
Tax relief on overseas tax suffered (20) (16)
Current tax charge for the year 1,918 773
Authorised Open Ended Investment Companies are exempt from UK tax on capital gains, therefore any capital gains/(losses) are not included in the reconciliation above.
c) Provision for deferred taxThere was no provision required for deferred tax at the balance sheet date (31/08/17: same).
d) Factors that may affect future tax chargesAt the year end, there is a potential deferred tax asset of £6,568,000 (31/08/17: £5,856,000) in relation to surplus management expenses. It is unlikely the Fund will generate sufficient taxable profits in the future to utilise these expenses and therefore no deferred tax asset has been recognised in the year.
6. DistributionsThe distributions take account of income received on the issue of shares and income deducted on the cancellation of shares and comprise:
31 August 2018 £’000
31 August 2017 £’000
Accumulation shares
Interim 360 –
Final 6,625 3,683
6,985 3,683
Add: Amounts deducted on cancellation of shares 30 243
Deduct: Amounts received on the creation of shares (753) (589)
Net distributions for the year 6,262 3,337
The difference between the net revenue after taxation and the distribution paid is as follows:
Net revenue after taxation 3,515 3,420
Stock dividend charged to capital – (83)
Income deficit transfer to capital* 2,747 –
Net distributions for the year 6,262 3,337
* The A Accumulation class was in a deficit position when terminated.
Details of the distribution per share are set out on page 24.
Royal London European Opportunities Fund
NOTES TO THE FINANCIAL STATEMENTS (CONTINUED)FOR THE YEAR ENDED 31 AUGUST 2018

Royal London Equity Funds ICVC20
Royal London European Opportunities Fund
NOTES TO THE FINANCIAL STATEMENTS (CONTINUED)FOR THE YEAR ENDED 31 AUGUST 2018
7. Debtors31 August 2018
£’00031 August 2017
£’000Sales awaiting settlement 4,579 1,620
Accrued revenue 367 316
Withholding tax recoverable 558 1,362
Total debtors 5,504 3,298
8. Cash and bank balances31 August 2018
£’00031 August 2017
£’000Cash and bank balances 9,972 7,926
Total cash and bank balances 9,972 7,926
9. Other creditors31 August 2018
£’00031 August 2017
£’000Purchases awaiting settlement – 2,044
Accrued expenses 303 556
Total other creditors 303 2,600
10. Reconciliation of number of sharesClass A
AccumulationClass M
AccumulationOpening shares at 01/09/17 267,726,727 169,096
Shares issued 23,273,495 53,958,307
Shares cancelled (45,561,430) (19,752,183)
Shares converted (245,438,792) 200,879,190
Closing shares at 31/08/18 – 235,254,410
All classes within the Fund have the same rights on winding up.
11. Contingent liabilities and outstanding commitmentsThere were no contingent liabilities or outstanding commitments at the balance sheet date (31/08/17: same).
12. Related party transactionsThe Fund’s Authorised Corporate Director, Royal London Unit Trust Managers Limited, is a related party to the Fund as defined by Financial Reporting Standard 102 ‘Related Party Disclosures’.
Authorised Corporate Director fees charged by Royal London Unit Trust Managers Limited are shown in note 4 and details of shares created and cancelled by Royal London Unit Trust Managers Limited are shown in the Statement of Change in Net Assets Attributable to Shareholders and note 6. At the year end the balance due to Royal London Unit Trust Managers Limited in respect of these transactions was £273,000 (31/08/17: £524,000).
At the year end, 31 August 2018, 99.89% (31/08/17: 99.89%) of the shares in issue were held by The Royal London Mutual Insurance Society Limited. Royal London Unit Trust Managers Limited is a wholly owned subsidiary of The Royal London Mutual Insurance Society Limited.

Royal London Equity Funds ICVC 21
13. Stock lending activitiesThe Fund carried out stock lending activities for the purpose of efficient portfolio management and in order to generate income. Revenue earned from these activities is shown in note 3 and is net of bank and agents fees amounting to £20,000 (Gross: £100,000) (31/08/17: £4,000 (Gross: £20,000)) payable to HSBC Bank plc.
The value of stock on loan at the balance sheet date was £25,186,000 (31/08/17: £21,737,000).
The collateral held by asset type at the year end is stated below:
Asset class
31 August 2018 Collateral Held
£’000
31 August 2017 Collateral Held
£’000Equities 23,924 10,747
Bonds 2,954 11,487
The aggregate value of collateral held at the balance sheet date was £26,878,000 (31/08/17: £22,234,000). Collateral may be in the form of cash, UK gilts, certificates of deposit, treasury bills, sovereign debt, eurosterling bonds and equities; where the ACD approves the asset it will be held to reduce counterparty exposure. The value of the collateral held is greater than the value of the securities on loan and is monitored as part of the efficient portfolio management process.
The counterparties at the year end were Credit Suisse Securities (Europe) Limited, Morgan Stanley & Co International, Bank of Nova Scotia and Natixis.
14. Risk disclosuresThe policies applied to the management of risk disclosures are set out on page 9.
The fair values of the Fund’s assets and liabilities are represented by the values shown in the balance sheet on page 17. There is no material difference between the value of the financial assets and liabilities, as shown in the balance sheet, and their fair value.
A significant proportion of the Fund’s assets are denominated in currencies other than sterling. The value of the Fund’s assets may be affected by currency movements.
Currency31 August 2018
£’00031 August 2017
£’000Sterling 4,256 6,604
Danish krone 262 12,133
Euro 372,522 366,806
Norwegian krone 20,074 8,770
Polish zloty 4 4
Swedish krona 5,531 9
Swiss franc 55,244 36,576
Turkish lira 8 15
US dollar 8 8
Total 457,909 430,925
If sterling to foreign currency exchange rates had increased by 10% as at the balance sheet date, the net asset value of the Fund would have decreased by £45,365,000 (31/08/17: £42,432,000). If sterling to foreign currency exchange rates had decreased by 10% as at the balance sheet date, the net asset value of the Fund would have increased by £45,365,000 (31/08/17: £42,432,000). These calculations assume all other variables remain constant.
If market prices had increased by 10% as at the balance sheet date, the net asset value of the Fund would have increased by £44,274,000 (31/08/17: £42,230,000). If market prices had decreased by 10% as at the balance sheet date, the net asset value of the Fund would have decreased by £44,274,000 (31/08/17: £42,230,000). These calculations assume all other variables remain constant.
The only interest bearing assets are cash balances of £9,972,000 (31/08/17: £7,926,000) which earn interest by reference to LIBOR or international equivalent.
Interest risk is considered insignificant so no sensitivity analysis is required (31/08/17: same).
FX risk is insignificant (31/08/17: same).
Royal London European Opportunities Fund
NOTES TO THE FINANCIAL STATEMENTS (CONTINUED)FOR THE YEAR ENDED 31 AUGUST 2018
Royal London Equity Funds ICVC22
Royal London European Opportunities Fund
NOTES TO THE FINANCIAL STATEMENTS (CONTINUED)FOR THE YEAR ENDED 31 AUGUST 2018
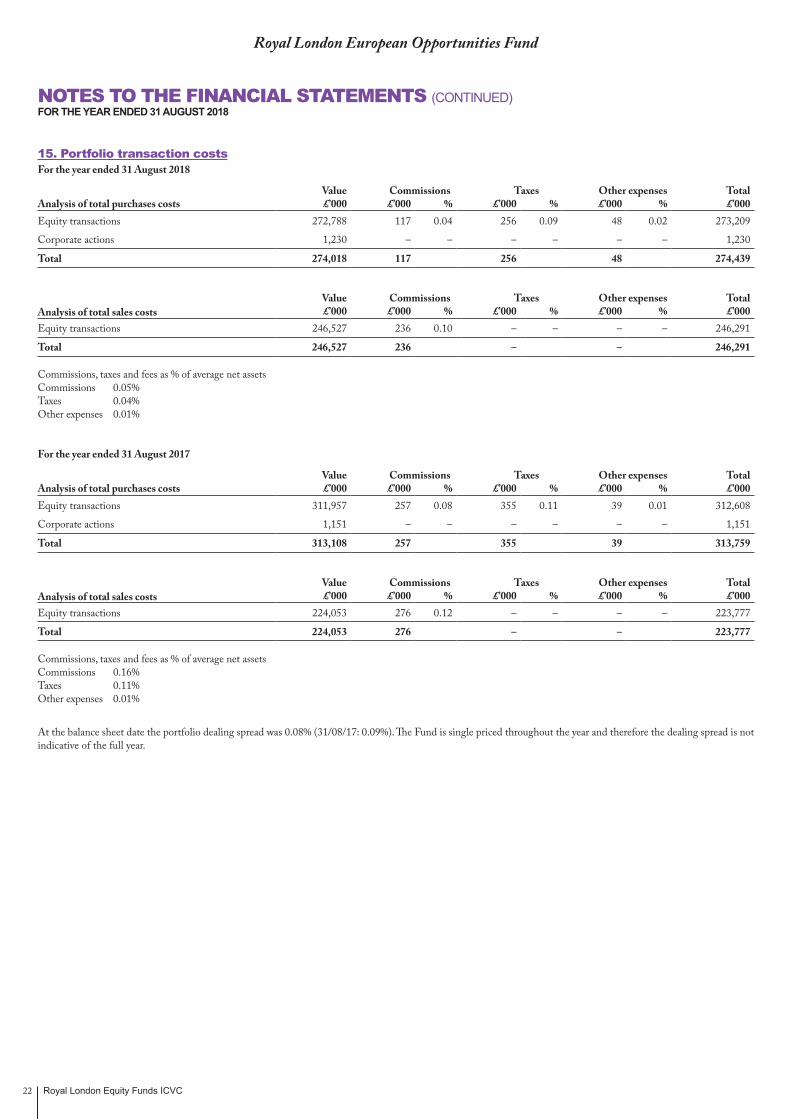
15. Portfolio transaction costsFor the year ended 31 August 2018
Value Commissions Taxes Other expenses TotalAnalysis of total purchases costs £’000 £’000 % £’000 % £’000 % £’000Equity transactions 272,788 117 0.04 256 0.09 48 0.02 273,209
Corporate actions 1,230 – – – – – – 1,230
Total 274,018 117 256 48 274,439
Value Commissions Taxes Other expenses TotalAnalysis of total sales costs £’000 £’000 % £’000 % £’000 % £’000Equity transactions 246,527 236 0.10 – – – – 246,291
Total 246,527 236 – – 246,291
Commissions, taxes and fees as % of average net assetsCommissions 0.05%Taxes 0.04%Other expenses 0.01%
For the year ended 31 August 2017
Value Commissions Taxes Other expenses TotalAnalysis of total purchases costs £’000 £’000 % £’000 % £’000 % £’000Equity transactions 311,957 257 0.08 355 0.11 39 0.01 312,608
Corporate actions 1,151 – – – – – – 1,151
Total 313,108 257 355 39 313,759
Value Commissions Taxes Other expenses TotalAnalysis of total sales costs £’000 £’000 % £’000 % £’000 % £’000Equity transactions 224,053 276 0.12 – – – – 223,777
Total 224,053 276 – – 223,777
Commissions, taxes and fees as % of average net assetsCommissions 0.16%Taxes 0.11%Other expenses 0.01%
At the balance sheet date the portfolio dealing spread was 0.08% (31/08/17: 0.09%). The Fund is single priced throughout the year and therefore the dealing spread is not indicative of the full year.
Royal London Equity Funds ICVC 23
Royal London European Opportunities Fund
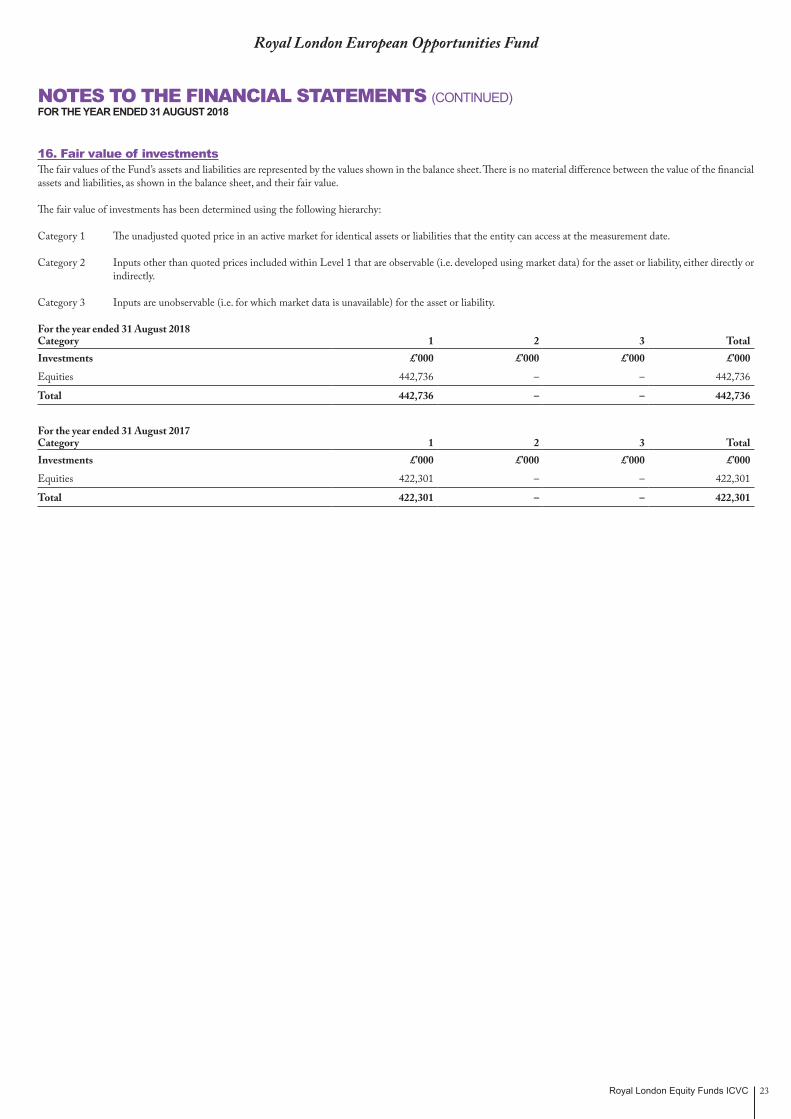
16. Fair value of investmentsThe fair values of the Fund’s assets and liabilities are represented by the values shown in the balance sheet. There is no material difference between the value of the financial assets and liabilities, as shown in the balance sheet, and their fair value.
The fair value of investments has been determined using the following hierarchy:
Category 1 The unadjusted quoted price in an active market for identical assets or liabilities that the entity can access at the measurement date.
Category 2 Inputs other than quoted prices included within Level 1 that are observable (i.e. developed using market data) for the asset or liability, either directly or indirectly.
Category 3 Inputs are unobservable (i.e. for which market data is unavailable) for the asset or liability.
For the year ended 31 August 2018 Category 1 2 3 TotalInvestments £’000 £’000 £’000 £’000
Equities 442,736 – – 442,736
Total 442,736 – – 442,736
For the year ended 31 August 2017 Category 1 2 3 TotalInvestments £’000 £’000 £’000 £’000
Equities 422,301 – – 422,301
Total 422,301 – – 422,301
NOTES TO THE FINANCIAL STATEMENTS (CONTINUED)FOR THE YEAR ENDED 31 AUGUST 2018
Royal London Equity Funds ICVC24
Royal London European Opportunities Fund
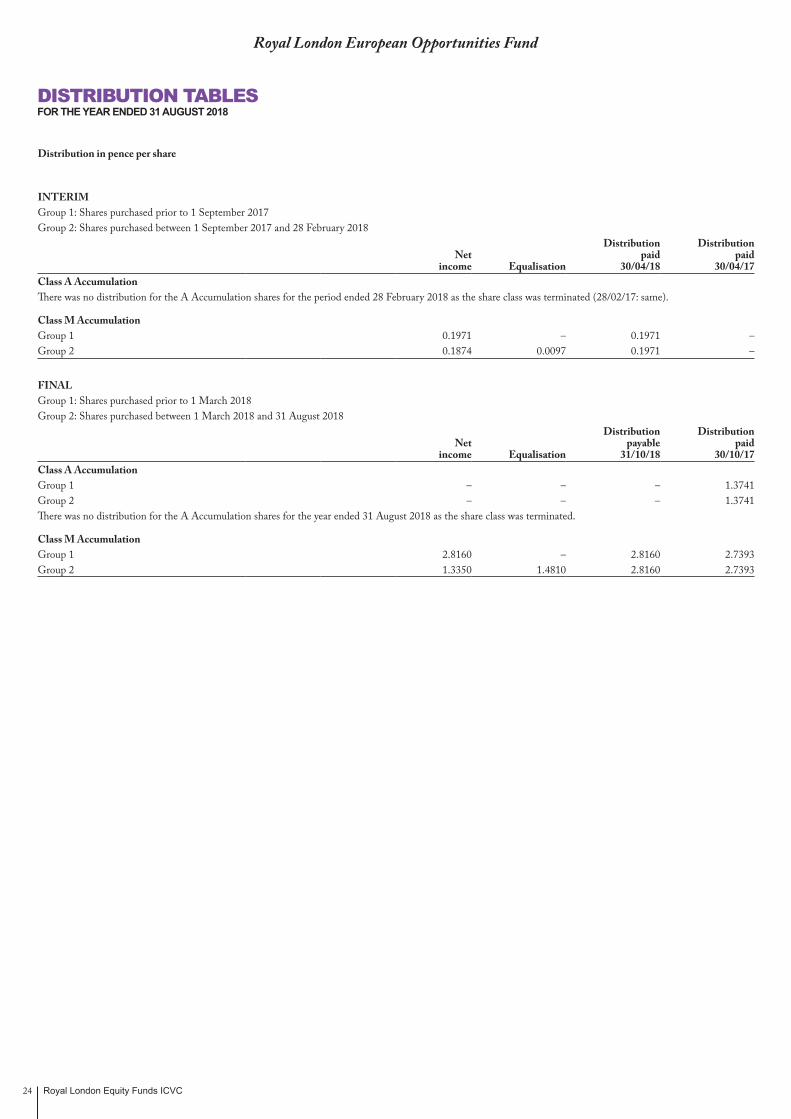
Distribution in pence per share
INTERIMGroup 1: Shares purchased prior to 1 September 2017Group 2: Shares purchased between 1 September 2017 and 28 February 2018
Distribution DistributionNet paid paid
income Equalisation 30/04/18 30/04/17Class A AccumulationThere was no distribution for the A Accumulation shares for the period ended 28 February 2018 as the share class was terminated (28/02/17: same).
Class M AccumulationGroup 1 0.1971 – 0.1971 –Group 2 0.1874 0.0097 0.1971 –
FINALGroup 1: Shares purchased prior to 1 March 2018Group 2: Shares purchased between 1 March 2018 and 31 August 2018
Distribution DistributionNet payable paid
income Equalisation 31/10/18 30/10/17Class A AccumulationGroup 1 – – – 1.3741Group 2 – – – 1.3741There was no distribution for the A Accumulation shares for the year ended 31 August 2018 as the share class was terminated.
Class M AccumulationGroup 1 2.8160 – 2.8160 2.7393Group 2 1.3350 1.4810 2.8160 2.7393
DISTRIBUTION TABLESFOR THE YEAR ENDED 31 AUGUST 2018
Royal London Equity Funds ICVC 25
Royal London UK Mid Cap Growth Fund
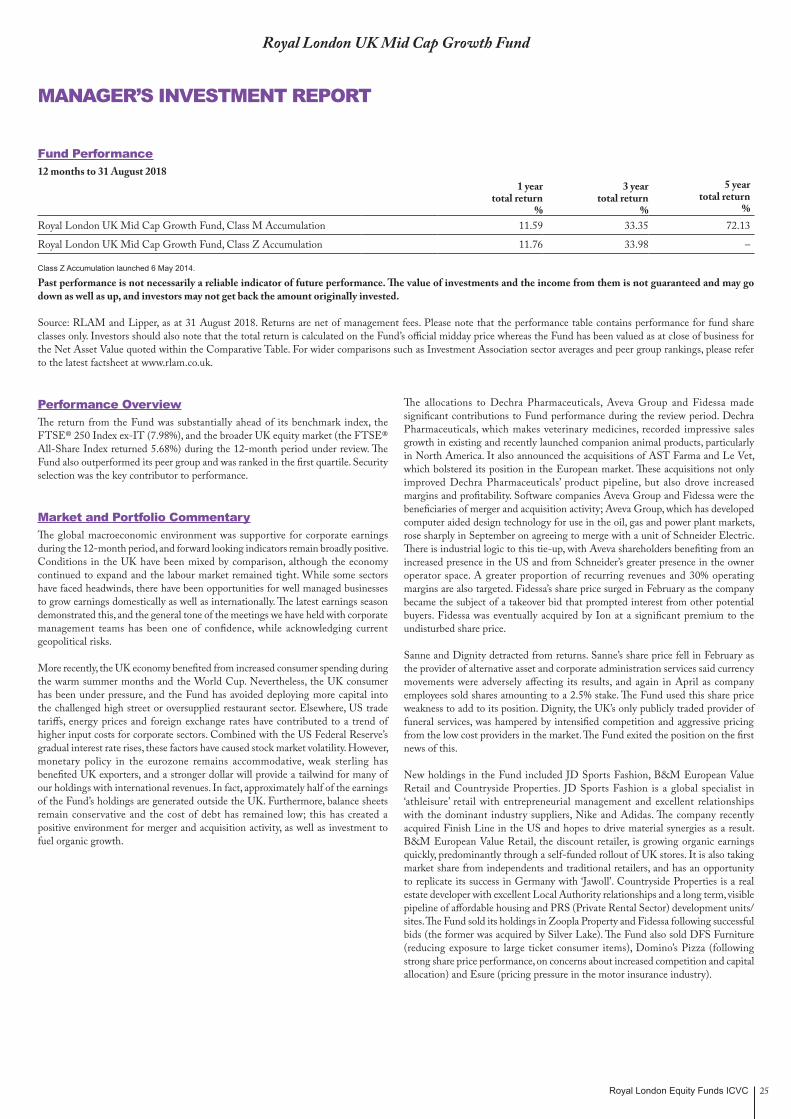
Fund Performance12 months to 31 August 2018
1 year total return
%
3 year total return
%
5 year total return
%Royal London UK Mid Cap Growth Fund, Class M Accumulation 11.59 33.35 72.13
Royal London UK Mid Cap Growth Fund, Class Z Accumulation 11.76 33.98 –
Class Z Accumulation launched 6 May 2014.
Past performance is not necessarily a reliable indicator of future performance. The value of investments and the income from them is not guaranteed and may go down as well as up, and investors may not get back the amount originally invested.
Source: RLAM and Lipper, as at 31 August 2018. Returns are net of management fees. Please note that the performance table contains performance for fund share classes only. Investors should also note that the total return is calculated on the Fund’s official midday price whereas the Fund has been valued as at close of business for the Net Asset Value quoted within the Comparative Table. For wider comparisons such as Investment Association sector averages and peer group rankings, please refer to the latest factsheet at www.rlam.co.uk.
Performance OverviewThe return from the Fund was substantially ahead of its benchmark index, the FTSE® 250 Index ex-IT (7.98%), and the broader UK equity market (the FTSE® All-Share Index returned 5.68%) during the 12-month period under review. The Fund also outperformed its peer group and was ranked in the first quartile. Security selection was the key contributor to performance.
Market and Portfolio CommentaryThe global macroeconomic environment was supportive for corporate earnings during the 12-month period, and forward looking indicators remain broadly positive. Conditions in the UK have been mixed by comparison, although the economy continued to expand and the labour market remained tight. While some sectors have faced headwinds, there have been opportunities for well managed businesses to grow earnings domestically as well as internationally. The latest earnings season demonstrated this, and the general tone of the meetings we have held with corporate management teams has been one of confidence, while acknowledging current geopolitical risks.
More recently, the UK economy benefited from increased consumer spending during the warm summer months and the World Cup. Nevertheless, the UK consumer has been under pressure, and the Fund has avoided deploying more capital into the challenged high street or oversupplied restaurant sector. Elsewhere, US trade tariffs, energy prices and foreign exchange rates have contributed to a trend of higher input costs for corporate sectors. Combined with the US Federal Reserve’s gradual interest rate rises, these factors have caused stock market volatility. However, monetary policy in the eurozone remains accommodative, weak sterling has benefited UK exporters, and a stronger dollar will provide a tailwind for many of our holdings with international revenues. In fact, approximately half of the earnings of the Fund’s holdings are generated outside the UK. Furthermore, balance sheets remain conservative and the cost of debt has remained low; this has created a positive environment for merger and acquisition activity, as well as investment to fuel organic growth.
The allocations to Dechra Pharmaceuticals, Aveva Group and Fidessa made significant contributions to Fund performance during the review period. Dechra Pharmaceuticals, which makes veterinary medicines, recorded impressive sales growth in existing and recently launched companion animal products, particularly in North America. It also announced the acquisitions of AST Farma and Le Vet, which bolstered its position in the European market. These acquisitions not only improved Dechra Pharmaceuticals’ product pipeline, but also drove increased margins and profitability. Software companies Aveva Group and Fidessa were the beneficiaries of merger and acquisition activity; Aveva Group, which has developed computer aided design technology for use in the oil, gas and power plant markets, rose sharply in September on agreeing to merge with a unit of Schneider Electric. There is industrial logic to this tie-up, with Aveva shareholders benefiting from an increased presence in the US and from Schneider’s greater presence in the owner operator space. A greater proportion of recurring revenues and 30% operating margins are also targeted. Fidessa’s share price surged in February as the company became the subject of a takeover bid that prompted interest from other potential buyers. Fidessa was eventually acquired by Ion at a significant premium to the undisturbed share price.
Sanne and Dignity detracted from returns. Sanne’s share price fell in February as the provider of alternative asset and corporate administration services said currency movements were adversely affecting its results, and again in April as company employees sold shares amounting to a 2.5% stake. The Fund used this share price weakness to add to its position. Dignity, the UK’s only publicly traded provider of funeral services, was hampered by intensified competition and aggressive pricing from the low cost providers in the market. The Fund exited the position on the first news of this.
New holdings in the Fund included JD Sports Fashion, B&M European Value Retail and Countryside Properties. JD Sports Fashion is a global specialist in ‘athleisure’ retail with entrepreneurial management and excellent relationships with the dominant industry suppliers, Nike and Adidas. The company recently acquired Finish Line in the US and hopes to drive material synergies as a result. B&M European Value Retail, the discount retailer, is growing organic earnings quickly, predominantly through a self-funded rollout of UK stores. It is also taking market share from independents and traditional retailers, and has an opportunity to replicate its success in Germany with ‘Jawoll’. Countryside Properties is a real estate developer with excellent Local Authority relationships and a long term, visible pipeline of affordable housing and PRS (Private Rental Sector) development units/sites. The Fund sold its holdings in Zoopla Property and Fidessa following successful bids (the former was acquired by Silver Lake). The Fund also sold DFS Furniture (reducing exposure to large ticket consumer items), Domino’s Pizza (following strong share price performance, on concerns about increased competition and capital allocation) and Esure (pricing pressure in the motor insurance industry).
MANAGER’S INVESTMENT REPORT
Royal London Equity Funds ICVC26
Royal London UK Mid Cap Growth Fund
MANAGER’S INVESTMENT REPORT (CONTINUED)
Investment OutlookWe expect further stock market volatility associated with the Brexit headlines, but we think that an accommodative monetary policy in Europe is likely to remain. Many of the companies in our universe remain well placed for progress over the next year. We do not try and take ‘sector’ or ‘market’ bets, but focus on bottom-up stock selection with an emphasis on investing (not trading) in companies with structural profit drivers operating in markets experiencing growth. We have never sought to predict the ‘cycle’ and therefore avoid the more cyclical end of the UK market, but try to find innovative companies where good management can improve margins and take market share.
The Fund aims to achieve capital growth over the long term (three to five years), targeting a minimum weighting of 85% to be invested in companies in the FTSE® 250 ex-IT Index and typically holding 40 to 60 positions. We seek out medium sized businesses that we believe can grow their profits and cashflow sustainably faster than the market and can ultimately become large companies. We focus our efforts on investing in cash generative businesses with strong balance sheets, structural earnings growth opportunities and valuation optionality.
Henry LowsonFund Manager31 August 2018Royal London Asset Management
Please note that Henry Lowson started managing the Fund on 2 January 2018. The previous Fund Manager was Derek Mitchell.
The views expressed are the author’s own and do not constitute investment advice and are not an indication of future fund performance. Portfolio holdings are subject to change, for information only and are not investment recommendations.
Source: Royal London Asset Management, unless otherwise stated.

Royal London Equity Funds ICVC 27
Royal London UK Mid Cap Growth Fund
Class A Accumulation31/08/18** 31/08/17 31/08/16
Change in net assets per share (p) (p) (p)
Opening net asset value per share 375.63 318.15 321.56
Return before operating charges* 21.94 62.56 1.10
Operating charges (2.26) (5.08) (4.51)
Return after operating charges* 19.68 57.48 (3.41)
Distributions on accumulation shares – (3.43) (4.17)
Retained distributions on accumulation shares – 3.43 4.17
Cancellation price (395.31) – –
Closing net asset value per share – 375.63 318.15
* after direct transaction costs of: 0.44 0.67 0.71
Performance
Return after charges 5.24% 18.07% (1.06)%
Other information
Closing net asset value (£’000) – 280,643 239,526
Closing number of shares – 74,713,421 75,287,495
Operating charges – 1.49% 1.45%
Direct transaction costs 0.11% 0.19% 0.23%
Prices^
Highest share price 403.40 378.40 330.60
Lowest share price 373.30 305.00 276.40
** From 25 January 2018 shareholders in Class A Accumulation converted into Class M Accumulation.
Class M Accumulation31/08/18 31/08/17 31/08/16
Change in net assets per share (p) (p) (p)
Opening net asset value per share 396.40 333.41 334.63
Return before operating charges* 45.74 65.80 1.21
Operating charges (3.16) (2.81) (2.43)
Return after operating charges* 42.58 62.99 (1.22)
Distributions on accumulation shares (6.97) (6.12) (6.64)
Retained distributions on accumulation shares 6.97 6.12 6.64
Closing net asset value per share 438.98 396.40 333.41
* after direct transaction costs of: 0.48 0.70 0.74
Performance
Return after charges 10.74% 18.89% (0.36)%
Other information
Closing net asset value (£’000) 382,730 74,155 81,051
Closing number of shares 87,185,521 18,707,057 24,309,772
Operating charges 0.75% 0.79% 0.75%
Direct transaction costs 0.11% 0.19% 0.23%
Prices^
Highest share price 444.30 399.20 344.60
Lowest share price 389.60 320.10 289.30
COMPARATIVE TABLES
Royal London Equity Funds ICVC28
Royal London UK Mid Cap Growth Fund
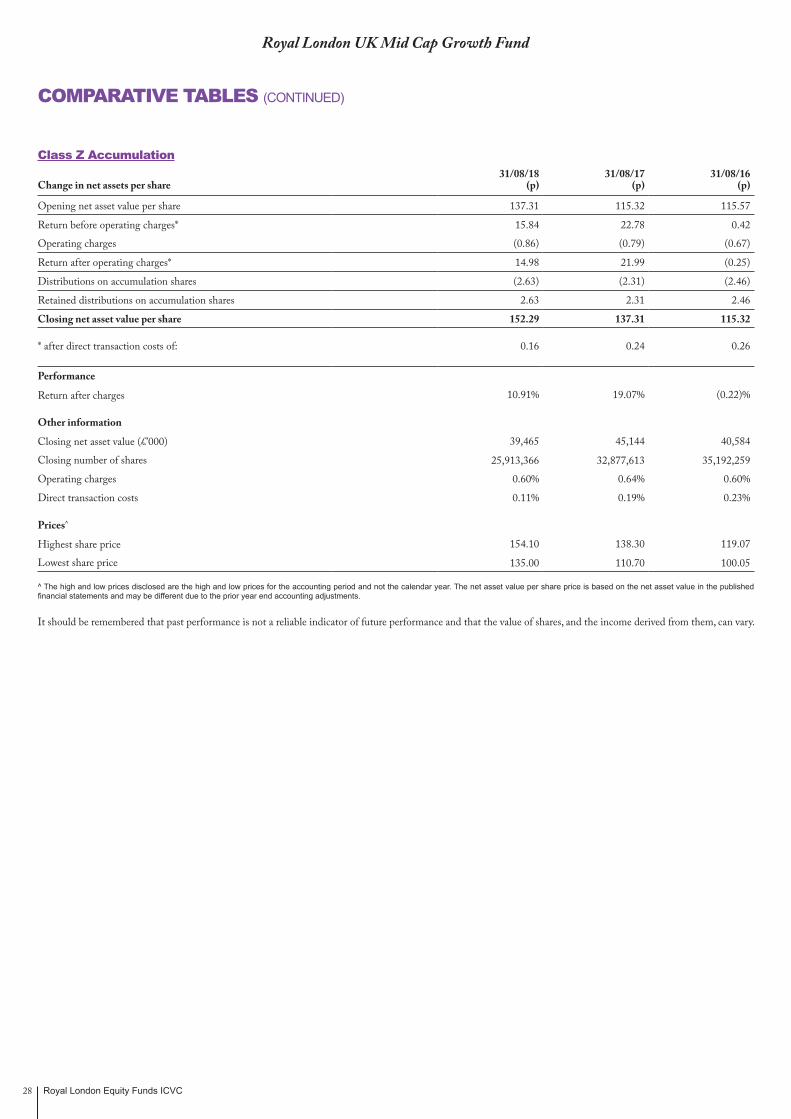
Class Z Accumulation31/08/18 31/08/17 31/08/16
Change in net assets per share (p) (p) (p)
Opening net asset value per share 137.31 115.32 115.57
Return before operating charges* 15.84 22.78 0.42
Operating charges (0.86) (0.79) (0.67)
Return after operating charges* 14.98 21.99 (0.25)
Distributions on accumulation shares (2.63) (2.31) (2.46)
Retained distributions on accumulation shares 2.63 2.31 2.46
Closing net asset value per share 152.29 137.31 115.32
* after direct transaction costs of: 0.16 0.24 0.26
Performance
Return after charges 10.91% 19.07% (0.22)%
Other information
Closing net asset value (£’000) 39,465 45,144 40,584
Closing number of shares 25,913,366 32,877,613 35,192,259
Operating charges 0.60% 0.64% 0.60%
Direct transaction costs 0.11% 0.19% 0.23%
Prices^
Highest share price 154.10 138.30 119.07
Lowest share price 135.00 110.70 100.05
^ The high and low prices disclosed are the high and low prices for the accounting period and not the calendar year. The net asset value per share price is based on the net asset value in the published financial statements and may be different due to the prior year end accounting adjustments.
It should be remembered that past performance is not a reliable indicator of future performance and that the value of shares, and the income derived from them, can vary.
COMPARATIVE TABLES (CONTINUED)
Royal London Equity Funds ICVC 29
Royal London UK Mid Cap Growth Fund
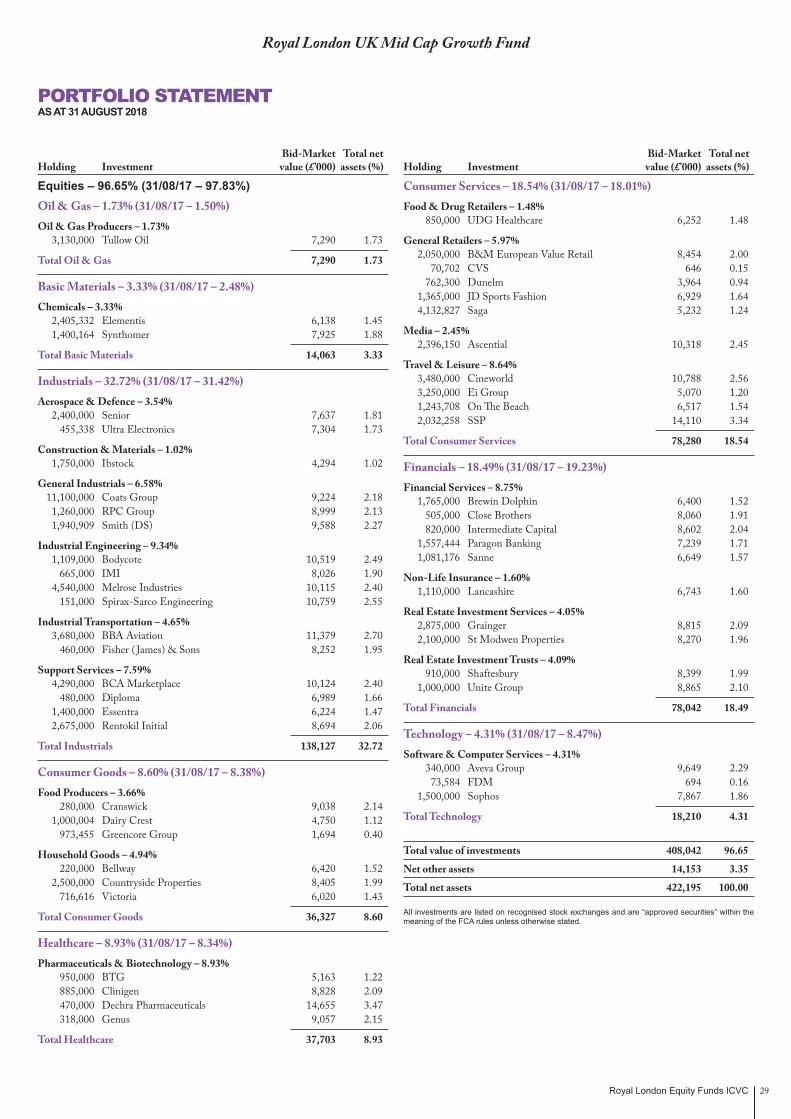
Equities – 96.65% (31/08/17 – 97.83%) Oil & Gas – 1.73% (31/08/17 – 1.50%) Oil & Gas Producers – 1.73% 3,130,000 Tullow Oil 7,290 1.73
Total Oil & Gas 7,290 1.73
Basic Materials – 3.33% (31/08/17 – 2.48%) Chemicals – 3.33% 2,405,332 Elementis 6,138 1.45 1,400,164 Synthomer 7,925 1.88
Total Basic Materials 14,063 3.33
Industrials – 32.72% (31/08/17 – 31.42%) Aerospace & Defence – 3.54% 2,400,000 Senior 7,637 1.81 455,338 Ultra Electronics 7,304 1.73
Construction & Materials – 1.02% 1,750,000 Ibstock 4,294 1.02
General Industrials – 6.58% 11,100,000 Coats Group 9,224 2.18 1,260,000 RPC Group 8,999 2.13 1,940,909 Smith (DS) 9,588 2.27
Industrial Engineering – 9.34% 1,109,000 Bodycote 10,519 2.49 665,000 IMI 8,026 1.90 4,540,000 Melrose Industries 10,115 2.40 151,000 Spirax-Sarco Engineering 10,759 2.55
Industrial Transportation – 4.65% 3,680,000 BBA Aviation 11,379 2.70 460,000 Fisher ( James) & Sons 8,252 1.95
Support Services – 7.59% 4,290,000 BCA Marketplace 10,124 2.40 480,000 Diploma 6,989 1.66 1,400,000 Essentra 6,224 1.47 2,675,000 Rentokil Initial 8,694 2.06
Total Industrials 138,127 32.72
Consumer Goods – 8.60% (31/08/17 – 8.38%) Food Producers – 3.66% 280,000 Cranswick 9,038 2.14 1,000,004 Dairy Crest 4,750 1.12 973,455 Greencore Group 1,694 0.40
Household Goods – 4.94% 220,000 Bellway 6,420 1.52 2,500,000 Countryside Properties 8,405 1.99 716,616 Victoria 6,020 1.43
Total Consumer Goods 36,327 8.60
Healthcare – 8.93% (31/08/17 – 8.34%) Pharmaceuticals & Biotechnology – 8.93% 950,000 BTG 5,163 1.22 885,000 Clinigen 8,828 2.09 470,000 Dechra Pharmaceuticals 14,655 3.47 318,000 Genus 9,057 2.15
Total Healthcare 37,703 8.93
Consumer Services – 18.54% (31/08/17 – 18.01%) Food & Drug Retailers – 1.48% 850,000 UDG Healthcare 6,252 1.48
General Retailers – 5.97% 2,050,000 B&M European Value Retail 8,454 2.00 70,702 CVS 646 0.15 762,300 Dunelm 3,964 0.94 1,365,000 JD Sports Fashion 6,929 1.64 4,132,827 Saga 5,232 1.24
Media – 2.45% 2,396,150 Ascential 10,318 2.45
Travel & Leisure – 8.64% 3,480,000 Cineworld 10,788 2.56 3,250,000 Ei Group 5,070 1.20 1,243,708 On The Beach 6,517 1.54 2,032,258 SSP 14,110 3.34
Total Consumer Services 78,280 18.54
Financials – 18.49% (31/08/17 – 19.23%) Financial Services – 8.75% 1,765,000 Brewin Dolphin 6,400 1.52 505,000 Close Brothers 8,060 1.91 820,000 Intermediate Capital 8,602 2.04 1,557,444 Paragon Banking 7,239 1.71 1,081,176 Sanne 6,649 1.57
Non-Life Insurance – 1.60% 1,110,000 Lancashire 6,743 1.60
Real Estate Investment Services – 4.05% 2,875,000 Grainger 8,815 2.09 2,100,000 St Modwen Properties 8,270 1.96
Real Estate Investment Trusts – 4.09% 910,000 Shaftesbury 8,399 1.99 1,000,000 Unite Group 8,865 2.10
Total Financials 78,042 18.49
Technology – 4.31% (31/08/17 – 8.47%) Software & Computer Services – 4.31% 340,000 Aveva Group 9,649 2.29 73,584 FDM 694 0.16 1,500,000 Sophos 7,867 1.86
Total Technology 18,210 4.31
Total value of investments 408,042 96.65
Net other assets 14,153 3.35
Total net assets 422,195 100.00
All investments are listed on recognised stock exchanges and are “approved securities” within the meaning of the FCA rules unless otherwise stated.
PORTFOLIO STATEMENTAS AT 31 AUGUST 2018
Bid-Market Total net Holding Investment value (£’000) assets (%)
Bid-Market Total net Holding Investment value (£’000) assets (%)

Royal London Equity Funds ICVC30
Royal London UK Mid Cap Growth Fund
SUMMARY OF MATERIAL PORTFOLIO CHANGESFOR THE YEAR ENDED 31 AUGUST 2018
Significant Purchases
Cost £’000
Countryside Properties 8,561
B&M European Value Retail 8,369
St Modwen Properties 7,850
Essentra 6,763
Elementis 6,758
On The Beach 6,588
Just Group 6,449
Victoria 5,606
Diploma 5,520
JD Sports Fashion 5,317
Subtotal 67,781
Total cost of purchases, including the above, for the year 124,161
Significant Sales
Proceeds £’000
Zoopla Property 11,089
Fidessa 10,573
Sophos 9,781
Esure 7,650
Domino's Pizza 7,640
Dechra Pharmaceuticals 6,624
Aldermore 6,311
Paysafe 5,561
Greencore Group 5,366
Howdens Joinery 4,488
Subtotal 75,083
Total proceeds from sales, including the above, for the year 139,854
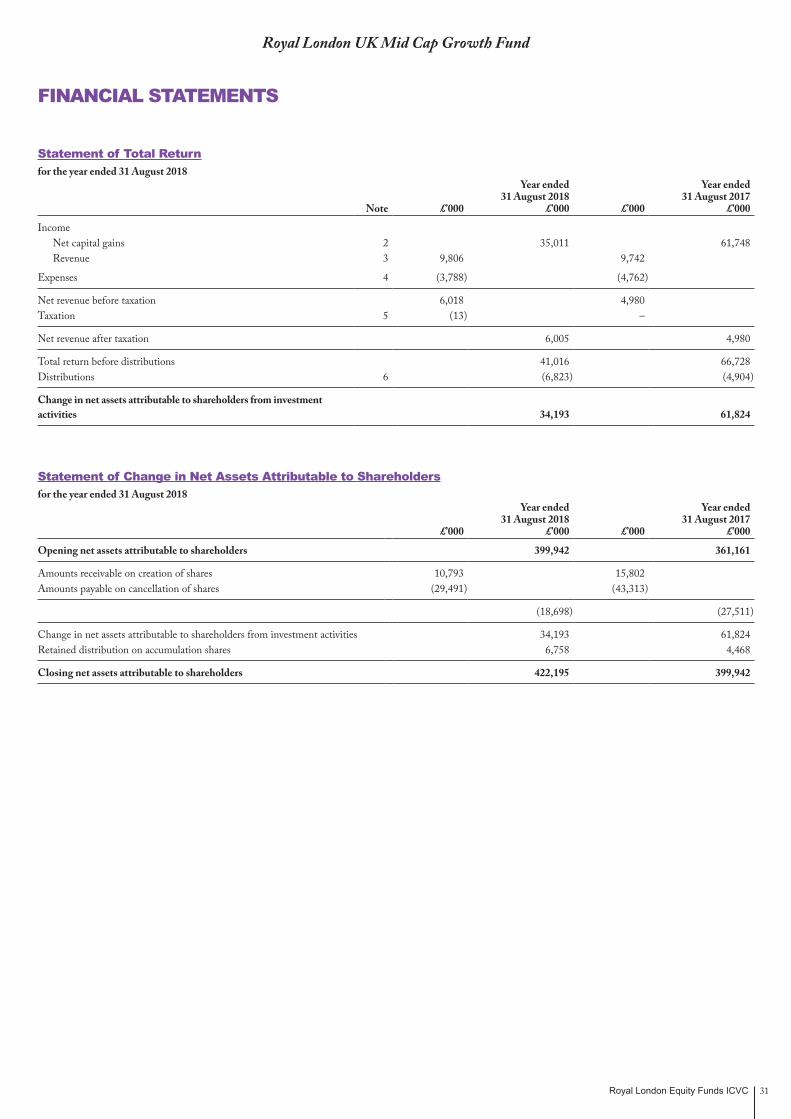
Royal London Equity Funds ICVC 31
Royal London UK Mid Cap Growth Fund
FINANCIAL STATEMENTS
Statement of Total Returnfor the year ended 31 August 2018
Note £’000
Year ended31 August 2018
£’000 £’000
Year ended31 August 2017
£’000
Income Net capital gains 2 35,011 61,748 Revenue 3 9,806 9,742
Expenses 4 (3,788) (4,762)
Net revenue before taxation 6,018 4,980 Taxation 5 (13) –
Net revenue after taxation 6,005 4,980
Total return before distributions 41,016 66,728 Distributions 6 (6,823) (4,904)
Change in net assets attributable to shareholders from investment activities 34,193 61,824
Statement of Change in Net Assets Attributable to Shareholdersfor the year ended 31 August 2018
£’000
Year ended31 August 2018
£’000 £’000
Year ended31 August 2017
£’000
Opening net assets attributable to shareholders 399,942 361,161
Amounts receivable on creation of shares 10,793 15,802 Amounts payable on cancellation of shares (29,491) (43,313)
(18,698) (27,511)
Change in net assets attributable to shareholders from investment activities 34,193 61,824 Retained distribution on accumulation shares 6,758 4,468
Closing net assets attributable to shareholders 422,195 399,942

Royal London Equity Funds ICVC32
Royal London UK Mid Cap Growth Fund
FINANCIAL STATEMENTS (CONTINUED)
Balance Sheetas at 31 August 2018
Note31 August 2018
£’000 31 August 2017
£’000
ASSETS
Investments 408,042 391,258
Current assets:Debtors 7 2,193 1,343Cash and bank balances 8 13,109 9,520
Total assets 423,344 402,121
LIABILITIES
Creditors:Other creditors 9 1,149 2,179
Total liabilities 1,149 2,179
Net assets attributable to shareholders 422,195 399,942

Royal London Equity Funds ICVC 33
Royal London UK Mid Cap Growth Fund
NOTES TO THE FINANCIAL STATEMENTSFOR THE YEAR ENDED 31 AUGUST 2018
1. Accounting policiesThe accounting policies are set out in note 1 on page 8.
2. Net capital gains31 August 2018
£’00031 August 2017
£’000The net capital gains during the year comprise:
Non-derivative securities 35,014 61,751
Activity fees (3) (3)
Net capital gains 35,011 61,748
3. Revenue31 August 2018
£’00031 August 2017
£’000UK dividends 8,845 9,037
Overseas dividends 539 311
Property investment income (PID) 348 196
Bank interest 29 3
Stock lending income 45 115
Stock dividends – 80
Total revenue 9,806 9,742
4. Expenses31 August 2018
£’00031 August 2017
£’000Payable to the Authorised Corporate Director or associates of the Authorised Corporate Director and agents of either of them:Authorised Corporate Director’s fee 3,603 4,434
Payable to the Depositary, associates of the Depositary and agents of either of them:
Depositary’s fee 46 43
Safe custody fees 6 6
52 49
Other expenses:
Registrar’s fees 118 264
Audit fee 10 10
Printing & stationery fee 3 3
Professional fee – 1
Legal fees 2 1
133 279
Total expenses 3,788 4,762
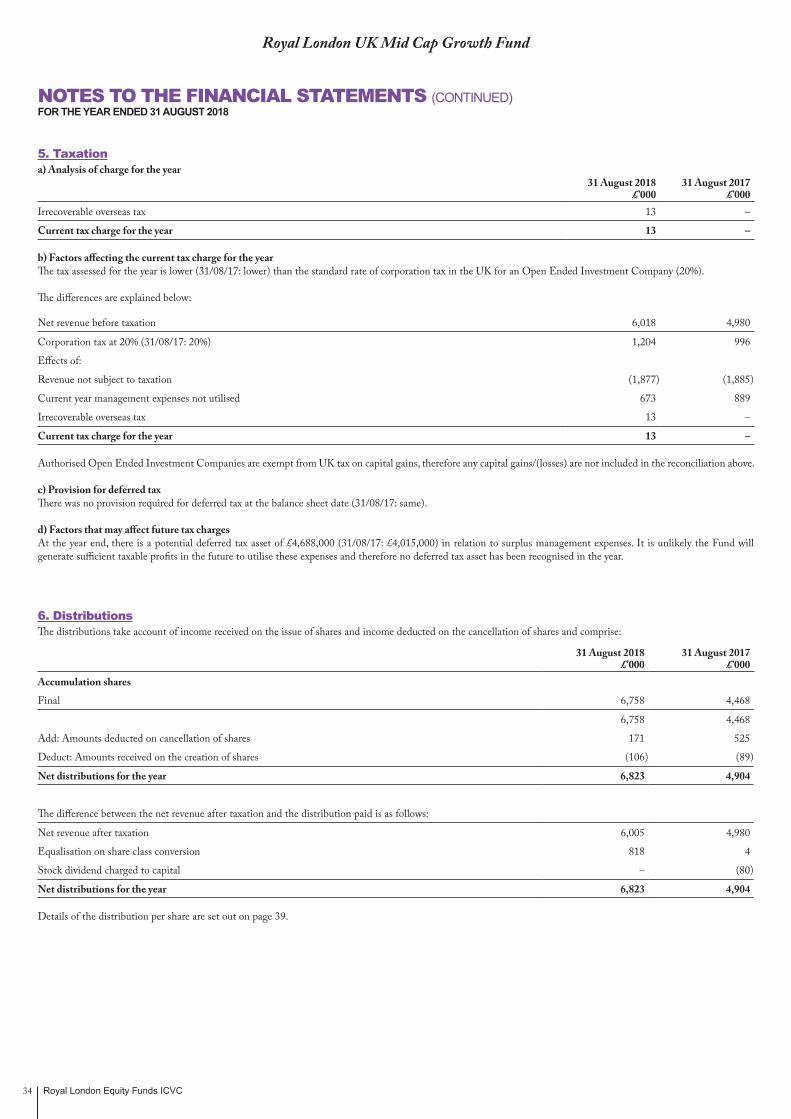
Royal London Equity Funds ICVC34
5. Taxationa) Analysis of charge for the year
31 August 2018£’000
31 August 2017£’000
Irrecoverable overseas tax 13 –
Current tax charge for the year 13 –
b) Factors affecting the current tax charge for the yearThe tax assessed for the year is lower (31/08/17: lower) than the standard rate of corporation tax in the UK for an Open Ended Investment Company (20%).
The differences are explained below:
Net revenue before taxation 6,018 4,980
Corporation tax at 20% (31/08/17: 20%) 1,204 996
Effects of:
Revenue not subject to taxation (1,877) (1,885)
Current year management expenses not utilised 673 889
Irrecoverable overseas tax 13 –
Current tax charge for the year 13 –
Authorised Open Ended Investment Companies are exempt from UK tax on capital gains, therefore any capital gains/(losses) are not included in the reconciliation above.
c) Provision for deferred taxThere was no provision required for deferred tax at the balance sheet date (31/08/17: same).
d) Factors that may affect future tax chargesAt the year end, there is a potential deferred tax asset of £4,688,000 (31/08/17: £4,015,000) in relation to surplus management expenses. It is unlikely the Fund will generate sufficient taxable profits in the future to utilise these expenses and therefore no deferred tax asset has been recognised in the year.
6. DistributionsThe distributions take account of income received on the issue of shares and income deducted on the cancellation of shares and comprise:
31 August 2018 £’000
31 August 2017 £’000
Accumulation shares
Final 6,758 4,468
6,758 4,468
Add: Amounts deducted on cancellation of shares 171 525
Deduct: Amounts received on the creation of shares (106) (89)
Net distributions for the year 6,823 4,904
The difference between the net revenue after taxation and the distribution paid is as follows:
Net revenue after taxation 6,005 4,980
Equalisation on share class conversion 818 4
Stock dividend charged to capital – (80)
Net distributions for the year 6,823 4,904
Details of the distribution per share are set out on page 39.
Royal London UK Mid Cap Growth Fund
NOTES TO THE FINANCIAL STATEMENTS (CONTINUED)FOR THE YEAR ENDED 31 AUGUST 2018
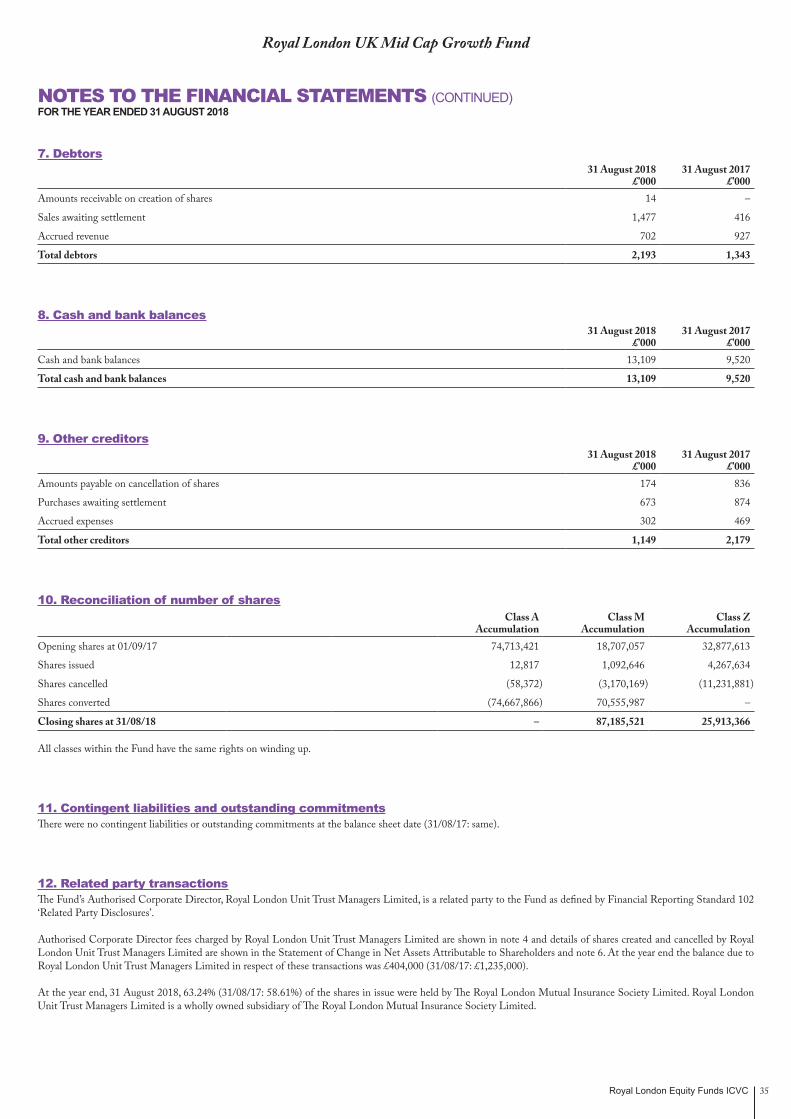
Royal London Equity Funds ICVC 35
Royal London UK Mid Cap Growth Fund
NOTES TO THE FINANCIAL STATEMENTS (CONTINUED)FOR THE YEAR ENDED 31 AUGUST 2018
7. Debtors31 August 2018
£’00031 August 2017
£’000Amounts receivable on creation of shares 14 –
Sales awaiting settlement 1,477 416
Accrued revenue 702 927
Total debtors 2,193 1,343
8. Cash and bank balances31 August 2018
£’00031 August 2017
£’000Cash and bank balances 13,109 9,520
Total cash and bank balances 13,109 9,520
9. Other creditors31 August 2018
£’00031 August 2017
£’000Amounts payable on cancellation of shares 174 836
Purchases awaiting settlement 673 874
Accrued expenses 302 469
Total other creditors 1,149 2,179
10. Reconciliation of number of sharesClass A
AccumulationClass M
AccumulationClass Z
AccumulationOpening shares at 01/09/17 74,713,421 18,707,057 32,877,613
Shares issued 12,817 1,092,646 4,267,634
Shares cancelled (58,372) (3,170,169) (11,231,881)
Shares converted (74,667,866) 70,555,987 –
Closing shares at 31/08/18 – 87,185,521 25,913,366
All classes within the Fund have the same rights on winding up.
11. Contingent liabilities and outstanding commitmentsThere were no contingent liabilities or outstanding commitments at the balance sheet date (31/08/17: same).
12. Related party transactionsThe Fund’s Authorised Corporate Director, Royal London Unit Trust Managers Limited, is a related party to the Fund as defined by Financial Reporting Standard 102 ‘Related Party Disclosures’.
Authorised Corporate Director fees charged by Royal London Unit Trust Managers Limited are shown in note 4 and details of shares created and cancelled by Royal London Unit Trust Managers Limited are shown in the Statement of Change in Net Assets Attributable to Shareholders and note 6. At the year end the balance due to Royal London Unit Trust Managers Limited in respect of these transactions was £404,000 (31/08/17: £1,235,000).
At the year end, 31 August 2018, 63.24% (31/08/17: 58.61%) of the shares in issue were held by The Royal London Mutual Insurance Society Limited. Royal London Unit Trust Managers Limited is a wholly owned subsidiary of The Royal London Mutual Insurance Society Limited.

Royal London Equity Funds ICVC36
13. Stock lending activitiesThe Fund carried out stock lending activities for the purpose of efficient portfolio management and in order to generate income. Revenue earned from these activities is shown in note 3 and is net of bank and agents fees amounting to £11,000 (Gross: £56,000) (31/08/17: £28,000 (Gross: £143,000)) payable to HSBC Bank plc.
The value of stock on loan at the balance sheet date was £28,706,000 (31/08/17: £47,993,000).
The collateral held by asset type at the year end is stated below:
Asset class
31 August 2018 Collateral Held
£’000
31 August 2017 Collateral Held
£’000Equities 22,364 34,230
Bonds 7,862 16,322
The aggregate value of collateral held at the balance sheet date was £30,226,000 (31/08/17: £50,552,000) Collateral may be in the form of cash, UK gilts, certificates of deposit, treasury bills, sovereign debt, eurosterling bonds and equities; where the ACD approves the asset it will be held to reduce counterparty exposure. The value of the collateral held is greater than the value of the securities on loan and is monitored as part of the efficient portfolio management process.
The counterparties at the year end were Bank of Nova Scotia, Goldman Sachs International, HSBC Bank, JP Morgan Securities, Natixis and Santander.
14. Risk disclosuresThe policies applied to the management of risk disclosures are set out on page 9.
The fair values of the Fund’s assets and liabilities are represented by the values shown in the balance sheet on page 32. There is no material difference between the value of the financial assets and liabilities, as shown in the balance sheet, and their fair value.
A small proportion of the Fund’s assets are denominated in currencies other than sterling. The value of the Fund’s assets may be affected by currency movements.
Currency31 August 2018
£’00031 August 2017
£’000Sterling 422,153 399,907
US dollar 42 35
Total 422,195 399,942
If sterling to foreign currency exchange rates had increased by 10% as at the balance sheet date, the net asset value of the Fund would have decreased by £4,000 (31/08/17: £3,000) If sterling to foreign currency exchange rates had decreased by 10% as at the balance sheet date, the net asset value of the Fund would have increased by £4,000 (31/08/17: £3,000). These calculations assume all other variables remain constant.
If market prices had increased by 10% as at the balance sheet date, the net asset value of the Fund would have increased by £40,804,000 (31/08/17: £39,126,000). If market prices had decreased by 10% as at the balance sheet date, the net asset value of the Fund would have decreased by £40,804,000 (31/08/17: £39,126,000). These calculations assume all other variables remain constant.
The only interest bearing assets are cash balances of £13,109,000 (31/08/17: £9,520,000) which earn interest by reference to LIBOR or international equivalent.
FX risk is insignificant (31/08/17: same).
Royal London UK Mid Cap Growth Fund
NOTES TO THE FINANCIAL STATEMENTS (CONTINUED)FOR THE YEAR ENDED 31 AUGUST 2018

Royal London Equity Funds ICVC 37
15. Portfolio transaction costsFor the year ended 31 August 2018
Value Commissions Taxes Other expenses TotalAnalysis of total purchases costs £’000 £’000 % £’000 % £’000 % £’000Equity transactions 117,824 85 0.07 437 0.37 26 0.02 118,372
Corporate actions 5,789 – – – – – – 5,789
Total 123,613 85 437 26 124,161
Value Commissions Taxes Other expenses TotalAnalysis of total sales costs £’000 £’000 % £’000 % £’000 % £’000Equity transactions 139,963 109 0.08 – – – – 139,854
Total 139,963 109 – – 139,854
Commissions, taxes and fees as % of average net assetsCommissions 0.03%Taxes 0.08%Other expenses 0.00%
For the year ended 31 August 2017
Value Commissions Taxes Other expenses TotalAnalysis of total purchases costs £’000 £’000 % £’000 % £’000 % £’000Equity transactions 98,740 141 0.14 400 0.41 41 0.04 99,322
Corporate actions 6,104 – – – – – – 6,104
Total 104,844 141 400 41 105,426
Value Commissions Taxes Other expenses TotalAnalysis of total sales costs £’000 £’000 % £’000 % £’000 % £’000Equity transactions 117,809 171 0.15 – – – – 117,638
Corporate actions 11,154 – – – – – – 11,154
Total 128,963 171 – – 128,792
Commissions, taxes and fees as % of average net assetsCommissions 0.08%Taxes 0.10%Other expenses 0.01%
At the balance sheet date the portfolio dealing spread was 0.11% (31/08/17: 0.13%). The Fund is single priced throughout the year and therefore the dealing spread is not indicative of the full year.
Royal London UK Mid Cap Growth Fund
NOTES TO THE FINANCIAL STATEMENTS (CONTINUED)FOR THE YEAR ENDED 31 AUGUST 2018

Royal London Equity Funds ICVC38
16. Fair value of investmentsThe fair values of the Fund’s assets and liabilities are represented by the values shown in the balance sheet. There is no material difference between the value of the financial assets and liabilities, as shown in the balance sheet, and their fair value.
The fair value of investments has been determined using the following hierarchy:
Category 1 The unadjusted quoted price in an active market for identical assets or liabilities that the entity can access at the measurement date.
Category 2 Inputs other than quoted prices included within Level 1 that are observable (i.e. developed using market data) for the asset or liability, either directly or indirectly.
Category 3 Inputs are unobservable (i.e. for which market data is unavailable) for the asset or liability.
For the year ended 31 August 2018 Category 1 2 3 TotalInvestments £’000 £’000 £’000 £’000
Equities 408,042 – – 408,042
Total 408,042 – – 408,042
For the year ended 31 August 2017 Category 1 2 3 TotalInvestments £’000 £’000 £’000 £’000
Equities 391,258 – – 391,258
Total 391,258 – – 391,258
Royal London UK Mid Cap Growth Fund
NOTES TO THE FINANCIAL STATEMENTS (CONTINUED)FOR THE YEAR ENDED 31 AUGUST 2018

Royal London Equity Funds ICVC 39
Royal London UK Mid Cap Growth Fund
DISTRIBUTION TABLEFOR THE YEAR ENDED 31 AUGUST 2018
Distribution in pence per share
FINALGroup 1: Shares purchased prior to 1 September 2017Group 2: Shares purchased between 1 September 2017 and 31 August 2018
NetDistribution
payableDistribution
paidincome Equalisation 31/10/18 31/10/17
Class A Accumulation*Group 1 – – – 3.4316Group 2 – – – 3.4316
Class M AccumulationGroup 1 6.9696 – 6.9696 6.1239Group 2 3.4007 3.5689 6.9696 6.1239
Class Z AccumulationGroup 1 2.6310 – 2.6310 2.3070Group 2 1.2918 1.3392 2.6310 2.3070
* From 25 January 2018 shareholders in Class A Accumulation converted into Class M Accumulation.
Royal London Equity Funds ICVC40
Royal London UK Opportunities Fund
Fund Performance12 months to 31 August 2018
1 year total return
%
3 year total return
%
5 year total return
%Royal London UK Opportunities Fund, Class M Accumulation 7.85 23.29 41.77
Past performance is not necessarily a reliable indicator of future performance. The value of investments and the income from them is not guaranteed and may go down as well as up, and investors may not get back the amount originally invested.
Source: RLAM and Lipper, as at 31 August 2018. Returns are net of management fees. Please note that the performance table contains performance for fund share classes only. Investors should also note that the total return is calculated on the Fund’s official midday price whereas the Fund has been valued as at close of business for the Net Asset Value quoted within the Comparative Table. For wider comparisons such as Investment Association sector averages and peer group rankings, please refer to the latest factsheet at www.rlam.co.uk.
Performance OverviewThe return from the Fund was ahead of the wider UK equity market during the 12-month period under review, using the FTSE® All-Share Index as a guide. Security selection contributed to this performance.
Market and Portfolio CommentaryUK and global economic growth was generally supportive for equities during the term under review. In the UK, a strong labour market and weak productivity resulted in expansion that was broadly steady, but relatively sluggish. The Bank of England (BoE) raised its benchmark interest rate twice, judging that the UK economy had a limited degree of slack; elsewhere, the US Federal Reserve continued its programme of gradual rate rises, and central banks in other countries were in no hurry to tighten policy. Sterling strengthened during the period as a whole, posting its largest monthly gain in almost a year in September as the BoE gave an unusually strong steer of impending policy tightening; the currency weakened during the summer of 2018 amid mounting concern about a ‘no deal’ Brexit as the deadline for negotiations drew closer.
Holdings of GKN, Dechra Pharmaceuticals, Croda International and Ashtead Group made prominent contributions to performance. Industrial company GKN was the subject of a takeover bid in January from Melrose Industries that resulted in a prolonged battle, even prompting some politicians to urge government intervention. Shares of GKN rose by almost half before Melrose succeeded in acquiring the company. Dechra Pharmaceuticals makes veterinary medicines and recorded strong growth in sales after introducing new products, while takeovers that bolstered its position in the European market and extended its activities into New Zealand were received positively by investors. Croda International, the specialty chemicals company, once again proved to be a major contributor to performance as the shares re-rated on a higher earnings number. Ashtead, which rents out construction and industrial equipment, continued to benefit from steady demand in the US, its main market, and from acquisitions that increased its scale. The company also got a boost from hurricanes that struck the US in 2017, requiring both immediate clean-up and a subsequent rebuilding effort.
RPC Group, Greencore Group and Saga detracted from returns. RPC, which makes plastic packaging, performed poorly during the review period even while reporting continued positive development of its business, supported by both organic growth and acquisitions. Against a backdrop of negative media commentary on packaging waste in recent months, it is pleasing to note that RPC is taking steps to reduce the environmental impact of its products, such as using ‘green’ plastic derived from sugar cane, rather than fossil fuel-based materials. Shares of Greencore slumped in the first quarter of 2018 as the producer of convenience foods issued a profit warning stemming from costs for a reorganisation in the US; the stock subsequently rebounded as interim results showed a generally positive performance in the underlying business, with solid growth in organic revenue. Saga issued a profit warning in December, taking the market by surprise. Thankfully we were in the process of selling our position and had exited three quarters of our holding prior to the warning, but nevertheless, this proved detrimental to performance.
Fund activity included initiating positions in On the Beach Group, Clipper Logistics and JD Sports Fashion, whilst Ultra Electronics, DFS Furniture and Hurricane Energy were among holdings that were sold. The Fund increased allocations to RPC and Dechra Pharmaceuticals, and reduced exposures to Glencore and BP.
The Fund aims to achieve capital growth by investing across the entire UK equity market and typically holds 30 to 40 stocks, based on the manager’s ‘best ideas’. The manager seeks to identify companies whose market value is below their long-term worth and which, he believes, have the ability to provide strong returns for shareholders. Additionally, the manager is not afraid to buy into these businesses when they are out of favour due to short-term uncertainties.
Investment OutlookWe expect the BoE to leave rates on hold until 2019. We anticipate more of a Brexit impact on economic data in 2018’s second half, assuming that more companies ‘press pause’ on investment decisions. But monetary policy looks set to remain supportive, alongside a marginal ease in the fiscal policy stance. Our base case for Brexit is that a withdrawal agreement will be reached and ratified by March 2019 or soon after.
Craig YeamanFund Manager31 August 2018Royal London Asset Management
Please note that Craig Yeaman started managing the Fund on 2 January 2018. The previous Fund Manager was Derek Mitchell.
The views expressed are the author’s own and do not constitute investment advice and are not an indication of future fund performance. Portfolio holdings are subject to change, for information only and are not investment recommendations.
Source: Royal London Asset Management, unless otherwise stated.
MANAGER’S INVESTMENT REPORT
Royal London Equity Funds ICVC 41
Royal London UK Opportunities Fund
Class A Accumulation31/08/18** 31/08/17 31/08/16
Change in net assets per share (p) (p) (p)
Opening net asset value per share 177.08 163.60 158.22
Return before operating charges* 9.47 15.91 7.59
Operating charges (1.03) (2.43) (2.21)
Return after operating charges* 8.44 13.48 5.38
Distributions on accumulation shares – (3.55) (3.20)
Retained distributions on accumulation shares – 3.55 3.20
Cancellation price (185.52) – –
Closing net asset value per share – 177.08 163.60
* after direct transaction costs of: 0.35 0.27 0.36
Performance
Return after charges 4.77% 8.24% 3.40%
Other information
Closing net asset value (£’000) – 715,976 659,728
Closing number of shares – 404,325,738 403,248,917
Operating charges – 1.42% 1.42%
Direct transaction costs 0.19% 0.16% 0.23%
Prices^
Highest share price 189.60 182.50 166.20
Lowest share price 174.20 157.00 138.90
** From 25 January 2018 shareholders in Class A Accumulation converted into Class M Accumulation.
Class M Accumulation31/08/18 31/08/17 31/08/16
Change in net assets per share (p) (p) (p)
Opening net asset value per share 186.51 171.13 164.34
Return before operating charges* 14.36 16.67 7.95
Operating charges (1.39) (1.29) (1.16)
Return after operating charges* 12.97 15.38 6.79
Distributions on accumulation shares (4.09) (4.99) (4.48)
Retained distributions on accumulation shares 4.09 4.99 4.48
Closing net asset value per share 199.48 186.51 171.13
* after direct transaction costs of: 0.38 0.28 0.38
Performance
Return after charges 6.95% 8.99% 4.13%
Other information
Closing net asset value (£’000) 788,285 11,265 14,109
Closing number of shares 395,163,121 6,039,776 8,244,608
Operating charges 0.72% 0.72% 0.72%
Direct transaction costs 0.19% 0.16% 0.23%
Prices^
Highest share price 206.50 191.90 173.80
Lowest share price 178.80 164.40 144.70
COMPARATIVE TABLES

Royal London Equity Funds ICVC42
Royal London UK Opportunities Fund
Class M Income31/08/18** 31/08/17 31/08/16
Change in net assets per share (p) (p) (p)
Opening net asset value per share 137.42 129.53 127.78
Return before operating charges* 7.36 12.63 6.14
Operating charges (0.41) (0.97) (0.92)
Return after operating charges* 6.95 11.66 5.22
Distributions on income shares – (3.77) (3.47)
Cancellation price (144.37) – –
Closing net asset value per share - 137.42 129.53
* after direct transaction costs of: 0.27 0.21 0.29
Performance
Return after charges 5.06% 9.00% 4.09%
Other information
Closing net asset value (£’000) – 115 302
Closing number of shares – 83,311 233,148
Operating charges – 0.72% 0.72%
Direct transaction costs 0.19% 0.16% 0.23%
Prices^
Highest share price 147.50 145.20 135.10
Lowest share price 135.20 124.50 112.50
** From 25 January 2018 shareholders in Class M Income converted into Class M Accumulation.^ The high and low prices disclosed are the high and low prices for the accounting period and not the calendar year. The net asset value per share price is based on the net asset value in the published financial statements and may be different due to the prior year end accounting adjustments.
It should be remembered that past performance is not a reliable indicator of future performance and that the value of shares, and the income derived from them, can vary.
COMPARATIVE TABLES (CONTINUED)

Royal London Equity Funds ICVC 43
Royal London UK Opportunities Fund
Equities – 97.63% (31/08/17 – 97.26%) Oil & Gas – 5.91% (31/08/17 – 9.94%) Oil Equipment & Services – 3.00% 3,295,000 John Wood 23,678 3.00
Oil & Gas Producers – 2.91% 4,194,000 BP 22,954 2.91
Total Oil & Gas 46,632 5.91
Basic Materials – 13.57% (31/08/17 – 9.90%) Chemicals – 8.41% 349,000 Croda International 17,785 2.26 4,697,000 Synthomer 26,585 3.37 692,050 Victrex 21,924 2.78
Mining – 5.16% 3,659,000 Glencore 11,473 1.46 798,000 Rio Tinto 29,199 3.70
Total Basic Materials 106,966 13.57
Industrials – 37.70% (31/08/17 – 22.40%) Construction & Materials – 4.85% 2,720,000 MJ Gleeson 19,094 2.42 5,691,855 Tyman 19,153 2.43
General Industrials – 12.14% 18,080,011 Melrose Industries 40,282 5.11 3,108,616 RPC Group 22,202 2.82 6,724,090 Smith (DS) 33,217 4.21
Industrial Engineering – 2.42% 1,800,000 Hill & Smith 19,080 2.42
Industrial Transportation – 3.68% 5,477,000 BBA Aviation 16,935 2.15 3,825,025 Clipper Logistics 12,087 1.53
Support Services – 14.61% 1,300,000 Ashtead Group 30,706 3.90 8,792,000 BCA Marketplace 20,749 2.63 432,500 DCC 30,080 3.82 5,391,000 Rentokil Initial 17,521 2.22 3,140,000 Restore 16,077 2.04
Total Industrials 297,183 37.70
Consumer Goods – 11.42% (31/08/17 – 7.09%) Automobiles & Parts – 1.22% 3,340,000 TI Fluid Systems 9,606 1.22
Food Producers – 2.23% 10,120,000 Greencore Group 17,609 2.23
Household Goods – 5.08% 591,000 Berkeley 21,530 2.73 2,209,799 Victoria 18,562 2.35
Tobacco – 2.89% 829,000 Imperial Brands 22,748 2.89
Total Consumer Goods 90,055 11.42
Healthcare – 2.20% (31/08/17 – 13.01%) Pharmaceuticals & Biotechnology – 2.20% 555,966 Dechra Pharmaceuticals 17,335 2.20
Total Healthcare 17,335 2.20
Consumer Services – 12.03% (31/08/17 – 8.65%) General Retailers – 4.89% 3,936,000 B&M European Value Retail 16,232 2.06 4,396,000 JD Sports Fashion 22,314 2.83
Media – 4.82% 9,519,000 ITV 15,288 1.94 1,329,000 RELX 22,706 2.88
Travel & Leisure – 2.32% 3,485,000 On The Beach 18,261 2.32
Total Consumer Services 94,801 12.03
Telecommunications – 0.00% (31/08/17 – 1.40%)
Financials – 14.80% (31/08/17 – 22.49%) Banks – 3.49% 46,350,000 Lloyds Banking Group 27,481 3.49
Life Insurance – 6.30% 1,944,000 Prudential 33,728 4.28 1,405,000 St James’s Place Capital 15,898 2.02
Financial Services – 5.01% 5,204,000 Charter Court Financial Services 18,641 2.36 1,990,000 Intermediate Capital Group 20,875 2.65
Total Financials 116,623 14.80
Technology – 0.00% (31/08/17 – 2.38%)
Total value of investments 769,595 97.63
Net other assets 18,690 2.37
Total net assets 788,285 100.00
All investments are listed on recognised stock exchanges and are “approved securities” within the meaning of the FCA rules unless otherwise stated.
PORTFOLIO STATEMENTAS AT 31 AUGUST 2018
Bid-Market Total net Holding Investment value (£’000) assets (%)
Bid-Market Total net Holding Investment value (£’000) assets (%)

Royal London Equity Funds ICVC44
Royal London UK Opportunities Fund
SUMMARY OF MATERIAL PORTFOLIO CHANGESFOR THE YEAR ENDED 31 AUGUST 2018
Significant Purchases
Cost £’000
RPC Group 27,988
GKN 27,610
Hill & Smith 22,828
Berkeley 21,973
John Wood 21,914
MJ Gleeson 20,216
Tyman 19,405
On The Beach 19,227
Victrex 17,504
Victoria 17,210
Subtotal 215,875
Total cost of purchases, including the above, for the year 406,290
Significant Sales
Proceeds £’000
Royal Dutch Shell ‘B’ 40,107
Smith & Nephew 29,464
Barclays 28,752
Shire 26,448
AstraZeneca 19,035
GlaxoSmithKline 18,960
Sage 17,441
Melrose Industries 17,074
Aviva 16,625
BP 15,199
Subtotal 229,105
Total proceeds from sales, including the above, for the year 378,419

Royal London Equity Funds ICVC 45
Royal London UK Opportunities Fund
FINANCIAL STATEMENTS
Statement of Total Returnfor the year ended 31 August 2018
Note £’000
Year ended31 August 2018
£’000 £’000
Year ended31 August 2017
£’000
Income Net capital gains 2 34,387 40,956 Revenue 3 21,366 24,584
Expenses 4 (7,446) (9,912)
Net revenue before taxation 13,920 14,672 Taxation 5 (21) –
Net revenue after taxation 13,899 14,672
Total return before distributions 48,286 55,628 Distributions 6 (15,956) (14,672)
Change in net assets attributable to shareholders from investment activities 32,330 40,956
Statement of Change in Net Assets Attributable to Shareholdersfor the year ended 31 August 2018
£’000
Year ended31 August 2018
£’000 £’000
Year ended31 August 2017
£’000
Opening net assets attributable to shareholders 727,356 674,139
Amounts receivable on creation of shares 14,391 4,088 Amounts payable on cancellation of shares (1,939) (6,483)
12,452 (2,395)
Change in net assets attributable to shareholders from investment activities 32,330 40,956 Retained distribution on accumulation shares 16,147 14,656
Closing net assets attributable to shareholders 788,285 727,356

Royal London Equity Funds ICVC46
Royal London UK Opportunities Fund
FINANCIAL STATEMENTS (CONTINUED)
Balance Sheetas at 31 August 2018
Note31 August 2018
£’00031 August 2017
£’000
ASSETS
Investments 769,595 707,404
Current assets:Debtors 7 6,074 6,721 Cash and bank balances 8 14,881 18,045
Total assets 790,550 732,170
LIABILITIES
Creditors:Distribution payable – 3Other creditors 9 2,265 4,811
Total liabilities 2,265 4,814
Net assets attributable to shareholders 788,285 727,356
Royal London Equity Funds ICVC 47
Royal London UK Opportunities Fund
NOTES TO THE FINANCIAL STATEMENTSFOR THE YEAR ENDED 31 AUGUST 2018
1. Accounting policiesThe accounting policies are set out in note 1 on page 8.
2. Net capital gains31 August 2018
£’00031 August 2017
£’000The net capital gains during the year comprise:
Non-derivative securities 34,392 40,954
Currency (losses)/gains (2) 3
Activity fees (3) (1)
Net capital gains 34,387 40,956
3. Revenue31 August 2018
£’00031 August 2017
£’000UK dividends 19,764 23,665
Overseas dividends 1,538 898
Bank interest 36 8
Stock lending income 28 13
Total revenue 21,366 24,584
4. Expenses31 August 2018
£’00031 August 2017
£’000Payable to the Authorised Corporate Director or associates of the Authorised Corporate Director and agents of either of them:
Authorised Corporate Director’s fee 7,329 9,802
Payable to the Depositary, associates of the Depositary and agents of either of them:
Depositary’s fee 66 62
Safe custody fees 12 11
78 73
Other expenses:
Registrar’s fees 24 21
Audit fee 10 11
Printing & stationery fee 3 3
Legal fee 2 2
39 37
Total expenses 7,446 9,912
Royal London Equity Funds ICVC48
5. Taxationa) Analysis of charge for the year
31 August 2018£’000
31 August 2017£’000
Irrecoverable overseas tax 21 –
Current tax charge for the year 21 –
b) Factors affecting the current tax charge for the yearThe tax assessed for the year is lower (31/08/17: lower) than the standard rate of corporation tax in the UK for an Open Ended Investment Company (20%).
The differences are explained below:
Net revenue before taxation 13,920 14,672
Corporation tax at 20% (31/08/17: 20%) 2,784 2,934
Effects of:
Revenue not subject to taxation (4,260) (4,912)
Current year expenses not utilised 1,476 1,978
Irrecoverable overseas tax 21 –
Current tax charge for the year 21 –
Authorised Open Ended Investment Companies are exempt from UK tax on capital gains, therefore any capital gains/(losses) are not included in the reconciliation above.
c) Provision for deferred taxThere was no provision required for deferred tax at the balance sheet date (31/08/17: same).
d) Factors that may affect future tax chargesAt the year end, there is a potential deferred tax asset of £14,199,000 (31/08/17: £12,723,000) in relation to surplus management expenses. It is unlikely the Fund will generate sufficient taxable profits in the future to utilise these expenses and therefore no deferred tax asset has been recognised in the year.
6. DistributionsThe distributions take account of income received on the issue of shares and income deducted on the cancellation of shares and comprise:
31 August 2018 £’000
31 August 2017 £’000
Accumulation shares
Final 16,147 14,656
16,147 14,656
Income shares
Final – 3
– 3
16,147 14,659
Add: Amounts deducted on cancellation of shares 11 31
Deduct: Amounts received on the creation of shares (202) (18)
Net distributions for the year 15,956 14,672
The difference between the net revenue after taxation and the distribution paid is as follows:
Net revenue after taxation 13,899 14,672
Equalisation on conversions 2,057 –
Net distributions for the year 15,956 14,672
Details of the distribution per share are set out on page 53.
Royal London UK Opportunities Fund
NOTES TO THE FINANCIAL STATEMENTS (CONTINUED)FOR THE YEAR ENDED 31 AUGUST 2018

Royal London Equity Funds ICVC 49
Royal London UK Opportunities Fund
NOTES TO THE FINANCIAL STATEMENTS (CONTINUED)FOR THE YEAR ENDED 31 AUGUST 2018
7. Debtors31 August 2018
£’00031 August 2017
£’000Amounts receivable on creation of shares 171 –
Sales awaiting settlement 1,790 2,064
Accrued revenue 4,113 4,657
Total debtors 6,074 6,721
8. Cash and bank balances31 August 2018
£’00031 August 2017
£’000Cash and bank balances 14,881 18,045
Total cash and bank balances 14,881 18,045
9. Other creditors31 August 2018
£’00031 August 2017
£’000Amounts payable on cancellation of shares – 3
Purchases awaiting settlement 1,763 3,916
Accrued expenses 502 892
Total other creditors 2,265 4,811
10. Reconciliation of number of sharesClass A
AccumulationClass M
AccumulationClass MIncome
Opening shares at 01/09/17 404,325,738 6,039,776 83,311
Shares issued 304,893 6,980,800 6,892
Shares cancelled (491,642) (542,806) (8,716)
Shares converted (404,138,989) 382,685,351 (81,487)
Closing shares at 31/08/18 – 395,163,121 –
All classes within the Fund have the same rights on winding up.
11. Contingent liabilities and outstanding commitmentsThere were no contingent liabilities or outstanding commitments at the balance sheet date (31/08/17: same).
12. Related party transactionsThe Fund’s Authorised Corporate Director, Royal London Unit Trust Managers Limited, is a related party to the Fund as defined by Financial Reporting Standard 102 ‘Related Party Disclosures’.
Authorised Corporate Director fees charged by Royal London Unit Trust Managers Limited are shown in note 4 and details of shares created and cancelled by Royal London Unit Trust Managers Limited are shown in the Statement of Change in Net Assets Attributable to Shareholders and note 6. At the year end the balance due to Royal London Unit Trust Managers Limited in respect of these transactions was £298,000 (31/08/17: £859,000).
At the year end, 31 August 2018, 97.33% (31/08/17: 98.41%) of the shares in issue were held by The Royal London Mutual Insurance Society Limited. Royal London Unit Trust Managers Limited is a wholly owned subsidiary of The Royal London Mutual Insurance Society Limited.
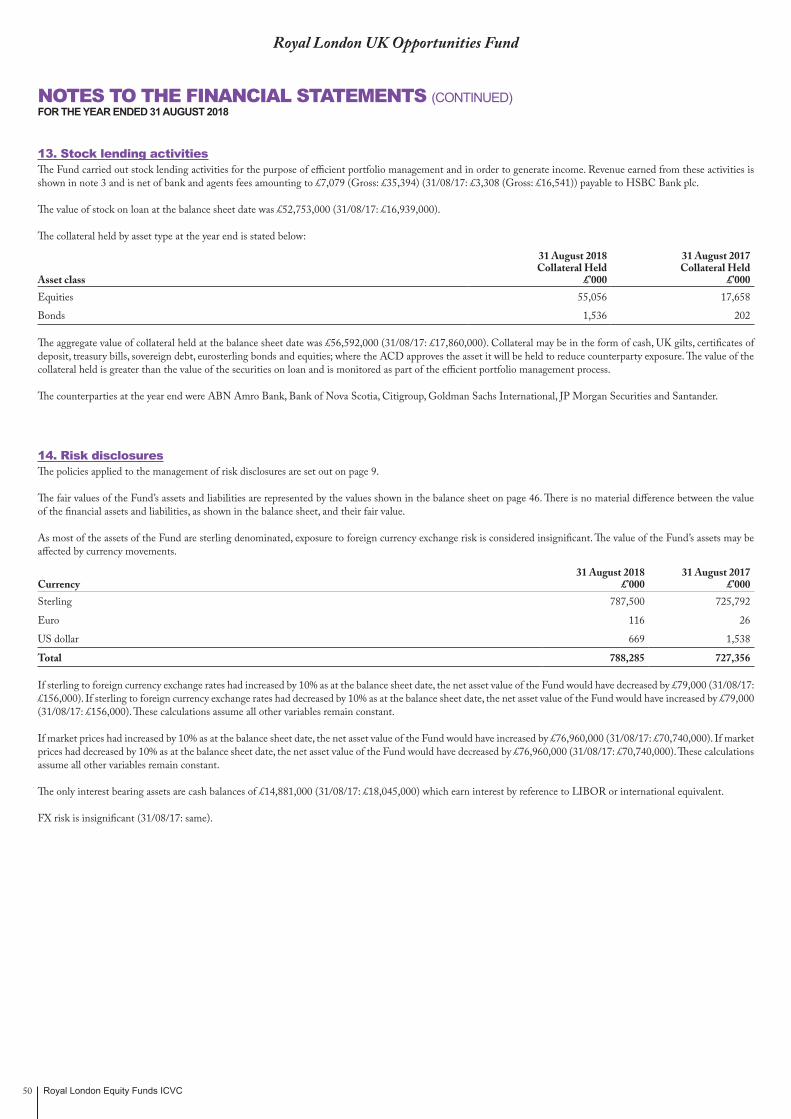
Royal London Equity Funds ICVC50
13. Stock lending activitiesThe Fund carried out stock lending activities for the purpose of efficient portfolio management and in order to generate income. Revenue earned from these activities is shown in note 3 and is net of bank and agents fees amounting to £7,079 (Gross: £35,394) (31/08/17: £3,308 (Gross: £16,541)) payable to HSBC Bank plc.
The value of stock on loan at the balance sheet date was £52,753,000 (31/08/17: £16,939,000).
The collateral held by asset type at the year end is stated below:
Asset class
31 August 2018 Collateral Held
£’000
31 August 2017 Collateral Held
£’000Equities 55,056 17,658
Bonds 1,536 202
The aggregate value of collateral held at the balance sheet date was £56,592,000 (31/08/17: £17,860,000). Collateral may be in the form of cash, UK gilts, certificates of deposit, treasury bills, sovereign debt, eurosterling bonds and equities; where the ACD approves the asset it will be held to reduce counterparty exposure. The value of the collateral held is greater than the value of the securities on loan and is monitored as part of the efficient portfolio management process.
The counterparties at the year end were ABN Amro Bank, Bank of Nova Scotia, Citigroup, Goldman Sachs International, JP Morgan Securities and Santander.
14. Risk disclosuresThe policies applied to the management of risk disclosures are set out on page 9.
The fair values of the Fund’s assets and liabilities are represented by the values shown in the balance sheet on page 46. There is no material difference between the value of the financial assets and liabilities, as shown in the balance sheet, and their fair value.
As most of the assets of the Fund are sterling denominated, exposure to foreign currency exchange risk is considered insignificant. The value of the Fund’s assets may be affected by currency movements.
Currency31 August 2018
£’00031 August 2017
£’000Sterling 787,500 725,792
Euro 116 26
US dollar 669 1,538
Total 788,285 727,356
If sterling to foreign currency exchange rates had increased by 10% as at the balance sheet date, the net asset value of the Fund would have decreased by £79,000 (31/08/17: £156,000). If sterling to foreign currency exchange rates had decreased by 10% as at the balance sheet date, the net asset value of the Fund would have increased by £79,000 (31/08/17: £156,000). These calculations assume all other variables remain constant.
If market prices had increased by 10% as at the balance sheet date, the net asset value of the Fund would have increased by £76,960,000 (31/08/17: £70,740,000). If market prices had decreased by 10% as at the balance sheet date, the net asset value of the Fund would have decreased by £76,960,000 (31/08/17: £70,740,000). These calculations assume all other variables remain constant.
The only interest bearing assets are cash balances of £14,881,000 (31/08/17: £18,045,000) which earn interest by reference to LIBOR or international equivalent.
FX risk is insignificant (31/08/17: same).
Royal London UK Opportunities Fund
NOTES TO THE FINANCIAL STATEMENTS (CONTINUED)FOR THE YEAR ENDED 31 AUGUST 2018

Royal London Equity Funds ICVC 51
Royal London UK Opportunities Fund
NOTES TO THE FINANCIAL STATEMENTS (CONTINUED)FOR THE YEAR ENDED 31 AUGUST 2018
15. Portfolio transaction costsFor the year ended 31 August 2018
Value Commissions Taxes Other expenses TotalAnalysis of total purchases costs £’000 £’000 % £’000 % £’000 % £’000Equity transactions 399,252 310 0.08 1,668 0.42 58 0.01 401,288
Corporate actions 5,002 – – – – – – 5,002
Total 404,254 310 1,668 58 406,290
Value Commissions Taxes Other expenses TotalAnalysis of total sales costs £’000 £’000 % £’000 % £’000 % £’000Equity transactions 371,806 285 0.08 – – – – 371,521
Corporate actions 6,898 – – – – – – 6,898
Total 378,704 285 – – 378,419
Commissions, taxes and fees as % of average net assetsCommissions 0.05%Taxes 0.14%Other expenses 0.00%
For the year ended 31 August 2017
Value Commissions Taxes Other expenses TotalAnalysis of total purchases costs £’000 £’000 % £’000 % £’000 % £’000Equity transactions 146,428 201 0.14 693 0.47 22 0.02 147,344
Total 146,428 201 693 22 147,344
Value Commissions Taxes Other expenses TotalAnalysis of total sales costs £’000 £’000 % £’000 % £’000 % £’000Equity transactions 132,424 193 0.15 – – – – 132,231
Total 132,424 193 – – 132,231
Commissions, taxes and fees as % of average net assetsCommissions 0.06%Taxes 0.10%Other expenses 0.00%
At the balance sheet date the portfolio dealing spread was 0.23% (31/08/17: 0.11%). The Fund is single priced throughout the year and therefore the dealing spread is not indicative of the full year.

Royal London Equity Funds ICVC52
16. Fair value of investmentsThe fair values of the Fund’s assets and liabilities are represented by the values shown in the balance sheet. There is no material difference between the value of the financial assets and liabilities, as shown in the balance sheet, and their fair value.
The fair value of investments has been determined using the following hierarchy:
Category 1 The unadjusted quoted price in an active market for identical assets or liabilities that the entity can access at the measurement date.
Category 2 Inputs other than quoted prices included within Level 1 that are observable (i.e. developed using market data) for the asset or liability, either directly or indirectly.
Category 3 Inputs are unobservable (i.e. for which market data is unavailable) for the asset or liability.
For the year ended 31 August 2018 Category 1 2 3 TotalInvestments £’000 £’000 £’000 £’000
Equities 769,595 – – 769,595
Total 769,595 – – 769,595
For the year ended 31 August 2017 Category 1 2 3 TotalInvestments £’000 £’000 £’000 £’000
Equities 707,404 – – 707,404
Total 707,404 – – 707,404
Royal London UK Opportunities Fund
NOTES TO THE FINANCIAL STATEMENTS (CONTINUED)FOR THE YEAR ENDED 31 AUGUST 2018
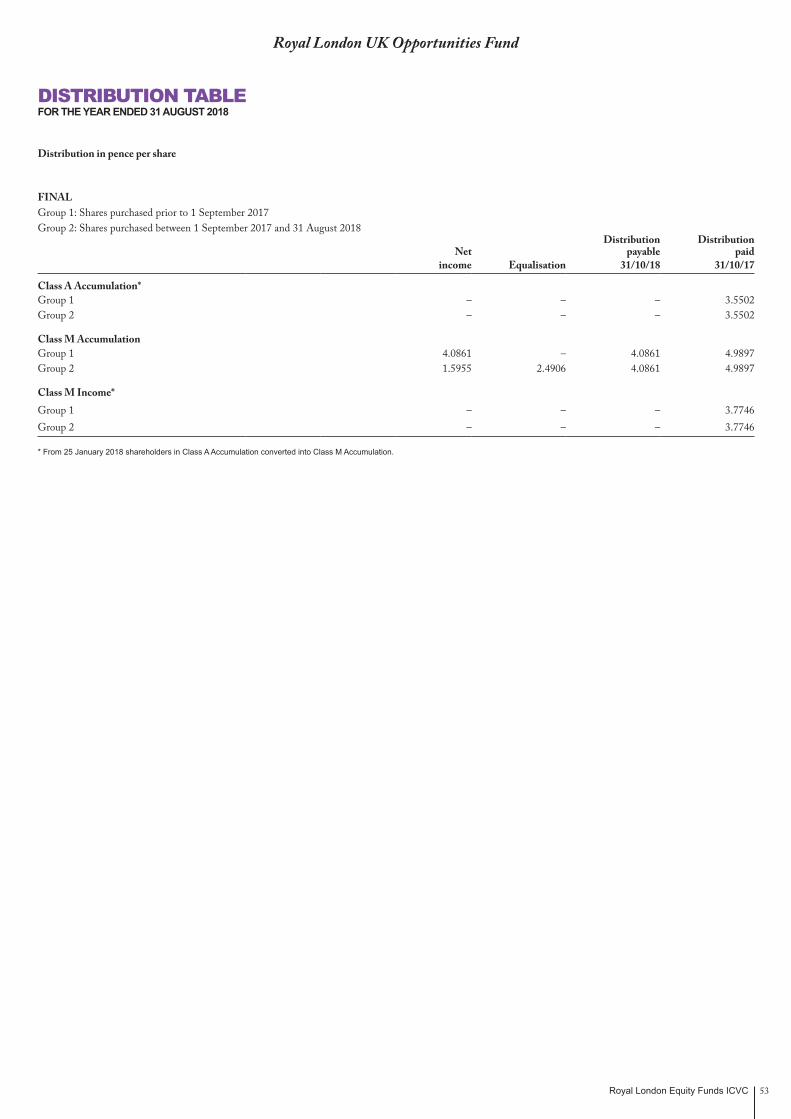
Royal London Equity Funds ICVC 53
Royal London UK Opportunities Fund
DISTRIBUTION TABLEFOR THE YEAR ENDED 31 AUGUST 2018
Distribution in pence per share
FINALGroup 1: Shares purchased prior to 1 September 2017Group 2: Shares purchased between 1 September 2017 and 31 August 2018
NetDistribution
payableDistribution
paidincome Equalisation 31/10/18 31/10/17
Class A Accumulation*Group 1 – – – 3.5502Group 2 – – – 3.5502
Class M AccumulationGroup 1 4.0861 – 4.0861 4.9897Group 2 1.5955 2.4906 4.0861 4.9897
Class M Income*Group 1 – – – 3.7746Group 2 – – – 3.7746
* From 25 January 2018 shareholders in Class A Accumulation converted into Class M Accumulation.
Royal London Equity Funds ICVC54
Royal London Japan Tracker Fund
Fund Performance12 months to 31 August 2018
1 year return
%
3 year return
%
5 year return
%Royal London Japan Tracker Fund, Class Z Accumulation (Total return) 8.62 50.15 77.23
FTSE® Japan Index (Capital return) 6.28 44.31 62.92
Past performance is not necessarily a reliable indicator of future performance. The value of investments and the income from them is not guaranteed and may go down as well as up, and investors may not get back the amount originally invested.
Source: RLAM and Lipper, as at 31 August 2018. Returns are net of management fees. Investors should note that the total return is calculated on the Fund’s official midday price whereas the Fund has been valued as at close of business for the Net Asset Value quoted within the Comparative Table. Please also note, the total return shown in the table is being compared against the official end of day price of the benchmark. The tracking error shown in the performance overview below is calculated using the unofficial end of day fund price to align with the official end of day benchmark price.
Performance OverviewInvestors should note that the Fund price is taken at noon each day, whilst the index performance is recorded at the close of business. Significant intra-day market movements at the start or end of the day may therefore distort comparisons. This and the charges associated with the Fund account for the majority of the difference between the performance of the Fund and the FTSE® Japan Index.
The tracking error between the Royal London Japan Tracker Fund and the FTSE® Japan Index was 0.20% during the period under review. This is within the anticipated tracking error range of 0.20% to 0.30%. We will always experience a small tracking difference between Fund and index for reasons including exchange rate risk on some dividends, trading costs and the use of index futures to manage cashflows.
Market and Portfolio CommentaryThe Fund aims to achieve the capital return of the FTSE® Japan Index. However, perfect replication can result in unnecessary and costly trading which may outweigh the benefits. The Fund uses an optimiser to help construct a portfolio designed to track the performance of the benchmark without necessarily holding all the constituents in their exact benchmark weights. It generates efficient rebalancing and cashflow trades and allows flexibility not to trade every index or cashflow event. In practice, the Fund holds most of its benchmark’s names, as well as holding futures and cash.
Nils JungbackeFund Manager31 August 2018Royal London Asset Management
Please note that Nils Jungbacke started managing the Fund on 4 January 2018. The previous Fund Manager was Vicky Harriss.
The views expressed are the author’s own and do not constitute investment advice and are not an indication of future fund performance. Portfolio holdings are subject to change, for information only and are not investment recommendations.
Source: Royal London Asset Management, unless otherwise stated.
MANAGER’S INVESTMENT REPORT
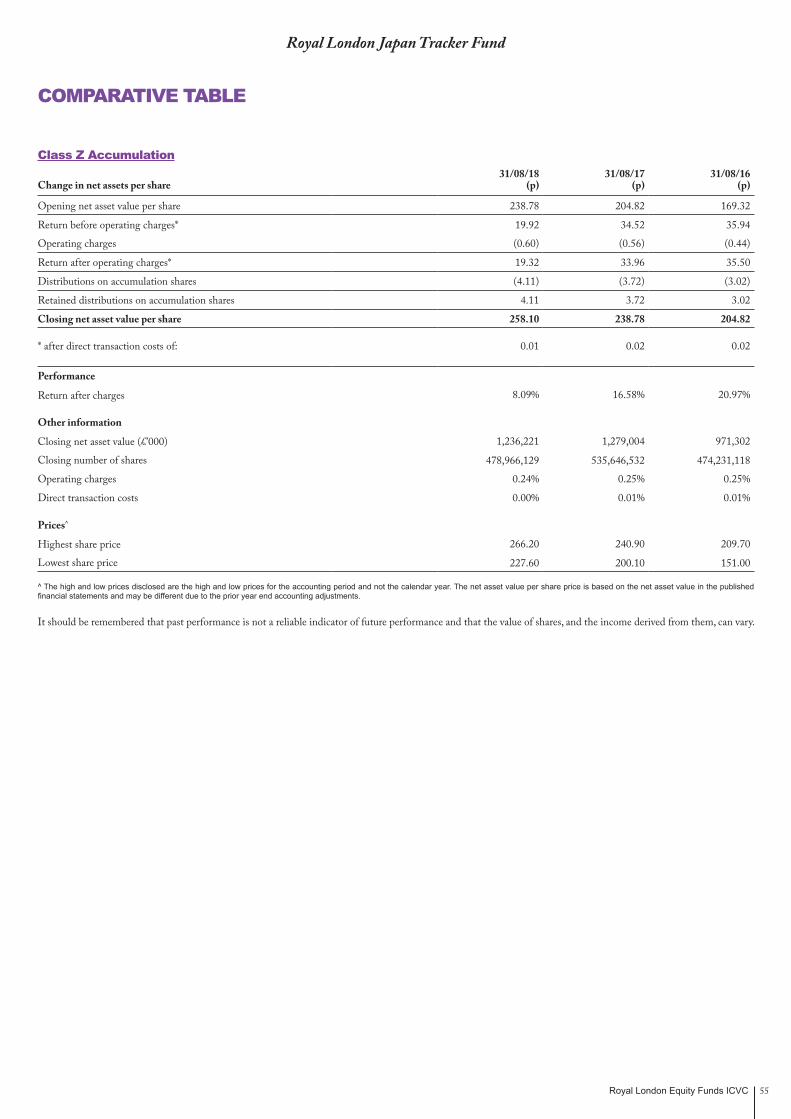
Royal London Equity Funds ICVC 55
Royal London Japan Tracker Fund
Class Z Accumulation31/08/18 31/08/17 31/08/16
Change in net assets per share (p) (p) (p)
Opening net asset value per share 238.78 204.82 169.32
Return before operating charges* 19.92 34.52 35.94
Operating charges (0.60) (0.56) (0.44)
Return after operating charges* 19.32 33.96 35.50
Distributions on accumulation shares (4.11) (3.72) (3.02)
Retained distributions on accumulation shares 4.11 3.72 3.02
Closing net asset value per share 258.10 238.78 204.82
* after direct transaction costs of: 0.01 0.02 0.02
Performance
Return after charges 8.09% 16.58% 20.97%
Other information
Closing net asset value (£’000) 1,236,221 1,279,004 971,302
Closing number of shares 478,966,129 535,646,532 474,231,118
Operating charges 0.24% 0.25% 0.25%
Direct transaction costs 0.00% 0.01% 0.01%
Prices^
Highest share price 266.20 240.90 209.70
Lowest share price 227.60 200.10 151.00
^ The high and low prices disclosed are the high and low prices for the accounting period and not the calendar year. The net asset value per share price is based on the net asset value in the published financial statements and may be different due to the prior year end accounting adjustments.
It should be remembered that past performance is not a reliable indicator of future performance and that the value of shares, and the income derived from them, can vary.
COMPARATIVE TABLE

Royal London Equity Funds ICVC56
Royal London Japan Tracker Fund
Equities – 99.05% (31/08/17 – 98.85%) Oil & Gas – 1.20% (31/08/17 – 0.88%) Oil & Gas Producers – 1.20% 27,500 Cosmo Energy 780 0.06 60,100 Idemitsu Kosan 2,335 0.19 378,100 Inpex 3,186 0.26 13,100 Japan Petroleum Exploration 215 0.02 1,310,720 JXTG 7,115 0.57 79,000 Showa Shell Sekiyu 1,228 0.10
Total Oil & Gas 14,859 1.20
Basic Materials – 6.43% (31/08/17 – 6.79%) Chemicals – 4.81% 58,300 Air Water 805 0.06 514,000 Asahi Kasei 5,811 0.47 123,400 Daicel 1,076 0.09 33,900 Denka 894 0.07 33,500 DIC 916 0.07 41,900 Hitachi Chemical 678 0.05 77,000 JSR 1,152 0.09 117,000 Kaneka 823 0.07 79,800 Kansai Paint 1,216 0.10 143,200 Kuraray 1,601 0.13 19,400 Lintec 409 0.03 531,500 Mitsubishi Chemical 3,672 0.30 74,200 Mitsubishi Gas Chemical 1,190 0.10 73,800 Mitsui Chemicals 1,471 0.12 42,600 Nagase & Company 547 0.04 67,100 Nippon Kayaku 607 0.05 63,800 Nippon Paint 1,941 0.16 13,500 Nippon Shokubai 766 0.06 56,900 Nissan Chemical Industries 2,089 0.17 65,300 Nitto Denko 3,906 0.32 28,600 NOF 731 0.06 168,600 Shin-Etsu Chemical 12,184 0.99 59,900 Showa Denko KK 2,194 0.18 617,000 Sumitomo Chemical 2,701 0.22 60,300 Taiyo Nippon Sanso 684 0.06 75,100 Teijin 1,146 0.09 80,100 Tokai Carbon 1,103 0.09 29,500 Tokuyama 697 0.06 623,600 Toray Industries 3,607 0.29 116,400 Tosoh 1,410 0.11 43,100 Ube Industries 845 0.07 61,500 Zeon 508 0.04
Forestry & Paper – 0.20% 40,800 Nippon Paper Industries 572 0.04 368,000 Oji 1,938 0.16
Industrial Metals – 1.42% 14,500 Daido Steel 510 0.04 18,400 Dowa Mining 424 0.03 81,400 Hitachi Metals 725 0.06 212,300 JFE 3,581 0.29 122,300 Kobe Steel 788 0.06 25,700 Maruichi Steel Tube 606 0.05 23,400 Mitsui Mining & Smelting 517 0.04 322,200 Nippon Steel 4,998 0.40 18,500 Nisshin Steel 200 0.02 97,800 Sumitomo Metal Mining 2,435 0.20 92,000 Toyota Tsusho 2,416 0.20 15,300 Yamato Kogyo 338 0.03
Total Basic Materials 79,428 6.43
Industrials – 23.25% (31/08/17 – 22.83%) Construction & Materials – 2.18% 21,000 Aica Kogyo 622 0.05 77,000 Asahi Glass 2,377 0.19 40,900 Comsys 853 0.07 29,200 Daito Trust Construction 3,372 0.27 114,200 Haseko 1,140 0.09 376,000 Kajima 2,085 0.17 41,900 Kandenko 323 0.03 53,900 Kinden 655 0.05 38,200 Kyowa Exeo 823 0.07 107,900 Lixil Group 1,631 0.13 53,400 Maeda 491 0.04 21,400 Maeda Road Construction 320 0.03 20,000 Nippo 286 0.02 281,400 Obayashi 2,031 0.16 113,400 Penta-Ocean Construction 513 0.04 82,900 Sanwa Holding 733 0.06 229,600 Shimizu 1,547 0.13 147,000 Sumitomo Osaka Cement 484 0.04 50,800 Taiheiyo Cement 1,184 0.10 87,200 Taisei 3,004 0.24 91,600 Toda 490 0.04 60,500 Toto 1,971 0.16
General Industrials – 0.92% 9,700 FP 421 0.03 53,400 IHI 1,438 0.11 51,500 Mitsubishi Materials 1,072 0.09 86,600 Rengo 573 0.05 509,100 Sojitz 1,367 0.11 2,445,000 Toshiba 5,615 0.45 66,100 Toyo Seikan 965 0.08
Electronic & Electrical Equipment – 6.95% 76,800 Alps Electric 1,774 0.14 28,500 Azbil 957 0.08 258,000 Fuji Electric 1,600 0.13 107,300 Fujikura 510 0.04 25,300 Furukawa Electric 671 0.06 52,000 Hamamatsu Photonics 1,613 0.13 13,600 Hirose Electric 1,247 0.10 1,911,000 Hitachi 9,620 0.78 15,500 Horiba 739 0.06 151,300 Hoya 6,817 0.55 45,900 Ibiden 514 0.04 19,000 Japan Aviation Electronic 268 0.02 284,000 Japan Display 329 0.03 37,200 Keyence 16,204 1.31 129,000 Kyocera 6,270 0.51 21,100 Mabuchi Motor 674 0.06 173,700 Minebea 2,512 0.20 78,400 Murata Manufacturing 10,436 0.84 110,800 NGK Insulators 1,390 0.11 96,600 Nidec 10,791 0.87 33,900 Nippon Electric Glass 839 0.07 79,800 Omron 2,752 0.22 45,700 Taiyo Yuden 1,037 0.08 49,500 TDK 4,283 0.35 49,900 Ushio 507 0.04 99,900 Yokogawa Electric 1,578 0.13
PORTFOLIO STATEMENTAS AT 31 AUGUST 2018
Bid-Market Total net Holding Investment value (£’000) assets (%)
Bid-Market Total net Holding Investment value (£’000) assets (%)

Royal London Equity Funds ICVC 57
Royal London Japan Tracker Fund
Industrials – 23.25% (31/08/17 – 22.83%) – continued Industrial Engineering – 7.19% 134,400 Amada 1,106 0.09 62,900 Chiyoda 355 0.03 39,300 Daifuku 1,571 0.13 109,600 Daikin Industries 10,764 0.87 11,400 Disco 1,572 0.13 40,500 DMG Mori 516 0.04 43,000 Ebara 1,132 0.09 80,200 Fanuc 12,109 0.98 21,900 Glory 450 0.04 111,100 Hino Motors 901 0.07 43,500 Hitachi Construction Machinery 1,001 0.08 21,900 Hoshizaki Electric 1,600 0.13 224,300 Isuzu Motors 2,500 0.20 26,600 Japan Steel Works 525 0.04 89,100 JGC 1,383 0.11 59,700 Kawasaki Heavy Industries 1,257 0.10 377,400 Komatsu 8,275 0.67 458,200 Kubota 5,519 0.45 45,700 Kurita Water Industries 1,045 0.08 16,000 Kyudenko 469 0.04 113,800 Misumi 2,261 0.18 817,200 Mitsubishi Electric 8,502 0.69 118,000 Mitsubishi Heavy Industries 3,377 0.27 30,500 Mitsui Engineering & Shipbuilding 367 0.03 40,200 Miura 867 0.07 49,600 Nabtesco 997 0.08 190,500 NSK 1,665 0.14 172,300 NTN 544 0.04 12,400 Okuma 551 0.04 32,100 OSG 568 0.05 12,700 Shima Seiki Manufacturing 456 0.04 110,700 Shimadzu 2,527 0.20 23,900 SMC 6,129 0.50 47,600 Sumitomo Heavy Industries 1,191 0.10 46,500 Tadano 394 0.03 46,300 THK 956 0.08 20,800 Ulvac 664 0.05 107,400 Yaskawa Electric 2,776 0.23
Industrial Transportation – 1.11% 13,700 Fukuyama Transport 495 0.04 17,400 Hitachi Transport System 369 0.03 19,700 Japan Airport Terminal 680 0.06 43,400 Kamigumi 679 0.05 32,900 Kawasaki Kisen Kaisha 469 0.04 65,400 Kyushu Railway 1,513 0.12 27,800 Mitsubishi Logistics 490 0.04 46,200 Mitsui OSK Lines 958 0.08 30,400 Nippon Express 1,468 0.12 67,900 Nippon Yusen KK 987 0.08 21,000 Sankyu 857 0.07 64,200 Seino 758 0.06 32,000 SG Holdings 583 0.05 147,000 Yamato 3,367 0.27
Support Services – 4.90% 9,600 Askul 214 0.02 6,700 GMO Payment Gateway 614 0.05 583,900 Itochu 7,872 0.64 644,700 Marubeni 4,077 0.33 530,800 Mitsubishi 11,675 0.94 699,000 Mitsui & Company 8,980 0.73
Industrials – 23.25% (31/08/17 – 22.83%) – continued Support Services – 4.90% – continued 24,800 Monotaro 1,084 0.09 71,200 Persol Holdings 1,227 0.10 492,600 Recruit 11,563 0.93 79,800 Secom 5,059 0.41 28,400 Sohgo Securities Services 963 0.08 462,800 Sumitomo 5,790 0.47 19,800 Toppan Forms 150 0.01 213,000 Toppan Printing 1,281 0.10
Total Industrials 287,382 23.25
Consumer Goods – 23.85% (31/08/17 – 24.23%) Automobiles & Parts – 10.56% 71,000 Aisin Seiki 2,527 0.21 254,200 Bridgestone 7,214 0.58 189,200 Denso 7,023 0.57 11,500 Exedy 278 0.02 161,000 GS Yuasa 610 0.05 727,200 Honda Motor 16,600 1.34 93,200 JTEKT 1,006 0.08 47,000 Koito Manufacturing 2,237 0.18 235,800 Mazda Motor 2,107 0.17 258,200 Mitsubishi Motors 1,417 0.11 82,700 NGK Spark Plug 1,810 0.15 64,500 NHK Spring 525 0.04 34,000 Nifco 720 0.06 793,900 Nissan Motor 5,729 0.46 25,300 Nissan Shatai 173 0.02 46,400 NOK 683 0.06 60,800 Stanley Electric 1,620 0.13 253,300 Subaru Corporation 5,800 0.47 310,800 Sumitomo Electric Industries 3,790 0.31 75,600 Sumitomo Rubber Industries 864 0.07 169,800 Suzuki Motor 8,512 0.69 20,900 Tokai Rika 339 0.03 42,300 Toyo Tire & Rubber 534 0.04 31,500 Toyoda Gosei 606 0.05 25,900 Toyota Boshoku 349 0.03 66,200 Toyota Industries 2,889 0.23 1,060,480 Toyota Motor 50,970 4.12 21,300 TS Tech 620 0.05 115,500 Yamaha Motor 2,256 0.18 44,600 Yokohama Rubber 722 0.06
Beverages – 1.41% 156,400 Asahi Breweries 5,439 0.44 66,900 Coca-Cola West Japan 1,458 0.12 22,700 Ito En 769 0.06 29,100 Kagome 635 0.05 342,900 Kirin 6,535 0.53 27,500 Sapporo Breweries 443 0.04 51,100 Suntory Beverage & Food 1,613 0.13 71,700 Takara Shuzo 547 0.04
Food Producers – 1.94% 208,300 Ajinomoto 2,725 0.22 7,200 Ariake Japan 499 0.04 32,000 Calbee 784 0.06 22,200 Ezaki Glico 860 0.07 19,500 Fuji Oil 457 0.04 31,700 House Foods 724 0.06 55,700 Itoham Yonekyu 318 0.03
PORTFOLIO STATEMENT (CONTINUED)AS AT 31 AUGUST 2018
Bid-Market Total net Holding Investment value (£’000) assets (%)
Bid-Market Total net Holding Investment value (£’000) assets (%)

Royal London Equity Funds ICVC58
Royal London Japan Tracker Fund
Consumer Goods – 23.85% (31/08/17 – 24.23%) – continued Food Producers – 1.94% – continued 47,500 Kewpie 883 0.07 75,000 Kikkoman 2,893 0.23 16,600 Megmilk Snow Brand 323 0.03 55,000 Meiji 2,813 0.23 6,200 Mitsubishi Shokuhin 132 0.01 17,000 Morinaga 510 0.04 16,100 Morinaga Milk Industry 336 0.03 42,500 NH Foods 1,193 0.10 45,300 Nichirei 877 0.07 104,800 Nisshin Seifun 1,615 0.13 28,400 Nissin Food Products 1,395 0.11 36,300 Toyo Suisan Kaisha 1,030 0.08 50,600 Yakult Honsha 2,770 0.23 52,800 Yamazaki Baking 792 0.06
Household Goods – 1.52% 268,100 Daiwa House Industry 6,299 0.51 25,300 Fujitsu General 321 0.03 59,500 IIDA Group 847 0.07 37,400 Kokuyo 500 0.04 99,900 Makita 3,487 0.28 9,800 Pilot 430 0.04 15,200 Rinnai 871 0.07 21,600 Sanrio 356 0.03 147,900 Sekisui Chemical 1,982 0.16 238,100 Sekisui House 2,994 0.24 53,800 Sumitomo Forestry 670 0.05
Leisure Goods – 4.79% 79,700 Bandai Namco 2,381 0.19 89,600 Casio Computer 1,108 0.09 15,900 Daiichi Kosho 566 0.05 38,600 Konami 1,247 0.10 143,400 Nikon 2,113 0.17 44,400 Nintendo 12,366 1.00 879,400 Panasonic 8,094 0.65 83,200 Sega Sammy 1,034 0.08 59,400 Sharp 1,085 0.09 32,100 Shimano 3,813 0.31 522,700 Sony 23,012 1.86 66,800 Yamaha 2,452 0.20
Personal Goods – 2.82% 10,400 ABC-Mart 437 0.04 72,400 Asics 835 0.07 112,700 Citizen Watch 595 0.05 8,500 Dr.Ci:Labo 282 0.02 198,600 Kao 11,877 0.96 12,100 Kose 1,721 0.14 102,800 Lion 1,669 0.14 54,200 Nisshinbo Industries 468 0.04 6,300 Noevir Holdings 285 0.02 13,100 Paltac 548 0.04 43,900 Pigeon 1,630 0.13 31,800 Pola Orbis 864 0.07 160,300 Shiseido 8,694 0.70 34,600 Toyobo 487 0.04 156,400 Uni-Charm 3,939 0.32 24,100 Wacoal 548 0.04
Consumer Goods – 23.85% (31/08/17 – 24.23%) – continued Tobacco – 0.81% 494,500 Japan Tobacco 10,026 0.81
Total Consumer Goods 294,831 23.85
Healthcare – 7.49% (31/08/17 – 6.75%) Healthcare Equipment & Services – 1.39% 40,800 Asahi Intecc 1,197 0.10 30,600 Nihon Kohden 690 0.05 50,600 Nipro 521 0.04 115,800 Olympus Optical 3,632 0.29 78,000 Sysmex 5,206 0.42 127,200 Terumo 5,401 0.44 42,300 Topcon 569 0.05
Pharmaceuticals & Biotechnology – 6.10% 72,000 Alfresa 1,391 0.11 818,800 Astellas Pharmaceuticals 10,689 0.86 89,000 Chugai Pharmaceuticals 3,971 0.32 262,500 Daiichi Sankyo 7,894 0.64 109,300 Eisai 7,618 0.62 29,500 Hisamitsu Pharmaceutical 1,660 0.13 14,500 Kaken Pharmaceutical 573 0.05 11,900 Kissei Pharmaceutical 271 0.02 26,000 Kobayashi Pharmaceutical 1,438 0.12 19,000 Kyorin 304 0.02 104,600 Kyowa Hakko Kogyo 1,428 0.12 63,100 Medipal 981 0.08 20,300 Miraca 432 0.04 90,300 Mitsubishi Tanabe Pharmaceutical 1,160 0.09 5,700 Mochida Pharmaceutical 340 0.03 21,900 Nippon Shinyaku 991 0.08 181,500 Ono Pharmaceutical 3,675 0.30 173,200 Otsuka 6,260 0.51 35,300 Peptidream 1,062 0.09 40,200 Rohto Pharmaceutical 989 0.08 147,900 Santen Pharmaceutical 1,756 0.14 15,800 Sawai Pharmaceutical 650 0.05 116,800 Shionogi 5,229 0.42 68,000 Sumitomo Dainippon Pharmaceuticals 1,114 0.09 32,700 Suzuken 1,146 0.09 18,000 Taisho Pharmaceuticals 1,502 0.12 315,100 Takeda Pharmaceutical 10,160 0.82 26,800 Tsumura & Co 705 0.06
Total Healthcare 92,605 7.49
Consumer Services – 10.48% (31/08/17 – 10.32%) Food & Drug Retailers – 0.68% 11,700 AIN Holdings 689 0.06 3,600 Cosmos Pharmaceutical 581 0.05 28,506 Familymart 1,915 0.15 20,200 Lawson 914 0.07 31,100 Matsumotokiyoshi 905 0.07 14,700 Sugi 559 0.05 28,000 Sundrug 774 0.06 15,200 Tsuruha 1,338 0.11 20,900 Welcia 742 0.06
PORTFOLIO STATEMENT (CONTINUED)AS AT 31 AUGUST 2018
Bid-Market Total net Holding Investment value (£’000) assets (%)
Bid-Market Total net Holding Investment value (£’000) assets (%)
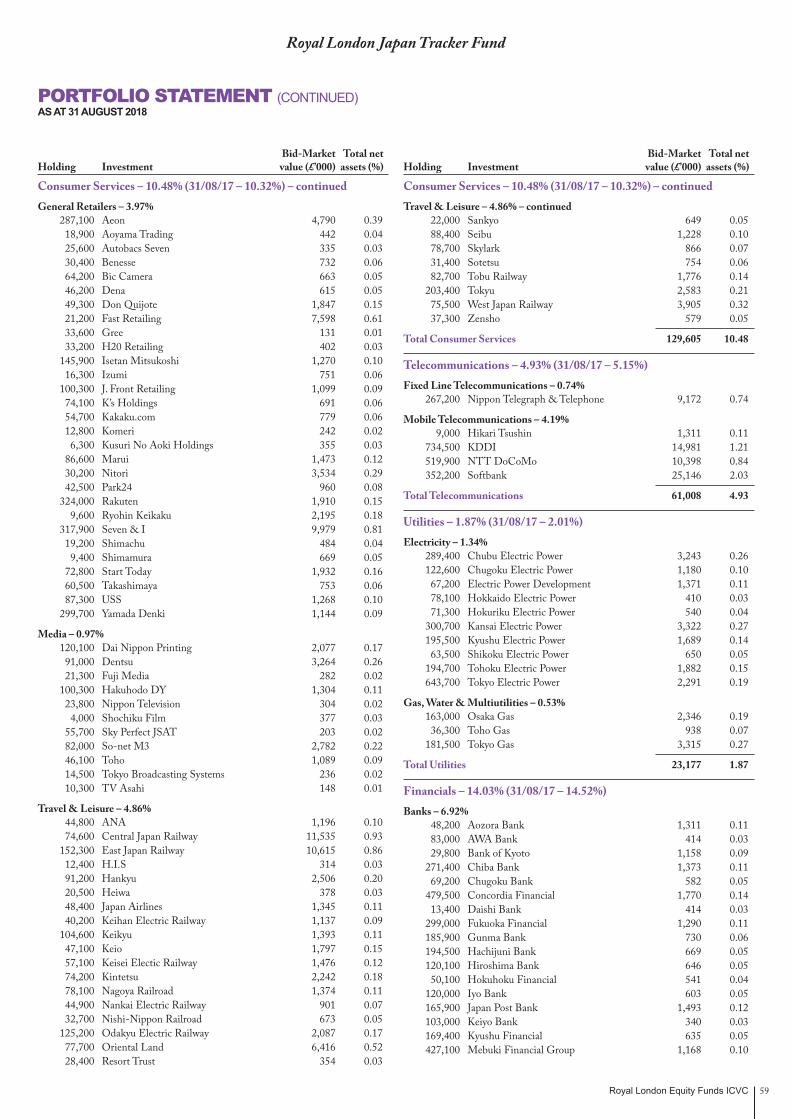
Royal London Equity Funds ICVC 59
Royal London Japan Tracker Fund
Consumer Services – 10.48% (31/08/17 – 10.32%) – continued General Retailers – 3.97% 287,100 Aeon 4,790 0.39 18,900 Aoyama Trading 442 0.04 25,600 Autobacs Seven 335 0.03 30,400 Benesse 732 0.06 64,200 Bic Camera 663 0.05 46,200 Dena 615 0.05 49,300 Don Quijote 1,847 0.15 21,200 Fast Retailing 7,598 0.61 33,600 Gree 131 0.01 33,200 H20 Retailing 402 0.03 145,900 Isetan Mitsukoshi 1,270 0.10 16,300 Izumi 751 0.06 100,300 J. Front Retailing 1,099 0.09 74,100 K’s Holdings 691 0.06 54,700 Kakaku.com 779 0.06 12,800 Komeri 242 0.02 6,300 Kusuri No Aoki Holdings 355 0.03 86,600 Marui 1,473 0.12 30,200 Nitori 3,534 0.29 42,500 Park24 960 0.08 324,000 Rakuten 1,910 0.15 9,600 Ryohin Keikaku 2,195 0.18 317,900 Seven & I 9,979 0.81 19,200 Shimachu 484 0.04 9,400 Shimamura 669 0.05 72,800 Start Today 1,932 0.16 60,500 Takashimaya 753 0.06 87,300 USS 1,268 0.10 299,700 Yamada Denki 1,144 0.09
Media – 0.97% 120,100 Dai Nippon Printing 2,077 0.17 91,000 Dentsu 3,264 0.26 21,300 Fuji Media 282 0.02 100,300 Hakuhodo DY 1,304 0.11 23,800 Nippon Television 304 0.02 4,000 Shochiku Film 377 0.03 55,700 Sky Perfect JSAT 203 0.02 82,000 So-net M3 2,782 0.22 46,100 Toho 1,089 0.09 14,500 Tokyo Broadcasting Systems 236 0.02 10,300 TV Asahi 148 0.01
Travel & Leisure – 4.86% 44,800 ANA 1,196 0.10 74,600 Central Japan Railway 11,535 0.93 152,300 East Japan Railway 10,615 0.86 12,400 H.I.S 314 0.03 91,200 Hankyu 2,506 0.20 20,500 Heiwa 378 0.03 48,400 Japan Airlines 1,345 0.11 40,200 Keihan Electric Railway 1,137 0.09 104,600 Keikyu 1,393 0.11 47,100 Keio 1,797 0.15 57,100 Keisei Electic Railway 1,476 0.12 74,200 Kintetsu 2,242 0.18 78,100 Nagoya Railroad 1,374 0.11 44,900 Nankai Electric Railway 901 0.07 32,700 Nishi-Nippon Railroad 673 0.05 125,200 Odakyu Electric Railway 2,087 0.17 77,700 Oriental Land 6,416 0.52 28,400 Resort Trust 354 0.03
Consumer Services – 10.48% (31/08/17 – 10.32%) – continued Travel & Leisure – 4.86% – continued 22,000 Sankyo 649 0.05 88,400 Seibu 1,228 0.10 78,700 Skylark 866 0.07 31,400 Sotetsu 754 0.06 82,700 Tobu Railway 1,776 0.14 203,400 Tokyu 2,583 0.21 75,500 West Japan Railway 3,905 0.32 37,300 Zensho 579 0.05
Total Consumer Services 129,605 10.48
Telecommunications – 4.93% (31/08/17 – 5.15%) Fixed Line Telecommunications – 0.74% 267,200 Nippon Telegraph & Telephone 9,172 0.74
Mobile Telecommunications – 4.19% 9,000 Hikari Tsushin 1,311 0.11 734,500 KDDI 14,981 1.21 519,900 NTT DoCoMo 10,398 0.84 352,200 Softbank 25,146 2.03
Total Telecommunications 61,008 4.93
Utilities – 1.87% (31/08/17 – 2.01%) Electricity – 1.34% 289,400 Chubu Electric Power 3,243 0.26 122,600 Chugoku Electric Power 1,180 0.10 67,200 Electric Power Development 1,371 0.11 78,100 Hokkaido Electric Power 410 0.03 71,300 Hokuriku Electric Power 540 0.04 300,700 Kansai Electric Power 3,322 0.27 195,500 Kyushu Electric Power 1,689 0.14 63,500 Shikoku Electric Power 650 0.05 194,700 Tohoku Electric Power 1,882 0.15 643,700 Tokyo Electric Power 2,291 0.19
Gas, Water & Multiutilities – 0.53% 163,000 Osaka Gas 2,346 0.19 36,300 Toho Gas 938 0.07 181,500 Tokyo Gas 3,315 0.27
Total Utilities 23,177 1.87
Financials – 14.03% (31/08/17 – 14.52%) Banks – 6.92% 48,200 Aozora Bank 1,311 0.11 83,000 AWA Bank 414 0.03 29,800 Bank of Kyoto 1,158 0.09 271,400 Chiba Bank 1,373 0.11 69,200 Chugoku Bank 582 0.05 479,500 Concordia Financial 1,770 0.14 13,400 Daishi Bank 414 0.03 299,000 Fukuoka Financial 1,290 0.11 185,900 Gunma Bank 730 0.06 194,500 Hachijuni Bank 669 0.05 120,100 Hiroshima Bank 646 0.05 50,100 Hokuhoku Financial 541 0.04 120,000 Iyo Bank 603 0.05 165,900 Japan Post Bank 1,493 0.12 103,000 Keiyo Bank 340 0.03 169,400 Kyushu Financial 635 0.05 427,100 Mebuki Financial Group 1,168 0.10
PORTFOLIO STATEMENT (CONTINUED)AS AT 31 AUGUST 2018
Bid-Market Total net Holding Investment value (£’000) assets (%)
Bid-Market Total net Holding Investment value (£’000) assets (%)
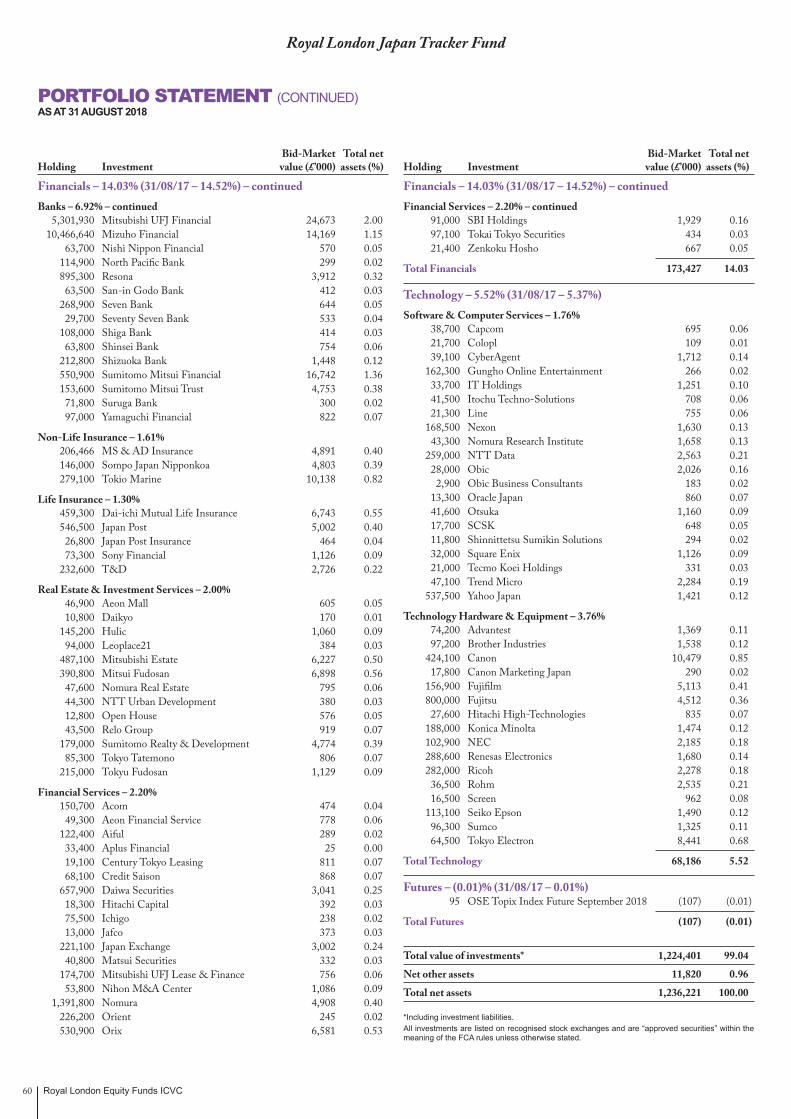
Royal London Equity Funds ICVC60
Royal London Japan Tracker Fund
Financials – 14.03% (31/08/17 – 14.52%) – continued Banks – 6.92% – continued 5,301,930 Mitsubishi UFJ Financial 24,673 2.00 10,466,640 Mizuho Financial 14,169 1.15 63,700 Nishi Nippon Financial 570 0.05 114,900 North Pacific Bank 299 0.02 895,300 Resona 3,912 0.32 63,500 San-in Godo Bank 412 0.03 268,900 Seven Bank 644 0.05 29,700 Seventy Seven Bank 533 0.04 108,000 Shiga Bank 414 0.03 63,800 Shinsei Bank 754 0.06 212,800 Shizuoka Bank 1,448 0.12 550,900 Sumitomo Mitsui Financial 16,742 1.36 153,600 Sumitomo Mitsui Trust 4,753 0.38 71,800 Suruga Bank 300 0.02 97,000 Yamaguchi Financial 822 0.07
Non-Life Insurance – 1.61% 206,466 MS & AD Insurance 4,891 0.40 146,000 Sompo Japan Nipponkoa 4,803 0.39 279,100 Tokio Marine 10,138 0.82
Life Insurance – 1.30% 459,300 Dai-ichi Mutual Life Insurance 6,743 0.55 546,500 Japan Post 5,002 0.40 26,800 Japan Post Insurance 464 0.04 73,300 Sony Financial 1,126 0.09 232,600 T&D 2,726 0.22
Real Estate & Investment Services – 2.00% 46,900 Aeon Mall 605 0.05 10,800 Daikyo 170 0.01 145,200 Hulic 1,060 0.09 94,000 Leoplace21 384 0.03 487,100 Mitsubishi Estate 6,227 0.50 390,800 Mitsui Fudosan 6,898 0.56 47,600 Nomura Real Estate 795 0.06 44,300 NTT Urban Development 380 0.03 12,800 Open House 576 0.05 43,500 Relo Group 919 0.07 179,000 Sumitomo Realty & Development 4,774 0.39 85,300 Tokyo Tatemono 806 0.07 215,000 Tokyu Fudosan 1,129 0.09
Financial Services – 2.20% 150,700 Acom 474 0.04 49,300 Aeon Financial Service 778 0.06 122,400 Aiful 289 0.02 33,400 Aplus Financial 25 0.00 19,100 Century Tokyo Leasing 811 0.07 68,100 Credit Saison 868 0.07 657,900 Daiwa Securities 3,041 0.25 18,300 Hitachi Capital 392 0.03 75,500 Ichigo 238 0.02 13,000 Jafco 373 0.03 221,100 Japan Exchange 3,002 0.24 40,800 Matsui Securities 332 0.03 174,700 Mitsubishi UFJ Lease & Finance 756 0.06 53,800 Nihon M&A Center 1,086 0.09 1,391,800 Nomura 4,908 0.40 226,200 Orient 245 0.02 530,900 Orix 6,581 0.53
PORTFOLIO STATEMENT (CONTINUED)AS AT 31 AUGUST 2018
Bid-Market Total net Holding Investment value (£’000) assets (%)
Bid-Market Total net Holding Investment value (£’000) assets (%)
Financials – 14.03% (31/08/17 – 14.52%) – continued Financial Services – 2.20% – continued 91,000 SBI Holdings 1,929 0.16 97,100 Tokai Tokyo Securities 434 0.03 21,400 Zenkoku Hosho 667 0.05
Total Financials 173,427 14.03
Technology – 5.52% (31/08/17 – 5.37%) Software & Computer Services – 1.76% 38,700 Capcom 695 0.06 21,700 Colopl 109 0.01 39,100 CyberAgent 1,712 0.14 162,300 Gungho Online Entertainment 266 0.02 33,700 IT Holdings 1,251 0.10 41,500 Itochu Techno-Solutions 708 0.06 21,300 Line 755 0.06 168,500 Nexon 1,630 0.13 43,300 Nomura Research Institute 1,658 0.13 259,000 NTT Data 2,563 0.21 28,000 Obic 2,026 0.16 2,900 Obic Business Consultants 183 0.02 13,300 Oracle Japan 860 0.07 41,600 Otsuka 1,160 0.09 17,700 SCSK 648 0.05 11,800 Shinnittetsu Sumikin Solutions 294 0.02 32,000 Square Enix 1,126 0.09 21,000 Tecmo Koei Holdings 331 0.03 47,100 Trend Micro 2,284 0.19 537,500 Yahoo Japan 1,421 0.12
Technology Hardware & Equipment – 3.76% 74,200 Advantest 1,369 0.11 97,200 Brother Industries 1,538 0.12 424,100 Canon 10,479 0.85 17,800 Canon Marketing Japan 290 0.02 156,900 Fujifilm 5,113 0.41 800,000 Fujitsu 4,512 0.36 27,600 Hitachi High-Technologies 835 0.07 188,000 Konica Minolta 1,474 0.12 102,900 NEC 2,185 0.18 288,600 Renesas Electronics 1,680 0.14 282,000 Ricoh 2,278 0.18 36,500 Rohm 2,535 0.21 16,500 Screen 962 0.08 113,100 Seiko Epson 1,490 0.12 96,300 Sumco 1,325 0.11 64,500 Tokyo Electron 8,441 0.68
Total Technology 68,186 5.52
Futures – (0.01)% (31/08/17 – 0.01%) 95 OSE Topix Index Future September 2018 (107) (0.01)
Total Futures (107) (0.01)
Total value of investments* 1,224,401 99.04
Net other assets 11,820 0.96
Total net assets 1,236,221 100.00
*Including investment liabilities. All investments are listed on recognised stock exchanges and are “approved securities” within the meaning of the FCA rules unless otherwise stated.

Royal London Equity Funds ICVC 61
Royal London Japan Tracker Fund
SUMMARY OF MATERIAL PORTFOLIO CHANGESFOR THE YEAR ENDED 31 AUGUST 2018
Significant Purchases
Cost £’000
Toyota Motor 16,293
Mitsubishi UFJ Financial 8,442
Softbank 6,827
Honda Motor 5,784
Sony 5,472
Sumitomo Mitsui Financial 5,429
Japan Post 5,330
Keyence 5,087
KDDI 4,723
Mizuho Financial 4,618
Subtotal 68,005
Total cost of purchases, including the above, for the year 394,885
Significant Sales
Proceeds £’000
Toyota Motor 23,736
Mitsubishi UFJ Financial 11,634
Softbank 9,103
Sony 8,289
Honda Motor 8,242
Sumitomo Mitsui Financial 7,558
Keyence 7,120
KDDI 6,780
Mizuho Financial 6,337
Fanuc 5,994
Subtotal 94,793
Total proceeds from sales, including the above, for the year 523,523

Royal London Equity Funds ICVC62
Royal London Japan Tracker Fund
FINANCIAL STATEMENTS
Statement of Total Returnfor the year ended 31 August 2018
Note £’000
Year ended31 August 2018
£’000 £’000
Year ended31 August 2017
£’000
Income Net capital gains 2 89,103 154,707 Revenue 3 30,495 25,482
Expenses 4 (3,399) (2,844)Interest payable and similar charges (1) –
Net revenue before taxation 27,095 22,638 Taxation 5 (3,005) (2,504)
Net revenue after taxation 24,090 20,134
Total return before distributions 113,193 174,841 Distributions 6 (24,090) (20,134)
Change in net assets attributable to shareholders from investment activities 89,103 154,707
Statement of Change in Net Assets Attributable to Shareholdersfor the year ended 31 August 2018
£’000
Year ended31 August 2018
£’000 £’000
Year ended31 August 2017
£’000
Opening net assets attributable to shareholders 1,279,004 971,302
Amounts receivable on creation of shares 396,383 568,060 Amounts payable on cancellation of shares (552,347) (437,019)
(155,964) 131,041
Dilution levy charged 978 779 Change in net assets attributable to shareholders from investment activities 89,103 154,707 Retained distributions on accumulation shares 23,100 21,175
Closing net assets attributable to shareholders 1,236,221 1,279,004
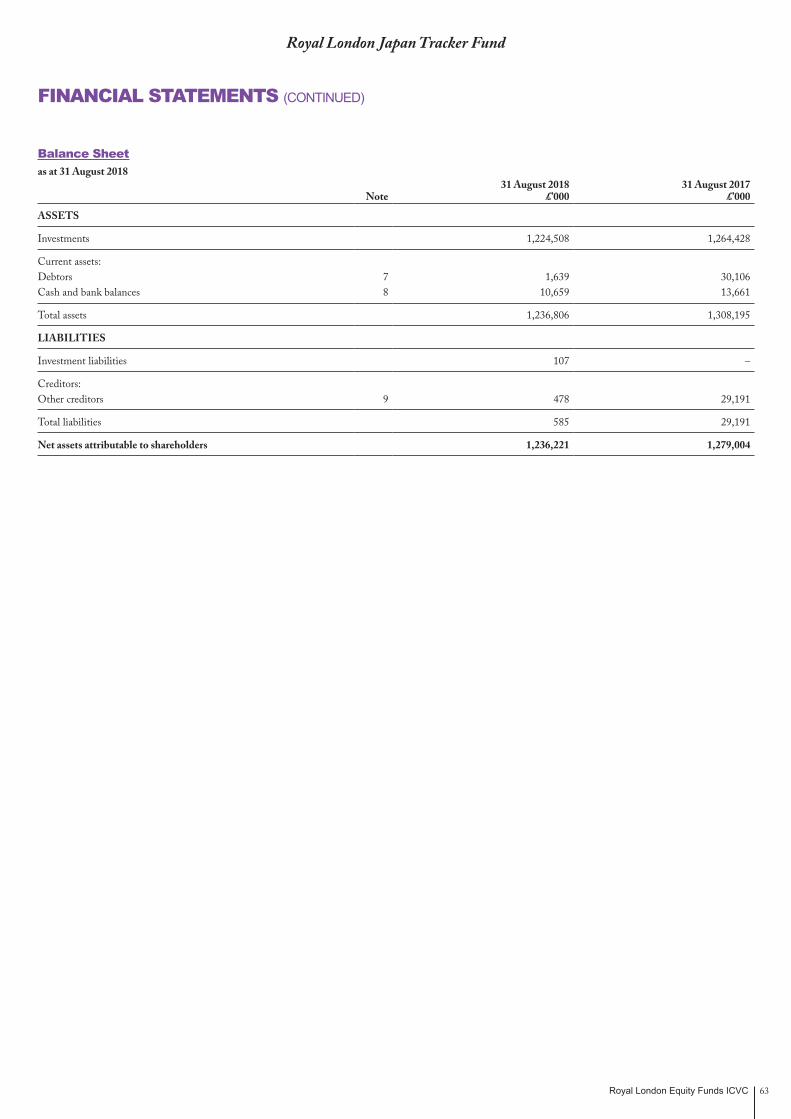
Royal London Equity Funds ICVC 63
Royal London Japan Tracker Fund
FINANCIAL STATEMENTS (CONTINUED)
Balance Sheetas at 31 August 2018
Note31 August 2018
£’00031 August 2017
£’000
ASSETS
Investments 1,224,508 1,264,428
Current assets:Debtors 7 1,639 30,106 Cash and bank balances 8 10,659 13,661
Total assets 1,236,806 1,308,195
LIABILITIES
Investment liabilities 107 –
Creditors:Other creditors 9 478 29,191
Total liabilities 585 29,191
Net assets attributable to shareholders 1,236,221 1,279,004

Royal London Equity Funds ICVC64
Royal London Japan Tracker Fund
NOTES TO THE FINANCIAL STATEMENTSFOR THE YEAR ENDED 31 AUGUST 2018
1. Accounting policiesThe accounting policies are set out in note 1 on page 8.
2. Net capital gains31 August 2018
£’00031 August 2017
£’000The net capital gains during the year comprise:
Non-derivative securities 88,855 151,223
Derivative securities 874 4,669
Currency losses (577) (1,084)
Activity fees (49) (101)
Net capital gains 89,103 154,707
3. Revenue31 August 2018
£’00031 August 2017
£’000Overseas dividends 30,051 25,170
Bank interest 2 –
Stock lending income 442 312
Total revenue 30,495 25,482
4. Expenses31 August 2018
£’00031 August 2017
£’000Payable to the Authorised Corporate Director or associates of the Authorised Corporate Director and agents of either of them:
Authorised Corporate Director’s fee 2,887 2,392
Payable to the Depositary, associates of the Depositary and agents of either of them:
Depositary's fee 85 89
Safe custody fees 196 164
281 253
Other expenses:
Registrar's fees 33 23
Audit fee 8 13
FTSE® licence fee 165 135
Service charges 21 22
Printing & stationery fee 3 3
Legal fee 1 3
231 199
Total expenses 3,399 2,844
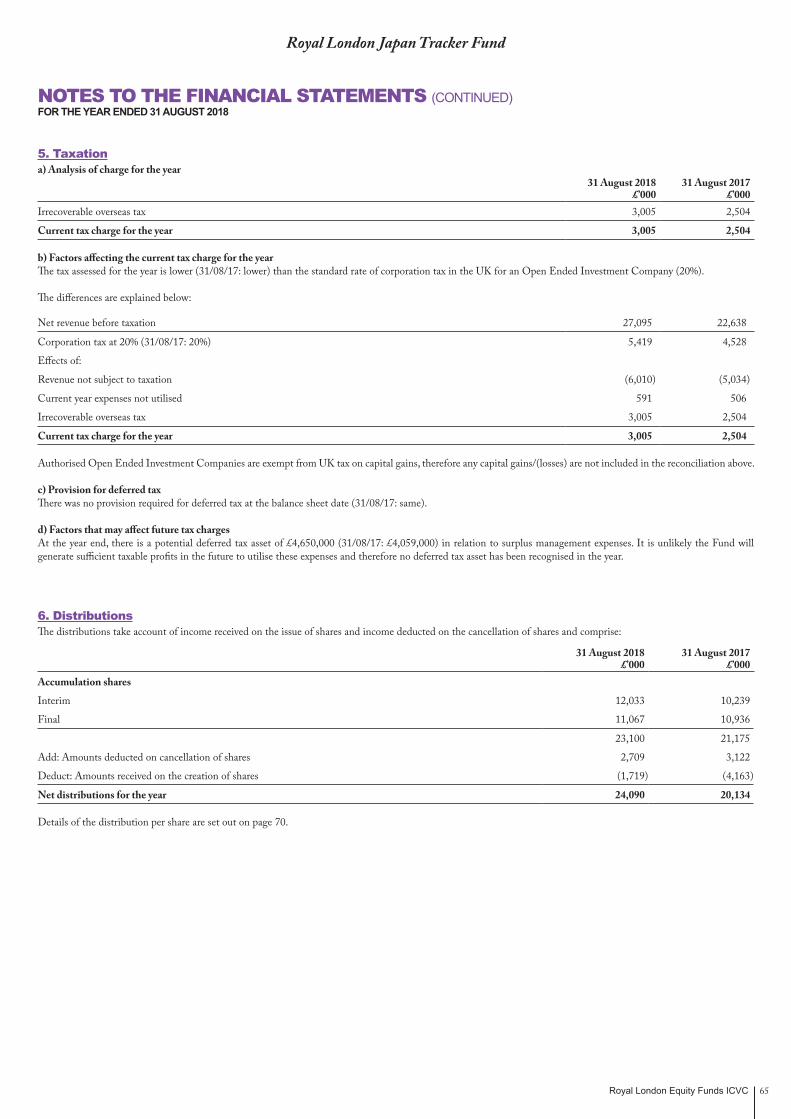
Royal London Equity Funds ICVC 65
5. Taxationa) Analysis of charge for the year
31 August 2018£’000
31 August 2017£’000
Irrecoverable overseas tax 3,005 2,504
Current tax charge for the year 3,005 2,504
b) Factors affecting the current tax charge for the yearThe tax assessed for the year is lower (31/08/17: lower) than the standard rate of corporation tax in the UK for an Open Ended Investment Company (20%).
The differences are explained below:
Net revenue before taxation 27,095 22,638
Corporation tax at 20% (31/08/17: 20%) 5,419 4,528
Effects of:
Revenue not subject to taxation (6,010) (5,034)
Current year expenses not utilised 591 506
Irrecoverable overseas tax 3,005 2,504
Current tax charge for the year 3,005 2,504
Authorised Open Ended Investment Companies are exempt from UK tax on capital gains, therefore any capital gains/(losses) are not included in the reconciliation above.
c) Provision for deferred taxThere was no provision required for deferred tax at the balance sheet date (31/08/17: same).
d) Factors that may affect future tax chargesAt the year end, there is a potential deferred tax asset of £4,650,000 (31/08/17: £4,059,000) in relation to surplus management expenses. It is unlikely the Fund will generate sufficient taxable profits in the future to utilise these expenses and therefore no deferred tax asset has been recognised in the year.
6. DistributionsThe distributions take account of income received on the issue of shares and income deducted on the cancellation of shares and comprise:
31 August 2018 £’000
31 August 2017 £’000
Accumulation shares
Interim 12,033 10,239
Final 11,067 10,936
23,100 21,175
Add: Amounts deducted on cancellation of shares 2,709 3,122
Deduct: Amounts received on the creation of shares (1,719) (4,163)
Net distributions for the year 24,090 20,134
Details of the distribution per share are set out on page 70.
Royal London Japan Tracker Fund
NOTES TO THE FINANCIAL STATEMENTS (CONTINUED)FOR THE YEAR ENDED 31 AUGUST 2018
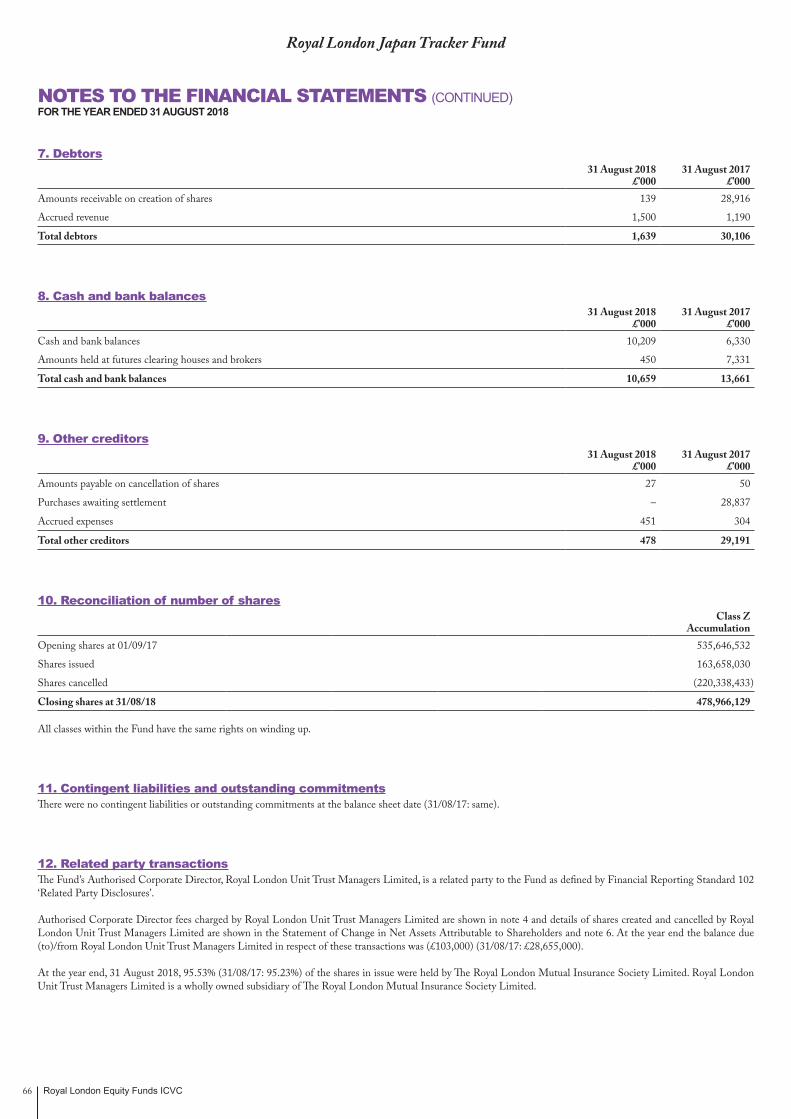
Royal London Equity Funds ICVC66
Royal London Japan Tracker Fund
NOTES TO THE FINANCIAL STATEMENTS (CONTINUED)FOR THE YEAR ENDED 31 AUGUST 2018
7. Debtors31 August 2018
£’00031 August 2017
£’000Amounts receivable on creation of shares 139 28,916
Accrued revenue 1,500 1,190
Total debtors 1,639 30,106
8. Cash and bank balances31 August 2018
£’00031 August 2017
£’000Cash and bank balances 10,209 6,330
Amounts held at futures clearing houses and brokers 450 7,331
Total cash and bank balances 10,659 13,661
9. Other creditors31 August 2018
£’00031 August 2017
£’000Amounts payable on cancellation of shares 27 50
Purchases awaiting settlement – 28,837
Accrued expenses 451 304
Total other creditors 478 29,191
10. Reconciliation of number of sharesClass Z
AccumulationOpening shares at 01/09/17 535,646,532
Shares issued 163,658,030
Shares cancelled (220,338,433)
Closing shares at 31/08/18 478,966,129
All classes within the Fund have the same rights on winding up.
11. Contingent liabilities and outstanding commitmentsThere were no contingent liabilities or outstanding commitments at the balance sheet date (31/08/17: same).
12. Related party transactionsThe Fund’s Authorised Corporate Director, Royal London Unit Trust Managers Limited, is a related party to the Fund as defined by Financial Reporting Standard 102 ‘Related Party Disclosures’.
Authorised Corporate Director fees charged by Royal London Unit Trust Managers Limited are shown in note 4 and details of shares created and cancelled by Royal London Unit Trust Managers Limited are shown in the Statement of Change in Net Assets Attributable to Shareholders and note 6. At the year end the balance due (to)/from Royal London Unit Trust Managers Limited in respect of these transactions was (£103,000) (31/08/17: £28,655,000).
At the year end, 31 August 2018, 95.53% (31/08/17: 95.23%) of the shares in issue were held by The Royal London Mutual Insurance Society Limited. Royal London Unit Trust Managers Limited is a wholly owned subsidiary of The Royal London Mutual Insurance Society Limited.

Royal London Equity Funds ICVC 67
13. Stock lending activitiesThe Fund carried out stock lending activities for the purpose of efficient portfolio management and in order to generate income. Revenue earned from these activities is shown in note 3 and is net of bank and agents fees amounting to £110,000 (Gross: £552,000) (31/08/17: £78,000 (Gross: £390,000)) payable to HSBC Bank plc.
The value of stock on loan at the balance sheet date was £157,247,000 (31/08/17: £152,599,000).
The collateral held by asset type at the year end is stated below:
Asset class
31 August 2018 Collateral Held
£’000
31 August 2017 Collateral Held
£’000Equities 128,724 130,883
Bonds 38,614 31,270
The aggregate value of collateral held at the balance sheet date was £167,338,000 (31/08/17: £162,153,000). Collateral may be in the form of cash, UK gilts, certificates of deposit, treasury bills, sovereign debt, eurosterling bonds and equities; where the ACD approves the asset it will be held to reduce counterparty exposure. The value of the collateral held is greater than the value of the securities on loan and is monitored as part of the efficient portfolio management process.
The counterparties at the year end were Bank of Nova Scotia, BNP Paribas Arbitrage, Citigroup Global Markets, Credit Suisse Dublin Branch, Credit Suisse Securities (Europe) Limited, Goldman Sachs, HSBC Bank, JP Morgan Securities, Macquarie Bank, Morgan Stanley & Co International, Natixis, Skandinaviska Enskilda Banken, Societe Generale and UBS.
14. Financial derivativesMotives and circumstances are used to determine whether returns on derivative contracts should be treated as capital or revenue. Where positions are undertaken to protect or enhance capital and the circumstances support this, the returns are included within net capital gains/losses in the Statement of Total Return. Where they are undertaken for generating or protecting revenue and the circumstances support this, the returns are treated as revenue and are included within the net revenue in the Statement of Total Return. The basis of apportionment is typically made by reference to the yield on the underlying security, index or other appropriate source.
The use of derivatives can create additional counterparty risks. Details of the policy adopted by the ACD for managing counterparty and other risks are set out in the Notes to the Financial Statements.
The types of derivatives held at the year end were index futures which are not classed as OTC derivatives and hence, no counterparty exposure has been disclosed.
Details of the individual contracts are shown on the portfolio statement on pages 56 to 60.
15. Risk disclosuresThe policies applied to the management of risk disclosures are set out on page 9.
The fair values of the Fund’s assets and liabilities are represented by the values shown in the balance sheet on page 63. There is no material difference between the value of the financial assets and liabilities, as shown in the balance sheet, and their fair value.
A significant proportion of the Fund’s assets are denominated in currencies other than sterling. The value of the Fund’s assets may be affected by currency movements.
Currency31 August 2018
£’00031 August 2017
£’000Sterling 140 375
Japanese yen 1,236,081 1,278,629
Total 1,236,221 1,279,004
If sterling to foreign currency exchange rates had increased by 10% as at the balance sheet date, the net asset value of the Fund would have decreased by £123,608,000 (31/08/17: £127,863,000). If sterling to foreign currency exchange rates had decreased by 10% as at the balance sheet date, the net asset value of the Fund would have increased by £123,608,000 (31/08/17: £127,863,000). These calculations assume all other variables remain constant.
If market prices had increased by 10% as at the balance sheet date, the net asset value of the Fund would have increased by £122,440,000 (31/08/17: £126,443,000). If market prices had decreased by 10% as at the balance sheet date, the net asset value of the Fund would have decreased by £122,440,000 (31/08/17: £126,443,000). These calculations assume all other variables remain constant.
The only interest bearing assets are cash balances of £10,209,000 (31/08/17: £6,330,000) which earn interest by reference to LIBOR or international equivalent.
Royal London Japan Tracker Fund
NOTES TO THE FINANCIAL STATEMENTS (CONTINUED)FOR THE YEAR ENDED 31 AUGUST 2018
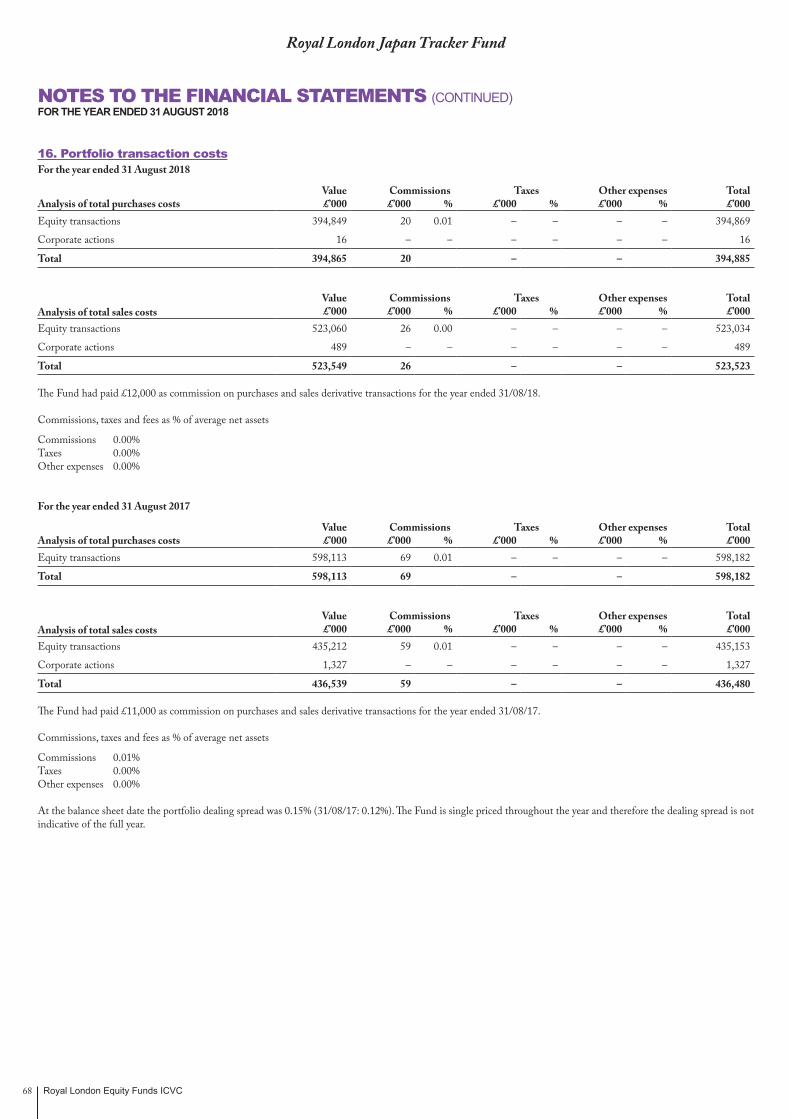
Royal London Equity Funds ICVC68
Royal London Japan Tracker Fund
NOTES TO THE FINANCIAL STATEMENTS (CONTINUED)FOR THE YEAR ENDED 31 AUGUST 2018
16. Portfolio transaction costsFor the year ended 31 August 2018
Value Commissions Taxes Other expenses TotalAnalysis of total purchases costs £’000 £’000 % £’000 % £’000 % £’000Equity transactions 394,849 20 0.01 – – – – 394,869
Corporate actions 16 – – – – – – 16
Total 394,865 20 – – 394,885
Value Commissions Taxes Other expenses TotalAnalysis of total sales costs £’000 £’000 % £’000 % £’000 % £’000Equity transactions 523,060 26 0.00 – – – – 523,034
Corporate actions 489 – – – – – – 489
Total 523,549 26 – – 523,523
The Fund had paid £12,000 as commission on purchases and sales derivative transactions for the year ended 31/08/18.
Commissions, taxes and fees as % of average net assets
Commissions 0.00%Taxes 0.00%Other expenses 0.00%
For the year ended 31 August 2017
Value Commissions Taxes Other expenses TotalAnalysis of total purchases costs £’000 £’000 % £’000 % £’000 % £’000Equity transactions 598,113 69 0.01 – – – – 598,182
Total 598,113 69 – – 598,182
Value Commissions Taxes Other expenses TotalAnalysis of total sales costs £’000 £’000 % £’000 % £’000 % £’000Equity transactions 435,212 59 0.01 – – – – 435,153
Corporate actions 1,327 – – – – – – 1,327
Total 436,539 59 – – 436,480
The Fund had paid £11,000 as commission on purchases and sales derivative transactions for the year ended 31/08/17.
Commissions, taxes and fees as % of average net assets
Commissions 0.01%Taxes 0.00%Other expenses 0.00%
At the balance sheet date the portfolio dealing spread was 0.15% (31/08/17: 0.12%). The Fund is single priced throughout the year and therefore the dealing spread is not indicative of the full year.

Royal London Equity Funds ICVC 69
Royal London Japan Tracker Fund
NOTES TO THE FINANCIAL STATEMENTS (CONTINUED)FOR THE YEAR ENDED 31 AUGUST 2018
17. Fair value of investmentsThe fair values of the Fund’s assets and liabilities are represented by the values shown in the balance sheet. There is no material difference between the value of the financial assets and liabilities, as shown in the balance sheet, and their fair value.
The fair value of investments has been determined using the following hierarchy:
Category 1 The unadjusted quoted price in an active market for identical assets or liabilities that the entity can access at the measurement date.
Category 2 Inputs other than quoted prices included within Level 1 that are observable (i.e. developed using market data) for the asset or liability, either directly or indirectly.
Category 3 Inputs are unobservable (i.e. for which market data is unavailable) for the asset or liability.
For the year ended 31 August 2018 Category 1 2 3 TotalInvestments £’000 £’000 £’000 £’000
Equities 1,224,508 – – 1,224,508
Total 1,224,508 – – 1,224,508
Investment liabilities £’000 £’000 £’000 £’000
Derivatives (107) – – (107)
Total (107) – – (107)
For the year ended 31 August 2017 Category 1 2 3 TotalInvestments £’000 £’000 £’000 £’000
Equities 1,264,292 – – 1,264,292
Derivatives 136 – – 136
Total 1,264,428 – – 1,264,428
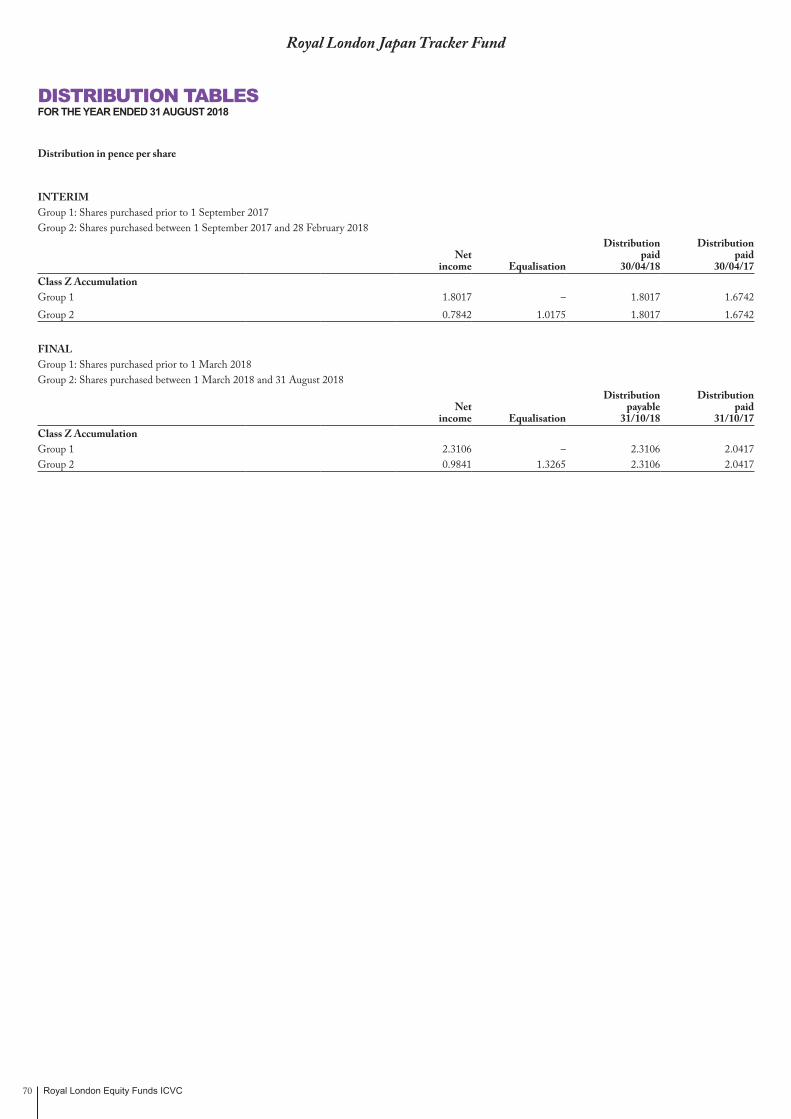
Royal London Equity Funds ICVC70
Royal London Japan Tracker Fund
DISTRIBUTION TABLESFOR THE YEAR ENDED 31 AUGUST 2018
Distribution in pence per share
INTERIMGroup 1: Shares purchased prior to 1 September 2017Group 2: Shares purchased between 1 September 2017 and 28 February 2018
Distribution DistributionNet paid paid
income Equalisation 30/04/18 30/04/17Class Z AccumulationGroup 1 1.8017 – 1.8017 1.6742Group 2 0.7842 1.0175 1.8017 1.6742
FINALGroup 1: Shares purchased prior to 1 March 2018Group 2: Shares purchased between 1 March 2018 and 31 August 2018
Distribution DistributionNet payable paid
income Equalisation 31/10/18 31/10/17Class Z AccumulationGroup 1 2.3106 – 2.3106 2.0417Group 2 0.9841 1.3265 2.3106 2.0417

Royal London Equity Funds ICVC 71
Royal London FTSE® 350 Tracker Fund
Fund Performance12 months to 31 August 2018
1 year total return
%
3 year total return
%
5 year total return
%Royal London FTSE® 350 Tracker Fund, Class Z Accumulation 5.62 35.84 43.26
Royal London FTSE® 350 Tracker Fund, Class Z Income 5.67 35.86 43.31
FTSE® 350 Index 4.66 33.54 43.45
Past performance is not necessarily a reliable indicator of future performance. The value of investments and the income from them is not guaranteed and may go down as well as up, and investors may not get back the amount originally invested.
Source: RLAM and Lipper, as at 31 August 2018. Returns are net of management fees. Investors should note that the total return is calculated on the Fund’s official midday price whereas the Fund has been valued as at close of business for the Net Asset Value quoted within the Comparative Table. Please also note, the total return shown in the table is being compared against the official end of day price of the benchmark. The tracking error shown in the performance overview below is calculated using the unofficial end of day fund price to align with the official end of day benchmark price.
Performance OverviewInvestors should note that the Fund price is taken at noon each day, whilst the index performance is recorded at the close of business. Significant intra-day market movements at the start or end of the day may therefore distort comparisons. This and the charges associated with the Fund account for the majority of the difference between the performance of the Fund and the FTSE® 350 Index.
The tracking error between the Royal London FTSE® 350 Tracker Fund and the FTSE® 350 Index was 0.10% during the period under review. This is within the anticipated tracking error range of 0.05% to 0.15%. We will always experience a small tracking difference between Fund and index for reasons including exchange rate risk on some dividends, trading costs and the use of index futures to manage cashflows.
Market and Portfolio CommentaryThe Fund aims to achieve the total return of the FTSE® 350 Index. However, perfect replication can result in unnecessary and costly trading which may outweigh the benefits. The Fund uses an optimiser to help construct a portfolio designed to track the performance of the benchmark without necessarily holding all the constituents in their exact benchmark weights. It generates efficient rebalancing and cashflow trades and allows flexibility not to trade every index or cashflow event. In practice, the Fund holds most of its benchmark’s names, as well as holding futures and cash.
Nils JungbackeFund Manager31 August 2018Royal London Asset Management
Please note that Nils Jungbacke started managing the Fund on 4 January 2018. The previous Fund Manager was Vicky Harriss.
The views expressed are the author’s own and do not constitute investment advice and are not an indication of future fund performance. Portfolio holdings are subject to change, for information only and are not investment recommendations.
Source: Royal London Asset Management, unless otherwise stated.
MANAGER’S INVESTMENT REPORT
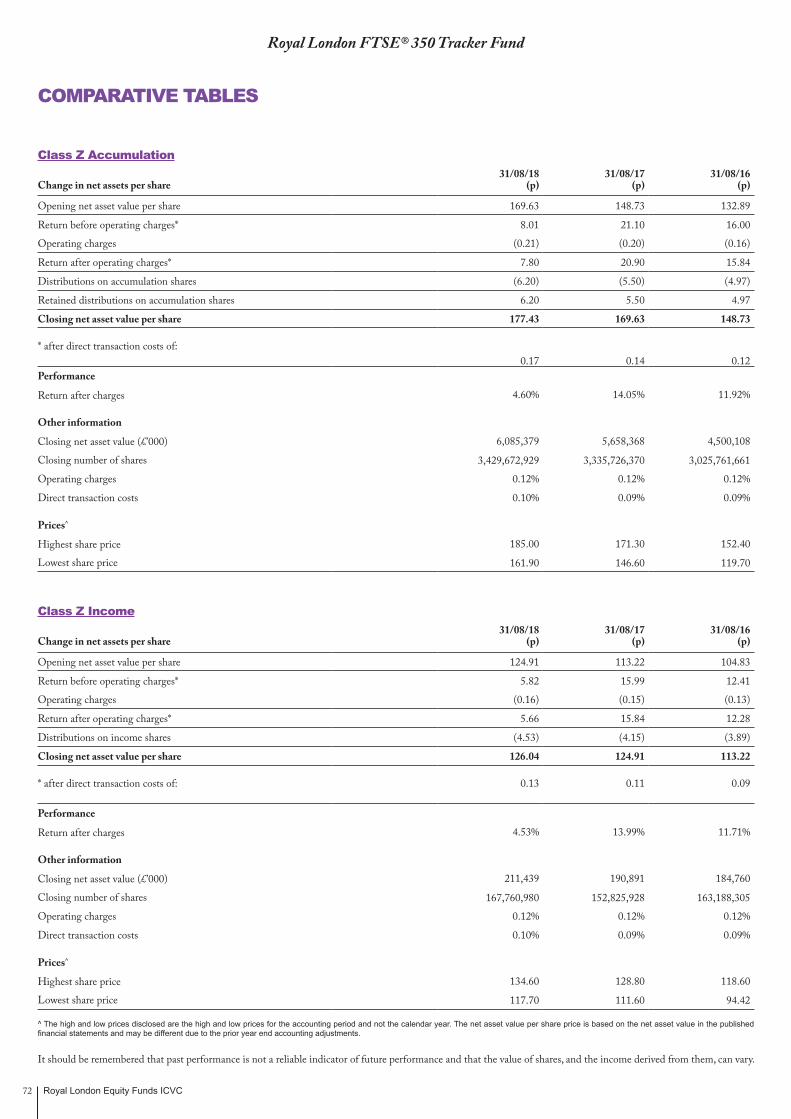
Royal London Equity Funds ICVC72
Royal London FTSE® 350 Tracker Fund
Class Z Accumulation31/08/18 31/08/17 31/08/16
Change in net assets per share (p) (p) (p)
Opening net asset value per share 169.63 148.73 132.89
Return before operating charges* 8.01 21.10 16.00
Operating charges (0.21) (0.20) (0.16)
Return after operating charges* 7.80 20.90 15.84
Distributions on accumulation shares (6.20) (5.50) (4.97)
Retained distributions on accumulation shares 6.20 5.50 4.97
Closing net asset value per share 177.43 169.63 148.73
* after direct transaction costs of:0.17 0.14 0.12
Performance
Return after charges 4.60% 14.05% 11.92%
Other information
Closing net asset value (£’000) 6,085,379 5,658,368 4,500,108
Closing number of shares 3,429,672,929 3,335,726,370 3,025,761,661
Operating charges 0.12% 0.12% 0.12%
Direct transaction costs 0.10% 0.09% 0.09%
Prices^
Highest share price 185.00 171.30 152.40
Lowest share price 161.90 146.60 119.70
Class Z Income31/08/18 31/08/17 31/08/16
Change in net assets per share (p) (p) (p)
Opening net asset value per share 124.91 113.22 104.83
Return before operating charges* 5.82 15.99 12.41
Operating charges (0.16) (0.15) (0.13)
Return after operating charges* 5.66 15.84 12.28
Distributions on income shares (4.53) (4.15) (3.89)
Closing net asset value per share 126.04 124.91 113.22
* after direct transaction costs of: 0.13 0.11 0.09
Performance
Return after charges 4.53% 13.99% 11.71%
Other information
Closing net asset value (£’000) 211,439 190,891 184,760
Closing number of shares 167,760,980 152,825,928 163,188,305
Operating charges 0.12% 0.12% 0.12%
Direct transaction costs 0.10% 0.09% 0.09%
Prices^
Highest share price 134.60 128.80 118.60
Lowest share price 117.70 111.60 94.42
^ The high and low prices disclosed are the high and low prices for the accounting period and not the calendar year. The net asset value per share price is based on the net asset value in the published financial statements and may be different due to the prior year end accounting adjustments.
It should be remembered that past performance is not a reliable indicator of future performance and that the value of shares, and the income derived from them, can vary.
COMPARATIVE TABLES
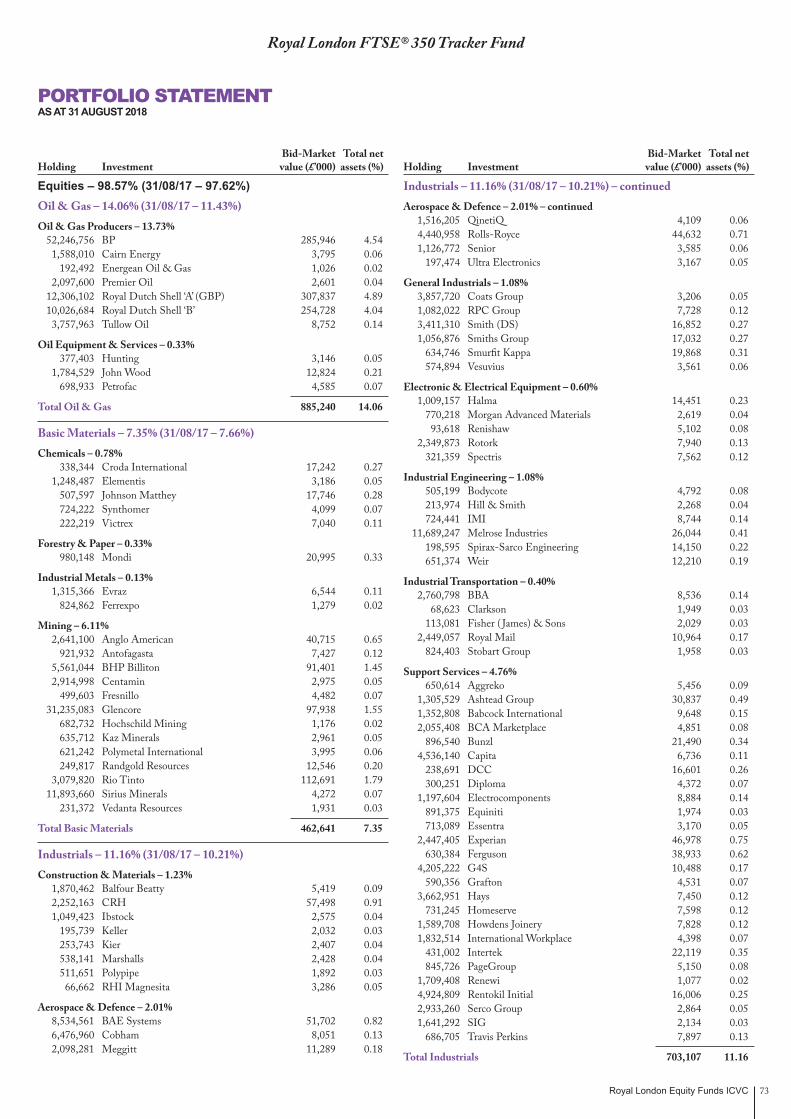
Royal London Equity Funds ICVC 73
Royal London FTSE® 350 Tracker Fund
Equities – 98.57% (31/08/17 – 97.62%) Oil & Gas – 14.06% (31/08/17 – 11.43%) Oil & Gas Producers – 13.73% 52,246,756 BP 285,946 4.54 1,588,010 Cairn Energy 3,795 0.06 192,492 Energean Oil & Gas 1,026 0.02 2,097,600 Premier Oil 2,601 0.04 12,306,102 Royal Dutch Shell ‘A’ (GBP) 307,837 4.89 10,026,684 Royal Dutch Shell ‘B’ 254,728 4.04 3,757,963 Tullow Oil 8,752 0.14
Oil Equipment & Services – 0.33% 377,403 Hunting 3,146 0.05 1,784,529 John Wood 12,824 0.21 698,933 Petrofac 4,585 0.07
Total Oil & Gas 885,240 14.06
Basic Materials – 7.35% (31/08/17 – 7.66%) Chemicals – 0.78% 338,344 Croda International 17,242 0.27 1,248,487 Elementis 3,186 0.05 507,597 Johnson Matthey 17,746 0.28 724,222 Synthomer 4,099 0.07 222,219 Victrex 7,040 0.11
Forestry & Paper – 0.33% 980,148 Mondi 20,995 0.33
Industrial Metals – 0.13% 1,315,366 Evraz 6,544 0.11 824,862 Ferrexpo 1,279 0.02
Mining – 6.11% 2,641,100 Anglo American 40,715 0.65 921,932 Antofagasta 7,427 0.12 5,561,044 BHP Billiton 91,401 1.45 2,914,998 Centamin 2,975 0.05 499,603 Fresnillo 4,482 0.07 31,235,083 Glencore 97,938 1.55 682,732 Hochschild Mining 1,176 0.02 635,712 Kaz Minerals 2,961 0.05 621,242 Polymetal International 3,995 0.06 249,817 Randgold Resources 12,546 0.20 3,079,820 Rio Tinto 112,691 1.79 11,893,660 Sirius Minerals 4,272 0.07 231,372 Vedanta Resources 1,931 0.03
Total Basic Materials 462,641 7.35
Industrials – 11.16% (31/08/17 – 10.21%) Construction & Materials – 1.23% 1,870,462 Balfour Beatty 5,419 0.09 2,252,163 CRH 57,498 0.91 1,049,423 Ibstock 2,575 0.04 195,739 Keller 2,032 0.03 253,743 Kier 2,407 0.04 538,141 Marshalls 2,428 0.04 511,651 Polypipe 1,892 0.03 66,662 RHI Magnesita 3,286 0.05
Aerospace & Defence – 2.01% 8,534,561 BAE Systems 51,702 0.82 6,476,960 Cobham 8,051 0.13 2,098,281 Meggitt 11,289 0.18
Industrials – 11.16% (31/08/17 – 10.21%) – continued Aerospace & Defence – 2.01% – continued 1,516,205 QinetiQ 4,109 0.06 4,440,958 Rolls-Royce 44,632 0.71 1,126,772 Senior 3,585 0.06 197,474 Ultra Electronics 3,167 0.05
General Industrials – 1.08% 3,857,720 Coats Group 3,206 0.05 1,082,022 RPC Group 7,728 0.12 3,411,310 Smith (DS) 16,852 0.27 1,056,876 Smiths Group 17,032 0.27 634,746 Smurfit Kappa 19,868 0.31 574,894 Vesuvius 3,561 0.06
Electronic & Electrical Equipment – 0.60% 1,009,157 Halma 14,451 0.23 770,218 Morgan Advanced Materials 2,619 0.04 93,618 Renishaw 5,102 0.08 2,349,873 Rotork 7,940 0.13 321,359 Spectris 7,562 0.12
Industrial Engineering – 1.08% 505,199 Bodycote 4,792 0.08 213,974 Hill & Smith 2,268 0.04 724,441 IMI 8,744 0.14 11,689,247 Melrose Industries 26,044 0.41 198,595 Spirax-Sarco Engineering 14,150 0.22 651,374 Weir 12,210 0.19
Industrial Transportation – 0.40% 2,760,798 BBA 8,536 0.14 68,623 Clarkson 1,949 0.03 113,081 Fisher ( James) & Sons 2,029 0.03 2,449,057 Royal Mail 10,964 0.17 824,403 Stobart Group 1,958 0.03
Support Services – 4.76% 650,614 Aggreko 5,456 0.09 1,305,529 Ashtead Group 30,837 0.49 1,352,808 Babcock International 9,648 0.15 2,055,408 BCA Marketplace 4,851 0.08 896,540 Bunzl 21,490 0.34 4,536,140 Capita 6,736 0.11 238,691 DCC 16,601 0.26 300,251 Diploma 4,372 0.07 1,197,604 Electrocomponents 8,884 0.14 891,375 Equiniti 1,974 0.03 713,089 Essentra 3,170 0.05 2,447,405 Experian 46,978 0.75 630,384 Ferguson 38,933 0.62 4,205,222 G4S 10,488 0.17 590,356 Grafton 4,531 0.07 3,662,951 Hays 7,450 0.12 731,245 Homeserve 7,598 0.12 1,589,708 Howdens Joinery 7,828 0.12 1,832,514 International Workplace 4,398 0.07 431,002 Intertek 22,119 0.35 845,726 PageGroup 5,150 0.08 1,709,408 Renewi 1,077 0.02 4,924,809 Rentokil Initial 16,006 0.25 2,933,260 Serco Group 2,864 0.05 1,641,292 SIG 2,134 0.03 686,705 Travis Perkins 7,897 0.13
Total Industrials 703,107 11.16
PORTFOLIO STATEMENTAS AT 31 AUGUST 2018
Bid-Market Total net Holding Investment value (£’000) assets (%)
Bid-Market Total net Holding Investment value (£’000) assets (%)

Royal London Equity Funds ICVC74
Royal London FTSE® 350 Tracker Fund
Bid-Market Total net Holding Investment value (£’000) assets (%)
Bid-Market Total net Holding Investment value (£’000) assets (%)
Consumer Goods – 14.30% (31/08/17 – 16.21%) Automobiles & Parts – 0.02% 452,762 TI Fluid Systems 1,302 0.02
Beverages – 3.10% 227,359 Barr (AG) 1,592 0.03 717,960 Britvic 5,851 0.09 528,876 Coca-Cola HBC 13,946 0.22 6,460,803 Diageo 174,086 2.76
Food Producers – 0.66% 929,652 Associated British Foods 21,252 0.34 402,674 Bakkavör 755 0.01 138,380 Cranswick 4,467 0.07 363,091 Dairy Crest 1,725 0.03 1,924,605 Greencore Group 3,349 0.05 175,368 Hilton Food 1,592 0.03 1,257,543 Tate & Lyle 8,431 0.13
Household Goods – 3.17% 2,700,063 Barratt Developments 14,634 0.23 332,359 Bellway 9,698 0.15 332,477 Berkeley 12,112 0.19 362,203 Bovis Homes 4,075 0.07 1,186,377 Countryside Properties 3,989 0.06 678,244 Crest Nicholson 2,591 0.04 293,671 Galliford Try 2,849 0.05 1,474,196 McCarthy & Stone 1,642 0.03 829,204 Persimmon 20,158 0.32 1,674,658 Reckitt Benckiser 109,824 1.74 642,040 Redrow 3,515 0.06 8,690,301 Taylor Wimpey 14,535 0.23
Leisure Goods – 0.05% 80,734 Games Workshop 2,870 0.05
Personal Goods – 2.58% 1,110,047 Burberry 24,821 0.39 487,392 PZ Cussons 1,170 0.02 77,046 Ted Baker 1,701 0.03 3,067,867 Unilever 134,725 2.14
Tobacco – 4.72% 6,106,367 British American Tobacco 227,248 3.61 2,539,957 Imperial Brands 69,696 1.11
Total Consumer Goods 900,201 14.30
Healthcare – 9.45% (31/08/17 – 8.41%) Healthcare Equipment & Services – 0.89% 3,947,060 ConvaTec 8,419 0.13 1,062,589 Mediclinic International 5,240 0.08 231,526 NMC Health 9,085 0.15 2,340,443 Smith & Nephew 31,760 0.51 757,705 Spire Healthcare 1,306 0.02
Pharmaceuticals & Biotechnology – 8.56% 3,390,552 AstraZeneca 196,482 3.12 1,051,128 BTG 5,713 0.09 270,298 Dechra Pharmaceuticals 8,428 0.13 166,438 Genus 4,740 0.08 13,036,316 GlaxoSmithKline 203,419 3.23 378,469 Hikma Pharmaceuticals 7,463 0.12 1,963,200 Indivior 5,308 0.08 2,397,861 Shire 107,856 1.71
Total Healthcare 595,219 9.45
Consumer Services – 11.65% (31/08/17 – 10.44%) Food & Drug Retailers – 1.85% 275,504 Greggs 2,926 0.05 5,812,958 Morrison (Wm) Supermarkets 15,303 0.24 1,469,926 Ocado 15,758 0.25 4,323,507 Sainsbury ( J) 14,017 0.22 25,848,080 Tesco 63,690 1.01 677,739 UDG Healthcare 4,985 0.08
General Retailers – 1.67% 2,300,993 B&M European Value Retail 9,489 0.15 802,037 Card Factory 1,526 0.02 2,710,162 Dixons Carphone 4,480 0.07 269,733 Dunelm 1,403 0.02 543,973 Halfords 1,786 0.03 1,117,729 Inchcape 7,735 0.12 985,669 JD Sports Fashion 5,003 0.08 1,538,056 Just Eat 11,788 0.19 5,740,249 Kingfisher 15,682 0.25 4,342,509 Marks & Spencer 13,093 0.21 362,004 Next 19,888 0.32 3,028,022 Saga 3,833 0.06 481,113 Sports Direct International 1,836 0.03 136,125 Superdry 1,620 0.03 287,028 WH Smith 5,919 0.09
Media – 3.58% 1,058,605 Ascential 4,558 0.07 901,905 Entertainment One 3,297 0.05 146,828 Euromoney Institutional Investor 1,891 0.03 3,332,917 Informa 25,410 0.40 9,967,593 ITV 16,008 0.26 1,922,809 Merlin Entertainments 7,151 0.11 1,399,147 Moneysupermarket.com 3,971 0.06 2,084,029 Pearson 19,119 0.30 2,785,107 RELX 47,584 0.76 2,403,200 Rightmove 11,824 0.19 2,764,125 Sky 42,581 0.68 3,279,268 WPP 41,925 0.67
Travel & Leisure – 4.55% 712,514 888 Holdings 1,657 0.03 464,237 Carnival 21,494 0.34 2,737,262 Cineworld 8,486 0.13 4,230,148 Compass Group 70,136 1.11 1,294,344 Domino’s Pizza 3,760 0.06 660,863 easyJet 10,078 0.16 3,264,207 Firstgroup 2,894 0.05 117,241 Go-Ahead 1,968 0.03 827,428 Greene King 4,026 0.06 1,467,866 GVC 16,117 0.26 509,531 Intercontinental Hotels 24,228 0.38 4,381,136 International Consolidated Airlines (IAG) 30,265 0.48 328,666 Millennium & Copthorne Hotels 1,735 0.03 607,765 Mitchells & Butlers 1,549 0.02 1,129,267 National Express 4,467 0.07 229,656 On The Beach 1,203 0.02 222,190 Paddy Power 15,587 0.25 469,385 Rank Group 810 0.01 1,242,921 SSP 8,630 0.14 1,170,729 Stagecoach 1,902 0.03 3,700,286 Thomas Cook 3,092 0.05 1,163,874 TUI 16,539 0.26 190,112 Wetherspoon ( JD) 2,365 0.04
PORTFOLIO STATEMENT (CONTINUED)AS AT 31 AUGUST 2018
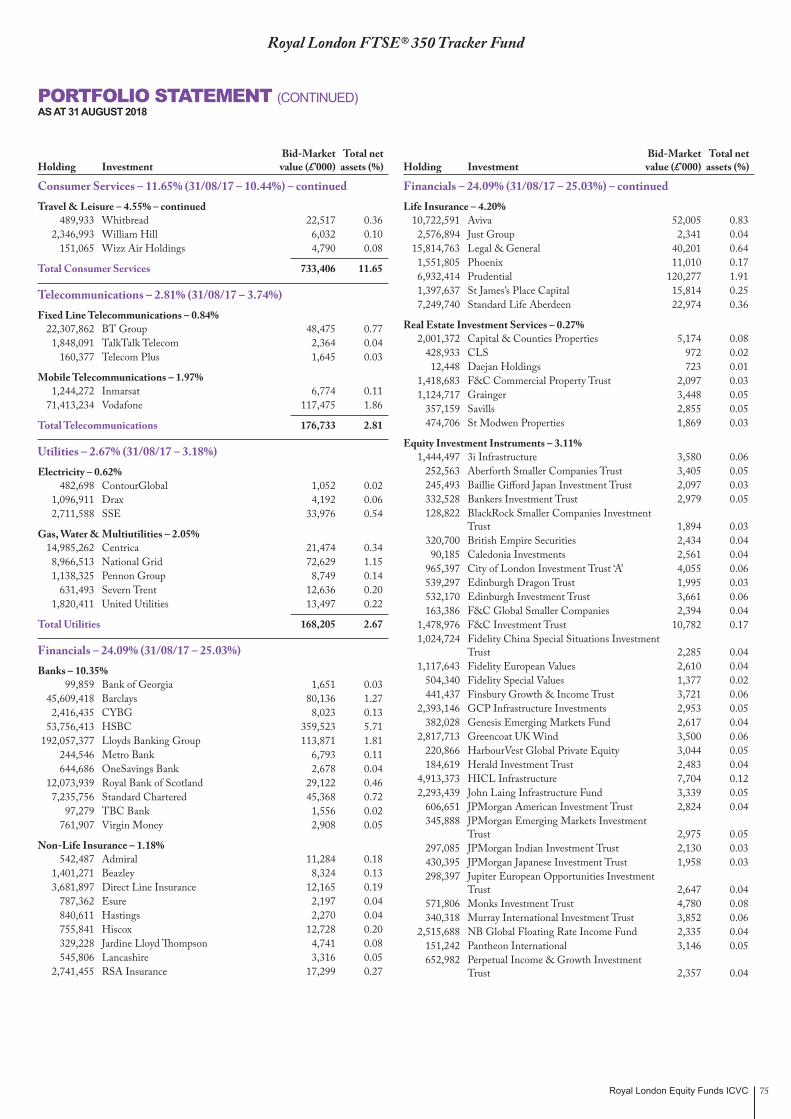
Royal London Equity Funds ICVC 75
Bid-Market Total net Holding Investment value (£’000) assets (%)
Bid-Market Total net Holding Investment value (£’000) assets (%)
Royal London FTSE® 350 Tracker Fund
Consumer Services – 11.65% (31/08/17 – 10.44%) – continued Travel & Leisure – 4.55% – continued 489,933 Whitbread 22,517 0.36 2,346,993 William Hill 6,032 0.10 151,065 Wizz Air Holdings 4,790 0.08
Total Consumer Services 733,406 11.65
Telecommunications – 2.81% (31/08/17 – 3.74%) Fixed Line Telecommunications – 0.84% 22,307,862 BT Group 48,475 0.77 1,848,091 TalkTalk Telecom 2,364 0.04 160,377 Telecom Plus 1,645 0.03
Mobile Telecommunications – 1.97% 1,244,272 Inmarsat 6,774 0.11 71,413,234 Vodafone 117,475 1.86
Total Telecommunications 176,733 2.81
Utilities – 2.67% (31/08/17 – 3.18%) Electricity – 0.62% 482,698 ContourGlobal 1,052 0.02 1,096,911 Drax 4,192 0.06 2,711,588 SSE 33,976 0.54
Gas, Water & Multiutilities – 2.05% 14,985,262 Centrica 21,474 0.34 8,966,513 National Grid 72,629 1.15 1,138,325 Pennon Group 8,749 0.14 631,493 Severn Trent 12,636 0.20 1,820,411 United Utilities 13,497 0.22
Total Utilities 168,205 2.67
Financials – 24.09% (31/08/17 – 25.03%) Banks – 10.35% 99,859 Bank of Georgia 1,651 0.03 45,609,418 Barclays 80,136 1.27 2,416,435 CYBG 8,023 0.13 53,756,413 HSBC 359,523 5.71 192,057,377 Lloyds Banking Group 113,871 1.81 244,546 Metro Bank 6,793 0.11 644,686 OneSavings Bank 2,678 0.04 12,073,939 Royal Bank of Scotland 29,122 0.46 7,235,756 Standard Chartered 45,368 0.72 97,279 TBC Bank 1,556 0.02 761,907 Virgin Money 2,908 0.05
Non-Life Insurance – 1.18% 542,487 Admiral 11,284 0.18 1,401,271 Beazley 8,324 0.13 3,681,897 Direct Line Insurance 12,165 0.19 787,362 Esure 2,197 0.04 840,611 Hastings 2,270 0.04 755,841 Hiscox 12,728 0.20 329,228 Jardine Lloyd Thompson 4,741 0.08 545,806 Lancashire 3,316 0.05 2,741,455 RSA Insurance 17,299 0.27
PORTFOLIO STATEMENT (CONTINUED)AS AT 31 AUGUST 2018
Financials – 24.09% (31/08/17 – 25.03%) – continued Life Insurance – 4.20% 10,722,591 Aviva 52,005 0.83 2,576,894 Just Group 2,341 0.04 15,814,763 Legal & General 40,201 0.64 1,551,805 Phoenix 11,010 0.17 6,932,414 Prudential 120,277 1.91 1,397,637 St James’s Place Capital 15,814 0.25 7,249,740 Standard Life Aberdeen 22,974 0.36
Real Estate Investment Services – 0.27% 2,001,372 Capital & Counties Properties 5,174 0.08 428,933 CLS 972 0.02 12,448 Daejan Holdings 723 0.01 1,418,683 F&C Commercial Property Trust 2,097 0.03 1,124,717 Grainger 3,448 0.05 357,159 Savills 2,855 0.05 474,706 St Modwen Properties 1,869 0.03
Equity Investment Instruments – 3.11% 1,444,497 3i Infrastructure 3,580 0.06 252,563 Aberforth Smaller Companies Trust 3,405 0.05 245,493 Baillie Gifford Japan Investment Trust 2,097 0.03 332,528 Bankers Investment Trust 2,979 0.05 128,822 BlackRock Smaller Companies Investment
Trust 1,894 0.03 320,700 British Empire Securities 2,434 0.04 90,185 Caledonia Investments 2,561 0.04 965,397 City of London Investment Trust ‘A’ 4,055 0.06 539,297 Edinburgh Dragon Trust 1,995 0.03 532,170 Edinburgh Investment Trust 3,661 0.06 163,386 F&C Global Smaller Companies 2,394 0.04 1,478,976 F&C Investment Trust 10,782 0.17 1,024,724 Fidelity China Special Situations Investment
Trust 2,285 0.04 1,117,643 Fidelity European Values 2,610 0.04 504,340 Fidelity Special Values 1,377 0.02 441,437 Finsbury Growth & Income Trust 3,721 0.06 2,393,146 GCP Infrastructure Investments 2,953 0.05 382,028 Genesis Emerging Markets Fund 2,617 0.04 2,817,713 Greencoat UK Wind 3,500 0.06 220,866 HarbourVest Global Private Equity 3,044 0.05 184,619 Herald Investment Trust 2,483 0.04 4,913,373 HICL Infrastructure 7,704 0.12 2,293,439 John Laing Infrastructure Fund 3,339 0.05 606,651 JPMorgan American Investment Trust 2,824 0.04 345,888 JPMorgan Emerging Markets Investment
Trust 2,975 0.05 297,085 JPMorgan Indian Investment Trust 2,130 0.03 430,395 JPMorgan Japanese Investment Trust 1,958 0.03 298,397 Jupiter European Opportunities Investment
Trust 2,647 0.04 571,806 Monks Investment Trust 4,780 0.08 340,318 Murray International Investment Trust 3,852 0.06 2,515,688 NB Global Floating Rate Income Fund 2,335 0.04 151,242 Pantheon International 3,146 0.05 652,982 Perpetual Income & Growth Investment
Trust 2,357 0.04

Royal London Equity Funds ICVC76
Bid-Market Total net Holding Investment value (£’000) assets (%)
Bid-Market Total net Holding Investment value (£’000) assets (%)
Royal London FTSE® 350 Tracker Fund
PORTFOLIO STATEMENT (CONTINUED)AS AT 31 AUGUST 2018
Financials – 24.09% (31/08/17 – 25.03%) – continued Equity Investment Instruments – 3.11% – continued 587,150 Pershing Square Holdings 6,975 0.11 5,589 Personal Assets Investment Trust 2,233 0.03 358,368 Polar Capital Technology Trust 4,931 0.08 2,701,549 Renewables Infrastructure 2,977 0.05 339,290 RIT Capital Partners 7,040 0.11 153,819 Riverstone Energy 1,950 0.03 463,771 Schroder Asia Pacific Fund 2,054 0.03 214,613 Scottish Investment Trust 1,867 0.03 3,717,698 Scottish Mortgage Investment Trust 20,782 0.33 2,105,572 Sequoia Economic Infrastructure Income
Fund 2,306 0.04 179,502 Temple Bar Investment Trust 2,283 0.04 715,235 Templeton Emerging Markets Investment
Trust 5,042 0.08 928,953 The Alliance Trust 7,209 0.11 2,193,435 The Mercantile Investment Trust 4,744 0.07 859,318 TR Property Investment 3,631 0.06 544,694 Vietnam Enterprise Investments 2,457 0.04 550,746 VinaCapital Vietnam Opportunity Fund 1,867 0.03 488,379 Witan Investment Trust 5,470 0.09 131,586 Worldwide Healthcare Trust 3,777 0.06
Real Estate Investment Trusts – 1.93% 6,316,391 Assura 3,461 0.05 394,280 Big Yellow 3,714 0.06 2,619,713 British Land 16,646 0.26 273,809 Derwent London 8,327 0.13 755,657 Great Portland Estates 5,450 0.09 2,151,886 Hammerson 10,135 0.16 2,400,898 Intu Properties 3,790 0.06 1,902,129 Land Securities 17,433 0.28 1,752,684 LondonMetric Property 3,232 0.05 825,021 NewRiver Retail 2,190 0.03 1,957,066 Primary Health Properties 2,215 0.03 3,446,197 Redefine International 1,165 0.02 553,087 Safestore 2,937 0.05 2,702,077 SEGRO 17,785 0.28 619,651 Shaftesbury 5,719 0.09 3,992,139 Tritax Big Box 6,024 0.10 1,809,339 UK Commercial Property Trust 1,619 0.03 695,575 Unite Group 6,166 0.10 332,544 Workspace 3,538 0.06
Financial Services – 3.05% 2,547,012 3i Group 22,801 0.36 1,629,201 AA 1,816 0.03 1,038,553 Ashmore 3,691 0.06 748,194 Brewin Dolphin 2,713 0.04
Financials – 24.09% (31/08/17 – 25.03%) – continued Financial Services – 3.05% – continued 382,677 Charter Court Financial Services 1,371 0.02 411,013 Close Brothers 6,560 0.10 703,380 Hargreaves Lansdown 15,460 0.25 979,348 IG Group 8,853 0.14 510,505 IntegraFin 1,833 0.03 758,416 Intermediate Capital 7,956 0.13 3,678,860 International Public Partnership 5,739 0.09 1,740,569 Investec 8,811 0.14 2,740,941 IP 3,558 0.06 1,349,072 John Laing 4,241 0.07 1,122,587 Jupiter Fund Management 4,704 0.07 834,591 London Stock Exchange 38,591 0.61 4,278,386 Man Group 7,350 0.12 853,504 NEX 8,979 0.14 704,076 Paragon Banking 3,273 0.05 687,312 Provident Financial 4,694 0.07 4,727,630 Quilter 6,658 0.11 140,251 Rathbone Brothers 3,694 0.06 359,954 Sanne 2,214 0.04 299,491 Schroders 9,209 0.15 1,038,552 Syncona 2,757 0.04 1,518,069 TP ICAP 4,325 0.07
Total Financials 1,517,179 24.09
Technology – 1.03% (31/08/17 – 1.31%) Software & Computer Services – 1.03% 252,272 Alfa Financial Software 421 0.01 2,511,572 Auto Trader 11,272 0.18 173,468 Aveva Group 4,923 0.08 190,607 Computacenter 2,581 0.04 237,320 FDM 2,238 0.03 1,146,278 Micro Focus International 14,959 0.24 789,888 Playtech 4,201 0.07 2,897,774 Sage 17,253 0.27 285,385 Softcat 2,423 0.04 892,371 Sophos 4,680 0.07
Total Technology 64,951 1.03
Futures – (0.04)% (31/08/17 – 0.01%) 1,212 LIFFE FTSE® 100 Index Future
September 2018 (2,368) (0.04)
Total Futures (2,368) (0.04)
Total value of investments* 6,204,514 98.53
Net other assets 92,304 1.47
Total net assets 6,296,818 100.00
* Including investment liabilities.All investments are listed on recognised stock exchanges and are “approved securities” within the meaning of the FCA rules unless otherwise stated.

Royal London Equity Funds ICVC 77
Royal London FTSE® 350 Tracker Fund
SUMMARY OF MATERIAL PORTFOLIO CHANGESFOR THE YEAR ENDED 31 AUGUST 2018
Significant Purchases
Cost £’000
HSBC 71,168
Royal Dutch Shell ‘A’ (EUR) 58,091
British American Tobacco 50,806
BP 48,844
Royal Dutch Shell ‘B’ 42,427
GlaxoSmithKline 33,256
Diageo 30,684
AstraZeneca 30,360
Vodafone 27,353
Lloyds Banking Group 23,727
Subtotal 416,716
Total cost of purchases, including the above, for the year 1,281,320
Significant Sales
Proceeds £’000
HSBC 40,842
Royal Dutch Shell ‘A’ (EUR) 35,953
British American Tobacco 29,794
BP 28,385
Royal Dutch Shell ‘B’ 26,832
Diageo 22,450
Worldpay 21,622
Quilter 20,316
GlaxoSmithKline 18,525
AstraZeneca 18,236
Subtotal 262,955
Total proceeds from sales, including the above, for the year 857,859
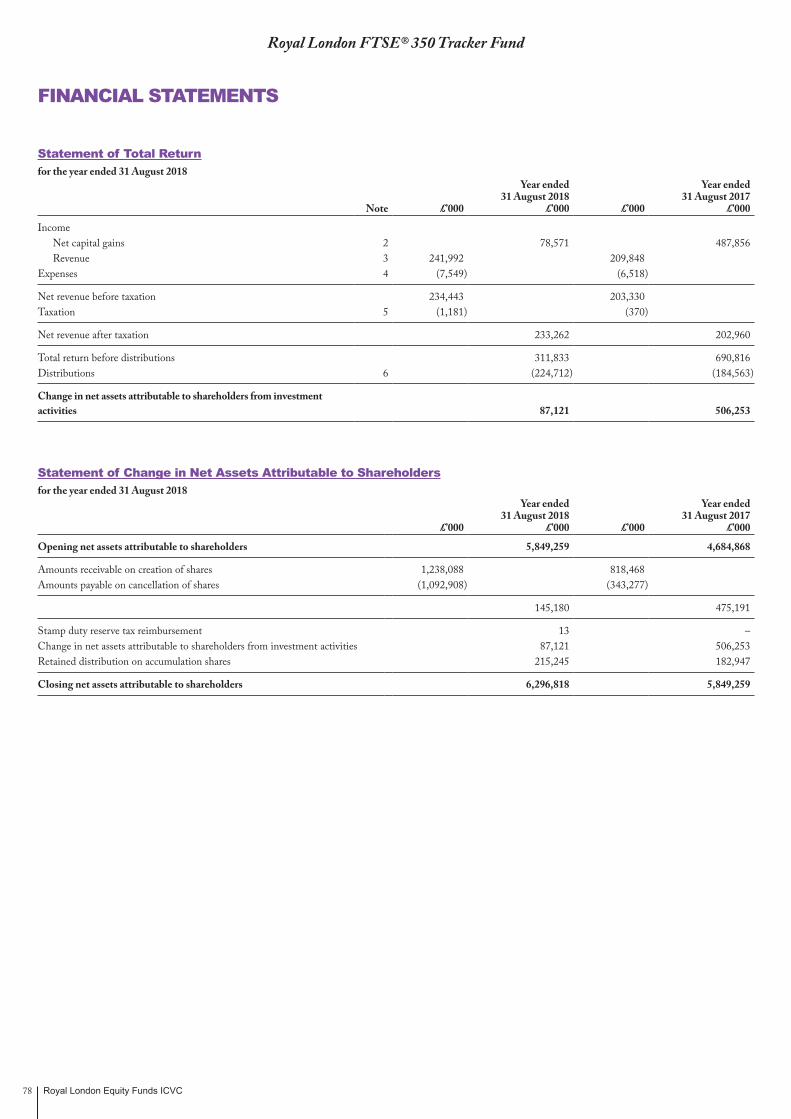
Royal London Equity Funds ICVC78
Royal London FTSE® 350 Tracker Fund
FINANCIAL STATEMENTS
Statement of Total Returnfor the year ended 31 August 2018
Note £’000
Year ended31 August 2018
£’000 £’000
Year ended31 August 2017
£’000
Income Net capital gains 2 78,571 487,856 Revenue 3 241,992 209,848
Expenses 4 (7,549) (6,518)
Net revenue before taxation 234,443 203,330 Taxation 5 (1,181) (370)
Net revenue after taxation 233,262 202,960
Total return before distributions 311,833 690,816 Distributions 6 (224,712) (184,563)
Change in net assets attributable to shareholders from investment activities 87,121 506,253
Statement of Change in Net Assets Attributable to Shareholdersfor the year ended 31 August 2018
£’000
Year ended31 August 2018
£’000 £’000
Year ended31 August 2017
£’000
Opening net assets attributable to shareholders 5,849,259 4,684,868
Amounts receivable on creation of shares 1,238,088 818,468 Amounts payable on cancellation of shares (1,092,908) (343,277)
145,180 475,191
Stamp duty reserve tax reimbursement 13 – Change in net assets attributable to shareholders from investment activities 87,121 506,253 Retained distribution on accumulation shares 215,245 182,947
Closing net assets attributable to shareholders 6,296,818 5,849,259

Royal London Equity Funds ICVC 79
Royal London FTSE® 350 Tracker Fund
FINANCIAL STATEMENTS (CONTINUED)
Balance Sheetas at 31 August 2018
Note31 August 2018
£’00031 August 2018
£’000
ASSETS
Investments 6,206,882 5,710,829
Current assets:Debtors 7 49,335 43,302 Cash and bank balances 8 48,835 100,202
Total assets 6,305,052 5,854,333
LIABILITIES
Investment liabilities 2,368 –
Creditors:Distribution payable 5,021 4,033 Other creditors 9 845 1,041
Total liabilities 8,234 5,074
Net assets attributable to shareholders 6,296,818 5,849,259
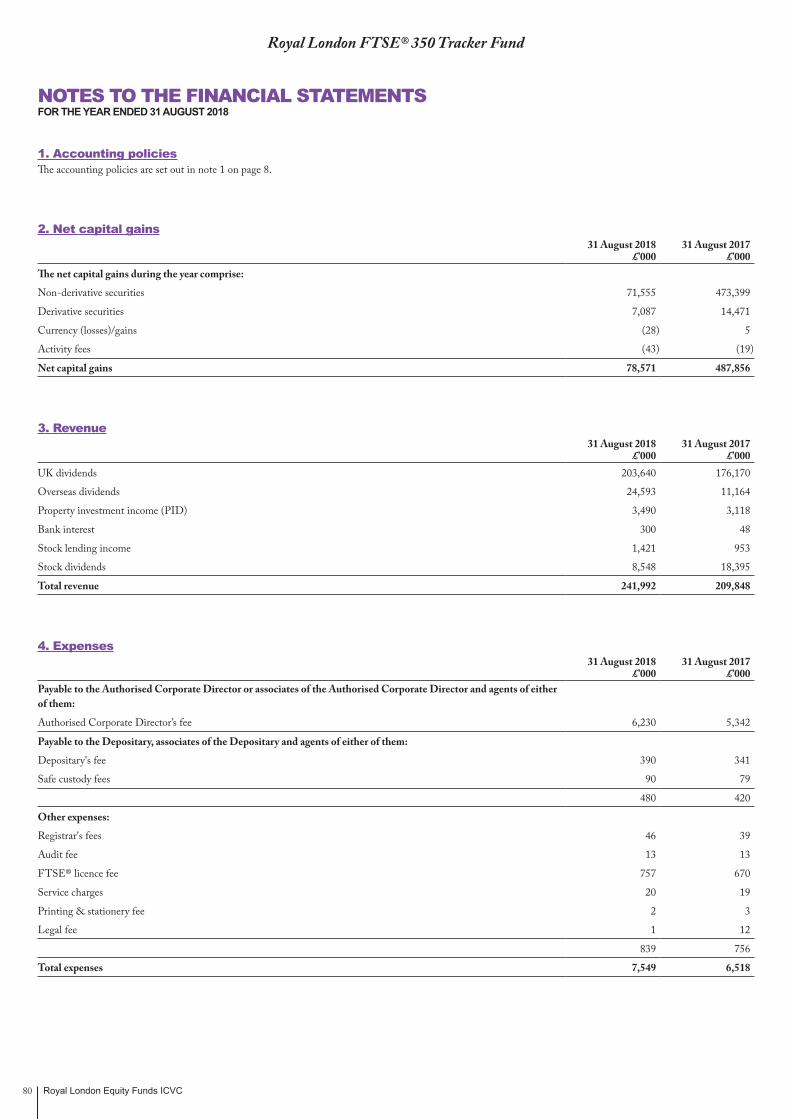
Royal London Equity Funds ICVC80
Royal London FTSE® 350 Tracker Fund
NOTES TO THE FINANCIAL STATEMENTS FOR THE YEAR ENDED 31 AUGUST 2018
1. Accounting policiesThe accounting policies are set out in note 1 on page 8.
2. Net capital gains31 August 2018
£’00031 August 2017
£’000The net capital gains during the year comprise:
Non-derivative securities 71,555 473,399
Derivative securities 7,087 14,471
Currency (losses)/gains (28) 5
Activity fees (43) (19)
Net capital gains 78,571 487,856
3. Revenue31 August 2018
£’00031 August 2017
£’000UK dividends 203,640 176,170
Overseas dividends 24,593 11,164
Property investment income (PID) 3,490 3,118
Bank interest 300 48
Stock lending income 1,421 953
Stock dividends 8,548 18,395
Total revenue 241,992 209,848
4. Expenses31 August 2018
£’00031 August 2017
£’000Payable to the Authorised Corporate Director or associates of the Authorised Corporate Director and agents of either of them:
Authorised Corporate Director’s fee 6,230 5,342
Payable to the Depositary, associates of the Depositary and agents of either of them:
Depositary's fee 390 341
Safe custody fees 90 79
480 420
Other expenses:
Registrar's fees 46 39
Audit fee 13 13
FTSE® licence fee 757 670
Service charges 20 19
Printing & stationery fee 2 3
Legal fee 1 12
839 756
Total expenses 7,549 6,518
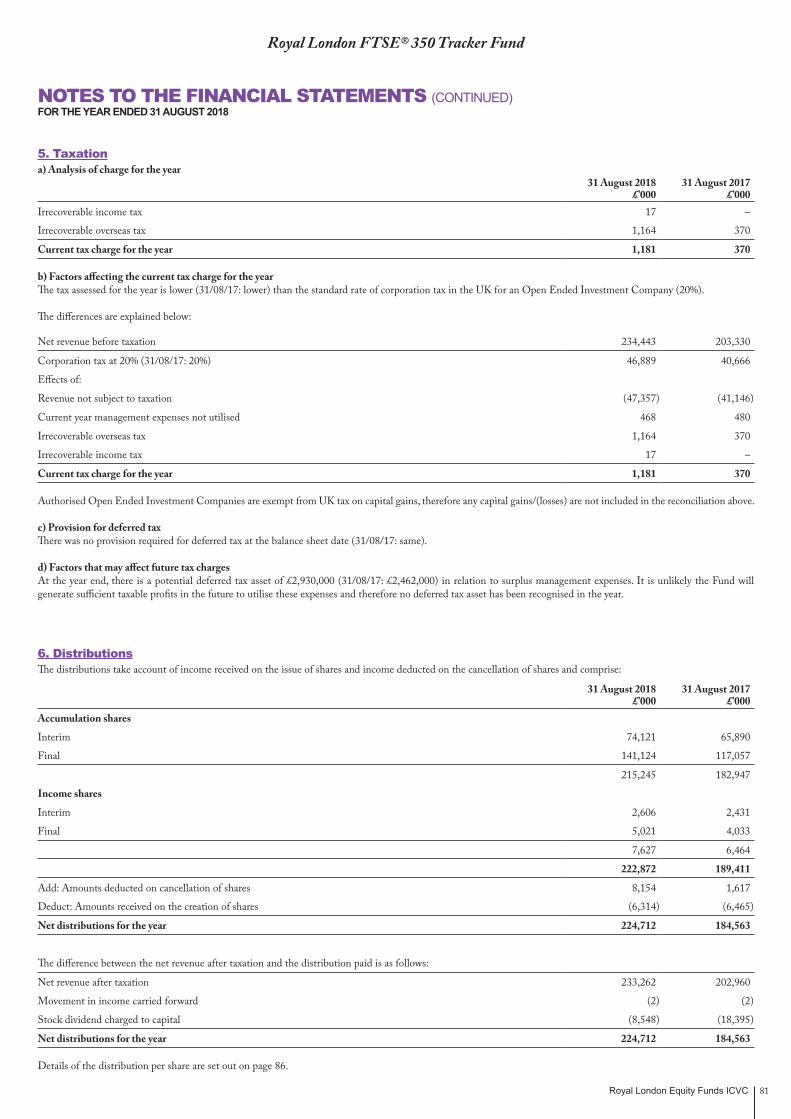
Royal London Equity Funds ICVC 81
Royal London FTSE® 350 Tracker Fund
NOTES TO THE FINANCIAL STATEMENTS (CONTINUED)FOR THE YEAR ENDED 31 AUGUST 2018
5. Taxationa) Analysis of charge for the year
31 August 2018£’000
31 August 2017£’000
Irrecoverable income tax 17 –
Irrecoverable overseas tax 1,164 370
Current tax charge for the year 1,181 370
b) Factors affecting the current tax charge for the yearThe tax assessed for the year is lower (31/08/17: lower) than the standard rate of corporation tax in the UK for an Open Ended Investment Company (20%).
The differences are explained below:
Net revenue before taxation 234,443 203,330
Corporation tax at 20% (31/08/17: 20%) 46,889 40,666
Effects of:
Revenue not subject to taxation (47,357) (41,146)
Current year management expenses not utilised 468 480
Irrecoverable overseas tax 1,164 370
Irrecoverable income tax 17 –
Current tax charge for the year 1,181 370
Authorised Open Ended Investment Companies are exempt from UK tax on capital gains, therefore any capital gains/(losses) are not included in the reconciliation above.
c) Provision for deferred taxThere was no provision required for deferred tax at the balance sheet date (31/08/17: same).
d) Factors that may affect future tax chargesAt the year end, there is a potential deferred tax asset of £2,930,000 (31/08/17: £2,462,000) in relation to surplus management expenses. It is unlikely the Fund will generate sufficient taxable profits in the future to utilise these expenses and therefore no deferred tax asset has been recognised in the year.
6. DistributionsThe distributions take account of income received on the issue of shares and income deducted on the cancellation of shares and comprise:
31 August 2018 £’000
31 August 2017 £’000
Accumulation shares
Interim 74,121 65,890
Final 141,124 117,057
215,245 182,947
Income shares
Interim 2,606 2,431
Final 5,021 4,033
7,627 6,464
222,872 189,411
Add: Amounts deducted on cancellation of shares 8,154 1,617
Deduct: Amounts received on the creation of shares (6,314) (6,465)
Net distributions for the year 224,712 184,563
The difference between the net revenue after taxation and the distribution paid is as follows:
Net revenue after taxation 233,262 202,960
Movement in income carried forward (2) (2)
Stock dividend charged to capital (8,548) (18,395)
Net distributions for the year 224,712 184,563
Details of the distribution per share are set out on page 86.
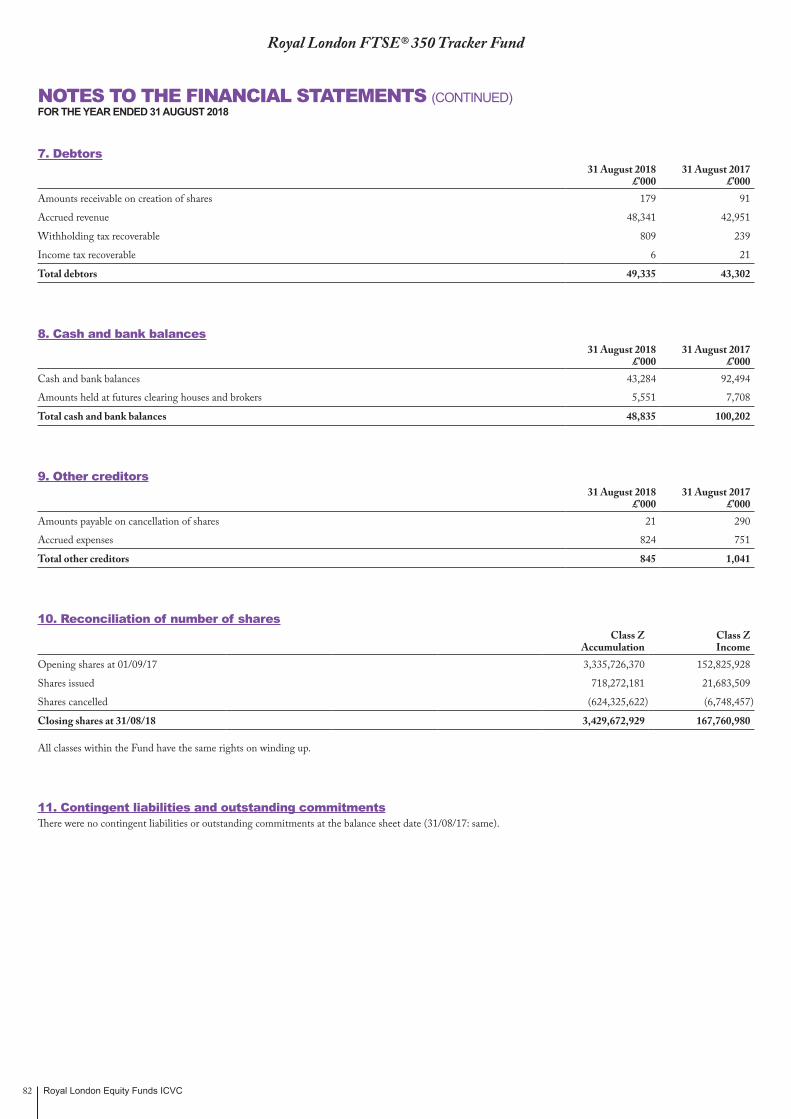
Royal London Equity Funds ICVC82
Royal London FTSE® 350 Tracker Fund
NOTES TO THE FINANCIAL STATEMENTS (CONTINUED)FOR THE YEAR ENDED 31 AUGUST 2018
7. Debtors31 August 2018
£’00031 August 2017
£’000Amounts receivable on creation of shares 179 91
Accrued revenue 48,341 42,951
Withholding tax recoverable 809 239
Income tax recoverable 6 21
Total debtors 49,335 43,302
8. Cash and bank balances31 August 2018
£’00031 August 2017
£’000Cash and bank balances 43,284 92,494
Amounts held at futures clearing houses and brokers 5,551 7,708
Total cash and bank balances 48,835 100,202
9. Other creditors31 August 2018
£’00031 August 2017
£’000Amounts payable on cancellation of shares 21 290
Accrued expenses 824 751
Total other creditors 845 1,041
10. Reconciliation of number of sharesClass Z
AccumulationClass ZIncome
Opening shares at 01/09/17 3,335,726,370 152,825,928
Shares issued 718,272,181 21,683,509
Shares cancelled (624,325,622) (6,748,457)
Closing shares at 31/08/18 3,429,672,929 167,760,980
All classes within the Fund have the same rights on winding up.
11. Contingent liabilities and outstanding commitmentsThere were no contingent liabilities or outstanding commitments at the balance sheet date (31/08/17: same).
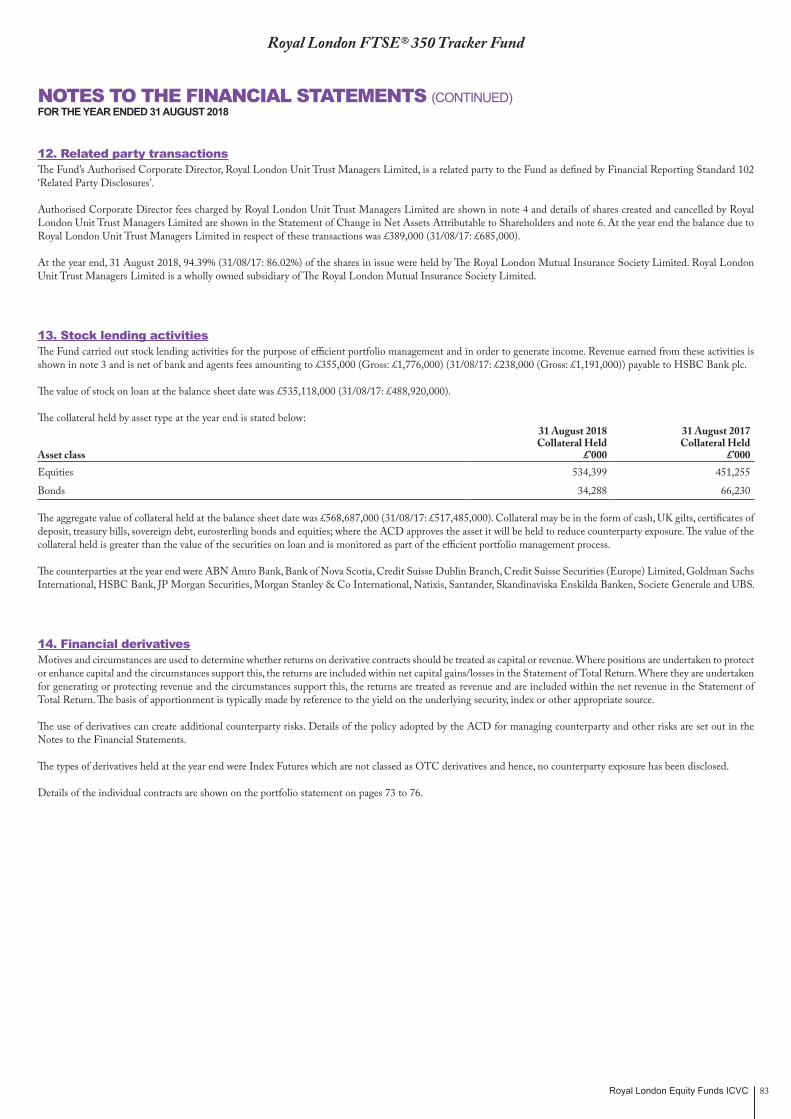
Royal London Equity Funds ICVC 83
12. Related party transactionsThe Fund’s Authorised Corporate Director, Royal London Unit Trust Managers Limited, is a related party to the Fund as defined by Financial Reporting Standard 102 ‘Related Party Disclosures’.
Authorised Corporate Director fees charged by Royal London Unit Trust Managers Limited are shown in note 4 and details of shares created and cancelled by Royal London Unit Trust Managers Limited are shown in the Statement of Change in Net Assets Attributable to Shareholders and note 6. At the year end the balance due to Royal London Unit Trust Managers Limited in respect of these transactions was £389,000 (31/08/17: £685,000).
At the year end, 31 August 2018, 94.39% (31/08/17: 86.02%) of the shares in issue were held by The Royal London Mutual Insurance Society Limited. Royal London Unit Trust Managers Limited is a wholly owned subsidiary of The Royal London Mutual Insurance Society Limited.
13. Stock lending activitiesThe Fund carried out stock lending activities for the purpose of efficient portfolio management and in order to generate income. Revenue earned from these activities is shown in note 3 and is net of bank and agents fees amounting to £355,000 (Gross: £1,776,000) (31/08/17: £238,000 (Gross: £1,191,000)) payable to HSBC Bank plc.
The value of stock on loan at the balance sheet date was £535,118,000 (31/08/17: £488,920,000).
The collateral held by asset type at the year end is stated below:
Asset class
31 August 2018 Collateral Held
£’000
31 August 2017 Collateral Held
£’000Equities 534,399 451,255
Bonds 34,288 66,230
The aggregate value of collateral held at the balance sheet date was £568,687,000 (31/08/17: £517,485,000). Collateral may be in the form of cash, UK gilts, certificates of deposit, treasury bills, sovereign debt, eurosterling bonds and equities; where the ACD approves the asset it will be held to reduce counterparty exposure. The value of the collateral held is greater than the value of the securities on loan and is monitored as part of the efficient portfolio management process.
The counterparties at the year end were ABN Amro Bank, Bank of Nova Scotia, Credit Suisse Dublin Branch, Credit Suisse Securities (Europe) Limited, Goldman Sachs International, HSBC Bank, JP Morgan Securities, Morgan Stanley & Co International, Natixis, Santander, Skandinaviska Enskilda Banken, Societe Generale and UBS.
14. Financial derivativesMotives and circumstances are used to determine whether returns on derivative contracts should be treated as capital or revenue. Where positions are undertaken to protect or enhance capital and the circumstances support this, the returns are included within net capital gains/losses in the Statement of Total Return. Where they are undertaken for generating or protecting revenue and the circumstances support this, the returns are treated as revenue and are included within the net revenue in the Statement of Total Return. The basis of apportionment is typically made by reference to the yield on the underlying security, index or other appropriate source.
The use of derivatives can create additional counterparty risks. Details of the policy adopted by the ACD for managing counterparty and other risks are set out in the Notes to the Financial Statements.
The types of derivatives held at the year end were Index Futures which are not classed as OTC derivatives and hence, no counterparty exposure has been disclosed.
Details of the individual contracts are shown on the portfolio statement on pages 73 to 76.
Royal London FTSE® 350 Tracker Fund
NOTES TO THE FINANCIAL STATEMENTS (CONTINUED)FOR THE YEAR ENDED 31 AUGUST 2018

Royal London Equity Funds ICVC84
Royal London FTSE® 350 Tracker Fund
NOTES TO THE FINANCIAL STATEMENTS (CONTINUED)FOR THE YEAR ENDED 31 AUGUST 2018
15. Risk disclosuresThe policies applied to the management of risk disclosures are set out on page 9.
The fair values of the Fund’s assets and liabilities are represented by the values shown in the balance sheet on page 79. There is no material difference between the value of the financial assets and liabilities, as shown in the balance sheet, and their fair value.
A proportion of the Fund’s assets are denominated in currencies other than sterling. The value of the Fund’s assets may be affected by currency movements.
Currency31 August 2018
£’00031 August 2017
£’000Sterling 6,274,926 5,828,539
Euro 1,235 2,402
US dollar 20,657 18,318
Total 6,296,818 5,849,259
If sterling to foreign currency exchange rates had increased by 10% as at the balance sheet date, the net asset value of the Fund would have decreased by £2,189,000 (31/08/17: £2,072,000). If sterling to foreign currency exchange rates had decreased by 10% as at the balance sheet date, the net asset value of the Fund would have increased by £2,189,000 (31/08/17: £2,072,000). These calculations assume all other variables remain constant.
If market prices had increased by 10% as at the balance sheet date, the net asset value of the Fund would have increased by £620,451,000 (31/08/17: £571,083,000). If market prices had decreased by 10% as at the balance sheet date, the net asset value of the Fund would have decreased by £620,451,000 (31/08/17: £571,083,000). These calculations assume all other variables remain constant.
The only interest bearing asset are cash balance of £43,284,000 (31/08/17: £92,494,000) which earn interest by reference to LIBOR or international equivalent.
16. Portfolio transaction costsFor the year ended 31 August 2018
Value Commissions Taxes Other expenses TotalAnalysis of total purchases costs £’000 £’000 % £’000 % £’000 % £’000Equity transactions 1,262,292 156 0.01 5,841 0.46 17 0.00 1,268,306
Corporate actions 13,014 – – – – – – 13,014
Total 1,275,306 156 5,841 17 1,281,320
Value Commissions Taxes Other expenses TotalAnalysis of total sales costs £’000 £’000 % £’000 % £’000 % £’000Equity transactions 822,226 41 0.00 – – 3 0.00 822,182
Corporate actions 35,677 – – – – – – 35,677
Total 857,903 41 – 3 857,859
The Fund had paid £95,000 as commission on purchases and sales derivative transactions for the year ended 31/08/18.
Commissions, taxes and fees as % of average net assetsCommissions 0.01%Taxes 0.09%Other expenses 0.00%

Royal London Equity Funds ICVC 85
16. Portfolio transaction costs – continuedFor the year ended 31 August 2017
Value Commissions Taxes Other expenses TotalAnalysis of total purchases costs £’000 £’000 % £’000 % £’000 % £’000Equity transactions 1,000,822 36 0.00 4,587 0.46 3 0.00 1,005,448
Corporate actions 11,481 – – – – – – 11,481
Total 1,012,303 36 4,587 3 1,016,929
Value Commissions Taxes Other expenses TotalAnalysis of total sales costs £’000 £’000 % £’000 % £’000 % £’000Equity transactions 203,225 19 0.01 – – 1 0.00 203,205
Corporate actions 155,741 – – – – – – 155,741
Total 358,966 19 – 1 358,946
The Fund had paid £76,000 as commission on purchases and sales derivative transactions for the year ended 31/08/17.
Commissions, taxes and fees as % of average net assetsCommissions 0.00%Taxes 0.09%Other expenses 0.00%
At the balance sheet date the portfolio dealing spread was 0.06% (31/08/17: 0.06%). The Fund is single priced throughout the year and therefore the dealing spread is not indicative of the full year.
17. Fair value of investmentsThe fair values of the Fund’s assets and liabilities are represented by the values shown in the balance sheet. There is no material difference between the value of the financial assets and liabilities, as shown in the balance sheet, and their fair value.
The fair value of investments has been determined using the following hierarchy:
Category 1 The unadjusted quoted price in an active market for identical assets or liabilities that the entity can access at the measurement date.
Category 2 Inputs other than quoted prices included within Level 1 that are observable (i.e. developed using market data) for the asset or liability, either directly or indirectly.
Category 3 Inputs are unobservable (i.e. for which market data is unavailable) for the asset or liability.
For the year ended 31 August 2018 Category 1 2 3 TotalInvestments £’000 £’000 £’000 £’000
Equities 6,206,882 – – 6,206,882
Total 6,206,882 – – 6,206,882
Investment liabilities £’000 £’000 £’000 £’000
Derivatives (2,368) – – (2,368)
Total (2,368) – – (2,368)
For the year ended 31 August 2017 Category 1 2 3 TotalInvestments £’000 £’000 £’000 £’000
Equities 5,710,107 – – 5,710,107
Derivatives 722 – – 722
Total 5,710,829 – – 5,710,829
Royal London FTSE® 350 Tracker Fund
NOTES TO THE FINANCIAL STATEMENTS (CONTINUED)FOR THE YEAR ENDED 31 AUGUST 2018
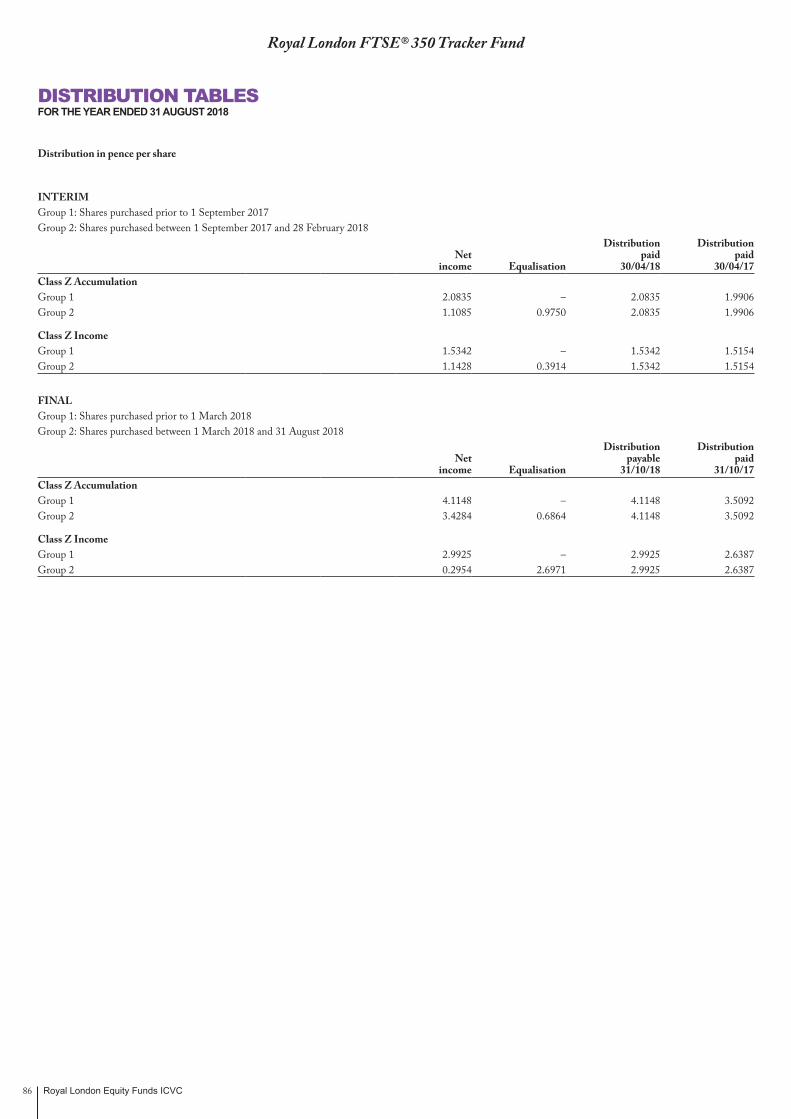
Royal London Equity Funds ICVC86
Royal London FTSE® 350 Tracker Fund
DISTRIBUTION TABLESFOR THE YEAR ENDED 31 AUGUST 2018
Distribution in pence per share
INTERIMGroup 1: Shares purchased prior to 1 September 2017Group 2: Shares purchased between 1 September 2017 and 28 February 2018
Distribution DistributionNet paid paid
income Equalisation 30/04/18 30/04/17Class Z AccumulationGroup 1 2.0835 – 2.0835 1.9906Group 2 1.1085 0.9750 2.0835 1.9906
Class Z IncomeGroup 1 1.5342 – 1.5342 1.5154Group 2 1.1428 0.3914 1.5342 1.5154
FINALGroup 1: Shares purchased prior to 1 March 2018Group 2: Shares purchased between 1 March 2018 and 31 August 2018
Distribution DistributionNet payable paid
income Equalisation 31/10/18 31/10/17Class Z AccumulationGroup 1 4.1148 – 4.1148 3.5092Group 2 3.4284 0.6864 4.1148 3.5092
Class Z IncomeGroup 1 2.9925 – 2.9925 2.6387Group 2 0.2954 2.6971 2.9925 2.6387
Royal London Equity Funds ICVC 87
Royal London UK All Share Tracker Fund
Fund Performance12 months to 31 August 2018
1 year total return
%
3 year total return
%
5 year total return
%Royal London UK All Share Tracker Fund, Class Z Accumulation 6.25 35.58 43.19
FTSE® All-Share Index 4.68 33.73 44.09
Past performance is not necessarily a reliable indicator of future performance. The value of investments and the income from them is not guaranteed and may go down as well as up, and investors may not get back the amount originally invested.
Source: RLAM and Lipper, as at 31 August 2018. Returns are net of management fees. Investors should note that the total return is calculated on the Fund’s official midday price whereas the Fund has been valued as at close of business for the Net Asset Value quoted within the Comparative Table. Please also note, the total return shown in the table is being compared against the official end of day price of the benchmark. The tracking error shown in the performance overview below is calculated using the unofficial end of day fund price to align with the official end of day benchmark price.
Performance OverviewInvestors should note that the Fund price is taken at noon each day, whilst the index performance is recorded at the close of business. Significant intra-day market movements at the start or end of the day may therefore distort comparisons. This and the charges associated with the Fund account for the majority of the difference between the performance of the Fund and the FTSE® All-Share Index.
The tracking error between the Royal London UK All Share Tracker Fund and the FTSE® All-Share Index was 0.08% during the period under review. This is within the anticipated tracking error range of 0.05% to 0.15%. We will always experience a small tracking difference between Fund and index for reasons including exchange rate risk on some dividends, trading costs and the use of index futures to manage cashflows.
Market and Portfolio CommentaryThe Fund aims to achieve the total return of the FTSE® All-Share Index. However, perfect replication can result in unnecessary and costly trading which may outweigh the benefits. The Fund uses an optimiser to help construct a portfolio designed to track the performance of the benchmark without necessarily holding all the constituents in their exact benchmark weights. It generates efficient rebalancing and cashflow trades and allows flexibility not to trade every index or cashflow event. In practice, the Fund holds most of its benchmark’s names, as well as holding futures and cash.
Nils JungbackeFund Manager31 August 2018Royal London Asset Management
Please note that Nils Jungbacke started managing the Fund on 4 January 2018. The previous Fund Manager was Vicky Harriss.
The views expressed are the author’s own and do not constitute investment advice and are not an indication of future fund performance. Portfolio holdings are subject to change, for information only and are not investment recommendations.
Source: Royal London Asset Management, unless otherwise stated.
MANAGER’S INVESTMENT REPORT

Royal London Equity Funds ICVC88
Royal London UK All Share Tracker Fund
COMPARATIVE TABLES
Class Z Accumulation31/08/18 31/08/17 31/08/16
Change in net assets per share (p) (p) (p)
Opening net asset value per share 197.65 173.10 155.04
Return before operating charges* 9.34 24.81 18.29
Operating charges (0.28) (0.26) (0.23)
Return after operating charges* 9.06 24.55 18.06
Distributions on accumulation shares (7.10) (6.33) (5.68)
Retained distributions on accumulation shares 7.10 6.33 5.68
Closing net asset value per share 206.71 197.65 173.10
* after direct transaction costs of: 0.07 0.09 0.11
Performance
Return after charges 4.58% 14.18% 11.65%
Other information
Closing net asset value (£’000) 545,648 548,926 505,679
Closing number of shares 263,968,506 277,733,342 292,134,064
Operating charges 0.14% 0.14% 0.15%
Direct transaction costs 0.03% 0.05% 0.07%
Prices^
Highest share price 215.50 199.70 176.30
Lowest share price 188.80 170.90 138.90
Class Z Income**31/08/18 31/08/17 31/08/16
Change in net assets per share (p) (p) (p)
Opening net asset value per share 112.52 101.82 94.43
Return before operating charges* 5.29 14.54 10.96
Operating charges (0.06) (0.15) (0.14)
Return after operating charges* 5.23 14.39 10.82
Distributions on income shares – (3.69) (3.43)
Cancellation price (117.75) – –
Closing net asset value per share – 112.52 101.82
* after direct transaction costs of: 0.04 0.05 0.07
Performance
Return after charges 4.65% 14.13% 11.46%
Other information
Closing net asset value (£’000) – 2,225 1,822
Closing number of shares – 1,977,634 1,789,563
Operating charges – 0.14% 0.15%
Direct transaction costs 0.03% 0.05% 0.07%
Prices^
Highest share price 119.70 116.10 105.90
Lowest share price 110.00 100.50 84.61** From 25 January 2018 shareholders in Class Z Income converted into Class Z Accumulation.^ The high and low prices disclosed are the high and low prices for the accounting period and not the calendar year. The net asset value per share price is based on the net asset value in the published financial statements and may be different due to the prior year end accounting adjustments.
It should be remembered that past performance is not a reliable indicator of future performance and that the value of shares, and the income derived from them, can vary.
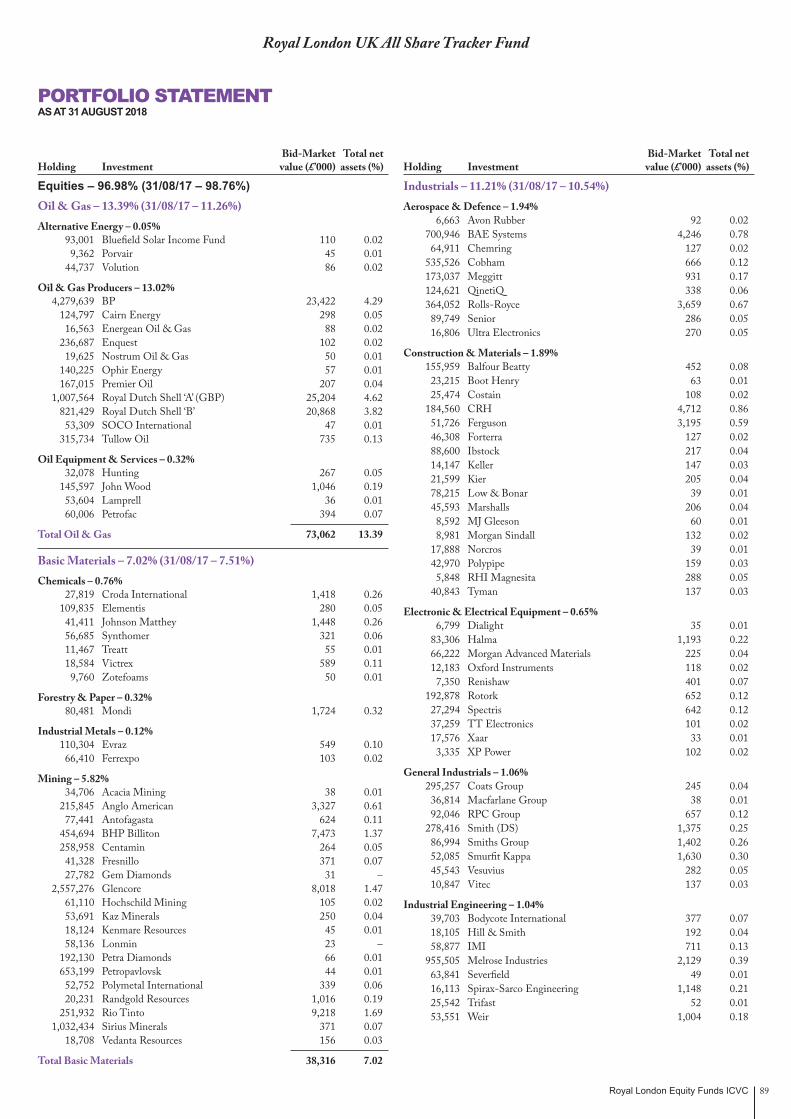
Royal London Equity Funds ICVC 89
Royal London UK All Share Tracker Fund
Equities – 96.98% (31/08/17 – 98.76%) Oil & Gas – 13.39% (31/08/17 – 11.26%) Alternative Energy – 0.05% 93,001 Bluefield Solar Income Fund 110 0.02 9,362 Porvair 45 0.01 44,737 Volution 86 0.02
Oil & Gas Producers – 13.02% 4,279,639 BP 23,422 4.29 124,797 Cairn Energy 298 0.05 16,563 Energean Oil & Gas 88 0.02 236,687 Enquest 102 0.02 19,625 Nostrum Oil & Gas 50 0.01 140,225 Ophir Energy 57 0.01 167,015 Premier Oil 207 0.04 1,007,564 Royal Dutch Shell ‘A’ (GBP) 25,204 4.62 821,429 Royal Dutch Shell ‘B’ 20,868 3.82 53,309 SOCO International 47 0.01 315,734 Tullow Oil 735 0.13
Oil Equipment & Services – 0.32% 32,078 Hunting 267 0.05 145,597 John Wood 1,046 0.19 53,604 Lamprell 36 0.01 60,006 Petrofac 394 0.07
Total Oil & Gas 73,062 13.39
Basic Materials – 7.02% (31/08/17 – 7.51%) Chemicals – 0.76% 27,819 Croda International 1,418 0.26 109,835 Elementis 280 0.05 41,411 Johnson Matthey 1,448 0.26 56,685 Synthomer 321 0.06 11,467 Treatt 55 0.01 18,584 Victrex 589 0.11 9,760 Zotefoams 50 0.01
Forestry & Paper – 0.32% 80,481 Mondi 1,724 0.32
Industrial Metals – 0.12% 110,304 Evraz 549 0.10 66,410 Ferrexpo 103 0.02
Mining – 5.82% 34,706 Acacia Mining 38 0.01 215,845 Anglo American 3,327 0.61 77,441 Antofagasta 624 0.11 454,694 BHP Billiton 7,473 1.37 258,958 Centamin 264 0.05 41,328 Fresnillo 371 0.07 27,782 Gem Diamonds 31 – 2,557,276 Glencore 8,018 1.47 61,110 Hochschild Mining 105 0.02 53,691 Kaz Minerals 250 0.04 18,124 Kenmare Resources 45 0.01 58,136 Lonmin 23 – 192,130 Petra Diamonds 66 0.01 653,199 Petropavlovsk 44 0.01 52,752 Polymetal International 339 0.06 20,231 Randgold Resources 1,016 0.19 251,932 Rio Tinto 9,218 1.69 1,032,434 Sirius Minerals 371 0.07 18,708 Vedanta Resources 156 0.03
Total Basic Materials 38,316 7.02
PORTFOLIO STATEMENTAS AT 31 AUGUST 2018
Bid-Market Total net Holding Investment value (£’000) assets (%)
Bid-Market Total net Holding Investment value (£’000) assets (%)
Industrials – 11.21% (31/08/17 – 10.54%) Aerospace & Defence – 1.94% 6,663 Avon Rubber 92 0.02 700,946 BAE Systems 4,246 0.78 64,911 Chemring 127 0.02 535,526 Cobham 666 0.12 173,037 Meggitt 931 0.17 124,621 QinetiQ 338 0.06 364,052 Rolls-Royce 3,659 0.67 89,749 Senior 286 0.05 16,806 Ultra Electronics 270 0.05
Construction & Materials – 1.89% 155,959 Balfour Beatty 452 0.08 23,215 Boot Henry 63 0.01 25,474 Costain 108 0.02 184,560 CRH 4,712 0.86 51,726 Ferguson 3,195 0.59 46,308 Forterra 127 0.02 88,600 Ibstock 217 0.04 14,147 Keller 147 0.03 21,599 Kier 205 0.04 78,215 Low & Bonar 39 0.01 45,593 Marshalls 206 0.04 8,592 MJ Gleeson 60 0.01 8,981 Morgan Sindall 132 0.02 17,888 Norcros 39 0.01 42,970 Polypipe 159 0.03 5,848 RHI Magnesita 288 0.05 40,843 Tyman 137 0.03
Electronic & Electrical Equipment – 0.65% 6,799 Dialight 35 0.01 83,306 Halma 1,193 0.22 66,222 Morgan Advanced Materials 225 0.04 12,183 Oxford Instruments 118 0.02 7,350 Renishaw 401 0.07 192,878 Rotork 652 0.12 27,294 Spectris 642 0.12 37,259 TT Electronics 101 0.02 17,576 Xaar 33 0.01 3,335 XP Power 102 0.02
General Industrials – 1.06% 295,257 Coats Group 245 0.04 36,814 Macfarlane Group 38 0.01 92,046 RPC Group 657 0.12 278,416 Smith (DS) 1,375 0.25 86,994 Smiths Group 1,402 0.26 52,085 Smurfit Kappa 1,630 0.30 45,543 Vesuvius 282 0.05 10,847 Vitec 137 0.03
Industrial Engineering – 1.04% 39,703 Bodycote International 377 0.07 18,105 Hill & Smith 192 0.04 58,877 IMI 711 0.13 955,505 Melrose Industries 2,129 0.39 63,841 Severfield 49 0.01 16,113 Spirax-Sarco Engineering 1,148 0.21 25,542 Trifast 52 0.01 53,551 Weir 1,004 0.18
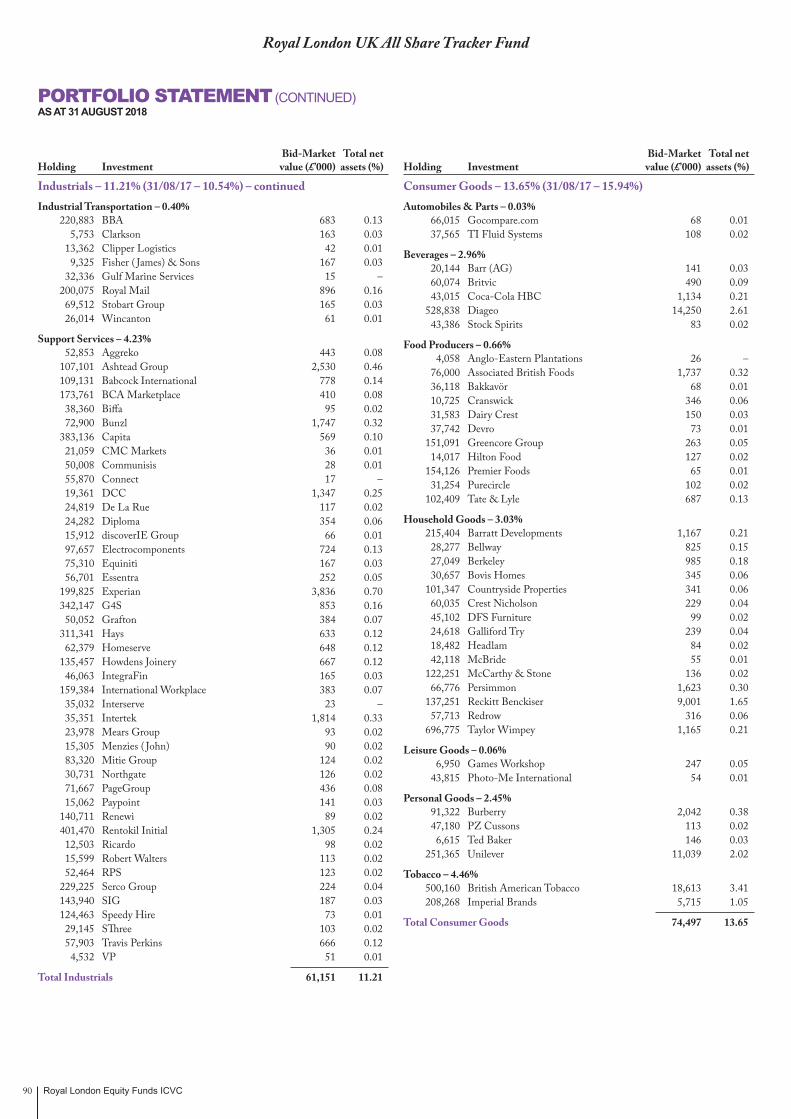
Royal London Equity Funds ICVC90
Royal London UK All Share Tracker Fund
Industrials – 11.21% (31/08/17 – 10.54%) – continued Industrial Transportation – 0.40% 220,883 BBA 683 0.13 5,753 Clarkson 163 0.03 13,362 Clipper Logistics 42 0.01 9,325 Fisher ( James) & Sons 167 0.03 32,336 Gulf Marine Services 15 – 200,075 Royal Mail 896 0.16 69,512 Stobart Group 165 0.03 26,014 Wincanton 61 0.01
Support Services – 4.23% 52,853 Aggreko 443 0.08 107,101 Ashtead Group 2,530 0.46 109,131 Babcock International 778 0.14 173,761 BCA Marketplace 410 0.08 38,360 Biffa 95 0.02 72,900 Bunzl 1,747 0.32 383,136 Capita 569 0.10 21,059 CMC Markets 36 0.01 50,008 Communisis 28 0.01 55,870 Connect 17 – 19,361 DCC 1,347 0.25 24,819 De La Rue 117 0.02 24,282 Diploma 354 0.06 15,912 discoverIE Group 66 0.01 97,657 Electrocomponents 724 0.13 75,310 Equiniti 167 0.03 56,701 Essentra 252 0.05 199,825 Experian 3,836 0.70 342,147 G4S 853 0.16 50,052 Grafton 384 0.07 311,341 Hays 633 0.12 62,379 Homeserve 648 0.12 135,457 Howdens Joinery 667 0.12 46,063 IntegraFin 165 0.03 159,384 International Workplace 383 0.07 35,032 Interserve 23 – 35,351 Intertek 1,814 0.33 23,978 Mears Group 93 0.02 15,305 Menzies ( John) 90 0.02 83,320 Mitie Group 124 0.02 30,731 Northgate 126 0.02 71,667 PageGroup 436 0.08 15,062 Paypoint 141 0.03 140,711 Renewi 89 0.02 401,470 Rentokil Initial 1,305 0.24 12,503 Ricardo 98 0.02 15,599 Robert Walters 113 0.02 52,464 RPS 123 0.02 229,225 Serco Group 224 0.04 143,940 SIG 187 0.03 124,463 Speedy Hire 73 0.01 29,145 SThree 103 0.02 57,903 Travis Perkins 666 0.12 4,532 VP 51 0.01
Total Industrials 61,151 11.21
PORTFOLIO STATEMENT (CONTINUED)AS AT 31 AUGUST 2018
Bid-Market Total net Holding Investment value (£’000) assets (%)
Bid-Market Total net Holding Investment value (£’000) assets (%)
Consumer Goods – 13.65% (31/08/17 – 15.94%) Automobiles & Parts – 0.03% 66,015 Gocompare.com 68 0.01 37,565 TI Fluid Systems 108 0.02
Beverages – 2.96% 20,144 Barr (AG) 141 0.03 60,074 Britvic 490 0.09 43,015 Coca-Cola HBC 1,134 0.21 528,838 Diageo 14,250 2.61 43,386 Stock Spirits 83 0.02
Food Producers – 0.66% 4,058 Anglo-Eastern Plantations 26 – 76,000 Associated British Foods 1,737 0.32 36,118 Bakkavör 68 0.01 10,725 Cranswick 346 0.06 31,583 Dairy Crest 150 0.03 37,742 Devro 73 0.01 151,091 Greencore Group 263 0.05 14,017 Hilton Food 127 0.02 154,126 Premier Foods 65 0.01 31,254 Purecircle 102 0.02 102,409 Tate & Lyle 687 0.13
Household Goods – 3.03% 215,404 Barratt Developments 1,167 0.21 28,277 Bellway 825 0.15 27,049 Berkeley 985 0.18 30,657 Bovis Homes 345 0.06 101,347 Countryside Properties 341 0.06 60,035 Crest Nicholson 229 0.04 45,102 DFS Furniture 99 0.02 24,618 Galliford Try 239 0.04 18,482 Headlam 84 0.02 42,118 McBride 55 0.01 122,251 McCarthy & Stone 136 0.02 66,776 Persimmon 1,623 0.30 137,251 Reckitt Benckiser 9,001 1.65 57,713 Redrow 316 0.06 696,775 Taylor Wimpey 1,165 0.21
Leisure Goods – 0.06% 6,950 Games Workshop 247 0.05 43,815 Photo-Me International 54 0.01
Personal Goods – 2.45% 91,322 Burberry 2,042 0.38 47,180 PZ Cussons 113 0.02 6,615 Ted Baker 146 0.03 251,365 Unilever 11,039 2.02
Tobacco – 4.46% 500,160 British American Tobacco 18,613 3.41 208,268 Imperial Brands 5,715 1.05
Total Consumer Goods 74,497 13.65
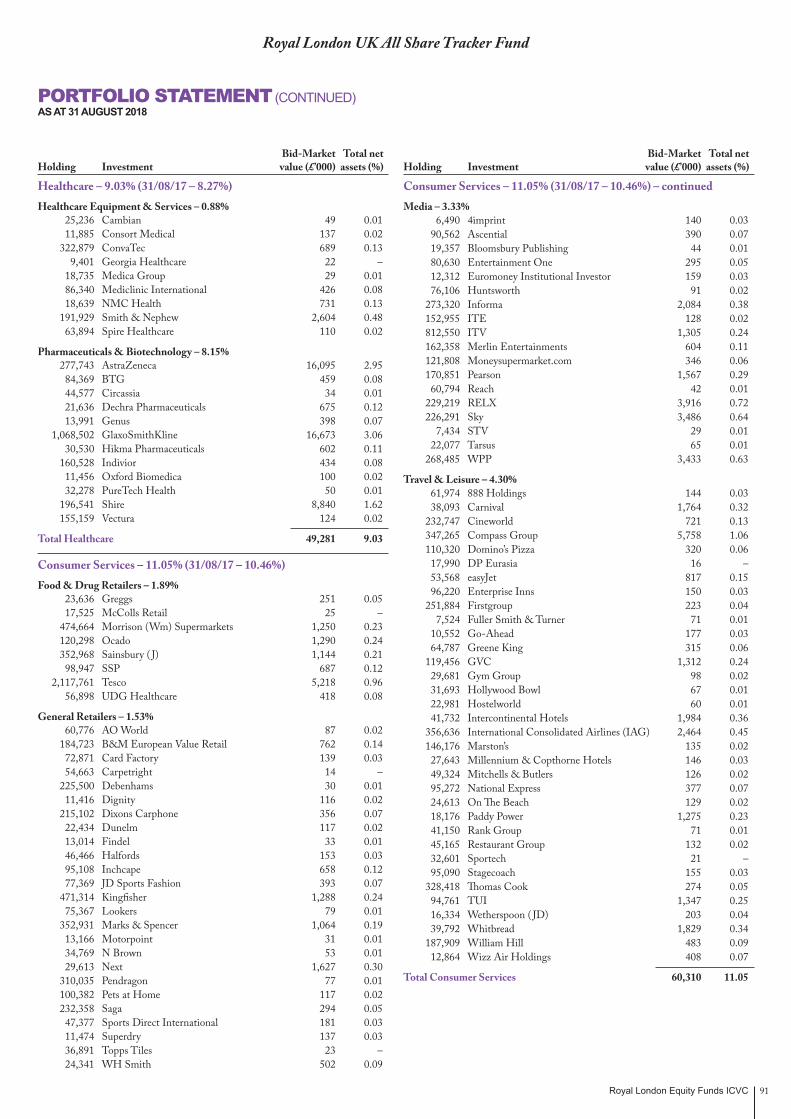
Royal London Equity Funds ICVC 91
Royal London UK All Share Tracker Fund
Healthcare – 9.03% (31/08/17 – 8.27%) Healthcare Equipment & Services – 0.88% 25,236 Cambian 49 0.01 11,885 Consort Medical 137 0.02 322,879 ConvaTec 689 0.13 9,401 Georgia Healthcare 22 – 18,735 Medica Group 29 0.01 86,340 Mediclinic International 426 0.08 18,639 NMC Health 731 0.13 191,929 Smith & Nephew 2,604 0.48 63,894 Spire Healthcare 110 0.02
Pharmaceuticals & Biotechnology – 8.15% 277,743 AstraZeneca 16,095 2.95 84,369 BTG 459 0.08 44,577 Circassia 34 0.01 21,636 Dechra Pharmaceuticals 675 0.12 13,991 Genus 398 0.07 1,068,502 GlaxoSmithKline 16,673 3.06 30,530 Hikma Pharmaceuticals 602 0.11 160,528 Indivior 434 0.08 11,456 Oxford Biomedica 100 0.02 32,278 PureTech Health 50 0.01 196,541 Shire 8,840 1.62 155,159 Vectura 124 0.02
Total Healthcare 49,281 9.03
Consumer Services – 11.05% (31/08/17 – 10.46%) Food & Drug Retailers – 1.89% 23,636 Greggs 251 0.05 17,525 McColls Retail 25 – 474,664 Morrison (Wm) Supermarkets 1,250 0.23 120,298 Ocado 1,290 0.24 352,968 Sainsbury ( J) 1,144 0.21 98,947 SSP 687 0.12 2,117,761 Tesco 5,218 0.96 56,898 UDG Healthcare 418 0.08
General Retailers – 1.53% 60,776 AO World 87 0.02 184,723 B&M European Value Retail 762 0.14 72,871 Card Factory 139 0.03 54,663 Carpetright 14 – 225,500 Debenhams 30 0.01 11,416 Dignity 116 0.02 215,102 Dixons Carphone 356 0.07 22,434 Dunelm 117 0.02 13,014 Findel 33 0.01 46,466 Halfords 153 0.03 95,108 Inchcape 658 0.12 77,369 JD Sports Fashion 393 0.07 471,314 Kingfisher 1,288 0.24 75,367 Lookers 79 0.01 352,931 Marks & Spencer 1,064 0.19 13,166 Motorpoint 31 0.01 34,769 N Brown 53 0.01 29,613 Next 1,627 0.30 310,035 Pendragon 77 0.01 100,382 Pets at Home 117 0.02 232,358 Saga 294 0.05 47,377 Sports Direct International 181 0.03 11,474 Superdry 137 0.03 36,891 Topps Tiles 23 – 24,341 WH Smith 502 0.09
PORTFOLIO STATEMENT (CONTINUED)AS AT 31 AUGUST 2018
Bid-Market Total net Holding Investment value (£’000) assets (%)
Bid-Market Total net Holding Investment value (£’000) assets (%)
Consumer Services – 11.05% (31/08/17 – 10.46%) – continued Media – 3.33% 6,490 4imprint 140 0.03 90,562 Ascential 390 0.07 19,357 Bloomsbury Publishing 44 0.01 80,630 Entertainment One 295 0.05 12,312 Euromoney Institutional Investor 159 0.03 76,106 Huntsworth 91 0.02 273,320 Informa 2,084 0.38 152,955 ITE 128 0.02 812,550 ITV 1,305 0.24 162,358 Merlin Entertainments 604 0.11 121,808 Moneysupermarket.com 346 0.06 170,851 Pearson 1,567 0.29 60,794 Reach 42 0.01 229,219 RELX 3,916 0.72 226,291 Sky 3,486 0.64 7,434 STV 29 0.01 22,077 Tarsus 65 0.01 268,485 WPP 3,433 0.63
Travel & Leisure – 4.30% 61,974 888 Holdings 144 0.03 38,093 Carnival 1,764 0.32 232,747 Cineworld 721 0.13 347,265 Compass Group 5,758 1.06 110,320 Domino’s Pizza 320 0.06 17,990 DP Eurasia 16 – 53,568 easyJet 817 0.15 96,220 Enterprise Inns 150 0.03 251,884 Firstgroup 223 0.04 7,524 Fuller Smith & Turner 71 0.01 10,552 Go-Ahead 177 0.03 64,787 Greene King 315 0.06 119,456 GVC 1,312 0.24 29,681 Gym Group 98 0.02 31,693 Hollywood Bowl 67 0.01 22,981 Hostelworld 60 0.01 41,732 Intercontinental Hotels 1,984 0.36 356,636 International Consolidated Airlines (IAG) 2,464 0.45 146,176 Marston’s 135 0.02 27,643 Millennium & Copthorne Hotels 146 0.03 49,324 Mitchells & Butlers 126 0.02 95,272 National Express 377 0.07 24,613 On The Beach 129 0.02 18,176 Paddy Power 1,275 0.23 41,150 Rank Group 71 0.01 45,165 Restaurant Group 132 0.02 32,601 Sportech 21 – 95,090 Stagecoach 155 0.03 328,418 Thomas Cook 274 0.05 94,761 TUI 1,347 0.25 16,334 Wetherspoon ( JD) 203 0.04 39,792 Whitbread 1,829 0.34 187,909 William Hill 483 0.09 12,864 Wizz Air Holdings 408 0.07
Total Consumer Services 60,310 11.05

Royal London Equity Funds ICVC92
Royal London UK All Share Tracker Fund
Telecommunications – 2.67% (31/08/17 – 3.67%) Fixed Line Telecommunications – 0.81% 1,823,800 BT Group 3,963 0.73 118,586 Kcom 116 0.02 153,243 TalkTalk Telecom 196 0.04 13,349 Telecom Plus 137 0.02
Mobile Telecommunications – 1.86% 102,206 Inmarsat 556 0.10 5,842,513 Vodafone 9,611 1.76
Total Telecommunications 14,579 2.67
Utilities – 2.53% (31/08/17 – 3.10%) Electricity – 0.59% 40,097 ContourGlobal 87 0.02 92,432 Drax 353 0.06 221,008 SSE 2,769 0.51
Gas, Water & Multiutilities – 1.94% 1,228,881 Centrica 1,761 0.32 733,866 National Grid 5,944 1.09 95,999 Pennon Group 738 0.14 51,400 Severn Trent 1,028 0.19 148,364 United Utilities 1,100 0.20
Total Utilities 13,780 2.53
Financials – 25.01% (31/08/17 – 26.61%) Banks – 9.78% 8,748 Bank of Georgia 145 0.03 3,731,208 Barclays 6,556 1.20 194,310 CYBG 645 0.12 4,402,965 HSBC 29,447 5.40 15,729,916 Lloyds Banking Group 9,326 1.71 19,743 Metro Bank 548 0.10 52,811 OneSavings Bank 219 0.04 988,111 Royal Bank of Scotland 2,383 0.44 592,822 Standard Chartered 3,717 0.68 7,954 TBC Bank 127 0.02 64,723 Virgin Money 247 0.04
Equity Investment Instruments – 4.39% 44,023 Aberdeen Asian Income 90 0.02 8,325 Aberdeen Asian Smaller Companies
Investment Trust 88 0.02 82,500 Aberdeen Diversified Income and Growth 102 0.02 29,189 Aberdeen New Dawn Investment Trust 67 0.01 14,184 Aberdeen New India Investment Trust 68 0.01 34,593 Aberdeen Standard European Logistic
Income REIT 38 0.01 19,582 Aberforth Smaller Companies Trust 264 0.05 43,251 Aberforth Split Level Income 40 0.01 38,757 Alcentra European Fund 39 0.01 6,181 Allianz Technology Trust 100 0.02 8,575 Artemis Alpha Trust 28 0.01 19,288 Baillie Gifford Japan Investment Trust 165 0.03 55,845 Baillie Gifford Shin 112 0.02 36,139 Baillie Gifford UK Growth Fund 70 0.01 28,451 Bankers Investment Trust 255 0.05 5,316 BH Global 79 0.01 122,012 Bilfinger Berger Global Infrastructure 181 0.03 12,761 Biotech Growth Trust 107 0.02 37,478 BlackRock Frontiers Investment Trust 54 0.01 23,624 BlackRock Greater European Investment Trust 85 0.02
PORTFOLIO STATEMENT (CONTINUED)AS AT 31 AUGUST 2018
Bid-Market Total net Holding Investment value (£’000) assets (%)
Bid-Market Total net Holding Investment value (£’000) assets (%)
Financials – 25.01% (31/08/17 – 26.61%) – continued Equity Investment Instruments – 4.39% – continued 9,995 BlackRock Latin American Investment Trust 39 0.01 20,438 BlackRock North American Income Trust 37 0.01 10,093 BlackRock Smaller Companies Investment Trust 148 0.03 16,914 BlackRock Throgmorton Investment Trust 92 0.02 37,318 BlackRock World Mining Investment Trust 133 0.02 26,991 British Empire Securities 205 0.04 7,021 Brunner 55 0.01 1,314 Capital Gearing Trust 54 0.01 20,387 City Merchants High Yield Trust 39 0.01 80,689 City of London Investment Trust ‘A’ 339 0.06 28,259 Coupland Cardiff Japan Income & Growth
Trust 45 0.01 108,207 CQS New City High Yield Fund 65 0.01 55,968 CVC Credit Partners European Opportunities 64 0.01 10,583 Dexion Absolute+ – – 86,723 Diverse Income Trust 90 0.02 33,475 Dunedin Income Growth Investment Trust 85 0.02 12,711 Dunedin Smaller Companies Investment Trust 38 0.01 27,614 Ecofin Global Utilities & Infrastructure Trust 35 0.01 43,139 Edinburgh Dragon Trust 160 0.03 39,863 Edinburgh Investment Trust 274 0.05 8,706 Edinburgh Worldwide Investment Trust 86 0.02 5,959 Electra Private Equity 54 0.01 9,797 EP Global Opportunities Trust 32 0.01 10,998 European Investment Trust 100 0.02 21,827 F&C Capital & Income Investment Trust 72 0.01 12,707 F&C Global Smaller Companies 186 0.03 121,955 F&C Investment Trust 889 0.16 16,710 F&C Private Equity 56 0.01 14,151 Fidelity Asian Values Investment Trust 58 0.01 88,895 Fidelity China Special Situations Investment
Trust 198 0.04 33,891 Fidelity Japanese Values Investment Trust 52 0.01 42,518 Fidelity Special Values 116 0.02 35,963 Finsbury Growth & Income Trust 303 0.06 105,823 Foresight Solar Fund 117 0.02 78,561 Funding Circle SME Income Fund 80 0.01 6,000 Fundsmith Emerging Equities Trust 76 0.01 195,999 GCP Infrastructure Investments 242 0.04 32,610 Genesis Emerging Markets Fund 223 0.04 15,667 Graphite Enterprise Investment Trust 137 0.03 211,317 Greencoat UK Wind 262 0.05 16,648 HarbourVest Global Private Equity 229 0.04 8,605 Henderson Alternative Strategies Trust 24 – 39,568 Henderson Diversified Income 35 0.01 4,699 Henderson European Focus Trust 59 0.01 5,343 Henderson Eurotrust 60 0.01 26,657 Henderson Far East Income 95 0.02 32,162 Henderson High Income 57 0.01 43,321 Henderson International Income Trust 73 0.01 17,557 Henderson Smaller Companies Investment
Trust 156 0.03 13,565 Herald Investment Trust 182 0.03 8,068 HG Capital 157 0.03 402,822 HICL Infrastructure 632 0.12 17,225 Highbridge Multi-Strategy Fund 39 0.01 27,387 ICG-Longbow Senior Secured UK Property 28 0.01 37,602 Impax Environmental Markets 103 0.02 7,328 Independent Investment Trust 50 0.01 9,263 International Biotechnology Investment Trust 63 0.01 17,761 Invesco Asia Trust 49 0.01

Royal London Equity Funds ICVC 93
Royal London UK All Share Tracker Fund
Financials – 25.01% (31/08/17 – 26.61%) – continued Equity Investment Instruments – 4.39% – continued 14,108 Invesco Income Growth Investment Trust 39 0.01 8,540 Invesco Perpetual UK Smaller Companies
Investment Trust 45 0.01 170,128 John Laing Infrastructure Fund 248 0.05 11,518 JP Morgan US Smaller Companies Trust 38 0.01 22,761 JPMorgan Asian Investment Trust 78 0.01 19,275 JPMorgan Chinese Investment Trust 51 0.01 12,528 JPMorgan Claverhouse Investment Trust 95 0.02 28,460 JPMorgan Emerging Markets Investment
Trust 245 0.04 17,554 JPMorgan European Investment Trust 53 0.01 21,441 JPMorgan European Investment Trust Income 34 0.01 37,197 JPMorgan European Smaller Companies 152 0.03 50,936 JPMorgan Global Convertibles Income Fund 47 0.01 65,314 JPMorgan Global Emerging Markets Fund 78 0.01 24,224 JPMorgan Indian Investment Trust 174 0.03 30,734 JPMorgan Japanese Investment Trust 140 0.03 12,098 JPMorgan Japanese Smaller Companies
Investment Trust 52 0.01 5,398 JPMorgan Mid Capital Investment Trust 64 0.01 27,199 JPMorgan Overseas Investment Trust 89 0.02 12,423 JPMorgan Russian Securities 62 0.01 3,719 JPMorgan Smaller Companies Investment
Trust 44 0.01 24,622 Jupiter European Opportunities Investment
Trust 218 0.04 94,965 Jupiter Fund Management 398 0.07 5,040 Jupiter US Smaller Companies 56 0.01 3,024 Keystone Investment Trust 51 0.01 27,028 Law Debenture 164 0.03 41 Lindsell Train Investment Trust 47 0.01 6,364 Lowland Investment Company 96 0.02 6,211 Majedie Investment Trust 18 – 8,421 Martin Currie Asia Unconstrained Trust 32 0.01 20,415 Martin Currie Global Portfolio 53 0.01 26,395 Merchants Trust 131 0.02 8,347 Mid Wynd International Investment Trust 45 0.01 28,179 Middlefield Canadian Income Trust 29 0.01 47,451 Monks Investment Trust 397 0.07 3,569 Montanaro European Smaller Companies Trust 34 0.01 15,249 Murray Income Trust 118 0.02 25,849 Murray International Investment Trust 293 0.05 173,810 NB Global Floating Rate Income Fund 161 0.03 11,139 NB Private Equity Partners 126 0.02 131,221 NextEnergy Solar Fund 142 0.03 2,598 North Atlantic Smaller Companies 79 0.01 29,681 Pacific Assets 81 0.01 14,086 Pacific Horizon 48 0.01 11,279 Pantheon International 235 0.04 55,707 Perpetual Income & Growth Investment Trust 201 0.04 51,097 Pershing Square Holdings 607 0.11 437 Personal Assets Investment Trust 175 0.03 125,727 Picton Property Income 116 0.02 37,072 Polar Capital Global Financials Trust 52 0.01 30,565 Polar Capital Global Healthcare Growth &
Income Trust 68 0.01 28,057 Polar Capital Technology Trust 386 0.07 3,953 Ranger Direct Lending Fund 31 0.01 17,738 Real Estate Credit Investments 30 0.01 203,675 Renewables Infrastructure 224 0.04 28,550 RIT Capital Partners 592 0.11
PORTFOLIO STATEMENT (CONTINUED)AS AT 31 AUGUST 2018
Bid-Market Total net Holding Investment value (£’000) assets (%)
Bid-Market Total net Holding Investment value (£’000) assets (%)
Financials – 25.01% (31/08/17 – 26.61%) – continued Equity Investment Instruments – 4.39% – continued 12,842 Riverstone Energy 163 0.03 39,009 Ruffer 90 0.02 39,123 Schroder Asia Pacific Fund 173 0.03 23,406 Schroder Asian Total Return Investment
Company 84 0.02 15,772 Schroder Income Growth Fund 47 0.01 30,719 Schroder Japan Growth Investment Trust 64 0.01 51,937 Schroder Oriental Income Fund 130 0.02 8,122 Schroder UK Mid Cap Fund 44 0.01 31,087 Scottish American Investment Trust 119 0.02 15,738 Scottish Investment Trust 137 0.03 305,438 Scottish Mortgage Investment Trust 1,707 0.31 7,504 Scottish Oriental Smaller Companies 76 0.01 27,390 Securities Trust of Scotland 48 0.01 194,668 Sequoia Economic Infrastructure Income
Fund 213 0.04 26,374 SQN Asset Finance Income Fund 24 – 9,994 Standard Life Equity Income 48 0.01 18,675 Standard Life European 62 0.01 15,171 Standard Life UK Smaller Companies 78 0.01 85,787 Starwood European Real Estate 93 0.02 15,771 Strategic Equity Capital 35 0.01 14,386 Temple Bar Investment Trust 183 0.03 56,897 Templeton Emerging Markets Investment
Trust 401 0.07 75,267 The Alliance Trust 584 0.11 6,426 The North American Income Trust 89 0.02 11,405 TR European Growth Trust 113 0.02 74,629 TR Property Investment 315 0.06 72,495 Troy Income & Growth Trust 56 0.01 85,712 TwentyFour Income 105 0.02 31,513 Twentyfour Select Monthly Income Fund 30 0.01 39,298 Utilico Emerging Markets 81 0.01 11,295 Value & Income Trust 30 0.01 45,160 Vietnam Enterprise Investments 204 0.04 41,695 VinaCapital Vietnam Opportunity Fund 141 0.03 38,855 Witan Investment Trust 435 0.08 14,988 Witan Pacific Investment Trust 48 0.01 192,968 Woodford Patient Capital Trust 156 0.03 11,434 Worldwide Healthcare Trust 328 0.06
Financial Services – 2.94% 209,290 3i Group 1,874 0.34 147,737 AA 165 0.03 53,242 Allied Minds 41 0.01 55,928 Apax Global Alpha 77 0.01 33,102 Arrow Global 83 0.02 79,038 Ashmore 281 0.05 59,256 Brewin Dolphin 215 0.04 19,743 Carr’s Milling Industries 28 0.01 13,937 Charles Taylor Consulting 39 0.01 30,369 Charter Court Financial Services 109 0.02 3,895 City of London Investment 15 – 34,477 Close Brothers 550 0.10 8,748 Georgia 90 0.02 57,679 Hargreaves Lansdown 1,268 0.23 81,077 IG Group 733 0.13 63,866 Intermediate Capital 670 0.12 50,748 International Personal Finance 112 0.02

Royal London Equity Funds ICVC94
Royal London UK All Share Tracker Fund
Financials – 25.01% (31/08/17 – 26.61%) – continued Financial Services – 2.94% – continued 322,128 International Public Partnership 503 0.09 142,059 Investec 719 0.13 227,779 IP 296 0.05 112,235 John Laing 353 0.06 18,491 JTC 70 0.01 10,198 Liontrust Asset Management 66 0.01 68,783 London Stock Exchange 3,181 0.58 363,046 Man Group 624 0.11 70,362 NEX Group 740 0.14 57,996 Paragon Group 270 0.05 15,771 Princess Private Equity 142 0.03 56,757 Provident Financial 388 0.07 379,607 Quilter 535 0.10 11,450 Rathbone Brothers 302 0.06 769 S & U 19 – 30,605 Sanne 188 0.03 25,006 Schroders 769 0.14 89,518 Syncona 238 0.04 122,819 TP ICAP 350 0.06 82,582 VPC Specialty Lending Investments 66 0.01 38,070 XPS Pension Group 66 0.01
Life Insurance – 3.99% 876,533 Aviva 4,251 0.78 34,861 Chesnara 132 0.02 224,773 Just Group 204 0.04 1,293,433 Legal & General 3,288 0.60 132,153 Phoenix 938 0.17 567,751 Prudential 9,850 1.81 113,205 St James’s Place Capital 1,281 0.23 593,741 Standard Life 1,882 0.34
Non-Life Insurance – 1.14% 44,448 Admiral 925 0.17 119,381 Beazley 709 0.13 299,287 Direct Line Insurance 989 0.18 66,015 Esure 184 0.03 71,401 Hastings 193 0.04 60,775 Hiscox 1,023 0.19 27,761 Jardine Lloyd Thompson 400 0.07 47,705 Lancashire 290 0.05 224,449 RSA Insurance 1,416 0.26 29,824 Sabre Insurance 83 0.02
Real Estate Investment Services – 1.16% 125,234 3i Infrastructure 310 0.06 42,032 Baillie Gifford US Growth Trust 56 0.01 65,115 BB Healthcare Trust 95 0.02 2,879 BH Macro 63 0.01 7,431 Caledonia Investments 211 0.04 169,801 Capital & Counties Properties 439 0.08 33,550 CLS 76 0.01 81,221 Countrywide 9 – 1,167 Daejan Holdings 68 0.01 123,358 F&C Commercial Property Trust 182 0.03 97,122 Fidelity European Values 227 0.04 62,824 Foxtons 33 0.01 60,133 GCP Asset Backed Income Fund 63 0.01 83,057 Grainger 255 0.05 59,333 Great Portland Estates 428 0.08 23,767 Helical Bar 81 0.01 69,762 John Laing Environmental Assets 73 0.01
PORTFOLIO STATEMENT (CONTINUED)AS AT 31 AUGUST 2018
Bid-Market Total net Holding Investment value (£’000) assets (%)
Bid-Market Total net Holding Investment value (£’000) assets (%)
Financials – 25.01% (31/08/17 – 26.61%) – continued Real Estate Investment Services – 1.16% – continued 46,589 JPMorgan American Investment Trust 217 0.04 156,291 Land Securities 1,432 0.26 21,114 LSL Property Services 60 0.01 39,117 LXI REIT 44 0.01 13,008 Macau Property Opportunities Fund 24 – 42,830 Montanaro UK Smaller Companies Trust 52 0.01 18,116 P2P Global Investments 140 0.03 10,573 Palace Capital 33 0.01 150,642 Raven Property Group 60 0.01 30,315 Savills 242 0.04 222,940 Sirius Real Estate 129 0.02 76,080 SQN Asset Finance Income Fund 72 0.01 40,652 St Modwen Properties 160 0.03 169,209 The Mercantile Investment Trust 366 0.07 28,132 U and I 64 0.01 147,655 UK Commercial Property REIT 132 0.02 59,369 Unite Group 526 0.10
Real Estate Investment Trusts – 1.61% 549,005 Assura REIT 301 0.06 30,406 Big Yellow REIT 286 0.05 215,046 British Land REIT 1,366 0.25 146,231 Capital & Regional 67 0.01 73,212 Civitas Social Housing 78 0.01 74,947 Civitas Social Housing REIT 74 0.01 87,733 Custodian REIT 106 0.02 23,116 Derwent London REIT 703 0.13 46,114 Ediston Property Investment Company 51 0.01 134,970 Empiric Student Property 133 0.02 55,482 F&C UK Real Estate 54 0.01 89,563 GCP Student Living 137 0.03 175,632 Hammerson REIT 827 0.15 99,568 Hansteen Holdings REIT 99 0.02 209,318 Intu Properties REIT 330 0.06 137,895 LondonMetric Property 254 0.05 18,280 McKay Securities REIT 50 0.01 87,615 MedicX REIT 68 0.01 62,076 NewRiver Retail REIT 165 0.03 18,710 Phoenix Spree REIT 70 0.01 147,589 Primary Health Properties REIT 167 0.03 332,074 Redefine International 112 0.02 58,519 Regional REIT 56 0.01 42,850 Residential Secure REIT 41 0.01 47,698 Safestore Holdings REIT 253 0.05 25,080 Schroder European REIT 28 0.01 119,673 Schroder Real Estate Investment Trust 78 0.01 222,282 SEGRO REIT 1,463 0.27 48,604 Shaftesbury REIT 449 0.08 75,531 Standard Life Investments Property Income
Trust 71 0.01 66,965 Target Healthcare REIT 77 0.01 5,290 Town Centre Securities REIT 14 – 48,305 Triple Point Social Housing REIT 52 0.01 342,245 Tritax Big Box REIT 516 0.09 24,968 Workspace REIT 266 0.05
Total Financials 136,472 25.01

Royal London Equity Funds ICVC 95
Royal London UK All Share Tracker Fund
PORTFOLIO STATEMENT (CONTINUED)AS AT 31 AUGUST 2018
Bid-Market Total net Holding Investment value (£’000) assets (%)
Technology – 1.42% (31/08/17 – 1.40%) Software & Computer Services – 1.39% 23,285 Alfa Financial Software 39 0.01 205,247 Auto Trader 921 0.17 13,868 Aveva Group 394 0.07 16,200 Computacenter 219 0.04 19,462 FDM 184 0.03 126,424 Just Eat 969 0.18 13,722 Kainos 53 0.01 93,844 Micro Focus International 1,225 0.22 14,504 Microgen 61 0.01 60,790 NCC 134 0.02 62,737 Playtech 334 0.06 196,090 Rightmove 965 0.18 236,043 Sage 1,405 0.26 18,555 SDL 88 0.02 24,759 Softcat 210 0.04 71,695 Sophos 376 0.07
Technology Hardware & Equipment – 0.03% 54,421 Nanoco 21 – 139,103 Spirent Communications 164 0.03
Total Technology 7,762 1.42
Futures – (0.06)% (31/08/17 – 0.01%) 221 ICF FTSE® 100 Index Future
September 2018 (376) (0.06)
Total Futures (376) (0.06)
Total value of investments* 528,834 96.92
Net other assets 16,814 3.08
Total net assets 545,648 100.00
* Including investment liabilities.+ Value less than £1,000All investments are listed on recognised stock exchanges and are “approved securities” within the meaning of the FCA rules unless otherwise stated.
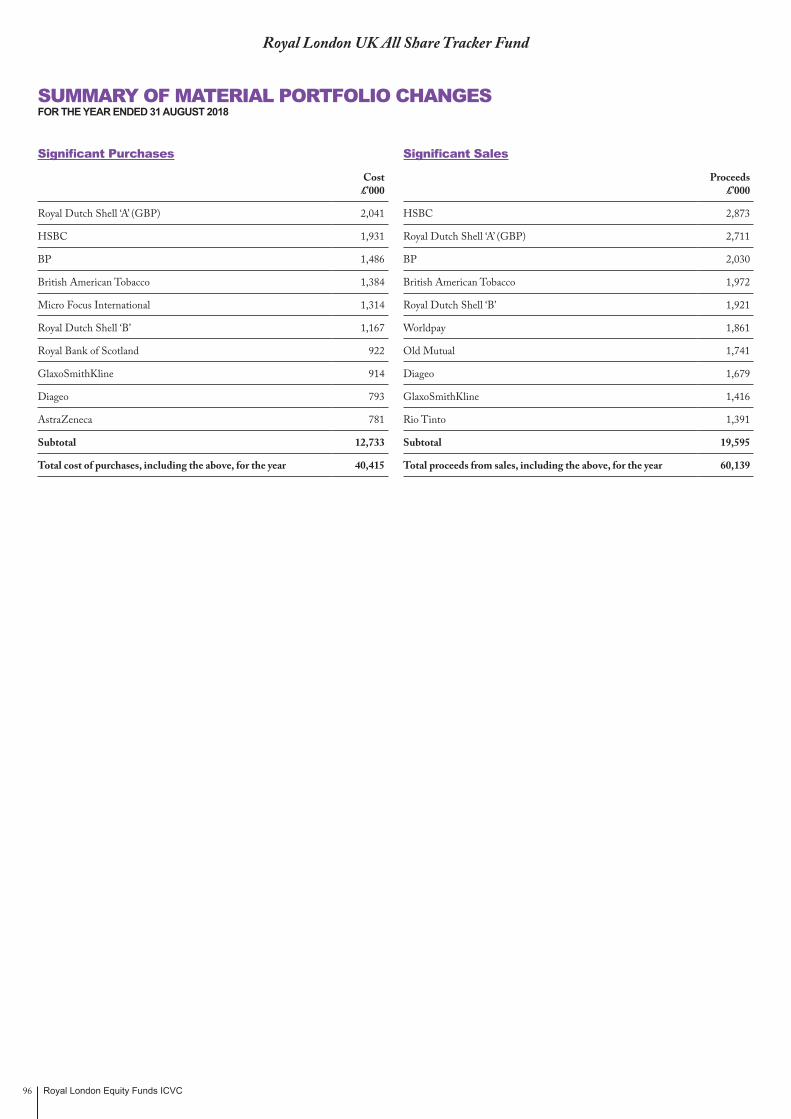
Royal London Equity Funds ICVC96
Royal London UK All Share Tracker Fund
SUMMARY OF MATERIAL PORTFOLIO CHANGESFOR THE YEAR ENDED 31 AUGUST 2018
Significant Purchases
Cost £’000
Royal Dutch Shell ‘A’ (GBP) 2,041
HSBC 1,931
BP 1,486
British American Tobacco 1,384
Micro Focus International 1,314
Royal Dutch Shell ‘B’ 1,167
Royal Bank of Scotland 922
GlaxoSmithKline 914
Diageo 793
AstraZeneca 781
Subtotal 12,733
Total cost of purchases, including the above, for the year 40,415
Significant Sales
Proceeds £’000
HSBC 2,873
Royal Dutch Shell ‘A’ (GBP) 2,711
BP 2,030
British American Tobacco 1,972
Royal Dutch Shell ‘B’ 1,921
Worldpay 1,861
Old Mutual 1,741
Diageo 1,679
GlaxoSmithKline 1,416
Rio Tinto 1,391
Subtotal 19,595
Total proceeds from sales, including the above, for the year 60,139
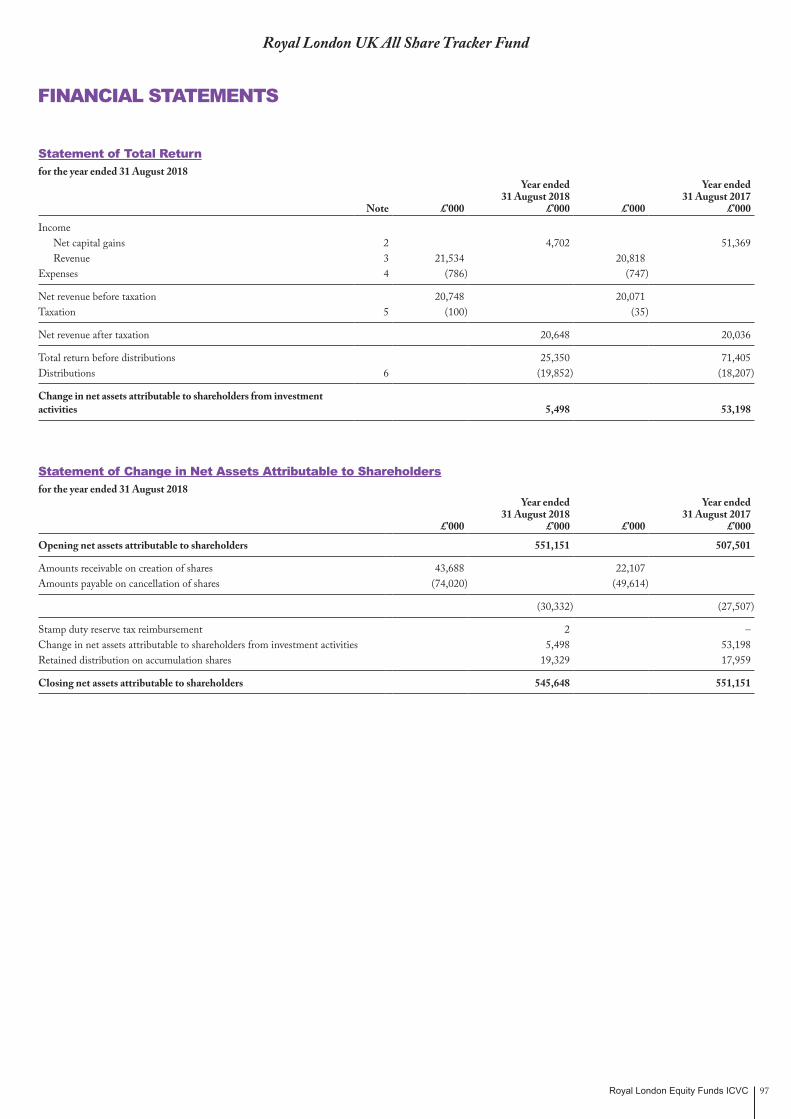
Royal London Equity Funds ICVC 97
Royal London UK All Share Tracker Fund
FINANCIAL STATEMENTS
Statement of Total Returnfor the year ended 31 August 2018
Note £’000
Year ended31 August 2018
£’000 £’000
Year ended31 August 2017
£’000
Income Net capital gains 2 4,702 51,369 Revenue 3 21,534 20,818
Expenses 4 (786) (747)
Net revenue before taxation 20,748 20,071 Taxation 5 (100) (35)
Net revenue after taxation 20,648 20,036
Total return before distributions 25,350 71,405 Distributions 6 (19,852) (18,207)
Change in net assets attributable to shareholders from investment activities 5,498 53,198
Statement of Change in Net Assets Attributable to Shareholdersfor the year ended 31 August 2018
£’000
Year ended31 August 2018
£’000 £’000
Year ended31 August 2017
£’000
Opening net assets attributable to shareholders 551,151 507,501
Amounts receivable on creation of shares 43,688 22,107 Amounts payable on cancellation of shares (74,020) (49,614)
(30,332) (27,507)
Stamp duty reserve tax reimbursement 2 – Change in net assets attributable to shareholders from investment activities 5,498 53,198 Retained distribution on accumulation shares 19,329 17,959
Closing net assets attributable to shareholders 545,648 551,151
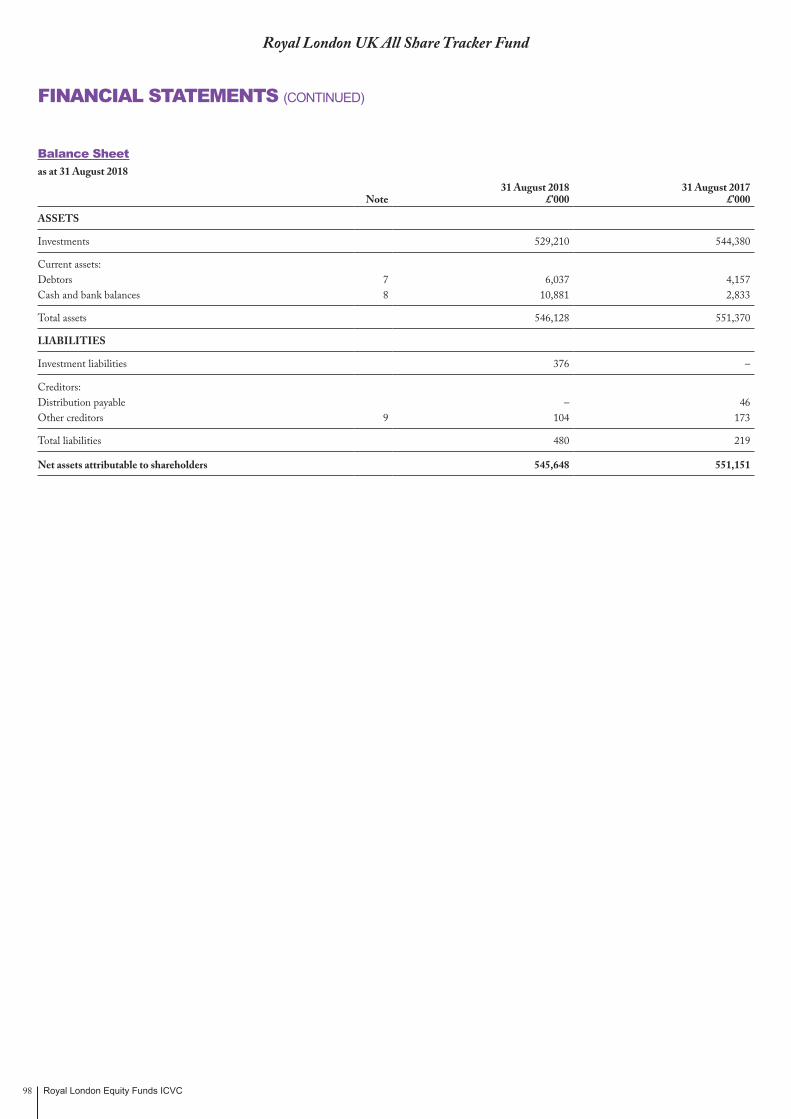
Royal London Equity Funds ICVC98
Royal London UK All Share Tracker Fund
FINANCIAL STATEMENTS (CONTINUED)
Balance Sheetas at 31 August 2018
Note31 August 2018
£’00031 August 2017
£’000
ASSETS
Investments 529,210 544,380
Current assets:Debtors 7 6,037 4,157 Cash and bank balances 8 10,881 2,833
Total assets 546,128 551,370
LIABILITIES
Investment liabilities 376 –
Creditors:Distribution payable – 46 Other creditors 9 104 173
Total liabilities 480 219
Net assets attributable to shareholders 545,648 551,151

Royal London Equity Funds ICVC 99
Royal London UK All Share Tracker Fund
NOTES TO THE FINANCIAL STATEMENTSFOR THE YEAR ENDED 31 AUGUST 2018
1. Accounting policiesThe accounting policies are set out in note 1 on page 8.
2. Net capital gains31 August 2018
£’00031 August 2017
£’000The net capital gains during the year comprise:
Non-derivative securities 4,481 50,094
Derivative securities 231 1,280
Currency (losses)/gains (4) 1
Activity fees (6) (6)
Net capital gains 4,702 51,369
3. Revenue31 August 2018
£’00031 August 2017
£’000UK dividends 18,114 17,389
Overseas dividends 2,131 1,193
Property investment income (PID) 344 324
Bank interest 31 4
Stock lending income 118 79
Stock dividends 796 1,829
Total revenue 21,534 20,818
4. Expenses31 August 2018
£’00031 August 2017
£’000Payable to the Authorised Corporate Director or associates of the Authorised Corporate Director and agents of either of them:
Authorised Corporate Director’s fee 569 540
Payable to the Depositary, associates of the Depositary and agents of either of them:
Depositary’s fee 55 52
Safe custody fees 10 9
65 61
Other expenses:
Registrar’s fees 49 47
Audit fee 13 13
FTSE® licence fee 66 61
Service charges 20 20
Printing & stationery fee 2 3
Legal fee 2 2
152 146
Total expenses 786 747

Royal London Equity Funds ICVC100
5. Taxationa) Analysis of charge for the year
31 August 2018£’000
31 August 2017£’000
Irrecoverable income tax 1 –
Irrecoverable overseas tax 99 35
Current tax charge for the year 100 35
b) Factors affecting the current tax charge for the yearThe tax assessed for the year is lower (31/08/17: lower) than the standard rate of corporation tax in the UK for an Open Ended Investment Company (20%).
The differences are explained below:
Net revenue before taxation 20,748 20,071
Corporation tax at 20% (31/08/17: 20%) 4,150 4,014
Effects of:
Revenue not subject to taxation (4,209) (4,082)
Current year expenses not utilised 59 68
Irrecoverable overseas tax 99 35
Irrecoverable income tax 1 –
Current tax charge for the year 100 35
Authorised Open Ended Investment Companies are exempt from UK tax on capital gains, therefore any capital gains/(losses) are not included in the reconciliation above.
c) Provision for deferred taxThere was no provision required for deferred tax at the balance sheet date (31/08/17: same).
d) Factors that may affect future tax chargesAt the year end, there is a potential deferred tax asset of £629,000 (31/08/17: £570,000) in relation to surplus management expenses. It is unlikely the Fund will generate sufficient taxable profits in the future to utilise these expenses and therefore no deferred tax asset has been recognised in the year.
6. DistributionsThe distributions take account of income received on the issue of shares and income deducted on the cancellation of shares and comprise:
31 August 2018 £’000
31 August 2017 £’000
Accumulation shares
Interim 6,966 6,749
Final 12,363 11,210
19,329 17,959
Income shares
Interim – 27
Final – 46
– 73
19,329 18,032
Add: Amounts deducted on cancellation of shares 877 351
Deduct: Amounts received on the creation of shares (354) (176)
Net distributions for the year 19,852 18,207
The difference between the net revenue after taxation and the distribution paid is as follows:
Net revenue after taxation 20,648 20,036
Stock dividend charged to capital (796) (1,829)
Net distributions for the year 19,852 18,207
Details of the distribution per share are set out on page 105.
Royal London UK All Share Tracker Fund
NOTES TO THE FINANCIAL STATEMENTS (CONTINUED)FOR THE YEAR ENDED 31 AUGUST 2018

Royal London Equity Funds ICVC 101
Royal London UK All Share Tracker Fund
NOTES TO THE FINANCIAL STATEMENTS (CONTINUED)FOR THE YEAR ENDED 31 AUGUST 2018
7. Debtors31 August 2018
£’00031 August 2017
£’000Amounts receivable on creation of shares 1,935 22
Accrued revenue 4,026 4,106
Withholding tax recoverable 73 26
Income tax recoverable 3 3
Total debtors 6,037 4,157
8. Cash and bank balances31 August 2018
£’00031 August 2017
£’000Cash and bank balances 9,995 2,489
Amounts held at futures clearing houses and brokers 886 344
Total cash and bank balances 10,881 2,833
9. Other creditors31 August 2018
£’00031 August 2017
£’000Amounts payable on cancellation of shares – 72
Accrued expenses 104 101
Total other creditors 104 173
10. Reconciliation of number of sharesClass Z
Accumulation Class ZIncome
Opening shares at 01/09/17 277,733,342 1,977,634
Shares issued 21,193,376 221,337
Shares cancelled (36,179,488) (53,545)
Shares converted 1,221,276 (2,145,426)
Closing shares at 31/08/18 263,968,506 –
All classes within the Fund have the same rights on winding up.
11. Contingent liabilities and outstanding commitmentsThere were no contingent liabilities or outstanding commitments at the balance sheet date (31/08/17: same).
12. Related party transactionsThe Fund’s Authorised Corporate Director, Royal London Unit Trust Managers Limited, is a related party to the Fund as defined by Financial Reporting Standard 102 ‘Related Party Disclosures’.
Authorised Corporate Director fees charged by Royal London Unit Trust Managers Limited are shown in note 4 and details of shares created and cancelled by Royal London Unit Trust Managers Limited are shown in the Statement of Change in Net Assets Attributable to Shareholders and note 6. At the year end the balance due from/(to) Royal London Unit Trust Managers Limited in respect of these transactions was £1,888,000 (31/08/17: £96,000).
At the year end, 31 August 2018, 65.65% (31/08/17: 66.63%) of the shares in issue were held by The Royal London Mutual Insurance Society Limited. Royal London Unit Trust Managers Limited is a wholly owned subsidiary of The Royal London Mutual Insurance Society Limited.
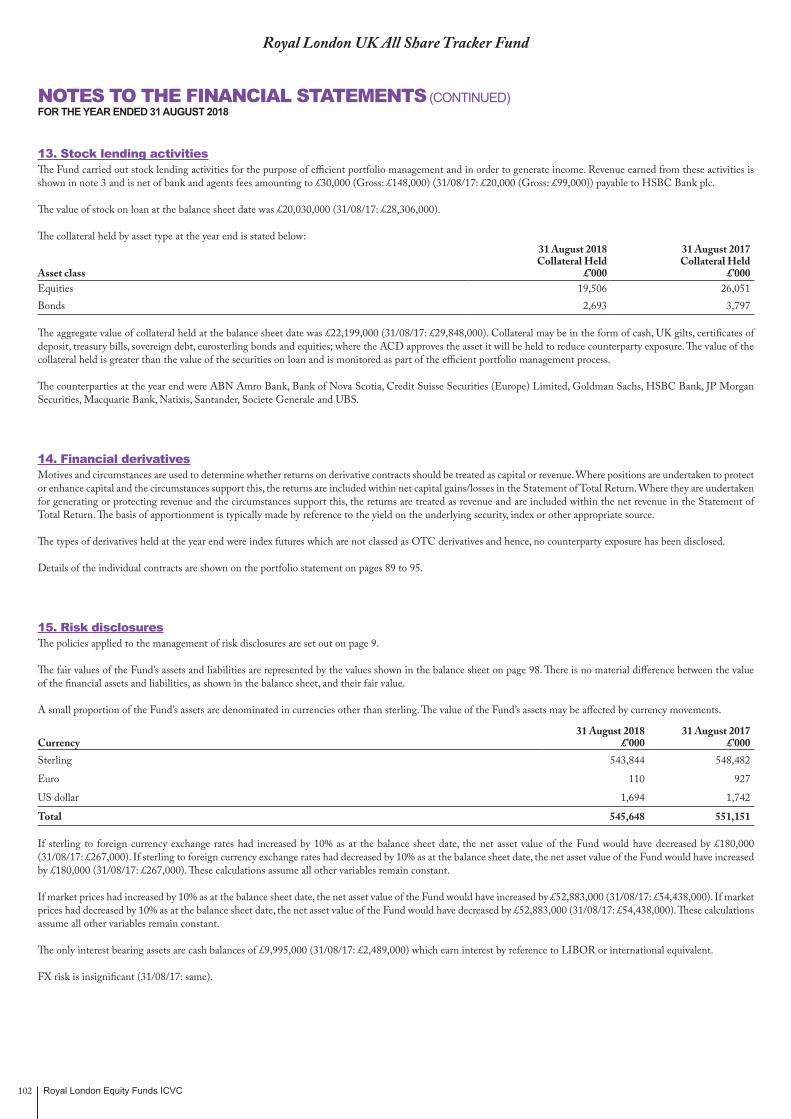
Royal London Equity Funds ICVC102
13. Stock lending activitiesThe Fund carried out stock lending activities for the purpose of efficient portfolio management and in order to generate income. Revenue earned from these activities is shown in note 3 and is net of bank and agents fees amounting to £30,000 (Gross: £148,000) (31/08/17: £20,000 (Gross: £99,000)) payable to HSBC Bank plc.
The value of stock on loan at the balance sheet date was £20,030,000 (31/08/17: £28,306,000).
The collateral held by asset type at the year end is stated below:
Asset class
31 August 2018 Collateral Held
£’000
31 August 2017 Collateral Held
£’000Equities 19,506 26,051Bonds 2,693 3,797
The aggregate value of collateral held at the balance sheet date was £22,199,000 (31/08/17: £29,848,000). Collateral may be in the form of cash, UK gilts, certificates of deposit, treasury bills, sovereign debt, eurosterling bonds and equities; where the ACD approves the asset it will be held to reduce counterparty exposure. The value of the collateral held is greater than the value of the securities on loan and is monitored as part of the efficient portfolio management process.
The counterparties at the year end were ABN Amro Bank, Bank of Nova Scotia, Credit Suisse Securities (Europe) Limited, Goldman Sachs, HSBC Bank, JP Morgan Securities, Macquarie Bank, Natixis, Santander, Societe Generale and UBS.
14. Financial derivativesMotives and circumstances are used to determine whether returns on derivative contracts should be treated as capital or revenue. Where positions are undertaken to protect or enhance capital and the circumstances support this, the returns are included within net capital gains/losses in the Statement of Total Return. Where they are undertaken for generating or protecting revenue and the circumstances support this, the returns are treated as revenue and are included within the net revenue in the Statement of Total Return. The basis of apportionment is typically made by reference to the yield on the underlying security, index or other appropriate source.
The types of derivatives held at the year end were index futures which are not classed as OTC derivatives and hence, no counterparty exposure has been disclosed.
Details of the individual contracts are shown on the portfolio statement on pages 89 to 95.
15. Risk disclosuresThe policies applied to the management of risk disclosures are set out on page 9.
The fair values of the Fund’s assets and liabilities are represented by the values shown in the balance sheet on page 98. There is no material difference between the value of the financial assets and liabilities, as shown in the balance sheet, and their fair value.
A small proportion of the Fund’s assets are denominated in currencies other than sterling. The value of the Fund’s assets may be affected by currency movements.
Currency31 August 2018
£’00031 August 2017
£’000Sterling 543,844 548,482
Euro 110 927
US dollar 1,694 1,742
Total 545,648 551,151
If sterling to foreign currency exchange rates had increased by 10% as at the balance sheet date, the net asset value of the Fund would have decreased by £180,000 (31/08/17: £267,000). If sterling to foreign currency exchange rates had decreased by 10% as at the balance sheet date, the net asset value of the Fund would have increased by £180,000 (31/08/17: £267,000). These calculations assume all other variables remain constant.
If market prices had increased by 10% as at the balance sheet date, the net asset value of the Fund would have increased by £52,883,000 (31/08/17: £54,438,000). If market prices had decreased by 10% as at the balance sheet date, the net asset value of the Fund would have decreased by £52,883,000 (31/08/17: £54,438,000). These calculations assume all other variables remain constant.
The only interest bearing assets are cash balances of £9,995,000 (31/08/17: £2,489,000) which earn interest by reference to LIBOR or international equivalent.
FX risk is insignificant (31/08/17: same).
Royal London UK All Share Tracker Fund
NOTES TO THE FINANCIAL STATEMENTS (CONTINUED)FOR THE YEAR ENDED 31 AUGUST 2018

Royal London Equity Funds ICVC 103
Royal London UK All Share Tracker Fund
NOTES TO THE FINANCIAL STATEMENTS (CONTINUED)FOR THE YEAR ENDED 31 AUGUST 2018
16. Portfolio transaction costsFor the year ended 31 August 2018
Value Commissions Taxes Other expenses TotalAnalysis of total purchases costs £’000 £’000 % £’000 % £’000 % £’000Equity transactions 38,838 1 – 173 0.45 2 0.01 39,014
Corporate actions 1,401 – – – – – – 1,401
Total 40,239 1 173 2 40,415
Value Commissions Taxes Other expenses TotalAnalysis of total sales costs £’000 £’000 % £’000 % £’000 % £’000Equity transactions 56,535 2 – – – 1 – 56,532
Corporate actions 3,607 – – – – – – 3,607
Total 60,142 2 – 1 60,139
The Fund had paid £5,290 as commission on purchases and sales derivative transactions for the year ended 31/08/18.
Commissions, taxes and fees as % of average net assetsCommissions 0.00%Taxes 0.03%Other expenses 0.00%
For the year ended 31 August 2017
Value Commissions Taxes Other expenses TotalAnalysis of total purchases costs £’000 £’000 % £’000 % £’000 % £’000Equity transactions 53,548 1 – 244 0.46 1 – 53,794
Corporate actions 1,399 – – – – – – 1,399
Total 54,947 1 244 1 55,193
Value Commissions Taxes Other expenses TotalAnalysis of total sales costs £’000 £’000 % £’000 % £’000 % £’000Equity transactions 32,753 3 0.01 – – – – 32,750
Corporate actions 16,815 – – – – – – 16,815
Total 49,568 3 – – 49,565
The Fund had paid £5,661 as commission on purchases and sales derivative transactions for the year ended 31/08/17.
Commissions, taxes and fees as % of average net assetsCommissions 0.00%Taxes 0.05%Other expenses 0.00%
At the balance sheet date the portfolio dealing spread was 0.09% (31/08/17: 0.09%). The Fund is single priced throughout the year and therefore the dealing spread is not indicative of the full year.
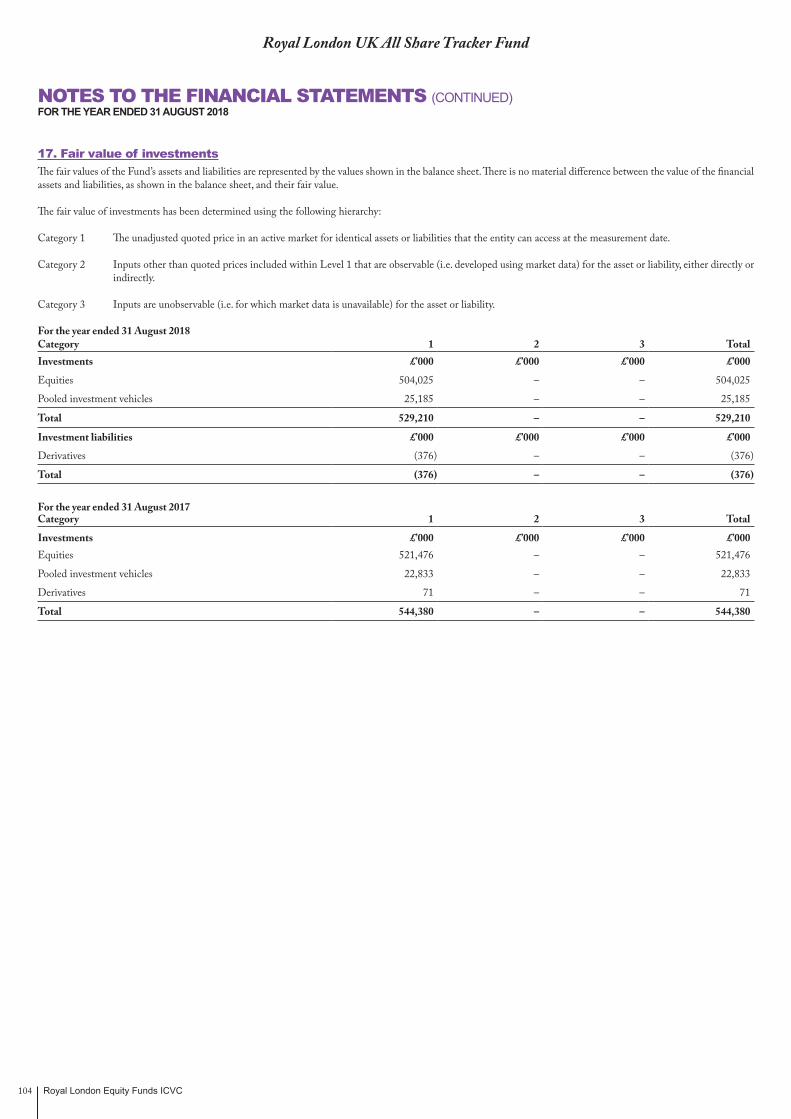
Royal London Equity Funds ICVC104
Royal London UK All Share Tracker Fund
NOTES TO THE FINANCIAL STATEMENTS (CONTINUED)FOR THE YEAR ENDED 31 AUGUST 2018
17. Fair value of investmentsThe fair values of the Fund’s assets and liabilities are represented by the values shown in the balance sheet. There is no material difference between the value of the financial assets and liabilities, as shown in the balance sheet, and their fair value.
The fair value of investments has been determined using the following hierarchy:
Category 1 The unadjusted quoted price in an active market for identical assets or liabilities that the entity can access at the measurement date.
Category 2 Inputs other than quoted prices included within Level 1 that are observable (i.e. developed using market data) for the asset or liability, either directly or indirectly.
Category 3 Inputs are unobservable (i.e. for which market data is unavailable) for the asset or liability.
For the year ended 31 August 2018 Category 1 2 3 TotalInvestments £’000 £’000 £’000 £’000
Equities 504,025 – – 504,025
Pooled investment vehicles 25,185 – – 25,185
Total 529,210 – – 529,210
Investment liabilities £’000 £’000 £’000 £’000
Derivatives (376) – – (376)
Total (376) – – (376)
For the year ended 31 August 2017 Category 1 2 3 Total
Investments £’000 £’000 £’000 £’000Equities 521,476 – – 521,476
Pooled investment vehicles 22,833 – – 22,833
Derivatives 71 – – 71
Total 544,380 – – 544,380

Royal London Equity Funds ICVC 105
DISTRIBUTION TABLESFOR THE YEAR ENDED 31 AUGUST 2018
Royal London UK All Share Tracker Fund
Distribution in pence per share
INTERIMGroup 1: Shares purchased prior to 1 September 2017Group 2: Shares purchased between 1 September 2017 and 28 February 2018
Distribution DistributionNet paid paid
income Equalisation 30/04/18 30/04/17Class Z AccumulationGroup 1 2.4144 – 2.4144 2.2909Group 2 1.0984 1.3160 2.4144 2.2909
Class Z Income*Group 1 – – – 1.3479Group 2 – – – 1.3479
FINALGroup 1: Shares purchased prior to 1 March 2018Group 2: Shares purchased between 1 March 2018 and 31 August 2018
Distribution DistributionNet payable paid
income Equalisation 31/10/18 31/10/17Class Z AccumulationGroup 1 4.6834 – 4.6834 4.0363Group 2 1.7957 2.8877 4.6834 4.0363
Class Z Income*Group 1 – – – 2.3455Group 2 – – – 2.3455
* From 25 January 2018 shareholders in Class Z Income converted into Class Z Accumulation.

Royal London Equity Funds ICVC106
Royal London US Tracker Fund
Fund Performance12 months to 31 August 2018
1 year return
%
3 year return
%
5 year return
%Royal London US Tracker Fund, Class Z Accumulation (Total return) 18.46 79.93 125.80
FTSE® USA Index (Capital return) 16.36 73.58 110.72
Past performance is not necessarily a reliable indicator of future performance. The value of investments and the income from them is not guaranteed and may go down as well as up, and investors may not get back the amount originally invested.
Source: RLAM and Lipper, as at 31 August 2018. Returns are net of management fees. Investors should note that the total return is calculated on the Fund’s official midday price whereas the Fund has been valued as at close of business for the Net Asset Value quoted within the Comparative Table. Please also note, the total return shown in the table is being compared against the official end of day price of the benchmark. The tracking error shown in the performance overview below is calculated using the unofficial end of day fund price to align with the official end of day benchmark price.
Performance OverviewInvestors should note that the Fund price is taken at noon each day, whilst the index performance is recorded at the close of business. Significant intra-day market movements at the start or end of the day may therefore distort comparisons. This, along with the impact of income and the charges associated with the Fund, accounts for the majority of the difference between the performance of the Fund and the FTSE® USA Index.
The tracking error between the Royal London US Tracker Fund and the FTSE® USA Index was 0.06% during the past 12 months. This is below the anticipated tracking error range of 0.20% to 0.30%. We will always experience a small tracking difference between Fund and index for reasons including exchange rate risk on some dividends, trading costs, optimisation and the use of index futures to manage cashflows.
Market and Portfolio CommentaryThe Fund aims to achieve the capital return of the FTSE® USA Index. However, perfect replication can result in unnecessary and costly trading which may outweigh the benefits. The Fund uses an optimiser to help construct a portfolio designed to track the performance of the benchmark without necessarily holding all the constituents in their exact benchmark weights. It generates efficient rebalancing and cashflow trades and allows flexibility not to trade every index or cashflow event. In practice, the Fund holds most of its benchmark’s names, as well as holding futures and cash.
Symon BradfordFund Manager31 August 2018Royal London Asset Management
The views expressed are the author’s own and do not constitute investment advice and are not an indication of future fund performance. Portfolio holdings are subject to change, for information only and are not investment recommendations.
Source: Royal London Asset Management, unless otherwise stated.
MANAGERS’ INVESTMENT REPORT

Royal London Equity Funds ICVC 107
Royal London US Tracker Fund
COMPARATIVE TABLE
Class Z Accumulation31/08/18 31/08/17 31/08/16
Change in net assets per share (p) (p) (p)
Opening net asset value per share 310.37 263.81 203.04
Return before operating charges* 56.45 47.23 61.28
Operating charges (0.74) (0.67) (0.51)
Return after operating charges* 55.71 46.56 60.77
Distributions on accumulation shares (4.44) (4.22) (3.65)
Retained distributions on accumulation shares 4.44 4.22 3.65
Closing net asset value per share 366.08 310.37 263.81
* after direct transaction costs of: 0.01 0.00 0.00
Performance
Return after charges 17.95% 17.65% 29.93%
Other information
Closing net asset value (£’000) 5,738,312 4,657,964 3,927,986
Closing number of shares 1,567,492,843 1,500,761,172 1,488,969,128
Operating charges 0.23% 0.23% 0.23%
Direct transaction costs 0.00% 0.00% 0.00%
Prices^
Highest share price 368.70 314.20 268.80
Lowest share price 297.50 255.30 195.10
^ The high and low prices disclosed are the high and low prices for the accounting period and not the calendar year. The net asset value per share price is based on the net asset value in the published financial statements and may be different due to the prior year end accounting adjustments.
It should be remembered that past performance is not a reliable indicator of future performance and that the value of shares, and the income derived from them, can vary.

Royal London Equity Funds ICVC108
Royal London US Tracker Fund
Equities – 99.46% (31/08/17 – 93.16%)
UNITED STATES – 96.27% (31/08/17 – 89.44%) Oil & Gas – 5.64% (31/08/17 – 5.14%) Oil & Gas Producers – 4.83% 153,665 Anadarko Petroleum 7,613 0.13 41,787 Andeavor 4,913 0.09 68,651 Antero Resources Corporation 978 0.02 111,507 Apache 3,759 0.07 119,003 Baker Hughes, a GE Company ‘A’ 3,018 0.05 133,641 Cabot Oil & Gas 2,451 0.04 1,734 California Resources Corporation 55 – 61,282 Cheniere Energy 3,155 0.05 553,784 Chevron 50,476 0.88 27,219 Cimarex Energy Com 1,769 0.03 1,304 Cobalt International Energy+ – – 45,457 Concho Resources 4,795 0.08 339,284 Conoco Phillips 19,163 0.33 29,463 Continental Resources 1,495 0.03 153,836 Devon Energy 5,081 0.09 30,764 Diamondback Energy 2,866 0.05 167,807 EOG Resources 15,263 0.27 72,730 EQT Corporation 2,854 0.05 1,230,317 Exxon Mobil 75,849 1.32 80,715 Hess 4,181 0.07 48,243 HollyFrontier 2,766 0.05 258,396 Marathon Oil Corporation 4,276 0.07 133,679 Marathon Petroleum Corporation 8,464 0.15 48,979 Murphy Oil 1,162 0.02 61,136 Newfield Exploration 1,283 0.02 141,599 Noble Energy 3,237 0.06 223,072 Occidental Petroleum 13,706 0.24 121,088 Phillips 66 11,040 0.19 50,566 Pioneer Natural Resources 6,797 0.12 6,330 QEP Resources 49 – 66,947 Range Resources 846 0.01 68,449 Targa Resources 2,901 0.05 125,245 Valero Energy 11,360 0.20
Oil Equipment & Services – 0.81% 1,434 Diamond Offshore Drilling 19 – 258,131 Halliburton 7,920 0.14 30,674 Helmerich & Payne 1,547 0.03 567,872 Kinder Morgan 7,729 0.13 112,496 National-Oilwell 4,073 0.07 402,070 Schlumberger 19,532 0.34 13,879 Transocean 129 – 247,279 Williams Companies 5,628 0.10
Total Oil & Gas 324,198 5.64
Basic Materials – 1.98% (31/08/17 – 1.99%) Chemicals – 1.59% 63,031 Air Products & Chemicals 8,065 0.14 32,968 Albemarle 2,423 0.04 19,362 Ashland Global Holdings 1,254 0.02 25,653 Avery Dennison 2,076 0.04 40,400 Celanese ‘A’ 3,631 0.06 68,813 CF Industries Holdings 2,750 0.05 674,617 DowDuPont 36,384 0.63 42,230 Eastman Chemicals 3,152 0.05 72,441 Ecolab 8,386 0.15 38,478 FMC 2,530 0.04
Basic Materials – 1.98% (31/08/17 – 1.99%) – continued Chemicals – 1.59% – continued 23,309 International Flavors & Fragrances 2,336 0.04 72,866 PPG Industries 6,196 0.11 81,563 Praxair 9,922 0.17 101,299 The Mosaic Company 2,436 0.04 9,956 Westlake Chemical 724 0.01
Forestry & Paper – 0.08% 119,806 International Paper 4,713 0.08
Industrial Metals – 0.21% 130,340 Arconic 2,244 0.04 420,932 Freeport – McMoRan 4,547 0.08 93,842 Nucor 4,512 0.08 24,202 Southern Copper 813 0.01
Mining – 0.10% 53,784 Alcoa Upstream Corporation 1,848 0.03 160,269 Newmont Mining 3,829 0.07
Total Basic Materials 114,771 1.98
Industrials – 10.31% (31/08/17 – 9.87%) Aerospace & Defence – 2.36% 159,475 Boeing 42,046 0.73 75,417 General Dynamics 11,221 0.20 12,886 Huntington Ingalls Industries 2,424 0.04 22,818 L-3 Communications 3,752 0.07 71,837 Lockheed Martin 17,708 0.31 46,641 Northrop Grumman 10,713 0.19 82,815 Raytheon 12,701 0.22 41,626 Rockwell Collins 4,350 0.08 75,018 Textron 3,983 0.07 14,340 TransDigm 3,860 0.07 217,240 United Technologies 22,009 0.38
Construction & Materials – 0.46% 12,764 Acuity Brands 1,501 0.03 43,688 Fluor New 1,930 0.03 42,003 Fortune Brands Home & Security 1,712 0.03 39,214 Jacobs Engineering 2,192 0.04 18,398 Martin Marietta Materials 2,813 0.05 90,253 Masco 2,636 0.05 52,657 MDU Resources 1,130 0.02 24,132 Sherwin-Williams 8,459 0.15 1,230 TopBuild 59 – 38,503 Vulcan Materials 3,282 0.06
Electronic & Electrical Equipment – 0.81% 93,566 Agilent Technologies 4,860 0.08 63,849 Ametek 3,778 0.07 86,406 Amphenol Corporation ‘A’ 6,287 0.11 23,341 Arrow Electronics 1,392 0.02 32,907 Avnet 1,225 0.02 181,891 Emerson Electric 10,736 0.19 11,041 IPG Photonics Corporation 1,491 0.03 46,576 Jabil Circuit 1,059 0.02 56,183 Keysight Technologies 2,804 0.05 7,268 Mettler Toledo International 3,268 0.06 29,643 Roper Technologies 6,804 0.12 72,924 Trimble Navigation 2,362 0.04
General Industrials – 2.13% 167,370 3M Company 27,144 0.47 101,620 Ball Corporation 3,274 0.06 27,001 Bemis 1,024 0.02
Bid-Market Total net Holding Investment value (£’000) assets (%)
Bid-Market Total net Holding Investment value (£’000) assets (%)
PORTFOLIO STATEMENTAS AT 31 AUGUST 2018

Royal London Equity Funds ICVC 109
Royal London US Tracker Fund
Industrials – 10.31% (31/08/17 – 9.87%) – continued General Industrials – 2.13% – continued 179,535 Danaher 14,299 0.25 129,340 Eaton 8,272 0.14 91,011 Fortive 5,881 0.10 2,500,346 General Electric 24,874 0.43 215,125 Honeywell International 26,325 0.46 26,640 Packaging Corporation of America 2,253 0.04 39,523 Parker-Hannifin 5,340 0.09 43,852 Sealed Air 1,353 0.02 73,788 Westrock Company 3,127 0.05
Industrial Engineering – 1.10% 24,101 Apergy Corporation 838 0.01 167,547 Caterpillar 17,899 0.31 43,328 Cummins 4,727 0.08 93,240 Deere & Co 10,316 0.18 45,202 Dover 2,986 0.05 36,527 Flowserve 1,465 0.03 92,599 Illinois Tool Works 9,893 0.17 100,860 Paccar 5,309 0.09 35,960 Rockwell Automation 5,006 0.09 25,269 Wabtec Corporation 2,106 0.04 52,306 Xylem Incorporated 3,055 0.05
Industrial Transportation – 1.72% 40,858 CH Robinson Worldwide 3,020 0.05 241,339 CSX 13,768 0.24 50,894 Expeditors International 2,869 0.05 72,139 Fedex 13,539 0.24 25,715 Hunt ( JB) Transport Services 2,388 0.04 29,863 Kansas City Southern 2,664 0.05 81,755 Norfolk Southern 10,929 0.19 16,683 Old Dominion Freight Line 1,956 0.03 223,100 Union Pacific 25,843 0.45 200,613 United Parcel Services ‘B’ 18,955 0.33 36,681 XPO Logistics 3,005 0.05
Support Services – 1.73% 14,103 Alliance Data Systems 2,589 0.05 71,731 Aramark Corporation 2,268 0.04 128,514 Automatic Data Processing 14,508 0.25 34,332 Broadridge Financial Solutions 3,569 0.06 36,858 CDK Global 1,766 0.03 25,553 Cintas 4,196 0.07 10,708 Costar Group 3,643 0.06 84,628 Fastenal 3,800 0.07 80,535 Fidelity National Financial Ventures 2,484 0.04 94,928 Fidelity National Information 7,898 0.14 119,695 Fiserv 7,373 0.13 26,688 FleetCor Technologies 4,386 0.08 46,281 Global Payments 4,436 0.08 13,128 Grainger 3,576 0.06 19,303 Manpower 1,392 0.02 95,205 Paychex 5,365 0.09 64,425 Republic Services 3,635 0.06 34,716 Robert Half International 2,088 0.04 23,936 Stericycle 1,136 0.02 52,288 Total Systems Services 3,907 0.07 24,515 United Rentals 2,940 0.05 44,772 Verisk Analytics 4,102 0.07 125,024 Waste Management 8,742 0.15
Total Industrials 592,048 10.31
Consumer Goods – 7.56% (31/08/17 – 8.84%) Automobiles & Parts – 0.77% 25,653 Autoliv 1,758 0.03 62,525 BorgWarner 2,105 0.04 1,126,648 Ford Motor 8,209 0.14 380,168 General Motors 10,541 0.18 76,240 Gentex 1,371 0.02 40,964 Genuine Parts 3,147 0.05 72,014 Goodyear Tire & Rubber 1,257 0.02 47,859 Harley-Davidson 1,569 0.03 19,680 Lear Corporation 2,457 0.04 90,259 LKQ 2,397 0.04 39,411 Tesla Motors 9,147 0.16 27,664 Veoneer 1,063 0.02
Beverages – 1.61% 75,227 Brown-Forman ‘B’ 3,022 0.05 1,106,732 Coca-Cola 37,943 0.66 46,069 Constellation Brands 7,373 0.13 52,273 Molson Coors Brewing ‘B’ 2,684 0.05 118,959 Monster Beverage Corporation 5,572 0.10 410,397 PepsiCo 35,361 0.62
Food Producers – 1.09% 164,985 Archer Daniels Midland 6,395 0.11 52,218 Campbell Soup 1,585 0.03 111,506 ConAgra Foods 3,152 0.05 169,751 General Mills 6,009 0.10 41,365 Hershey 3,199 0.06 78,742 Hormel Foods 2,371 0.04 20,855 Ingredion 1,621 0.03 33,014 JM Smucker 2,625 0.05 72,278 Kellogg 3,991 0.07 173,096 Kraft Heinz 7,760 0.14 43,014 Lamb Weston Holdings 2,237 0.04 35,705 McCormick 3,430 0.06 418,839 Mondelez International ‘A’ 13,763 0.24 87,455 Tyson Foods ‘A’ 4,226 0.07
Household Goods – 1.43% 73,932 Church & Dwight 3,218 0.06 37,759 Clorox 4,212 0.07 104,737 DR Horton 3,587 0.06 93,954 Jefferies Financial Group 1,678 0.03 37,096 Leggett & Platt 1,297 0.02 71,954 Lennar 2,860 0.05 1,002 Lennar ‘B’ 33 – 17,472 Mohawk Industries 2,575 0.04 133,788 Newell Brands 2,236 0.04 979 NVR 2,010 0.04 730,558 Procter & Gamble 46,613 0.81 71,007 PulteGroup 1,527 0.03 16,555 Snap-on 2,252 0.04 45,111 Stanley Black & Decker 4,877 0.08 44,967 Toll Brothers 1,253 0.02 21,304 Whirlpool 2,049 0.04
Leisure Goods – 0.50% 219,031 Activision 12,148 0.21 88,484 Electronic Arts 7,720 0.13 34,088 Hasbro 2,604 0.05 98,569 Mattel 1,170 0.02 17,552 Polaris Industries 1,465 0.03 32,378 Take Two Interactive 3,327 0.06
Bid-Market Total net Holding Investment value (£’000) assets (%)
Bid-Market Total net Holding Investment value (£’000) assets (%)
PORTFOLIO STATEMENT (CONTINUED)AS AT 31 AUGUST 2018
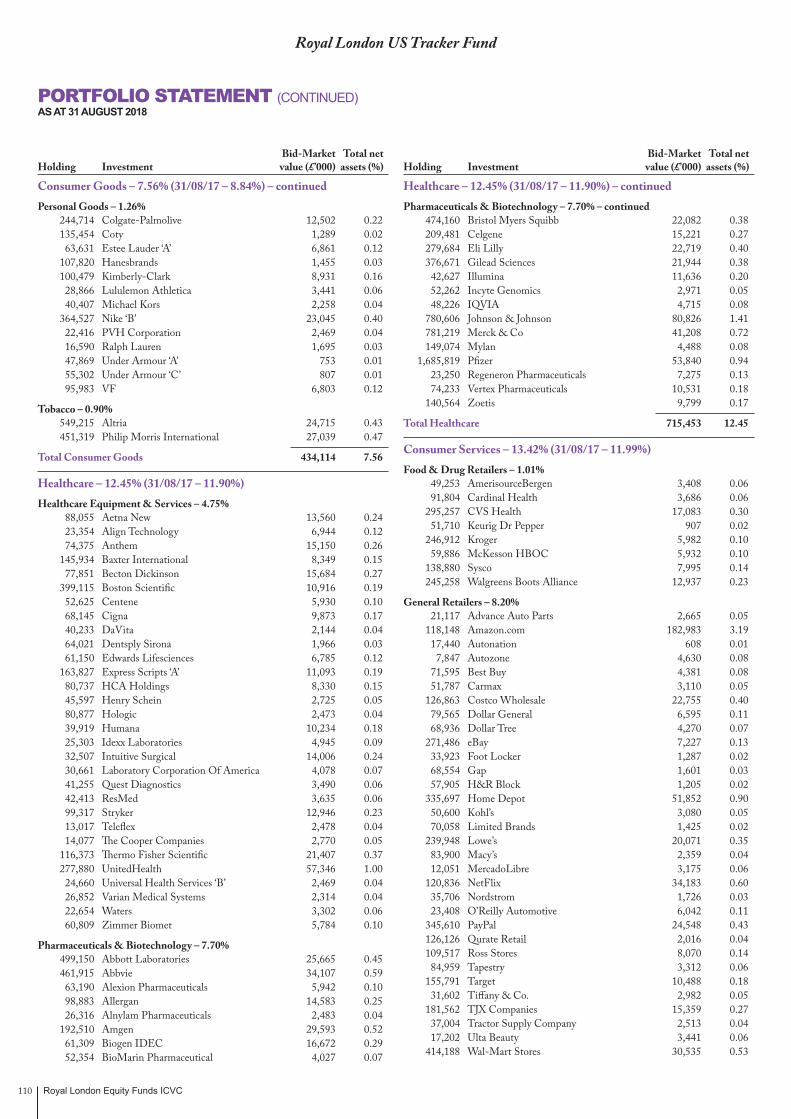
Royal London Equity Funds ICVC110
Royal London US Tracker Fund
Consumer Goods – 7.56% (31/08/17 – 8.84%) – continued Personal Goods – 1.26% 244,714 Colgate-Palmolive 12,502 0.22 135,454 Coty 1,289 0.02 63,631 Estee Lauder ‘A’ 6,861 0.12 107,820 Hanesbrands 1,455 0.03 100,479 Kimberly-Clark 8,931 0.16 28,866 Lululemon Athletica 3,441 0.06 40,407 Michael Kors 2,258 0.04 364,527 Nike ‘B’ 23,045 0.40 22,416 PVH Corporation 2,469 0.04 16,590 Ralph Lauren 1,695 0.03 47,869 Under Armour ‘A’ 753 0.01 55,302 Under Armour ‘C’ 807 0.01 95,983 VF 6,803 0.12
Tobacco – 0.90% 549,215 Altria 24,715 0.43 451,319 Philip Morris International 27,039 0.47
Total Consumer Goods 434,114 7.56
Healthcare – 12.45% (31/08/17 – 11.90%) Healthcare Equipment & Services – 4.75% 88,055 Aetna New 13,560 0.24 23,354 Align Technology 6,944 0.12 74,375 Anthem 15,150 0.26 145,934 Baxter International 8,349 0.15 77,851 Becton Dickinson 15,684 0.27 399,115 Boston Scientific 10,916 0.19 52,625 Centene 5,930 0.10 68,145 Cigna 9,873 0.17 40,233 DaVita 2,144 0.04 64,021 Dentsply Sirona 1,966 0.03 61,150 Edwards Lifesciences 6,785 0.12 163,827 Express Scripts ‘A’ 11,093 0.19 80,737 HCA Holdings 8,330 0.15 45,597 Henry Schein 2,725 0.05 80,877 Hologic 2,473 0.04 39,919 Humana 10,234 0.18 25,303 Idexx Laboratories 4,945 0.09 32,507 Intuitive Surgical 14,006 0.24 30,661 Laboratory Corporation Of America 4,078 0.07 41,255 Quest Diagnostics 3,490 0.06 42,413 ResMed 3,635 0.06 99,317 Stryker 12,946 0.23 13,017 Teleflex 2,478 0.04 14,077 The Cooper Companies 2,770 0.05 116,373 Thermo Fisher Scientific 21,407 0.37 277,880 UnitedHealth 57,346 1.00 24,660 Universal Health Services ‘B’ 2,469 0.04 26,852 Varian Medical Systems 2,314 0.04 22,654 Waters 3,302 0.06 60,809 Zimmer Biomet 5,784 0.10
Pharmaceuticals & Biotechnology – 7.70% 499,150 Abbott Laboratories 25,665 0.45 461,915 Abbvie 34,107 0.59 63,190 Alexion Pharmaceuticals 5,942 0.10 98,883 Allergan 14,583 0.25 26,316 Alnylam Pharmaceuticals 2,483 0.04 192,510 Amgen 29,593 0.52 61,309 Biogen IDEC 16,672 0.29 52,354 BioMarin Pharmaceutical 4,027 0.07
Healthcare – 12.45% (31/08/17 – 11.90%) – continued Pharmaceuticals & Biotechnology – 7.70% – continued 474,160 Bristol Myers Squibb 22,082 0.38 209,481 Celgene 15,221 0.27 279,684 Eli Lilly 22,719 0.40 376,671 Gilead Sciences 21,944 0.38 42,627 Illumina 11,636 0.20 52,262 Incyte Genomics 2,971 0.05 48,226 IQVIA 4,715 0.08 780,606 Johnson & Johnson 80,826 1.41 781,219 Merck & Co 41,208 0.72 149,074 Mylan 4,488 0.08 1,685,819 Pfizer 53,840 0.94 23,250 Regeneron Pharmaceuticals 7,275 0.13 74,233 Vertex Pharmaceuticals 10,531 0.18 140,564 Zoetis 9,799 0.17
Total Healthcare 715,453 12.45
Consumer Services – 13.42% (31/08/17 – 11.99%) Food & Drug Retailers – 1.01% 49,253 AmerisourceBergen 3,408 0.06 91,804 Cardinal Health 3,686 0.06 295,257 CVS Health 17,083 0.30 51,710 Keurig Dr Pepper 907 0.02 246,912 Kroger 5,982 0.10 59,886 McKesson HBOC 5,932 0.10 138,880 Sysco 7,995 0.14 245,258 Walgreens Boots Alliance 12,937 0.23
General Retailers – 8.20% 21,117 Advance Auto Parts 2,665 0.05 118,148 Amazon.com 182,983 3.19 17,440 Autonation 608 0.01 7,847 Autozone 4,630 0.08 71,595 Best Buy 4,381 0.08 51,787 Carmax 3,110 0.05 126,863 Costco Wholesale 22,755 0.40 79,565 Dollar General 6,595 0.11 68,936 Dollar Tree 4,270 0.07 271,486 eBay 7,227 0.13 33,923 Foot Locker 1,287 0.02 68,554 Gap 1,601 0.03 57,905 H&R Block 1,205 0.02 335,697 Home Depot 51,852 0.90 50,600 Kohl’s 3,080 0.05 70,058 Limited Brands 1,425 0.02 239,948 Lowe’s 20,071 0.35 83,900 Macy’s 2,359 0.04 12,051 MercadoLibre 3,175 0.06 120,836 NetFlix 34,183 0.60 35,706 Nordstrom 1,726 0.03 23,408 O’Reilly Automotive 6,042 0.11 345,610 PayPal 24,548 0.43 126,126 Qurate Retail 2,016 0.04 109,517 Ross Stores 8,070 0.14 84,959 Tapestry 3,312 0.06 155,791 Target 10,488 0.18 31,602 Tiffany & Co. 2,982 0.05 181,562 TJX Companies 15,359 0.27 37,004 Tractor Supply Company 2,513 0.04 17,202 Ulta Beauty 3,441 0.06 414,188 Wal-Mart Stores 30,535 0.53
Bid-Market Total net Holding Investment value (£’000) assets (%)
Bid-Market Total net Holding Investment value (£’000) assets (%)
PORTFOLIO STATEMENT (CONTINUED)AS AT 31 AUGUST 2018

Royal London Equity Funds ICVC 111
Royal London US Tracker Fund
Consumer Services – 13.42% (31/08/17 – 11.99%) – continued Media – 2.31% 98,705 CBS ‘B’ 4,026 0.07 51,872 Charter Communications ‘A’ 12,387 0.22 1,330,673 Comcast ‘A’ 37,860 0.66 33,278 Discovery Communications ‘A’ 712 0.01 64,030 Discovery Communications ‘C’ 1,263 0.02 66,798 Dish Network ‘A’ 1,816 0.03 10,663 Dun & Bradstreet 1,172 0.02 114,775 Interpublic Group of Companies 2,062 0.04 2,170 Liberty Braves ‘A’ 44 – 701 Liberty Braves ‘C’ 14 – 7,486 Liberty Broadband ‘A’ 466 0.01 31,014 Liberty Broadband ‘C’ 1,935 0.03 164,547 Liberty Global ‘C’ 3,276 0.06 27,839 Liberty SiriusXM 1,001 0.02 50,908 Liberty SiriusXM ‘C’ 1,842 0.03 104,609 News Corporation (New) ‘A’ 1,052 0.02 34,631 News Corporation (New) ‘B’ 361 0.01 68,874 Omnicom 3,673 0.06 384,951 Sirius XM Holdings 2,100 0.04 305,226 Twenty First Century Fox ‘A’ 10,654 0.19 139,626 Twenty First Century Fox ‘B’ 4,819 0.08 104,985 Viacom ‘B’ 2,365 0.04 435,108 Walt Disney 37,463 0.65
Travel & Leisure – 1.90% 9,111 Alaska Air 473 0.01 33,338 American Airlines 1,038 0.02 119,836 Carnival 5,668 0.10 7,047 Chipotle Mexican Grill 2,576 0.04 35,524 Darden Restaurants 3,171 0.06 51,818 Delta Airlines 2,331 0.04 12,313 Domino’s Pizza 2,829 0.05 35,353 Expedia 3,549 0.06 65,449 Hilton Worldwide 3,907 0.07 104,203 Las Vegas Sands 5,245 0.09 67,078 Marriott International* – – 85,411 Marriott International New ‘A’ 8,311 0.14 228,373 McDonald’s 28,498 0.50 153,304 MGM Resorts International 3,419 0.06 56,768 Park Hotels & Resort 1,461 0.03 42,863 Southwest Airlines 2,021 0.04 389,658 Starbucks 16,021 0.28 32,599 TripAdvisor 1,362 0.02 20,980 United Continental Holdings 1,411 0.02 29,964 Wyndham Destinations 1,019 0.02 29,964 Wyndham Hotels & Resort 1,308 0.02 29,987 Wynn Resorts 3,422 0.06 95,267 Yum! Brands 6,368 0.11 106,454 Yum! China 3,167 0.06
Total Consumer Services 769,362 13.42
Telecommunications – 1.96% (31/08/17 – 2.01%) Fixed Line Telecommunications – 1.86% 2,110,137 AT & T 51,822 0.90 286,181 CenturyLink 4,703 0.08 19,188 Frontier Communications 77 – 1,202,048 Verizon Communications 50,274 0.88
Mobile Telecommunications – 0.10% 205,458 Sprint (FON) 966 0.02 91,486 T-Mobile 4,648 0.08
Total Telecommunications 112,490 1.96
Utilities – 2.77% (31/08/17 – 2.96%) Electricity – 2.01% 195,351 AES 2,022 0.04 62,680 Alliant Energy 2,065 0.04 142,362 American Electric Power 7,858 0.14 16,553 Avangrid 629 0.01 87,451 CMS Energy 3,312 0.06 85,129 Consolidation Edison 5,168 0.09 190,181 Dominion Energy 10,354 0.18 53,758 DTE Energy 4,596 0.08 93,306 Edison International 4,719 0.08 53,610 Entergy 3,447 0.06 93,858 Eversource Energy 4,507 0.08 281,000 Exelon 9,448 0.16 139,534 FirstEnergy 4,012 0.07 136,932 NextEra Energy 17,914 0.31 93,792 NRG Energy 2,553 0.04 154,649 P G & E 5,495 0.10 33,026 Pinnacle West Capital 1,996 0.03 209,300 PP & L Resources 4,787 0.08 145,894 Public Service Enterprise 5,875 0.10 292,434 Southern 9,846 0.17 147,442 Xcel Energy 5,451 0.09
Gas Water & Multiutilities – 0.76% 70,577 Ameren 3,433 0.06 51,514 American Water Works 3,469 0.06 126,679 Centerpoint Energy 2,708 0.05 201,010 Duke Energy 12,564 0.22 109,029 Nisource 2,271 0.04 120,512 ONEOK 6,110 0.11 35,274 Scana 1,041 0.02 77,658 Sempra Energy 6,934 0.12 90,793 Wisconsin Energy 4,720 0.08
Total Utilities 159,304 2.77
Financials – 17.81% (31/08/17 – 16.89%) Banks – 6.22% 2,746,189 Bank of America 65,330 1.14 270,776 Bank of New York Mellon 10,862 0.19 224,263 BB & T Financial 8,912 0.16 742,103 Citigroup 40,658 0.71 138,802 Citizens Financial 4,396 0.08 51,066 Comerica 3,830 0.07 25,164 Commerce Bancshares 1,376 0.02 198,116 Fifth Third Bancorp 4,484 0.08 91,527 First Horizon National*+ – – 47,563 First Republic Bank 3,718 0.06 300,467 Huntingdon Bancshares 3,747 0.07 984,978 JP Morgan 86,771 1.51 306,213 KeyCorp 4,962 0.09 42,118 M&T Bank 5,740 0.10 144,751 New York Community Bancorp 1,198 0.02 75,011 Peoples United Financial 1,068 0.02 136,103 PNC Financial Services 15,026 0.26 321,625 Regions Financial 4,815 0.08 134,352 SunTrust Banks 7,603 0.13 15,376 SVB Financial Group 3,818 0.07 443,017 US Bancorp 18,436 0.32 1,277,689 Wells Fargo 57,448 1.00 58,921 Zions Bancorporation 2,416 0.04
Bid-Market Total net Holding Investment value (£’000) assets (%)
Bid-Market Total net Holding Investment value (£’000) assets (%)
PORTFOLIO STATEMENT (CONTINUED)AS AT 31 AUGUST 2018
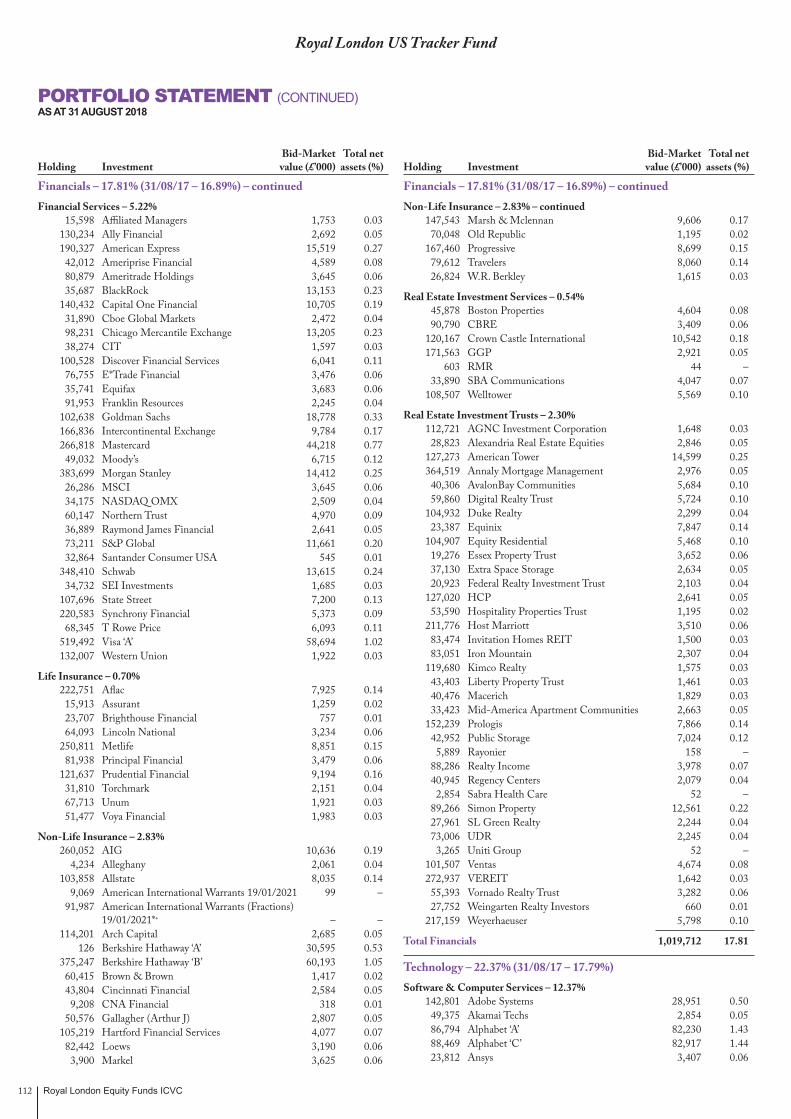
Royal London Equity Funds ICVC112
Royal London US Tracker Fund
Financials – 17.81% (31/08/17 – 16.89%) – continued Financial Services – 5.22% 15,598 Affiliated Managers 1,753 0.03 130,234 Ally Financial 2,692 0.05 190,327 American Express 15,519 0.27 42,012 Ameriprise Financial 4,589 0.08 80,879 Ameritrade Holdings 3,645 0.06 35,687 BlackRock 13,153 0.23 140,432 Capital One Financial 10,705 0.19 31,890 Cboe Global Markets 2,472 0.04 98,231 Chicago Mercantile Exchange 13,205 0.23 38,274 CIT 1,597 0.03 100,528 Discover Financial Services 6,041 0.11 76,755 E*Trade Financial 3,476 0.06 35,741 Equifax 3,683 0.06 91,953 Franklin Resources 2,245 0.04 102,638 Goldman Sachs 18,778 0.33 166,836 Intercontinental Exchange 9,784 0.17 266,818 Mastercard 44,218 0.77 49,032 Moody’s 6,715 0.12 383,699 Morgan Stanley 14,412 0.25 26,286 MSCI 3,645 0.06 34,175 NASDAQ OMX 2,509 0.04 60,147 Northern Trust 4,970 0.09 36,889 Raymond James Financial 2,641 0.05 73,211 S&P Global 11,661 0.20 32,864 Santander Consumer USA 545 0.01 348,410 Schwab 13,615 0.24 34,732 SEI Investments 1,685 0.03 107,696 State Street 7,200 0.13 220,583 Synchrony Financial 5,373 0.09 68,345 T Rowe Price 6,093 0.11 519,492 Visa ‘A’ 58,694 1.02 132,007 Western Union 1,922 0.03
Life Insurance – 0.70% 222,751 Aflac 7,925 0.14 15,913 Assurant 1,259 0.02 23,707 Brighthouse Financial 757 0.01 64,093 Lincoln National 3,234 0.06 250,811 Metlife 8,851 0.15 81,938 Principal Financial 3,479 0.06 121,637 Prudential Financial 9,194 0.16 31,810 Torchmark 2,151 0.04 67,713 Unum 1,921 0.03 51,477 Voya Financial 1,983 0.03
Non-Life Insurance – 2.83% 260,052 AIG 10,636 0.19 4,234 Alleghany 2,061 0.04 103,858 Allstate 8,035 0.14 9,069 American International Warrants 19/01/2021 99 – 91,987 American International Warrants (Fractions)
19/01/2021*+ – – 114,201 Arch Capital 2,685 0.05 126 Berkshire Hathaway ‘A’ 30,595 0.53 375,247 Berkshire Hathaway ‘B’ 60,193 1.05 60,415 Brown & Brown 1,417 0.02 43,804 Cincinnati Financial 2,584 0.05 9,208 CNA Financial 318 0.01 50,576 Gallagher (Arthur J) 2,807 0.05 105,219 Hartford Financial Services 4,077 0.07 82,442 Loews 3,190 0.06 3,900 Markel 3,625 0.06
Financials – 17.81% (31/08/17 – 16.89%) – continued Non-Life Insurance – 2.83% – continued 147,543 Marsh & Mclennan 9,606 0.17 70,048 Old Republic 1,195 0.02 167,460 Progressive 8,699 0.15 79,612 Travelers 8,060 0.14 26,824 W.R. Berkley 1,615 0.03
Real Estate Investment Services – 0.54% 45,878 Boston Properties 4,604 0.08 90,790 CBRE 3,409 0.06 120,167 Crown Castle International 10,542 0.18 171,563 GGP 2,921 0.05 603 RMR 44 – 33,890 SBA Communications 4,047 0.07 108,507 Welltower 5,569 0.10
Real Estate Investment Trusts – 2.30% 112,721 AGNC Investment Corporation 1,648 0.03 28,823 Alexandria Real Estate Equities 2,846 0.05 127,273 American Tower 14,599 0.25 364,519 Annaly Mortgage Management 2,976 0.05 40,306 AvalonBay Communities 5,684 0.10 59,860 Digital Realty Trust 5,724 0.10 104,932 Duke Realty 2,299 0.04 23,387 Equinix 7,847 0.14 104,907 Equity Residential 5,468 0.10 19,276 Essex Property Trust 3,652 0.06 37,130 Extra Space Storage 2,634 0.05 20,923 Federal Realty Investment Trust 2,103 0.04 127,020 HCP 2,641 0.05 53,590 Hospitality Properties Trust 1,195 0.02 211,776 Host Marriott 3,510 0.06 83,474 Invitation Homes REIT 1,500 0.03 83,051 Iron Mountain 2,307 0.04 119,680 Kimco Realty 1,575 0.03 43,403 Liberty Property Trust 1,461 0.03 40,476 Macerich 1,829 0.03 33,423 Mid-America Apartment Communities 2,663 0.05 152,239 Prologis 7,866 0.14 42,952 Public Storage 7,024 0.12 5,889 Rayonier 158 – 88,286 Realty Income 3,978 0.07 40,945 Regency Centers 2,079 0.04 2,854 Sabra Health Care 52 – 89,266 Simon Property 12,561 0.22 27,961 SL Green Realty 2,244 0.04 73,006 UDR 2,245 0.04 3,265 Uniti Group 52 – 101,507 Ventas 4,674 0.08 272,937 VEREIT 1,642 0.03 55,393 Vornado Realty Trust 3,282 0.06 27,752 Weingarten Realty Investors 660 0.01 217,159 Weyerhaeuser 5,798 0.10
Total Financials 1,019,712 17.81
Technology – 22.37% (31/08/17 – 17.79%) Software & Computer Services – 12.37% 142,801 Adobe Systems 28,951 0.50 49,375 Akamai Techs 2,854 0.05 86,794 Alphabet ‘A’ 82,230 1.43 88,469 Alphabet ‘C’ 82,917 1.44 23,812 Ansys 3,407 0.06
Bid-Market Total net Holding Investment value (£’000) assets (%)
Bid-Market Total net Holding Investment value (£’000) assets (%)
PORTFOLIO STATEMENT (CONTINUED)AS AT 31 AUGUST 2018
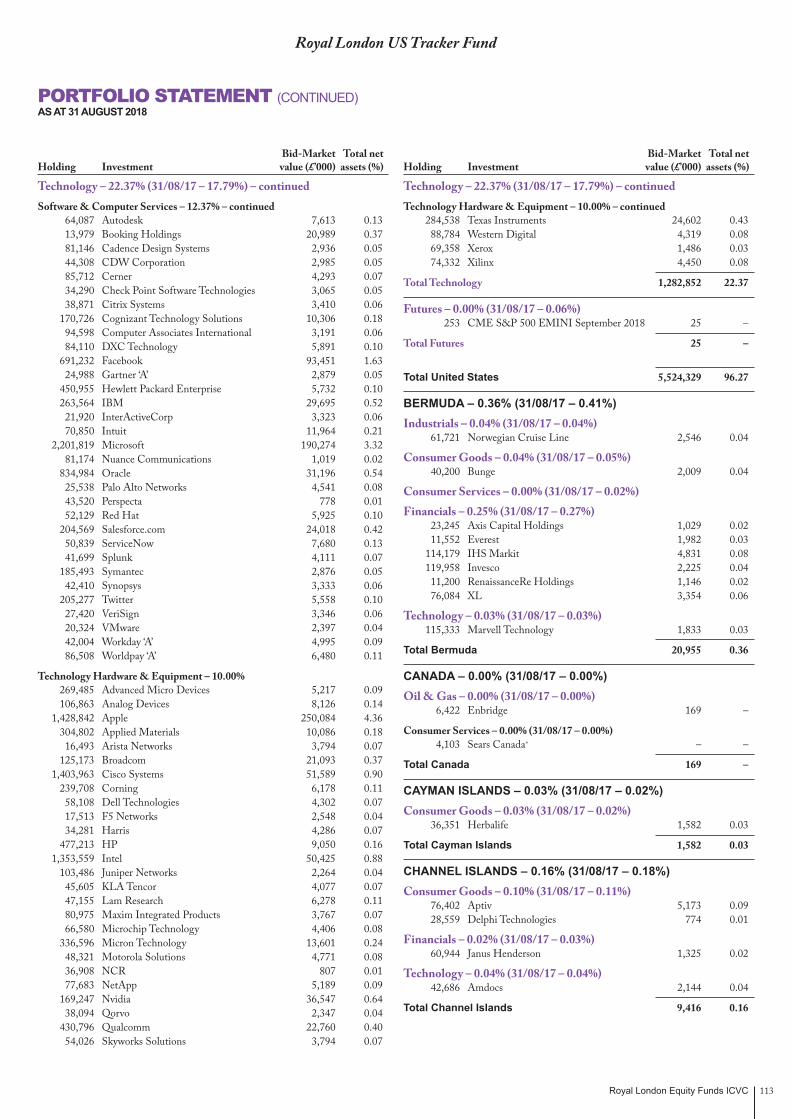
Royal London Equity Funds ICVC 113
Royal London US Tracker Fund
Technology – 22.37% (31/08/17 – 17.79%) – continued Software & Computer Services – 12.37% – continued 64,087 Autodesk 7,613 0.13 13,979 Booking Holdings 20,989 0.37 81,146 Cadence Design Systems 2,936 0.05 44,308 CDW Corporation 2,985 0.05 85,712 Cerner 4,293 0.07 34,290 Check Point Software Technologies 3,065 0.05 38,871 Citrix Systems 3,410 0.06 170,726 Cognizant Technology Solutions 10,306 0.18 94,598 Computer Associates International 3,191 0.06 84,110 DXC Technology 5,891 0.10 691,232 Facebook 93,451 1.63 24,988 Gartner ‘A’ 2,879 0.05 450,955 Hewlett Packard Enterprise 5,732 0.10 263,564 IBM 29,695 0.52 21,920 InterActiveCorp 3,323 0.06 70,850 Intuit 11,964 0.21 2,201,819 Microsoft 190,274 3.32 81,174 Nuance Communications 1,019 0.02 834,984 Oracle 31,196 0.54 25,538 Palo Alto Networks 4,541 0.08 43,520 Perspecta 778 0.01 52,129 Red Hat 5,925 0.10 204,569 Salesforce.com 24,018 0.42 50,839 ServiceNow 7,680 0.13 41,699 Splunk 4,111 0.07 185,493 Symantec 2,876 0.05 42,410 Synopsys 3,333 0.06 205,277 Twitter 5,558 0.10 27,420 VeriSign 3,346 0.06 20,324 VMware 2,397 0.04 42,004 Workday ‘A’ 4,995 0.09 86,508 Worldpay ‘A’ 6,480 0.11
Technology Hardware & Equipment – 10.00% 269,485 Advanced Micro Devices 5,217 0.09 106,863 Analog Devices 8,126 0.14 1,428,842 Apple 250,084 4.36 304,802 Applied Materials 10,086 0.18 16,493 Arista Networks 3,794 0.07 125,173 Broadcom 21,093 0.37 1,403,963 Cisco Systems 51,589 0.90 239,708 Corning 6,178 0.11 58,108 Dell Technologies 4,302 0.07 17,513 F5 Networks 2,548 0.04 34,281 Harris 4,286 0.07 477,213 HP 9,050 0.16 1,353,559 Intel 50,425 0.88 103,486 Juniper Networks 2,264 0.04 45,605 KLA Tencor 4,077 0.07 47,155 Lam Research 6,278 0.11 80,975 Maxim Integrated Products 3,767 0.07 66,580 Microchip Technology 4,406 0.08 336,596 Micron Technology 13,601 0.24 48,321 Motorola Solutions 4,771 0.08 36,908 NCR 807 0.01 77,683 NetApp 5,189 0.09 169,247 Nvidia 36,547 0.64 38,094 Qorvo 2,347 0.04 430,796 Qualcomm 22,760 0.40 54,026 Skyworks Solutions 3,794 0.07
Technology – 22.37% (31/08/17 – 17.79%) – continued Technology Hardware & Equipment – 10.00% – continued 284,538 Texas Instruments 24,602 0.43 88,784 Western Digital 4,319 0.08 69,358 Xerox 1,486 0.03 74,332 Xilinx 4,450 0.08
Total Technology 1,282,852 22.37
Futures – 0.00% (31/08/17 – 0.06%) 253 CME S&P 500 EMINI September 2018 25 –
Total Futures 25 –
Total United States 5,524,329 96.27
BERMUDA – 0.36% (31/08/17 – 0.41%) Industrials – 0.04% (31/08/17 – 0.04%) 61,721 Norwegian Cruise Line 2,546 0.04
Consumer Goods – 0.04% (31/08/17 – 0.05%) 40,200 Bunge 2,009 0.04
Consumer Services – 0.00% (31/08/17 – 0.02%) Financials – 0.25% (31/08/17 – 0.27%) 23,245 Axis Capital Holdings 1,029 0.02 11,552 Everest 1,982 0.03 114,179 IHS Markit 4,831 0.08 119,958 Invesco 2,225 0.04 11,200 RenaissanceRe Holdings 1,146 0.02 76,084 XL 3,354 0.06
Technology – 0.03% (31/08/17 – 0.03%) 115,333 Marvell Technology 1,833 0.03
Total Bermuda 20,955 0.36
CANADA – 0.00% (31/08/17 – 0.00%) Oil & Gas – 0.00% (31/08/17 – 0.00%) 6,422 Enbridge 169 –
Consumer Services – 0.00% (31/08/17 – 0.00%) 4,103 Sears Canada+ – –
Total Canada 169 –
CAYMAN ISLANDS – 0.03% (31/08/17 – 0.02%) Consumer Goods – 0.03% (31/08/17 – 0.02%) 36,351 Herbalife 1,582 0.03
Total Cayman Islands 1,582 0.03
CHANNEL ISLANDS – 0.16% (31/08/17 – 0.18%) Consumer Goods – 0.10% (31/08/17 – 0.11%) 76,402 Aptiv 5,173 0.09 28,559 Delphi Technologies 774 0.01
Financials – 0.02% (31/08/17 – 0.03%) 60,944 Janus Henderson 1,325 0.02
Technology – 0.04% (31/08/17 – 0.04%) 42,686 Amdocs 2,144 0.04
Total Channel Islands 9,416 0.16
Bid-Market Total net Holding Investment value (£’000) assets (%)
Bid-Market Total net Holding Investment value (£’000) assets (%)
PORTFOLIO STATEMENT (CONTINUED)AS AT 31 AUGUST 2018
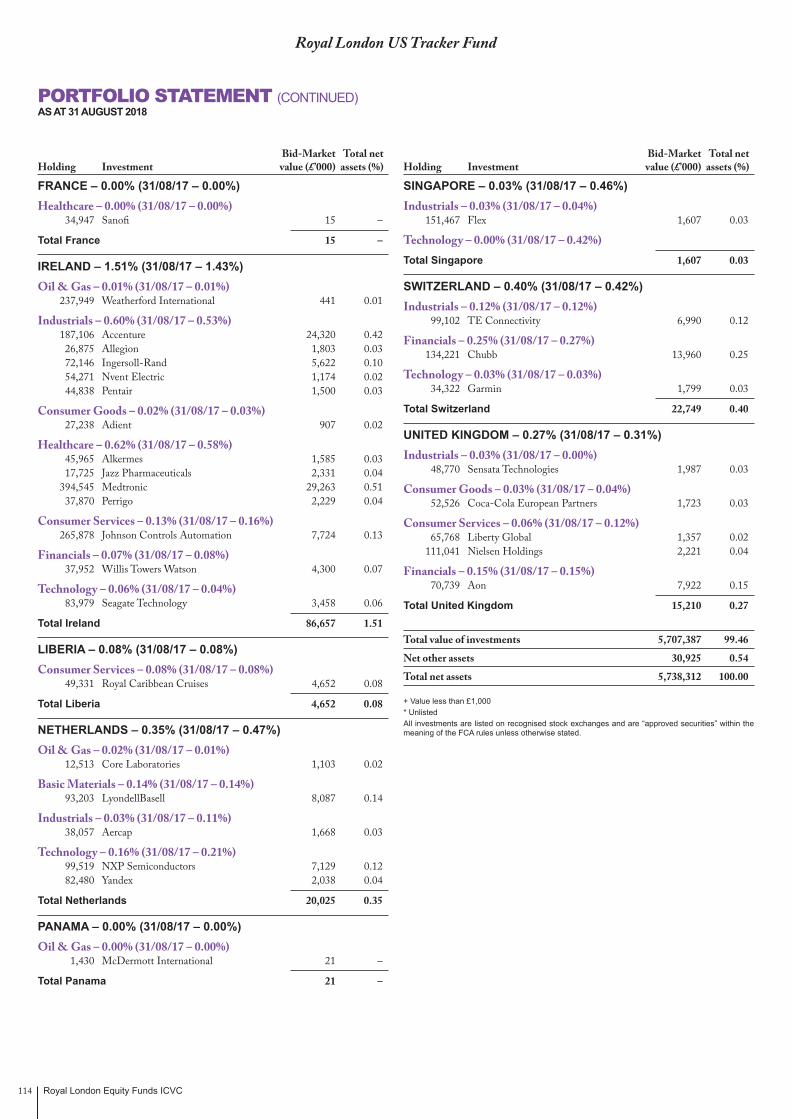
Royal London Equity Funds ICVC114
Royal London US Tracker Fund
FRANCE – 0.00% (31/08/17 – 0.00%) Healthcare – 0.00% (31/08/17 – 0.00%) 34,947 Sanofi 15 –
Total France 15 –
IRELAND – 1.51% (31/08/17 – 1.43%) Oil & Gas – 0.01% (31/08/17 – 0.01%) 237,949 Weatherford International 441 0.01
Industrials – 0.60% (31/08/17 – 0.53%) 187,106 Accenture 24,320 0.42 26,875 Allegion 1,803 0.03 72,146 Ingersoll-Rand 5,622 0.10 54,271 Nvent Electric 1,174 0.02 44,838 Pentair 1,500 0.03
Consumer Goods – 0.02% (31/08/17 – 0.03%) 27,238 Adient 907 0.02
Healthcare – 0.62% (31/08/17 – 0.58%) 45,965 Alkermes 1,585 0.03 17,725 Jazz Pharmaceuticals 2,331 0.04 394,545 Medtronic 29,263 0.51 37,870 Perrigo 2,229 0.04
Consumer Services – 0.13% (31/08/17 – 0.16%) 265,878 Johnson Controls Automation 7,724 0.13
Financials – 0.07% (31/08/17 – 0.08%) 37,952 Willis Towers Watson 4,300 0.07
Technology – 0.06% (31/08/17 – 0.04%) 83,979 Seagate Technology 3,458 0.06
Total Ireland 86,657 1.51
LIBERIA – 0.08% (31/08/17 – 0.08%) Consumer Services – 0.08% (31/08/17 – 0.08%) 49,331 Royal Caribbean Cruises 4,652 0.08
Total Liberia 4,652 0.08
NETHERLANDS – 0.35% (31/08/17 – 0.47%) Oil & Gas – 0.02% (31/08/17 – 0.01%) 12,513 Core Laboratories 1,103 0.02
Basic Materials – 0.14% (31/08/17 – 0.14%) 93,203 LyondellBasell 8,087 0.14
Industrials – 0.03% (31/08/17 – 0.11%) 38,057 Aercap 1,668 0.03
Technology – 0.16% (31/08/17 – 0.21%) 99,519 NXP Semiconductors 7,129 0.12 82,480 Yandex 2,038 0.04
Total Netherlands 20,025 0.35
PANAMA – 0.00% (31/08/17 – 0.00%) Oil & Gas – 0.00% (31/08/17 – 0.00%) 1,430 McDermott International 21 –
Total Panama 21 –
SINGAPORE – 0.03% (31/08/17 – 0.46%) Industrials – 0.03% (31/08/17 – 0.04%) 151,467 Flex 1,607 0.03
Technology – 0.00% (31/08/17 – 0.42%) Total Singapore 1,607 0.03
SWITZERLAND – 0.40% (31/08/17 – 0.42%) Industrials – 0.12% (31/08/17 – 0.12%) 99,102 TE Connectivity 6,990 0.12
Financials – 0.25% (31/08/17 – 0.27%) 134,221 Chubb 13,960 0.25
Technology – 0.03% (31/08/17 – 0.03%) 34,322 Garmin 1,799 0.03
Total Switzerland 22,749 0.40
UNITED KINGDOM – 0.27% (31/08/17 – 0.31%) Industrials – 0.03% (31/08/17 – 0.00%) 48,770 Sensata Technologies 1,987 0.03
Consumer Goods – 0.03% (31/08/17 – 0.04%) 52,526 Coca-Cola European Partners 1,723 0.03
Consumer Services – 0.06% (31/08/17 – 0.12%) 65,768 Liberty Global 1,357 0.02 111,041 Nielsen Holdings 2,221 0.04
Financials – 0.15% (31/08/17 – 0.15%) 70,739 Aon 7,922 0.15
Total United Kingdom 15,210 0.27
Total value of investments 5,707,387 99.46
Net other assets 30,925 0.54
Total net assets 5,738,312 100.00
+ Value less than £1,000* UnlistedAll investments are listed on recognised stock exchanges and are “approved securities” within the meaning of the FCA rules unless otherwise stated.
Bid-Market Total net Holding Investment value (£’000) assets (%)
Bid-Market Total net Holding Investment value (£’000) assets (%)
PORTFOLIO STATEMENT (CONTINUED)AS AT 31 AUGUST 2018
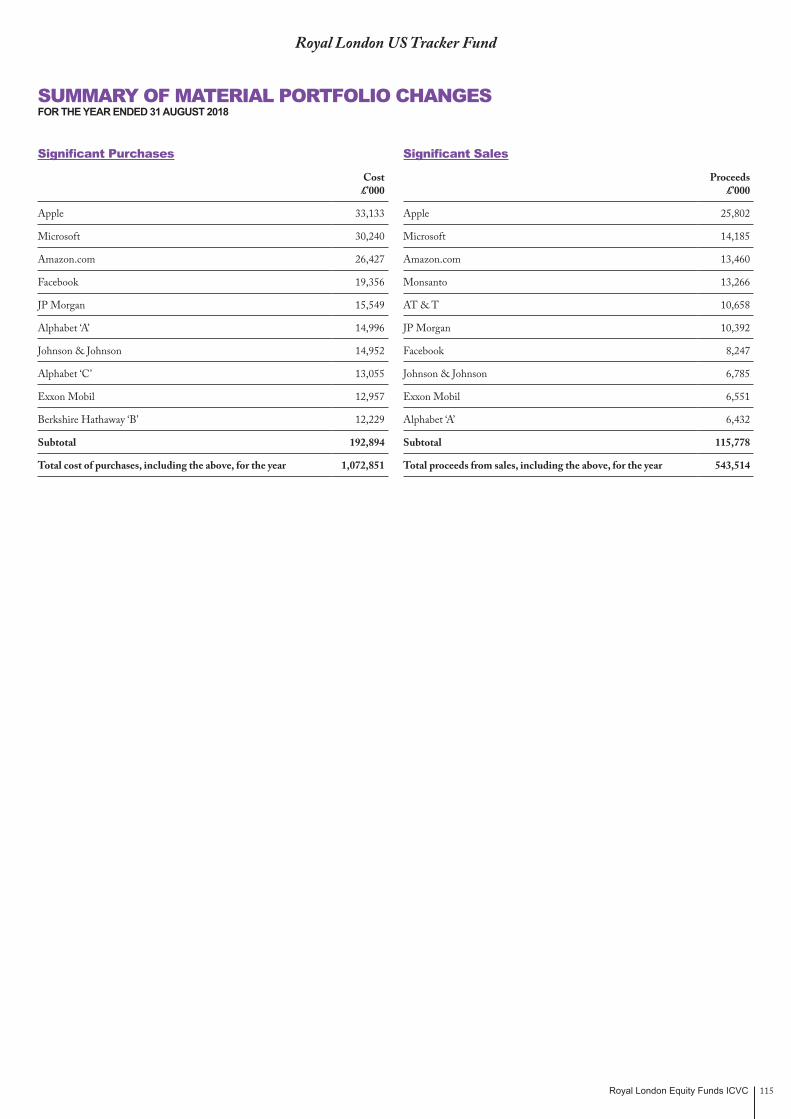
Royal London Equity Funds ICVC 115
Royal London US Tracker Fund
SUMMARY OF MATERIAL PORTFOLIO CHANGESFOR THE YEAR ENDED 31 AUGUST 2018
Significant Purchases
Cost £’000
Apple 33,133
Microsoft 30,240
Amazon.com 26,427
Facebook 19,356
JP Morgan 15,549
Alphabet ‘A’ 14,996
Johnson & Johnson 14,952
Alphabet ‘C’ 13,055
Exxon Mobil 12,957
Berkshire Hathaway ‘B’ 12,229
Subtotal 192,894
Total cost of purchases, including the above, for the year 1,072,851
Significant Sales
Proceeds £’000
Apple 25,802
Microsoft 14,185
Amazon.com 13,460
Monsanto 13,266
AT & T 10,658
JP Morgan 10,392
Facebook 8,247
Johnson & Johnson 6,785
Exxon Mobil 6,551
Alphabet ‘A’ 6,432
Subtotal 115,778
Total proceeds from sales, including the above, for the year 543,514
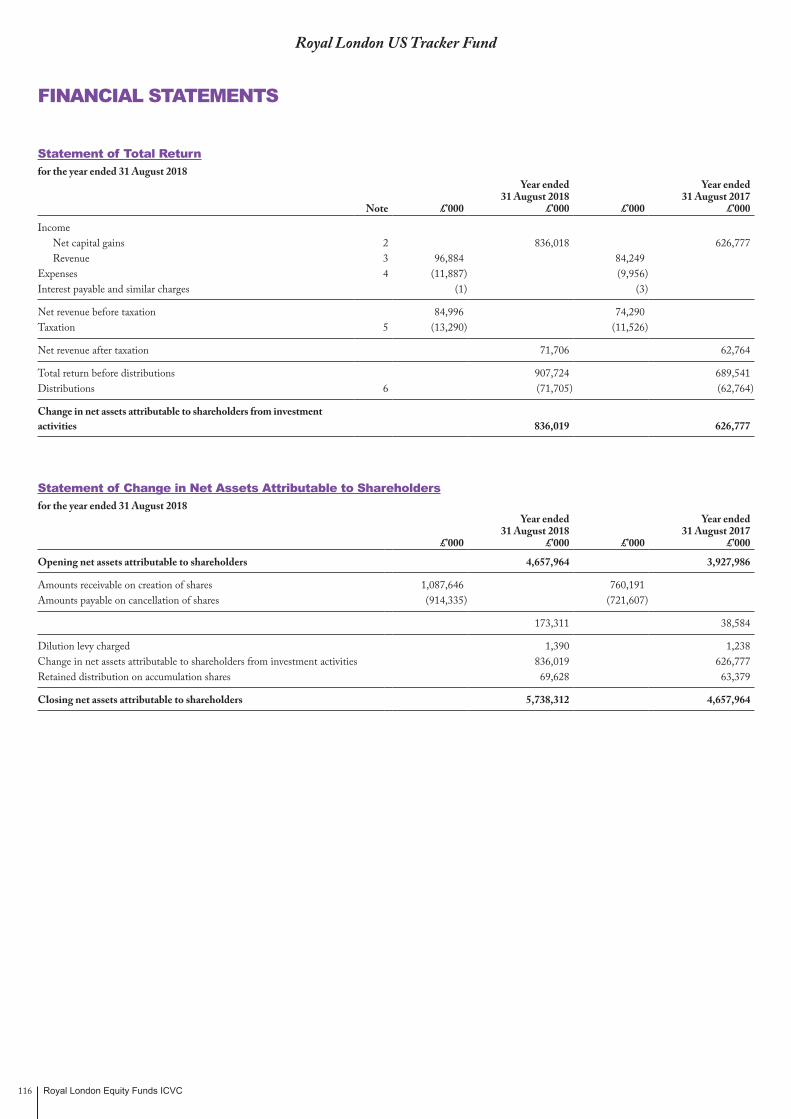
Royal London Equity Funds ICVC116
Royal London US Tracker Fund
FINANCIAL STATEMENTS
Statement of Total Returnfor the year ended 31 August 2018
Note £’000
Year ended31 August 2018
£’000 £’000
Year ended31 August 2017
£’000
Income Net capital gains 2 836,018 626,777 Revenue 3 96,884 84,249
Expenses 4 (11,887) (9,956)Interest payable and similar charges (1) (3)
Net revenue before taxation 84,996 74,290 Taxation 5 (13,290) (11,526)
Net revenue after taxation 71,706 62,764
Total return before distributions 907,724 689,541 Distributions 6 (71,705) (62,764)
Change in net assets attributable to shareholders from investment activities 836,019 626,777
Statement of Change in Net Assets Attributable to Shareholdersfor the year ended 31 August 2018
£’000
Year ended31 August 2018
£’000 £’000
Year ended31 August 2017
£’000
Opening net assets attributable to shareholders 4,657,964 3,927,986
Amounts receivable on creation of shares 1,087,646 760,191 Amounts payable on cancellation of shares (914,335) (721,607)
173,311 38,584
Dilution levy charged 1,390 1,238 Change in net assets attributable to shareholders from investment activities 836,019 626,777 Retained distribution on accumulation shares 69,628 63,379
Closing net assets attributable to shareholders 5,738,312 4,657,964
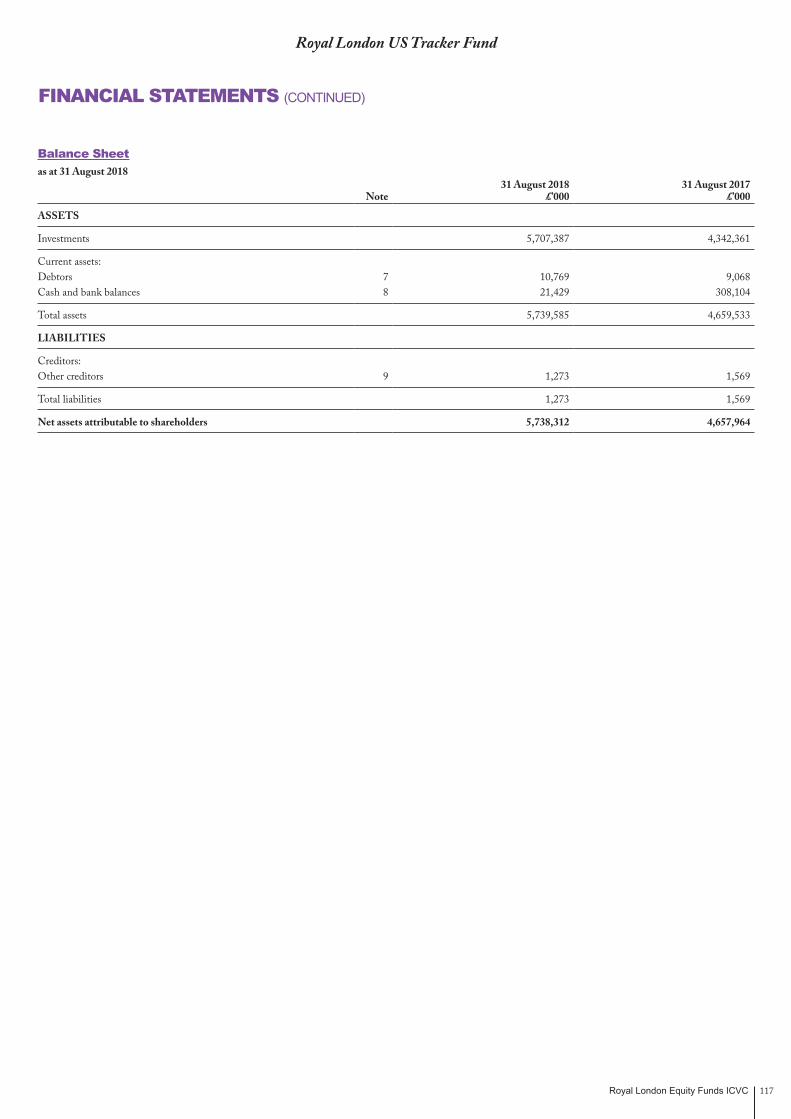
Royal London Equity Funds ICVC 117
Royal London US Tracker Fund
FINANCIAL STATEMENTS (CONTINUED)
Balance Sheetas at 31 August 2018
Note31 August 2018
£’00031 August 2017
£’000
ASSETS
Investments 5,707,387 4,342,361
Current assets:Debtors 7 10,769 9,068 Cash and bank balances 8 21,429 308,104
Total assets 5,739,585 4,659,533
LIABILITIES
Creditors:Other creditors 9 1,273 1,569
Total liabilities 1,273 1,569
Net assets attributable to shareholders 5,738,312 4,657,964

Royal London Equity Funds ICVC118
Royal London US Tracker Fund
NOTES TO THE FINANCIAL STATEMENTSFOR THE YEAR ENDED 31 AUGUST 2018
1. Accounting policiesThe accounting policies are set out in note 1 on page 8.
2. Net capital gains31 August 2018
£’00031 August 2017
£’000The net capital gains during the year comprise:
Non-derivative securities 842,503 593,450
Derivative securities 8,196 30,035
Currency (losses)/gains (14,628) 3,294
Activity fees (53) (2)
Net capital gains 836,018 626,777
3. Revenue31 August 2018
£’00031 August 2017
£’000UK dividends 502 410
Overseas dividends 94,104 82,355
Bank interest 1,621 1,011
Deposit interest 54 8
Stock lending income 603 465
Total revenue 96,884 84,249
4. Expenses31 August 2018
£’00031 August 2017
£’000Payable to the Authorised Corporate Director or associates of the Authorised Corporate Director and agents of either of them:
Authorised Corporate Director's fee 10,473 8,693
Payable to the Depositary, associates of the Depositary and agents of either of them:
Depositary's fee 267 275
Safe custody fees 472 392
739 667
Other expenses:
Registrar's fees 34 27
Audit fee 8 13
FTSE® licence fee 611 524
Service charges 19 20
Printing & stationery fee 2 3
Professional fee – 1
Legal fee 1 8
675 596
Total expenses 11,887 9,956

Royal London Equity Funds ICVC 119
5. Taxationa) Analysis of charge for the year
31 August 2018£’000
31 August 2017£’000
Irrecoverable overseas tax 13,290 11,526
Current tax charge for the year 13,290 11,526
b) Factors affecting the current tax charge for the yearThe tax assessed for the year is lower (31/08/17: lower) than the standard rate of corporation tax in the UK for an Open Ended Investment Company (20%).
The differences are explained below:
Net revenue before taxation 84,996 74,290
Corporation tax at 20% (31/08/17: 20%) 16,999 14,858
Effects of:
Revenue not subject to taxation (18,028) (15,984)
Current year management expenses not utilised 1,161 1,211
Irrecoverable overseas tax 13,290 11,526
Tax relief on overseas tax suffered (132) (85)
Current tax charge for the year 13,290 11,526
Authorised Open Ended Investment Companies are exempt from UK tax on capital gains, therefore any capital gains/(losses) are not included in the reconciliation above.
c) Provision for deferred taxThere was no provision required for deferred tax at the balance sheet date (31/08/17: same).
d) Factors that may affect future tax chargesAt the year end, there is a potential deferred tax asset of £6,316,000 (31/08/17: £5,155,000) in relation to surplus management expenses. It is unlikely the Fund will generate sufficient taxable profits in the future to utilise these expenses and therefore no deferred tax asset has been recognised in the year.
6. DistributionsThe distributions take account of income received on the issue of shares and income deducted on the cancellation of shares and comprise:
31 August 2018 £’000
31 August 2017 £’000
Accumulation shares
Final 69,628 63,379
69,628 63,379
Add: Amounts deducted on cancellation of shares 7,742 4,351
Deduct: Amounts received on the creation of shares (5,665) (4,966)
Net distributions for the year 71,705 62,764
The difference between the net revenue after taxation and the distribution paid is as follows:
Net revenue after taxation 71,706 62,764
Movement in income carried forward (1) –
Net distributions for the year 71,705 62,764
Details of the distribution per share are set out on page 124.
Royal London US Tracker Fund
NOTES TO THE FINANCIAL STATEMENTS (CONTINUED)FOR THE YEAR ENDED 31 AUGUST 2018
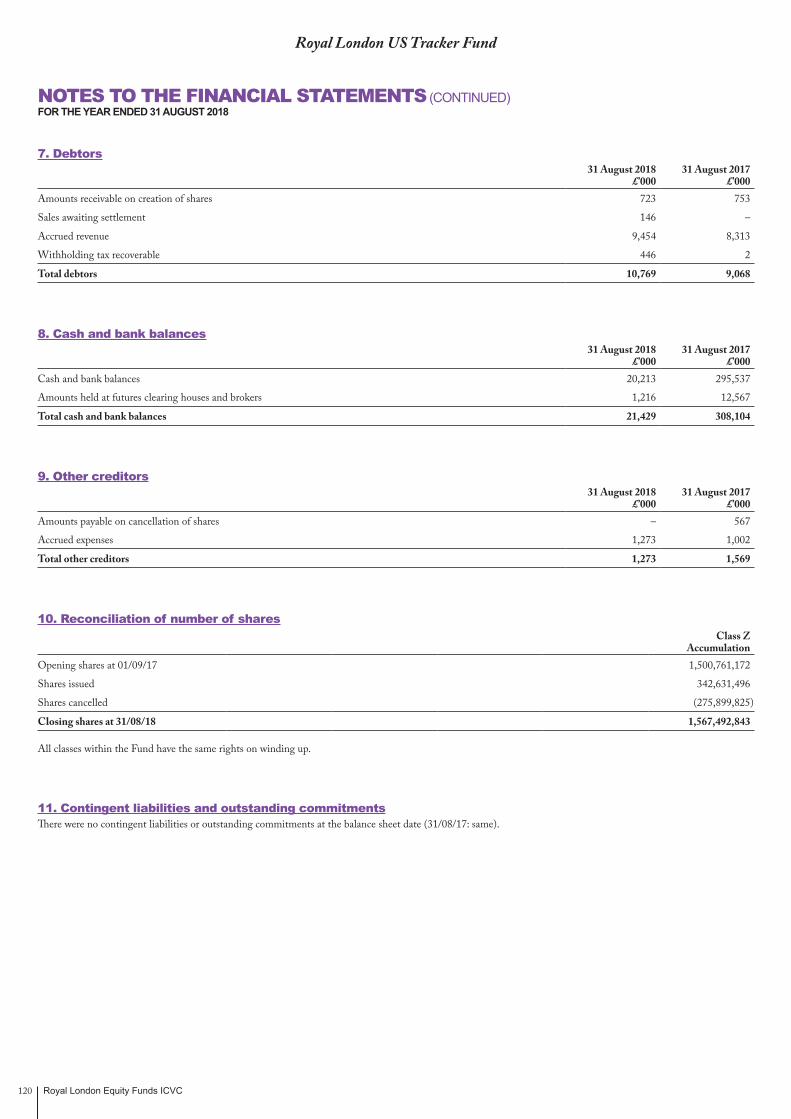
Royal London Equity Funds ICVC120
Royal London US Tracker Fund
NOTES TO THE FINANCIAL STATEMENTS (CONTINUED)FOR THE YEAR ENDED 31 AUGUST 2018
7. Debtors31 August 2018
£’00031 August 2017
£’000Amounts receivable on creation of shares 723 753
Sales awaiting settlement 146 –
Accrued revenue 9,454 8,313
Withholding tax recoverable 446 2
Total debtors 10,769 9,068
8. Cash and bank balances31 August 2018
£’00031 August 2017
£’000Cash and bank balances 20,213 295,537
Amounts held at futures clearing houses and brokers 1,216 12,567
Total cash and bank balances 21,429 308,104
9. Other creditors31 August 2018
£’00031 August 2017
£’000Amounts payable on cancellation of shares – 567
Accrued expenses 1,273 1,002
Total other creditors 1,273 1,569
10. Reconciliation of number of sharesClass Z
Accumulation Opening shares at 01/09/17 1,500,761,172
Shares issued 342,631,496
Shares cancelled (275,899,825)
Closing shares at 31/08/18 1,567,492,843
All classes within the Fund have the same rights on winding up.
11. Contingent liabilities and outstanding commitmentsThere were no contingent liabilities or outstanding commitments at the balance sheet date (31/08/17: same).

Royal London Equity Funds ICVC 121
12. Related party transactionsThe Fund’s Authorised Corporate Director, Royal London Unit Trust Managers Limited, is a related party to the Fund as defined by Financial Reporting Standard 102 ‘Related Party Disclosures’.
Authorised Corporate Director fees charged by Royal London Unit Trust Managers Limited are shown in note 4 and details of shares created and cancelled by Royal London Unit Trust Managers Limited are shown in the Statement of Change in Net Assets Attributable to Shareholders and note 6. At the year end the balance due to Royal London Unit Trust Managers Limited in respect of these transactions was £273,000 (31/08/17: £578,000).
At the year end, 31 August 2018, 97.70% (31/08/17: 90.21%) of the shares in issue were held by The Royal London Mutual Insurance Society Limited. Royal London Unit Trust Managers Limited is a wholly owned subsidiary of The Royal London Mutual Insurance Society Limited.
13. Stock lending activitiesThe Fund carried out stock lending activities for the purpose of efficient portfolio management and in order to generate income. Revenue earned from these activities is shown in note 3 and is net of bank and agents fees amounting to £151,000 (Gross: £754,000) (31/08/17: £116,000 (Gross: £581,000)) payable to HSBC Bank plc.
The value of stock on loan at the balance sheet date was £478,274,000 (31/08/17: £403,425,000).
The collateral held by asset type at the year end is stated below:
Asset class
31 August 2018 Collateral Held
£’000
31 August 2017 Collateral Held
£’000Equities 414,667 366,952
Bonds 106,828 61,831
The aggregate value of collateral held at the balance sheet date was £521,495,000 (31/08/17: £428,783,000). Collateral may be in the form of cash, UK gilts, certificates of deposit, treasury bills, sovereign debt, eurosterling bonds and equities; where the ACD approves the asset it will be held to reduce counterparty exposure. The value of the collateral held is greater than the value of the securities on loan and is monitored as part of the efficient portfolio management process.
The counterparties at the year end were Bank of Nova Scotia, Credit Suisse Dublin Branch, Credit Suisse Securities (Europe) Limited, HSBC Bank, JP Morgan Securities, Natixis, Societe Generale and UBS AG.
14. Financial derivativesThe Fund has used financial derivatives for hedging and meeting investment objectives including risk reduction and implementation of investment policies. The use of derivatives can create additional counterparty risks. Details of the policy adopted by the ACD for managing counterparty and other risks are set out in the Notes to the Financial Statements.
The types of derivatives held at the year end were index futures which are not classed as OTC derivatives and hence, no counterparty exposure has been disclosed.
Details of the individual contracts are shown on the portfolio statement on pages 108 to 114.
Royal London US Tracker Fund
NOTES TO THE FINANCIAL STATEMENTS (CONTINUED)FOR THE YEAR ENDED 31 AUGUST 2018
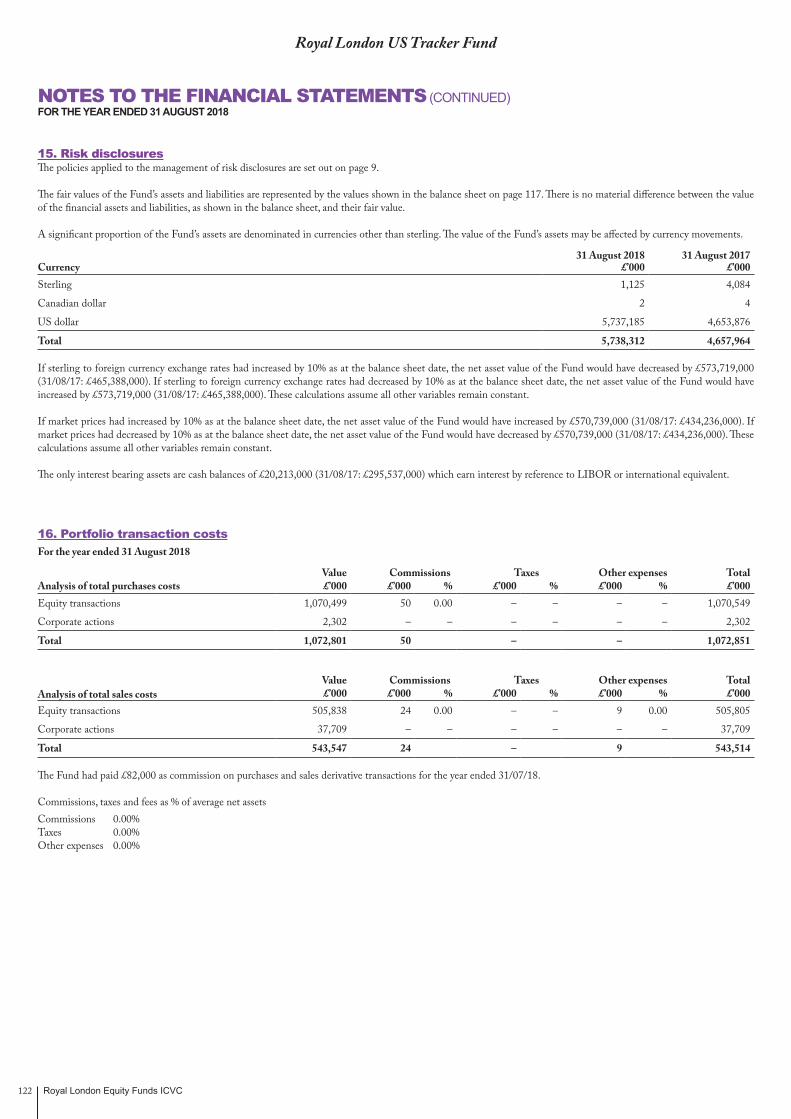
Royal London Equity Funds ICVC122
Royal London US Tracker Fund
NOTES TO THE FINANCIAL STATEMENTS (CONTINUED)FOR THE YEAR ENDED 31 AUGUST 2018
15. Risk disclosuresThe policies applied to the management of risk disclosures are set out on page 9.
The fair values of the Fund’s assets and liabilities are represented by the values shown in the balance sheet on page 117. There is no material difference between the value of the financial assets and liabilities, as shown in the balance sheet, and their fair value.
A significant proportion of the Fund’s assets are denominated in currencies other than sterling. The value of the Fund’s assets may be affected by currency movements.
Currency31 August 2018
£’00031 August 2017
£’000Sterling 1,125 4,084
Canadian dollar 2 4
US dollar 5,737,185 4,653,876
Total 5,738,312 4,657,964
If sterling to foreign currency exchange rates had increased by 10% as at the balance sheet date, the net asset value of the Fund would have decreased by £573,719,000 (31/08/17: £465,388,000). If sterling to foreign currency exchange rates had decreased by 10% as at the balance sheet date, the net asset value of the Fund would have increased by £573,719,000 (31/08/17: £465,388,000). These calculations assume all other variables remain constant.
If market prices had increased by 10% as at the balance sheet date, the net asset value of the Fund would have increased by £570,739,000 (31/08/17: £434,236,000). If market prices had decreased by 10% as at the balance sheet date, the net asset value of the Fund would have decreased by £570,739,000 (31/08/17: £434,236,000). These calculations assume all other variables remain constant.
The only interest bearing assets are cash balances of £20,213,000 (31/08/17: £295,537,000) which earn interest by reference to LIBOR or international equivalent.
16. Portfolio transaction costsFor the year ended 31 August 2018
Value Commissions Taxes Other expenses TotalAnalysis of total purchases costs £’000 £’000 % £’000 % £’000 % £’000Equity transactions 1,070,499 50 0.00 – – – – 1,070,549
Corporate actions 2,302 – – – – – – 2,302
Total 1,072,801 50 – – 1,072,851
Value Commissions Taxes Other expenses TotalAnalysis of total sales costs £’000 £’000 % £’000 % £’000 % £’000Equity transactions 505,838 24 0.00 – – 9 0.00 505,805
Corporate actions 37,709 – – – – – – 37,709
Total 543,547 24 – 9 543,514
The Fund had paid £82,000 as commission on purchases and sales derivative transactions for the year ended 31/07/18.
Commissions, taxes and fees as % of average net assetsCommissions 0.00%Taxes 0.00%Other expenses 0.00%

Royal London Equity Funds ICVC 123
Royal London US Tracker Fund
NOTES TO THE FINANCIAL STATEMENTS (CONTINUED)FOR THE YEAR ENDED 31 AUGUST 2018
16. Portfolio transaction costs – continuedFor the year ended 31 August 2017
Value Commissions Taxes Other expenses TotalAnalysis of total purchases costs £’000 £’000 % £’000 % £’000 % £’000Equity transactions 160,366 5 0.00 – – – – 160,371
Corporate actions 3,084 – – – – – – 3,084
Total 163,450 5 – – 163,455
Value Commissions Taxes Other expenses TotalAnalysis of total sales costs £’000 £’000 % £’000 % £’000 % £’000Equity transactions 61,734 3 0.00 – – 1 0.00 61,730
Corporate actions 36,128 – – – – – – 36,128
Total 97,862 3 – 1 97,858
The Fund had paid £74,000 as commission on purchases and sales derivative transactions for the year ended 31/07/17.
Commissions, taxes and fees as % of average net assetsCommissions 0.00%Taxes 0.00%Other expenses 0.00%
At the balance sheet date the portfolio dealing spread was 0.02% (31/08/17: 0.02%). The Fund is single priced throughout the year and therefore the dealing spread is not indicative of the full year.
17. Fair value of investmentsThe fair values of the Fund’s assets and liabilities are represented by the values shown in the balance sheet. There is no material difference between the value of the financial assets and liabilities, as shown in the balance sheet, and their fair value.
The fair value of investments has been determined using the following hierarchy:
Category 1 The unadjusted quoted price in an active market for identical assets or liabilities that the entity can access at the measurement date.
Category 2 Inputs other than quoted prices included within Level 1 that are observable (i.e. developed using market data) for the asset or liability, either directly or indirectly.
Category 3 Inputs are unobservable (i.e. for which market data is unavailable) for the asset or liability.
For the year ended 31 August 2018 Category 1 2 3 TotalInvestments £’000 £’000 £’000 £’000
Equities 5,707,362 – – 5,707,362
Derivatives 25 – – 25
Total 5,707,387 – – 5,707,387
For the year ended 31 August 2017 Category 1 2 3 TotalInvestments £’000 £’000 £’000 £’000
Equities 4,339,638 – – 4,339,638
Derivatives 2,723 – – 2,723
Total 4,342,361 – – 4,342,361

Royal London Equity Funds ICVC124
DISTRIBUTION TABLEFOR THE YEAR ENDED 31 AUGUST 2018
Royal London US Tracker Fund
Distribution in pence per share
FINALGroup 1: Shares purchased prior to 1 September 2017Group 2: Shares purchased between 1 September 2017 and 31 August 2018
Distribution DistributionNet payable paid
Class Z Accumulation income Equalisation 31/10/18 31/10/17Group 1 4.4420 – 4.4420 4.2231Group 2 2.7579 1.6841 4.4420 4.2231
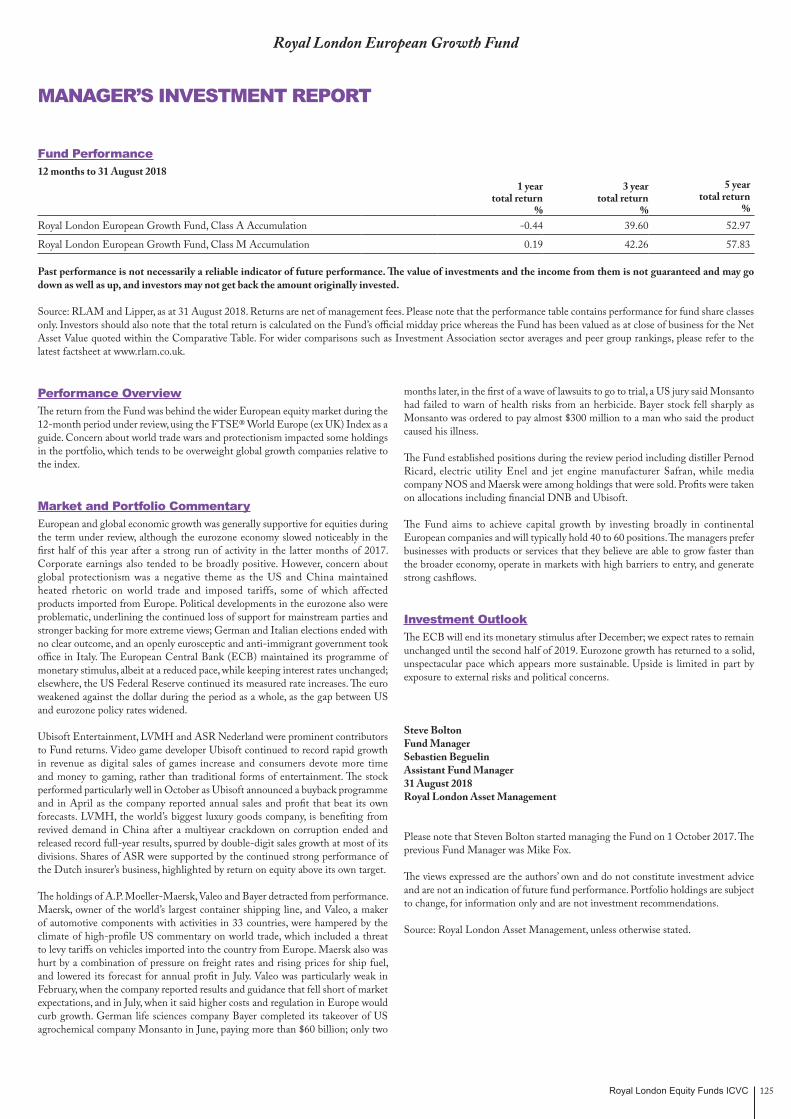
Royal London Equity Funds ICVC 125
Royal London European Growth Fund
Fund Performance12 months to 31 August 2018
1 year total return
%
3 year total return
%
5 year total return
%Royal London European Growth Fund, Class A Accumulation -0.44 39.60 52.97
Royal London European Growth Fund, Class M Accumulation 0.19 42.26 57.83
Past performance is not necessarily a reliable indicator of future performance. The value of investments and the income from them is not guaranteed and may go down as well as up, and investors may not get back the amount originally invested.
Source: RLAM and Lipper, as at 31 August 2018. Returns are net of management fees. Please note that the performance table contains performance for fund share classes only. Investors should also note that the total return is calculated on the Fund’s official midday price whereas the Fund has been valued as at close of business for the Net Asset Value quoted within the Comparative Table. For wider comparisons such as Investment Association sector averages and peer group rankings, please refer to the latest factsheet at www.rlam.co.uk.
Performance OverviewThe return from the Fund was behind the wider European equity market during the 12-month period under review, using the FTSE® World Europe (ex UK) Index as a guide. Concern about world trade wars and protectionism impacted some holdings in the portfolio, which tends to be overweight global growth companies relative to the index.
Market and Portfolio CommentaryEuropean and global economic growth was generally supportive for equities during the term under review, although the eurozone economy slowed noticeably in the first half of this year after a strong run of activity in the latter months of 2017. Corporate earnings also tended to be broadly positive. However, concern about global protectionism was a negative theme as the US and China maintained heated rhetoric on world trade and imposed tariffs, some of which affected products imported from Europe. Political developments in the eurozone also were problematic, underlining the continued loss of support for mainstream parties and stronger backing for more extreme views; German and Italian elections ended with no clear outcome, and an openly eurosceptic and anti-immigrant government took office in Italy. The European Central Bank (ECB) maintained its programme of monetary stimulus, albeit at a reduced pace, while keeping interest rates unchanged; elsewhere, the US Federal Reserve continued its measured rate increases. The euro weakened against the dollar during the period as a whole, as the gap between US and eurozone policy rates widened.
Ubisoft Entertainment, LVMH and ASR Nederland were prominent contributors to Fund returns. Video game developer Ubisoft continued to record rapid growth in revenue as digital sales of games increase and consumers devote more time and money to gaming, rather than traditional forms of entertainment. The stock performed particularly well in October as Ubisoft announced a buyback programme and in April as the company reported annual sales and profit that beat its own forecasts. LVMH, the world’s biggest luxury goods company, is benefiting from revived demand in China after a multiyear crackdown on corruption ended and released record full-year results, spurred by double-digit sales growth at most of its divisions. Shares of ASR were supported by the continued strong performance of the Dutch insurer’s business, highlighted by return on equity above its own target.
The holdings of A.P. Moeller-Maersk, Valeo and Bayer detracted from performance. Maersk, owner of the world’s largest container shipping line, and Valeo, a maker of automotive components with activities in 33 countries, were hampered by the climate of high-profile US commentary on world trade, which included a threat to levy tariffs on vehicles imported into the country from Europe. Maersk also was hurt by a combination of pressure on freight rates and rising prices for ship fuel, and lowered its forecast for annual profit in July. Valeo was particularly weak in February, when the company reported results and guidance that fell short of market expectations, and in July, when it said higher costs and regulation in Europe would curb growth. German life sciences company Bayer completed its takeover of US agrochemical company Monsanto in June, paying more than $60 billion; only two
months later, in the first of a wave of lawsuits to go to trial, a US jury said Monsanto had failed to warn of health risks from an herbicide. Bayer stock fell sharply as Monsanto was ordered to pay almost $300 million to a man who said the product caused his illness.
The Fund established positions during the review period including distiller Pernod Ricard, electric utility Enel and jet engine manufacturer Safran, while media company NOS and Maersk were among holdings that were sold. Profits were taken on allocations including financial DNB and Ubisoft.
The Fund aims to achieve capital growth by investing broadly in continental European companies and will typically hold 40 to 60 positions. The managers prefer businesses with products or services that they believe are able to grow faster than the broader economy, operate in markets with high barriers to entry, and generate strong cashflows.
Investment OutlookThe ECB will end its monetary stimulus after December; we expect rates to remain unchanged until the second half of 2019. Eurozone growth has returned to a solid, unspectacular pace which appears more sustainable. Upside is limited in part by exposure to external risks and political concerns.
Steve Bolton Fund ManagerSebastien BeguelinAssistant Fund Manager31 August 2018Royal London Asset Management
Please note that Steven Bolton started managing the Fund on 1 October 2017. The previous Fund Manager was Mike Fox.
The views expressed are the authors’ own and do not constitute investment advice and are not an indication of future fund performance. Portfolio holdings are subject to change, for information only and are not investment recommendations.
Source: Royal London Asset Management, unless otherwise stated.
MANAGER’S INVESTMENT REPORT

Royal London Equity Funds ICVC126
Royal London European Growth Fund
COMPARATIVE TABLES
Class A Accumulation31/08/18 31/08/17 31/08/16
Change in net assets per share (p) (p) (p)
Opening net asset value per share 916.96 724.29 649.71
Return before operating charges* 2.22 203.19 83.02
Operating charges (11.65) (10.52) (8.44)
Return after operating charges* (9.43) 192.67 74.58
Distributions on accumulation shares (11.54) (10.25) (10.71)
Retained distributions on accumulation shares 11.54 10.25 10.71
Closing net asset value per share 907.53 916.96 724.29
* after direct transaction costs of: 1.09 1.38 0.51
Performance
Return after charges (1.03)% 26.60% 11.48%
Other information
Closing net asset value (£’000) 918,604 883,640 596,024
Closing number of shares 101,219,830 96,366,486 82,290,428
Operating charges 1.29% 1.29% 1.29%
Direct transaction costs 0.12% 0.17% 0.08%
Prices^
Highest share price 940.90 917.70 741.70
Lowest share price 838.10 712.20 580.60
Class M Accumulation31/08/18 31/08/17 31/08/16
Change in net assets per share (p) (p) (p)
Opening net asset value per share 959.78 753.37 671.54
Return before operating charges* 2.39 212.08 86.34
Operating charges (6.25) (5.67) (4.51)
Return after operating charges* (3.86) 206.41 81.83
Distributions on accumulation shares (18.04) (15.67) (15.65)
Retained distributions on accumulation shares 18.04 15.67 15.65
Closing net asset value per share 955.92 959.78 753.37
* after direct transaction costs of: 1.14 1.45 0.53
Performance
Return after charges (0.40)% 27.40% 12.19%
Other information
Closing net asset value (£’000) 3,838 3,009 1,579
Closing number of shares 401,507 313,572 209,523
Operating charges 0.66% 0.66% 0.66%
Direct transaction costs 0.12% 0.17% 0.08%
Prices^
Highest share price 985.90 960.40 771.30
Lowest share price 880.60 742.00 601.80
^ The high and low prices disclosed are the high and low prices for the accounting period and not the calendar year. The net asset value per share price is based on the net asset value in the published financial statements and may be different due to the prior year end accounting adjustments.
It should be remembered that past performance is not a reliable indicator of future performance and that the value of shares, and the income derived from them, can vary.
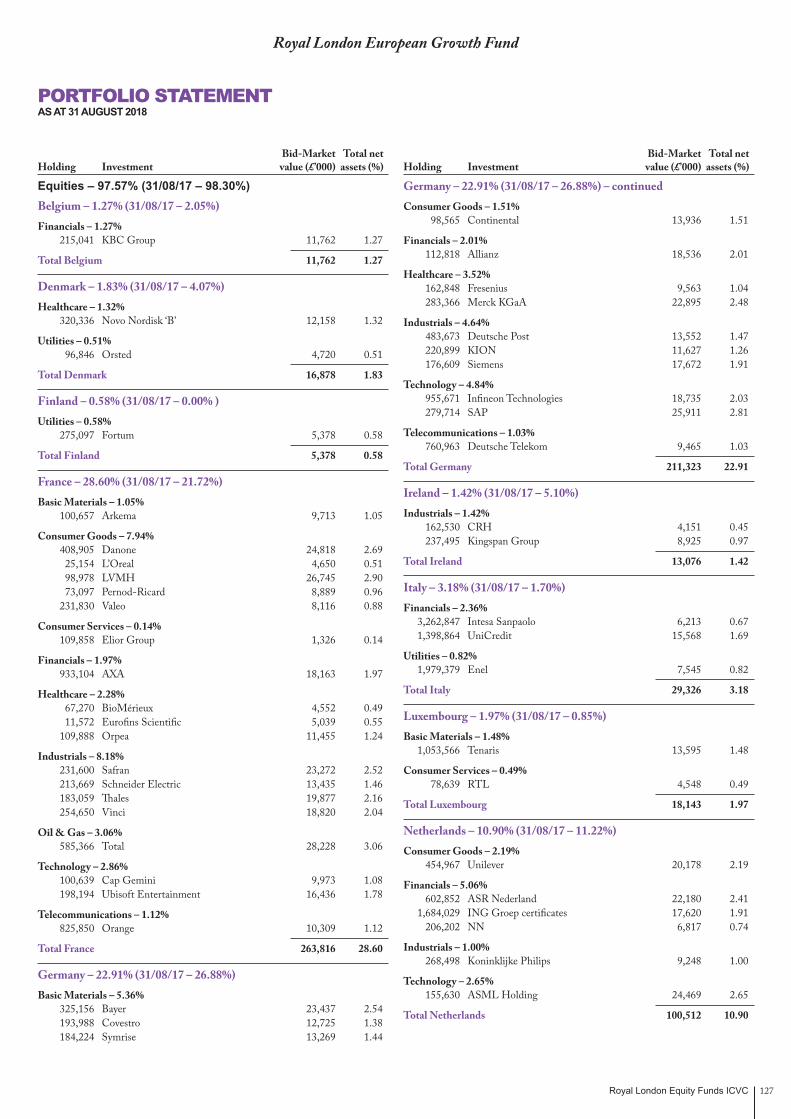
Royal London Equity Funds ICVC 127
Royal London European Growth Fund
Equities – 97.57% (31/08/17 – 98.30%) Belgium – 1.27% (31/08/17 – 2.05%) Financials – 1.27% 215,041 KBC Group 11,762 1.27
Total Belgium 11,762 1.27
Denmark – 1.83% (31/08/17 – 4.07%) Healthcare – 1.32% 320,336 Novo Nordisk ‘B’ 12,158 1.32
Utilities – 0.51% 96,846 Orsted 4,720 0.51
Total Denmark 16,878 1.83
Finland – 0.58% (31/08/17 – 0.00% ) Utilities – 0.58% 275,097 Fortum 5,378 0.58
Total Finland 5,378 0.58
France – 28.60% (31/08/17 – 21.72%) Basic Materials – 1.05% 100,657 Arkema 9,713 1.05
Consumer Goods – 7.94% 408,905 Danone 24,818 2.69 25,154 L’Oreal 4,650 0.51 98,978 LVMH 26,745 2.90 73,097 Pernod-Ricard 8,889 0.96 231,830 Valeo 8,116 0.88
Consumer Services – 0.14% 109,858 Elior Group 1,326 0.14
Financials – 1.97% 933,104 AXA 18,163 1.97
Healthcare – 2.28% 67,270 BioMérieux 4,552 0.49 11,572 Eurofins Scientific 5,039 0.55 109,888 Orpea 11,455 1.24
Industrials – 8.18% 231,600 Safran 23,272 2.52 213,669 Schneider Electric 13,435 1.46 183,059 Thales 19,877 2.16 254,650 Vinci 18,820 2.04
Oil & Gas – 3.06% 585,366 Total 28,228 3.06
Technology – 2.86% 100,639 Cap Gemini 9,973 1.08 198,194 Ubisoft Entertainment 16,436 1.78
Telecommunications – 1.12% 825,850 Orange 10,309 1.12
Total France 263,816 28.60
Germany – 22.91% (31/08/17 – 26.88%) Basic Materials – 5.36% 325,156 Bayer 23,437 2.54 193,988 Covestro 12,725 1.38 184,224 Symrise 13,269 1.44
Germany – 22.91% (31/08/17 – 26.88%) – continued Consumer Goods – 1.51% 98,565 Continental 13,936 1.51
Financials – 2.01% 112,818 Allianz 18,536 2.01
Healthcare – 3.52% 162,848 Fresenius 9,563 1.04 283,366 Merck KGaA 22,895 2.48
Industrials – 4.64% 483,673 Deutsche Post 13,552 1.47 220,899 KION 11,627 1.26 176,609 Siemens 17,672 1.91
Technology – 4.84% 955,671 Infineon Technologies 18,735 2.03 279,714 SAP 25,911 2.81
Telecommunications – 1.03% 760,963 Deutsche Telekom 9,465 1.03
Total Germany 211,323 22.91
Ireland – 1.42% (31/08/17 – 5.10%) Industrials – 1.42% 162,530 CRH 4,151 0.45 237,495 Kingspan Group 8,925 0.97
Total Ireland 13,076 1.42
Italy – 3.18% (31/08/17 – 1.70%) Financials – 2.36% 3,262,847 Intesa Sanpaolo 6,213 0.67 1,398,864 UniCredit 15,568 1.69
Utilities – 0.82% 1,979,379 Enel 7,545 0.82
Total Italy 29,326 3.18
Luxembourg – 1.97% (31/08/17 – 0.85%) Basic Materials – 1.48% 1,053,566 Tenaris 13,595 1.48
Consumer Services – 0.49% 78,639 RTL 4,548 0.49
Total Luxembourg 18,143 1.97
Netherlands – 10.90% (31/08/17 – 11.22%) Consumer Goods – 2.19% 454,967 Unilever 20,178 2.19
Financials – 5.06% 602,852 ASR Nederland 22,180 2.41 1,684,029 ING Groep certificates 17,620 1.91 206,202 NN 6,817 0.74
Industrials – 1.00% 268,498 Koninklijke Philips 9,248 1.00
Technology – 2.65% 155,630 ASML Holding 24,469 2.65
Total Netherlands 100,512 10.90
PORTFOLIO STATEMENTAS AT 31 AUGUST 2018
Bid-Market Total net Holding Investment value (£’000) assets (%)
Bid-Market Total net Holding Investment value (£’000) assets (%)

Royal London Equity Funds ICVC128
Royal London European Growth Fund
PORTFOLIO STATEMENT (CONTINUED)AS AT 31 AUGUST 2018
Norway – 3.85% (31/08/17 – 2.67%) Consumer Goods – 1.04% 575,196 Marine Harvest 9,584 1.04
Financials – 1.50% 881,557 Den Norske Bank 13,853 1.50
Telecommunications – 1.31% 828,378 Telenor 12,049 1.31
Total Norway 35,486 3.85
Portugal – 2.87% (31/08/17 – 3.35%) Oil & Gas – 2.87% 1,701,882 Galp Energia SGPS 26,516 2.87
Total Portugal 26,516 2.87
Spain – 2.75% (31/08/17 – 4.65%) Financials – 1.28% 3,081,432 Banco Santander 11,823 1.28
Industrials – 1.47% 815,591 Ferrovial 13,598 1.47
Total Spain 25,421 2.75
Sweden – 1.62% (31/08/17 – 3.81%) Financials – 0.69% 685,163 Handelsbanken ‘A’ 6,396 0.69
Industrials – 0.93% 282,610 Assa Abloy ‘B’ 4,438 0.48 515,110 Epiroc ‘A’ 4,112 0.45
Total Sweden 14,946 1.62
Switzerland – 13.82% (31/08/17 – 10.23%) Basic Materials – 1.61% 129,636 Sika 14,810 1.61
Consumer Goods – 2.48% 353,602 Nestlé (registered) 22,887 2.48
Financials – 3.66% 29,988 Partners 18,143 1.97 1,292,823 UBS Group (registered) 15,561 1.69
Healthcare – 5.27% 339,192 Novartis (registered) 21,690 2.35 140,780 Roche Holding – participating 26,963 2.92
Industrials – 0.80% 21,171 Geberit 7,421 0.80
Total Switzerland 127,475 13.82
Total value of investments 900,058 97.57
Net other assets 22,384 2.43
Total net assets 922,442 100.00
All investments are listed on a recognised stock exchange and are “approved securities” within the meaning of the FCA rules unless otherwise stated.
Bid-Market Total net Holding Investment value (£’000) assets (%)
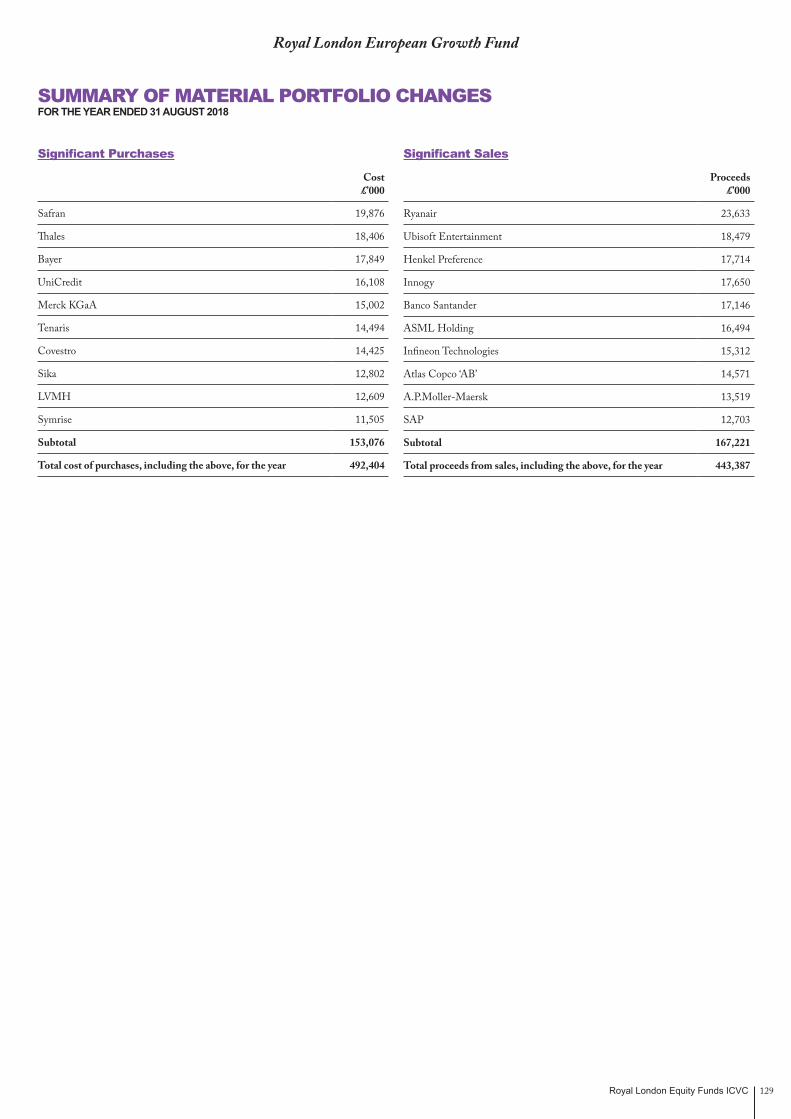
Royal London Equity Funds ICVC 129
Royal London European Growth Fund
SUMMARY OF MATERIAL PORTFOLIO CHANGESFOR THE YEAR ENDED 31 AUGUST 2018
Significant Purchases
Cost £’000
Safran 19,876
Thales 18,406
Bayer 17,849
UniCredit 16,108
Merck KGaA 15,002
Tenaris 14,494
Covestro 14,425
Sika 12,802
LVMH 12,609
Symrise 11,505
Subtotal 153,076
Total cost of purchases, including the above, for the year 492,404
Significant Sales
Proceeds £’000
Ryanair 23,633
Ubisoft Entertainment 18,479
Henkel Preference 17,714
Innogy 17,650
Banco Santander 17,146
ASML Holding 16,494
Infineon Technologies 15,312
Atlas Copco ‘AB’ 14,571
A.P.Moller-Maersk 13,519
SAP 12,703
Subtotal 167,221
Total proceeds from sales, including the above, for the year 443,387

Royal London Equity Funds ICVC130
Royal London European Growth Fund
FINANCIAL STATEMENTS
Statement of Total Returnfor the year ended 31 August 2018
Note £’000
Year ended31 August 2018
£’000 £’000
Year ended31 August 2017
£’000
Income Net capital (losses)/gains 2 (20,140) 161,858 Revenue 3 23,616 19,987
Expenses 4 (10,913) (9,279)Interest payable and similar charges – (1)
Net revenue before taxation 12,703 10,707 Taxation 5 (2,527) (1,426)
Net revenue after taxation 10,176 9,281
Total (deficit)/return before distributions (9,964) 171,139 Distributions 6 (10,176) (9,042)
Change in net assets attributable to shareholders from investment activities (20,140) 162,097
Statement of Change in Net Assets Attributable to Shareholdersfor the year ended 31 August 2018
£’000
Year ended31 August 2018
£’000 £’000
Year ended31 August 2017
£’000
Opening net assets attributable to shareholders 886,649 597,603
Amounts receivable on creation of shares 261,604 248,559 Amounts payable on cancellation of shares (217,639) (131,679)
43,965 116,880
Dilution levy charged 215 143 Change in net assets attributable to shareholders from investment activities (20,140) 162,097 Retained distributions on accumulation shares 11,753 9,926
Closing net assets attributable to shareholders 922,442 886,649
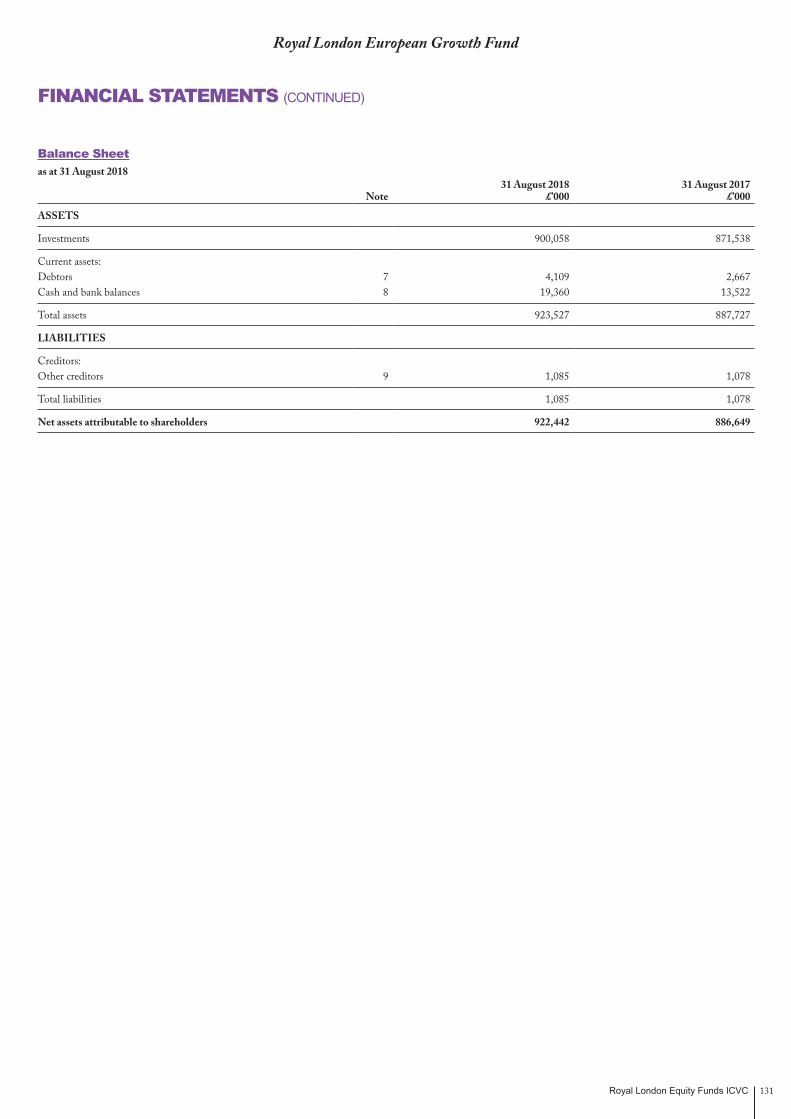
Royal London Equity Funds ICVC 131
Royal London European Growth Fund
FINANCIAL STATEMENTS (CONTINUED)
Balance Sheetas at 31 August 2018
Note31 August 2018
£’00031 August 2017
£’000
ASSETS
Investments 900,058 871,538
Current assets:Debtors 7 4,109 2,667 Cash and bank balances 8 19,360 13,522
Total assets 923,527 887,727
LIABILITIES
Creditors:Other creditors 9 1,085 1,078
Total liabilities 1,085 1,078
Net assets attributable to shareholders 922,442 886,649

Royal London Equity Funds ICVC132
Royal London European Growth Fund
NOTES TO THE FINANCIAL STATEMENTSFOR THE YEAR ENDED 31 AUGUST 2018
1. Accounting policiesThe accounting policies are set out in note 1 on page 8.
2. Net capital (losses)/gains31 August 2018
£’00031 August 2017
£’000The net capital (losses)/gains during the year comprise:
Non-derivative securities (20,497) 161,819
Currency gains 384 56
Activity fees (27) (17)
Net capital (losses)/gains (20,140) 161,858
3. Revenue31 August 2018
£’00031 August 2017
£’000Overseas dividends 23,449 19,706
Bank interest 34 4
Stock lending income 112 38
HMRC interest received 21 –
Stock dividends – 239
Total revenue 23,616 19,987
4. Expenses31 August 2018
£’00031 August 2017
£’000Payable to the Authorised Corporate Director or associates of the Authorised Corporate Director and agents of either of them:
Authorised Corporate Director's fee 10,594 8,997
Payable to the Depositary, associates of the Depositary and agents of either of them:
Depositary's fee 70 62
Safe custody fees 124 103
194 165
Other expenses:
Registrar's fees 111 100
Audit fee 10 10
Printing & stationery fee 3 4
Professional fee – 1
Legal fee 1 2
125 117
Total expenses 10,913 9,279
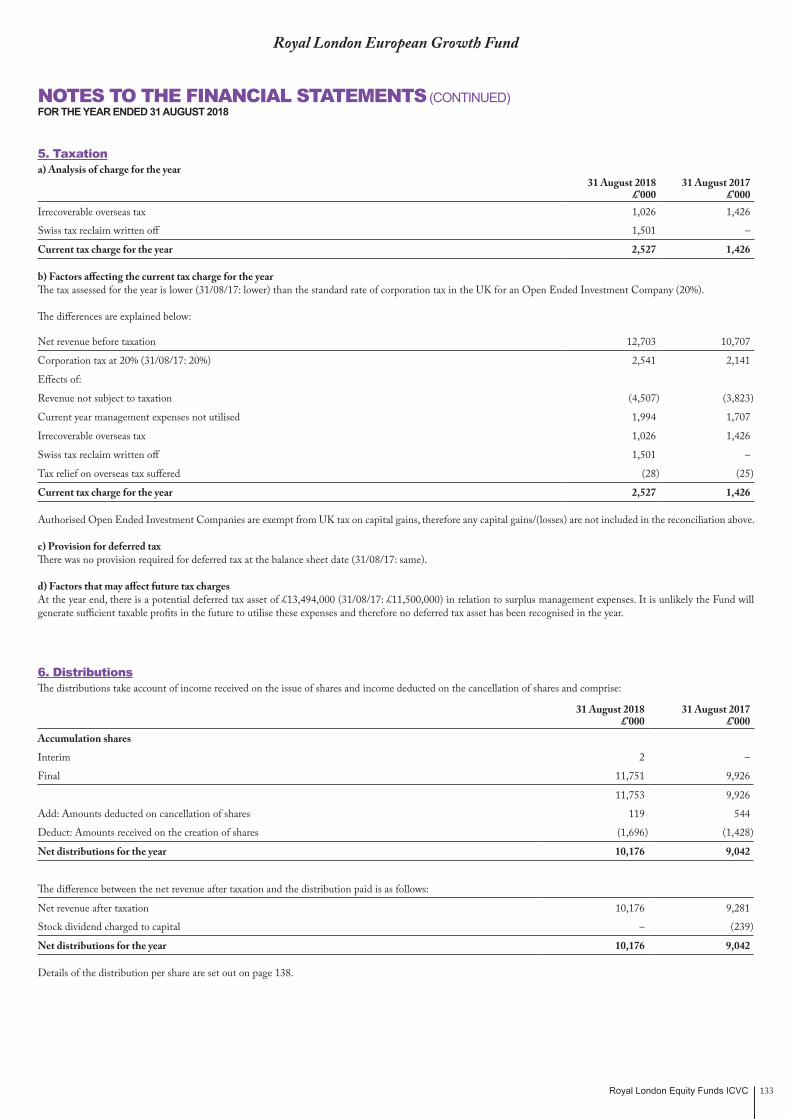
Royal London Equity Funds ICVC 133
5. Taxationa) Analysis of charge for the year
31 August 2018£’000
31 August 2017£’000
Irrecoverable overseas tax 1,026 1,426
Swiss tax reclaim written off 1,501 –
Current tax charge for the year 2,527 1,426
b) Factors affecting the current tax charge for the year The tax assessed for the year is lower (31/08/17: lower) than the standard rate of corporation tax in the UK for an Open Ended Investment Company (20%).
The differences are explained below:
Net revenue before taxation 12,703 10,707
Corporation tax at 20% (31/08/17: 20%) 2,541 2,141
Effects of:
Revenue not subject to taxation (4,507) (3,823)
Current year management expenses not utilised 1,994 1,707
Irrecoverable overseas tax 1,026 1,426
Swiss tax reclaim written off 1,501 –
Tax relief on overseas tax suffered (28) (25)
Current tax charge for the year 2,527 1,426
Authorised Open Ended Investment Companies are exempt from UK tax on capital gains, therefore any capital gains/(losses) are not included in the reconciliation above.
c) Provision for deferred taxThere was no provision required for deferred tax at the balance sheet date (31/08/17: same).
d) Factors that may affect future tax chargesAt the year end, there is a potential deferred tax asset of £13,494,000 (31/08/17: £11,500,000) in relation to surplus management expenses. It is unlikely the Fund will generate sufficient taxable profits in the future to utilise these expenses and therefore no deferred tax asset has been recognised in the year.
6. DistributionsThe distributions take account of income received on the issue of shares and income deducted on the cancellation of shares and comprise:
31 August 2018 £’000
31 August 2017 £’000
Accumulation shares
Interim 2 –
Final 11,751 9,926
11,753 9,926
Add: Amounts deducted on cancellation of shares 119 544
Deduct: Amounts received on the creation of shares (1,696) (1,428)
Net distributions for the year 10,176 9,042
The difference between the net revenue after taxation and the distribution paid is as follows:
Net revenue after taxation 10,176 9,281
Stock dividend charged to capital – (239)
Net distributions for the year 10,176 9,042
Details of the distribution per share are set out on page 138.
Royal London European Growth Fund
NOTES TO THE FINANCIAL STATEMENTS (CONTINUED)FOR THE YEAR ENDED 31 AUGUST 2018

Royal London Equity Funds ICVC134
Royal London European Growth Fund
NOTES TO THE FINANCIAL STATEMENTS (CONTINUED)FOR THE YEAR ENDED 31 AUGUST 2018
7. Debtors31 August 2018
£’00031 August 2017
£’000Amounts receivable on creation of shares 11 13
Sales awaiting settlement 2,654 –
Accrued revenue 403 193
Withholding tax recoverable 1,041 2,461
Total debtors 4,109 2,667
8. Cash and bank balances31 August 2018
£’00031 August 2017
£’000Cash and bank balances 19,360 13,522
Total cash and bank balances 19,360 13,522
9. Other creditors31 August 2018
£’00031 August 2017
£’000Amounts payable on cancellation of shares 20 63
Accrued expenses 1,065 1,015
Total other creditors 1,085 1,078
10. Reconciliation of number of sharesClass A
AccumulationClass M
AccumulationOpening shares at 01/09/17 96,366,486 313,572
Shares issued 28,952,680 131,856
Shares cancelled (24,090,298) (52,533)
Shares converted (9,038) 8,612
Closing shares at 31/08/18 101,219,830 401,507
All classes within the Fund have the same rights on winding up.
11. Contingent liabilities and outstanding commitmentsThere were no contingent liabilities or outstanding commitments at the balance sheet date (31/08/17: same).
12. Related party transactionsThe Fund’s Authorised Corporate Director, Royal London Unit Trust Managers Limited, is a related party to the Fund as defined by Financial Reporting Standard 102 ‘Related Party Disclosures’.
Authorised Corporate Director fees charged by Royal London Unit Trust Managers Limited are shown in note 4 and details of shares created and cancelled by Royal London Unit Trust Managers Limited are shown in the Statement of Change in Net Assets Attributable to Shareholders and note 6. At the year end the balance due to Royal London Unit Trust Managers Limited in respect of these transactions was £994,000 (31/08/17: £1,003,000).
At the year end, 31 August 2018, 93.66% (31/08/17: 93.05%) of the shares in issue were held by The Royal London Mutual Insurance Society Limited. Royal London Unit Trust Managers Limited is a wholly owned subsidiary of The Royal London Mutual Insurance Society Limited.

Royal London Equity Funds ICVC 135
13. Stock lending activitiesThe Fund carried out stock lending activities for the purpose of efficient portfolio management and in order to generate income. Revenue earned from these activities is shown in note 3 and is net of bank and agents fees amounting to £28,000 (Gross: £140,000) (31/08/17: £10,000 (Gross: £48,000)) payable to HSBC Bank plc.
The value of stock on loan at the balance sheet date was £26,782,000 (31/08/17: £89,248,000).
The collateral held by asset type at the year end is stated below:
Asset class
31 August 2018 Collateral Held
£’000
31 August 2017 Collateral Held
£’000Equities 14,530 53,124
Bonds 15,254 39,238
The aggregate value of collateral held at the balance sheet date was £29,784,000 (31/08/17: £92,362,000). Collateral may be in the form of cash, UK gilts, certificates of deposit, treasury bills, sovereign debt, eurosterling bonds and equities; where the ACD approves the asset it will be held to reduce counterparty exposure. The value of the collateral held is greater than the value of the securities on loan and is monitored as part of the efficient portfolio management process.
The counterparties at the year end were Morgan Stanley & Co International,Credit Suisse Securities (Europe) Limited,HSBC Bank,Natixis and Skandinaviska Enskilda Banken.
14. Risk disclosuresThe policies applied to the management of risk disclosures are set out on page 9.
The fair values of the Fund’s assets and liabilities are represented by the values shown in the balance sheet on page 131. There is no material difference between the value of the financial assets and liabilities, as shown in the balance sheet, and their fair value.
A significant proportion of the Fund’s assets are denominated in currencies other than sterling. The value of the Fund’s assets may be affected by currency movements.
Currency31 August 2018
£’00031 August 2017
£’000Sterling 5,055 12,097
Danish krone 20,301 36,272
Euro 714,566 688,937
Norwegian krone 38,398 23,659
Swedish krona 15,780 33,790
Swiss franc 128,101 91,892
Turkish lira 1 2
US dollar 240 –
Total 922,442 886,649
If sterling to foreign currency exchange rates had increased by 10% as at the balance sheet date, the net asset value of the Fund would have decreased by £91,739,000 (31/08/17: £87,455,000) If sterling to foreign currency exchange rates had decreased by 10% as at the balance sheet date, the net asset value of the Fund would have increased by £91,739,000 (31/08/17: £87,455,000). These calculations assume all other variables remain constant.
If market prices had increased by 10% as at the balance sheet date, the net asset value of the Fund would have increased by £90,006,000 (31/08/17: £87,154,000). If market prices had decreased by 10% as at the balance sheet date, the net asset value of the Fund would have decreased by £90,006,000 (31/08/17: £87,154,000). These calculations assume all other variables remain constant.
The only interest bearing assets are cash balances of £19,360,000 (31/08/17: £13,522,000) which earn interest by reference to LIBOR or international equivalent.
Royal London European Growth Fund
NOTES TO THE FINANCIAL STATEMENTS (CONTINUED)FOR THE YEAR ENDED 31 AUGUST 2018
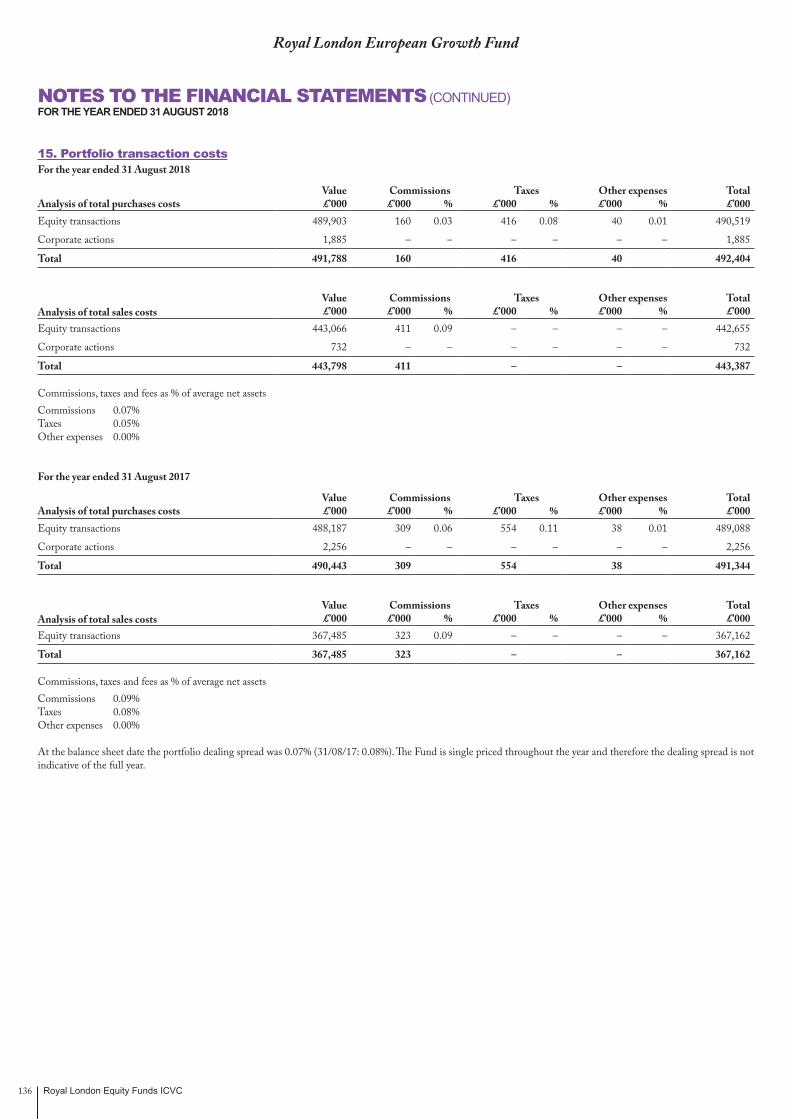
Royal London Equity Funds ICVC136
Royal London European Growth Fund
NOTES TO THE FINANCIAL STATEMENTS (CONTINUED)FOR THE YEAR ENDED 31 AUGUST 2018
15. Portfolio transaction costsFor the year ended 31 August 2018
Value Commissions Taxes Other expenses TotalAnalysis of total purchases costs £’000 £’000 % £’000 % £’000 % £’000Equity transactions 489,903 160 0.03 416 0.08 40 0.01 490,519
Corporate actions 1,885 – – – – – – 1,885
Total 491,788 160 416 40 492,404
Value Commissions Taxes Other expenses TotalAnalysis of total sales costs £’000 £’000 % £’000 % £’000 % £’000Equity transactions 443,066 411 0.09 – – – – 442,655
Corporate actions 732 – – – – – – 732
Total 443,798 411 – – 443,387
Commissions, taxes and fees as % of average net assetsCommissions 0.07%Taxes 0.05%Other expenses 0.00%
For the year ended 31 August 2017
Value Commissions Taxes Other expenses TotalAnalysis of total purchases costs £’000 £’000 % £’000 % £’000 % £’000Equity transactions 488,187 309 0.06 554 0.11 38 0.01 489,088
Corporate actions 2,256 – – – – – – 2,256
Total 490,443 309 554 38 491,344
Value Commissions Taxes Other expenses TotalAnalysis of total sales costs £’000 £’000 % £’000 % £’000 % £’000Equity transactions 367,485 323 0.09 – – – – 367,162
Total 367,485 323 – – 367,162
Commissions, taxes and fees as % of average net assetsCommissions 0.09%Taxes 0.08%Other expenses 0.00%
At the balance sheet date the portfolio dealing spread was 0.07% (31/08/17: 0.08%). The Fund is single priced throughout the year and therefore the dealing spread is not indicative of the full year.

Royal London Equity Funds ICVC 137
Royal London European Growth Fund
NOTES TO THE FINANCIAL STATEMENTS (CONTINUED)FOR THE YEAR ENDED 31 AUGUST 2018
16. Fair value of investmentsThe fair values of the Fund’s assets and liabilities are represented by the values shown in the balance sheet. There is no material difference between the value of the financial assets and liabilities, as shown in the balance sheet, and their fair value.
The fair value of investments has been determined using the following hierarchy:
Category 1 The unadjusted quoted price in an active market for identical assets or liabilities that the entity can access at the measurement date.
Category 2 Inputs other than quoted prices included within Level 1 that are observable (i.e. developed using market data) for the asset or liability, either directly or indirectly.
Category 3 Inputs are unobservable (i.e. for which market data is unavailable) for the asset or liability.
For the year ended 31 August 2018 Category 1 2 3 TotalInvestments £’000 £’000 £’000 £’000
Equities 900,058 – – 900,058
Total 900,058 – – 900,058
For the year ended 31 August 2017 Category 1 2 3 TotalInvestments £’000 £’000 £’000 £’000
Equities 871,538 – – 871,538
Total 871,538 – – 871,538
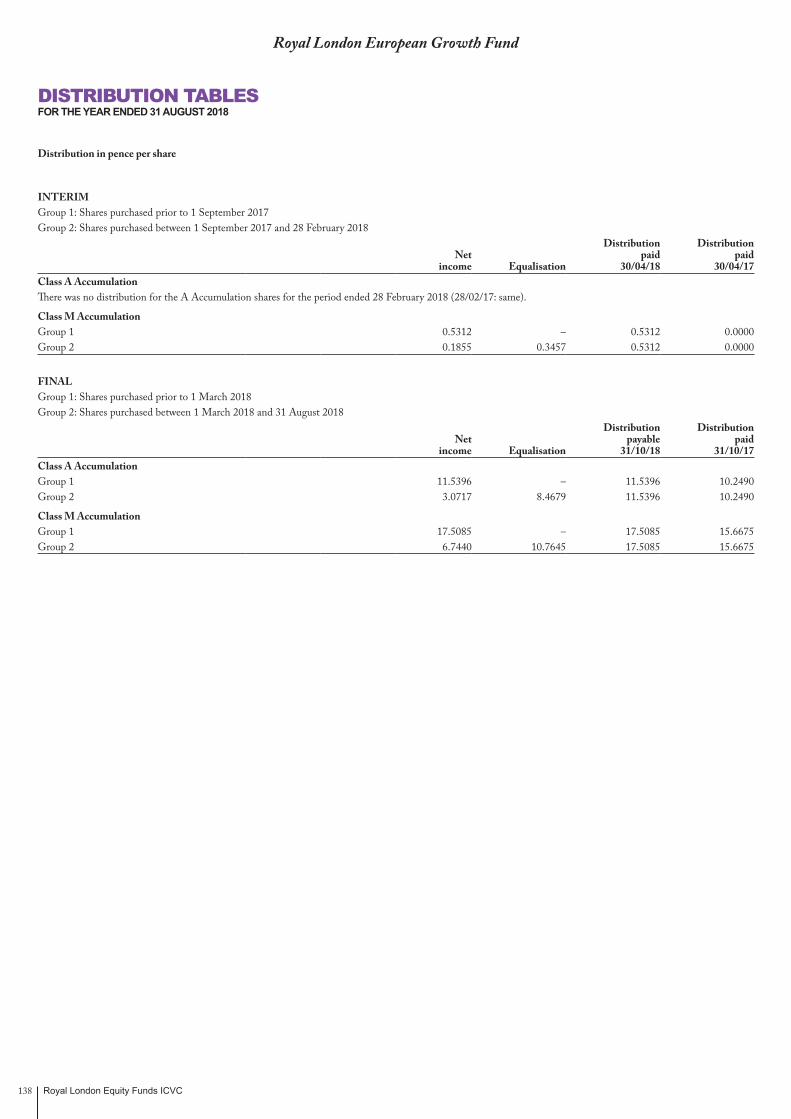
Royal London Equity Funds ICVC138
Royal London European Growth Fund
DISTRIBUTION TABLESFOR THE YEAR ENDED 31 AUGUST 2018
Distribution in pence per share
INTERIMGroup 1: Shares purchased prior to 1 September 2017Group 2: Shares purchased between 1 September 2017 and 28 February 2018
Distribution DistributionNet paid paid
income Equalisation 30/04/18 30/04/17Class A AccumulationThere was no distribution for the A Accumulation shares for the period ended 28 February 2018 (28/02/17: same).
Class M AccumulationGroup 1 0.5312 – 0.5312 0.0000Group 2 0.1855 0.3457 0.5312 0.0000
FINALGroup 1: Shares purchased prior to 1 March 2018Group 2: Shares purchased between 1 March 2018 and 31 August 2018
Distribution DistributionNet payable paid
income Equalisation 31/10/18 31/10/17Class A AccumulationGroup 1 11.5396 – 11.5396 10.2490Group 2 3.0717 8.4679 11.5396 10.2490
Class M AccumulationGroup 1 17.5085 – 17.5085 15.6675Group 2 6.7440 10.7645 17.5085 15.6675
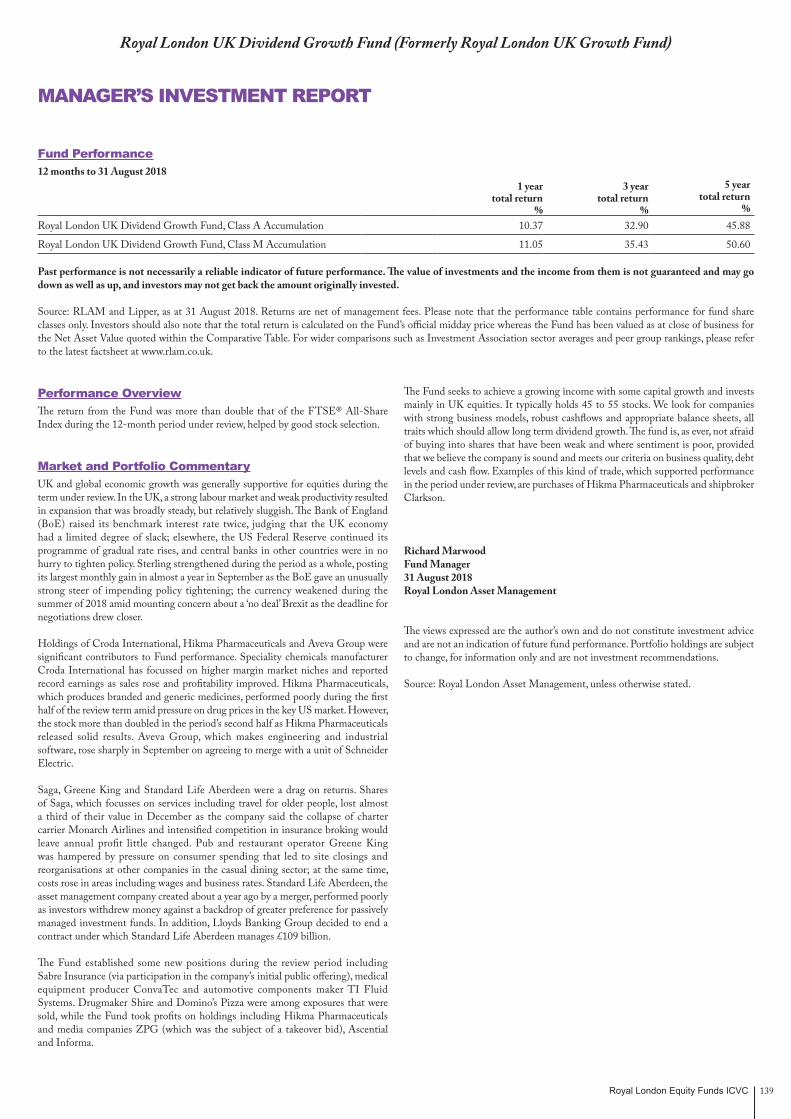
Royal London Equity Funds ICVC 139
Royal London UK Dividend Growth Fund (Formerly Royal London UK Growth Fund)
Fund Performance12 months to 31 August 2018
1 year total return
%
3 year total return
%
5 year total return
%Royal London UK Dividend Growth Fund, Class A Accumulation 10.37 32.90 45.88
Royal London UK Dividend Growth Fund, Class M Accumulation 11.05 35.43 50.60
Past performance is not necessarily a reliable indicator of future performance. The value of investments and the income from them is not guaranteed and may go down as well as up, and investors may not get back the amount originally invested.
Source: RLAM and Lipper, as at 31 August 2018. Returns are net of management fees. Please note that the performance table contains performance for fund share classes only. Investors should also note that the total return is calculated on the Fund’s official midday price whereas the Fund has been valued as at close of business for the Net Asset Value quoted within the Comparative Table. For wider comparisons such as Investment Association sector averages and peer group rankings, please refer to the latest factsheet at www.rlam.co.uk.
Performance OverviewThe return from the Fund was more than double that of the FTSE® All-Share Index during the 12-month period under review, helped by good stock selection.
Market and Portfolio CommentaryUK and global economic growth was generally supportive for equities during the term under review. In the UK, a strong labour market and weak productivity resulted in expansion that was broadly steady, but relatively sluggish. The Bank of England (BoE) raised its benchmark interest rate twice, judging that the UK economy had a limited degree of slack; elsewhere, the US Federal Reserve continued its programme of gradual rate rises, and central banks in other countries were in no hurry to tighten policy. Sterling strengthened during the period as a whole, posting its largest monthly gain in almost a year in September as the BoE gave an unusually strong steer of impending policy tightening; the currency weakened during the summer of 2018 amid mounting concern about a ‘no deal’ Brexit as the deadline for negotiations drew closer.
Holdings of Croda International, Hikma Pharmaceuticals and Aveva Group were significant contributors to Fund performance. Speciality chemicals manufacturer Croda International has focussed on higher margin market niches and reported record earnings as sales rose and profitability improved. Hikma Pharmaceuticals, which produces branded and generic medicines, performed poorly during the first half of the review term amid pressure on drug prices in the key US market. However, the stock more than doubled in the period’s second half as Hikma Pharmaceuticals released solid results. Aveva Group, which makes engineering and industrial software, rose sharply in September on agreeing to merge with a unit of Schneider Electric.
Saga, Greene King and Standard Life Aberdeen were a drag on returns. Shares of Saga, which focusses on services including travel for older people, lost almost a third of their value in December as the company said the collapse of charter carrier Monarch Airlines and intensified competition in insurance broking would leave annual profit little changed. Pub and restaurant operator Greene King was hampered by pressure on consumer spending that led to site closings and reorganisations at other companies in the casual dining sector; at the same time, costs rose in areas including wages and business rates. Standard Life Aberdeen, the asset management company created about a year ago by a merger, performed poorly as investors withdrew money against a backdrop of greater preference for passively managed investment funds. In addition, Lloyds Banking Group decided to end a contract under which Standard Life Aberdeen manages £109 billion.
The Fund established some new positions during the review period including Sabre Insurance (via participation in the company’s initial public offering), medical equipment producer ConvaTec and automotive components maker TI Fluid Systems. Drugmaker Shire and Domino’s Pizza were among exposures that were sold, while the Fund took profits on holdings including Hikma Pharmaceuticals and media companies ZPG (which was the subject of a takeover bid), Ascential and Informa.
The Fund seeks to achieve a growing income with some capital growth and invests mainly in UK equities. It typically holds 45 to 55 stocks. We look for companies with strong business models, robust cashflows and appropriate balance sheets, all traits which should allow long term dividend growth. The fund is, as ever, not afraid of buying into shares that have been weak and where sentiment is poor, provided that we believe the company is sound and meets our criteria on business quality, debt levels and cash flow. Examples of this kind of trade, which supported performance in the period under review, are purchases of Hikma Pharmaceuticals and shipbroker Clarkson.
Richard MarwoodFund Manager31 August 2018Royal London Asset Management
The views expressed are the author’s own and do not constitute investment advice and are not an indication of future fund performance. Portfolio holdings are subject to change, for information only and are not investment recommendations.
Source: Royal London Asset Management, unless otherwise stated.
MANAGER’S INVESTMENT REPORT
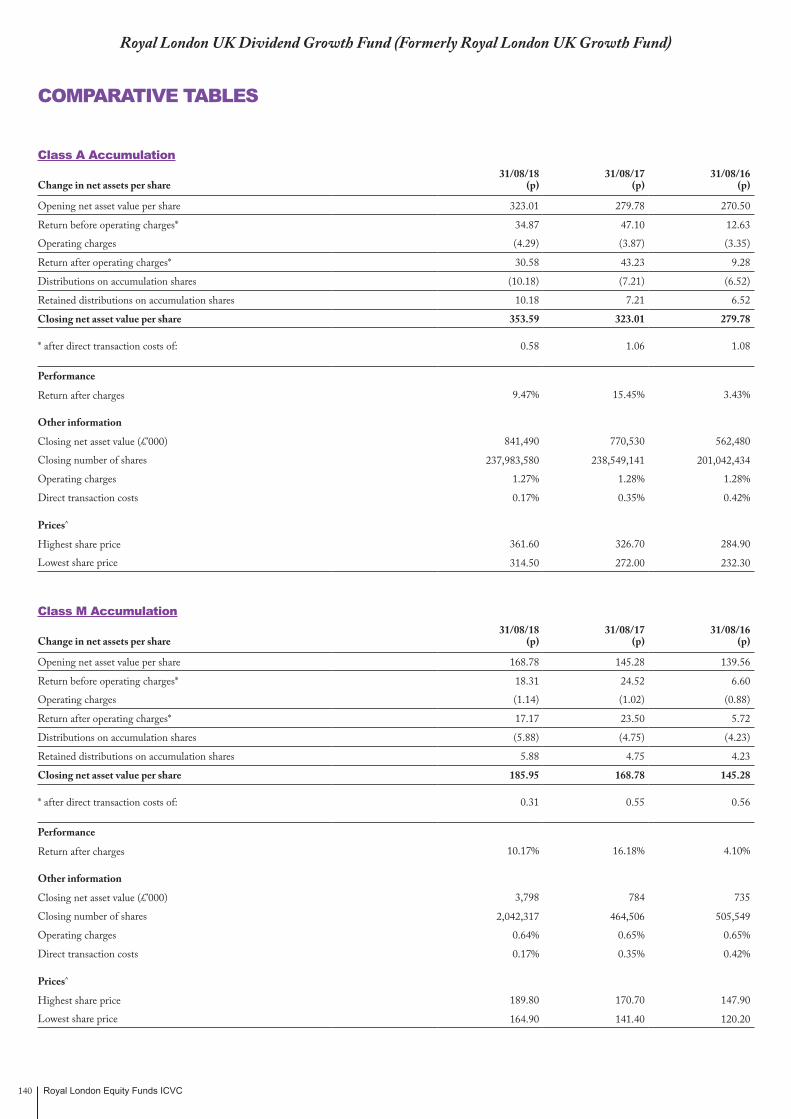
Royal London Equity Funds ICVC140
Royal London UK Dividend Growth Fund (Formerly Royal London UK Growth Fund)
COMPARATIVE TABLES
Class A Accumulation31/08/18 31/08/17 31/08/16
Change in net assets per share (p) (p) (p)
Opening net asset value per share 323.01 279.78 270.50
Return before operating charges* 34.87 47.10 12.63
Operating charges (4.29) (3.87) (3.35)
Return after operating charges* 30.58 43.23 9.28
Distributions on accumulation shares (10.18) (7.21) (6.52)
Retained distributions on accumulation shares 10.18 7.21 6.52
Closing net asset value per share 353.59 323.01 279.78
* after direct transaction costs of: 0.58 1.06 1.08
Performance
Return after charges 9.47% 15.45% 3.43%
Other information
Closing net asset value (£’000) 841,490 770,530 562,480
Closing number of shares 237,983,580 238,549,141 201,042,434
Operating charges 1.27% 1.28% 1.28%
Direct transaction costs 0.17% 0.35% 0.42%
Prices^
Highest share price 361.60 326.70 284.90
Lowest share price 314.50 272.00 232.30
Class M Accumulation31/08/18 31/08/17 31/08/16
Change in net assets per share (p) (p) (p)
Opening net asset value per share 168.78 145.28 139.56
Return before operating charges* 18.31 24.52 6.60
Operating charges (1.14) (1.02) (0.88)
Return after operating charges* 17.17 23.50 5.72
Distributions on accumulation shares (5.88) (4.75) (4.23)
Retained distributions on accumulation shares 5.88 4.75 4.23
Closing net asset value per share 185.95 168.78 145.28
* after direct transaction costs of: 0.31 0.55 0.56
Performance
Return after charges 10.17% 16.18% 4.10%
Other information
Closing net asset value (£’000) 3,798 784 735
Closing number of shares 2,042,317 464,506 505,549
Operating charges 0.64% 0.65% 0.65%
Direct transaction costs 0.17% 0.35% 0.42%
Prices^
Highest share price 189.80 170.70 147.90
Lowest share price 164.90 141.40 120.20
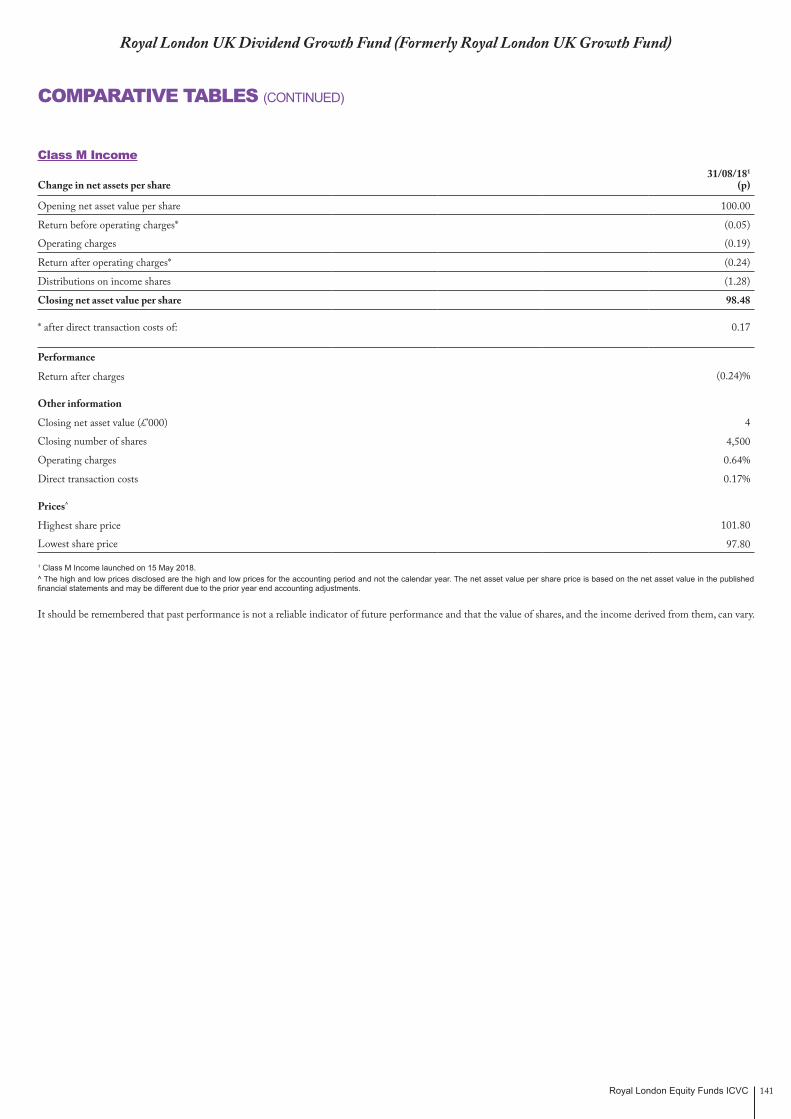
Royal London Equity Funds ICVC 141
Royal London UK Dividend Growth Fund (Formerly Royal London UK Growth Fund)
COMPARATIVE TABLES (CONTINUED)
Class M Income31/08/181
Change in net assets per share (p)
Opening net asset value per share 100.00
Return before operating charges* (0.05)
Operating charges (0.19)
Return after operating charges* (0.24)
Distributions on income shares (1.28)
Closing net asset value per share 98.48
* after direct transaction costs of: 0.17
Performance
Return after charges (0.24)%
Other information
Closing net asset value (£’000) 4
Closing number of shares 4,500
Operating charges 0.64%
Direct transaction costs 0.17%
Prices^
Highest share price 101.80
Lowest share price 97.80
1 Class M Income launched on 15 May 2018.^ The high and low prices disclosed are the high and low prices for the accounting period and not the calendar year. The net asset value per share price is based on the net asset value in the published financial statements and may be different due to the prior year end accounting adjustments.
It should be remembered that past performance is not a reliable indicator of future performance and that the value of shares, and the income derived from them, can vary.
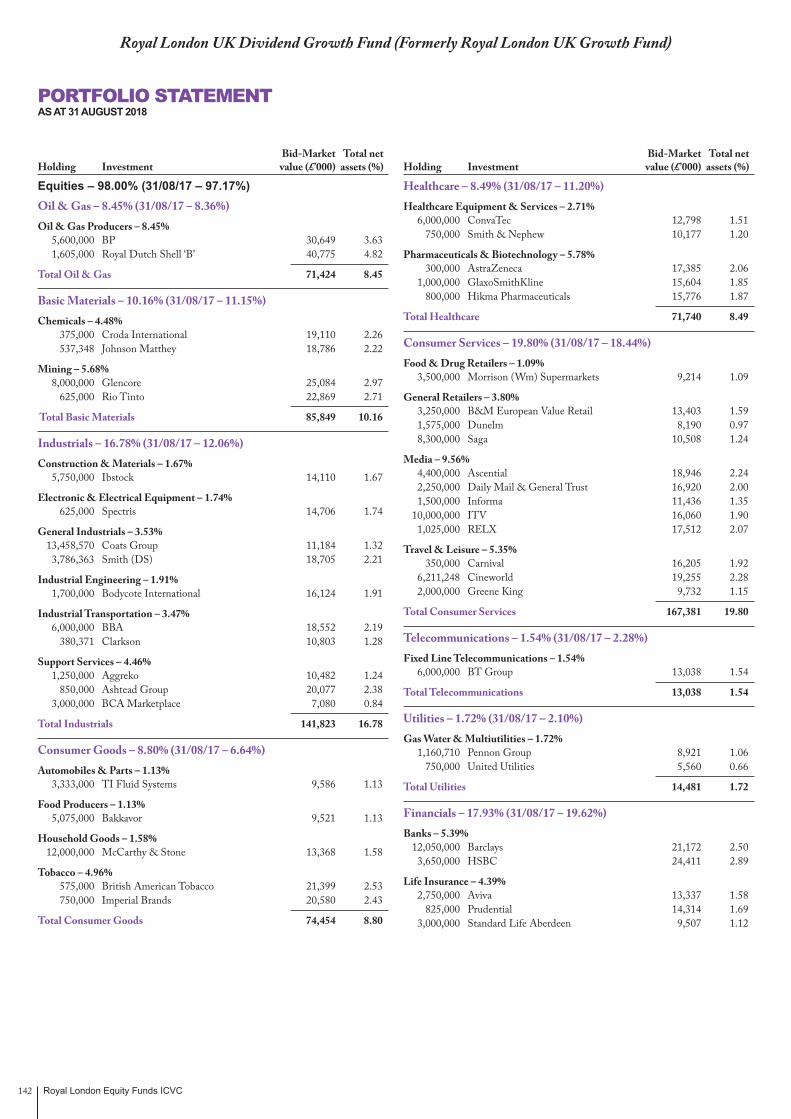
Royal London Equity Funds ICVC142
Royal London UK Dividend Growth Fund (Formerly Royal London UK Growth Fund)
Equities – 98.00% (31/08/17 – 97.17%) Oil & Gas – 8.45% (31/08/17 – 8.36%) Oil & Gas Producers – 8.45% 5,600,000 BP 30,649 3.63 1,605,000 Royal Dutch Shell ‘B’ 40,775 4.82
Total Oil & Gas 71,424 8.45
Basic Materials – 10.16% (31/08/17 – 11.15%) Chemicals – 4.48% 375,000 Croda International 19,110 2.26 537,348 Johnson Matthey 18,786 2.22
Mining – 5.68% 8,000,000 Glencore 25,084 2.97 625,000 Rio Tinto 22,869 2.71
Total Basic Materials 85,849 10.16
Industrials – 16.78% (31/08/17 – 12.06%) Construction & Materials – 1.67% 5,750,000 Ibstock 14,110 1.67
Electronic & Electrical Equipment – 1.74% 625,000 Spectris 14,706 1.74
General Industrials – 3.53% 13,458,570 Coats Group 11,184 1.32 3,786,363 Smith (DS) 18,705 2.21
Industrial Engineering – 1.91% 1,700,000 Bodycote International 16,124 1.91
Industrial Transportation – 3.47% 6,000,000 BBA 18,552 2.19 380,371 Clarkson 10,803 1.28
Support Services – 4.46% 1,250,000 Aggreko 10,482 1.24 850,000 Ashtead Group 20,077 2.38 3,000,000 BCA Marketplace 7,080 0.84
Total Industrials 141,823 16.78
Consumer Goods – 8.80% (31/08/17 – 6.64%) Automobiles & Parts – 1.13% 3,333,000 TI Fluid Systems 9,586 1.13
Food Producers – 1.13% 5,075,000 Bakkavor 9,521 1.13
Household Goods – 1.58% 12,000,000 McCarthy & Stone 13,368 1.58
Tobacco – 4.96% 575,000 British American Tobacco 21,399 2.53 750,000 Imperial Brands 20,580 2.43
Total Consumer Goods 74,454 8.80
Healthcare – 8.49% (31/08/17 – 11.20%) Healthcare Equipment & Services – 2.71% 6,000,000 ConvaTec 12,798 1.51 750,000 Smith & Nephew 10,177 1.20
Pharmaceuticals & Biotechnology – 5.78% 300,000 AstraZeneca 17,385 2.06 1,000,000 GlaxoSmithKline 15,604 1.85 800,000 Hikma Pharmaceuticals 15,776 1.87
Total Healthcare 71,740 8.49
Consumer Services – 19.80% (31/08/17 – 18.44%) Food & Drug Retailers – 1.09% 3,500,000 Morrison (Wm) Supermarkets 9,214 1.09
General Retailers – 3.80% 3,250,000 B&M European Value Retail 13,403 1.59 1,575,000 Dunelm 8,190 0.97 8,300,000 Saga 10,508 1.24
Media – 9.56% 4,400,000 Ascential 18,946 2.24 2,250,000 Daily Mail & General Trust 16,920 2.00 1,500,000 Informa 11,436 1.35 10,000,000 ITV 16,060 1.90 1,025,000 RELX 17,512 2.07
Travel & Leisure – 5.35% 350,000 Carnival 16,205 1.92 6,211,248 Cineworld 19,255 2.28 2,000,000 Greene King 9,732 1.15
Total Consumer Services 167,381 19.80
Telecommunications – 1.54% (31/08/17 – 2.28%) Fixed Line Telecommunications – 1.54% 6,000,000 BT Group 13,038 1.54
Total Telecommunications 13,038 1.54
Utilities – 1.72% (31/08/17 – 2.10%) Gas Water & Multiutilities – 1.72% 1,160,710 Pennon Group 8,921 1.06 750,000 United Utilities 5,560 0.66
Total Utilities 14,481 1.72
Financials – 17.93% (31/08/17 – 19.62%) Banks – 5.39% 12,050,000 Barclays 21,172 2.50 3,650,000 HSBC 24,411 2.89
Life Insurance – 4.39% 2,750,000 Aviva 13,337 1.58 825,000 Prudential 14,314 1.69 3,000,000 Standard Life Aberdeen 9,507 1.12
PORTFOLIO STATEMENTAS AT 31 AUGUST 2018
Bid-Market Total net Holding Investment value (£’000) assets (%)
Bid-Market Total net Holding Investment value (£’000) assets (%)

Royal London Equity Funds ICVC 143
Financials – 17.93% (31/08/17 – 19.62%) – continued Non-Life Insurance – 1.51% 4,600,000 Sabre Insurance 12,742 1.51
Real Estate Investment Trusts – 1.42% 4,275,902 Itacare* – – 1,350,000 Unite Group 11,968 1.42
Financial Services – 5.22% 1,713,917 3i Group 15,343 1.82 768,700 Close Brothers 12,268 1.45 1,575,000 Intermediate Capital 16,522 1.95
Total Financials 151,584 17.93
Technology – 4.33% (31/08/17 – 5.32%) Software & Computer Services – 4.33% 660,000 Aveva Group 18,731 2.22 3,000,000 Sage 17,862 2.11
Total Technology 36,593 4.33
Total value of investments 828,367 98.00
Net other assets 16,925 2.00
Total net assets 845,292 100.00
* UnlistedAll investments are listed on recognised stock exchanges and are “approved securities” within the meaning of the FCA rules unless otherwise stated.
Royal London UK Dividend Growth Fund (Formerly Royal London UK Growth Fund)
PORTFOLIO STATEMENT (CONTINUED)AS AT 31 AUGUST 2018
Bid-Market Total net Holding Investment value (£’000) assets (%)
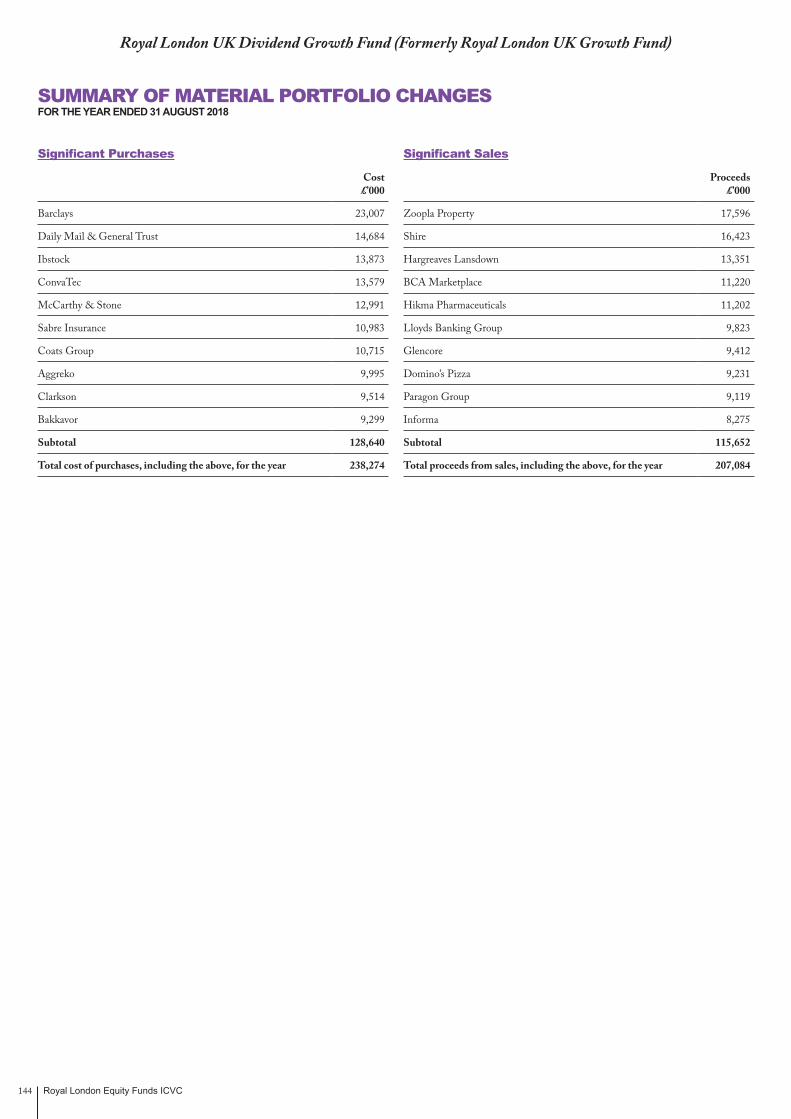
Royal London Equity Funds ICVC144
Royal London UK Dividend Growth Fund (Formerly Royal London UK Growth Fund)
SUMMARY OF MATERIAL PORTFOLIO CHANGESFOR THE YEAR ENDED 31 AUGUST 2018
Significant Purchases
Cost £’000
Barclays 23,007
Daily Mail & General Trust 14,684
Ibstock 13,873
ConvaTec 13,579
McCarthy & Stone 12,991
Sabre Insurance 10,983
Coats Group 10,715
Aggreko 9,995
Clarkson 9,514
Bakkavor 9,299
Subtotal 128,640
Total cost of purchases, including the above, for the year 238,274
Significant Sales
Proceeds £’000
Zoopla Property 17,596
Shire 16,423
Hargreaves Lansdown 13,351
BCA Marketplace 11,220
Hikma Pharmaceuticals 11,202
Lloyds Banking Group 9,823
Glencore 9,412
Domino’s Pizza 9,231
Paragon Group 9,119
Informa 8,275
Subtotal 115,652
Total proceeds from sales, including the above, for the year 207,084

Royal London Equity Funds ICVC 145
Royal London UK Dividend Growth Fund (Formerly Royal London UK Growth Fund)
FINANCIAL STATEMENTS
Statement of Total Returnfor the year ended 31 August 2018
Note £’000
Year ended31 August 2018
£’000 £’000
Year ended31 August 2017
£’000
Income Net capital gains 2 53,959 80,318 Revenue 3 29,328 25,504
Expenses 4 (10,269) (8,733)Interest payable and similar charges – (2)
Net revenue before taxation 19,059 16,769 Taxation 5 (33) (31)
Net revenue after taxation 19,026 16,738
Total return before distributions 72,985 97,056 Distributions 6 (24,305) (16,611)
Change in net assets attributable to shareholders from investment activities 48,680 80,445
Statement of Change in Net Assets Attributable to Shareholdersfor the year ended 31 August 2018
£’000
Year ended31 August 2018
£’000 £’000
Year ended31 August 2017
£’000
Opening net assets attributable to shareholders 771,314 563,215
Amounts receivable on creation of shares 3,779 113,459 Amounts payable on cancellation of shares (2,789) (2,818)
990 110,641
Change in net assets attributable to shareholders from investment activities 48,680 80,445 Retained distributions on accumulation shares 24,308 17,013
Closing net assets attributable to shareholders 845,292 771,314

Royal London Equity Funds ICVC146
Royal London UK Dividend Growth Fund (Formerly Royal London UK Growth Fund)
FINANCIAL STATEMENTS (CONTINUED)
Balance Sheetas at 31 August 2018
Note31 August 2018
£’000 31 August 2017
£’000
ASSETS
Investments 828,367 749,516
Current assets:Debtors 7 9,611 7,017 Cash and bank balances 8 8,339 17,323
Total assets 846,317 773,856
LIABILITIES
Creditors:Other creditors 9 1,025 2,542
Total liabilities 1,025 2,542
Net assets attributable to shareholders 845,292 771,314

Royal London Equity Funds ICVC 147
Royal London UK Dividend Growth Fund (Formerly Royal London UK Growth Fund)
NOTES TO THE FINANCIAL STATEMENTSFOR THE YEAR ENDED 31 AUGUST 2018
1. Accounting policiesThe accounting policies are set out in note 1 on page 8.
2. Net capital gains31 August 2018
£’00031 August 2017
£’000The net capital gains during the year comprise:
Non-derivative securities 53,965 80,317
Currency (losses)/gains (4) 4
Activity fees (2) (3)
Net capital gains 53,959 80,318
3. Revenue31 August 2018
£’00031 August 2017
£’000UK dividends 27,791 24,813
Overseas dividends 838 293
Property investment income (PID) 445 225
Bank interest 25 4
Stock lending income 229 42
Stock dividends – 127
Total revenue 29,328 25,504
4. Expenses31 August 2018
£’00031 August 2017
£’000Payable to the Authorised Corporate Director or associates of the Authorised Corporate Director and agents of either of them:
Authorised Corporate Director's fee 10,080 8,557
Payable to the Depositary, associates of the Depositary and agents of either of them:
Depositary's fee 70 61
Safe custody fees 13 11
83 72
Other expenses:
Registrar's fees 91 88
Audit fee 10 11
Printing & stationery fee 4 3
Legal fee 1 2
106 104
Total expenses 10,269 8,733
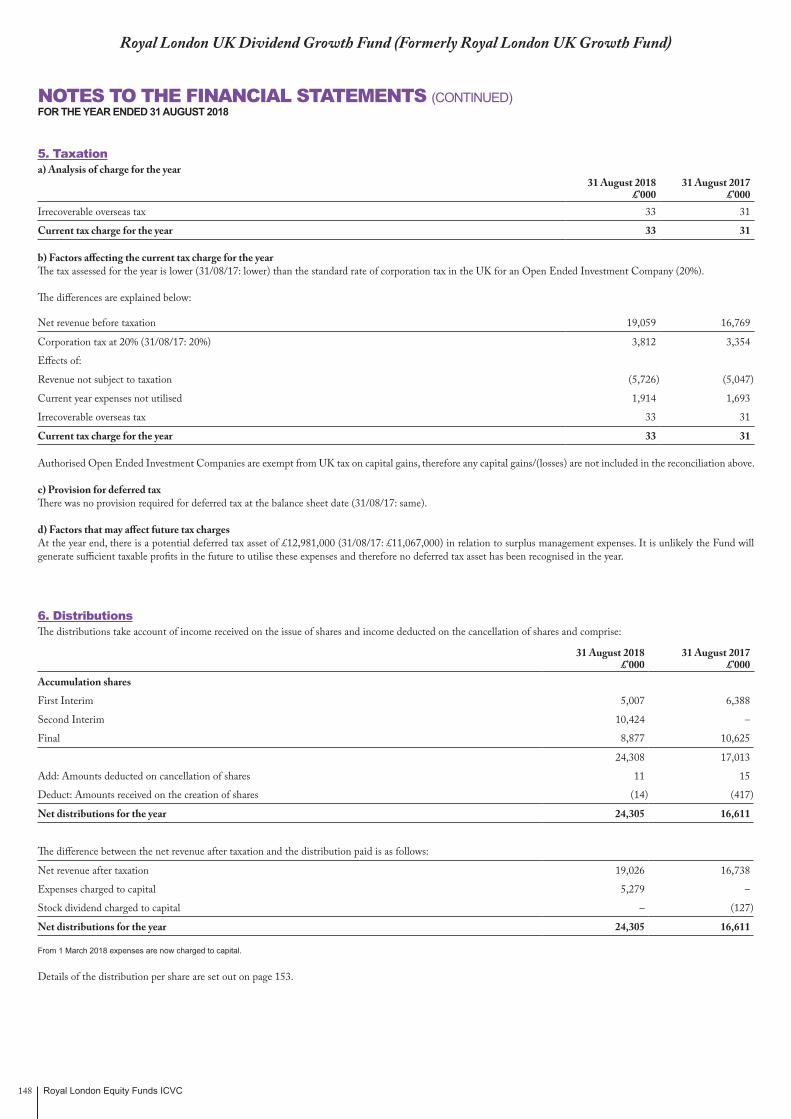
Royal London Equity Funds ICVC148
5. Taxationa) Analysis of charge for the year
31 August 2018£’000
31 August 2017£’000
Irrecoverable overseas tax 33 31
Current tax charge for the year 33 31
b) Factors affecting the current tax charge for the year The tax assessed for the year is lower (31/08/17: lower) than the standard rate of corporation tax in the UK for an Open Ended Investment Company (20%).
The differences are explained below:
Net revenue before taxation 19,059 16,769
Corporation tax at 20% (31/08/17: 20%) 3,812 3,354
Effects of:
Revenue not subject to taxation (5,726) (5,047)
Current year expenses not utilised 1,914 1,693
Irrecoverable overseas tax 33 31
Current tax charge for the year 33 31
Authorised Open Ended Investment Companies are exempt from UK tax on capital gains, therefore any capital gains/(losses) are not included in the reconciliation above.
c) Provision for deferred taxThere was no provision required for deferred tax at the balance sheet date (31/08/17: same).
d) Factors that may affect future tax chargesAt the year end, there is a potential deferred tax asset of £12,981,000 (31/08/17: £11,067,000) in relation to surplus management expenses. It is unlikely the Fund will generate sufficient taxable profits in the future to utilise these expenses and therefore no deferred tax asset has been recognised in the year.
6. DistributionsThe distributions take account of income received on the issue of shares and income deducted on the cancellation of shares and comprise:
31 August 2018 £’000
31 August 2017 £’000
Accumulation shares
First Interim 5,007 6,388
Second Interim 10,424 –
Final 8,877 10,625
24,308 17,013
Add: Amounts deducted on cancellation of shares 11 15
Deduct: Amounts received on the creation of shares (14) (417)
Net distributions for the year 24,305 16,611
The difference between the net revenue after taxation and the distribution paid is as follows:
Net revenue after taxation 19,026 16,738
Expenses charged to capital 5,279 –
Stock dividend charged to capital – (127)
Net distributions for the year 24,305 16,611
From 1 March 2018 expenses are now charged to capital.
Details of the distribution per share are set out on page 153.
Royal London UK Dividend Growth Fund (Formerly Royal London UK Growth Fund)
NOTES TO THE FINANCIAL STATEMENTS (CONTINUED)FOR THE YEAR ENDED 31 AUGUST 2018
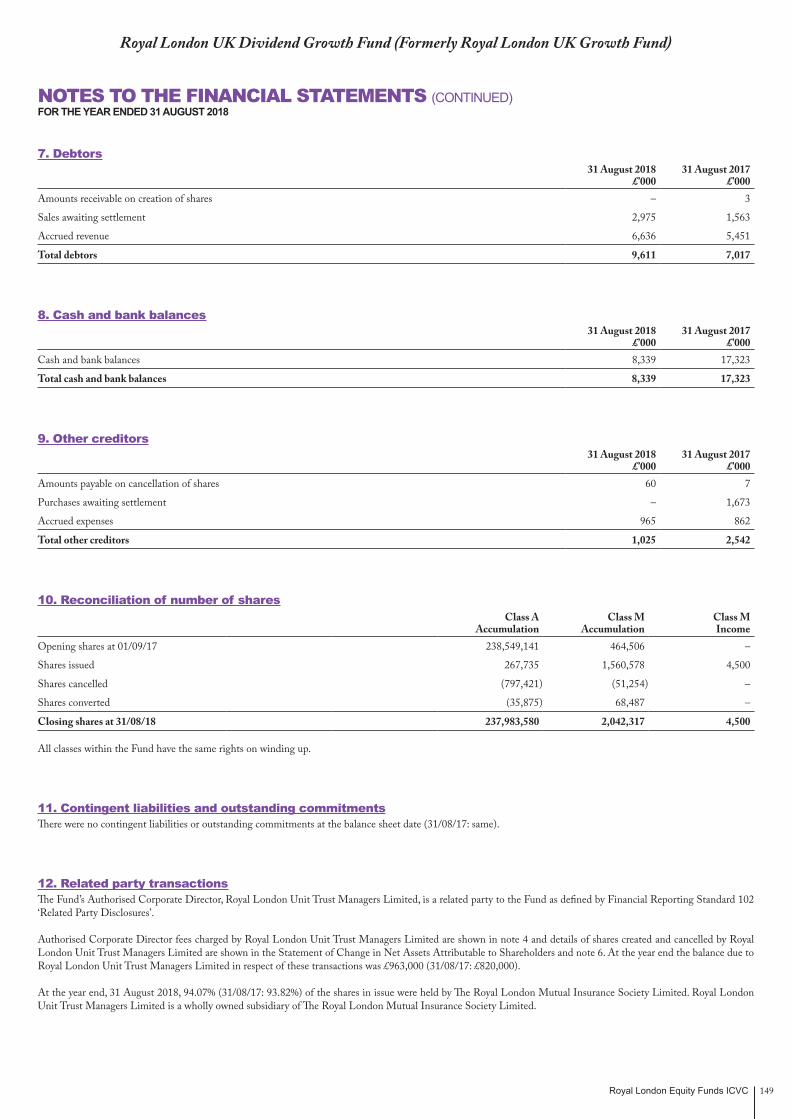
Royal London Equity Funds ICVC 149
Royal London UK Dividend Growth Fund (Formerly Royal London UK Growth Fund)
NOTES TO THE FINANCIAL STATEMENTS (CONTINUED)FOR THE YEAR ENDED 31 AUGUST 2018
7. Debtors31 August 2018
£’00031 August 2017
£’000Amounts receivable on creation of shares – 3
Sales awaiting settlement 2,975 1,563
Accrued revenue 6,636 5,451
Total debtors 9,611 7,017
8. Cash and bank balances31 August 2018
£’00031 August 2017
£’000Cash and bank balances 8,339 17,323
Total cash and bank balances 8,339 17,323
9. Other creditors31 August 2018
£’00031 August 2017
£’000Amounts payable on cancellation of shares 60 7
Purchases awaiting settlement – 1,673
Accrued expenses 965 862
Total other creditors 1,025 2,542
10. Reconciliation of number of sharesClass A
AccumulationClass M
AccumulationClass MIncome
Opening shares at 01/09/17 238,549,141 464,506 –
Shares issued 267,735 1,560,578 4,500
Shares cancelled (797,421) (51,254) –
Shares converted (35,875) 68,487 –
Closing shares at 31/08/18 237,983,580 2,042,317 4,500
All classes within the Fund have the same rights on winding up.
11. Contingent liabilities and outstanding commitmentsThere were no contingent liabilities or outstanding commitments at the balance sheet date (31/08/17: same).
12. Related party transactionsThe Fund’s Authorised Corporate Director, Royal London Unit Trust Managers Limited, is a related party to the Fund as defined by Financial Reporting Standard 102 ‘Related Party Disclosures’.
Authorised Corporate Director fees charged by Royal London Unit Trust Managers Limited are shown in note 4 and details of shares created and cancelled by Royal London Unit Trust Managers Limited are shown in the Statement of Change in Net Assets Attributable to Shareholders and note 6. At the year end the balance due to Royal London Unit Trust Managers Limited in respect of these transactions was £963,000 (31/08/17: £820,000).
At the year end, 31 August 2018, 94.07% (31/08/17: 93.82%) of the shares in issue were held by The Royal London Mutual Insurance Society Limited. Royal London Unit Trust Managers Limited is a wholly owned subsidiary of The Royal London Mutual Insurance Society Limited.

Royal London Equity Funds ICVC150
13. Stock lending activitiesThe Fund carried out stock lending activities for the purpose of efficient portfolio management and in order to generate income. Revenue earned from these activities is shown in note 3 and is net of bank and agents fees amounting to £57,000 (Gross: £286,000) (31/08/17: £10,000 (Gross: £52,000)) payable to HSBC Bank plc.
The value of stock on loan at the balance sheet date was £42,961,000 (31/08/17: £48,666,000).
The collateral held by asset type at the year end is stated below:
Asset class
31 August 2018 Collateral Held
£’000
31 August 2017 Collateral Held
£’000Equities 22,557 36,632
Bonds 22,684 14,060
The aggregate value of collateral held at the balance sheet date was £45,241,000 (31/08/17: £50,692,000). Collateral may be in the form of cash, UK gilts, certificates of deposit, treasury bills, sovereign debt, eurosterling bonds and equities; where the ACD approves the asset it will be held to reduce counterparty exposure. The value of the collateral held is greater than the value of the securities on loan and is monitored as part of the efficient portfolio management process.
The counterparties at the year end were Banco Santander, Bank of Nova Scotia, Goldman Sachs International, HSBC Bank and JP Morgan Securities.
14. Risk disclosuresThe policies applied to the management of risk disclosures are set out on page 9.
The fair values of the Fund’s assets and liabilities are represented by the values shown in the Balance Sheet on page 146. There is no material difference between the value of the financial assets and liabilities, as shown in the Balance Sheet, and their fair value.
A proportion of the Fund’s assets are denominated in currencies other than sterling. The value of the Fund’s assets may be affected by currency movements.
Currency31 August 2018
£’00031 August 2017
£’000Sterling 843,410 769,368
Euro 149 61
US dollar 1,733 1,885
Total 845,292 771,314
If sterling to foreign currency exchange rates had increased by 10% as at the balance sheet date, the net asset value of the Fund would have decreased by £188,000 (31/08/17: £195,000). If sterling to foreign currency exchange rates had decreased by 10% as at the balance sheet date, the net asset value of the Fund would have increased by £188,000 (31/08/17: £195,000). These calculations assume all other variables remain constant.
If market prices had increased by 10% as at the balance sheet date, the net asset value of the Fund would have increased by £82,837,000 (31/08/17: £74,952,000). If market prices had decreased by 10% as at the balance sheet date, the net asset value of the Fund would have decreased by £82,837,000 (31/08/17: £74,952,000). These calculations assume all other variables remain constant.
The only interest bearing assets are cash balances of £8,338,569 (31/08/17: £17,322,685) which earn interest by reference to LIBOR or international equivalent.
FX risk is insignificant (31/08/17: same).
Royal London UK Dividend Growth Fund (Formerly Royal London UK Growth Fund)
NOTES TO THE FINANCIAL STATEMENTS (CONTINUED)FOR THE YEAR ENDED 31 AUGUST 2018

Royal London Equity Funds ICVC 151
Royal London UK Dividend Growth Fund (Formerly Royal London UK Growth Fund)
NOTES TO THE FINANCIAL STATEMENTS (CONTINUED)FOR THE YEAR ENDED 31 AUGUST 2018
15. Portfolio transaction costsFor the year ended 31 August 2018
Value Commissions Taxes Other expenses TotalAnalysis of total purchases costs £’000 £’000 % £’000 % £’000 % £’000Equity transactions 226,071 190 0.08 874 0.39 135 0.06 227,270
Corporate actions 11,004 – – – – – – 11,004
Total 237,075 190 874 135 238,274
Value Commissions Taxes Other expenses TotalAnalysis of total sales costs £’000 £’000 % £’000 % £’000 % £’000Equity transactions 207,278 194 0.09 – – – – 207,084
Corporate actions – – – – – – – –
Total 207,278 194 – – 207,084
Commissions, taxes and fees as % of average net assetsCommissions 0.05%Taxes 0.11%Other expenses 0.01%
For the year ended 31 August 2017
Value Commissions Taxes Other expenses TotalAnalysis of total purchases costs £’000 £’000 % £’000 % £’000 % £’000Equity transactions 347,724 461 0.13 1,448 0.42 137 0.04 349,770
Corporate actions 1,655 – – – – – – 1,655
Total 349,379 461 1,448 137 351,425
Value Commissions Taxes Other expenses TotalAnalysis of total sales costs £’000 £’000 % £’000 % £’000 % £’000Equity transactions 231,463 336 0.15 – – – – 231,127
Corporate actions 3,120 – – – – – – 3,120
Total 234,583 336 – – 234,247
Commissions, taxes and fees as % of average net assetsCommissions 0.12%Taxes 0.21%Other expenses 0.02%
At the balance sheet date the portfolio dealing spread was 0.08% (31/08/17: 0.08%). The Fund is single priced throughout the year and therefore the dealing spread is not indicative of the full year.
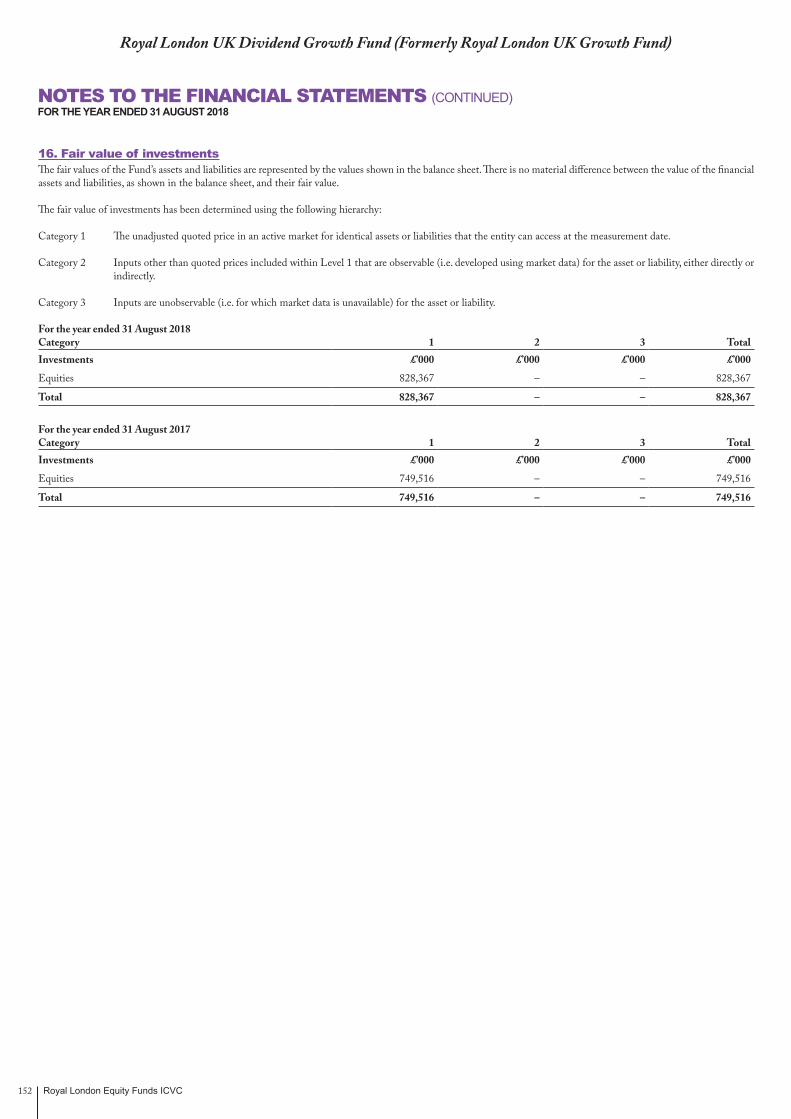
Royal London Equity Funds ICVC152
16. Fair value of investmentsThe fair values of the Fund’s assets and liabilities are represented by the values shown in the balance sheet. There is no material difference between the value of the financial assets and liabilities, as shown in the balance sheet, and their fair value.
The fair value of investments has been determined using the following hierarchy:
Category 1 The unadjusted quoted price in an active market for identical assets or liabilities that the entity can access at the measurement date.
Category 2 Inputs other than quoted prices included within Level 1 that are observable (i.e. developed using market data) for the asset or liability, either directly or indirectly.
Category 3 Inputs are unobservable (i.e. for which market data is unavailable) for the asset or liability.
For the year ended 31 August 2018 Category 1 2 3 TotalInvestments £’000 £’000 £’000 £’000
Equities 828,367 – – 828,367
Total 828,367 – – 828,367
For the year ended 31 August 2017 Category 1 2 3 TotalInvestments £’000 £’000 £’000 £’000
Equities 749,516 – – 749,516
Total 749,516 – – 749,516
Royal London UK Dividend Growth Fund (Formerly Royal London UK Growth Fund)
NOTES TO THE FINANCIAL STATEMENTS (CONTINUED)FOR THE YEAR ENDED 31 AUGUST 2018

Royal London Equity Funds ICVC 153
Royal London UK Dividend Growth Fund (Formerly Royal London UK Growth Fund)
DISTRIBUTION TABLESFOR THE YEAR ENDED 31 AUGUST 2018
Distribution in pence per share
FIRST INTERIMGroup 1: Shares purchased prior to 1 September 2017Group 2: Shares purchased between 1 September 2017 and 28 February 2018
Distribution DistributionNet paid paid
income Equalisation 30/04/18 30/04/17Class A AccumulationGroup 1 2.0977 – 2.0977 2.7627Group 2 1.2600 0.8377 2.0977 2.7627
Class M AccumulationGroup 1 1.6407 – 1.6407 1.9029Group 2 0.6273 1.0134 1.6407 1.9029
SECOND INTERIMGroup 1: Shares purchased prior to 1 March 2018Group 2: Shares purchased between 1 March 2018 and 31 May 2018
Distribution DistributionNet paid paid
income Equalisation 31/07/18 31/07/17Class A AccumulationGroup 1 4.3699 – 4.3699 0.0000Group 2 3.4652 0.9047 4.3699 0.0000
Class M AccumulationGroup 1 2.2925 – 2.2925 0.0000Group 2 1.1837 1.1088 2.2925 0.0000
Class M Income1
Group 1 0.2304 – 0.2304 n/aGroup 2 0.2304 0.0000 0.2304 n/a
1 Class M Income launched on 15 May 2018
FINALGroup 1: Shares purchased prior to 1 June 2018Group 2: Shares purchased between 1 June 2018 and 31 August 2018
Distribution DistributionNet payable paid
income Equalisation 31/10/18 31/10/17Class A AccumulationGroup 1 3.7134 – 3.7134 4.4484Group 2 2.4769 1.2365 3.7134 4.4484
Class M AccumulationGroup 1 1.9516 – 1.9516 2.8462Group 2 1.4005 0.5511 1.9516 2.8462
Class M Income1
Group 1 1.0446 – 1.0446 n/aGroup 2 1.0446 0.0000 1.0446 n/a
1 Class M Income launched on 15 May 2018.
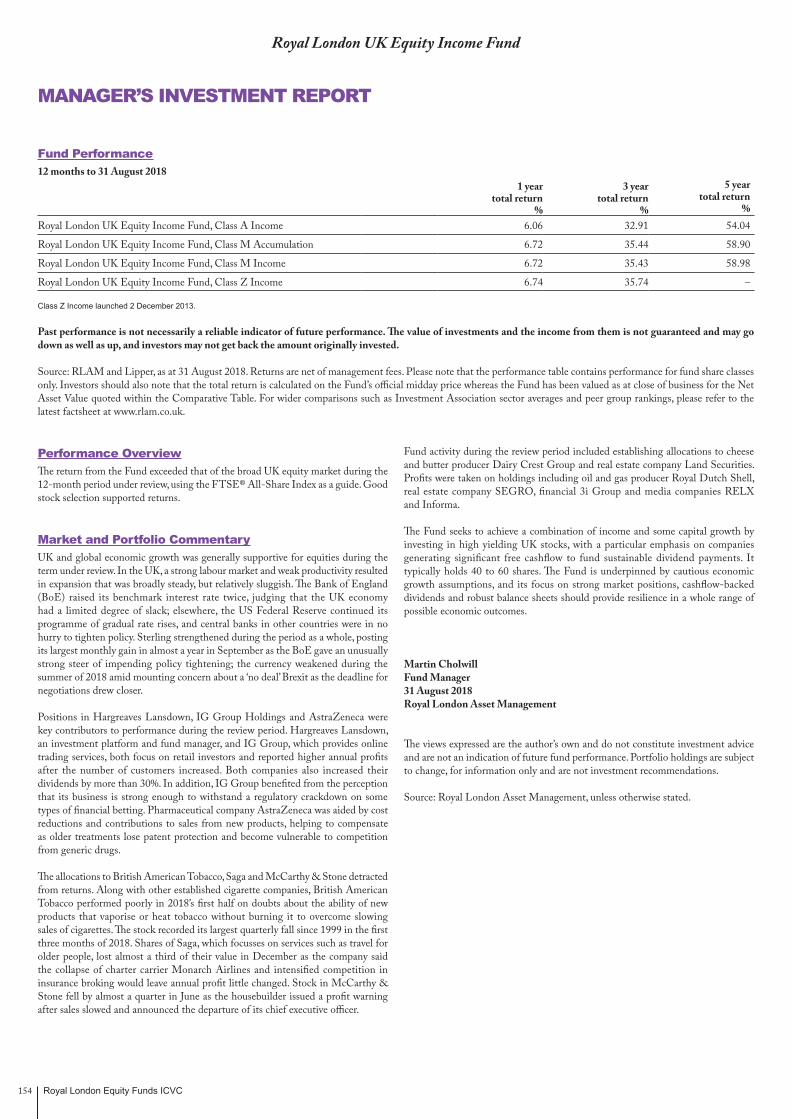
Royal London Equity Funds ICVC154
Royal London UK Equity Income Fund
Fund Performance12 months to 31 August 2018
1 year total return
%
3 year total return
%
5 year total return
%Royal London UK Equity Income Fund, Class A Income 6.06 32.91 54.04
Royal London UK Equity Income Fund, Class M Accumulation 6.72 35.44 58.90
Royal London UK Equity Income Fund, Class M Income 6.72 35.43 58.98
Royal London UK Equity Income Fund, Class Z Income 6.74 35.74 –
Class Z Income launched 2 December 2013.
Past performance is not necessarily a reliable indicator of future performance. The value of investments and the income from them is not guaranteed and may go down as well as up, and investors may not get back the amount originally invested.
Source: RLAM and Lipper, as at 31 August 2018. Returns are net of management fees. Please note that the performance table contains performance for fund share classes only. Investors should also note that the total return is calculated on the Fund’s official midday price whereas the Fund has been valued as at close of business for the Net Asset Value quoted within the Comparative Table. For wider comparisons such as Investment Association sector averages and peer group rankings, please refer to the latest factsheet at www.rlam.co.uk.
Performance OverviewThe return from the Fund exceeded that of the broad UK equity market during the 12-month period under review, using the FTSE® All-Share Index as a guide. Good stock selection supported returns.
Market and Portfolio CommentaryUK and global economic growth was generally supportive for equities during the term under review. In the UK, a strong labour market and weak productivity resulted in expansion that was broadly steady, but relatively sluggish. The Bank of England (BoE) raised its benchmark interest rate twice, judging that the UK economy had a limited degree of slack; elsewhere, the US Federal Reserve continued its programme of gradual rate rises, and central banks in other countries were in no hurry to tighten policy. Sterling strengthened during the period as a whole, posting its largest monthly gain in almost a year in September as the BoE gave an unusually strong steer of impending policy tightening; the currency weakened during the summer of 2018 amid mounting concern about a ‘no deal’ Brexit as the deadline for negotiations drew closer.
Positions in Hargreaves Lansdown, IG Group Holdings and AstraZeneca were key contributors to performance during the review period. Hargreaves Lansdown, an investment platform and fund manager, and IG Group, which provides online trading services, both focus on retail investors and reported higher annual profits after the number of customers increased. Both companies also increased their dividends by more than 30%. In addition, IG Group benefited from the perception that its business is strong enough to withstand a regulatory crackdown on some types of financial betting. Pharmaceutical company AstraZeneca was aided by cost reductions and contributions to sales from new products, helping to compensate as older treatments lose patent protection and become vulnerable to competition from generic drugs.
The allocations to British American Tobacco, Saga and McCarthy & Stone detracted from returns. Along with other established cigarette companies, British American Tobacco performed poorly in 2018’s first half on doubts about the ability of new products that vaporise or heat tobacco without burning it to overcome slowing sales of cigarettes. The stock recorded its largest quarterly fall since 1999 in the first three months of 2018. Shares of Saga, which focusses on services such as travel for older people, lost almost a third of their value in December as the company said the collapse of charter carrier Monarch Airlines and intensified competition in insurance broking would leave annual profit little changed. Stock in McCarthy & Stone fell by almost a quarter in June as the housebuilder issued a profit warning after sales slowed and announced the departure of its chief executive officer.
Fund activity during the review period included establishing allocations to cheese and butter producer Dairy Crest Group and real estate company Land Securities. Profits were taken on holdings including oil and gas producer Royal Dutch Shell, real estate company SEGRO, financial 3i Group and media companies RELX and Informa.
The Fund seeks to achieve a combination of income and some capital growth by investing in high yielding UK stocks, with a particular emphasis on companies generating significant free cashflow to fund sustainable dividend payments. It typically holds 40 to 60 shares. The Fund is underpinned by cautious economic growth assumptions, and its focus on strong market positions, cashflow-backed dividends and robust balance sheets should provide resilience in a whole range of possible economic outcomes.
Martin CholwillFund Manager31 August 2018Royal London Asset Management
The views expressed are the author’s own and do not constitute investment advice and are not an indication of future fund performance. Portfolio holdings are subject to change, for information only and are not investment recommendations.
Source: Royal London Asset Management, unless otherwise stated.
MANAGER’S INVESTMENT REPORT

Royal London Equity Funds ICVC 155
Royal London UK Equity Income Fund
COMPARATIVE TABLES
Class A Income31/08/18 31/08/17 31/08/16
Change in net assets per share (p) (p) (p)
Opening net asset value per share 775.20 733.90 674.76
Return before operating charges* 49.32 81.38 96.51
Operating charges (10.19) (9.97) (8.84)
Return after operating charges* 39.13 71.41 87.67
Distributions on income shares (32.55) (30.11) (28.53)
Closing net asset value per share 781.78 775.20 733.90
* after direct transaction costs of: 0.53 1.33 0.68
Performance
Return after charges 5.05% 9.73% 12.99%
Other information
Closing net asset value (£’000) 324,042 307,370 276,079
Closing number of shares 41,449,509 39,650,305 37,618,151
Operating charges 1.30% 1.31% 1.29%
Direct transaction costs 0.07% 0.17% 0.10%
Prices^
Highest share price 825.50 813.70 755.70
Lowest share price 727.80 706.10 618.10
Class M Accumulation31/08/18 31/08/17 31/08/16
Change in net assets per share (p) (p) (p)
Opening net asset value per share 189.74 171.65 150.55
Return before operating charges* 12.30 19.33 22.13
Operating charges (1.31) (1.24) (1.03)
Return after operating charges* 10.99 18.09 21.10
Distributions on accumulation shares (8.12) (7.17) (6.49)
Retained distributions on accumulation shares 8.12 7.17 6.49
Closing net asset value per share 200.73 189.74 171.65
* after direct transaction costs of: 0.13 0.32 0.16
Performance
Return after charges 5.79% 10.54% 14.02%
Other information
Closing net asset value (£’000) 605,559 521,475 379,666
Closing number of shares 301,678,279 274,843,457 221,181,344
Operating charges 0.67% 0.68% 0.66%
Direct transaction costs 0.07% 0.17% 0.10%
Prices^
Highest share price 206.80 195.60 174.80
Lowest share price 182.10 166.90 139.40

Royal London Equity Funds ICVC156
Royal London UK Equity Income Fund
Class M Income31/08/18 31/08/17 31/08/16
Change in net assets per share (p) (p) (p)
Opening net asset value per share 809.05 761.11 695.37
Return before operating charges* 51.61 84.67 99.93
Operating charges (5.50) (5.39) (4.68)
Return after operating charges* 46.11 79.28 95.25
Distributions on income shares (34.08) (31.34) (29.51)
Closing net asset value per share 821.08 809.05 761.11
* after direct transaction costs of: 0.55 1.39 0.71
Performance
Return after charges 5.70% 10.42% 13.70%
Other information
Closing net asset value (£’000) 610,887 572,219 533,865
Closing number of shares 74,400,005 70,727,635 70,142,515
Operating charges 0.67% 0.68% 0.66%
Direct transaction costs 0.07% 0.17% 0.10%
Prices^
Highest share price 865.50 847.90 783.50
Lowest share price 762.30 733.50 638.80
Class Z Income31/08/18 31/08/17 31/08/16
Change in net assets per share (p) (p) (p)
Opening net asset value per share 121.37 114.10 104.17
Return before operating charges* 7.75 12.69 14.98
Operating charges (0.74) (0.72) (0.63)
Return after operating charges* 7.01 11.97 14.35
Distributions on income shares (5.12) (4.70) (4.42)
Closing net asset value per share 123.26 121.37 114.10
* after direct transaction costs of: 0.08 0.21 0.11
Performance
Return after charges 5.78% 10.49% 13.78%
Other information
Closing net asset value (£’000) 505,963 488,234 454,308
Closing number of shares 410,475,536 402,262,398 398,149,440
Operating charges 0.60% 0.61% 0.59%
Direct transaction costs 0.07% 0.17% 0.10%
Prices^
Highest share price 129.90 127.20 117.50
Lowest share price 114.40 110.00 95.73
^ The high and low prices disclosed are the high and low prices for the accounting period and not the calendar year. The net asset value per share price is based on the net asset value in the published financial statements and may be different due to the prior year end accounting adjustments.
It should be remembered that past performance is not a reliable indicator of future performance and that the value of shares, and the income derived from them, can vary.
COMPARATIVE TABLES (CONTINUED)
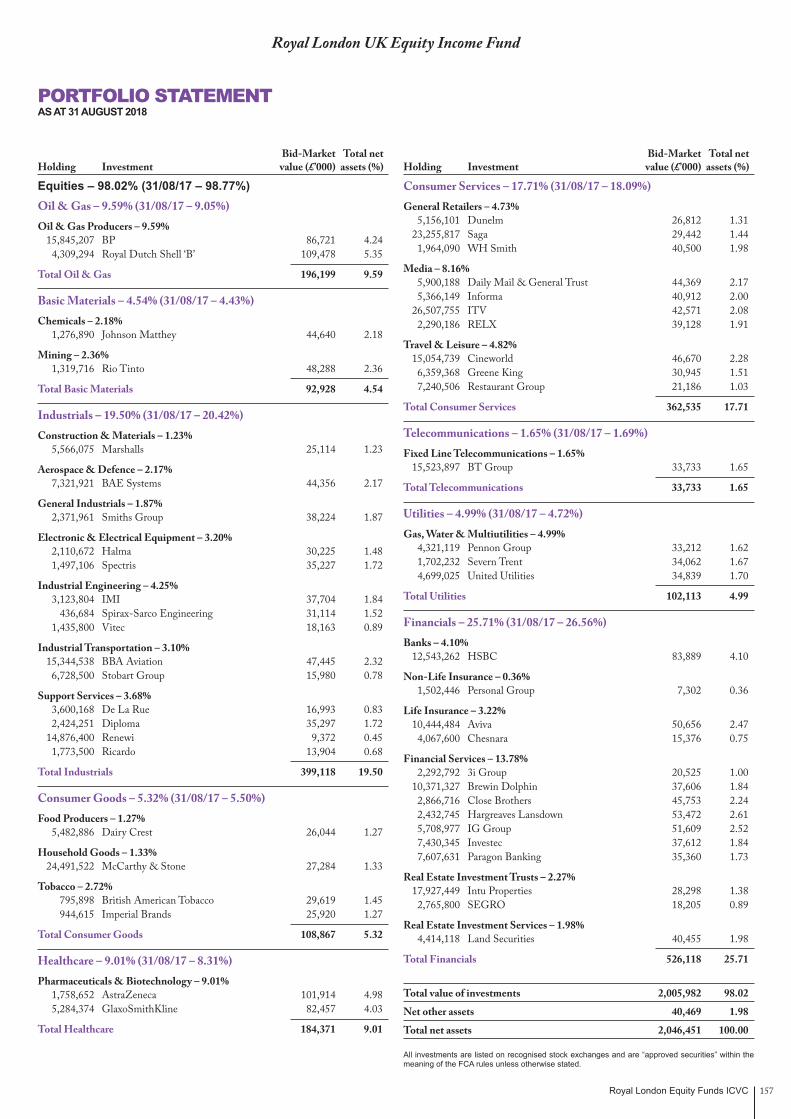
Royal London Equity Funds ICVC 157
Royal London UK Equity Income Fund
Equities – 98.02% (31/08/17 – 98.77%) Oil & Gas – 9.59% (31/08/17 – 9.05%) Oil & Gas Producers – 9.59% 15,845,207 BP 86,721 4.24 4,309,294 Royal Dutch Shell ‘B’ 109,478 5.35
Total Oil & Gas 196,199 9.59
Basic Materials – 4.54% (31/08/17 – 4.43%) Chemicals – 2.18% 1,276,890 Johnson Matthey 44,640 2.18
Mining – 2.36% 1,319,716 Rio Tinto 48,288 2.36
Total Basic Materials 92,928 4.54
Industrials – 19.50% (31/08/17 – 20.42%) Construction & Materials – 1.23% 5,566,075 Marshalls 25,114 1.23
Aerospace & Defence – 2.17% 7,321,921 BAE Systems 44,356 2.17
General Industrials – 1.87% 2,371,961 Smiths Group 38,224 1.87
Electronic & Electrical Equipment – 3.20% 2,110,672 Halma 30,225 1.48 1,497,106 Spectris 35,227 1.72
Industrial Engineering – 4.25% 3,123,804 IMI 37,704 1.84 436,684 Spirax-Sarco Engineering 31,114 1.52 1,435,800 Vitec 18,163 0.89
Industrial Transportation – 3.10% 15,344,538 BBA Aviation 47,445 2.32 6,728,500 Stobart Group 15,980 0.78
Support Services – 3.68% 3,600,168 De La Rue 16,993 0.83 2,424,251 Diploma 35,297 1.72 14,876,400 Renewi 9,372 0.45 1,773,500 Ricardo 13,904 0.68
Total Industrials 399,118 19.50
Consumer Goods – 5.32% (31/08/17 – 5.50%) Food Producers – 1.27% 5,482,886 Dairy Crest 26,044 1.27
Household Goods – 1.33% 24,491,522 McCarthy & Stone 27,284 1.33
Tobacco – 2.72% 795,898 British American Tobacco 29,619 1.45 944,615 Imperial Brands 25,920 1.27
Total Consumer Goods 108,867 5.32
Healthcare – 9.01% (31/08/17 – 8.31%) Pharmaceuticals & Biotechnology – 9.01% 1,758,652 AstraZeneca 101,914 4.98 5,284,374 GlaxoSmithKline 82,457 4.03
Total Healthcare 184,371 9.01
Consumer Services – 17.71% (31/08/17 – 18.09%) General Retailers – 4.73% 5,156,101 Dunelm 26,812 1.31 23,255,817 Saga 29,442 1.44 1,964,090 WH Smith 40,500 1.98
Media – 8.16% 5,900,188 Daily Mail & General Trust 44,369 2.17 5,366,149 Informa 40,912 2.00 26,507,755 ITV 42,571 2.08 2,290,186 RELX 39,128 1.91
Travel & Leisure – 4.82% 15,054,739 Cineworld 46,670 2.28 6,359,368 Greene King 30,945 1.51 7,240,506 Restaurant Group 21,186 1.03
Total Consumer Services 362,535 17.71
Telecommunications – 1.65% (31/08/17 – 1.69%) Fixed Line Telecommunications – 1.65% 15,523,897 BT Group 33,733 1.65
Total Telecommunications 33,733 1.65
Utilities – 4.99% (31/08/17 – 4.72%) Gas, Water & Multiutilities – 4.99% 4,321,119 Pennon Group 33,212 1.62 1,702,232 Severn Trent 34,062 1.67 4,699,025 United Utilities 34,839 1.70
Total Utilities 102,113 4.99
Financials – 25.71% (31/08/17 – 26.56%) Banks – 4.10% 12,543,262 HSBC 83,889 4.10
Non-Life Insurance – 0.36% 1,502,446 Personal Group 7,302 0.36
Life Insurance – 3.22% 10,444,484 Aviva 50,656 2.47 4,067,600 Chesnara 15,376 0.75
Financial Services – 13.78% 2,292,792 3i Group 20,525 1.00 10,371,327 Brewin Dolphin 37,606 1.84 2,866,716 Close Brothers 45,753 2.24 2,432,745 Hargreaves Lansdown 53,472 2.61 5,708,977 IG Group 51,609 2.52 7,430,345 Investec 37,612 1.84 7,607,631 Paragon Banking 35,360 1.73
Real Estate Investment Trusts – 2.27% 17,927,449 Intu Properties 28,298 1.38 2,765,800 SEGRO 18,205 0.89
Real Estate Investment Services – 1.98% 4,414,118 Land Securities 40,455 1.98
Total Financials 526,118 25.71
Total value of investments 2,005,982 98.02
Net other assets 40,469 1.98
Total net assets 2,046,451 100.00
All investments are listed on recognised stock exchanges and are “approved securities” within the meaning of the FCA rules unless otherwise stated.
PORTFOLIO STATEMENTAS AT 31 AUGUST 2018
Bid-Market Total net Holding Investment value (£’000) assets (%)
Bid-Market Total net Holding Investment value (£’000) assets (%)
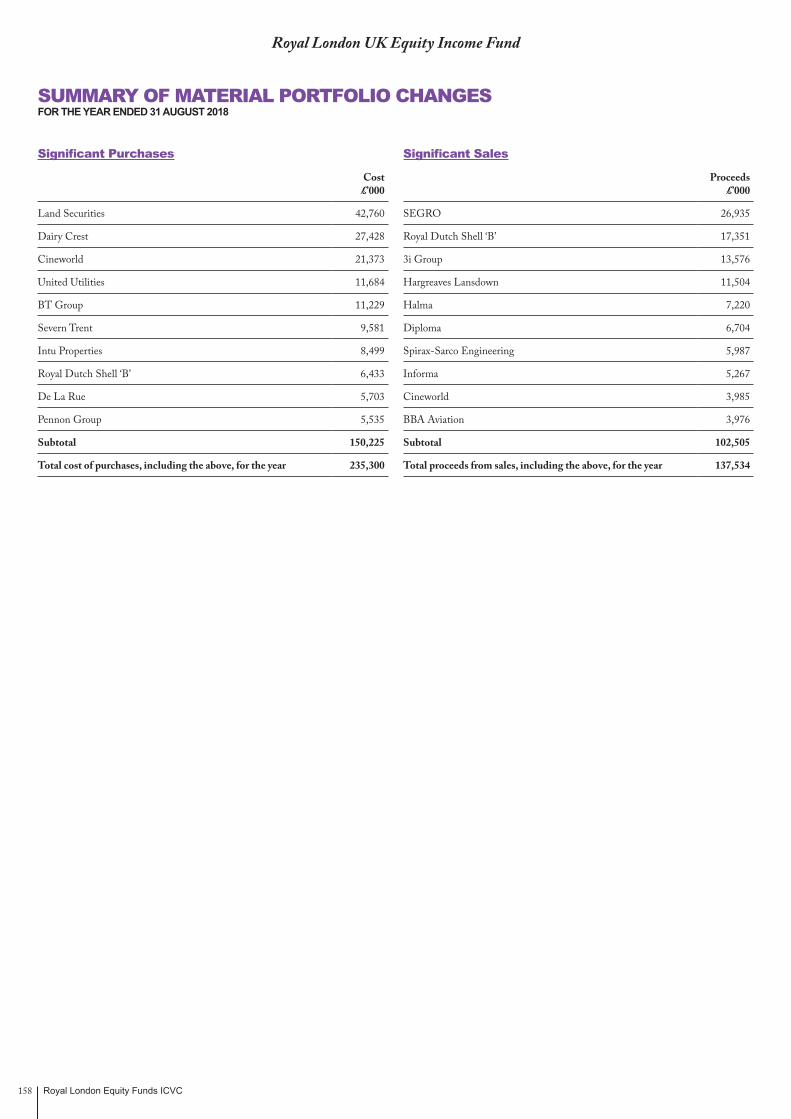
Royal London Equity Funds ICVC158
Royal London UK Equity Income Fund
SUMMARY OF MATERIAL PORTFOLIO CHANGESFOR THE YEAR ENDED 31 AUGUST 2018
Significant Purchases
Cost £’000
Land Securities 42,760
Dairy Crest 27,428
Cineworld 21,373
United Utilities 11,684
BT Group 11,229
Severn Trent 9,581
Intu Properties 8,499
Royal Dutch Shell ‘B’ 6,433
De La Rue 5,703
Pennon Group 5,535
Subtotal 150,225
Total cost of purchases, including the above, for the year 235,300
Significant Sales
Proceeds £’000
SEGRO 26,935
Royal Dutch Shell ‘B’ 17,351
3i Group 13,576
Hargreaves Lansdown 11,504
Halma 7,220
Diploma 6,704
Spirax-Sarco Engineering 5,987
Informa 5,267
Cineworld 3,985
BBA Aviation 3,976
Subtotal 102,505
Total proceeds from sales, including the above, for the year 137,534

Royal London Equity Funds ICVC 159
Royal London UK Equity Income Fund
FINANCIAL STATEMENTS
Statement of Total Returnfor the year ended 31 August 2018
Note £’000
Year ended31 August 2018
£’000 £’000
Year ended31 August 2017
£’000
Income Net capital gains 2 42,130 119,205 Revenue 3 83,720 71,030
Expenses 4 (14,998) (13,583)
Net revenue before taxation 68,722 57,447 Taxation 5 – –
Net revenue after taxation 68,722 57,447
Total return before distributions 110,852 176,652 Distributions 6 (82,956) (70,521)
Change in net assets attributable to shareholders from investment activities 27,896 106,131
Statement of Change in Net Assets Attributable to Shareholdersfor the year ended 31 August 2018
£’000
Year ended31 August 2018
£’000 £’000
Year ended31 August 2017
£’000
Opening net assets attributable to shareholders 1,889,298 1,643,918
Amounts receivable on creation of shares 230,846 244,045 Amounts payable on cancellation of shares (125,208) (123,245)
105,638 120,800
Dilution levy charged 45 109 Change in net assets attributable to shareholders from investment activities 27,896 106,131 Retained distributions on accumulation shares 23,564 18,332 Unclaimed distributions 10 8
Closing net assets attributable to shareholders 2,046,451 1,889,298
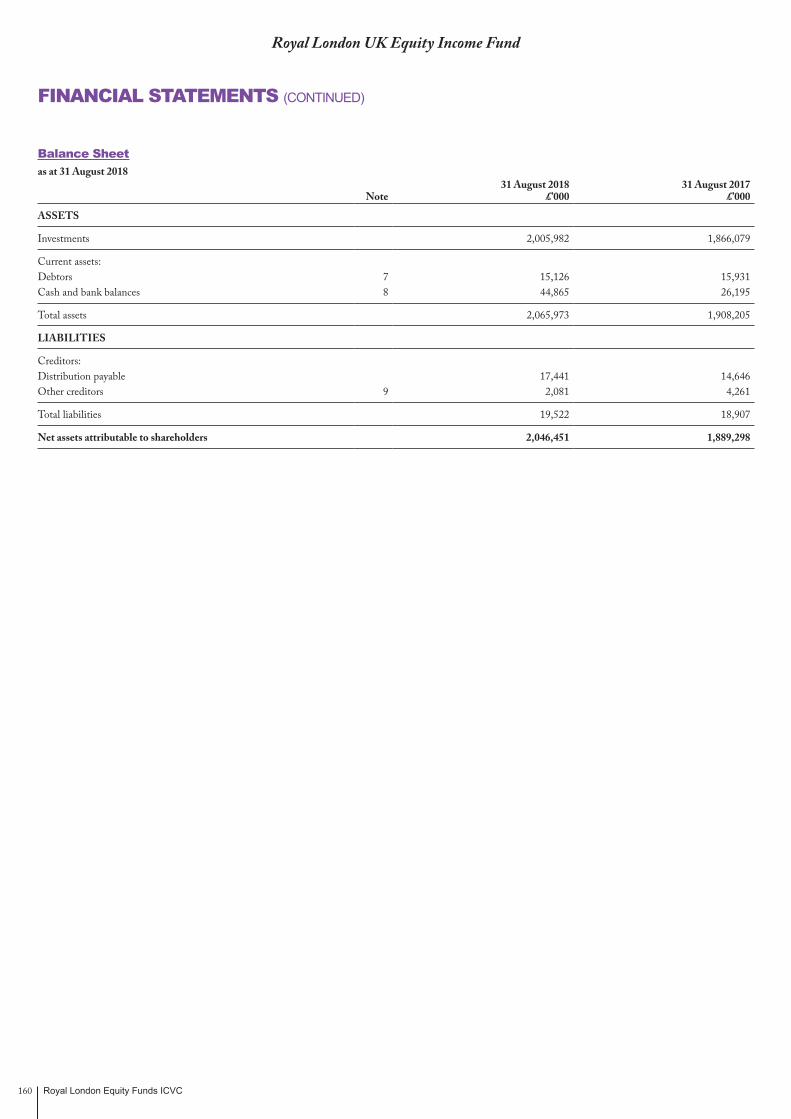
Royal London Equity Funds ICVC160
Royal London UK Equity Income Fund
FINANCIAL STATEMENTS (CONTINUED)
Balance Sheetas at 31 August 2018
Note31 August 2018
£’00031 August 2017
£’000
ASSETS
Investments 2,005,982 1,866,079
Current assets:Debtors 7 15,126 15,931 Cash and bank balances 8 44,865 26,195
Total assets 2,065,973 1,908,205
LIABILITIES
Creditors:Distribution payable 17,441 14,646 Other creditors 9 2,081 4,261
Total liabilities 19,522 18,907
Net assets attributable to shareholders 2,046,451 1,889,298

Royal London Equity Funds ICVC 161
Royal London UK Equity Income Fund
NOTES TO THE FINANCIAL STATEMENTSFOR THE YEAR ENDED 31 AUGUST 2018
1. Accounting policiesThe accounting policies are set out in note 1 on page 8.
2. Net capital gains31 August 2018
£’00031 August 2017
£’000The net capital gains during the year comprise:
Non-derivative securities 42,137 119,226
Activity fees (7) (21)
Net capital gains 42,130 119,205
3. Revenue31 August 2018
£’00031 August 2017
£’000UK dividends 78,697 67,647
Overseas dividends 1,204 836
Property investment income (PID) 3,582 2,404
Bank interest 95 14
Stock lending income 142 126
Underwriting commission – 3
Total revenue 83,720 71,030
4. Expenses31 August 2018
£’00031 August 2017
£’000Payable to the Authorised Corporate Director or associates of the Authorised Corporate Director and agents of either of them:Authorised Corporate Director's fee 14,000 12,530
Payable to the Depositary, associates of the Depositary and agents of either of them:
Depositary's fee 140 126
Safe custody fees 30 27
170 153
Other expenses:
Registrar's fees 811 875
Audit fee 13 13
Printing & stationery fee 3 7
Professional fee – 1
Legal fee 1 4
828 900
Total expenses 14,998 13,583

Royal London Equity Funds ICVC162
5. Taxationa) Analysis of charge for the year
31 August 2018£’000
31 August 2017£’000
Corporation tax at 20% – –
Current tax charge for the year – –
b) Factors affecting the current tax charge for the year The tax assessed for the year is lower (31/08/17: lower) than the standard rate of corporation tax in the UK for an Open Ended Investment Company (20%).
The differences are explained below:
Net revenue before taxation 68,722 57,447
Corporation tax at 20% 13,744 11,489
Effects of:
Revenue not subject to taxation (15,979) (13,697)
Current year management expenses not utilised 2,235 2,208
Current tax charge for the year – –
c) Provision for deferred taxThere was no provision required for deferred tax at the balance sheet date (31/08/17: same).
d) Factors that may affect future tax chargesAt the year end, there is a potential deferred tax asset of £17,069,000 (31/08/17: £14,834,000) in relation to surplus management expenses. It is unlikely the Fund will generate sufficient taxable profits in the future to utilise these expenses and therefore no deferred tax asset has been recognised in the year.
6. DistributionsThe distributions take account of income received on the issue of shares and income deducted on the cancellation of shares and comprise:
31 August 2018 £’000
31 August 2017 £’000
Accumulation shares
First Interim 4,842 3,453
Second Interim 5,052 4,043
Third Interim 6,429 5,312
Final 7,241 5,524
23,564 18,332
Income shares
First Interim 12,793 11,034
Second Interim 13,208 12,321
Third Interim 16,313 14,591
Final 17,441 14,646
59,755 52,592
83,319 70,924
Add: Amounts deducted on cancellation of shares 687 630
Deduct: Amounts received on the creation of shares (1,050) (1,033)
Net distributions for the year 82,956 70,521
The difference between the net revenue after taxation and the distribution paid is as follows:
Net revenue after taxation 68,722 57,447
Expenses charged to capital 14,998 13,583
Less: Tax relief on expenses charged to capital (764) (509)
Net distributions for the year 82,956 70,521
Details of the distribution per share are set out on pages 167 and 168.
Royal London UK Equity Income Fund
NOTES TO THE FINANCIAL STATEMENTS (CONTINUED)FOR THE YEAR ENDED 31 AUGUST 2018

Royal London Equity Funds ICVC 163
Royal London UK Equity Income Fund
NOTES TO THE FINANCIAL STATEMENTS (CONTINUED)FOR THE YEAR ENDED 31 AUGUST 2018
7. Debtors31 August 2018
£’00031 August 2017
£’000Amounts receivable on creation of shares 1,302 1,757
Sales awaiting settlement – 1,802
Accrued revenue 13,824 12,372
Total debtors 15,126 15,931
8. Cash and bank balances31 August 2018
£’00031 August 2017
£’000Cash and bank balances 44,865 26,195
Total cash and bank balances 44,865 26,195
9. Other creditors31 August 2018
£’00031 August 2017
£’000Amounts payable on cancellation of shares 560 714
Purchases awaiting settlement – 2,198
Accrued expenses 1,521 1,349
Total other creditors 2,081 4,261
10. Reconciliation of number of sharesClass A Income
Class MAccumulation
Class MIncome
Class ZIncome
Opening shares at 01/09/17 39,650,305 274,843,457 70,727,635 402,262,398
Shares issued 3,711,762 39,250,989 13,109,022 15,267,102
Shares cancelled (1,808,090) (8,191,220) (2,553,604) (60,202,740)
Shares converted (104,468) (4,224,947) (6,883,048) 53,148,776
Closing shares at 31/08/18 41,449,509 301,678,279 74,400,005 410,475,536
All classes within the Fund have the same rights on winding up.
11. Contingent liabilities and outstanding commitmentsThere were no contingent liabilities or outstanding commitments at the balance sheet date (31/08/17: same).
12. Related party transactionsThe Fund’s Authorised Corporate Director, Royal London Unit Trust Managers Limited, is a related party to the Fund as defined by Financial Reporting Standard 102 ‘Related Party Disclosures’.
Authorised Corporate Director fees charged by Royal London Unit Trust Managers Limited are shown in note 4 and details of shares created and cancelled by Royal London Unit Trust Managers Limited are shown in the Statement of Change in Net Assets Attributable to Shareholders and note 6. At the year end the balance due to Royal London Unit Trust Managers Limited in respect of these transactions was £498,000 (31/08/17: £94,000).
At the year end, 31 August 2018, 3.48% (31/08/17: 3.37%) of the shares in issue were held by The Royal London Mutual Insurance Society Limited. Royal London Unit Trust Managers Limited is a wholly owned subsidiary of The Royal London Mutual Insurance Society Limited.

Royal London Equity Funds ICVC164
13. Stock lending activitiesThe Fund carried out stock lending activities for the purpose of efficient portfolio management and in order to generate income. Revenue earned from these activities is shown in note 3 and is net of bank and agents fees amounting to £35,000 (Gross: £177,000) (31/08/17: £32,000 (Gross: £158,000)) payable to HSBC Bank plc.
The value of stock on loan at the balance sheet date was £109,242,000 (31/08/17: £77,479,000).
The collateral held by asset type at the year end is stated below:
Asset class
31 August 2018 Collateral Held
£’000
31 August 2017 Collateral Held
£’000Equities 107,590 79,918
Bonds 6,051 –
The aggregate value of collateral held at the balance sheet date was £113,641,000 (31/08/17: £79,918,000). Collateral may be in the form of cash, UK gilts, certificates of deposit, treasury bills, sovereign debt, eurosterling bonds and equities; where the ACD approves the asset it will be held to reduce counterparty exposure. The value of the collateral held is greater than the value of the securities on loan and is monitored as part of the efficient portfolio management process.
The counterparties at the year end were ABM Amro Bank, Bank of Nova Scotia, Credit Suisse Securities (Europe) limited, HSBC Bank, Natixis and Santander.
14. Risk disclosuresThe policies applied to the management of risk disclosures are set out on page 9.
The fair values of the Fund’s assets and liabilities are represented by the values shown in the balance sheet on page 160. There is no material difference between the value of the financial assets and liabilities, as shown in the balance sheet, and their fair value.
A small proportion of the Fund’s assets are denominated in currencies other than sterling. The value of the Fund’s assets may be affected by currency movements.
Currency31 August 2018
£’00031 August 2017
£’000Sterling 2,041,454 1,884,221
Euro 3 3
US dollar 4,994 5,074
Total 2,046,451 1,889,298
If sterling to foreign currency exchange rates had increased by 10% as at the balance sheet date, the net asset value of the Fund would have decreased by £500,000 (31/08/17: £508,000). If sterling to foreign currency exchange rates had decreased by 10% as at the balance sheet date, the net asset value of the Fund would have increased by £500,000 (31/08/17: £508,000). These calculations assume all other variables remain constant.
If market prices had increased by 10% as at the balance sheet date, the net asset value of the Fund would have increased by £200,598,000 (31/08/17: £186,608,000). If market prices had decreased by 10% as at the balance sheet date, the net asset value of the Fund would have decreased by £200,598,000 (31/08/17: £186,608,000). These calculations assume all other variables remain constant.
The only interest bearing assets are cash balances of £44,865,000 (31/08/17: £26,195,000) which earn interest by reference to LIBOR or international equivalent.
Interest risk is considered insignificant so no sensitivity analysis is required (31/08/17: same).
FX risk is insignificant (31/08/17: same).
Royal London UK Equity Income Fund
NOTES TO THE FINANCIAL STATEMENTS (CONTINUED)FOR THE YEAR ENDED 31 AUGUST 2018

Royal London Equity Funds ICVC 165
15. Portfolio transaction costsFor the year ended 31 August 2018
Value Commissions Taxes Other expenses TotalAnalysis of total purchases costs £’000 £’000 % £’000 % £’000 % £’000Equity transactions 213,803 199 0.09 877 0.41 100 0.05 214,979
Corporate actions 20,321 – – – – – – 20,321
Total 234,124 199 877 100 235,300
Value Commissions Taxes Other expenses TotalAnalysis of total sales costs £’000 £’000 % £’000 % £’000 % £’000Equity transactions 137,692 158 0.11 – – – – 137,534
Total 137,692 158 – – 137,534
Commissions, taxes and fees as % of average net assetsCommissions 0.02%Taxes 0.04%Other expenses 0.01%
For the year ended 31 August 2017
Value Commissions Taxes Other expenses TotalAnalysis of total purchases costs £’000 £’000 % £’000 % £’000 % £’000Equity transactions 441,375 476 0.11 2,140 0.48 36 0.01 444,027
Corporate actions 7,976 – – – – – – 7,976
Total 449,351 476 2,140 36 452,003
Value Commissions Taxes Other expenses TotalAnalysis of total sales costs £’000 £’000 % £’000 % £’000 % £’000Equity transactions 317,693 454 0.14 – – – – 317,239
Corporate actions 11,168 – – – – – – 11,168
Total 328,861 454 – – 328,407
Commissions, taxes and fees as % of average net assetsCommissions 0.05%Taxes 0.12%Other expenses 0.00%
At the balance sheet date the portfolio dealing spread was 0.10% (31/08/17: 0.09%). The Fund is single priced throughout the year and therefore the dealing spread is not indicative of the full year.
Royal London UK Equity Income Fund
NOTES TO THE FINANCIAL STATEMENTS (CONTINUED)FOR THE YEAR ENDED 31 AUGUST 2018
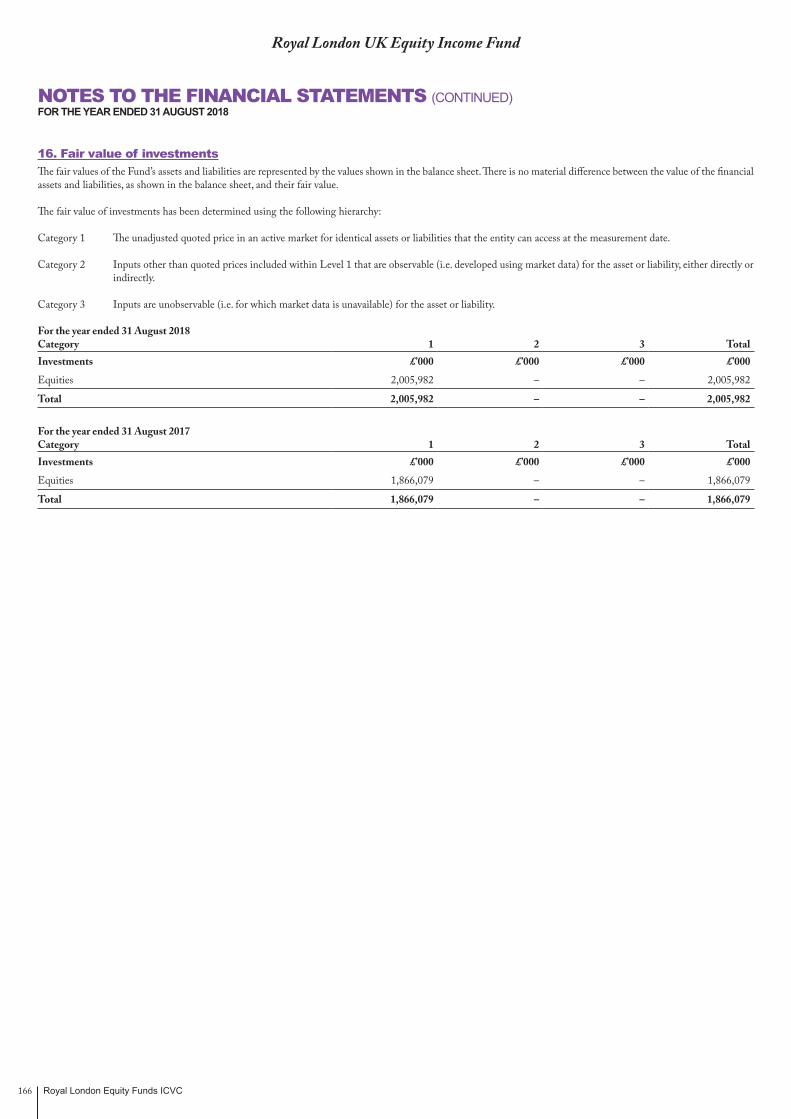
Royal London Equity Funds ICVC166
16. Fair value of investmentsThe fair values of the Fund’s assets and liabilities are represented by the values shown in the balance sheet. There is no material difference between the value of the financial assets and liabilities, as shown in the balance sheet, and their fair value.
The fair value of investments has been determined using the following hierarchy:
Category 1 The unadjusted quoted price in an active market for identical assets or liabilities that the entity can access at the measurement date.
Category 2 Inputs other than quoted prices included within Level 1 that are observable (i.e. developed using market data) for the asset or liability, either directly or indirectly.
Category 3 Inputs are unobservable (i.e. for which market data is unavailable) for the asset or liability.
For the year ended 31 August 2018 Category 1 2 3 TotalInvestments £’000 £’000 £’000 £’000
Equities 2,005,982 – – 2,005,982
Total 2,005,982 – – 2,005,982
For the year ended 31 August 2017 Category 1 2 3 TotalInvestments £’000 £’000 £’000 £’000
Equities 1,866,079 – – 1,866,079
Total 1,866,079 – – 1,866,079
Royal London UK Equity Income Fund
NOTES TO THE FINANCIAL STATEMENTS (CONTINUED)FOR THE YEAR ENDED 31 AUGUST 2018

Royal London Equity Funds ICVC 167
Distribution in pence per share
FIRST INTERIMGroup 1: Shares purchased prior to 1 September 2017Group 2: Shares purchased between 1 September 2017 and 30 November 2017
Distribution DistributionNet paid paid
income Equalisation 31/01/18 31/01/17Class A IncomeGroup 1 7.1502 – 7.1502 6.4283Group 2 4.2630 2.8872 7.1502 6.4283
Class M AccumulationGroup 1 1.7516 – 1.7516 1.5047Group 2 0.9071 0.8445 1.7516 1.5047
Class M IncomeGroup 1 7.4690 – 7.4690 6.6721Group 2 4.7186 2.7504 7.4690 6.6721
Class Z IncomeGroup 1 1.1206 – 1.1206 1.0003Group 2 0.4407 0.6799 1.1206 1.0003
SECOND INTERIMGroup 1: Shares purchased prior to 1 December 2017Group 2: Shares purchased between 1 December 2017 and 28 February 2018
Distribution DistributionNet paid paid
income Equalisation 30/04/18 30/04/17Class A IncomeGroup 1 7.1629 – 7.1629 6.9953Group 2 3.9661 3.1968 7.1629 6.9953
Class M AccumulationGroup 1 1.7738 – 1.7738 1.6550Group 2 1.0005 0.7733 1.7738 1.6550
Class M IncomeGroup 1 7.4942 – 7.4942 7.2737Group 2 4.2857 3.2085 7.4942 7.2737
Class Z IncomeGroup 1 1.1246 – 1.1246 1.0908Group 2 0.7415 0.3831 1.1246 1.0908
Royal London UK Equity Income Fund
DISTRIBUTION TABLESFOR THE YEAR ENDED 31 AUGUST 2018
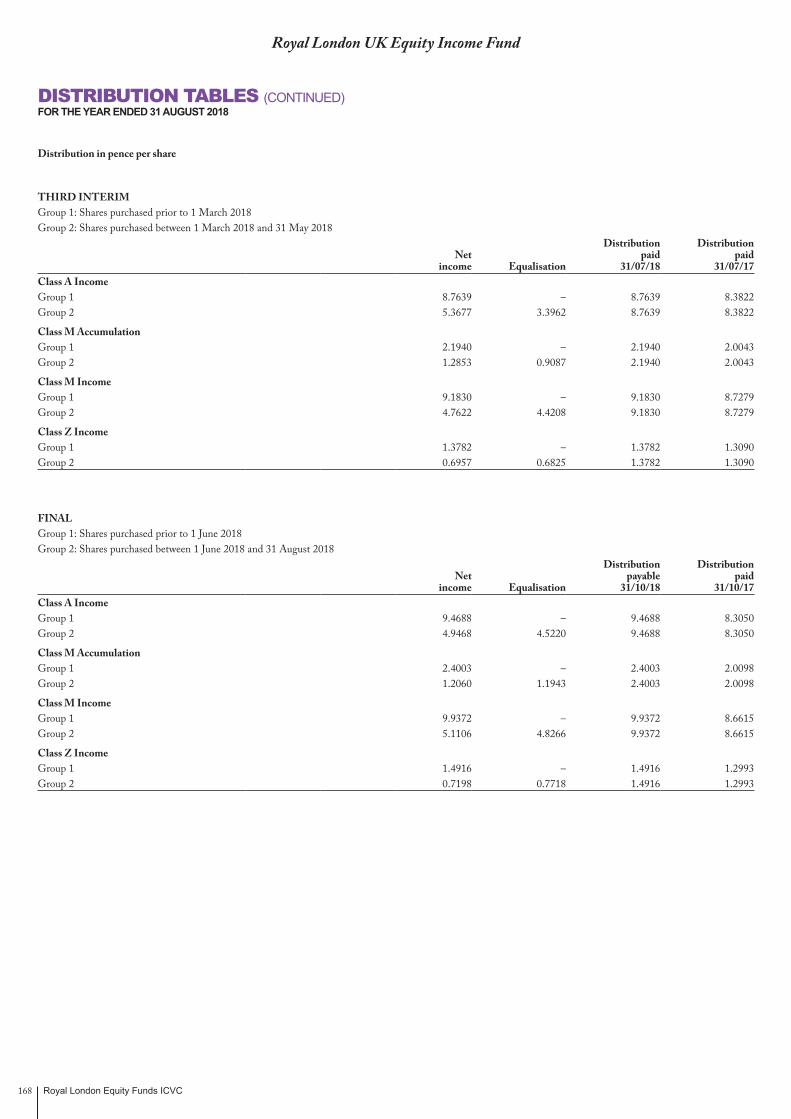
Royal London Equity Funds ICVC168
Royal London UK Equity Income Fund
DISTRIBUTION TABLES (CONTINUED)FOR THE YEAR ENDED 31 AUGUST 2018
Distribution in pence per share
THIRD INTERIMGroup 1: Shares purchased prior to 1 March 2018Group 2: Shares purchased between 1 March 2018 and 31 May 2018
Distribution DistributionNet paid paid
income Equalisation 31/07/18 31/07/17Class A IncomeGroup 1 8.7639 – 8.7639 8.3822Group 2 5.3677 3.3962 8.7639 8.3822
Class M AccumulationGroup 1 2.1940 – 2.1940 2.0043Group 2 1.2853 0.9087 2.1940 2.0043
Class M IncomeGroup 1 9.1830 – 9.1830 8.7279Group 2 4.7622 4.4208 9.1830 8.7279
Class Z IncomeGroup 1 1.3782 – 1.3782 1.3090Group 2 0.6957 0.6825 1.3782 1.3090
FINALGroup 1: Shares purchased prior to 1 June 2018Group 2: Shares purchased between 1 June 2018 and 31 August 2018
Distribution DistributionNet payable paid
income Equalisation 31/10/18 31/10/17Class A IncomeGroup 1 9.4688 – 9.4688 8.3050Group 2 4.9468 4.5220 9.4688 8.3050
Class M AccumulationGroup 1 2.4003 – 2.4003 2.0098Group 2 1.2060 1.1943 2.4003 2.0098
Class M IncomeGroup 1 9.9372 – 9.9372 8.6615Group 2 5.1106 4.8266 9.9372 8.6615
Class Z IncomeGroup 1 1.4916 – 1.4916 1.2993Group 2 0.7198 0.7718 1.4916 1.2993

Royal London Equity Funds ICVC 169
Royal London UK Equity Fund
Fund Performance12 months to 31 August 2018
1 year total return
%
3 year total return
%
5 year total return
%Royal London UK Equity Fund, Class M Accumulation 8.17 32.43 46.52
Past performance is not necessarily a reliable indicator of future performance. The value of investments and the income from them is not guaranteed and may go down as well as up, and investors may not get back the amount originally invested.
Source: RLAM and Lipper, as at 31 August 2018. Returns are net of management fees. Please note that the performance table contains performance for fund share classes only. Investors should also note that the total return is calculated on the Fund’s official midday price whereas the Fund has been valued as at close of business for the Net Asset Value quoted within the Comparative Table. For wider comparisons such as Investment Association sector averages and peer group rankings, please refer to the latest factsheet at www.rlam.co.uk.
Performance OverviewThe return from the Fund was well ahead of the wider UK equity market during the 12-month period under review, using the FTSE® All-Share Index as a guide. Good stock selection and taking of profits on portfolio holdings contributed to this performance.
Market and Portfolio CommentaryOver the last 12 months, equity markets moved higher and delivered attractive returns. The reason for this lies in the continuing strength of the global economy, and in particular corporate earnings. In the US, earnings were on a rising trend when they received a further boost as President Trump introduced legislation that reduced corporate tax rates, allowing companies to keep a greater part of their profits. As a result, corporate confidence has continued to rise and unemployment levels in the US are now close to 10-year lows. As a consequence of the US economy’s strength, the Federal Reserve has continued on the path of small but gradual rises in interest rates to keep inflationary forces in check. A recent rise to 2.25% has been enacted, but in comparison to history, the current rate remains stimulatory and provides an attractive financing rate for corporates.
A recent feature has been the backdrop of skirmishing with regard to global trade and the implementation of tariffs between the US and partners such as China, Canada, Germany and Mexico. Ultimately, increased protectionism is negative for the global economy and at its worst would result in a slowing of world growth; however, at this juncture it would appear that the threats are a negotiation tool.
Around the world, most other regions are growing at reasonable levels. Europe continues to implement a series of structural reforms, whilst growing at a reasonable pace by their own standards. In Asia, and China in particular, growth continues to be as expected, although the strength of the dollar against local currencies is causing a few problems and needs to be monitored. The biggest concern is probably closer to home in the form of Brexit, but as the outcomes are difficult to forecast and the UK equity market is largely global in the makeup of its constituents, we are not overly concerned.
With regards to the portfolio, we remain biased towards a range of companies with attractive end markets, strong management teams and the ability to defend their market positions from competition. The best performers during the period under review included Victrex and Croda International, high quality chemical companies which remained well placed for the future. Returns also benefited from profit-taking on the holding in industrial company GKN, which was purchased by Melrose Industries after a high profile takeover battle.
The biggest negative influence during the period was having no holding in television broadcaster Sky, which was the subject of takeover approaches. With regards to positions held in the Fund, Saga and Babcock International both disappointed, which resulted in the downgrade to profit forecasts going forward.
The Fund continues to seek those companies that can deliver sustained growth, despite the challenges of the economic environment. The factors that we particularly focus upon include the quality of the business model, the strength of the management team and a macroeconomic assessment of where corporates can find the most supportive operating conditions to run a business.
Investment OutlookThe outlook for equity markets remains attractive, despite the strength of recent years, which is reflected in the Fund’s robust 3-year and 5-year returns. Economies and corporate earnings in particular are growing at a reasonable pace and are the biggest contributor to rising share prices. The backdrop of historically low interest rates provides corporates with stimulatory conditions, but also means that consumers who hold cash receive little return. Prolonged falls in equity markets are normally a result of recessions, and currently we are not close to those conditions. We must remain watchful regarding the pace of interest rate rises, trade talks and the ability of inflation to revive; however, for now corporate earnings are setting the direction for markets, and that looks well set for the time.
Joe WaltersFund Manager31 August 2018Royal London Asset Management
Please note that Joe Walters started managing the Fund on 2 January 2018. The previous Fund Manager was Ivor Pether.
The views expressed are the author’s own and do not constitute investment advice and are not an indication of future fund performance. Portfolio holdings are subject to change, for information only and are not investment recommendations.
Source: Royal London Asset Management, unless otherwise stated.
MANAGER’S INVESTMENT REPORT

Royal London Equity Funds ICVC170
Royal London UK Equity Fund
COMPARATIVE TABLES
Class A Accumulation31/08/18** 31/08/17 31/08/16
Change in net assets per share (p) (p) (p)
Opening net asset value per share 1,096.75 984.03 915.32
Return before operating charges* 57.60 126.17 80.42
Operating charges (5.78) (13.45) (11.71)
Return after operating charges* 51.82 112.72 68.71
Distributions on accumulation shares – (27.02) (25.03)
Retained distributions on accumulation shares – 27.02 25.03
Cancellation price (1,148.57) – –
Closing net asset value per share – 1,096.75 984.03
* after direct transaction costs of: 0.91 1.20 0.81
Performance
Return after charges 4.72% 11.45% 7.51%
Other information
Closing net asset value (£’000) – 620,956 480,019
Closing number of shares – 56,617,569 48,781,034
Operating charges – 1.28% 1.29%
Direct transaction costs 0.08% 0.12% 0.09%
Prices^
Highest share price 1,172.00 1,116.00 997.20
Lowest share price 1,075.00 963.20 810.60
** From 25 January 2018 shareholders in Class A Accumulation converted to Class M Accumulation.

Royal London Equity Funds ICVC 171
Royal London UK Equity Fund
COMPARATIVE TABLES (CONTINUED)
Class M Accumulation31/08/18 31/08/17 31/08/16
Change in net assets per share (p) (p) (p)
Opening net asset value per share 158.18 141.03 130.35
Return before operating charges* 12.56 18.13 11.53
Operating charges (1.08) (0.98) (0.85)
Return after operating charges* 11.48 17.15 10.68
Distributions on accumulation shares (5.07) (4.84) (4.40)
Retained distributions on accumulation shares 5.07 4.84 4.40
Closing net asset value per share 169.66 158.18 141.03
* after direct transaction costs of: 0.14 0.17 0.12
Performance
Return after charges 7.26% 12.16% 8.19%
Other information
Closing net asset value (£’000) 683,340 6,207 4,650
Closing number of shares 402,761,405 3,923,828 3,296,944
Operating charges 0.65% 0.65% 0.66%
Direct transaction costs 0.08% 0.12% 0.09%
Prices^
Highest share price 176.30 160.70 142.90
Lowest share price 153.50 138.20 115.80
^ The high and low prices disclosed are the high and low prices for the accounting period and not the calendar year. The net asset value per share price is based on the net asset value in the published financial statements and may be different due to the prior year end accounting adjustments.
It should be remembered that past performance is not a reliable indicator of future performance and that the value of shares, and the income derived from them, can vary.
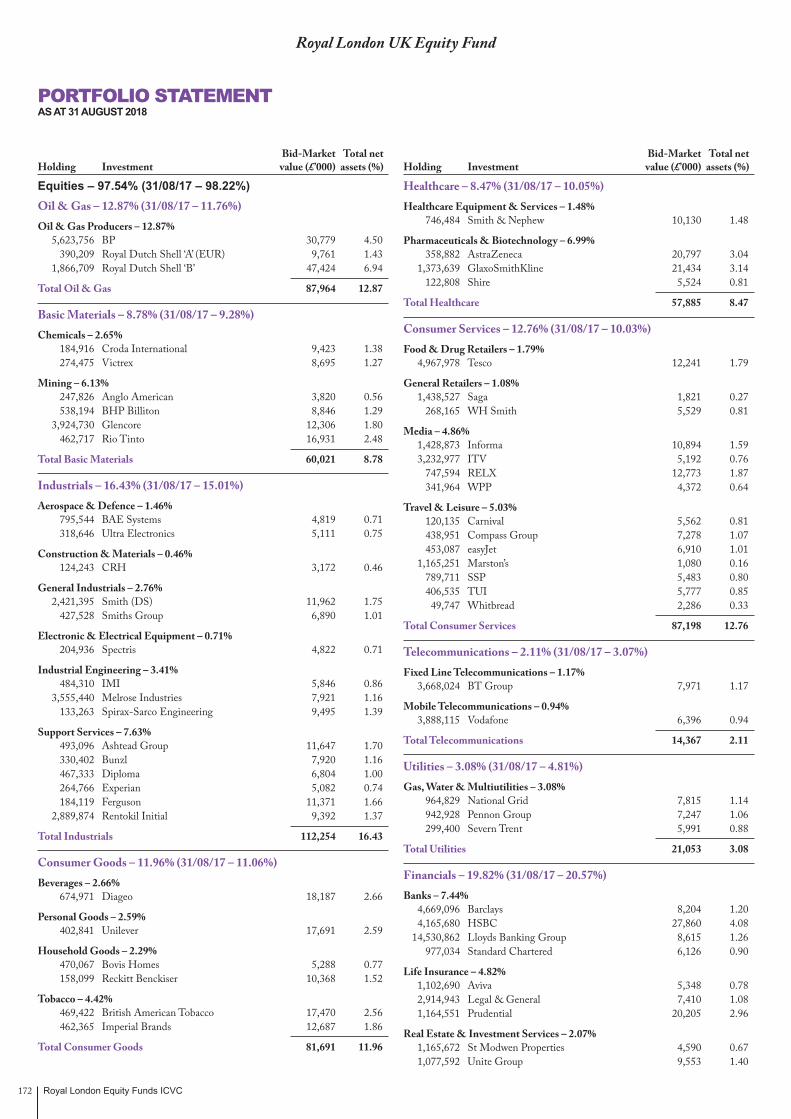
Royal London Equity Funds ICVC172
Royal London UK Equity Fund
Equities – 97.54% (31/08/17 – 98.22%) Oil & Gas – 12.87% (31/08/17 – 11.76%) Oil & Gas Producers – 12.87% 5,623,756 BP 30,779 4.50 390,209 Royal Dutch Shell ‘A’ (EUR) 9,761 1.43 1,866,709 Royal Dutch Shell ‘B’ 47,424 6.94
Total Oil & Gas 87,964 12.87
Basic Materials – 8.78% (31/08/17 – 9.28%) Chemicals – 2.65% 184,916 Croda International 9,423 1.38 274,475 Victrex 8,695 1.27
Mining – 6.13% 247,826 Anglo American 3,820 0.56 538,194 BHP Billiton 8,846 1.29 3,924,730 Glencore 12,306 1.80 462,717 Rio Tinto 16,931 2.48
Total Basic Materials 60,021 8.78
Industrials – 16.43% (31/08/17 – 15.01%) Aerospace & Defence – 1.46% 795,544 BAE Systems 4,819 0.71 318,646 Ultra Electronics 5,111 0.75
Construction & Materials – 0.46% 124,243 CRH 3,172 0.46
General Industrials – 2.76% 2,421,395 Smith (DS) 11,962 1.75 427,528 Smiths Group 6,890 1.01
Electronic & Electrical Equipment – 0.71% 204,936 Spectris 4,822 0.71
Industrial Engineering – 3.41% 484,310 IMI 5,846 0.86 3,555,440 Melrose Industries 7,921 1.16 133,263 Spirax-Sarco Engineering 9,495 1.39
Support Services – 7.63% 493,096 Ashtead Group 11,647 1.70 330,402 Bunzl 7,920 1.16 467,333 Diploma 6,804 1.00 264,766 Experian 5,082 0.74 184,119 Ferguson 11,371 1.66 2,889,874 Rentokil Initial 9,392 1.37
Total Industrials 112,254 16.43
Consumer Goods – 11.96% (31/08/17 – 11.06%) Beverages – 2.66% 674,971 Diageo 18,187 2.66
Personal Goods – 2.59% 402,841 Unilever 17,691 2.59
Household Goods – 2.29% 470,067 Bovis Homes 5,288 0.77 158,099 Reckitt Benckiser 10,368 1.52
Tobacco – 4.42% 469,422 British American Tobacco 17,470 2.56 462,365 Imperial Brands 12,687 1.86
Total Consumer Goods 81,691 11.96
Healthcare – 8.47% (31/08/17 – 10.05%) Healthcare Equipment & Services – 1.48% 746,484 Smith & Nephew 10,130 1.48
Pharmaceuticals & Biotechnology – 6.99% 358,882 AstraZeneca 20,797 3.04 1,373,639 GlaxoSmithKline 21,434 3.14 122,808 Shire 5,524 0.81
Total Healthcare 57,885 8.47
Consumer Services – 12.76% (31/08/17 – 10.03%) Food & Drug Retailers – 1.79% 4,967,978 Tesco 12,241 1.79
General Retailers – 1.08% 1,438,527 Saga 1,821 0.27 268,165 WH Smith 5,529 0.81
Media – 4.86% 1,428,873 Informa 10,894 1.59 3,232,977 ITV 5,192 0.76 747,594 RELX 12,773 1.87 341,964 WPP 4,372 0.64
Travel & Leisure – 5.03% 120,135 Carnival 5,562 0.81 438,951 Compass Group 7,278 1.07 453,087 easyJet 6,910 1.01 1,165,251 Marston’s 1,080 0.16 789,711 SSP 5,483 0.80 406,535 TUI 5,777 0.85 49,747 Whitbread 2,286 0.33
Total Consumer Services 87,198 12.76
Telecommunications – 2.11% (31/08/17 – 3.07%) Fixed Line Telecommunications – 1.17% 3,668,024 BT Group 7,971 1.17
Mobile Telecommunications – 0.94% 3,888,115 Vodafone 6,396 0.94
Total Telecommunications 14,367 2.11
Utilities – 3.08% (31/08/17 – 4.81%) Gas, Water & Multiutilities – 3.08% 964,829 National Grid 7,815 1.14 942,928 Pennon Group 7,247 1.06 299,400 Severn Trent 5,991 0.88
Total Utilities 21,053 3.08
Financials – 19.82% (31/08/17 – 20.57%) Banks – 7.44% 4,669,096 Barclays 8,204 1.20 4,165,680 HSBC 27,860 4.08 14,530,862 Lloyds Banking Group 8,615 1.26 977,034 Standard Chartered 6,126 0.90
Life Insurance – 4.82% 1,102,690 Aviva 5,348 0.78 2,914,943 Legal & General 7,410 1.08 1,164,551 Prudential 20,205 2.96
Real Estate & Investment Services – 2.07% 1,165,672 St Modwen Properties 4,590 0.67 1,077,592 Unite Group 9,553 1.40
PORTFOLIO STATEMENTAS AT 31 AUGUST 2018
Bid-Market Total net Holding Investment value (£’000) assets (%)
Bid-Market Total net Holding Investment value (£’000) assets (%)
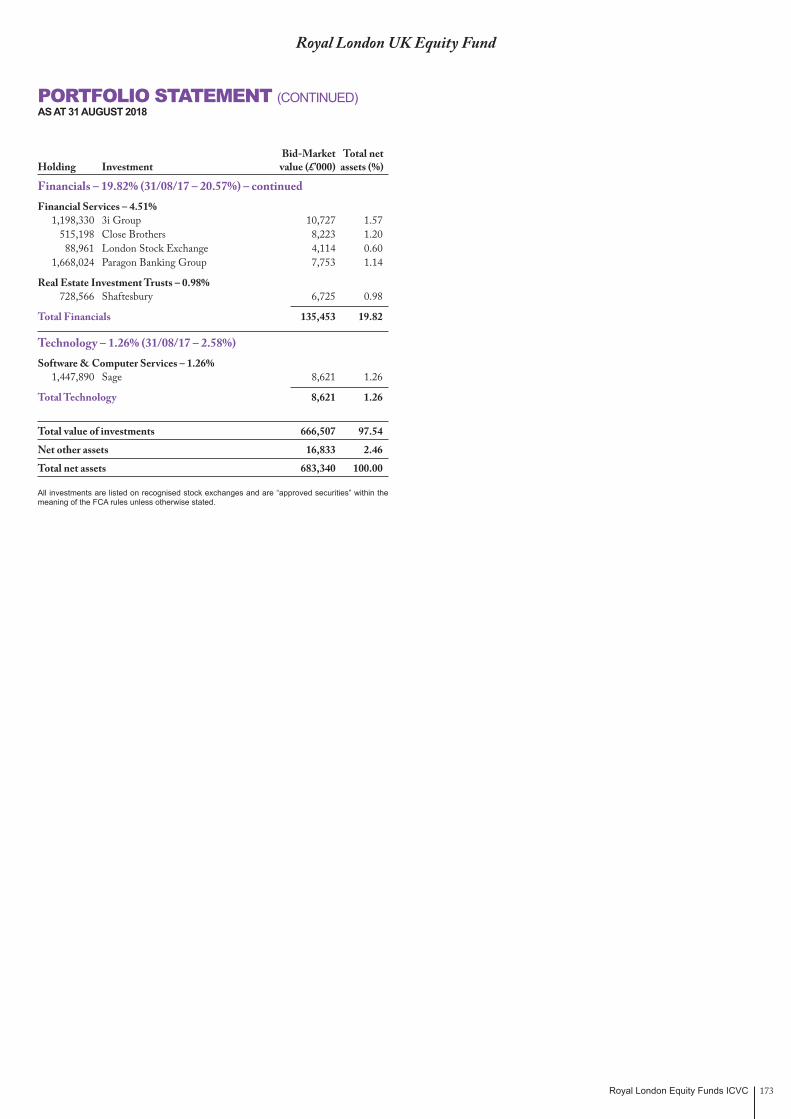
Royal London Equity Funds ICVC 173
PORTFOLIO STATEMENT (CONTINUED)AS AT 31 AUGUST 2018
Royal London UK Equity Fund
Bid-Market Total net Holding Investment value (£’000) assets (%)
Financials – 19.82% (31/08/17 – 20.57%) – continued Financial Services – 4.51% 1,198,330 3i Group 10,727 1.57 515,198 Close Brothers 8,223 1.20 88,961 London Stock Exchange 4,114 0.60 1,668,024 Paragon Banking Group 7,753 1.14
Real Estate Investment Trusts – 0.98% 728,566 Shaftesbury 6,725 0.98
Total Financials 135,453 19.82
Technology – 1.26% (31/08/17 – 2.58%) Software & Computer Services – 1.26% 1,447,890 Sage 8,621 1.26
Total Technology 8,621 1.26
Total value of investments 666,507 97.54
Net other assets 16,833 2.46
Total net assets 683,340 100.00
All investments are listed on recognised stock exchanges and are “approved securities” within the meaning of the FCA rules unless otherwise stated.
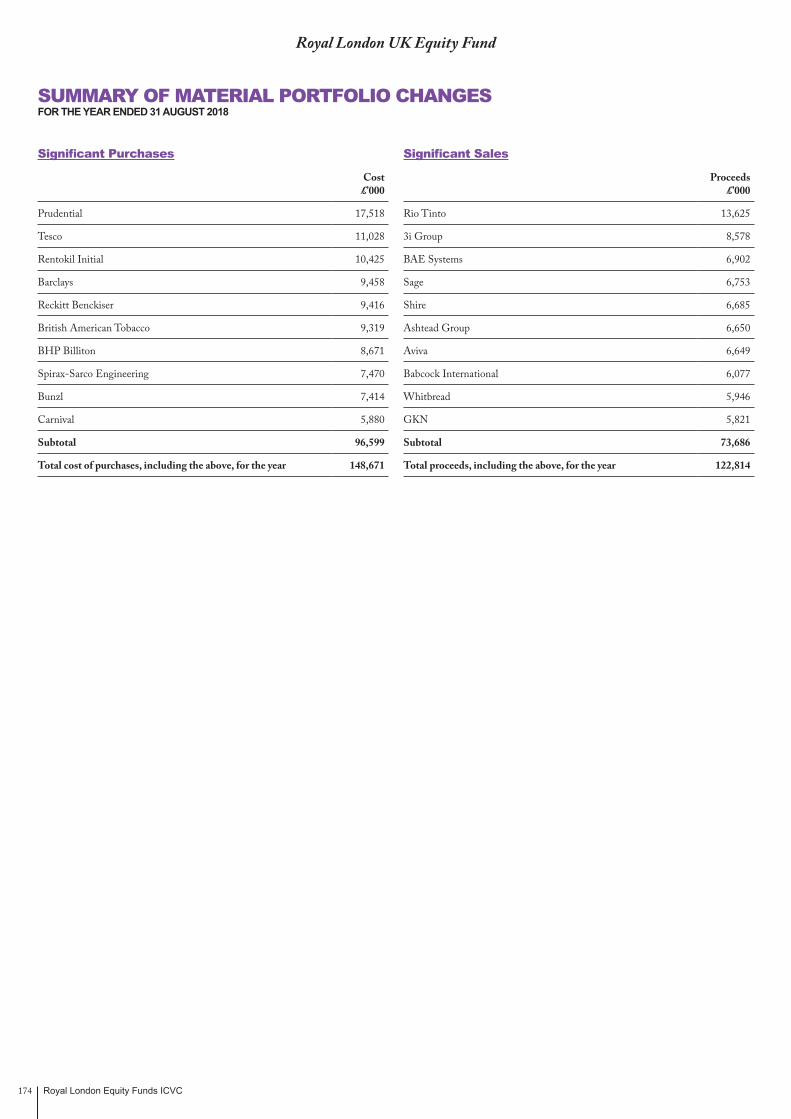
Royal London Equity Funds ICVC174
Royal London UK Equity Fund
SUMMARY OF MATERIAL PORTFOLIO CHANGESFOR THE YEAR ENDED 31 AUGUST 2018
Significant Purchases
Cost £’000
Prudential 17,518
Tesco 11,028
Rentokil Initial 10,425
Barclays 9,458
Reckitt Benckiser 9,416
British American Tobacco 9,319
BHP Billiton 8,671
Spirax-Sarco Engineering 7,470
Bunzl 7,414
Carnival 5,880
Subtotal 96,599
Total cost of purchases, including the above, for the year 148,671
Significant Sales
Proceeds £’000
Rio Tinto 13,625
3i Group 8,578
BAE Systems 6,902
Sage 6,753
Shire 6,685
Ashtead Group 6,650
Aviva 6,649
Babcock International 6,077
Whitbread 5,946
GKN 5,821
Subtotal 73,686
Total proceeds, including the above, for the year 122,814
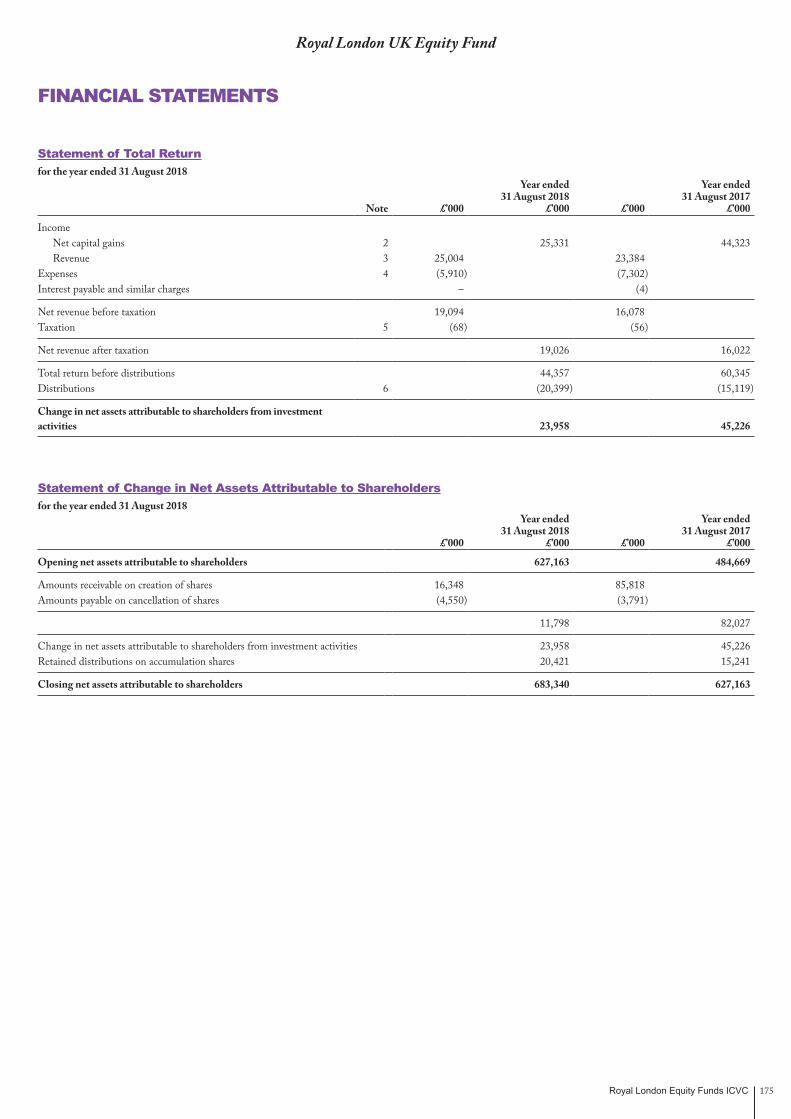
Royal London Equity Funds ICVC 175
Royal London UK Equity Fund
FINANCIAL STATEMENTS
Statement of Total Returnfor the year ended 31 August 2018
Note £’000
Year ended31 August 2018
£’000 £’000
Year ended31 August 2017
£’000
Income Net capital gains 2 25,331 44,323 Revenue 3 25,004 23,384
Expenses 4 (5,910) (7,302)Interest payable and similar charges – (4)
Net revenue before taxation 19,094 16,078 Taxation 5 (68) (56)
Net revenue after taxation 19,026 16,022
Total return before distributions 44,357 60,345 Distributions 6 (20,399) (15,119)
Change in net assets attributable to shareholders from investment activities 23,958 45,226
Statement of Change in Net Assets Attributable to Shareholdersfor the year ended 31 August 2018
£’000
Year ended31 August 2018
£’000 £’000
Year ended31 August 2017
£’000
Opening net assets attributable to shareholders 627,163 484,669
Amounts receivable on creation of shares 16,348 85,818 Amounts payable on cancellation of shares (4,550) (3,791)
11,798 82,027
Change in net assets attributable to shareholders from investment activities 23,958 45,226 Retained distributions on accumulation shares 20,421 15,241
Closing net assets attributable to shareholders 683,340 627,163
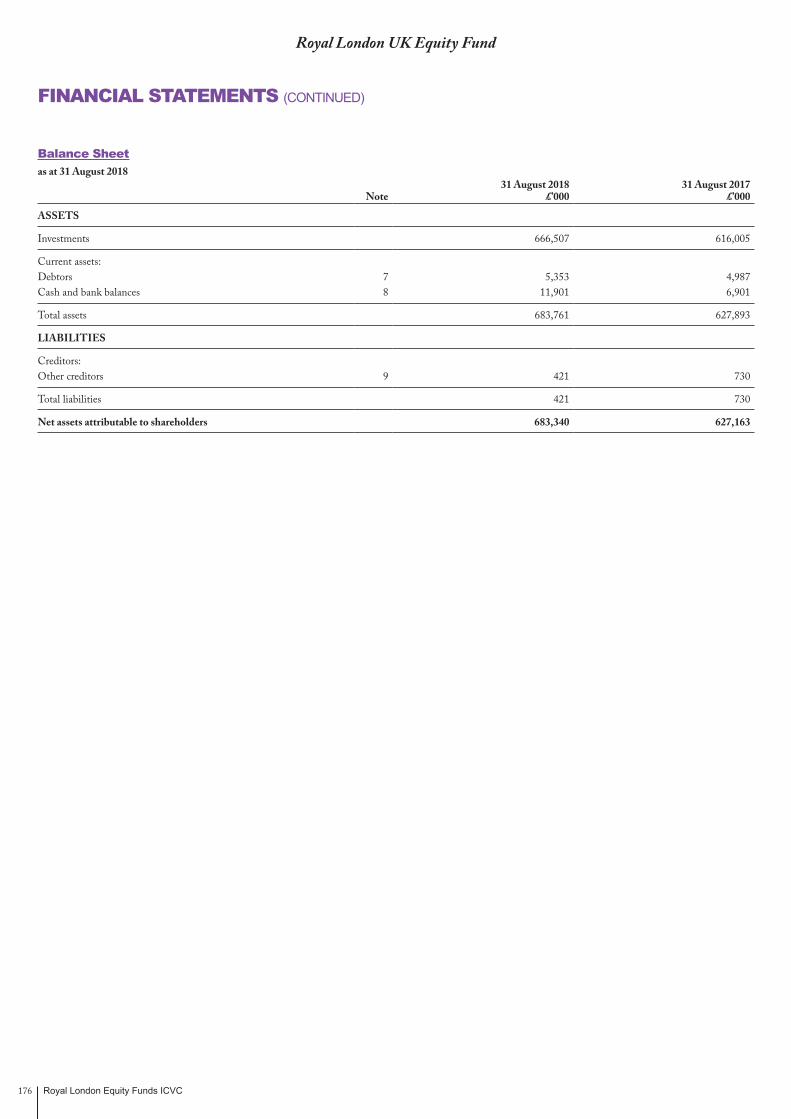
Royal London Equity Funds ICVC176
Royal London UK Equity Fund
FINANCIAL STATEMENTS (CONTINUED)
Balance Sheetas at 31 August 2018
Note31 August 2018
£’00031 August 2017
£’000
ASSETS
Investments 666,507 616,005
Current assets:Debtors 7 5,353 4,987 Cash and bank balances 8 11,901 6,901
Total assets 683,761 627,893
LIABILITIES
Creditors:Other creditors 9 421 730
Total liabilities 421 730
Net assets attributable to shareholders 683,340 627,163

Royal London Equity Funds ICVC 177
Royal London UK Equity Fund
NOTES TO THE FINANCIAL STATEMENTSFOR THE YEAR ENDED 31 AUGUST 2018
1. Accounting policiesThe accounting policies are set out in note 1 on page 8.
2. Net capital gains31 August 2018
£’00031 August 2017
£’000The net capital gains during the year comprise:
Non-derivative securities 25,334 44,325
Currency losses (1) –
Activity fees (2) (2)
Net capital gains 25,331 44,323
3. Revenue31 August 2018
£’00031 August 2017
£’000UK dividends 23,241 21,833
Overseas dividends 1,177 521
Property investment income (PID) 268 106
Bank interest 24 3
Stock lending income 28 16
Underwriting commission – 2
Stock dividends 266 903
Total revenue 25,004 23,384
4. Expenses31 August 2018
£’00031 August 2017
£’000Payable to the Authorised Corporate Director or associates of the Authorised Corporate Director and agents of either of them:Authorised Corporate Director's fee 5,718 7,118
Payable to the Depositary, associates of the Depositary and agents of either of them:
Depositary's fee 61 54
Safe custody fees 10 9
71 63
Other expenses:
Registrar's fees 106 103
Audit fee 10 11
Printing & stationery fee 3 6
Legal fee 2 1
121 121
Total expenses 5,910 7,302
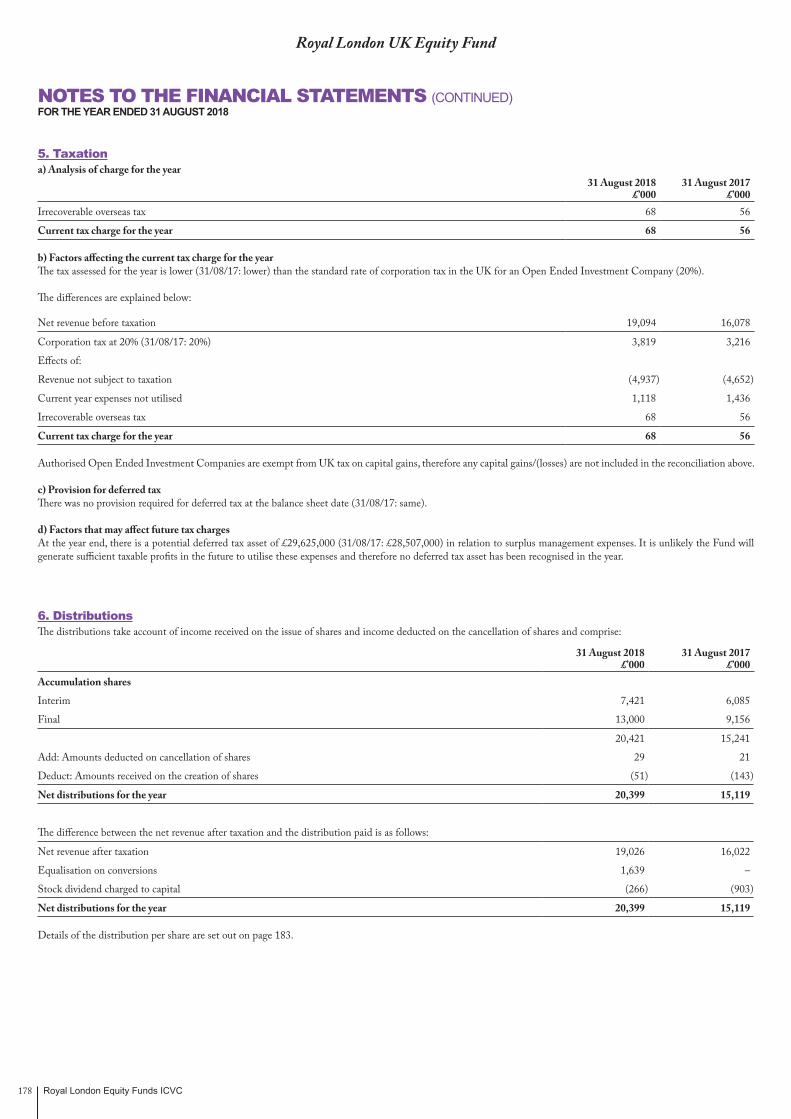
Royal London Equity Funds ICVC178
5. Taxationa) Analysis of charge for the year
31 August 2018£’000
31 August 2017£’000
Irrecoverable overseas tax 68 56
Current tax charge for the year 68 56
b) Factors affecting the current tax charge for the year The tax assessed for the year is lower (31/08/17: lower) than the standard rate of corporation tax in the UK for an Open Ended Investment Company (20%).
The differences are explained below:
Net revenue before taxation 19,094 16,078
Corporation tax at 20% (31/08/17: 20%) 3,819 3,216
Effects of:
Revenue not subject to taxation (4,937) (4,652)
Current year expenses not utilised 1,118 1,436
Irrecoverable overseas tax 68 56
Current tax charge for the year 68 56
Authorised Open Ended Investment Companies are exempt from UK tax on capital gains, therefore any capital gains/(losses) are not included in the reconciliation above.
c) Provision for deferred taxThere was no provision required for deferred tax at the balance sheet date (31/08/17: same).
d) Factors that may affect future tax chargesAt the year end, there is a potential deferred tax asset of £29,625,000 (31/08/17: £28,507,000) in relation to surplus management expenses. It is unlikely the Fund will generate sufficient taxable profits in the future to utilise these expenses and therefore no deferred tax asset has been recognised in the year.
6. DistributionsThe distributions take account of income received on the issue of shares and income deducted on the cancellation of shares and comprise:
31 August 2018 £’000
31 August 2017 £’000
Accumulation shares
Interim 7,421 6,085
Final 13,000 9,156
20,421 15,241
Add: Amounts deducted on cancellation of shares 29 21
Deduct: Amounts received on the creation of shares (51) (143)
Net distributions for the year 20,399 15,119
The difference between the net revenue after taxation and the distribution paid is as follows:
Net revenue after taxation 19,026 16,022
Equalisation on conversions 1,639 –
Stock dividend charged to capital (266) (903)
Net distributions for the year 20,399 15,119
Details of the distribution per share are set out on page 183.
Royal London UK Equity Fund
NOTES TO THE FINANCIAL STATEMENTS (CONTINUED)FOR THE YEAR ENDED 31 AUGUST 2018

Royal London Equity Funds ICVC 179
Royal London UK Equity Fund
NOTES TO THE FINANCIAL STATEMENTS (CONTINUED)FOR THE YEAR ENDED 31 AUGUST 2018
7. Debtors31 August 2018
£’00031 August 2017
£’000Amounts receivable on creation of shares 28 13
Sales awaiting settlement 67 –
Accrued revenue 5,217 4,967
Withholding tax recoverable 41 7
Total debtors 5,353 4,987
8. Cash and bank balances31 August 2018
£’00031 August 2017
£’000Cash and bank balances 11,901 6,901
Total cash and bank balances 11,901 6,901
9. Other creditors31 August 2018
£’00031 August 2017
£’000Amounts payable on cancellation of shares – 25
Accrued expenses 421 705
Total other creditors 421 730
10. Reconciliation of number of sharesClass A
AccumulationClass M
AccumulationOpening shares at 01/09/17 56,617,569 3,923,828
Shares issued 1,147,020 2,096,906
Shares cancelled (103,168) (2,054,357)
Shares converted (57,661,421) 398,795,028
Closing shares at 31/08/18 – 402,761,405
All classes within the Fund have the same rights on winding up.
11. Contingent liabilities and outstanding commitmentsThere were no contingent liabilities or outstanding commitments at the balance sheet date (31/08/17: same).
12. Related party transactionsThe Fund’s Authorised Corporate Director, Royal London Unit Trust Managers Limited, is a related party to the Fund as defined by Financial Reporting Standard 102 ‘Related Party Disclosures’.
Authorised Corporate Director fees charged by Royal London Unit Trust Managers Limited are shown in note 4 and details of shares created and cancelled by Royal London Unit Trust Managers Limited are shown in the Statement of Change in Net Assets Attributable to Shareholders and note 6. At the year end the balance due to Royal London Unit Trust Managers Limited in respect of these transactions was £337,000 (31/08/17: £671,000).
At the year end, 31 August 2018, 93.82% (31/08/17: 88.36%) of the shares in issue were held by The Royal London Mutual Insurance Society Limited. Royal London Unit Trust Managers Limited is a wholly owned subsidiary of The Royal London Mutual Insurance Society Limited.

Royal London Equity Funds ICVC180
13. Stock lending activitiesThe Fund carried out stock lending activities for the purpose of efficient portfolio management and in order to generate income. Revenue earned from these activities is shown in note 3 and is net of bank and agents fees amounting to £7,000 (Gross: £35,000) (31/08/17: £4,000 (Gross: £20,000)) payable to HSBC Bank plc.
The value of stock on loan at the balance sheet date was £8,595,000 (31/08/17: £29,482,000).
The collateral held by asset type at the year end is stated below:
Asset class
31 August 2018 Collateral Held
£’000
31 August 2017 Collateral Held
£’000Equities 7,270 29,811
Bonds 1,954 1,179
The aggregate value of collateral held at the balance sheet date was £9,224,000 (31/08/17: £30,990,000). Collateral may be in the form of cash, UK gilts, certificates of deposit, treasury bills, sovereign debt, eurosterling bonds and equities; where the ACD approves the asset it will be held to reduce counterparty exposure. The value of the collateral held is greater than the value of the securities on loan and is monitored as part of the efficient portfolio management process.
The counterparties at the year end were Bank of Nova Scotia, Goldman Sachs International, Santander UK and Societe Generale.
14. Risk disclosuresThe policies applied to the management of risk disclosures are set out on page 9.
The fair values of the Fund’s assets and liabilities are represented by the values shown in the balance sheet on page 176. There is no material difference between the value of the financial assets and liabilities, as shown in the balance sheet, and their fair value.
A small proportion of the Fund’s assets are denominated in currencies other than sterling. The value of the Fund’s assets may be affected by currency movements.
Currency31 August 2018
£’00031 August 2017
£’000Sterling 681,295 625,283
Euro 42 1
US dollar 2,003 1,879
Total 683,340 627,163
If sterling to foreign currency exchange rates had increased by 10% as at the balance sheet date, the net asset value of the Fund would have decreased by £204,000 (31/08/17: £188,000). If sterling to foreign currency exchange rates had decreased by 10% as at the balance sheet date, the net asset value of the Fund would have increased by £204,000 (31/08/17: £188,000). These calculations assume all other variables remain constant.
If market prices had increased by 10% as at the balance sheet date, the net asset value of the Fund would have increased by £66,651,000 (31/08/17: £61,600,000). If market prices had decreased by 10% as at the balance sheet date, the net asset value of the Fund would have decreased by £66,651,000 (31/08/17: £61,601,000). These calculations assume all other variables remain constant.
The only interest bearing assets are cash balances of £11,901,000 (31/08/17: £6,901,000) which earn interest by reference to LIBOR or international equivalent.
FX risk is insignificant (31/08/17: same).
Royal London UK Equity Fund
NOTES TO THE FINANCIAL STATEMENTS (CONTINUED)FOR THE YEAR ENDED 31 AUGUST 2018

Royal London Equity Funds ICVC 181
15. Portfolio transaction costsFor the year ended 31 August 2018
Value Commissions Taxes Other expenses TotalAnalysis of total purchases costs £’000 £’000 % £’000 % £’000 % £’000Equity transactions 145,819 86 0.06 596 0.41 88 0.06 146,589
Corporate actions 2,082 – – – – – – 2,082
Total 147,901 86 596 88 148,671
Value Commissions Taxes Other expenses TotalAnalysis of total sales costs £’000 £’000 % £’000 % £’000 % £’000Equity transactions 121,415 76 0.06 – – – – 121,339
Corporate actions 1,475 – – – – – – 1,475
Total 122,890 76 – – 122,814
Commissions, taxes and fees as % of average net assetsCommissions 0.02%Taxes 0.05%Other expenses 0.01%
For the year ended 31 August 2017
Value Commissions Taxes Other expenses TotalAnalysis of total purchases costs £’000 £’000 % £’000 % £’000 % £’000Equity transactions 118,014 113 0.10 491 0.42 32 0.03 118,650
Corporate actions 2,183 – – – – – – 2,183
Total 120,197 113 491 32 120,833
Value Commissions Taxes Other expenses TotalAnalysis of total sales costs £’000 £’000 % £’000 % £’000 % £’000Equity transactions 14,831 21 0.14 – – – – 14,810
Corporate actions 7,435 – – – – – – 7,435
Total 22,266 21 – – 22,245
Commissions, taxes and fees as % of average net assetsCommissions 0.02%Taxes 0.09%Other expenses 0.01%
At the balance sheet date the portfolio dealing spread was 0.04% (31/08/17: 0.06%). The Fund is single priced throughout the year and therefore the dealing spread is not indicative of the full year.
Royal London UK Equity Fund
NOTES TO THE FINANCIAL STATEMENTS (CONTINUED)FOR THE YEAR ENDED 31 AUGUST 2018
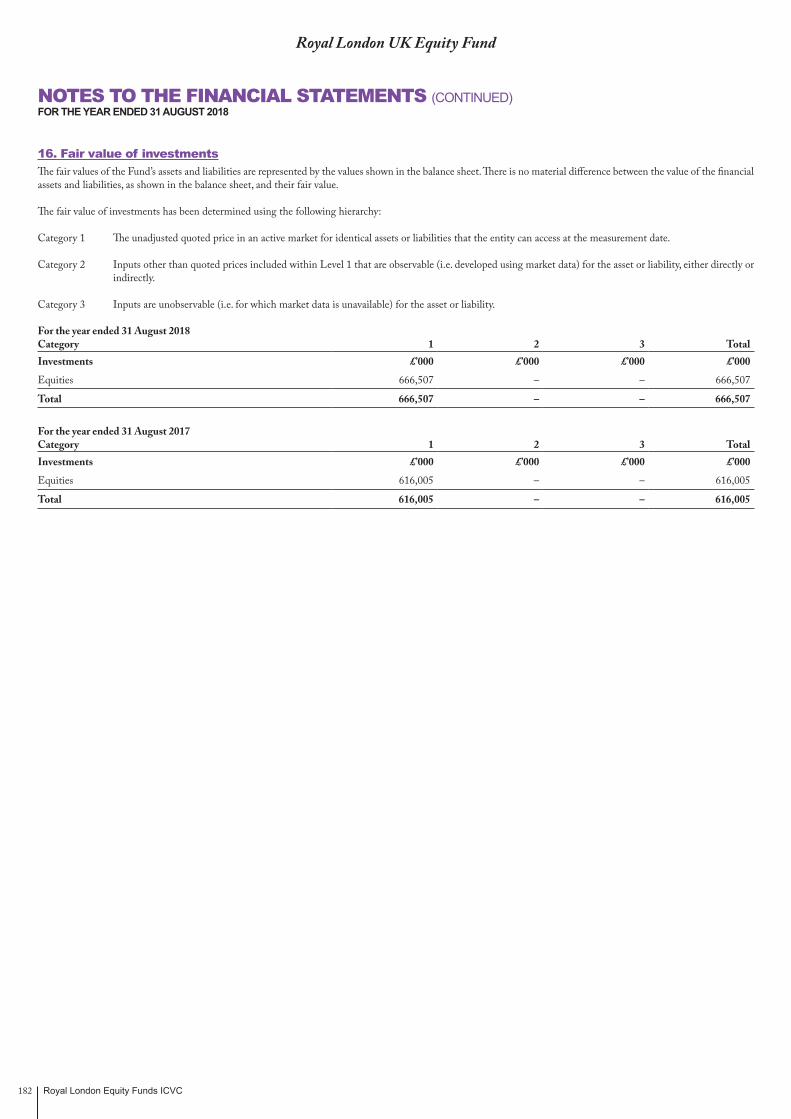
Royal London Equity Funds ICVC182
16. Fair value of investmentsThe fair values of the Fund’s assets and liabilities are represented by the values shown in the balance sheet. There is no material difference between the value of the financial assets and liabilities, as shown in the balance sheet, and their fair value.
The fair value of investments has been determined using the following hierarchy:
Category 1 The unadjusted quoted price in an active market for identical assets or liabilities that the entity can access at the measurement date.
Category 2 Inputs other than quoted prices included within Level 1 that are observable (i.e. developed using market data) for the asset or liability, either directly or indirectly.
Category 3 Inputs are unobservable (i.e. for which market data is unavailable) for the asset or liability.
For the year ended 31 August 2018 Category 1 2 3 TotalInvestments £’000 £’000 £’000 £’000
Equities 666,507 – – 666,507
Total 666,507 – – 666,507
For the year ended 31 August 2017 Category 1 2 3 TotalInvestments £’000 £’000 £’000 £’000
Equities 616,005 – – 616,005
Total 616,005 – – 616,005
Royal London UK Equity Fund
NOTES TO THE FINANCIAL STATEMENTS (CONTINUED)FOR THE YEAR ENDED 31 AUGUST 2018
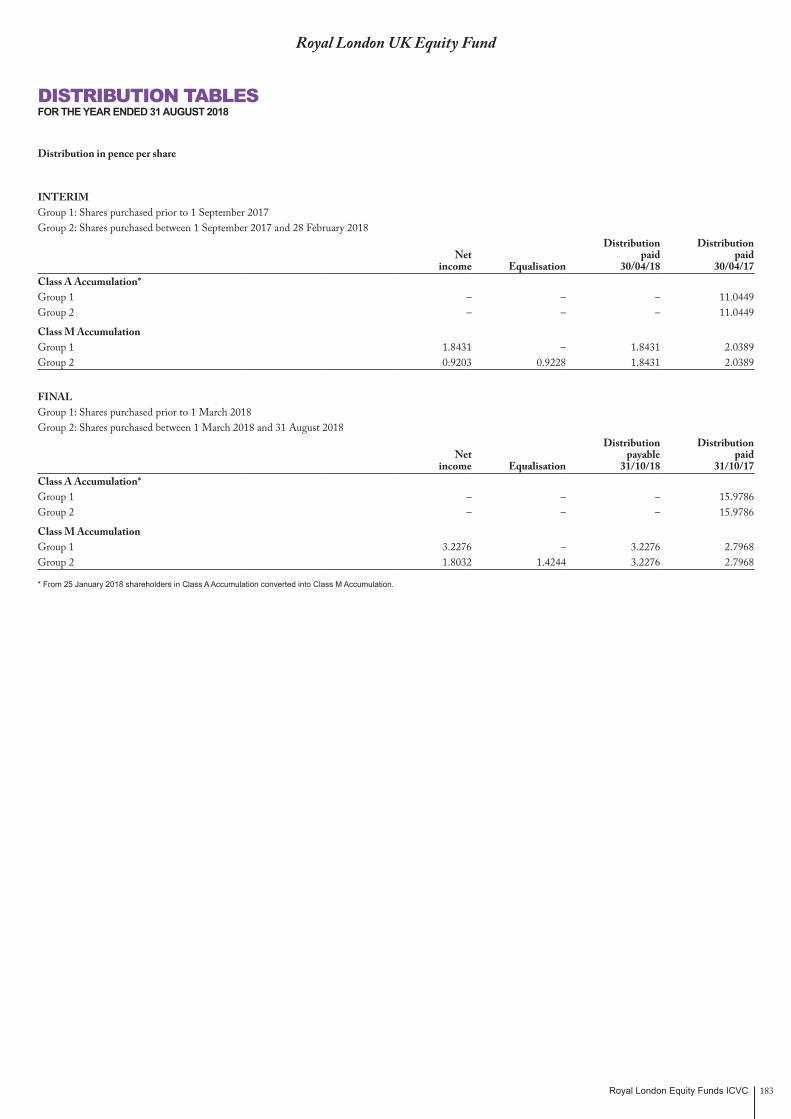
Royal London Equity Funds ICVC 183
Royal London UK Equity Fund
DISTRIBUTION TABLESFOR THE YEAR ENDED 31 AUGUST 2018
Distribution in pence per share
INTERIMGroup 1: Shares purchased prior to 1 September 2017Group 2: Shares purchased between 1 September 2017 and 28 February 2018
Distribution DistributionNet paid paid
income Equalisation 30/04/18 30/04/17Class A Accumulation*Group 1 – – – 11.0449Group 2 – – – 11.0449
Class M AccumulationGroup 1 1.8431 – 1.8431 2.0389Group 2 0.9203 0.9228 1.8431 2.0389
FINALGroup 1: Shares purchased prior to 1 March 2018Group 2: Shares purchased between 1 March 2018 and 31 August 2018
Distribution DistributionNet payable paid
income Equalisation 31/10/18 31/10/17Class A Accumulation*Group 1 – – – 15.9786Group 2 – – – 15.9786
Class M AccumulationGroup 1 3.2276 – 3.2276 2.7968Group 2 1.8032 1.4244 3.2276 2.7968
* From 25 January 2018 shareholders in Class A Accumulation converted into Class M Accumulation.
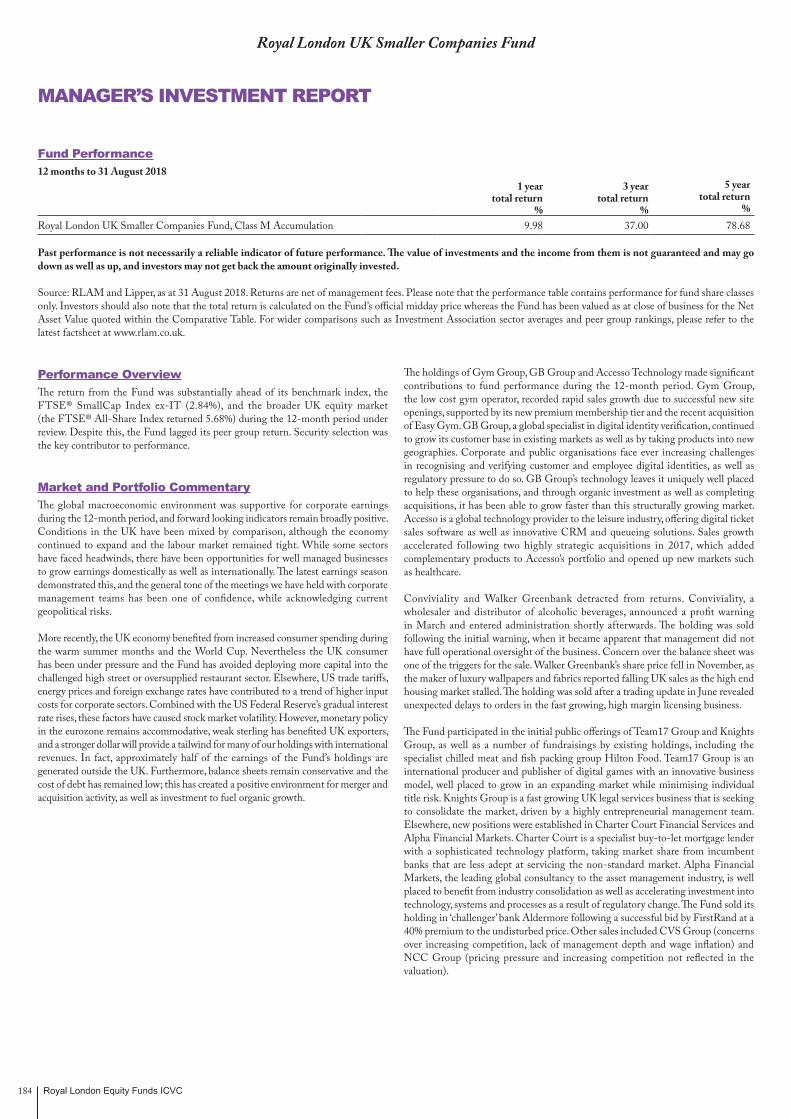
Royal London Equity Funds ICVC184
Royal London UK Smaller Companies Fund
Fund Performance12 months to 31 August 2018
1 year total return
%
3 year total return
%
5 year total return
%Royal London UK Smaller Companies Fund, Class M Accumulation 9.98 37.00 78.68
Past performance is not necessarily a reliable indicator of future performance. The value of investments and the income from them is not guaranteed and may go down as well as up, and investors may not get back the amount originally invested.
Source: RLAM and Lipper, as at 31 August 2018. Returns are net of management fees. Please note that the performance table contains performance for fund share classes only. Investors should also note that the total return is calculated on the Fund’s official midday price whereas the Fund has been valued as at close of business for the Net Asset Value quoted within the Comparative Table. For wider comparisons such as Investment Association sector averages and peer group rankings, please refer to the latest factsheet at www.rlam.co.uk.
Performance OverviewThe return from the Fund was substantially ahead of its benchmark index, the FTSE® SmallCap Index ex-IT (2.84%), and the broader UK equity market (the FTSE® All-Share Index returned 5.68%) during the 12-month period under review. Despite this, the Fund lagged its peer group return. Security selection was the key contributor to performance.
Market and Portfolio CommentaryThe global macroeconomic environment was supportive for corporate earnings during the 12-month period, and forward looking indicators remain broadly positive. Conditions in the UK have been mixed by comparison, although the economy continued to expand and the labour market remained tight. While some sectors have faced headwinds, there have been opportunities for well managed businesses to grow earnings domestically as well as internationally. The latest earnings season demonstrated this, and the general tone of the meetings we have held with corporate management teams has been one of confidence, while acknowledging current geopolitical risks.
More recently, the UK economy benefited from increased consumer spending during the warm summer months and the World Cup. Nevertheless the UK consumer has been under pressure and the Fund has avoided deploying more capital into the challenged high street or oversupplied restaurant sector. Elsewhere, US trade tariffs, energy prices and foreign exchange rates have contributed to a trend of higher input costs for corporate sectors. Combined with the US Federal Reserve’s gradual interest rate rises, these factors have caused stock market volatility. However, monetary policy in the eurozone remains accommodative, weak sterling has benefited UK exporters, and a stronger dollar will provide a tailwind for many of our holdings with international revenues. In fact, approximately half of the earnings of the Fund’s holdings are generated outside the UK. Furthermore, balance sheets remain conservative and the cost of debt has remained low; this has created a positive environment for merger and acquisition activity, as well as investment to fuel organic growth.
The holdings of Gym Group, GB Group and Accesso Technology made significant contributions to fund performance during the 12-month period. Gym Group, the low cost gym operator, recorded rapid sales growth due to successful new site openings, supported by its new premium membership tier and the recent acquisition of Easy Gym. GB Group, a global specialist in digital identity verification, continued to grow its customer base in existing markets as well as by taking products into new geographies. Corporate and public organisations face ever increasing challenges in recognising and verifying customer and employee digital identities, as well as regulatory pressure to do so. GB Group’s technology leaves it uniquely well placed to help these organisations, and through organic investment as well as completing acquisitions, it has been able to grow faster than this structurally growing market. Accesso is a global technology provider to the leisure industry, offering digital ticket sales software as well as innovative CRM and queueing solutions. Sales growth accelerated following two highly strategic acquisitions in 2017, which added complementary products to Accesso’s portfolio and opened up new markets such as healthcare.
Conviviality and Walker Greenbank detracted from returns. Conviviality, a wholesaler and distributor of alcoholic beverages, announced a profit warning in March and entered administration shortly afterwards. The holding was sold following the initial warning, when it became apparent that management did not have full operational oversight of the business. Concern over the balance sheet was one of the triggers for the sale. Walker Greenbank’s share price fell in November, as the maker of luxury wallpapers and fabrics reported falling UK sales as the high end housing market stalled. The holding was sold after a trading update in June revealed unexpected delays to orders in the fast growing, high margin licensing business.
The Fund participated in the initial public offerings of Team17 Group and Knights Group, as well as a number of fundraisings by existing holdings, including the specialist chilled meat and fish packing group Hilton Food. Team17 Group is an international producer and publisher of digital games with an innovative business model, well placed to grow in an expanding market while minimising individual title risk. Knights Group is a fast growing UK legal services business that is seeking to consolidate the market, driven by a highly entrepreneurial management team. Elsewhere, new positions were established in Charter Court Financial Services and Alpha Financial Markets. Charter Court is a specialist buy-to-let mortgage lender with a sophisticated technology platform, taking market share from incumbent banks that are less adept at servicing the non-standard market. Alpha Financial Markets, the leading global consultancy to the asset management industry, is well placed to benefit from industry consolidation as well as accelerating investment into technology, systems and processes as a result of regulatory change. The Fund sold its holding in ‘challenger’ bank Aldermore following a successful bid by FirstRand at a 40% premium to the undisturbed price. Other sales included CVS Group (concerns over increasing competition, lack of management depth and wage inflation) and NCC Group (pricing pressure and increasing competition not reflected in the valuation).
MANAGER’S INVESTMENT REPORT
Royal London Equity Funds ICVC 185
Royal London UK Smaller Companies Fund
MANAGER’S INVESTMENT REPORT (CONTINUED)
Investment OutlookWe expect further stock market volatility associated with the Brexit headlines, but we think that an accommodative monetary policy in Europe is likely to remain. Many of the companies in our universe remain well placed for progress over the next year. We do not try and take ‘sector’ or ‘market’ bets, but focus on bottom-up stock selection with an emphasis on investing (not trading) in companies with structural profit drivers operating in markets experiencing growth. We have never sought to predict the ‘cycle’ and therefore avoid the more cyclical end of the UK market, but try to find innovative companies where good management can improve margins and take market share.
The Fund aims to achieve capital growth over the long term (3 to 5 years), by investing in a diversified portfolio of UK-listed smaller companies. We seek out businesses that we believe can grow their profits and cashflow sustainably faster than the market and can ultimately become large companies. We focus our efforts on investing in cash generative businesses with strong balance sheets, structural earnings growth opportunities and valuation optionality.
Henry Lowson Fund Manager31 August 2018Royal London Asset Management
The views expressed are the author’s own and do not constitute investment advice and are not an indication of future fund performance. Portfolio holdings are subject to change, for information only and are not investment recommendations.
Source: Royal London Asset Management, unless otherwise stated.

Royal London Equity Funds ICVC186
Royal London UK Smaller Companies Fund
COMPARATIVE TABLES
Class A Accumulation31/08/18** 31/08/17 31/08/16
Change in net assets per share (p) (p) (p)
Opening net asset value per share 217.66 181.74 177.47
Return before operating charges* 15.63 38.72 6.78
Operating charges (1.30) (2.80) (2.51)
Return after operating charges* 14.33 35.92 4.27
Distributions on accumulation shares – (0.94) (1.61)
Retained distributions on accumulation shares – 0.94 1.61
Cancellation price (231.99) – –
Closing net asset value per share – 217.66 181.74
* after direct transaction costs of: 0.16 0.57 0.05
Performance
Return after charges 6.58% 19.76% 2.41%
Other information
Closing net asset value (£’000) – 255,633 211,666
Closing number of shares – 117,446,326 116,468,293
Operating charges – 1.44% 1.44%
Direct transaction costs 0.07% 0.29% 0.03%
Prices^
Highest share price 232.00 218.50 184.20
Lowest share price 217.10 171.30 155.80
** From 25 January 2018 shareholders in Class A Accumulation converted to Class M Accumulation.
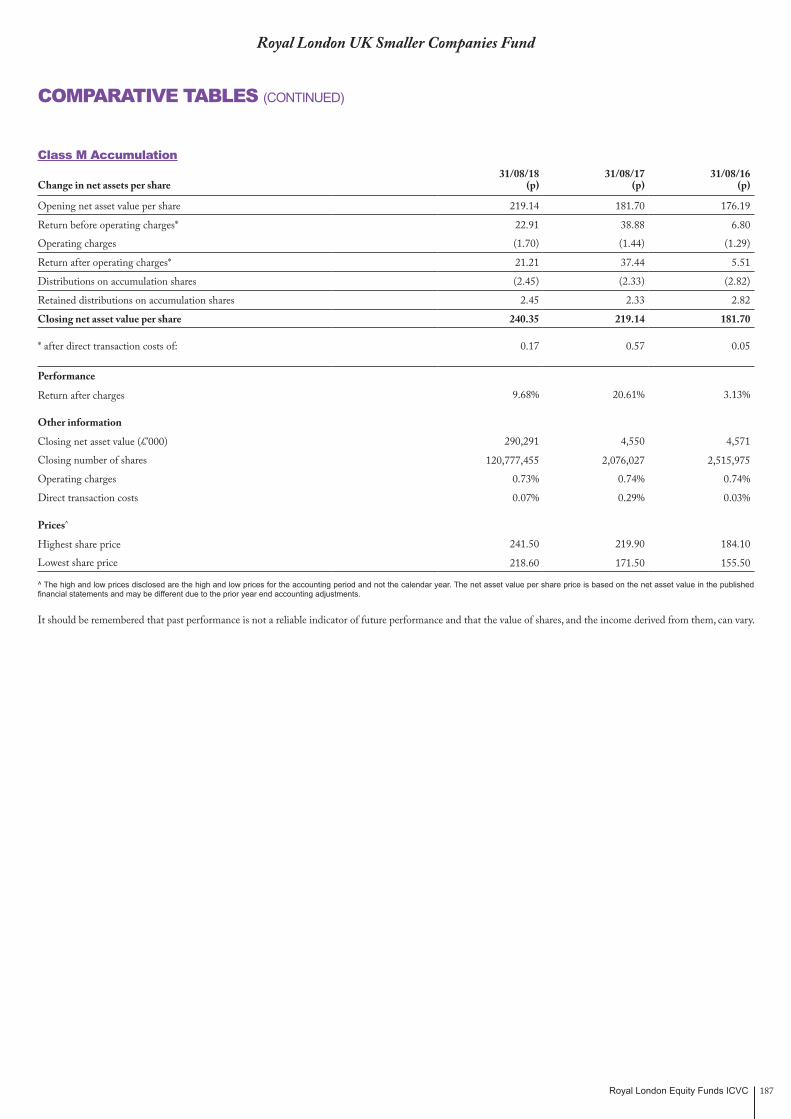
Royal London Equity Funds ICVC 187
Royal London UK Smaller Companies Fund
COMPARATIVE TABLES (CONTINUED)
Class M Accumulation31/08/18 31/08/17 31/08/16
Change in net assets per share (p) (p) (p)
Opening net asset value per share 219.14 181.70 176.19
Return before operating charges* 22.91 38.88 6.80
Operating charges (1.70) (1.44) (1.29)
Return after operating charges* 21.21 37.44 5.51
Distributions on accumulation shares (2.45) (2.33) (2.82)
Retained distributions on accumulation shares 2.45 2.33 2.82
Closing net asset value per share 240.35 219.14 181.70
* after direct transaction costs of: 0.17 0.57 0.05
Performance
Return after charges 9.68% 20.61% 3.13%
Other information
Closing net asset value (£’000) 290,291 4,550 4,571
Closing number of shares 120,777,455 2,076,027 2,515,975
Operating charges 0.73% 0.74% 0.74%
Direct transaction costs 0.07% 0.29% 0.03%
Prices^
Highest share price 241.50 219.90 184.10
Lowest share price 218.60 171.50 155.50
^ The high and low prices disclosed are the high and low prices for the accounting period and not the calendar year. The net asset value per share price is based on the net asset value in the published financial statements and may be different due to the prior year end accounting adjustments.
It should be remembered that past performance is not a reliable indicator of future performance and that the value of shares, and the income derived from them, can vary.
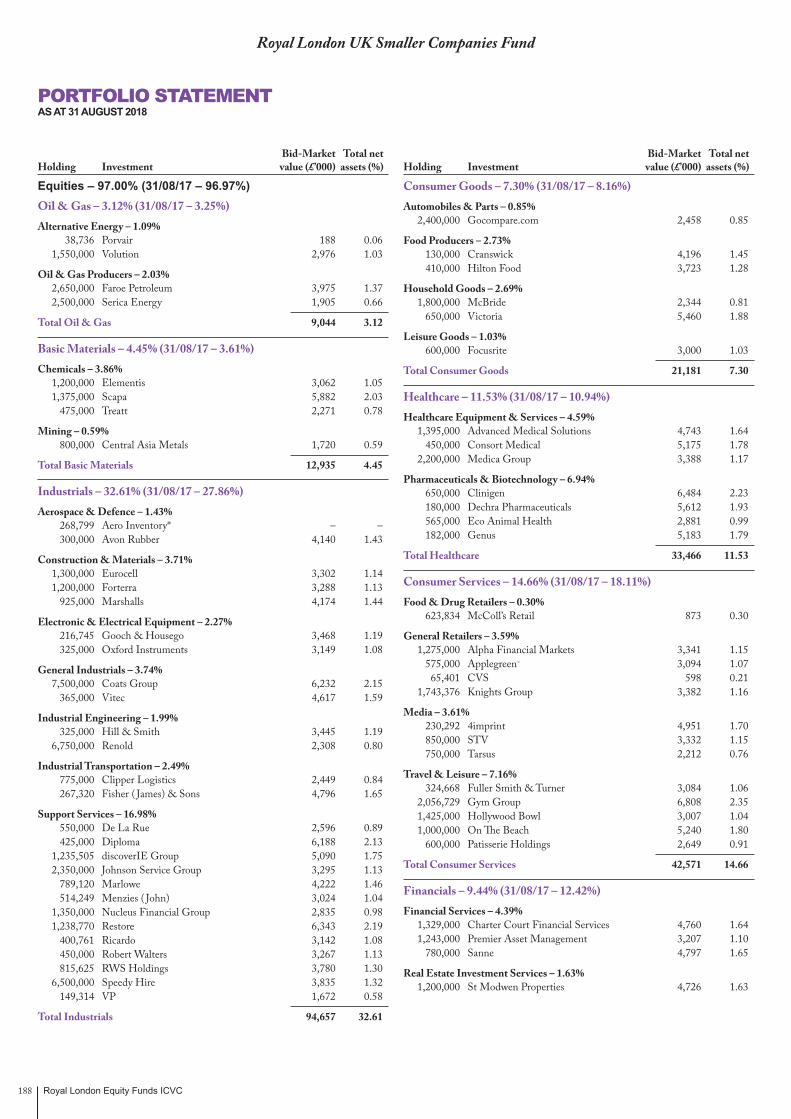
Royal London Equity Funds ICVC188
Royal London UK Smaller Companies Fund
Equities – 97.00% (31/08/17 – 96.97%) Oil & Gas – 3.12% (31/08/17 – 3.25%) Alternative Energy – 1.09% 38,736 Porvair 188 0.06 1,550,000 Volution 2,976 1.03
Oil & Gas Producers – 2.03% 2,650,000 Faroe Petroleum 3,975 1.37 2,500,000 Serica Energy 1,905 0.66
Total Oil & Gas 9,044 3.12
Basic Materials – 4.45% (31/08/17 – 3.61%) Chemicals – 3.86% 1,200,000 Elementis 3,062 1.05 1,375,000 Scapa 5,882 2.03 475,000 Treatt 2,271 0.78
Mining – 0.59% 800,000 Central Asia Metals 1,720 0.59
Total Basic Materials 12,935 4.45
Industrials – 32.61% (31/08/17 – 27.86%) Aerospace & Defence – 1.43% 268,799 Aero Inventory* – – 300,000 Avon Rubber 4,140 1.43
Construction & Materials – 3.71% 1,300,000 Eurocell 3,302 1.14 1,200,000 Forterra 3,288 1.13 925,000 Marshalls 4,174 1.44
Electronic & Electrical Equipment – 2.27% 216,745 Gooch & Housego 3,468 1.19 325,000 Oxford Instruments 3,149 1.08
General Industrials – 3.74% 7,500,000 Coats Group 6,232 2.15 365,000 Vitec 4,617 1.59
Industrial Engineering – 1.99% 325,000 Hill & Smith 3,445 1.19 6,750,000 Renold 2,308 0.80
Industrial Transportation – 2.49% 775,000 Clipper Logistics 2,449 0.84 267,320 Fisher ( James) & Sons 4,796 1.65
Support Services – 16.98% 550,000 De La Rue 2,596 0.89 425,000 Diploma 6,188 2.13 1,235,505 discoverIE Group 5,090 1.75 2,350,000 Johnson Service Group 3,295 1.13 789,120 Marlowe 4,222 1.46 514,249 Menzies ( John) 3,024 1.04 1,350,000 Nucleus Financial Group 2,835 0.98 1,238,770 Restore 6,343 2.19 400,761 Ricardo 3,142 1.08 450,000 Robert Walters 3,267 1.13 815,625 RWS Holdings 3,780 1.30 6,500,000 Speedy Hire 3,835 1.32 149,314 VP 1,672 0.58
Total Industrials 94,657 32.61
Consumer Goods – 7.30% (31/08/17 – 8.16%) Automobiles & Parts – 0.85% 2,400,000 Gocompare.com 2,458 0.85
Food Producers – 2.73% 130,000 Cranswick 4,196 1.45 410,000 Hilton Food 3,723 1.28
Household Goods – 2.69% 1,800,000 McBride 2,344 0.81 650,000 Victoria 5,460 1.88
Leisure Goods – 1.03% 600,000 Focusrite 3,000 1.03
Total Consumer Goods 21,181 7.30
Healthcare – 11.53% (31/08/17 – 10.94%) Healthcare Equipment & Services – 4.59% 1,395,000 Advanced Medical Solutions 4,743 1.64 450,000 Consort Medical 5,175 1.78 2,200,000 Medica Group 3,388 1.17
Pharmaceuticals & Biotechnology – 6.94% 650,000 Clinigen 6,484 2.23 180,000 Dechra Pharmaceuticals 5,612 1.93 565,000 Eco Animal Health 2,881 0.99 182,000 Genus 5,183 1.79
Total Healthcare 33,466 11.53
Consumer Services – 14.66% (31/08/17 – 18.11%) Food & Drug Retailers – 0.30% 623,834 McColl’s Retail 873 0.30
General Retailers – 3.59% 1,275,000 Alpha Financial Markets 3,341 1.15 575,000 Applegreen~ 3,094 1.07 65,401 CVS 598 0.21 1,743,376 Knights Group 3,382 1.16
Media – 3.61% 230,292 4imprint 4,951 1.70 850,000 STV 3,332 1.15 750,000 Tarsus 2,212 0.76
Travel & Leisure – 7.16% 324,668 Fuller Smith & Turner 3,084 1.06 2,056,729 Gym Group 6,808 2.35 1,425,000 Hollywood Bowl 3,007 1.04 1,000,000 On The Beach 5,240 1.80 600,000 Patisserie Holdings 2,649 0.91
Total Consumer Services 42,571 14.66
Financials – 9.44% (31/08/17 – 12.42%) Financial Services – 4.39% 1,329,000 Charter Court Financial Services 4,760 1.64 1,243,000 Premier Asset Management 3,207 1.10 780,000 Sanne 4,797 1.65
Real Estate Investment Services – 1.63% 1,200,000 St Modwen Properties 4,726 1.63
PORTFOLIO STATEMENTAS AT 31 AUGUST 2018
Bid-Market Total net Holding Investment value (£’000) assets (%)
Bid-Market Total net Holding Investment value (£’000) assets (%)

Royal London Equity Funds ICVC 189
Royal London UK Smaller Companies Fund
Financials – 9.44% (31/08/17 – 12.42%) – continued Real Estate Investment Trusts – 3.42% 2,250,000 PRS 2,295 0.79 525,000 Unite Group 4,654 1.60 280,000 Workspace 2,979 1.03
Total Financials 27,418 9.44
Technology – 13.89% (31/08/17 – 11.60%) Software & Computer Services – 9.56% 140,000 Aveva Group 3,973 1.37 1,246,900 GB 7,806 2.69 458,968 GlobalData 2,800 0.96 3,127,779 Learning Technologies Group 3,644 1.26 700,000 Microgen 2,926 1.01 1,220,853 Team17 Group 2,808 0.97 2,230,088 Totally 491 0.17 470,000 Tracsis 3,290 1.13
Technology Hardware & Equipment – 4.33% 265,000 Accesso Technology 7,234 2.49 625,000 Gamma Communications 5,338 1.84
Total Technology 40,310 13.89
Utilities – 0.00% (31/08/17 – 1.02%)
Total value of investments 281,582 97.00
Net other assets 8,709 3.00
Total net assets 290,291 100.00
* Unlisted~ SuspendedAll investments are listed on recognised stock exchanges and are ‘approved securities’ within themeaning of the FCA rules unless otherwise stated.
PORTFOLIO STATEMENT (CONTINUED)AS AT 31 AUGUST 2018
Bid-Market Total net Holding Investment value (£’000) assets (%)

Royal London Equity Funds ICVC190
Royal London UK Smaller Companies Fund
SUMMARY OF MATERIAL PORTFOLIO CHANGESFOR THE YEAR ENDED 31 AUGUST 2018
Significant Purchases
Cost £’000
Charter Court Financial Services 3,859
Menzies ( John) 3,700
McColl's Retail 3,438
RWS Holdings 3,345
Hilton Food 3,334
Clipper Logistics 3,292
Johnson Service Group 3,210
Robert Walters 3,139
Microgen 3,089
Gocompare.com 2,748
Subtotal 33,154
Total cost of purchases, including the above, for the year 85,226
Significant Sales
Proceeds £’000
CVS 4,778
Aldermore 4,647
iomart 4,263
Cineworld 3,942
Fever-Tree 3,237
Conviviality 3,072
Brooks Macdonald 3,051
Curtis Banks 2,841
Dunelm 2,731
Workspace 2,489
Subtotal 35,051
Total proceeds from sales, including the above, for the year 77,115

Royal London Equity Funds ICVC 191
Royal London UK Smaller Companies Fund
FINANCIAL STATEMENTS
Statement of Total Returnfor the year ended 31 August 2018
Note £’000
Year ended31 August 2018
£’000 £’000
Year ended31 August 2017
£’000
Income Net capital gains 2 22,551 41,761 Revenue 3 4,962 4,465
Expenses 4 (2,767) (3,313)Interest payable and similar charges (3) (4)
Net revenue before taxation 2,192 1,148 Taxation 5 – –
Net revenue after taxation 2,192 1,148
Total return before distributions 24,743 42,909 Distributions 6 (2,944) (1,148)
Change in net assets attributable to shareholders from investment activities 21,799 41,761
Statement of Change in Net Assets Attributable to Shareholdersfor the year ended 31 August 2018
£’000
Year ended31 August 2018
£’000 £’000
Year ended31 August 2017
£’000
Opening net assets attributable to shareholders 260,183 216,237
Amounts receivable on creation of shares 10,811 10,502 Amounts payable on cancellation of shares (5,454) (9,469)
5,357 1,033
Change in net assets attributable to shareholders from investment activities 21,799 41,761
Retained distributions on accumulation shares 2,952 1,152
Closing net assets attributable to shareholders 290,291 260,183

Royal London Equity Funds ICVC192
Royal London UK Smaller Companies Fund
FINANCIAL STATEMENTS (CONTINUED)
Balance Sheetas at 31 August 2018
Note31 August 2018
£’00031 August 2017
£’000
ASSETS
Investments 281,582 252,291
Current assets:Debtors 7 1,325 913 Cash and bank balances 8 7,810 8,513
Total assets 290,717 261,717
LIABILITIES
Creditors:Other creditors 9 426 1,534
Total liabilities 426 1,534
Net assets attributable to shareholders 290,291 260,183
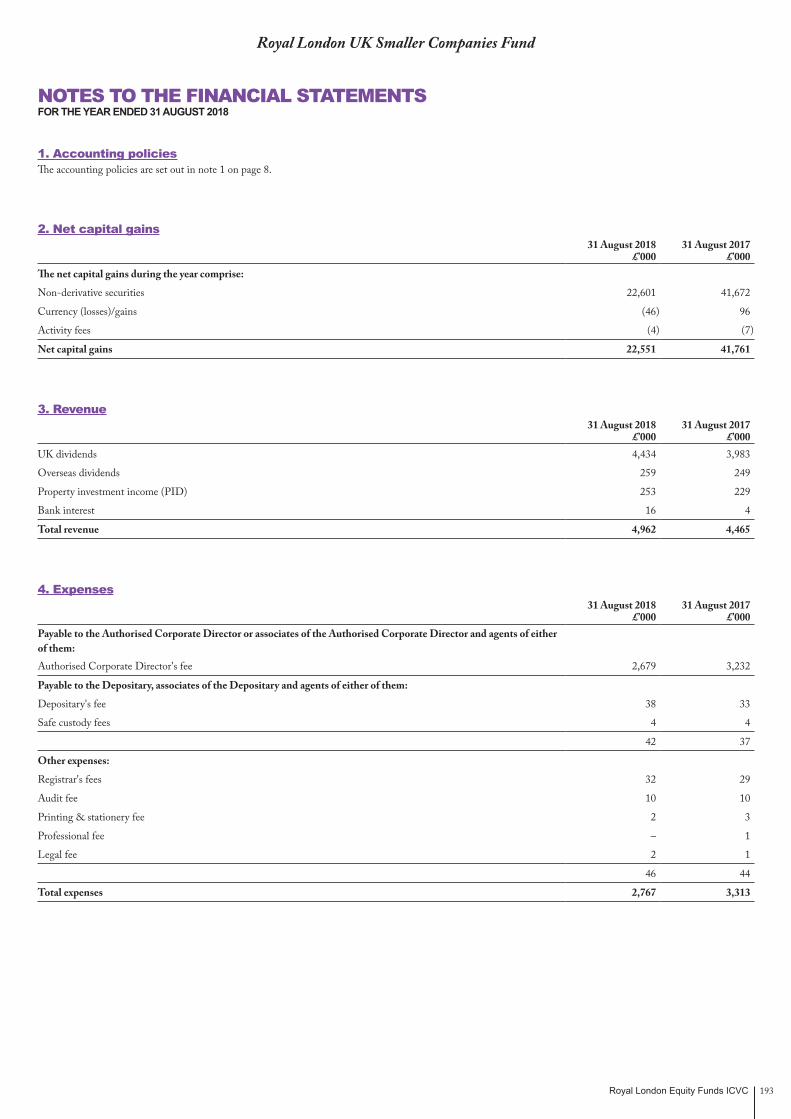
Royal London Equity Funds ICVC 193
Royal London UK Smaller Companies Fund
NOTES TO THE FINANCIAL STATEMENTSFOR THE YEAR ENDED 31 AUGUST 2018
1. Accounting policiesThe accounting policies are set out in note 1 on page 8.
2. Net capital gains31 August 2018
£’00031 August 2017
£’000The net capital gains during the year comprise:
Non-derivative securities 22,601 41,672
Currency (losses)/gains (46) 96
Activity fees (4) (7)
Net capital gains 22,551 41,761
3. Revenue31 August 2018
£’00031 August 2017
£’000UK dividends 4,434 3,983
Overseas dividends 259 249
Property investment income (PID) 253 229
Bank interest 16 4
Total revenue 4,962 4,465
4. Expenses31 August 2018
£’00031 August 2017
£’000Payable to the Authorised Corporate Director or associates of the Authorised Corporate Director and agents of either of them:Authorised Corporate Director's fee 2,679 3,232
Payable to the Depositary, associates of the Depositary and agents of either of them:
Depositary's fee 38 33
Safe custody fees 4 4
42 37
Other expenses:
Registrar's fees 32 29
Audit fee 10 10
Printing & stationery fee 2 3
Professional fee – 1
Legal fee 2 1
46 44
Total expenses 2,767 3,313

Royal London Equity Funds ICVC194
5. Taxationa) Analysis of charge for the year
31 August 2018£’000
31 August 2017£’000
Corporation tax at 20% – –
Current tax charge for the year – –
b) Factors affecting the current tax charge for the year The tax assessed for the year is lower (31/08/17: lower) than the standard rate of corporation tax in the UK for an Open Ended Investment Company (20%).
The differences are explained below:
Net revenue before taxation 2,192 1,148
Corporation tax at 20% (31/08/17: 20%) 438 230
Effects of:
Revenue not subject to taxation (938) (846)
Current year management expenses not utilised 500 616
Current tax charge for the year – –
Authorised Open Ended Investment Companies are exempt from UK tax on capital gains, therefore any capital gains/(losses) are not included in the reconciliation above.
c) Provision for deferred taxThere was no provision required for deferred tax at the balance sheet date (31/08/17: same).
d) Factors that may affect future tax chargesAt the year end, there is a potential deferred tax asset of £3,749,000 (31/08/17: £3,249,000) in relation to surplus management expenses. It is unlikely the Fund will generate sufficient taxable profits in the future to utilise these expenses and therefore no deferred tax asset has been recognised in the year.
6. DistributionsThe distributions take account of income received on the issue of shares and income deducted on the cancellation of shares and comprise:
31 August 2018 £’000
31 August 2017 £’000
Accumulation shares
Interim 1,114 235
Final 1,838 917
2,952 1,152
Add: Amounts deducted on cancellation of shares 18 26
Deduct: Amounts received on the creation of shares (26) (30)
Net distributions for the year 2,944 1,148
The difference between the net revenue after taxation and the distribution paid is as follows:
Net revenue after taxation 2,192 1,148
Equalisation on conversions 752 –
Net distributions for the year 2,944 1,148
Details of the distribution per share are set out on page 198.
Royal London UK Smaller Companies Fund
NOTES TO THE FINANCIAL STATEMENTS (CONTINUED)FOR THE YEAR ENDED 31 AUGUST 2018
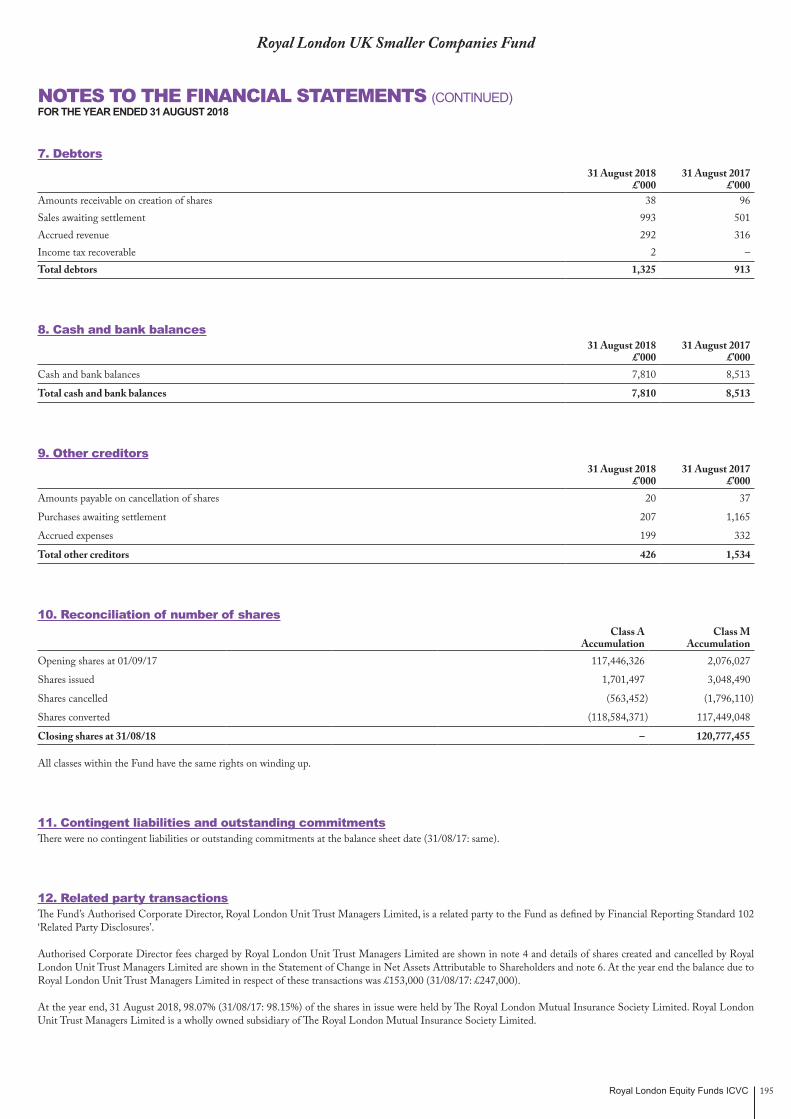
Royal London Equity Funds ICVC 195
Royal London UK Smaller Companies Fund
NOTES TO THE FINANCIAL STATEMENTS (CONTINUED)FOR THE YEAR ENDED 31 AUGUST 2018
7. Debtors31 August 2018
£’00031 August 2017
£’000Amounts receivable on creation of shares 38 96 Sales awaiting settlement 993 501 Accrued revenue 292 316 Income tax recoverable 2 –Total debtors 1,325 913
8. Cash and bank balances31 August 2018
£’00031 August 2017
£’000Cash and bank balances 7,810 8,513
Total cash and bank balances 7,810 8,513
9. Other creditors31 August 2018
£’00031 August 2017
£’000Amounts payable on cancellation of shares 20 37
Purchases awaiting settlement 207 1,165
Accrued expenses 199 332
Total other creditors 426 1,534
10. Reconciliation of number of sharesClass A
AccumulationClass M
AccumulationOpening shares at 01/09/17 117,446,326 2,076,027
Shares issued 1,701,497 3,048,490
Shares cancelled (563,452) (1,796,110)
Shares converted (118,584,371) 117,449,048
Closing shares at 31/08/18 – 120,777,455
All classes within the Fund have the same rights on winding up.
11. Contingent liabilities and outstanding commitmentsThere were no contingent liabilities or outstanding commitments at the balance sheet date (31/08/17: same).
12. Related party transactionsThe Fund’s Authorised Corporate Director, Royal London Unit Trust Managers Limited, is a related party to the Fund as defined by Financial Reporting Standard 102 ‘Related Party Disclosures’.
Authorised Corporate Director fees charged by Royal London Unit Trust Managers Limited are shown in note 4 and details of shares created and cancelled by Royal London Unit Trust Managers Limited are shown in the Statement of Change in Net Assets Attributable to Shareholders and note 6. At the year end the balance due to Royal London Unit Trust Managers Limited in respect of these transactions was £153,000 (31/08/17: £247,000).
At the year end, 31 August 2018, 98.07% (31/08/17: 98.15%) of the shares in issue were held by The Royal London Mutual Insurance Society Limited. Royal London Unit Trust Managers Limited is a wholly owned subsidiary of The Royal London Mutual Insurance Society Limited.

Royal London Equity Funds ICVC196
13. Risk disclosuresThe policies applied to the management of risk disclosures are set out on page 9.
The fair values of the Fund’s assets and liabilities are represented by the values shown in the balance sheet on page 192. There is no material difference between the value of the financial assets and liabilities, as shown in the balance sheet, and their fair value.
A small proportion of the Fund’s assets are denominated in currencies other than sterling. The value of the Fund’s assets may be affected by currency movements.
Currency31 August 2018
£’00031 August 2017
£’000Sterling 290,291 258,964
Euro – 1,219
Total 290,291 260,183
If sterling to foreign currency exchange rates had increased by 10% as at the balance sheet date, the net asset value of the Fund would have decreased by £– (31/08/17: £122,000). If sterling to foreign currency exchange rates had decreased by 10% as at the balance sheet date, the net asset value of the Fund would have increased by £– (31/08/17: £122,000). These calculations assume all other variables remain constant.
If market prices had increased by 10% as at the balance sheet date, the net asset value of the Fund would have increased by £28,158,000 (31/08/17: £25,229,000). If market prices had decreased by 10% as at the balance sheet date, the net asset value of the Fund would have decreased by £28,158,000 (31/08/17: £25,229,000). These calculations assume all other variables remain constant.
The only interest bearing assets are cash balances of £7,810,000 (31/08/17: £8,513,000) which earn interest by reference to LIBOR or international equivalent.
FX risk is insignificant (31/08/17: same).
14. Portfolio transaction costsFor the year ended 31 August 2018
Value Commissions Taxes Other expenses TotalAnalysis of total purchases costs £’000 £’000 % £’000 % £’000 % £’000Equity transactions 84,970 58 0.07 189 0.22 9 0.01 85,226
Total 84,970 58 189 9 85,226
Value Commissions Taxes Other expenses TotalAnalysis of total sales costs £’000 £’000 % £’000 % £’000 % £’000Equity transactions 76,282 60 0.08 – – – – 76,222
Corporate actions 893 – – – – – – 893
Total 77,175 60 – – 77,115
Commissions, taxes and fees as % of average net assetsCommissions 0.03%Taxes 0.04%Other expenses 0.00%
Royal London UK Smaller Companies Fund
NOTES TO THE FINANCIAL STATEMENTS (CONTINUED)FOR THE YEAR ENDED 31 AUGUST 2018

Royal London Equity Funds ICVC 197
Royal London UK Smaller Companies Fund
NOTES TO THE FINANCIAL STATEMENTS (CONTINUED)FOR THE YEAR ENDED 31 AUGUST 2018
14. Portfolio transaction costs – continuedFor the year ended 31 August 2017
Value Commissions Taxes Other expenses TotalAnalysis of total purchases costs £’000 £’000 % £’000 % £’000 % £’000Equity transactions 127,060 157 0.12 339 0.27 12 0.01 127,568
Corporate actions 557 – – – – – – 557
Total 127,617 157 339 12 128,125
Value Commissions Taxes Other expenses TotalAnalysis of total sales costs £’000 £’000 % £’000 % £’000 % £’000Equity transactions 120,414 168 0.14 – – 1 – 120,245
Total 120,414 168 – 1 120,245
Commissions, taxes and fees as % of average net assetsCommissions 0.14%Taxes 0.14%Other expenses 0.01%
At the balance sheet date the portfolio dealing spread was 0.97% (31/08/17: 0.83%). The Fund is single priced throughout the year and therefore the dealing spread is not indicative of the full year.
15. Fair value of investmentsThe fair values of the Fund’s assets and liabilities are represented by the values shown in the balance sheet. There is no material difference between the value of the financial assets and liabilities, as shown in the balance sheet, and their fair value.
The fair value of investments has been determined using the following hierarchy:
Category 1 The unadjusted quoted price in an active market for identical assets or liabilities that the entity can access at the measurement date.
Category 2 Inputs other than quoted prices included within Level 1 that are observable (i.e. developed using market data) for the asset or liability, either directly or indirectly.
Category 3 Inputs are unobservable (i.e. for which market data is unavailable) for the asset or liability.
For the year ended 31 August 2018 Category 1 2 3 TotalInvestments £’000 £’000 £’000 £’000
Equities 278,488 – 3,094 281,582
Total 278,488 – 3,094 281,582
For the year ended 31 August 2017 Category 1 2 3 TotalInvestments £’000 £’000 £’000 £’000
Equities 252,291 – – 252,291
Total 252,291 – – 252,291
Applegreen is category 3 as pricing was suspended from 2 August 2018 to 28 September 2018.
Aero Inventory is currently nil valued due to being delisted. This stock has been reviewed by the Manager in line with their Fair Value Pricing Policy and has been deemed appropriate.
Where a price is unavailable or the price provided is not thought to be a fair reflection of the current market value of the asset, the Manager, at its discretion, may permit some other method of valuation to be used.
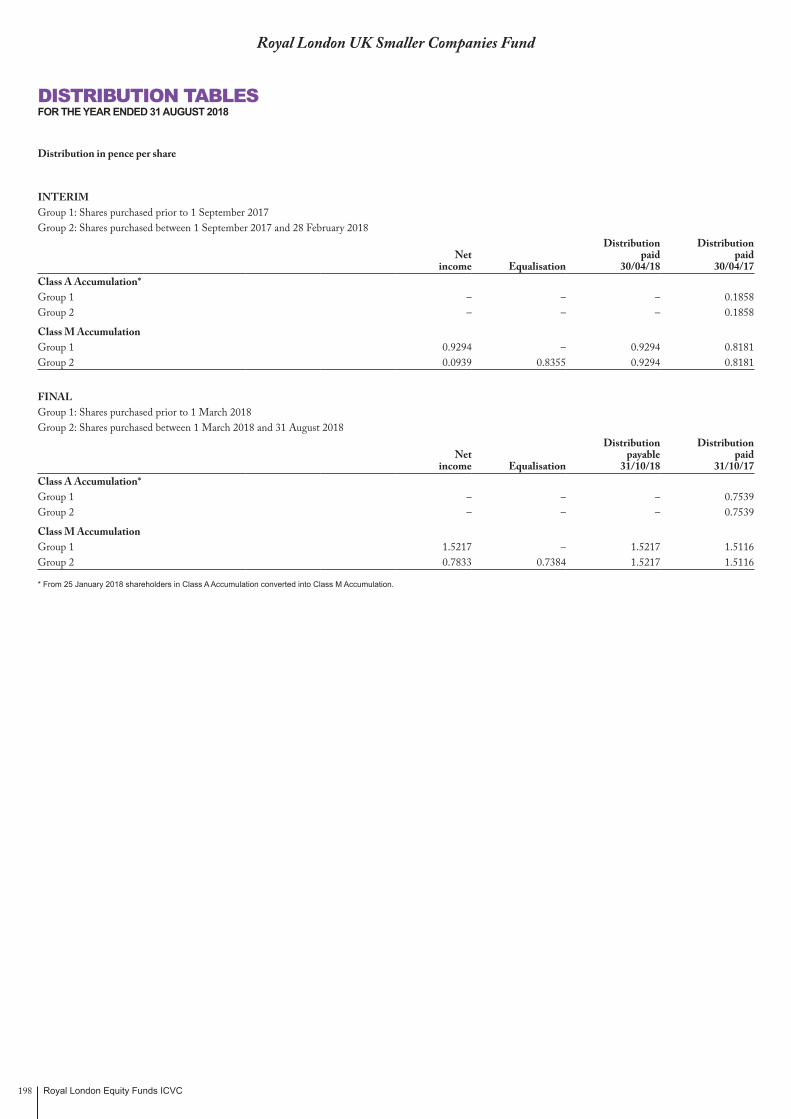
Royal London Equity Funds ICVC198
Royal London UK Smaller Companies Fund
DISTRIBUTION TABLESFOR THE YEAR ENDED 31 AUGUST 2018
Distribution in pence per share
INTERIMGroup 1: Shares purchased prior to 1 September 2017Group 2: Shares purchased between 1 September 2017 and 28 February 2018
Distribution DistributionNet paid paid
income Equalisation 30/04/18 30/04/17Class A Accumulation*Group 1 – – – 0.1858Group 2 – – – 0.1858
Class M AccumulationGroup 1 0.9294 – 0.9294 0.8181Group 2 0.0939 0.8355 0.9294 0.8181
FINALGroup 1: Shares purchased prior to 1 March 2018Group 2: Shares purchased between 1 March 2018 and 31 August 2018
Distribution DistributionNet payable paid
income Equalisation 31/10/18 31/10/17Class A Accumulation*Group 1 – – – 0.7539Group 2 – – – 0.7539
Class M AccumulationGroup 1 1.5217 – 1.5217 1.5116Group 2 0.7833 0.7384 1.5217 1.5116
* From 25 January 2018 shareholders in Class A Accumulation converted into Class M Accumulation.

Royal London Equity Funds ICVC 199
Royal London Asia Pacific ex Japan Tracker Fund
Fund Performance12 months to 31 August 2018
1 year return
%
3 year return
%
5 year return
%Royal London Asia Pacific ex Japan Tracker Fund, Class Z Accumulation (Total return) 3.72 70.59 59.72
FTSE® World Asia Pacific ex Japan Index (Capital return) 0.68 56.81 37.49
Past performance is not necessarily a reliable indicator of future performance. The value of investments and the income from them is not guaranteed and may go down as well as up, and investors may not get back the amount originally invested.
Source: : RLAM and Lipper, as at 31 August 2018. Returns are net of management fees. Investors should note that the total return is calculated on the Fund’s official midday price whereas the Fund has been valued as at close of business for the Net Asset Value quoted within the Comparative Table. Please also note, the total return shown in the table is being compared against the official end of day price of the benchmark. The tracking error shown in the performance overview below is calculated using the unofficial end of day fund price to align with the official end of day benchmark price.
Performance OverviewInvestors should note that the Fund price is taken at noon each day, whilst the index performance is recorded at the close of business. Significant intra-day market movements at the start or end of the day may therefore distort comparisons. This, along with the impact of income and the charges associated with the Fund, accounts for the majority of the difference between the performance of the Fund and the FTSE® World Asia Pacific ex Japan Index.
The tracking error between the Royal London Asia Pacific ex Japan Tracker Fund and the FTSE® World Asia Pacific ex Japan Index was 0.47% during the past 12 months. This is within the anticipated tracking error range of 0.30% to 0.50%. We will always experience a small tracking difference between Fund and index for reasons including exchange rate risk on some dividends, trading costs, optimisation and the use of index futures to manage cashflows.
Market and portfolio commentaryThe Fund aims to achieve the capital return of the FTSE® World Asia Pacific ex Japan Index. However, perfect replication can result in unnecessary and costly trading which may outweigh the benefits. The Fund uses an optimiser to help construct a portfolio designed to track the performance of the benchmark without necessarily holding all the constituents in their exact benchmark weights. It generates efficient rebalancing and cashflow trades and allows flexibility not to trade every index or cashflow event. In practice, the Fund holds most of its benchmark’s names, as well as holding futures and cash.
Symon BradfordFund Manager31 August 2018Royal London Asset Management
The views expressed are the author’s own and do not constitute investment advice and are not an indication of future fund performance. Portfolio holdings are subject to change, for information only and are not investment recommendations.
Source: Royal London Asset Management, unless otherwise stated.
MANAGER’S INVESTMENT REPORT
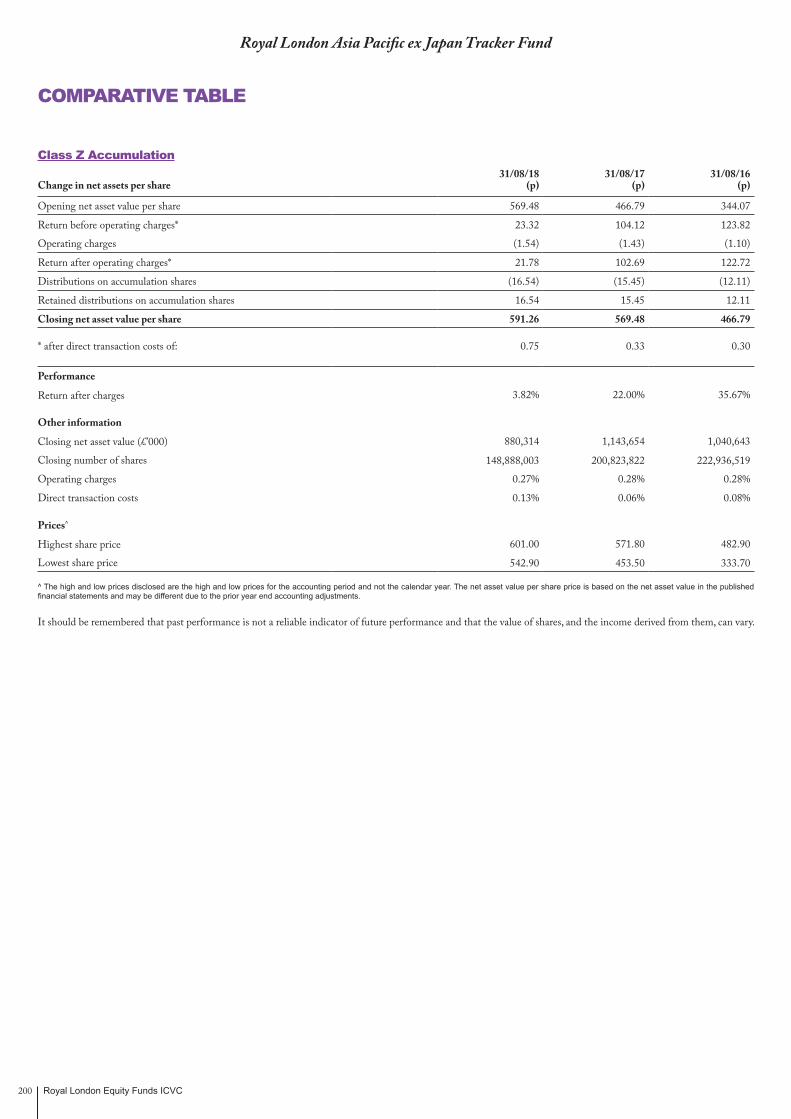
Royal London Equity Funds ICVC200
Royal London Asia Pacific ex Japan Tracker Fund
COMPARATIVE TABLE
Class Z Accumulation31/08/18 31/08/17 31/08/16
Change in net assets per share (p) (p) (p)
Opening net asset value per share 569.48 466.79 344.07
Return before operating charges* 23.32 104.12 123.82
Operating charges (1.54) (1.43) (1.10)
Return after operating charges* 21.78 102.69 122.72
Distributions on accumulation shares (16.54) (15.45) (12.11)
Retained distributions on accumulation shares 16.54 15.45 12.11
Closing net asset value per share 591.26 569.48 466.79
* after direct transaction costs of: 0.75 0.33 0.30
Performance
Return after charges 3.82% 22.00% 35.67%
Other information
Closing net asset value (£’000) 880,314 1,143,654 1,040,643
Closing number of shares 148,888,003 200,823,822 222,936,519
Operating charges 0.27% 0.28% 0.28%
Direct transaction costs 0.13% 0.06% 0.08%
Prices^
Highest share price 601.00 571.80 482.90
Lowest share price 542.90 453.50 333.70
^ The high and low prices disclosed are the high and low prices for the accounting period and not the calendar year. The net asset value per share price is based on the net asset value in the published financial statements and may be different due to the prior year end accounting adjustments.
It should be remembered that past performance is not a reliable indicator of future performance and that the value of shares, and the income derived from them, can vary.

Royal London Equity Funds ICVC 201
Royal London Asia Pacific ex Japan Tracker Fund
Equities – 95.39% (31/08/17 – 93.11%) Australia – 28.37% (31/08/17 – 27.33%) Basic Materials – 4.32% 765,467 Alumina 1,222 0.14 1,002,678 BHP Billiton 18,522 2.10 171,350 Bluescope Steel 1,649 0.19 500,595 Fortescue Metals 1,070 0.12 140,053 Iluka Resources 722 0.08 499,622 Incitec Pivot 1,070 0.12 26,146 New Hope Corporation 55 0.01 239,256 Newcrest Mining 2,580 0.29 81,081 Nufarm 308 0.03 114,420 Orica 1,118 0.13 112,535 OZ Minerals 565 0.06 128,333 Rio Tinto 5,184 0.59 55,897 Sims Metal Management 390 0.04 1,601,610 South32 3,092 0.35 232,607 Whitehaven Coal 650 0.07
Consumer Goods – 0.37% 168,080 Coca-Cola Amatil 874 0.10 223,805 Treasury Wine Estates 2,370 0.27
Consumer Services – 3.01% 199,325 Aristocrat Leisure 3,499 0.40 118,942 Crown 938 0.11 20,466 Domino’s Pizza 615 0.07 700,631 Fairfax Media 339 0.04 17,626 Flight Centre International 573 0.07 179,105 Harvey Norman 357 0.04 305,474 Metcash 467 0.05 228,198 Qantas Airways 815 0.09 23,301 Seven West Media 13 – 253,996 Star Entertainment 760 0.09 587,570 Tabcorp 1,566 0.18 353,483 Wesfarmers 10,072 1.14 409,750 Woolworths 6,420 0.73
Financials – 12.64% 892,167 AMP 1,658 0.19 59,326 ASX 2,218 0.25 903,780 Australia and New Zealand Banking 14,830 1.68 130,557 Bank of Queensland 834 0.09 160,846 Bendigo Bank 1,035 0.12 175,862 Challenger 1,059 0.12 549,253 Commonwealth Bank of Australia 21,763 2.47 320,805 Dexus Property 1,892 0.21 567,281 General Property 1,632 0.19 555,161 Goodman 3,271 0.37 732,093 Insurance Australia 3,116 0.35 108,826 IOOF Holdings 508 0.06 178,918 Lend Lease 2,001 0.23 95,575 Macquarie 6,852 0.78 45,741 Magellan Financial 708 0.08 860,058 Medibank 1,450 0.16 1,175,186 Mirvac 1,589 0.18 849,695 National Australia Bank 13,403 1.52 13,526 Perpetual 330 0.04 75,884 Platinum Asset Management 228 0.03 416,857 QBE Insurance 2,551 0.29 16,214 REA 818 0.09 1,589,224 Scentre 3,625 0.41 262,528 Shopping Centres Australasia 351 0.04 757,766 Stockland Trust 1,737 0.20
Australia – 28.37% (31/08/17 – 27.33%) – continued Financials – 12.64% – continued 400,997 Suncorp 3,454 0.39 993,891 Vicinity Centres 1,526 0.17 1,068,497 Westpac Banking 16,956 1.93
Healthcare – 2.78% 47,628 Ansell 663 0.08 17,420 Cochlear 2,089 0.24 140,994 CSL 17,816 2.02 576,923 Healthscope Limited 700 0.08 39,736 Ramsay Health Care 1,231 0.14 130,416 Sonic Healthcare 1,898 0.22
Industrials – 2.45% 139,779 Adelaide Brighton 499 0.06 164,186 ALS 807 0.09 362,038 Amcor 2,860 0.32 212,459 Atlas Arteria 785 0.09 588,694 Aurizon Holdings 1,376 0.16 355,894 Boral 1,378 0.16 491,651 Brambles 2,998 0.34 32,173 Cimic 878 0.10 166,904 CSR 398 0.05 196,340 Downer EDI 831 0.09 114,089 Duluxgroup 496 0.06 405,034 Orora 791 0.09 106,751 Seek 1,325 0.15 343,508 Sydney Airport 1,370 0.16 696,764 Transurban 4,676 0.53
Oil & Gas – 1.60% 366,299 APA 2,008 0.23 80,579 Caltex Australia 1,354 0.15 410,487 Oil Search 2,044 0.23 547,081 Santos 2,061 0.23 290,839 Woodside Petroleum 5,955 0.68 61,431 Worleyparsons 688 0.08
Technology – 0.20% 146,825 Computershare 1,565 0.18 89,993 Domain Holdings Australia 176 0.02 36,226 OneMarket 20 –
Telecommunications – 0.35% 1,299,029 Telstra 2,233 0.25 114,006 TPG Telecom 547 0.06 202,171 Vocus Communications Limited 319 0.04
Utilities – 0.60% 203,674 AGL Energy 2,352 0.27 528,039 Ausnet Services 482 0.06 543,177 Origin Energy 2,400 0.27
Futures – 0.05% 149 SFE SPI 200 Future September 2018 427 0.05
Total Australia 249,766 28.37
Bermuda – 0.90% (31/08/17 – 1.05%) Consumer Goods – 0.00% 786,000 Global Brand 29 –
Financials – 0.27% 1,969,000 China Oceanwide 76 0.01 793,000 Haitong International Securities 229 0.03 373,100 Hong Kong Land 1,984 0.23
PORTFOLIO STATEMENTAS AT 31 AUGUST 2018
Bid-Market Total net Holding Investment value (£’000) assets (%)
Bid-Market Total net Holding Investment value (£’000) assets (%)
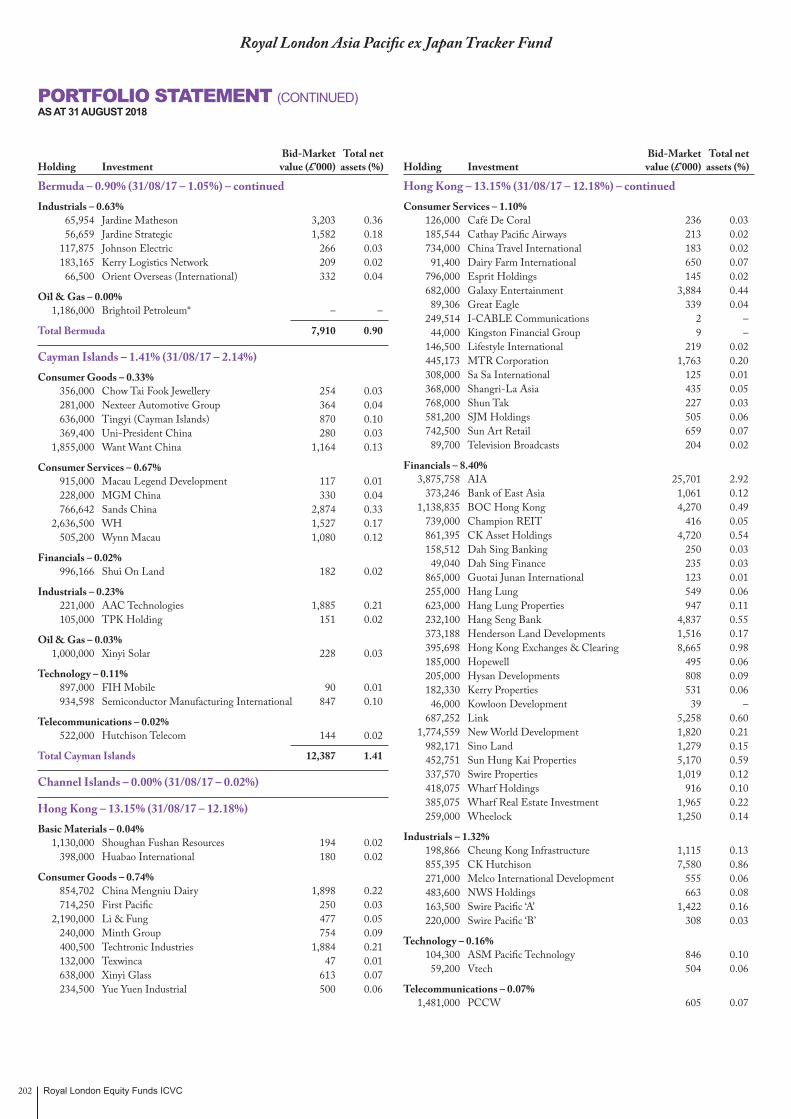
Royal London Equity Funds ICVC202
Royal London Asia Pacific ex Japan Tracker Fund
Bermuda – 0.90% (31/08/17 – 1.05%) – continued Industrials – 0.63% 65,954 Jardine Matheson 3,203 0.36 56,659 Jardine Strategic 1,582 0.18 117,875 Johnson Electric 266 0.03 183,165 Kerry Logistics Network 209 0.02 66,500 Orient Overseas (International) 332 0.04
Oil & Gas – 0.00% 1,186,000 Brightoil Petroleum* – –
Total Bermuda 7,910 0.90
Cayman Islands – 1.41% (31/08/17 – 2.14%) Consumer Goods – 0.33% 356,000 Chow Tai Fook Jewellery 254 0.03 281,000 Nexteer Automotive Group 364 0.04 636,000 Tingyi (Cayman Islands) 870 0.10 369,400 Uni-President China 280 0.03 1,855,000 Want Want China 1,164 0.13
Consumer Services – 0.67% 915,000 Macau Legend Development 117 0.01 228,000 MGM China 330 0.04 766,642 Sands China 2,874 0.33 2,636,500 WH 1,527 0.17 505,200 Wynn Macau 1,080 0.12
Financials – 0.02% 996,166 Shui On Land 182 0.02
Industrials – 0.23% 221,000 AAC Technologies 1,885 0.21 105,000 TPK Holding 151 0.02
Oil & Gas – 0.03% 1,000,000 Xinyi Solar 228 0.03
Technology – 0.11% 897,000 FIH Mobile 90 0.01 934,598 Semiconductor Manufacturing International 847 0.10
Telecommunications – 0.02% 522,000 Hutchison Telecom 144 0.02
Total Cayman Islands 12,387 1.41
Channel Islands – 0.00% (31/08/17 – 0.02%)
Hong Kong – 13.15% (31/08/17 – 12.18%) Basic Materials – 0.04% 1,130,000 Shoughan Fushan Resources 194 0.02 398,000 Huabao International 180 0.02
Consumer Goods – 0.74% 854,702 China Mengniu Dairy 1,898 0.22 714,250 First Pacific 250 0.03 2,190,000 Li & Fung 477 0.05 240,000 Minth Group 754 0.09 400,500 Techtronic Industries 1,884 0.21 132,000 Texwinca 47 0.01 638,000 Xinyi Glass 613 0.07 234,500 Yue Yuen Industrial 500 0.06
Hong Kong – 13.15% (31/08/17 – 12.18%) – continued Consumer Services – 1.10% 126,000 Café De Coral 236 0.03 185,544 Cathay Pacific Airways 213 0.02 734,000 China Travel International 183 0.02 91,400 Dairy Farm International 650 0.07 796,000 Esprit Holdings 145 0.02 682,000 Galaxy Entertainment 3,884 0.44 89,306 Great Eagle 339 0.04 249,514 I-CABLE Communications 2 – 44,000 Kingston Financial Group 9 – 146,500 Lifestyle International 219 0.02 445,173 MTR Corporation 1,763 0.20 308,000 Sa Sa International 125 0.01 368,000 Shangri-La Asia 435 0.05 768,000 Shun Tak 227 0.03 581,200 SJM Holdings 505 0.06 742,500 Sun Art Retail 659 0.07 89,700 Television Broadcasts 204 0.02
Financials – 8.40% 3,875,758 AIA 25,701 2.92 373,246 Bank of East Asia 1,061 0.12 1,138,835 BOC Hong Kong 4,270 0.49 739,000 Champion REIT 416 0.05 861,395 CK Asset Holdings 4,720 0.54 158,512 Dah Sing Banking 250 0.03 49,040 Dah Sing Finance 235 0.03 865,000 Guotai Junan International 123 0.01 255,000 Hang Lung 549 0.06 623,000 Hang Lung Properties 947 0.11 232,100 Hang Seng Bank 4,837 0.55 373,188 Henderson Land Developments 1,516 0.17 395,698 Hong Kong Exchanges & Clearing 8,665 0.98 185,000 Hopewell 495 0.06 205,000 Hysan Developments 808 0.09 182,330 Kerry Properties 531 0.06 46,000 Kowloon Development 39 – 687,252 Link 5,258 0.60 1,774,559 New World Development 1,820 0.21 982,171 Sino Land 1,279 0.15 452,751 Sun Hung Kai Properties 5,170 0.59 337,570 Swire Properties 1,019 0.12 418,075 Wharf Holdings 916 0.10 385,075 Wharf Real Estate Investment 1,965 0.22 259,000 Wheelock 1,250 0.14
Industrials – 1.32% 198,866 Cheung Kong Infrastructure 1,115 0.13 855,395 CK Hutchison 7,580 0.86 271,000 Melco International Development 555 0.06 483,600 NWS Holdings 663 0.08 163,500 Swire Pacific ‘A’ 1,422 0.16 220,000 Swire Pacific ‘B’ 308 0.03
Technology – 0.16% 104,300 ASM Pacific Technology 846 0.10 59,200 Vtech 504 0.06
Telecommunications – 0.07% 1,481,000 PCCW 605 0.07
PORTFOLIO STATEMENT (CONTINUED)AS AT 31 AUGUST 2018
Bid-Market Total net Holding Investment value (£’000) assets (%)
Bid-Market Total net Holding Investment value (£’000) assets (%)
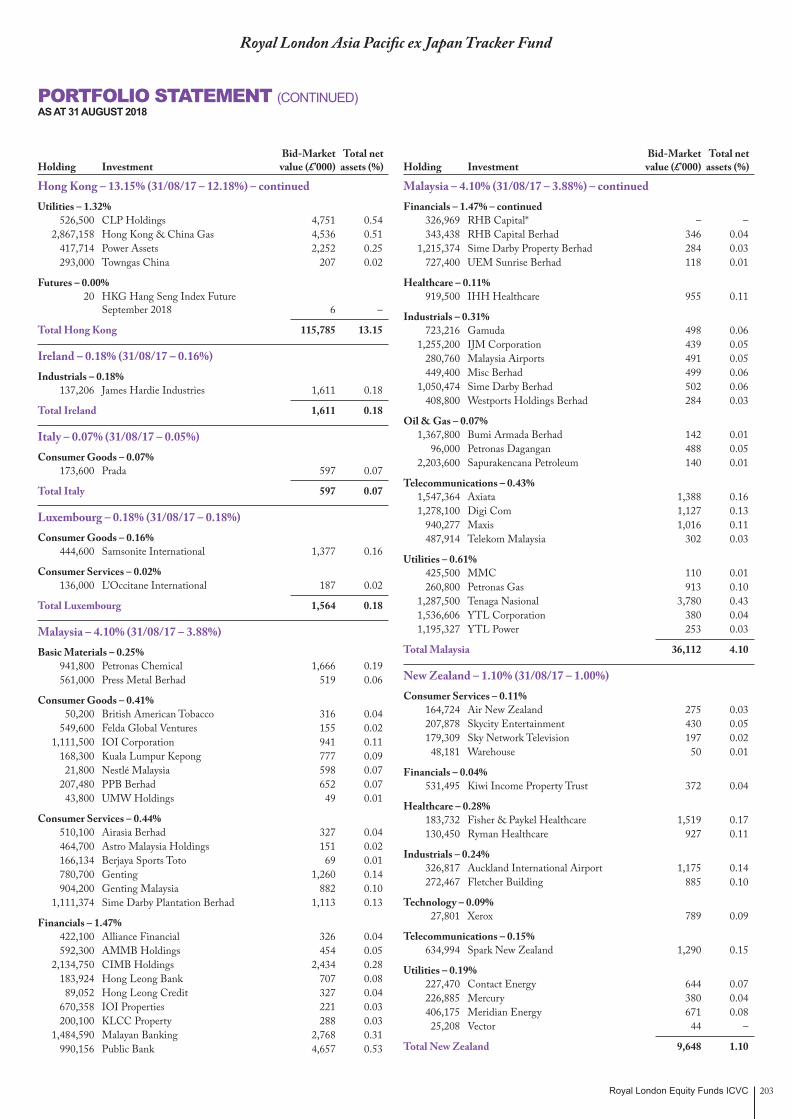
Royal London Equity Funds ICVC 203
Royal London Asia Pacific ex Japan Tracker Fund
Hong Kong – 13.15% (31/08/17 – 12.18%) – continued Utilities – 1.32% 526,500 CLP Holdings 4,751 0.54 2,867,158 Hong Kong & China Gas 4,536 0.51 417,714 Power Assets 2,252 0.25 293,000 Towngas China 207 0.02
Futures – 0.00% 20 HKG Hang Seng Index Future
September 2018 6 –
Total Hong Kong 115,785 13.15
Ireland – 0.18% (31/08/17 – 0.16%) Industrials – 0.18% 137,206 James Hardie Industries 1,611 0.18
Total Ireland 1,611 0.18
Italy – 0.07% (31/08/17 – 0.05%) Consumer Goods – 0.07% 173,600 Prada 597 0.07
Total Italy 597 0.07
Luxembourg – 0.18% (31/08/17 – 0.18%) Consumer Goods – 0.16% 444,600 Samsonite International 1,377 0.16
Consumer Services – 0.02% 136,000 L’Occitane International 187 0.02
Total Luxembourg 1,564 0.18
Malaysia – 4.10% (31/08/17 – 3.88%) Basic Materials – 0.25% 941,800 Petronas Chemical 1,666 0.19 561,000 Press Metal Berhad 519 0.06
Consumer Goods – 0.41% 50,200 British American Tobacco 316 0.04 549,600 Felda Global Ventures 155 0.02 1,111,500 IOI Corporation 941 0.11 168,300 Kuala Lumpur Kepong 777 0.09 21,800 Nestlé Malaysia 598 0.07 207,480 PPB Berhad 652 0.07 43,800 UMW Holdings 49 0.01
Consumer Services – 0.44% 510,100 Airasia Berhad 327 0.04 464,700 Astro Malaysia Holdings 151 0.02 166,134 Berjaya Sports Toto 69 0.01 780,700 Genting 1,260 0.14 904,200 Genting Malaysia 882 0.10 1,111,374 Sime Darby Plantation Berhad 1,113 0.13
Financials – 1.47% 422,100 Alliance Financial 326 0.04 592,300 AMMB Holdings 454 0.05 2,134,750 CIMB Holdings 2,434 0.28 183,924 Hong Leong Bank 707 0.08 89,052 Hong Leong Credit 327 0.04 670,358 IOI Properties 221 0.03 200,100 KLCC Property 288 0.03 1,484,590 Malayan Banking 2,768 0.31 990,156 Public Bank 4,657 0.53
Malaysia – 4.10% (31/08/17 – 3.88%) – continued Financials – 1.47% – continued 326,969 RHB Capital* – – 343,438 RHB Capital Berhad 346 0.04 1,215,374 Sime Darby Property Berhad 284 0.03 727,400 UEM Sunrise Berhad 118 0.01
Healthcare – 0.11% 919,500 IHH Healthcare 955 0.11
Industrials – 0.31% 723,216 Gamuda 498 0.06 1,255,200 IJM Corporation 439 0.05 280,760 Malaysia Airports 491 0.05 449,400 Misc Berhad 499 0.06 1,050,474 Sime Darby Berhad 502 0.06 408,800 Westports Holdings Berhad 284 0.03
Oil & Gas – 0.07% 1,367,800 Bumi Armada Berhad 142 0.01 96,000 Petronas Dagangan 488 0.05 2,203,600 Sapurakencana Petroleum 140 0.01
Telecommunications – 0.43% 1,547,364 Axiata 1,388 0.16 1,278,100 Digi Com 1,127 0.13 940,277 Maxis 1,016 0.11 487,914 Telekom Malaysia 302 0.03
Utilities – 0.61% 425,500 MMC 110 0.01 260,800 Petronas Gas 913 0.10 1,287,500 Tenaga Nasional 3,780 0.43 1,536,606 YTL Corporation 380 0.04 1,195,327 YTL Power 253 0.03
Total Malaysia 36,112 4.10
New Zealand – 1.10% (31/08/17 – 1.00%) Consumer Services – 0.11% 164,724 Air New Zealand 275 0.03 207,878 Skycity Entertainment 430 0.05 179,309 Sky Network Television 197 0.02 48,181 Warehouse 50 0.01
Financials – 0.04% 531,495 Kiwi Income Property Trust 372 0.04
Healthcare – 0.28% 183,732 Fisher & Paykel Healthcare 1,519 0.17 130,450 Ryman Healthcare 927 0.11
Industrials – 0.24% 326,817 Auckland International Airport 1,175 0.14 272,467 Fletcher Building 885 0.10
Technology – 0.09% 27,801 Xerox 789 0.09
Telecommunications – 0.15% 634,994 Spark New Zealand 1,290 0.15
Utilities – 0.19% 227,470 Contact Energy 644 0.07 226,885 Mercury 380 0.04 406,175 Meridian Energy 671 0.08 25,208 Vector 44 –
Total New Zealand 9,648 1.10
PORTFOLIO STATEMENT (CONTINUED)AS AT 31 AUGUST 2018
Bid-Market Total net Holding Investment value (£’000) assets (%)
Bid-Market Total net Holding Investment value (£’000) assets (%)
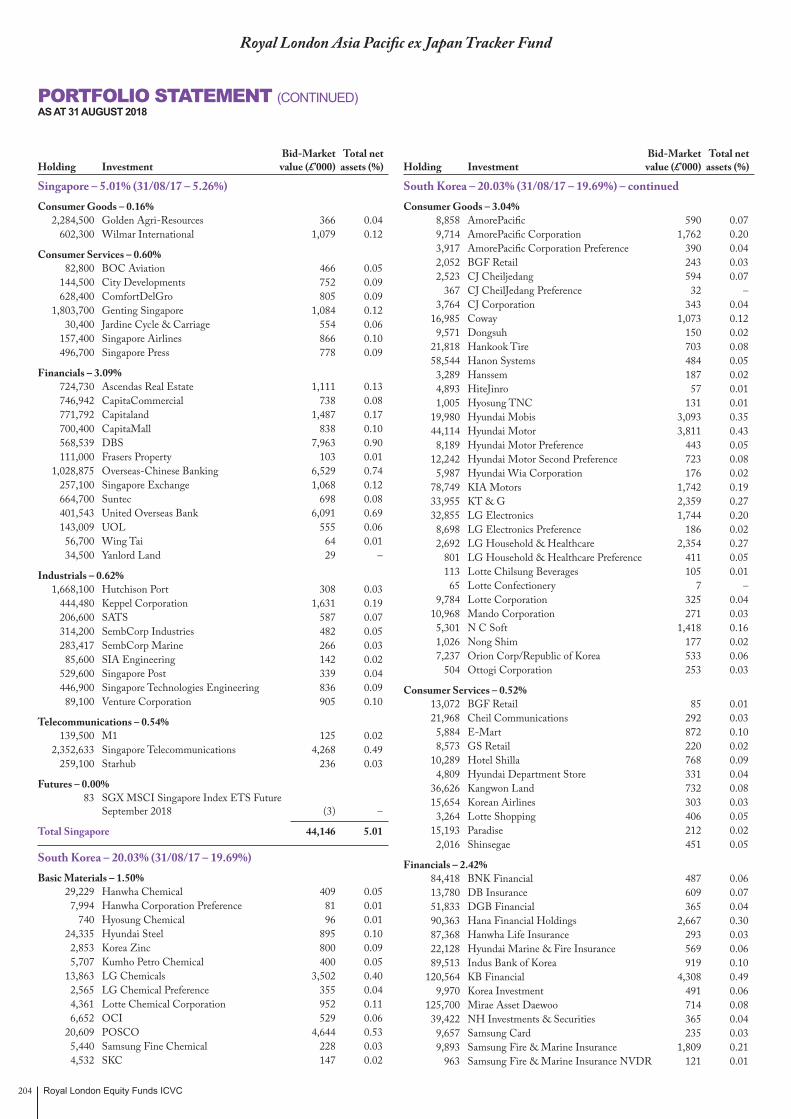
Royal London Equity Funds ICVC204
Royal London Asia Pacific ex Japan Tracker Fund
Singapore – 5.01% (31/08/17 – 5.26%) Consumer Goods – 0.16% 2,284,500 Golden Agri-Resources 366 0.04 602,300 Wilmar International 1,079 0.12
Consumer Services – 0.60% 82,800 BOC Aviation 466 0.05 144,500 City Developments 752 0.09 628,400 ComfortDelGro 805 0.09 1,803,700 Genting Singapore 1,084 0.12 30,400 Jardine Cycle & Carriage 554 0.06 157,400 Singapore Airlines 866 0.10 496,700 Singapore Press 778 0.09
Financials – 3.09% 724,730 Ascendas Real Estate 1,111 0.13 746,942 CapitaCommercial 738 0.08 771,792 Capitaland 1,487 0.17 700,400 CapitaMall 838 0.10 568,539 DBS 7,963 0.90 111,000 Frasers Property 103 0.01 1,028,875 Overseas-Chinese Banking 6,529 0.74 257,100 Singapore Exchange 1,068 0.12 664,700 Suntec 698 0.08 401,543 United Overseas Bank 6,091 0.69 143,009 UOL 555 0.06 56,700 Wing Tai 64 0.01 34,500 Yanlord Land 29 –
Industrials – 0.62% 1,668,100 Hutchison Port 308 0.03 444,480 Keppel Corporation 1,631 0.19 206,600 SATS 587 0.07 314,200 SembCorp Industries 482 0.05 283,417 SembCorp Marine 266 0.03 85,600 SIA Engineering 142 0.02 529,600 Singapore Post 339 0.04 446,900 Singapore Technologies Engineering 836 0.09 89,100 Venture Corporation 905 0.10
Telecommunications – 0.54% 139,500 M1 125 0.02 2,352,633 Singapore Telecommunications 4,268 0.49 259,100 Starhub 236 0.03
Futures – 0.00% 83 SGX MSCI Singapore Index ETS Future
September 2018 (3) –
Total Singapore 44,146 5.01
South Korea – 20.03% (31/08/17 – 19.69%) Basic Materials – 1.50% 29,229 Hanwha Chemical 409 0.05 7,994 Hanwha Corporation Preference 81 0.01 740 Hyosung Chemical 96 0.01 24,335 Hyundai Steel 895 0.10 2,853 Korea Zinc 800 0.09 5,707 Kumho Petro Chemical 400 0.05 13,863 LG Chemicals 3,502 0.40 2,565 LG Chemical Preference 355 0.04 4,361 Lotte Chemical Corporation 952 0.11 6,652 OCI 529 0.06 20,609 POSCO 4,644 0.53 5,440 Samsung Fine Chemical 228 0.03 4,532 SKC 147 0.02
South Korea – 20.03% (31/08/17 – 19.69%) – continued Consumer Goods – 3.04% 8,858 AmorePacific 590 0.07 9,714 AmorePacific Corporation 1,762 0.20 3,917 AmorePacific Corporation Preference 390 0.04 2,052 BGF Retail 243 0.03 2,523 CJ Cheiljedang 594 0.07 367 CJ CheilJedang Preference 32 – 3,764 CJ Corporation 343 0.04 16,985 Coway 1,073 0.12 9,571 Dongsuh 150 0.02 21,818 Hankook Tire 703 0.08 58,544 Hanon Systems 484 0.05 3,289 Hanssem 187 0.02 4,893 HiteJinro 57 0.01 1,005 Hyosung TNC 131 0.01 19,980 Hyundai Mobis 3,093 0.35 44,114 Hyundai Motor 3,811 0.43 8,189 Hyundai Motor Preference 443 0.05 12,242 Hyundai Motor Second Preference 723 0.08 5,987 Hyundai Wia Corporation 176 0.02 78,749 KIA Motors 1,742 0.19 33,955 KT & G 2,359 0.27 32,855 LG Electronics 1,744 0.20 8,698 LG Electronics Preference 186 0.02 2,692 LG Household & Healthcare 2,354 0.27 801 LG Household & Healthcare Preference 411 0.05 113 Lotte Chilsung Beverages 105 0.01 65 Lotte Confectionery 7 – 9,784 Lotte Corporation 325 0.04 10,968 Mando Corporation 271 0.03 5,301 N C Soft 1,418 0.16 1,026 Nong Shim 177 0.02 7,237 Orion Corp/Republic of Korea 533 0.06 504 Ottogi Corporation 253 0.03
Consumer Services – 0.52% 13,072 BGF Retail 85 0.01 21,968 Cheil Communications 292 0.03 5,884 E-Mart 872 0.10 8,573 GS Retail 220 0.02 10,289 Hotel Shilla 768 0.09 4,809 Hyundai Department Store 331 0.04 36,626 Kangwon Land 732 0.08 15,654 Korean Airlines 303 0.03 3,264 Lotte Shopping 406 0.05 15,193 Paradise 212 0.02 2,016 Shinsegae 451 0.05
Financials – 2.42% 84,418 BNK Financial 487 0.06 13,780 DB Insurance 609 0.07 51,833 DGB Financial 365 0.04 90,363 Hana Financial Holdings 2,667 0.30 87,368 Hanwha Life Insurance 293 0.03 22,128 Hyundai Marine & Fire Insurance 569 0.06 89,513 Indus Bank of Korea 919 0.10 120,564 KB Financial 4,308 0.49 9,970 Korea Investment 491 0.06 125,700 Mirae Asset Daewoo 714 0.08 39,422 NH Investments & Securities 365 0.04 9,657 Samsung Card 235 0.03 9,893 Samsung Fire & Marine Insurance 1,809 0.21 963 Samsung Fire & Marine Insurance NVDR 121 0.01
PORTFOLIO STATEMENT (CONTINUED)AS AT 31 AUGUST 2018
Bid-Market Total net Holding Investment value (£’000) assets (%)
Bid-Market Total net Holding Investment value (£’000) assets (%)

Royal London Equity Funds ICVC 205
Royal London Asia Pacific ex Japan Tracker Fund
South Korea – 20.03% (31/08/17 – 19.69%) – continued Financials – 2.42% – continued 19,009 Samsung Life Insurance 1,214 0.14 18,292 Samsung Securities 408 0.05 138,210 Shinhan Financial 4,155 0.46 152,595 Woori Bank 1,714 0.19
Healthcare – 1.03% 23,946 Celltrion 4,460 0.51 15,452 Celltrion Healthcare 965 0.11 2,110 Hanmi Pharmaceutical 726 0.08 4,176 Hanmi Science 251 0.03 4,063 Samsung Biologics 1,299 0.15 17,150 SillaJen 904 0.10 2,498 Yuhan Corporation 412 0.05
Industrials – 8.41% 23,315 Cheil Industries 1,974 0.22 1,944 CJ Logistics 206 0.02 9,477 Daelim Industrial 536 0.06 56,717 Daewoo Engineering & Construction 205 0.02 15,342 Daewoo International 194 0.02 1,835 Doosan 148 0.02 51,887 Doosan Infracore 341 0.04 15,764 GS Engineering & Construction 521 0.06 13,246 Hansteen Holdings Financials 292 0.03 11,280 Hanwha Techwin 195 0.02 6,214 HDC 105 0.01 9,941 HDC Hyundai Development 384 0.04 3,204 Hyosung 102 0.01 1,040 Hyosung Advanced 114 0.01 2,166 Hyosung Heavy Industries 89 0.01 2,514 Hyundai Construction 204 0.02 2,600 Hyundai Electric & Energy System 106 0.01 23,468 Hyundia Engineering & Construction 972 0.11 5,401 Hyundai Glovis 450 0.05 13,908 Hyundai Heavy Industries 1,134 0.13 3,436 Hyundai Heavy Industries Holdings 895 0.10 3,967 Hyundai Mipo Dockyard 268 0.03 1,864 KCC Corporation 418 0.05 9,019 Kepco Plant Service & Engineering 227 0.03 19,955 Korea Aerospace Industries 575 0.07 26,961 LG Corporation 1,331 0.15 2,326 LG Hausys 108 0.01 5,314 LS Cable 246 0.03 6,311 S1 Corporation 373 0.04 16,969 Samsung Electro-Mechanics 1,882 0.22 1,449,825 Samsung Electronics 48,501 5.51 254,631 Samsung Electronics preference 6,987 0.79 46,449 Samsung Engineering 539 0.06 150,470 Samsung Heavy Industries 735 0.09 16,092 Samsung SDI 2,625 0.30 45,442 SK Networks 141 0.02
Oil & Gas – 0.47% 18,764 Doosan Heavy Industries & Construction 184 0.02 14,146 GS Holdings 519 0.06 18,300 SK Innovation 2,435 0.28 12,032 S-Oil Corporation 990 0.11
Technology – 2.26% 13,695 Daum Kakao Corporation 1,178 0.13 1,500 Korea Digital Line* – – 66,849 LG Display 980 0.11 8,215 Naver Corporation 4,264 0.49
PORTFOLIO STATEMENT (CONTINUED)AS AT 31 AUGUST 2018
Bid-Market Total net Holding Investment value (£’000) assets (%)
Bid-Market Total net Holding Investment value (£’000) assets (%)
South Korea – 20.03% (31/08/17 – 19.69%) – continued Technology – 2.26% – continued 3,860 Netmarble Games 311 0.04 2,834 NHN Entertainment Corporation 118 0.02 9,710 Samsung SDS 1,624 0.19 9,988 SK C&C 1,812 0.21 164,250 SK Hynix 9,411 1.07
Telecommunications – 0.21% 57,353 LG Uplus 620 0.07 6,889 SK Telecom 1,243 0.14
Utilities – 0.23% 77,254 Korea Electric Power 1,629 0.19 9,185 Korea Gas Corporation 334 0.04
Futures – (0.06)% 210 KFE Kospi 200 Index Future
September 2018 (510) (0.06)
Total South Korea 176,305 20.03
Taiwan – 16.16% (31/08/17 – 16.08%) Basic Materials – 1.60% 3,577,270 China Steel 2,249 0.26 256,689 Enternal Chemical 173 0.02 177,000 Feng Hsin Iron & Steel 257 0.03 1,016,600 Formosa Chemicals & Fibre 3,107 0.35 1,461,990 Formosa Plastics 4,120 0.47 1,677,810 Nan Ya Plastics 3,577 0.41 304,000 Oriental Union Chemical 248 0.03 196,000 Taiwan Fertilizer 208 0.02 194,000 Ton Yi Industrial 66 0.01
Consumer Goods – 1.31% 625,353 Cheng Shin Rubber Industry 734 0.08 182,000 China Motor 118 0.01 66,685 Eclat Textile 623 0.07 1,275,948 Far Eastern New Century 1,143 0.13 114,600 Feng Tay Enterprises 534 0.06 297,000 Formosa Taffeta 265 0.03 94,000 Giant Manufacturing 311 0.04 32,000 Largan Precision 3,767 0.43 826,000 Pou Chen 699 0.08 563,000 Teco Electric & Machinery 315 0.04 1,452,687 Uni-President Enterprises 2,816 0.32 243,000 Yulon Motor 128 0.01 8,000 Yulon Nissan Motor 48 0.01
Consumer Services – 0.23% 1,004,000 China Airlines 237 0.03 834,503 Eva Airways 325 0.04 2,000 Hotai Motor Company 13 – 169,822 President Chain Store 1,419 0.16
Financials – 2.69% 225,770 Capital Securities 59 0.01 2,385,683 Cathay Financial 3,137 0.36 119,200 Cathay Real Estate Developments 52 0.01 1,818,491 Chang Hwa Commercial Bank 868 0.10 4,198,000 China Development Financial 1,162 0.13 723,503 China Life Insurance 553 0.06 5,451,144 CTBC Financial Holding 2,936 0.32 3,033,226 E.Sun Financial 1,713 0.19 721,758 Far Eastern International Bank 202 0.02 2,897,653 First Financial 1,488 0.17
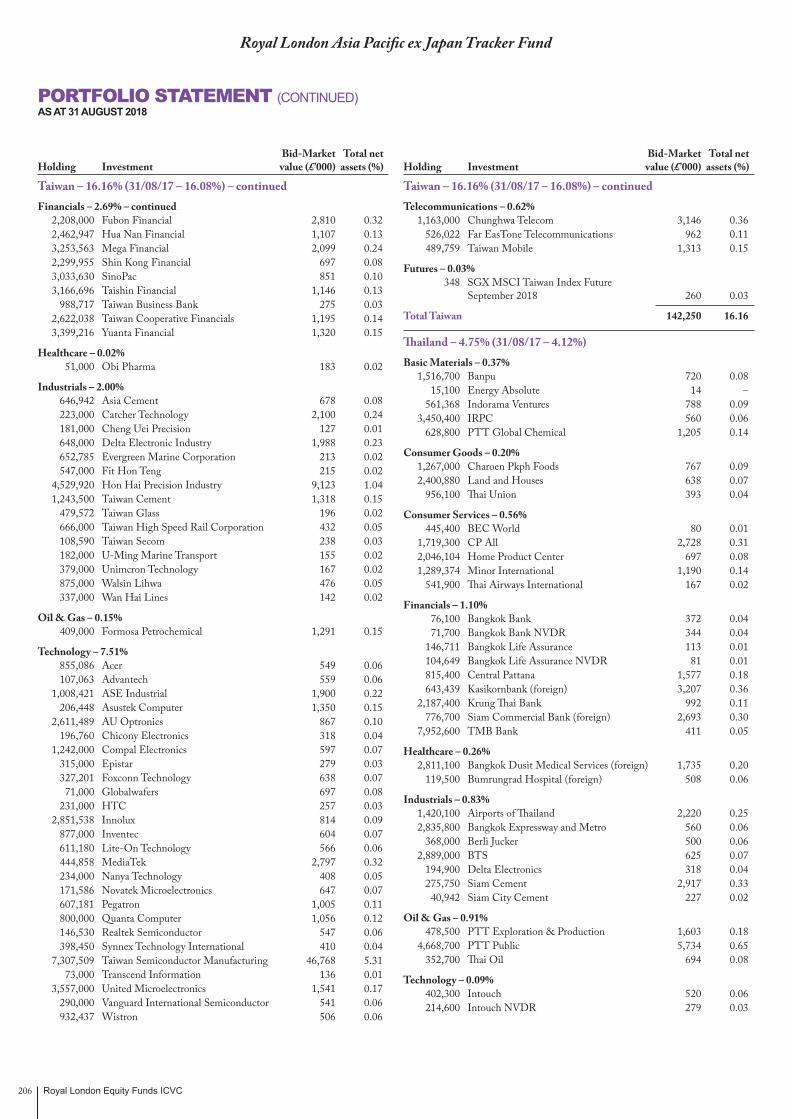
Royal London Equity Funds ICVC206
Royal London Asia Pacific ex Japan Tracker Fund
Taiwan – 16.16% (31/08/17 – 16.08%) – continued Financials – 2.69% – continued 2,208,000 Fubon Financial 2,810 0.32 2,462,947 Hua Nan Financial 1,107 0.13 3,253,563 Mega Financial 2,099 0.24 2,299,955 Shin Kong Financial 697 0.08 3,033,630 SinoPac 851 0.10 3,166,696 Taishin Financial 1,146 0.13 988,717 Taiwan Business Bank 275 0.03 2,622,038 Taiwan Cooperative Financials 1,195 0.14 3,399,216 Yuanta Financial 1,320 0.15
Healthcare – 0.02% 51,000 Obi Pharma 183 0.02
Industrials – 2.00% 646,942 Asia Cement 678 0.08 223,000 Catcher Technology 2,100 0.24 181,000 Cheng Uei Precision 127 0.01 648,000 Delta Electronic Industry 1,988 0.23 652,785 Evergreen Marine Corporation 213 0.02 547,000 Fit Hon Teng 215 0.02 4,529,920 Hon Hai Precision Industry 9,123 1.04 1,243,500 Taiwan Cement 1,318 0.15 479,572 Taiwan Glass 196 0.02 666,000 Taiwan High Speed Rail Corporation 432 0.05 108,590 Taiwan Secom 238 0.03 182,000 U-Ming Marine Transport 155 0.02 379,000 Unimcron Technology 167 0.02 875,000 Walsin Lihwa 476 0.05 337,000 Wan Hai Lines 142 0.02
Oil & Gas – 0.15% 409,000 Formosa Petrochemical 1,291 0.15
Technology – 7.51% 855,086 Acer 549 0.06 107,063 Advantech 559 0.06 1,008,421 ASE Industrial 1,900 0.22 206,448 Asustek Computer 1,350 0.15 2,611,489 AU Optronics 867 0.10 196,760 Chicony Electronics 318 0.04 1,242,000 Compal Electronics 597 0.07 315,000 Epistar 279 0.03 327,201 Foxconn Technology 638 0.07 71,000 Globalwafers 697 0.08 231,000 HTC 257 0.03 2,851,538 Innolux 814 0.09 877,000 Inventec 604 0.07 611,180 Lite-On Technology 566 0.06 444,858 MediaTek 2,797 0.32 234,000 Nanya Technology 408 0.05 171,586 Novatek Microelectronics 647 0.07 607,181 Pegatron 1,005 0.11 800,000 Quanta Computer 1,056 0.12 146,530 Realtek Semiconductor 547 0.06 398,450 Synnex Technology International 410 0.04 7,307,509 Taiwan Semiconductor Manufacturing 46,768 5.31 73,000 Transcend Information 136 0.01 3,557,000 United Microelectronics 1,541 0.17 290,000 Vanguard International Semiconductor 541 0.06 932,437 Wistron 506 0.06
Taiwan – 16.16% (31/08/17 – 16.08%) – continued Telecommunications – 0.62% 1,163,000 Chunghwa Telecom 3,146 0.36 526,022 Far EasTone Telecommunications 962 0.11 489,759 Taiwan Mobile 1,313 0.15
Futures – 0.03% 348 SGX MSCI Taiwan Index Future
September 2018 260 0.03
Total Taiwan 142,250 16.16
Thailand – 4.75% (31/08/17 – 4.12%) Basic Materials – 0.37% 1,516,700 Banpu 720 0.08 15,100 Energy Absolute 14 – 561,368 Indorama Ventures 788 0.09 3,450,400 IRPC 560 0.06 628,800 PTT Global Chemical 1,205 0.14
Consumer Goods – 0.20% 1,267,000 Charoen Pkph Foods 767 0.09 2,400,880 Land and Houses 638 0.07 956,100 Thai Union 393 0.04
Consumer Services – 0.56% 445,400 BEC World 80 0.01 1,719,300 CP All 2,728 0.31 2,046,104 Home Product Center 697 0.08 1,289,374 Minor International 1,190 0.14 541,900 Thai Airways International 167 0.02
Financials – 1.10% 76,100 Bangkok Bank 372 0.04 71,700 Bangkok Bank NVDR 344 0.04 146,711 Bangkok Life Assurance 113 0.01 104,649 Bangkok Life Assurance NVDR 81 0.01 815,400 Central Pattana 1,577 0.18 643,439 Kasikornbank (foreign) 3,207 0.36 2,187,400 Krung Thai Bank 992 0.11 776,700 Siam Commercial Bank (foreign) 2,693 0.30 7,952,600 TMB Bank 411 0.05
Healthcare – 0.26% 2,811,100 Bangkok Dusit Medical Services (foreign) 1,735 0.20 119,500 Bumrungrad Hospital (foreign) 508 0.06
Industrials – 0.83% 1,420,100 Airports of Thailand 2,220 0.25 2,835,800 Bangkok Expressway and Metro 560 0.06 368,000 Berli Jucker 500 0.06 2,889,000 BTS 625 0.07 194,900 Delta Electronics 318 0.04 275,750 Siam Cement 2,917 0.33 40,942 Siam City Cement 227 0.02
Oil & Gas – 0.91% 478,500 PTT Exploration & Production 1,603 0.18 4,668,700 PTT Public 5,734 0.65 352,700 Thai Oil 694 0.08
Technology – 0.09% 402,300 Intouch 520 0.06 214,600 Intouch NVDR 279 0.03
PORTFOLIO STATEMENT (CONTINUED)AS AT 31 AUGUST 2018
Bid-Market Total net Holding Investment value (£’000) assets (%)
Bid-Market Total net Holding Investment value (£’000) assets (%)
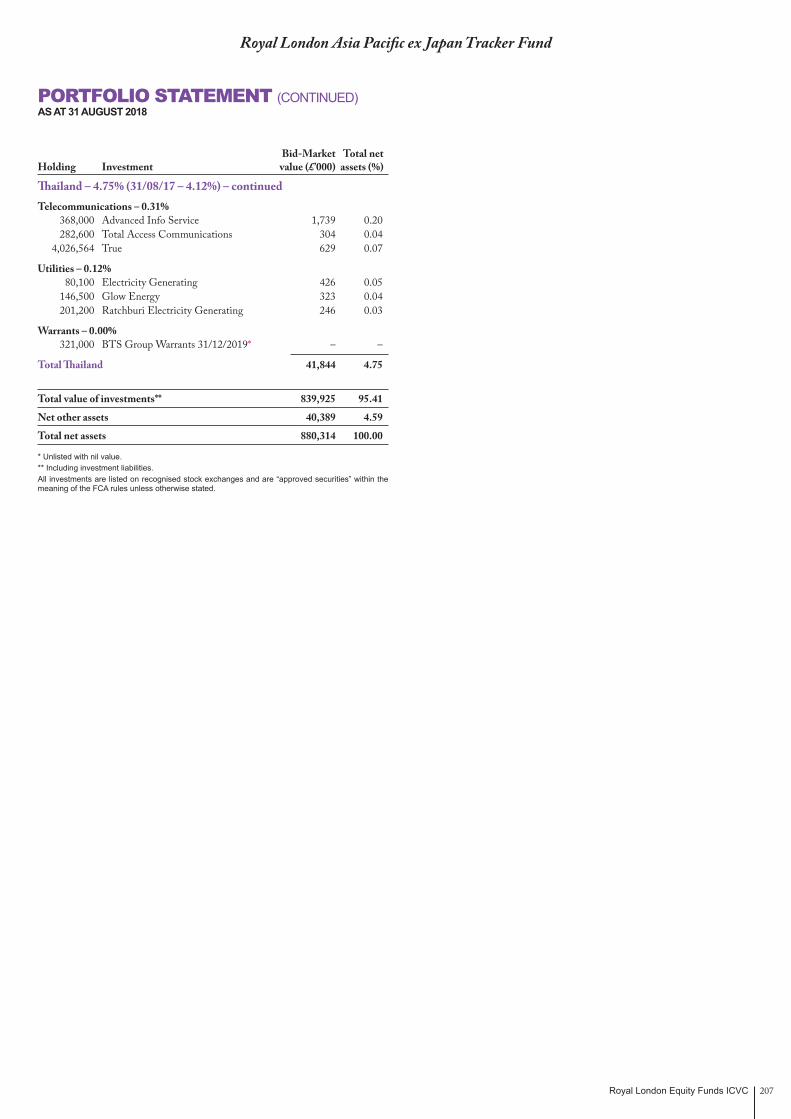
Royal London Equity Funds ICVC 207
Thailand – 4.75% (31/08/17 – 4.12%) – continued Telecommunications – 0.31% 368,000 Advanced Info Service 1,739 0.20 282,600 Total Access Communications 304 0.04 4,026,564 True 629 0.07
Utilities – 0.12% 80,100 Electricity Generating 426 0.05 146,500 Glow Energy 323 0.04 201,200 Ratchburi Electricity Generating 246 0.03
Warrants – 0.00% 321,000 BTS Group Warrants 31/12/2019* – –
Total Thailand 41,844 4.75
Total value of investments** 839,925 95.41
Net other assets 40,389 4.59
Total net assets 880,314 100.00
* Unlisted with nil value.** Including investment liabilities.All investments are listed on recognised stock exchanges and are “approved securities” within the meaning of the FCA rules unless otherwise stated.
Royal London Asia Pacific ex Japan Tracker Fund
PORTFOLIO STATEMENT (CONTINUED)AS AT 31 AUGUST 2018
Bid-Market Total net Holding Investment value (£’000) assets (%)
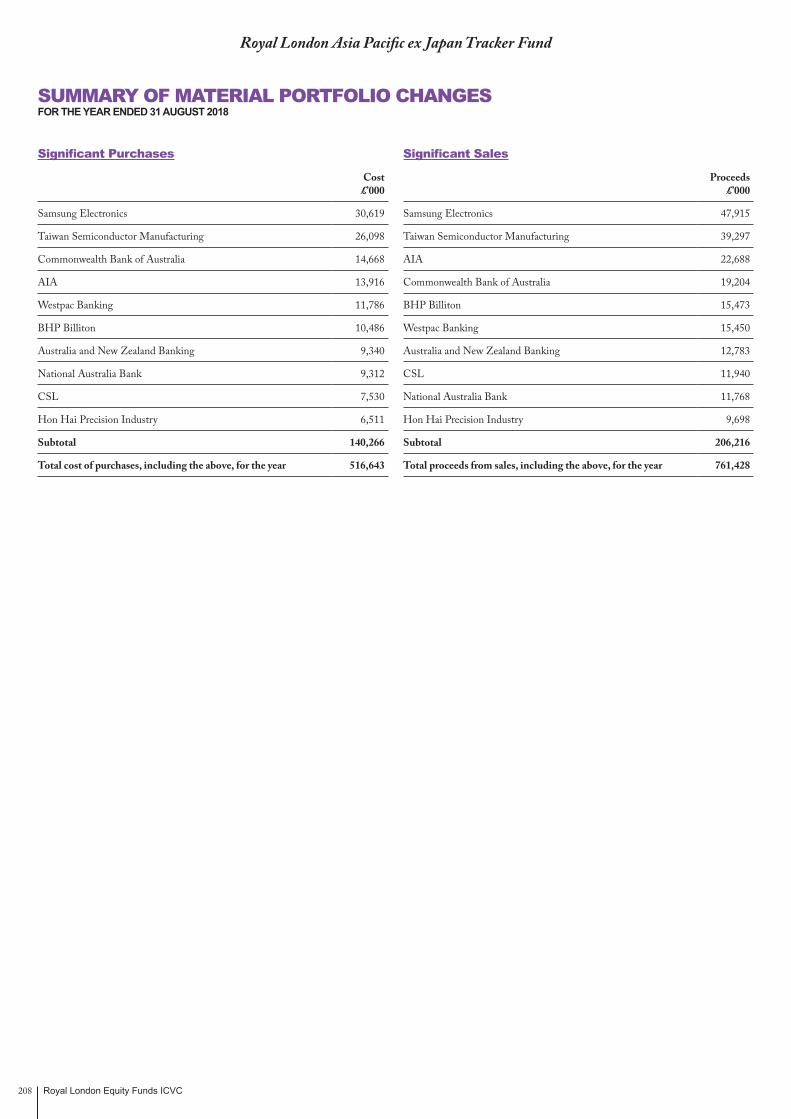
Royal London Equity Funds ICVC208
Royal London Asia Pacific ex Japan Tracker Fund
SUMMARY OF MATERIAL PORTFOLIO CHANGESFOR THE YEAR ENDED 31 AUGUST 2018
Significant Purchases
Cost £’000
Samsung Electronics 30,619
Taiwan Semiconductor Manufacturing 26,098
Commonwealth Bank of Australia 14,668
AIA 13,916
Westpac Banking 11,786
BHP Billiton 10,486
Australia and New Zealand Banking 9,340
National Australia Bank 9,312
CSL 7,530
Hon Hai Precision Industry 6,511
Subtotal 140,266
Total cost of purchases, including the above, for the year 516,643
Significant Sales
Proceeds £’000
Samsung Electronics 47,915
Taiwan Semiconductor Manufacturing 39,297
AIA 22,688
Commonwealth Bank of Australia 19,204
BHP Billiton 15,473
Westpac Banking 15,450
Australia and New Zealand Banking 12,783
CSL 11,940
National Australia Bank 11,768
Hon Hai Precision Industry 9,698
Subtotal 206,216
Total proceeds from sales, including the above, for the year 761,428
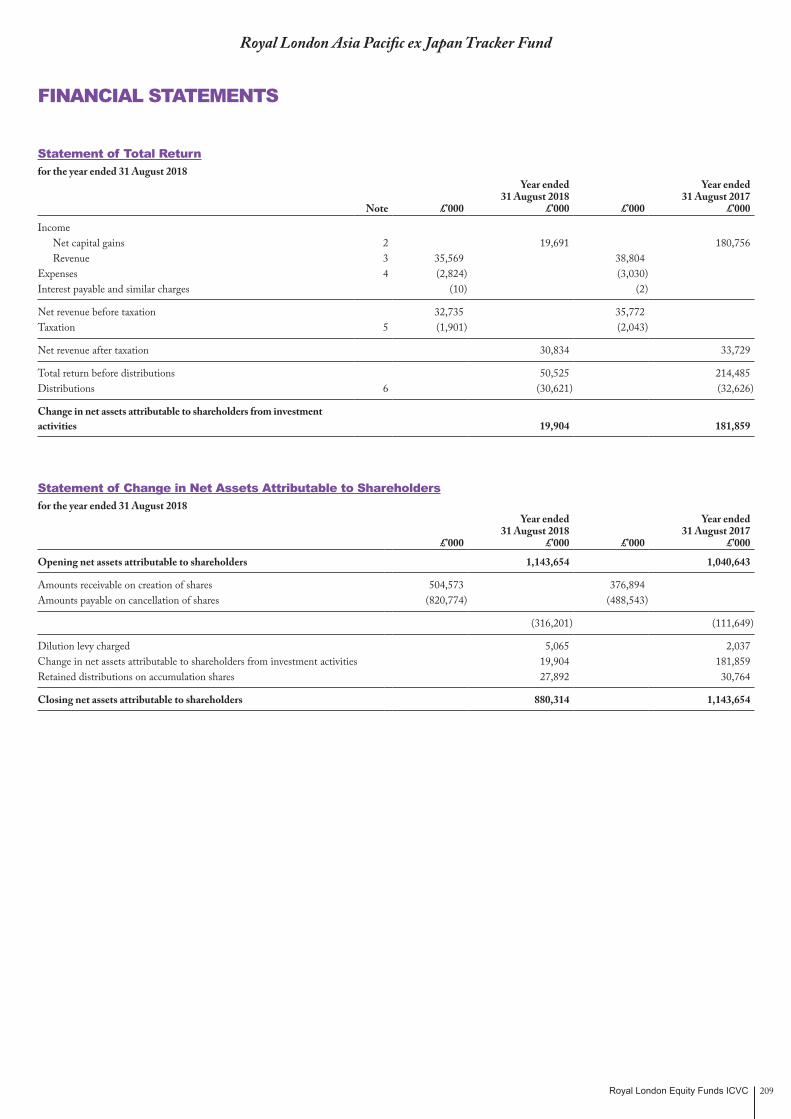
Royal London Equity Funds ICVC 209
Royal London Asia Pacific ex Japan Tracker Fund
FINANCIAL STATEMENTS
Statement of Total Returnfor the year ended 31 August 2018
Note £’000
Year ended31 August 2018
£’000 £’000
Year ended31 August 2017
£’000
Income Net capital gains 2 19,691 180,756 Revenue 3 35,569 38,804
Expenses 4 (2,824) (3,030)Interest payable and similar charges (10) (2)
Net revenue before taxation 32,735 35,772 Taxation 5 (1,901) (2,043)
Net revenue after taxation 30,834 33,729
Total return before distributions 50,525 214,485 Distributions 6 (30,621) (32,626)
Change in net assets attributable to shareholders from investment activities 19,904 181,859
Statement of Change in Net Assets Attributable to Shareholdersfor the year ended 31 August 2018
£’000
Year ended31 August 2018
£’000 £’000
Year ended31 August 2017
£’000
Opening net assets attributable to shareholders 1,143,654 1,040,643
Amounts receivable on creation of shares 504,573 376,894 Amounts payable on cancellation of shares (820,774) (488,543)
(316,201) (111,649)
Dilution levy charged 5,065 2,037 Change in net assets attributable to shareholders from investment activities 19,904 181,859 Retained distributions on accumulation shares 27,892 30,764
Closing net assets attributable to shareholders 880,314 1,143,654

Royal London Equity Funds ICVC210
Royal London Asia Pacific ex Japan Tracker Fund
FINANCIAL STATEMENTS (CONTINUED)
Balance Sheetas at 31 August 2018
Note31 August 2018
£’00031 August 2017
£’000
ASSETS
Investments 840,438 1,065,267
Current assets:Debtors 7 4,022 33,283 Cash and bank balances 8 36,845 45,581
Total assets 881,305 1,144,131
LIABILITIES
Investment liabilities 513 63
Creditors:Other creditors 9 478 414
Total liabilities 991 477
Net assets attributable to shareholders 880,314 1,143,654
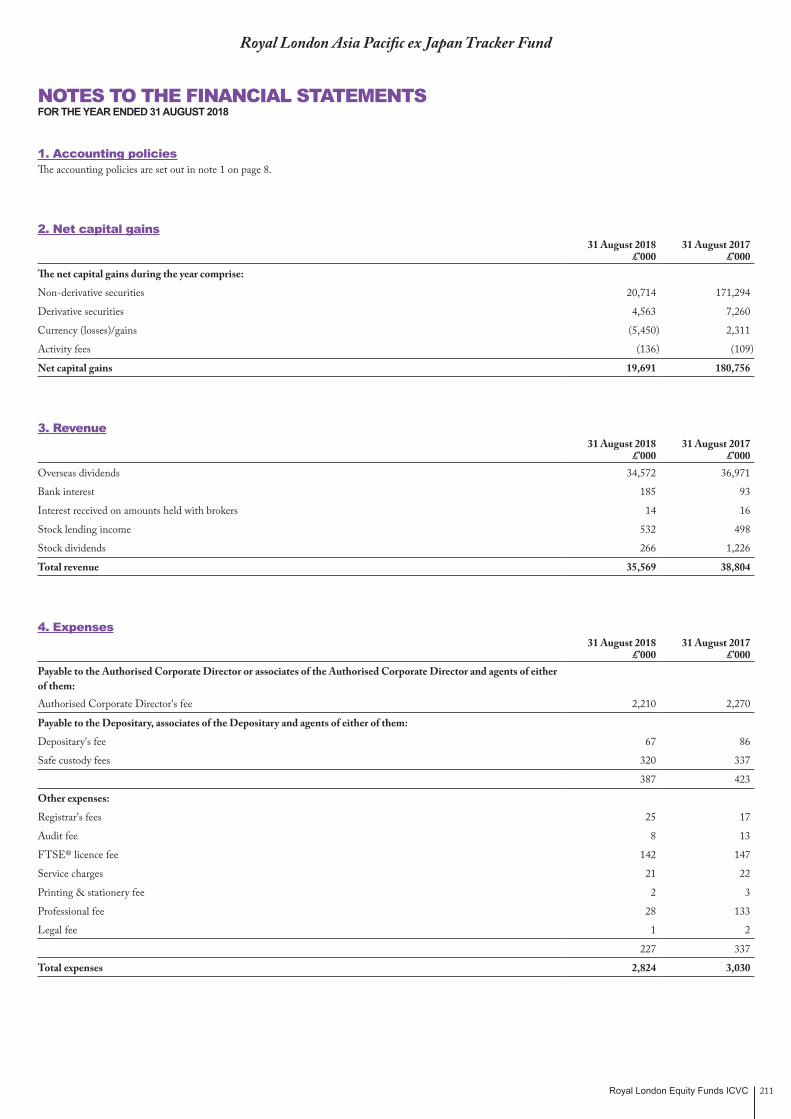
Royal London Equity Funds ICVC 211
Royal London Asia Pacific ex Japan Tracker Fund
NOTES TO THE FINANCIAL STATEMENTSFOR THE YEAR ENDED 31 AUGUST 2018
1. Accounting policiesThe accounting policies are set out in note 1 on page 8.
2. Net capital gains31 August 2018
£’00031 August 2017
£’000The net capital gains during the year comprise:
Non-derivative securities 20,714 171,294
Derivative securities 4,563 7,260
Currency (losses)/gains (5,450) 2,311
Activity fees (136) (109)
Net capital gains 19,691 180,756
3. Revenue31 August 2018
£’00031 August 2017
£’000Overseas dividends 34,572 36,971
Bank interest 185 93
Interest received on amounts held with brokers 14 16
Stock lending income 532 498
Stock dividends 266 1,226
Total revenue 35,569 38,804
4. Expenses31 August 2018
£’00031 August 2017
£’000Payable to the Authorised Corporate Director or associates of the Authorised Corporate Director and agents of either of them:Authorised Corporate Director's fee 2,210 2,270
Payable to the Depositary, associates of the Depositary and agents of either of them:
Depositary's fee 67 86
Safe custody fees 320 337
387 423
Other expenses:
Registrar's fees 25 17
Audit fee 8 13
FTSE® licence fee 142 147
Service charges 21 22
Printing & stationery fee 2 3
Professional fee 28 133
Legal fee 1 2
227 337
Total expenses 2,824 3,030

Royal London Equity Funds ICVC212
5. Taxationa) Analysis of charge for the year
31 August 2018£’000
31 August 2017£’000
Irrecoverable overseas tax 1,901 2,043
Current tax charge for the year 1,901 2,043
b) Factors affecting the current tax charge for the year The tax assessed for the year is lower (31/08/17: lower) than the standard rate of corporation tax in the UK for an Open Ended Investment Company (20%).
The differences are explained below:
Net revenue before taxation 32,735 35,772
Corporation tax at 20% (31/08/17: 20%) 6,547 7,154
Effects of:
Revenue not subject to taxation (6,548) (7,209)
Current year expenses not utilised 30 91
Irrecoverable overseas tax 1,901 2,043
Tax relief on overseas tax suffered (29) (36)
Current tax charge for the year 1,901 2,043
Authorised Open Ended Investment Companies are exempt from UK tax on capital gains, therefore any capital gains/(losses) are not included in the reconciliation above.
c) Provision for deferred taxThere was no provision required for deferred tax at the balance sheet date (31/08/17: same).
d) Factors that may affect future tax chargesAt the year end, there is a potential deferred tax asset of £3,212,000 (31/08/17: £3,182,000) in relation to surplus management expenses. It is unlikely the Fund will generate sufficient taxable profits in the future to utilise these expenses and therefore no deferred tax asset has been recognised in the year.
6. DistributionsThe distributions take account of income received on the issue of shares and income deducted on the cancellation of shares and comprise:
31 August 2018 £’000
31 August 2017 £’000
Accumulation shares
Interim 11,761 10,843
Final 16,131 19,921
27,892 30,764
Add: Amounts deducted on cancellation of shares 4,952 3,313
Deduct: Amounts received on the creation of shares (2,223) (1,451)
Net distributions for the year 30,621 32,626
The difference between the net revenue after taxation and the distribution paid is as follows:
Net revenue after taxation 30,834 33,729
Stock dividend charged to capital (266) (1,226)
Tax relief on stock dividends charged to capital 53 123
Net distributions for the year 30,621 32,626
Details of the distribution per share are set out on page 217.
Royal London Asia Pacific ex Japan Tracker Fund
NOTES TO THE FINANCIAL STATEMENTS (CONTINUED)FOR THE YEAR ENDED 31 AUGUST 2018

Royal London Equity Funds ICVC 213
Royal London Asia Pacific ex Japan Tracker Fund
NOTES TO THE FINANCIAL STATEMENTS (CONTINUED)FOR THE YEAR ENDED 31 AUGUST 2018
7. Debtors31 August 2018
£’00031 August 2017
£’000Amounts receivable on creation of shares 225 28,549
Sales awaiting settlement 63 –
Accrued revenue 3,734 4,628
Withholding tax recoverable – 106
Total debtors 4,022 33,283
8. Cash and bank balances31 August 2018
£’00031 August 2017
£’000Cash and bank balances 29,025 37,737
Amounts held at futures clearing houses and brokers 7,820 7,844
Total cash and bank balances 36,845 45,581
9. Other creditors31 August 2018
£’00031 August 2017
£’000Accrued expenses 400 306
Overseas tax payable on stock dividends 78 108
Total other creditors 478 414
10. Reconciliation of number of sharesClass Z
AccumulationOpening shares at 01/09/17 200,823,822
Shares issued 90,129,752
Shares cancelled (142,065,571)
Closing shares at 31/08/18 148,888,003
All classes within the Fund have the same rights on winding up.
11. Contingent liabilities and outstanding commitmentsThere were no contingent liabilities or outstanding commitments at the balance sheet date (31/08/17: same).
12. Related party transactionsThe Fund’s Authorised Corporate Director, Royal London Unit Trust Managers Limited, is a related party to the Fund as defined by Financial Reporting Standard 102 ‘Related Party Disclosures’.
Authorised Corporate Director fees charged by Royal London Unit Trust Managers Limited are shown in note 4 and details of shares created and cancelled by Royal London Unit Trust Managers Limited are shown in the Statement of Change in Net Assets Attributable to Shareholders and note 6. At the year end the balance due to Royal London Unit Trust Managers Limited in respect of these transactions was £74,485 (31/08/17: £28,360,487).
At the year end, 31 August 2018, 96.08% (31/08/17: 96.07%) of the shares in issue were held by The Royal London Mutual Insurance Society Limited. Royal London Unit Trust Managers Limited is a wholly owned subsidiary of The Royal London Mutual Insurance Society Limited.

Royal London Equity Funds ICVC214
13. Stock lending activitiesThe Fund carried out stock lending activities for the purpose of efficient portfolio management and in order to generate income. Revenue earned from these activities is shown in note 3 and is net of bank and agents fees amounting to £133,000 (Gross: £665,000) (31/08/17: £125,000 (Gross: £623,000)) payable to HSBC Bank plc.
The value of stock on loan at the balance sheet date was £90,745,000 (31/08/17: £110,642,000).
The collateral held by asset type at the year end is stated below:
Asset class
31 August 2018 Collateral Held
£’000
31 August 2017 Collateral Held
£’000Equities 60,175 99,291
Bonds 39,830 18,042
The aggregate value of collateral held at the balance sheet date was £100,005,000 (31/08/17: £117,333,000). Collateral may be in the form of cash, UK gilts, certificates of deposit, treasury bills, sovereign debt, eurosterling bonds and equities; where the ACD approves the asset it will be held to reduce counterparty exposure. The value of the collateral held is greater than the value of the securities on loan and is monitored as part of the efficient portfolio management process.
The counterparties at the year end were BNP Paribas, Credit Suisse Dublin Branch, Credit Suisse Securities, Goldman Sachs International, HSBC Bank, JP Morgan Securities, Macquarie Bank, Morgan Stanley Securities, Natixis, Societe Generale, Bank of Nova Scotia and UBS AG.
14. Financial derivativesThe Fund has used financial derivatives for hedging and meeting investment objectives including risk reduction and implementation of investment policies.
The use of derivatives can create additional counterparty risks. Details of the policy adopted by the ACD for managing counterparty and other risks are set out in the Notes to the Financial Statements.
The types of derivatives held at the year end were index futures which are not classed as OTC derivatives.
Details of the individual contracts are shown on the portfolio statement on pages 201 to 207.
15. Risk disclosuresThe policies applied to the management of risk disclosures are set out on page 9.
The fair values of the Fund’s assets and liabilities are represented by the values shown in the balance sheet on page 210. There is no material difference between the value of the financial assets and liabilities, as shown in the balance sheet, and their fair value.
A significant proportion of the Fund’s assets are denominated in currencies other than sterling. The value of the Fund’s assets may be affected by currency movements.
Currency31 August 2018
£’00031 August 2017
£’000Sterling 1,973 1,643
Australian dollar 265,319 348,380
Euro – 15
Hong Kong dollar 133,327 177,266
Korean won 183,234 231,095
Malaysian ringgit 36,181 44,362
New Zealand dollar 8,978 11,947
Singapore dollar 44,917 62,834
Taiwanese dollar 142,966 185,942
Thai baht 41,932 47,288
US dollar 21,487 32,882
Total 880,314 1,143,654
If sterling to foreign currency exchange rates had increased by 10% as at the balance sheet date, the net asset value of the Fund would have decreased by £87,834,000 (31/08/17: £114,201,000) If sterling to foreign currency exchange rates had decreased by 10% as at the balance sheet date, the net asset value of the Fund would have increased by £87,834,000 (31/08/17: £114,201,000). These calculations assume all other variables remain constant.
If market prices had increased by 10% as at the balance sheet date, the net asset value of the Fund would have increased by £83,993,000 (31/08/17: £106,520,000). If market prices had decreased by 10% as at the balance sheet date, the net asset value of the Fund would have decreased by £83,993,000 (31/08/17: £106,520,000). These calculations assume all other variables remain constant.
The only interest bearing assets are cash balances of £29,025,000 (31/08/17: £37,737,000) which earn interest by reference to LIBOR or international equivalent.
Royal London Asia Pacific ex Japan Tracker Fund
NOTES TO THE FINANCIAL STATEMENTS (CONTINUED)FOR THE YEAR ENDED 31 AUGUST 2018
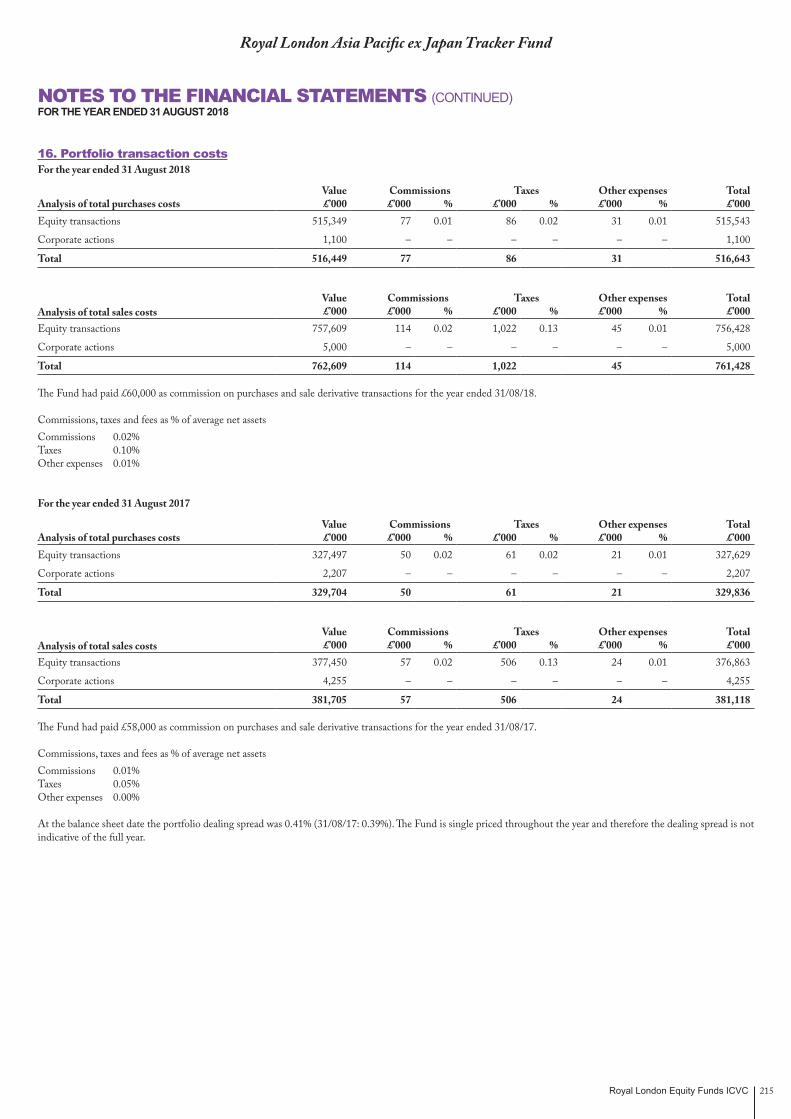
Royal London Equity Funds ICVC 215
Royal London Asia Pacific ex Japan Tracker Fund
NOTES TO THE FINANCIAL STATEMENTS (CONTINUED)FOR THE YEAR ENDED 31 AUGUST 2018
16. Portfolio transaction costsFor the year ended 31 August 2018
Value Commissions Taxes Other expenses TotalAnalysis of total purchases costs £’000 £’000 % £’000 % £’000 % £’000Equity transactions 515,349 77 0.01 86 0.02 31 0.01 515,543
Corporate actions 1,100 – – – – – – 1,100
Total 516,449 77 86 31 516,643
Value Commissions Taxes Other expenses TotalAnalysis of total sales costs £’000 £’000 % £’000 % £’000 % £’000Equity transactions 757,609 114 0.02 1,022 0.13 45 0.01 756,428
Corporate actions 5,000 – – – – – – 5,000
Total 762,609 114 1,022 45 761,428
The Fund had paid £60,000 as commission on purchases and sale derivative transactions for the year ended 31/08/18.
Commissions, taxes and fees as % of average net assetsCommissions 0.02%Taxes 0.10%Other expenses 0.01%
For the year ended 31 August 2017
Value Commissions Taxes Other expenses TotalAnalysis of total purchases costs £’000 £’000 % £’000 % £’000 % £’000Equity transactions 327,497 50 0.02 61 0.02 21 0.01 327,629
Corporate actions 2,207 – – – – – – 2,207
Total 329,704 50 61 21 329,836
Value Commissions Taxes Other expenses TotalAnalysis of total sales costs £’000 £’000 % £’000 % £’000 % £’000Equity transactions 377,450 57 0.02 506 0.13 24 0.01 376,863
Corporate actions 4,255 – – – – – – 4,255
Total 381,705 57 506 24 381,118
The Fund had paid £58,000 as commission on purchases and sale derivative transactions for the year ended 31/08/17.
Commissions, taxes and fees as % of average net assetsCommissions 0.01%Taxes 0.05%Other expenses 0.00%
At the balance sheet date the portfolio dealing spread was 0.41% (31/08/17: 0.39%). The Fund is single priced throughout the year and therefore the dealing spread is not indicative of the full year.
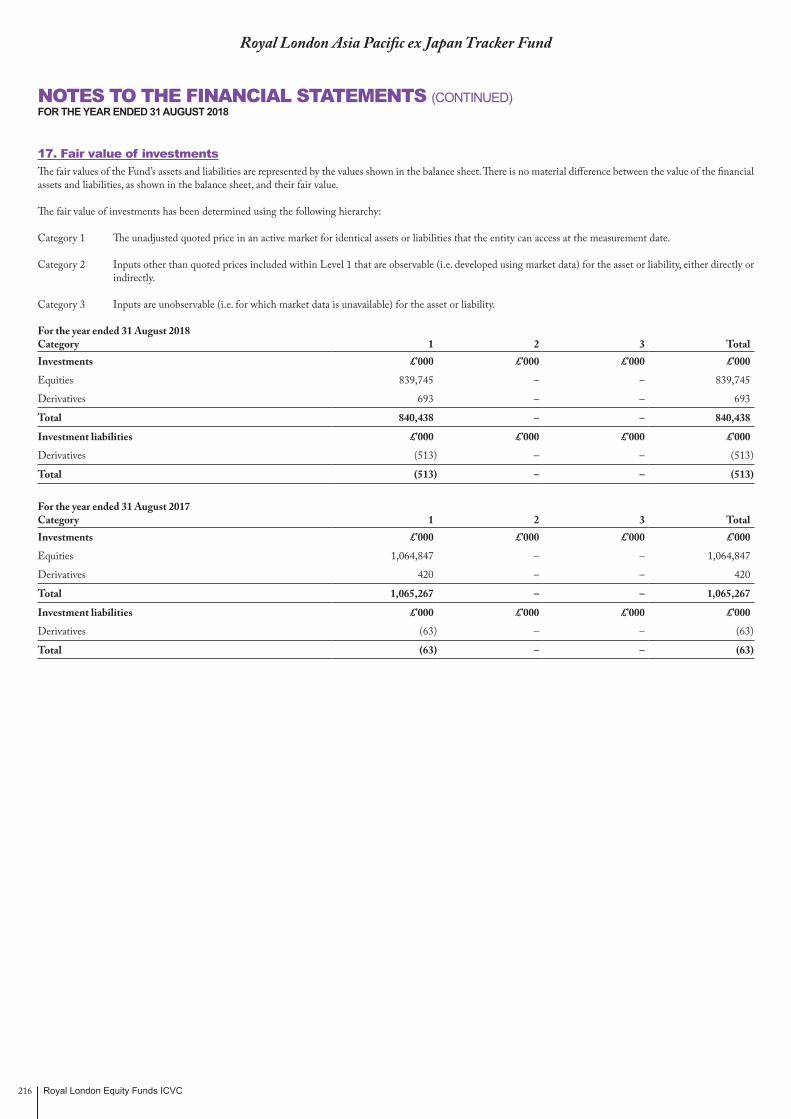
Royal London Equity Funds ICVC216
17. Fair value of investmentsThe fair values of the Fund’s assets and liabilities are represented by the values shown in the balance sheet. There is no material difference between the value of the financial assets and liabilities, as shown in the balance sheet, and their fair value.
The fair value of investments has been determined using the following hierarchy:
Category 1 The unadjusted quoted price in an active market for identical assets or liabilities that the entity can access at the measurement date.
Category 2 Inputs other than quoted prices included within Level 1 that are observable (i.e. developed using market data) for the asset or liability, either directly or indirectly.
Category 3 Inputs are unobservable (i.e. for which market data is unavailable) for the asset or liability.
For the year ended 31 August 2018 Category 1 2 3 TotalInvestments £’000 £’000 £’000 £’000
Equities 839,745 – – 839,745
Derivatives 693 – – 693
Total 840,438 – – 840,438
Investment liabilities £’000 £’000 £’000 £’000
Derivatives (513) – – (513)
Total (513) – – (513)
For the year ended 31 August 2017 Category 1 2 3 TotalInvestments £’000 £’000 £’000 £’000
Equities 1,064,847 – – 1,064,847
Derivatives 420 – – 420
Total 1,065,267 – – 1,065,267
Investment liabilities £’000 £’000 £’000 £’000
Derivatives (63) – – (63)
Total (63) – – (63)
Royal London Asia Pacific ex Japan Tracker Fund
NOTES TO THE FINANCIAL STATEMENTS (CONTINUED)FOR THE YEAR ENDED 31 AUGUST 2018
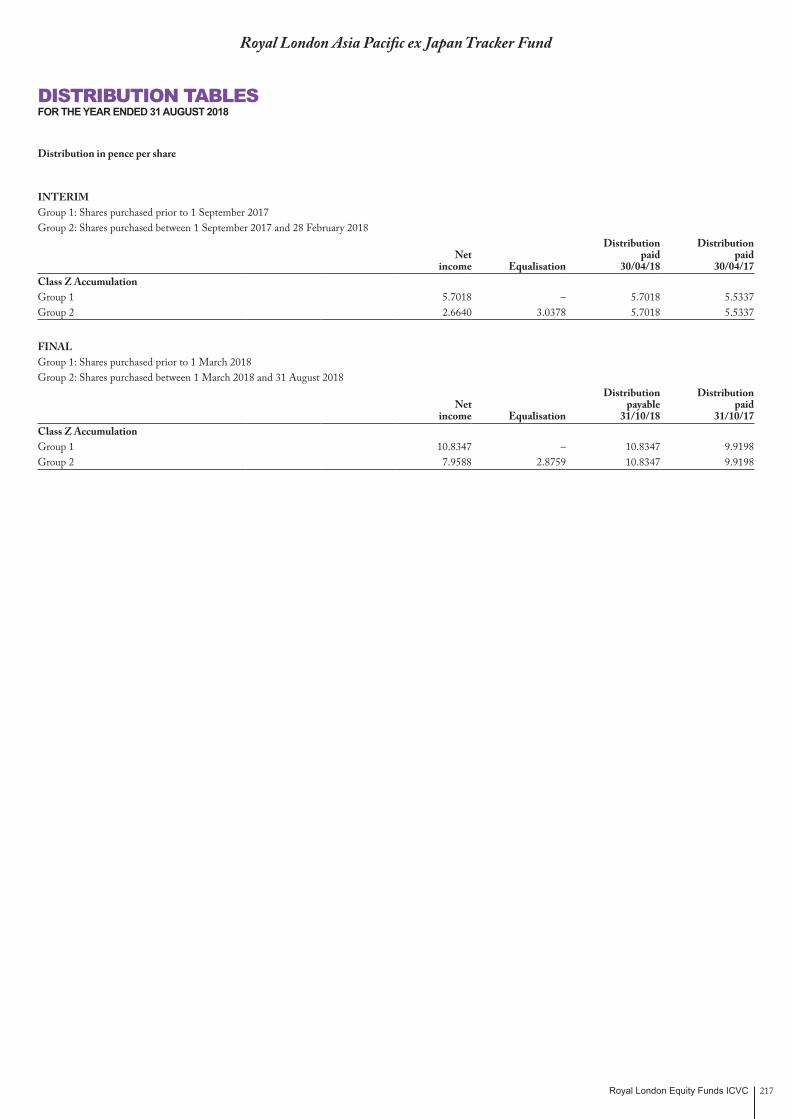
Royal London Equity Funds ICVC 217
Royal London Asia Pacific ex Japan Tracker Fund
DISTRIBUTION TABLESFOR THE YEAR ENDED 31 AUGUST 2018
Distribution in pence per share
INTERIMGroup 1: Shares purchased prior to 1 September 2017Group 2: Shares purchased between 1 September 2017 and 28 February 2018
Distribution DistributionNet paid paid
income Equalisation 30/04/18 30/04/17Class Z AccumulationGroup 1 5.7018 – 5.7018 5.5337Group 2 2.6640 3.0378 5.7018 5.5337
FINALGroup 1: Shares purchased prior to 1 March 2018Group 2: Shares purchased between 1 March 2018 and 31 August 2018
Distribution DistributionNet payable paid
income Equalisation 31/10/18 31/10/17Class Z AccumulationGroup 1 10.8347 – 10.8347 9.9198Group 2 7.9588 2.8759 10.8347 9.9198

Royal London Equity Funds ICVC218
Royal London Europe ex UK Tracker Fund
Fund Performance12 months to 31 August 2018
1 year return
%
3 year return
%
5 year return
%Royal London Europe ex UK Tracker Fund, Class Z Accumulation (Total return) 1.33 45.89 60.54
FTSE® World Europe ex UK Index (Capital return) -1.68 34.09 41.27
Past performance is not necessarily a reliable indicator of future performance. The value of investments and the income from them is not guaranteed and may go down as well as up, and investors may not get back the amount originally invested.
Source: RLAM and Lipper, as at 31 August 2018. Returns are net of management fees. Investors should note that the total return is calculated on the Fund’s official midday price whereas the Fund has been valued as at close of business for the Net Asset Value quoted within the Comparative Table. Please also note, the total return shown in the table is being compared against the official end of day price of the benchmark. The tracking error shown in the performance overview below is calculated using the unofficial end of day fund price to align with the official end of day benchmark price.
Performance OverviewInvestors should note that the Fund price is taken at noon each day, whilst the index performance is recorded at the close of business. Significant intra-day market movements at the start or end of the day may therefore distort comparisons. This and the charges associated with the Fund account for the majority of the difference between the performance of the Fund and the FTSE® World Europe ex UK Index.
The tracking error between the Royal London Europe ex UK Tracker Fund and the FTSE® World Europe ex UK Index was 0.22% during the period under review. This is within the anticipated tracking error range of 0.20% to 0.30%. We will always experience a small tracking difference between Fund and index for reasons including exchange rate risk on some dividends, trading costs and the use of index futures to manage cashflows.
Market and portfolio commentaryThe Fund aims to achieve the capital return of the FTSE® World Europe ex UK Index. However, perfect replication can result in unnecessary and costly trading which may outweigh the benefits. The Fund uses an optimiser to help construct a portfolio designed to track the performance of the benchmark without necessarily holding all the constituents in their exact benchmark weights. It generates efficient rebalancing and cashflow trades and allows flexibility not to trade every index or cashflow event. In practice, the Fund holds most of its benchmark’s names, as well as holding futures and cash.
JoJo ChenFund Manager31 August 2018Royal London Asset Management
The views expressed are the author’s own and do not constitute investment advice and are not an indication of future fund performance. Portfolio holdings are subject to change, for information only and are not investment recommendations.
Source: Royal London Asset Management, unless otherwise stated.
MANAGER’S INVESTMENT REPORT
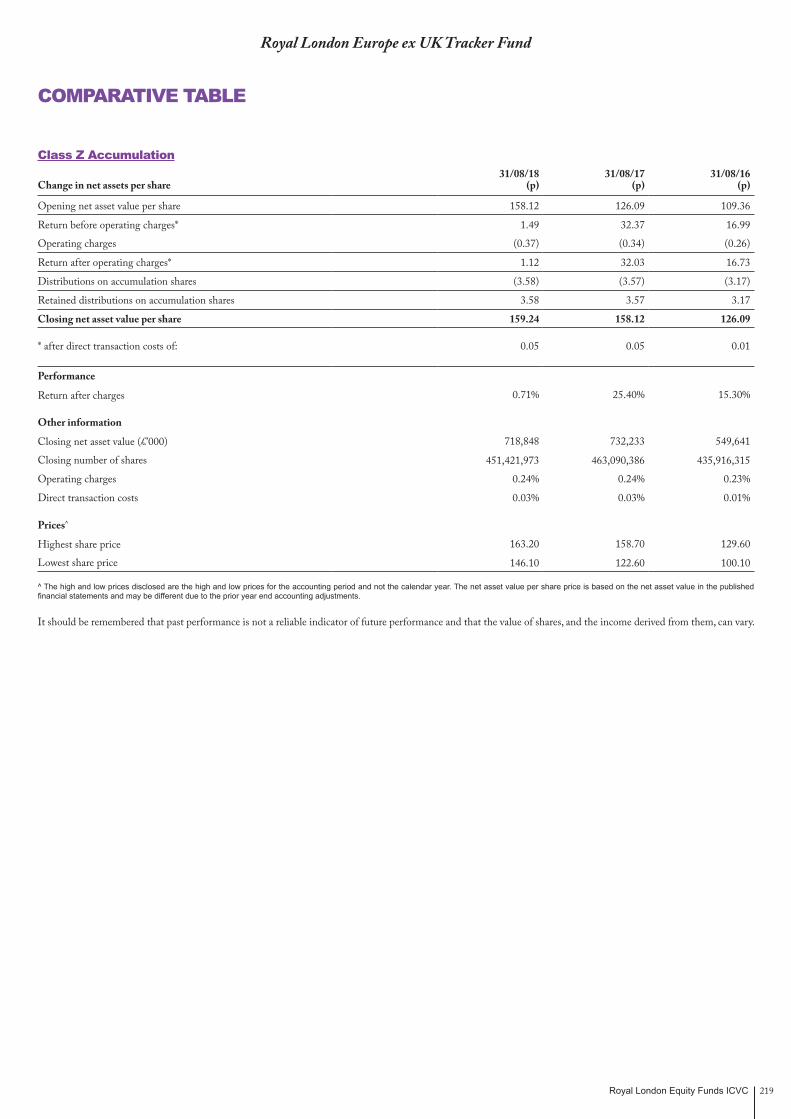
Royal London Equity Funds ICVC 219
Royal London Europe ex UK Tracker Fund
COMPARATIVE TABLE
Class Z Accumulation31/08/18 31/08/17 31/08/16
Change in net assets per share (p) (p) (p)
Opening net asset value per share 158.12 126.09 109.36
Return before operating charges* 1.49 32.37 16.99
Operating charges (0.37) (0.34) (0.26)
Return after operating charges* 1.12 32.03 16.73
Distributions on accumulation shares (3.58) (3.57) (3.17)
Retained distributions on accumulation shares 3.58 3.57 3.17
Closing net asset value per share 159.24 158.12 126.09
* after direct transaction costs of: 0.05 0.05 0.01
Performance
Return after charges 0.71% 25.40% 15.30%
Other information
Closing net asset value (£’000) 718,848 732,233 549,641
Closing number of shares 451,421,973 463,090,386 435,916,315
Operating charges 0.24% 0.24% 0.23%
Direct transaction costs 0.03% 0.03% 0.01%
Prices^
Highest share price 163.20 158.70 129.60
Lowest share price 146.10 122.60 100.10
^ The high and low prices disclosed are the high and low prices for the accounting period and not the calendar year. The net asset value per share price is based on the net asset value in the published financial statements and may be different due to the prior year end accounting adjustments.
It should be remembered that past performance is not a reliable indicator of future performance and that the value of shares, and the income derived from them, can vary.
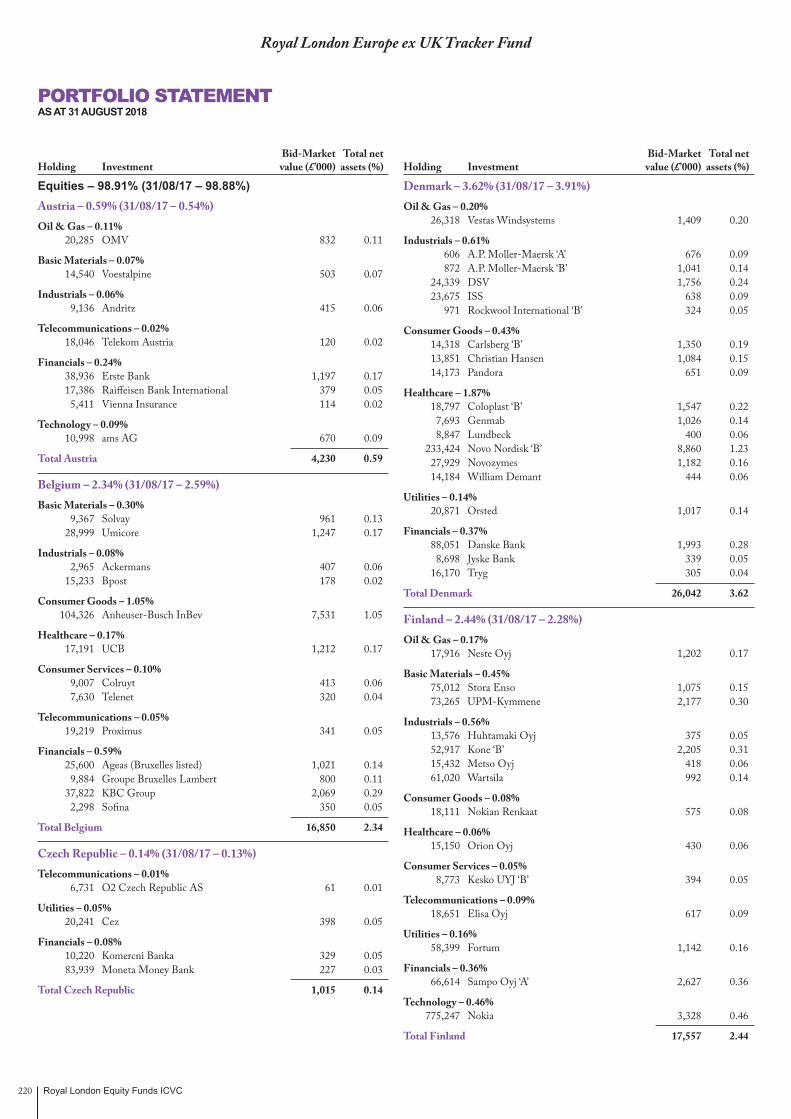
Royal London Equity Funds ICVC220
Royal London Europe ex UK Tracker Fund
Equities – 98.91% (31/08/17 – 98.88%) Austria – 0.59% (31/08/17 – 0.54%) Oil & Gas – 0.11% 20,285 OMV 832 0.11
Basic Materials – 0.07% 14,540 Voestalpine 503 0.07
Industrials – 0.06% 9,136 Andritz 415 0.06
Telecommunications – 0.02% 18,046 Telekom Austria 120 0.02
Financials – 0.24% 38,936 Erste Bank 1,197 0.17 17,386 Raiffeisen Bank International 379 0.05 5,411 Vienna Insurance 114 0.02
Technology – 0.09% 10,998 ams AG 670 0.09
Total Austria 4,230 0.59
Belgium – 2.34% (31/08/17 – 2.59%) Basic Materials – 0.30% 9,367 Solvay 961 0.13 28,999 Umicore 1,247 0.17
Industrials – 0.08% 2,965 Ackermans 407 0.06 15,233 Bpost 178 0.02
Consumer Goods – 1.05% 104,326 Anheuser-Busch InBev 7,531 1.05
Healthcare – 0.17% 17,191 UCB 1,212 0.17
Consumer Services – 0.10% 9,007 Colruyt 413 0.06 7,630 Telenet 320 0.04
Telecommunications – 0.05% 19,219 Proximus 341 0.05
Financials – 0.59% 25,600 Ageas (Bruxelles listed) 1,021 0.14 9,884 Groupe Bruxelles Lambert 800 0.11 37,822 KBC Group 2,069 0.29 2,298 Sofina 350 0.05
Total Belgium 16,850 2.34
Czech Republic – 0.14% (31/08/17 – 0.13%) Telecommunications – 0.01% 6,731 O2 Czech Republic AS 61 0.01
Utilities – 0.05% 20,241 Cez 398 0.05
Financials – 0.08% 10,220 Komercni Banka 329 0.05 83,939 Moneta Money Bank 227 0.03
Total Czech Republic 1,015 0.14
Denmark – 3.62% (31/08/17 – 3.91%) Oil & Gas – 0.20% 26,318 Vestas Windsystems 1,409 0.20
Industrials – 0.61% 606 A.P. Moller-Maersk ‘A’ 676 0.09 872 A.P. Moller-Maersk ‘B’ 1,041 0.14 24,339 DSV 1,756 0.24 23,675 ISS 638 0.09 971 Rockwool International ‘B’ 324 0.05
Consumer Goods – 0.43% 14,318 Carlsberg ‘B’ 1,350 0.19 13,851 Christian Hansen 1,084 0.15 14,173 Pandora 651 0.09
Healthcare – 1.87% 18,797 Coloplast ‘B’ 1,547 0.22 7,693 Genmab 1,026 0.14 8,847 Lundbeck 400 0.06 233,424 Novo Nordisk ‘B’ 8,860 1.23 27,929 Novozymes 1,182 0.16 14,184 William Demant 444 0.06
Utilities – 0.14% 20,871 Orsted 1,017 0.14
Financials – 0.37% 88,051 Danske Bank 1,993 0.28 8,698 Jyske Bank 339 0.05 16,170 Tryg 305 0.04
Total Denmark 26,042 3.62
Finland – 2.44% (31/08/17 – 2.28%) Oil & Gas – 0.17% 17,916 Neste Oyj 1,202 0.17
Basic Materials – 0.45% 75,012 Stora Enso 1,075 0.15 73,265 UPM-Kymmene 2,177 0.30
Industrials – 0.56% 13,576 Huhtamaki Oyj 375 0.05 52,917 Kone ‘B’ 2,205 0.31 15,432 Metso Oyj 418 0.06 61,020 Wartsila 992 0.14
Consumer Goods – 0.08% 18,111 Nokian Renkaat 575 0.08
Healthcare – 0.06% 15,150 Orion Oyj 430 0.06
Consumer Services – 0.05% 8,773 Kesko UYJ ‘B’ 394 0.05
Telecommunications – 0.09% 18,651 Elisa Oyj 617 0.09
Utilities – 0.16% 58,399 Fortum 1,142 0.16
Financials – 0.36% 66,614 Sampo Oyj ‘A’ 2,627 0.36
Technology – 0.46% 775,247 Nokia 3,328 0.46
Total Finland 17,557 2.44
PORTFOLIO STATEMENTAS AT 31 AUGUST 2018
Bid-Market Total net Holding Investment value (£’000) assets (%)
Bid-Market Total net Holding Investment value (£’000) assets (%)

Royal London Equity Funds ICVC 221
Royal London Europe ex UK Tracker Fund
France – 21.47% (31/08/17 – 20.21%) Oil & Gas – 2.29% 341,483 Total 16,467 2.29
Basic Materials – 0.94% 56,934 Air Liquide 5,530 0.77 9,537 Arkema 920 0.13 5,107 Imerys 283 0.04
Industrials – 3.70% 4,012 ADP Promesses 680 0.10 21,624 Alstom 735 0.10 117,610 Bollore 434 0.06 28,560 Bouygues 972 0.14 33,185 Bureau Veritas 657 0.09 343 Dassault Aviation 492 0.07 32,305 Edenred 949 0.13 10,456 Eiffage 907 0.13 25,228 Elis 451 0.06 61,550 Groupe Eurotunnel 598 0.08 36,163 Legrand 2,100 0.29 44,949 Rexel 545 0.08 43,351 Safran 4,356 0.61 65,843 Saint Gobain 2,185 0.30 69,782 Schneider Electric 4,388 0.61 13,311 Thales 1,445 0.20 63,214 Vinci 4,672 0.65
Consumer Goods – 4.72% 3,633 BIC 259 0.04 80,044 Danone 4,858 0.68 9,450 Faurecia 446 0.06 4,198 Hermes International 2,105 0.29 32,661 L’Oreal 6,037 0.84 33,608 LVMH 9,081 1.26 23,915 Michelin 2,183 0.30 28,577 Pernod-Ricard 3,475 0.48 72,911 Peugeot 1,546 0.22 8,386 Plastic Omnium 256 0.04 3,677 Remy Cointreau 397 0.06 24,696 Renault 1,640 0.23 3,633 SEB 522 0.07 31,716 Valeo 1,110 0.15
Healthcare – 2.17% 6,306 BioMérieux 427 0.06 28,082 Essilor International 3,123 0.44 1,450 Eurofins Scientific 631 0.09 4,766 Ipsen Promesses 653 0.09 6,254 Orpea 652 0.09 147,476 Sanofi 9,728 1.35 3,683 Sartorius Stedim Biotech 360 0.05
Consumer Services – 1.81% 27,131 Accor 1,046 0.15 32,661 Air France-KLM 242 0.03 11,778 ALD 168 0.02 73,260 Carrefour 1,008 0.14 8,443 Casino Guichard-Perrachon 206 0.03 14,142 Elior Participations 171 0.02 22,888 Eutelsat Communications 418 0.06 11,162 JC Decaux 284 0.04 10,058 Kering 4,214 0.59 17,080 Lagardere 388 0.05
France – 21.47% (31/08/17 – 20.21%) – continued Consumer Services – 1.81% – continued 27,909 Publicis Group 1,381 0.19 11,977 Sodexo 962 0.13 130,632 Vivendi 2,614 0.36
Telecommunications – 0.46% 262,272 Orange 3,274 0.46
Utilities – 0.77% 66,335 Electricite de France 838 0.12 223,788 Engie 2,530 0.35 11,626 Rubis 530 0.07 48,322 Suez Environnement 539 0.08 66,353 Veolia Environnement 1,078 0.15
Financials – 3.43% 7,166 Amundi 398 0.06 260,230 AXA 5,066 0.71 146,414 BNP Paribas 6,629 0.92 21,234 CNP Assurances 376 0.05 151,815 Credit Agricole 1,602 0.22 6,120 Eurazeo 358 0.05 4,756 Fonciere des Regions 383 0.05 7,248 Gecina 959 0.13 4,904 Icade EMGP 369 0.05 26,343 Klepierre 728 0.10 117,119 Natixis Banques Populaires 603 0.08 22,693 Scor Regroupe 709 0.10 100,391 Societe Generale 3,166 0.44 17,992 Unibail-Rodamco 2,915 0.41 3,762 Wendel 429 0.06
Technology – 1.18% 12,248 Atos 1,131 0.16 20,933 Cap Gemini 2,074 0.29 17,457 Dassault Systemes 2,180 0.30 3,171 Iliad 316 0.04 8,487 Ingenico 459 0.06 7,585 Teleperformance 1,123 0.16 11,298 UBI Soft Entertainment 937 0.13 5,465 Worldline 256 0.04
Futures – 0.00% 34 EOP CAC40 10 Euro Future
September 2018 30 –
Total France 154,342 21.47
Germany – 20.23% (31/08/17 – 19.76%) Basic Materials – 4.03% 123,690 BASF 8,808 1.23 126,478 Bayer 9,116 1.27 22,102 Brenntag 1,031 0.14 25,276 Covestro 1,658 0.23 19,795 Evonik Industries 568 0.08 4,066 Fuchs Petrolub 168 0.02 10,121 Fuchs Petrolub Preference 457 0.06 28,441 K+S 499 0.07 12,900 Lanxess 782 0.11 25,405 Linde 4,463 0.62 16,988 Symrise 1,224 0.17 2,218 Wacker Chemie 246 0.03
PORTFOLIO STATEMENT (CONTINUED)AS AT 31 AUGUST 2018
Bid-Market Total net Holding Investment value (£’000) assets (%)
Bid-Market Total net Holding Investment value (£’000) assets (%)
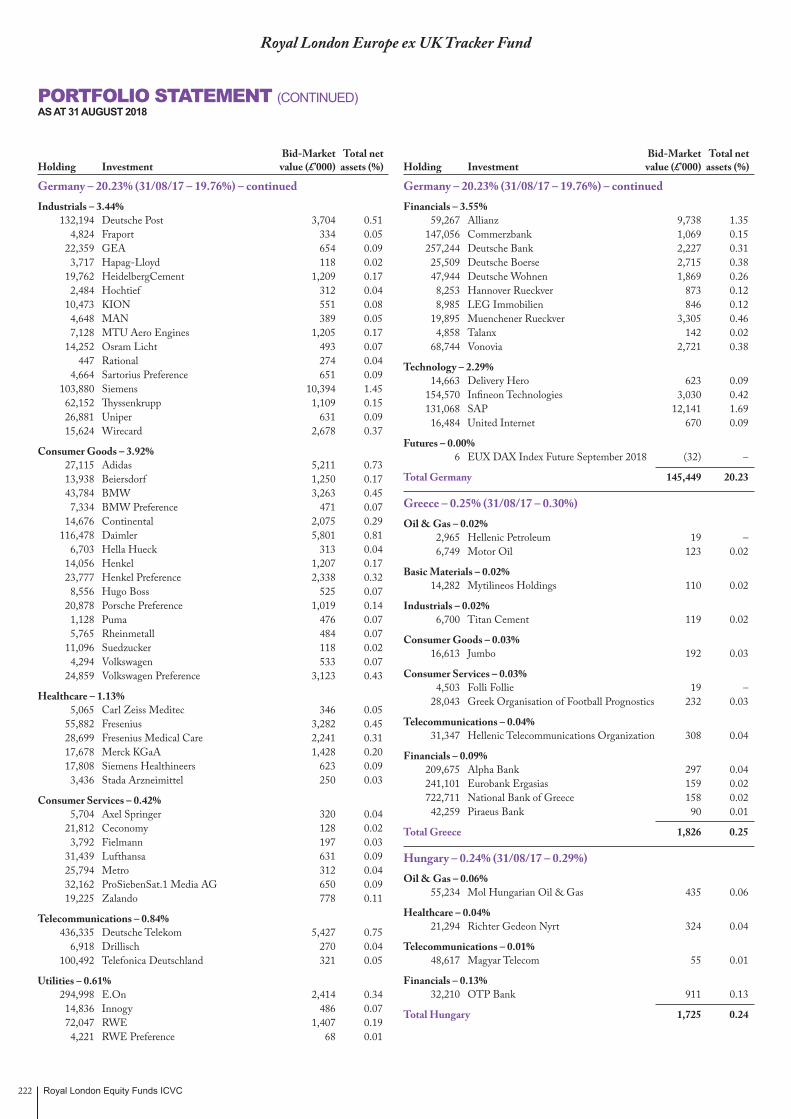
Royal London Equity Funds ICVC222
Royal London Europe ex UK Tracker Fund
Germany – 20.23% (31/08/17 – 19.76%) – continued Industrials – 3.44% 132,194 Deutsche Post 3,704 0.51 4,824 Fraport 334 0.05 22,359 GEA 654 0.09 3,717 Hapag-Lloyd 118 0.02 19,762 HeidelbergCement 1,209 0.17 2,484 Hochtief 312 0.04 10,473 KION 551 0.08 4,648 MAN 389 0.05 7,128 MTU Aero Engines 1,205 0.17 14,252 Osram Licht 493 0.07 447 Rational 274 0.04 4,664 Sartorius Preference 651 0.09 103,880 Siemens 10,394 1.45 62,152 Thyssenkrupp 1,109 0.15 26,881 Uniper 631 0.09 15,624 Wirecard 2,678 0.37
Consumer Goods – 3.92% 27,115 Adidas 5,211 0.73 13,938 Beiersdorf 1,250 0.17 43,784 BMW 3,263 0.45 7,334 BMW Preference 471 0.07 14,676 Continental 2,075 0.29 116,478 Daimler 5,801 0.81 6,703 Hella Hueck 313 0.04 14,056 Henkel 1,207 0.17 23,777 Henkel Preference 2,338 0.32 8,556 Hugo Boss 525 0.07 20,878 Porsche Preference 1,019 0.14 1,128 Puma 476 0.07 5,765 Rheinmetall 484 0.07 11,096 Suedzucker 118 0.02 4,294 Volkswagen 533 0.07 24,859 Volkswagen Preference 3,123 0.43
Healthcare – 1.13% 5,065 Carl Zeiss Meditec 346 0.05 55,882 Fresenius 3,282 0.45 28,699 Fresenius Medical Care 2,241 0.31 17,678 Merck KGaA 1,428 0.20 17,808 Siemens Healthineers 623 0.09 3,436 Stada Arzneimittel 250 0.03
Consumer Services – 0.42% 5,704 Axel Springer 320 0.04 21,812 Ceconomy 128 0.02 3,792 Fielmann 197 0.03 31,439 Lufthansa 631 0.09 25,794 Metro 312 0.04 32,162 ProSiebenSat.1 Media AG 650 0.09 19,225 Zalando 778 0.11
Telecommunications – 0.84% 436,335 Deutsche Telekom 5,427 0.75 6,918 Drillisch 270 0.04 100,492 Telefonica Deutschland 321 0.05
Utilities – 0.61% 294,998 E.On 2,414 0.34 14,836 Innogy 486 0.07 72,047 RWE 1,407 0.19 4,221 RWE Preference 68 0.01
Germany – 20.23% (31/08/17 – 19.76%) – continued Financials – 3.55% 59,267 Allianz 9,738 1.35 147,056 Commerzbank 1,069 0.15 257,244 Deutsche Bank 2,227 0.31 25,509 Deutsche Boerse 2,715 0.38 47,944 Deutsche Wohnen 1,869 0.26 8,253 Hannover Rueckver 873 0.12 8,985 LEG Immobilien 846 0.12 19,895 Muenchener Rueckver 3,305 0.46 4,858 Talanx 142 0.02 68,744 Vonovia 2,721 0.38
Technology – 2.29% 14,663 Delivery Hero 623 0.09 154,570 Infineon Technologies 3,030 0.42 131,068 SAP 12,141 1.69 16,484 United Internet 670 0.09
Futures – 0.00% 6 EUX DAX Index Future September 2018 (32) –
Total Germany 145,449 20.23
Greece – 0.25% (31/08/17 – 0.30%) Oil & Gas – 0.02% 2,965 Hellenic Petroleum 19 – 6,749 Motor Oil 123 0.02
Basic Materials – 0.02% 14,282 Mytilineos Holdings 110 0.02
Industrials – 0.02% 6,700 Titan Cement 119 0.02
Consumer Goods – 0.03% 16,613 Jumbo 192 0.03
Consumer Services – 0.03% 4,503 Folli Follie 19 – 28,043 Greek Organisation of Football Prognostics 232 0.03
Telecommunications – 0.04% 31,347 Hellenic Telecommunications Organization 308 0.04
Financials – 0.09% 209,675 Alpha Bank 297 0.04 241,101 Eurobank Ergasias 159 0.02 722,711 National Bank of Greece 158 0.02 42,259 Piraeus Bank 90 0.01
Total Greece 1,826 0.25
Hungary – 0.24% (31/08/17 – 0.29%) Oil & Gas – 0.06% 55,234 Mol Hungarian Oil & Gas 435 0.06
Healthcare – 0.04% 21,294 Richter Gedeon Nyrt 324 0.04
Telecommunications – 0.01% 48,617 Magyar Telecom 55 0.01
Financials – 0.13% 32,210 OTP Bank 911 0.13
Total Hungary 1,725 0.24
PORTFOLIO STATEMENT (CONTINUED)AS AT 31 AUGUST 2018
Bid-Market Total net Holding Investment value (£’000) assets (%)
Bid-Market Total net Holding Investment value (£’000) assets (%)

Royal London Equity Funds ICVC 223
Royal London Europe ex UK Tracker Fund
Ireland – 0.58% (31/08/17 – 0.55%) Industrials – 0.11% 20,429 Kingspan Group 768 0.11
Consumer Goods – 0.29% 29,547 Glanbia 387 0.05 19,705 Kerry ‘A’ (London listed) 1,727 0.24
Financials – 0.18% 101,001 AIB Group 436 0.06 131,178 Bank of Ireland 833 0.12
Total Ireland 4,151 0.58
Italy – 4.53% (31/08/17 – 4.89%) Oil & Gas – 0.73% 343,629 ENI 4,915 0.68 84,503 Saipem 348 0.05
Industrials – 0.35% 71,418 Atlantia 1,148 0.16 9,689 Buzzi Unicem 150 0.02 4,734 Buzzi Unicem DI RISP 42 0.01 56,534 Finmeccanica 488 0.07 34,776 Prysmian 692 0.09
Consumer Goods – 0.66% 75,625 Davide Campari 516 0.07 149,620 Fiat Chrysler 1,950 0.27 20,683 Luxottica 1,058 0.15 21,206 Moncler 739 0.10 24,669 Parmalat 62 0.01 49,421 Pirelli 307 0.04 5,703 Salvatore Ferragamo 105 0.02
Healthcare – 0.04% 11,718 Recordati 316 0.04
Consumer Services – 0.02% 46,930 Mediaset 108 0.02
Telecommunications – 0.15% 1,449,685 Telecom Italia 712 0.10 894,315 Telecom Italia RNC 383 0.05
Utilities – 0.89% 196,059 A2A 260 0.04 1,062,426 Enel 4,050 0.56 72,247 Italgas 301 0.04 304,704 Snam 964 0.14 196,672 Terna 796 0.11
Financials – 1.69% 33,532 Banca Mediolanum 175 0.02 142,353 Banche Popolari Unite 404 0.06 219,790 Banco BPM 382 0.05 58,084 Finecobank Banco Fineco 533 0.07 103,120 Fondiaria-Sai 178 0.03 177,561 Generali 2,279 0.32 2,002,092 Intesa Sanpaolo 3,812 0.53 85,163 Mediobanca 611 0.08 57,919 Poste Italiane 344 0.05 307,997 UniCredit 3,428 0.48
Futures – 0.00% 3 MIL FTSE®/MIB Index Future
September 2018 (18) –
Total Italy 32,538 4.53
Luxembourg – 0.53% (31/08/17 – 0.51%) Basic Materials – 0.37% 80,571 ArcelorMittal 1,869 0.26 63,814 Tenaris 823 0.11
Consumer Services – 0.15% 5,703 RTL 330 0.05 48,000 SES Global 742 0.10
Telecommunications – 0.01% 14,950 PLAY Communications 67 0.01
Total Luxembourg 3,831 0.53
Netherlands – 8.85% (31/08/17 – 8.02%) Basic Materials – 0.64% 34,013 Akzo Nobel 2,451 0.34 23,464 Koninklijke DSM 1,898 0.26 12,764 OCI 317 0.04
Industrials – 2.05% 13,632 Aalberts Industries 451 0.06 74,676 Airbus 7,103 0.99 11,946 Boskalis Westminster 264 0.04 135,206 CNH Industrial 1,246 0.17 124,053 Koninklijke Philips 4,273 0.59 15,994 Signify 347 0.05 14,379 Randstad 695 0.10 9,578 Vopak 380 0.05
Consumer Goods – 1.98% 17,173 Ferrari 1,732 0.24 32,113 Heineken 2,446 0.34 14,189 Heineken Holdings 1,040 0.15 203,006 Unilever 9,004 1.25
Healthcare – 0.13% 30,142 Qiagen NMBC 901 0.13
Consumer Services – 1.00% 997 AmRest Holdings 85 0.01 5,884 GrandVision 111 0.02 166,021 Koninklijke Ahold 3,114 0.43 116,805 Relx 1,993 0.28 37,471 Wolters Kluwer 1,831 0.26
Telecommunications – 0.14% 73,908 Altice Europe ‘A’ 171 0.02 3,190 Altice Europe ‘B’ 7 – 436,599 KPN Koninklijke 860 0.12
Financials – 1.47% 57,277 ABN AMRO 1,196 0.17 238,058 Aegon 1,100 0.15 18,297 ASR Nederland 673 0.09 14,120 Exor 708 0.10 519,000 ING Groep certificates 5,430 0.76 44,200 NN 1,461 0.20
Technology – 1.44% 54,428 ASML Holding 8,558 1.19 9,121 Gemalto 407 0.06 84,714 STMicroelectronics 1,342 0.19
Futures – 0.00% 14 EOE Amsterdam Index Future September 2018 8 –
Total Netherlands 63,603 8.85
PORTFOLIO STATEMENT (CONTINUED)AS AT 31 AUGUST 2018
Bid-Market Total net Holding Investment value (£’000) assets (%)
Bid-Market Total net Holding Investment value (£’000) assets (%)

Royal London Equity Funds ICVC224
Royal London Europe ex UK Tracker Fund
Norway – 1.52% (31/08/17 – 1.39%) Oil & Gas – 0.43% 14,569 Aker BP 398 0.06 135,194 Equinor 2,675 0.37
Basic Materials – 0.23% 189,946 Norsk Hydro 809 0.11 24,368 Yara International 865 0.12
Consumer Goods – 0.23% 57,786 Marine Harvest 963 0.13 111,139 Orkla 706 0.10
Consumer Services – 0.08% 10,713 Schibsted 296 0.04 12,870 Schibsted ‘B’ 323 0.04
Telecommunications – 0.19% 93,200 Telenor 1,356 0.19
Financials – 0.36% 146,781 Den Norske Bank 2,306 0.32 20,399 Gjensidige Forsikring 263 0.04
Total Norway 10,960 1.52
Poland – 0.98% (31/08/17 – 1.01%) Oil & Gas – 0.19% 12,036 Grupa Lotos 176 0.02 242,411 Polish Oil & Gas 294 0.04 44,386 Polski Koncern Naftowy Orlen 912 0.13
Basic Materials – 0.09% 3,413 Ciech 37 0.01 6,134 Grupa Azoty 49 0.01 6,311 Jastzebska Spolka Weglowa 102 0.01 21,148 KGHM 401 0.06
Industrials – 0.00% 1,178 Budimex 28 –
Consumer Goods – 0.08% 8,074 Dino Polska 154 0.02 222 LPP 430 0.06
Consumer Services – 0.04% 3,011 CCC 136 0.02 22,623 Cyfrowy Polsat 106 0.01 10,432 Eurocash 44 0.01
Telecommunications – 0.01% 85,919 Orange Polska 87 0.01
Utilities – 0.05% 27,636 ENEA 49 0.01 116,028 Polska Grupa Energetyczna 218 0.03 142,764 Tauron Polska Energia 59 0.01
Financials – 0.45% 12,255 Alior Bank 174 0.02 3,105 Bank Handlowy W Warszawie 44 0.01 81,295 Bank Millennium 153 0.02 22,535 Bank Pekao 550 0.08 3,476 Bank Zachodni 272 0.04 2,328 KRUK 100 0.01 1,771 mBank 152 0.02 122,559 PKO Bank Polski 1,081 0.15 80,536 PZU 751 0.10
PORTFOLIO STATEMENT (CONTINUED)AS AT 31 AUGUST 2018
Bid-Market Total net Holding Investment value (£’000) assets (%)
Bid-Market Total net Holding Investment value (£’000) assets (%)
Poland – 0.98% (31/08/17 – 1.01%) – continued Technology – 0.07% 7,594 Asseco Poland 73 0.01 9,554 CD Projekt 411 0.06
Total Poland 7,043 0.98
Portugal – 0.35% (31/08/17– 0.33%) Oil & Gas – 0.15% 68,992 Galp Energia SGPS 1,075 0.15
Consumer Services – 0.06% 37,365 Jeronimo Martins 431 0.06
Utilities – 0.14% 324,092 Electricidad de Portugal 976 0.14
Financials – 0.00% 371,192 Banco Espirtio Santo~ – –
Total Portugal 2,482 0.35
Spain – 6.34% (31/08/17 – 7.31%) Oil & Gas – 0.39% 32,586 Gamesa 375 0.05 162,985 Repsol 2,417 0.34
Basic Materials – 0.03% 22,116 Acerinox 229 0.03
Industrials – 0.52% 3,396 Acciona 230 0.03 33,148 Actividades de Construccion y Servicios 1,064 0.15 8,899 Aena 1,214 0.17 64,052 Ferrovial SA 1,068 0.15 26,016 Zardoya OTIS 187 0.02
Healthcare – 0.22% 44,585 Grifols ‘A’ 1,011 0.14 36,853 Grifols ‘B’ 604 0.08
Consumer Services – 0.49% 54,783 Distribuidora Internacional De Alimentacion 100 0.01 141,249 Inditex 3,294 0.46 24,136 Mediaset Espana Comunicacion 136 0.02
Telecommunications – 0.59% 19,998 Cellnex Telecom 396 0.06 608,747 Telefonica 3,807 0.53
Utilities – 1.13% 21,846 EDP Renovaveis 167 0.02 29,430 Enagas 631 0.09 41,984 Endesa 724 0.10 40,988 Naturgy Energy 849 0.12 833,518 Iberdrola 4,792 0.67 56,962 Red Electrica de Espana 923 0.13
Financials – 2.41% 787,139 Banco de Sabadell 932 0.13 2,144,457 Banco Santander 8,228 1.15 158,150 Bankia 458 0.06 95,447 Bankinter 655 0.09 895,518 BBVA 4,305 0.60 483,615 CaixaBank 1,671 0.23 7,090 Catalana Occidente 229 0.03 2,039 Corporacion Financiaera Alba 89 0.01 142,988 Corporacion Mapfre 325 0.05 42,304 Merlin Properties REIT 455 0.06
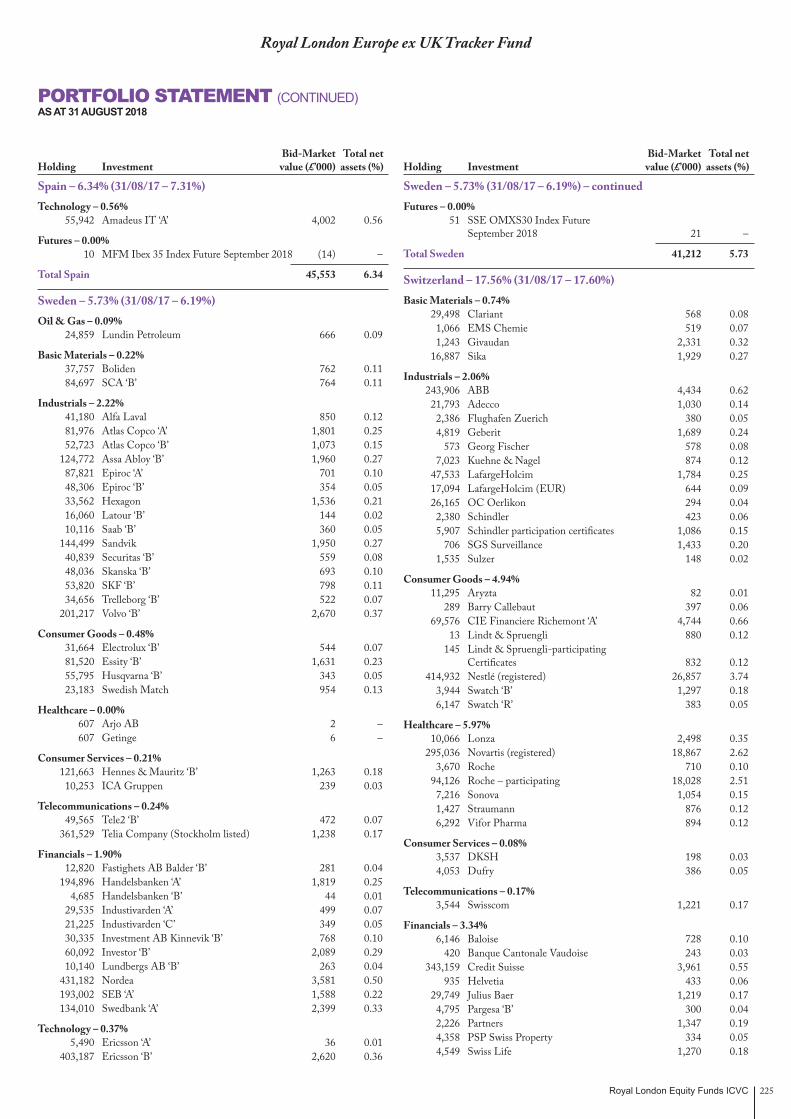
Royal London Equity Funds ICVC 225
Royal London Europe ex UK Tracker Fund
Spain – 6.34% (31/08/17 – 7.31%) Technology – 0.56% 55,942 Amadeus IT ‘A’ 4,002 0.56
Futures – 0.00% 10 MFM Ibex 35 Index Future September 2018 (14) –
Total Spain 45,553 6.34
Sweden – 5.73% (31/08/17 – 6.19%) Oil & Gas – 0.09% 24,859 Lundin Petroleum 666 0.09
Basic Materials – 0.22% 37,757 Boliden 762 0.11 84,697 SCA ‘B’ 764 0.11
Industrials – 2.22% 41,180 Alfa Laval 850 0.12 81,976 Atlas Copco ‘A’ 1,801 0.25 52,723 Atlas Copco ‘B’ 1,073 0.15 124,772 Assa Abloy ‘B’ 1,960 0.27 87,821 Epiroc ‘A’ 701 0.10 48,306 Epiroc ‘B’ 354 0.05 33,562 Hexagon 1,536 0.21 16,060 Latour ‘B’ 144 0.02 10,116 Saab ‘B’ 360 0.05 144,499 Sandvik 1,950 0.27 40,839 Securitas ‘B’ 559 0.08 48,036 Skanska ‘B’ 693 0.10 53,820 SKF ‘B’ 798 0.11 34,656 Trelleborg ‘B’ 522 0.07 201,217 Volvo ‘B’ 2,670 0.37
Consumer Goods – 0.48% 31,664 Electrolux ‘B’ 544 0.07 81,520 Essity ‘B’ 1,631 0.23 55,795 Husqvarna ‘B’ 343 0.05 23,183 Swedish Match 954 0.13
Healthcare – 0.00% 607 Arjo AB 2 – 607 Getinge 6 –
Consumer Services – 0.21% 121,663 Hennes & Mauritz ‘B’ 1,263 0.18 10,253 ICA Gruppen 239 0.03
Telecommunications – 0.24% 49,565 Tele2 ‘B’ 472 0.07 361,529 Telia Company (Stockholm listed) 1,238 0.17
Financials – 1.90% 12,820 Fastighets AB Balder ‘B’ 281 0.04 194,896 Handelsbanken ‘A’ 1,819 0.25 4,685 Handelsbanken ‘B’ 44 0.01 29,535 Industivarden ‘A’ 499 0.07 21,225 Industivarden ‘C’ 349 0.05 30,335 Investment AB Kinnevik ‘B’ 768 0.10 60,092 Investor ‘B’ 2,089 0.29 10,140 Lundbergs AB ‘B’ 263 0.04 431,182 Nordea 3,581 0.50 193,002 SEB ‘A’ 1,588 0.22 134,010 Swedbank ‘A’ 2,399 0.33
Technology – 0.37% 5,490 Ericsson ‘A’ 36 0.01 403,187 Ericsson ‘B’ 2,620 0.36
Sweden – 5.73% (31/08/17 – 6.19%) – continued Futures – 0.00% 51 SSE OMXS30 Index Future
September 2018 21 –
Total Sweden 41,212 5.73
Switzerland – 17.56% (31/08/17 – 17.60%) Basic Materials – 0.74% 29,498 Clariant 568 0.08 1,066 EMS Chemie 519 0.07 1,243 Givaudan 2,331 0.32 16,887 Sika 1,929 0.27
Industrials – 2.06% 243,906 ABB 4,434 0.62 21,793 Adecco 1,030 0.14 2,386 Flughafen Zuerich 380 0.05 4,819 Geberit 1,689 0.24 573 Georg Fischer 578 0.08 7,023 Kuehne & Nagel 874 0.12 47,533 LafargeHolcim 1,784 0.25 17,094 LafargeHolcim (EUR) 644 0.09 26,165 OC Oerlikon 294 0.04 2,380 Schindler 423 0.06 5,907 Schindler participation certificates 1,086 0.15 706 SGS Surveillance 1,433 0.20 1,535 Sulzer 148 0.02
Consumer Goods – 4.94% 11,295 Aryzta 82 0.01 289 Barry Callebaut 397 0.06 69,576 CIE Financiere Richemont ‘A’ 4,744 0.66 13 Lindt & Spruengli 880 0.12 145 Lindt & Spruengli-participating
Certificates 832 0.12 414,932 Nestlé (registered) 26,857 3.74 3,944 Swatch ‘B’ 1,297 0.18 6,147 Swatch ‘R’ 383 0.05
Healthcare – 5.97% 10,066 Lonza 2,498 0.35 295,036 Novartis (registered) 18,867 2.62 3,670 Roche 710 0.10 94,126 Roche – participating 18,028 2.51 7,216 Sonova 1,054 0.15 1,427 Straumann 876 0.12 6,292 Vifor Pharma 894 0.12
Consumer Services – 0.08% 3,537 DKSH 198 0.03 4,053 Dufry 386 0.05
Telecommunications – 0.17% 3,544 Swisscom 1,221 0.17
Financials – 3.34% 6,146 Baloise 728 0.10 420 Banque Cantonale Vaudoise 243 0.03 343,159 Credit Suisse 3,961 0.55 935 Helvetia 433 0.06 29,749 Julius Baer 1,219 0.17 4,795 Pargesa ‘B’ 300 0.04 2,226 Partners 1,347 0.19 4,358 PSP Swiss Property 334 0.05 4,549 Swiss Life 1,270 0.18
PORTFOLIO STATEMENT (CONTINUED)AS AT 31 AUGUST 2018
Bid-Market Total net Holding Investment value (£’000) assets (%)
Bid-Market Total net Holding Investment value (£’000) assets (%)
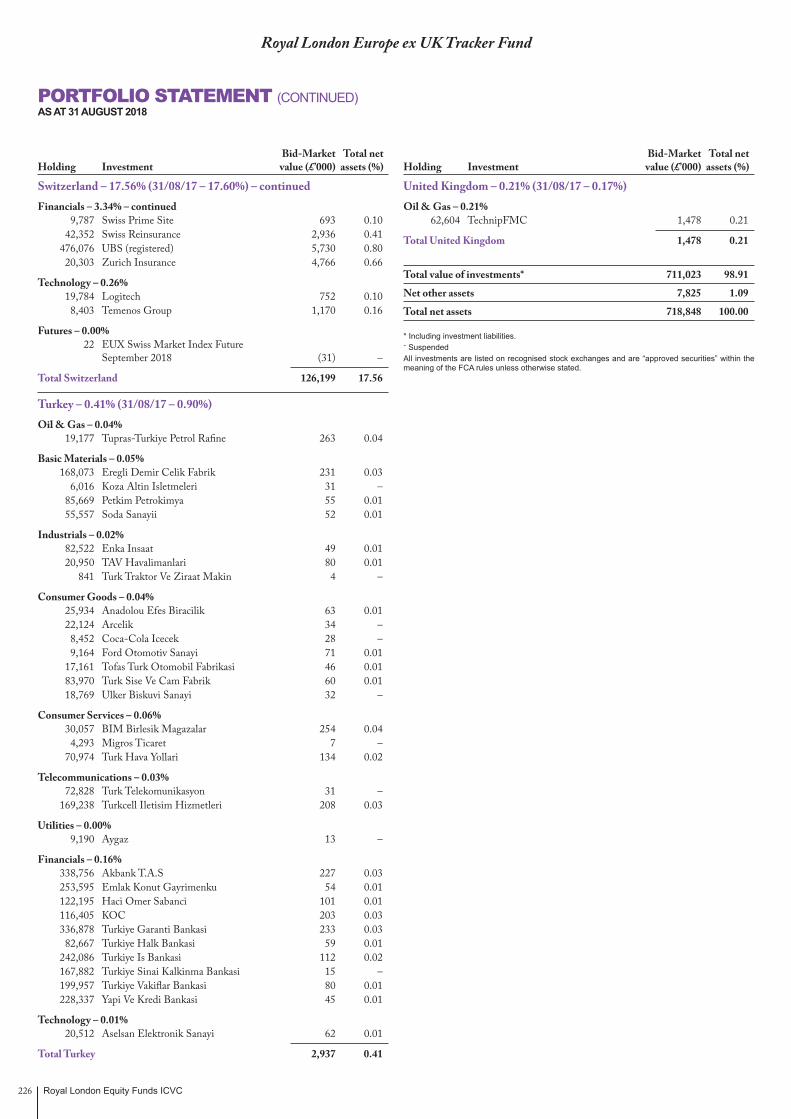
Royal London Equity Funds ICVC226
Royal London Europe ex UK Tracker Fund
PORTFOLIO STATEMENT (CONTINUED)AS AT 31 AUGUST 2018
Bid-Market Total net Holding Investment value (£’000) assets (%)
Bid-Market Total net Holding Investment value (£’000) assets (%)
Switzerland – 17.56% (31/08/17 – 17.60%) – continued Financials – 3.34% – continued 9,787 Swiss Prime Site 693 0.10 42,352 Swiss Reinsurance 2,936 0.41 476,076 UBS (registered) 5,730 0.80 20,303 Zurich Insurance 4,766 0.66
Technology – 0.26% 19,784 Logitech 752 0.10 8,403 Temenos Group 1,170 0.16
Futures – 0.00% 22 EUX Swiss Market Index Future
September 2018 (31) –
Total Switzerland 126,199 17.56
Turkey – 0.41% (31/08/17 – 0.90%) Oil & Gas – 0.04% 19,177 Tupras-Turkiye Petrol Rafine 263 0.04
Basic Materials – 0.05% 168,073 Eregli Demir Celik Fabrik 231 0.03 6,016 Koza Altin Isletmeleri 31 – 85,669 Petkim Petrokimya 55 0.01 55,557 Soda Sanayii 52 0.01
Industrials – 0.02% 82,522 Enka Insaat 49 0.01 20,950 TAV Havalimanlari 80 0.01 841 Turk Traktor Ve Ziraat Makin 4 –
Consumer Goods – 0.04% 25,934 Anadolou Efes Biracilik 63 0.01 22,124 Arcelik 34 – 8,452 Coca-Cola Icecek 28 – 9,164 Ford Otomotiv Sanayi 71 0.01 17,161 Tofas Turk Otomobil Fabrikasi 46 0.01 83,970 Turk Sise Ve Cam Fabrik 60 0.01 18,769 Ulker Biskuvi Sanayi 32 –
Consumer Services – 0.06% 30,057 BIM Birlesik Magazalar 254 0.04 4,293 Migros Ticaret 7 – 70,974 Turk Hava Yollari 134 0.02
Telecommunications – 0.03% 72,828 Turk Telekomunikasyon 31 – 169,238 Turkcell Iletisim Hizmetleri 208 0.03
Utilities – 0.00% 9,190 Aygaz 13 –
Financials – 0.16% 338,756 Akbank T.A.S 227 0.03 253,595 Emlak Konut Gayrimenku 54 0.01 122,195 Haci Omer Sabanci 101 0.01 116,405 KOC 203 0.03 336,878 Turkiye Garanti Bankasi 233 0.03 82,667 Turkiye Halk Bankasi 59 0.01 242,086 Turkiye Is Bankasi 112 0.02 167,882 Turkiye Sinai Kalkinma Bankasi 15 – 199,957 Turkiye Vakiflar Bankasi 80 0.01 228,337 Yapi Ve Kredi Bankasi 45 0.01
Technology – 0.01% 20,512 Aselsan Elektronik Sanayi 62 0.01
Total Turkey 2,937 0.41
United Kingdom – 0.21% (31/08/17 – 0.17%) Oil & Gas – 0.21% 62,604 TechnipFMC 1,478 0.21
Total United Kingdom 1,478 0.21
Total value of investments* 711,023 98.91
Net other assets 7,825 1.09
Total net assets 718,848 100.00
* Including investment liabilities.~ SuspendedAll investments are listed on recognised stock exchanges and are “approved securities” within the meaning of the FCA rules unless otherwise stated.

Royal London Equity Funds ICVC 227
Royal London Europe ex UK Tracker Fund
SUMMARY OF MATERIAL PORTFOLIO CHANGESFOR THE YEAR ENDED 31 AUGUST 2018
Significant Purchases
Cost £’000
Nestlé (registered) 7,361
Total 5,967
Novartis (registered) 5,355
Roche – participating 4,845
Bayer 4,394
SAP 3,865
ASML Holding 3,856
Siemens 3,246
Banco Santander 3,161
Allianz 3,061
Subtotal 45,111
Total cost of purchases, including the above, for the year 239,283
Significant Sales
Proceeds £’000
Nestlé (registered) 8,545
Novartis (registered) 7,539
Roche – participating 5,565
Total 3,952
Allianz 3,623
Bayer 3,506
Siemens 3,408
Banco Santander 3,407
Novo Nordisk ‘B’ 3,379
Daimler 3,320
Subtotal 46,244
Total proceeds from sales, including the above, for the year 238,923
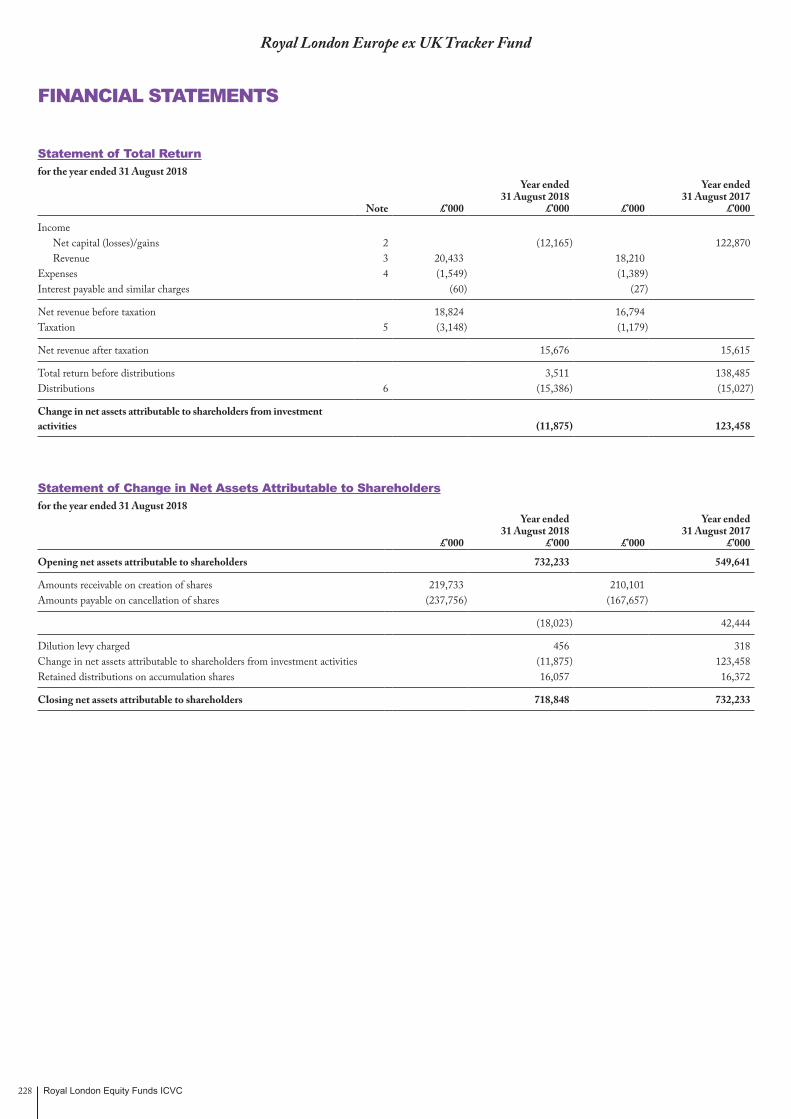
Royal London Equity Funds ICVC228
Royal London Europe ex UK Tracker Fund
FINANCIAL STATEMENTS
Statement of Total Returnfor the year ended 31 August 2018
Note £’000
Year ended31 August 2018
£’000 £’000
Year ended31 August 2017
£’000
Income Net capital (losses)/gains 2 (12,165) 122,870 Revenue 3 20,433 18,210
Expenses 4 (1,549) (1,389)Interest payable and similar charges (60) (27)
Net revenue before taxation 18,824 16,794 Taxation 5 (3,148) (1,179)
Net revenue after taxation 15,676 15,615
Total return before distributions 3,511 138,485 Distributions 6 (15,386) (15,027)
Change in net assets attributable to shareholders from investment activities (11,875) 123,458
Statement of Change in Net Assets Attributable to Shareholdersfor the year ended 31 August 2018
£’000
Year ended31 August 2018
£’000 £’000
Year ended31 August 2017
£’000
Opening net assets attributable to shareholders 732,233 549,641
Amounts receivable on creation of shares 219,733 210,101 Amounts payable on cancellation of shares (237,756) (167,657)
(18,023) 42,444
Dilution levy charged 456 318 Change in net assets attributable to shareholders from investment activities (11,875) 123,458 Retained distributions on accumulation shares 16,057 16,372
Closing net assets attributable to shareholders 718,848 732,233
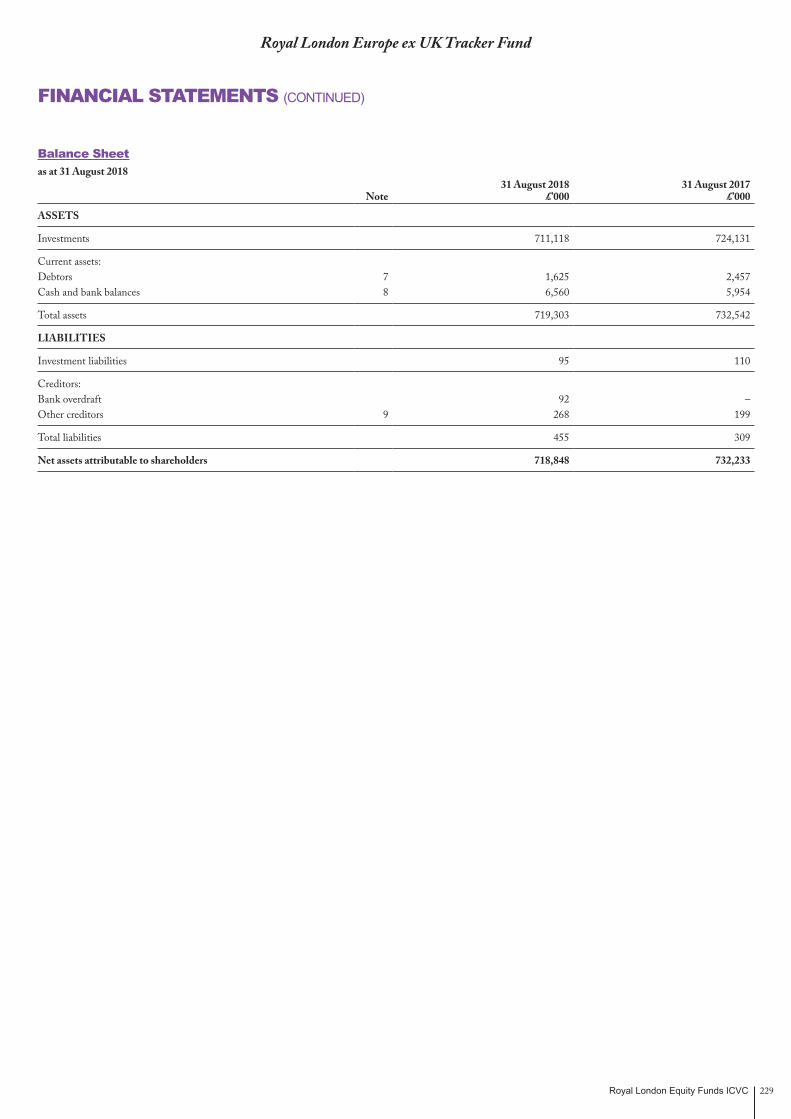
Royal London Equity Funds ICVC 229
Royal London Europe ex UK Tracker Fund
FINANCIAL STATEMENTS (CONTINUED)
Balance Sheetas at 31 August 2018
Note31 August 2018
£’00031 August 2017
£’000
ASSETS
Investments 711,118 724,131
Current assets:Debtors 7 1,625 2,457 Cash and bank balances 8 6,560 5,954
Total assets 719,303 732,542
LIABILITIES
Investment liabilities 95 110
Creditors:Bank overdraft 92 –Other creditors 9 268 199
Total liabilities 455 309
Net assets attributable to shareholders 718,848 732,233
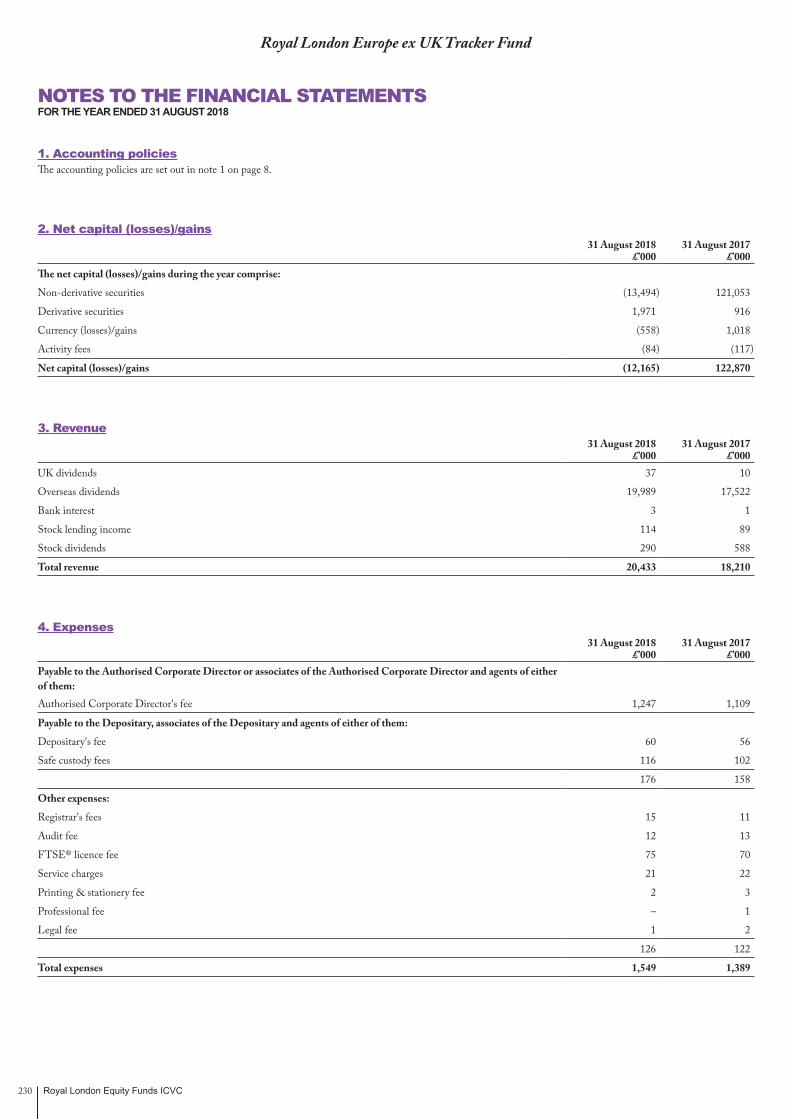
Royal London Equity Funds ICVC230
Royal London Europe ex UK Tracker Fund
NOTES TO THE FINANCIAL STATEMENTSFOR THE YEAR ENDED 31 AUGUST 2018
1. Accounting policiesThe accounting policies are set out in note 1 on page 8.
2. Net capital (losses)/gains31 August 2018
£’00031 August 2017
£’000The net capital (losses)/gains during the year comprise:
Non-derivative securities (13,494) 121,053
Derivative securities 1,971 916
Currency (losses)/gains (558) 1,018
Activity fees (84) (117)
Net capital (losses)/gains (12,165) 122,870
3. Revenue31 August 2018
£’00031 August 2017
£’000UK dividends 37 10
Overseas dividends 19,989 17,522
Bank interest 3 1
Stock lending income 114 89
Stock dividends 290 588
Total revenue 20,433 18,210
4. Expenses31 August 2018
£’00031 August 2017
£’000Payable to the Authorised Corporate Director or associates of the Authorised Corporate Director and agents of either of them:Authorised Corporate Director's fee 1,247 1,109
Payable to the Depositary, associates of the Depositary and agents of either of them:
Depositary's fee 60 56
Safe custody fees 116 102
176 158
Other expenses:
Registrar's fees 15 11
Audit fee 12 13
FTSE® licence fee 75 70
Service charges 21 22
Printing & stationery fee 2 3
Professional fee – 1
Legal fee 1 2
126 122
Total expenses 1,549 1,389
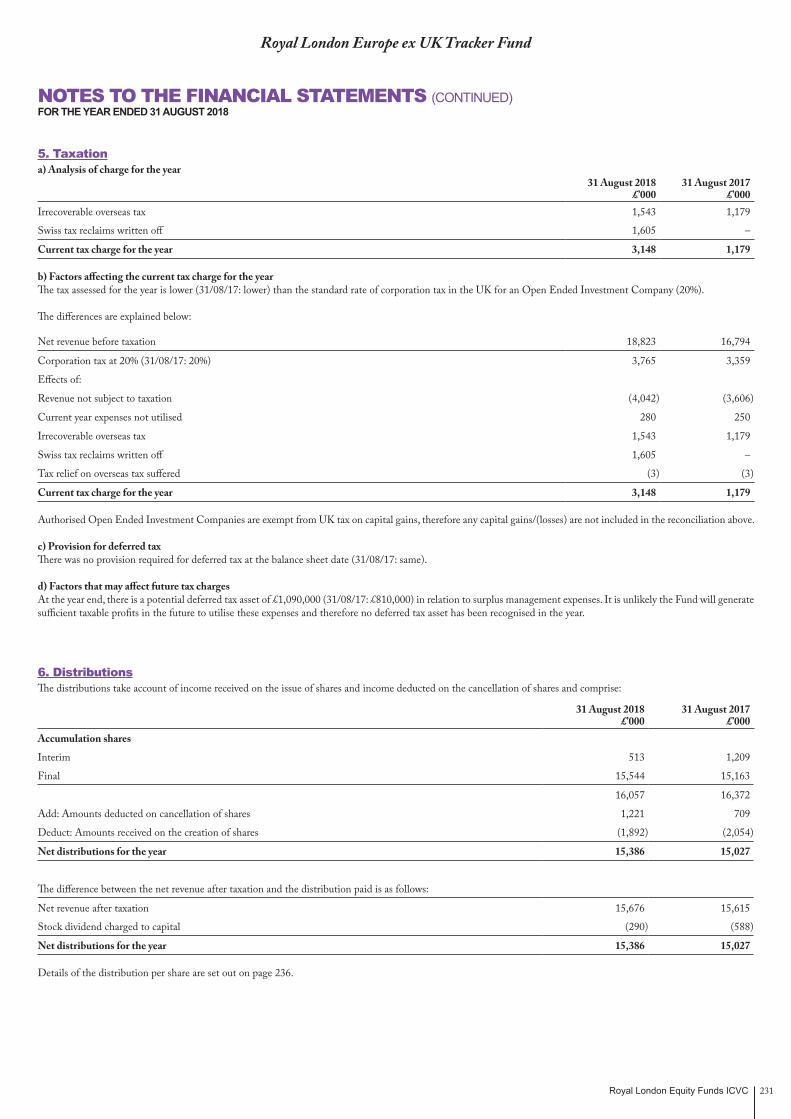
Royal London Equity Funds ICVC 231
5. Taxationa) Analysis of charge for the year
31 August 2018£’000
31 August 2017£’000
Irrecoverable overseas tax 1,543 1,179
Swiss tax reclaims written off 1,605 –
Current tax charge for the year 3,148 1,179
b) Factors affecting the current tax charge for the year The tax assessed for the year is lower (31/08/17: lower) than the standard rate of corporation tax in the UK for an Open Ended Investment Company (20%).
The differences are explained below:
Net revenue before taxation 18,823 16,794
Corporation tax at 20% (31/08/17: 20%) 3,765 3,359
Effects of:
Revenue not subject to taxation (4,042) (3,606)
Current year expenses not utilised 280 250
Irrecoverable overseas tax 1,543 1,179
Swiss tax reclaims written off 1,605 –
Tax relief on overseas tax suffered (3) (3)
Current tax charge for the year 3,148 1,179
Authorised Open Ended Investment Companies are exempt from UK tax on capital gains, therefore any capital gains/(losses) are not included in the reconciliation above.
c) Provision for deferred taxThere was no provision required for deferred tax at the balance sheet date (31/08/17: same).
d) Factors that may affect future tax chargesAt the year end, there is a potential deferred tax asset of £1,090,000 (31/08/17: £810,000) in relation to surplus management expenses. It is unlikely the Fund will generate sufficient taxable profits in the future to utilise these expenses and therefore no deferred tax asset has been recognised in the year.
6. DistributionsThe distributions take account of income received on the issue of shares and income deducted on the cancellation of shares and comprise:
31 August 2018 £’000
31 August 2017 £’000
Accumulation shares
Interim 513 1,209
Final 15,544 15,163
16,057 16,372
Add: Amounts deducted on cancellation of shares 1,221 709
Deduct: Amounts received on the creation of shares (1,892) (2,054)
Net distributions for the year 15,386 15,027
The difference between the net revenue after taxation and the distribution paid is as follows:
Net revenue after taxation 15,676 15,615
Stock dividend charged to capital (290) (588)
Net distributions for the year 15,386 15,027
Details of the distribution per share are set out on page 236.
Royal London Europe ex UK Tracker Fund
NOTES TO THE FINANCIAL STATEMENTS (CONTINUED)FOR THE YEAR ENDED 31 AUGUST 2018

Royal London Equity Funds ICVC232
Royal London Europe ex UK Tracker Fund
NOTES TO THE FINANCIAL STATEMENTS (CONTINUED)FOR THE YEAR ENDED 31 AUGUST 2018
7. Debtors31 August 2018
£’00031 August 2017
£’000Amounts receivable on creation of shares 382 30
Accrued revenue 206 191
Withholding tax recoverable 1,037 2,236
Total debtors 1,625 2,457
8. Cash and bank balances31 August 2018
£’00031 August 2017
£’000Cash and bank balances 5,900 5,177
Amounts held at futures clearing houses and brokers 660 777
Total cash and bank balances 6,560 5,954
9. Other creditors31 August 2018
£’00031 August 2017
£’000Accrued expenses 251 182
Corporation tax payable 17 17
Total other creditors 268 199
10. Reconciliation of number of sharesClass Z
AccumulationOpening shares at 01/09/17 463,090,386
Shares issued 141,183,919
Shares cancelled (152,852,332)
Closing shares at 31/08/18 451,421,973
All classes within the Fund have the same rights on winding up.
11. Contingent liabilities and outstanding commitmentsThere were no contingent liabilities or outstanding commitments at the balance sheet date (31/08/17: same).
12. Related party transactionsThe Fund’s Authorised Corporate Director, Royal London Unit Trust Managers Limited, is a related party to the Fund as defined by Financial Reporting Standard 102 ‘Related Party Disclosures’.
Authorised Corporate Director fees charged by Royal London Unit Trust Managers Limited are shown in note 4 and details of shares created and cancelled by Royal London Unit Trust Managers Limited are shown in the Statement of Change in Net Assets Attributable to Shareholders and note 6. At the year end the balance due from/to Royal London Unit Trust Managers Limited in respect of these transactions was £271,000 (31/08/17: £83,000).
At the year end, 31 August 2018, 97.52% (31/08/17: 97.91%) of the shares in issue were held by The Royal London Mutual Insurance Society Limited. Royal London Unit Trust Managers Limited is a wholly owned subsidiary of The Royal London Mutual Insurance Society Limited.
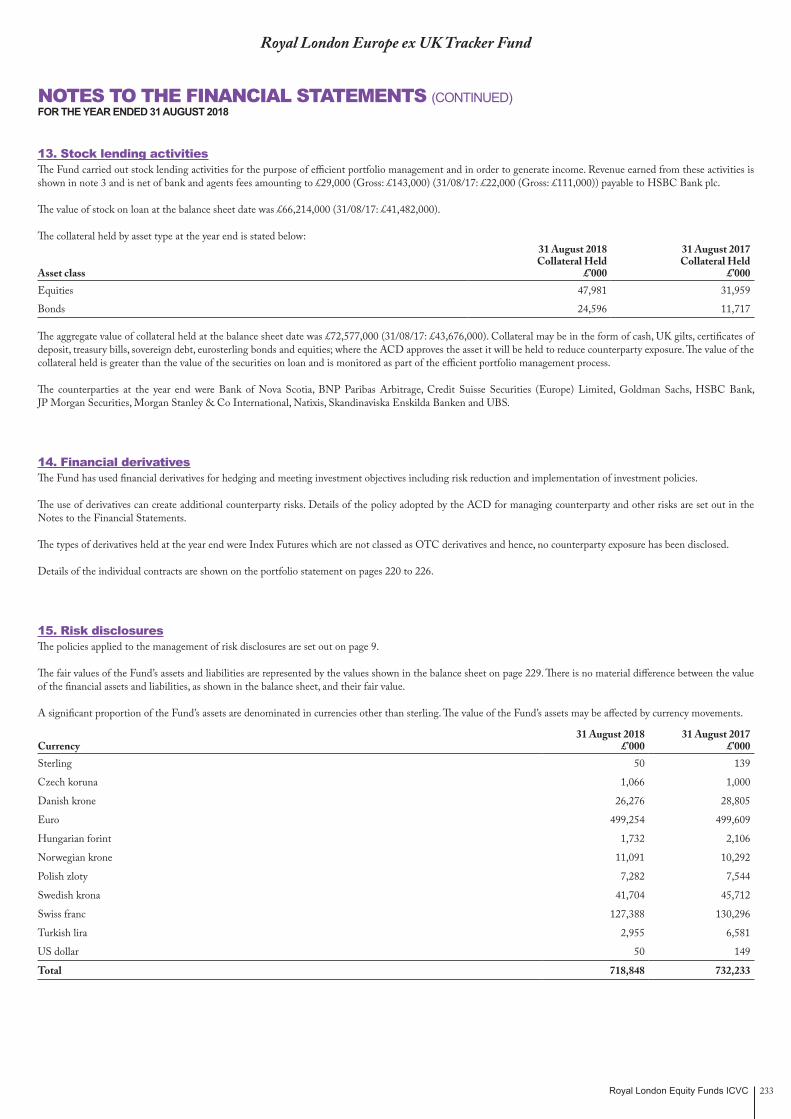
Royal London Equity Funds ICVC 233
13. Stock lending activitiesThe Fund carried out stock lending activities for the purpose of efficient portfolio management and in order to generate income. Revenue earned from these activities is shown in note 3 and is net of bank and agents fees amounting to £29,000 (Gross: £143,000) (31/08/17: £22,000 (Gross: £111,000)) payable to HSBC Bank plc.
The value of stock on loan at the balance sheet date was £66,214,000 (31/08/17: £41,482,000).
The collateral held by asset type at the year end is stated below:
Asset class
31 August 2018 Collateral Held
£’000
31 August 2017 Collateral Held
£’000Equities 47,981 31,959
Bonds 24,596 11,717
The aggregate value of collateral held at the balance sheet date was £72,577,000 (31/08/17: £43,676,000). Collateral may be in the form of cash, UK gilts, certificates of deposit, treasury bills, sovereign debt, eurosterling bonds and equities; where the ACD approves the asset it will be held to reduce counterparty exposure. The value of the collateral held is greater than the value of the securities on loan and is monitored as part of the efficient portfolio management process.
The counterparties at the year end were Bank of Nova Scotia, BNP Paribas Arbitrage, Credit Suisse Securities (Europe) Limited, Goldman Sachs, HSBC Bank, JP Morgan Securities, Morgan Stanley & Co International, Natixis, Skandinaviska Enskilda Banken and UBS.
14. Financial derivativesThe Fund has used financial derivatives for hedging and meeting investment objectives including risk reduction and implementation of investment policies.
The use of derivatives can create additional counterparty risks. Details of the policy adopted by the ACD for managing counterparty and other risks are set out in the Notes to the Financial Statements.
The types of derivatives held at the year end were Index Futures which are not classed as OTC derivatives and hence, no counterparty exposure has been disclosed.
Details of the individual contracts are shown on the portfolio statement on pages 220 to 226.
15. Risk disclosuresThe policies applied to the management of risk disclosures are set out on page 9.
The fair values of the Fund’s assets and liabilities are represented by the values shown in the balance sheet on page 229. There is no material difference between the value of the financial assets and liabilities, as shown in the balance sheet, and their fair value.
A significant proportion of the Fund’s assets are denominated in currencies other than sterling. The value of the Fund’s assets may be affected by currency movements.
Currency31 August 2018
£’00031 August 2017
£’000Sterling 50 139
Czech koruna 1,066 1,000
Danish krone 26,276 28,805
Euro 499,254 499,609
Hungarian forint 1,732 2,106
Norwegian krone 11,091 10,292
Polish zloty 7,282 7,544
Swedish krona 41,704 45,712
Swiss franc 127,388 130,296
Turkish lira 2,955 6,581
US dollar 50 149
Total 718,848 732,233
Royal London Europe ex UK Tracker Fund
NOTES TO THE FINANCIAL STATEMENTS (CONTINUED)FOR THE YEAR ENDED 31 AUGUST 2018
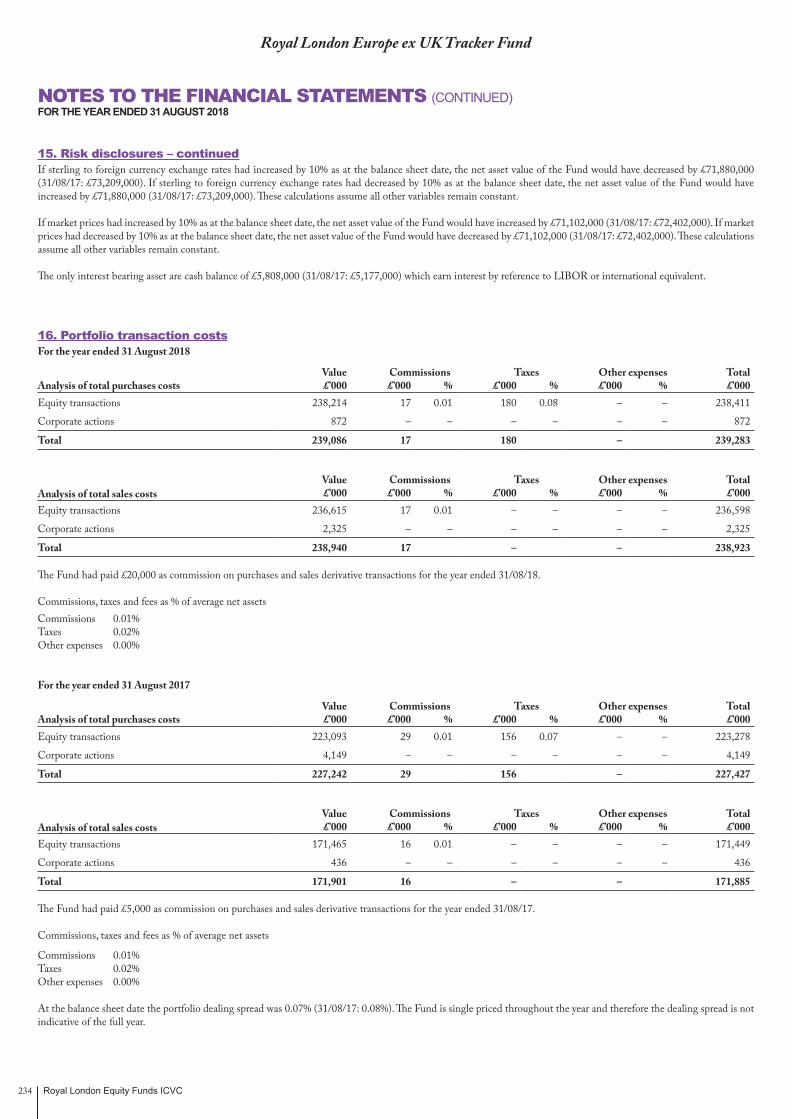
Royal London Equity Funds ICVC234
Royal London Europe ex UK Tracker Fund
NOTES TO THE FINANCIAL STATEMENTS (CONTINUED)FOR THE YEAR ENDED 31 AUGUST 2018
15. Risk disclosures – continuedIf sterling to foreign currency exchange rates had increased by 10% as at the balance sheet date, the net asset value of the Fund would have decreased by £71,880,000 (31/08/17: £73,209,000). If sterling to foreign currency exchange rates had decreased by 10% as at the balance sheet date, the net asset value of the Fund would have increased by £71,880,000 (31/08/17: £73,209,000). These calculations assume all other variables remain constant.
If market prices had increased by 10% as at the balance sheet date, the net asset value of the Fund would have increased by £71,102,000 (31/08/17: £72,402,000). If market prices had decreased by 10% as at the balance sheet date, the net asset value of the Fund would have decreased by £71,102,000 (31/08/17: £72,402,000). These calculations assume all other variables remain constant.
The only interest bearing asset are cash balance of £5,808,000 (31/08/17: £5,177,000) which earn interest by reference to LIBOR or international equivalent.
16. Portfolio transaction costsFor the year ended 31 August 2018
Value Commissions Taxes Other expenses TotalAnalysis of total purchases costs £’000 £’000 % £’000 % £’000 % £’000Equity transactions 238,214 17 0.01 180 0.08 – – 238,411
Corporate actions 872 – – – – – – 872
Total 239,086 17 180 – 239,283
Value Commissions Taxes Other expenses TotalAnalysis of total sales costs £’000 £’000 % £’000 % £’000 % £’000Equity transactions 236,615 17 0.01 – – – – 236,598
Corporate actions 2,325 – – – – – – 2,325
Total 238,940 17 – – 238,923
The Fund had paid £20,000 as commission on purchases and sales derivative transactions for the year ended 31/08/18.
Commissions, taxes and fees as % of average net assetsCommissions 0.01%Taxes 0.02%Other expenses 0.00%
For the year ended 31 August 2017
Value Commissions Taxes Other expenses TotalAnalysis of total purchases costs £’000 £’000 % £’000 % £’000 % £’000Equity transactions 223,093 29 0.01 156 0.07 – – 223,278
Corporate actions 4,149 – – – – – – 4,149
Total 227,242 29 156 – 227,427
Value Commissions Taxes Other expenses TotalAnalysis of total sales costs £’000 £’000 % £’000 % £’000 % £’000Equity transactions 171,465 16 0.01 – – – – 171,449
Corporate actions 436 – – – – – – 436
Total 171,901 16 – – 171,885
The Fund had paid £5,000 as commission on purchases and sales derivative transactions for the year ended 31/08/17.
Commissions, taxes and fees as % of average net assets
Commissions 0.01%Taxes 0.02%Other expenses 0.00%
At the balance sheet date the portfolio dealing spread was 0.07% (31/08/17: 0.08%). The Fund is single priced throughout the year and therefore the dealing spread is not indicative of the full year.
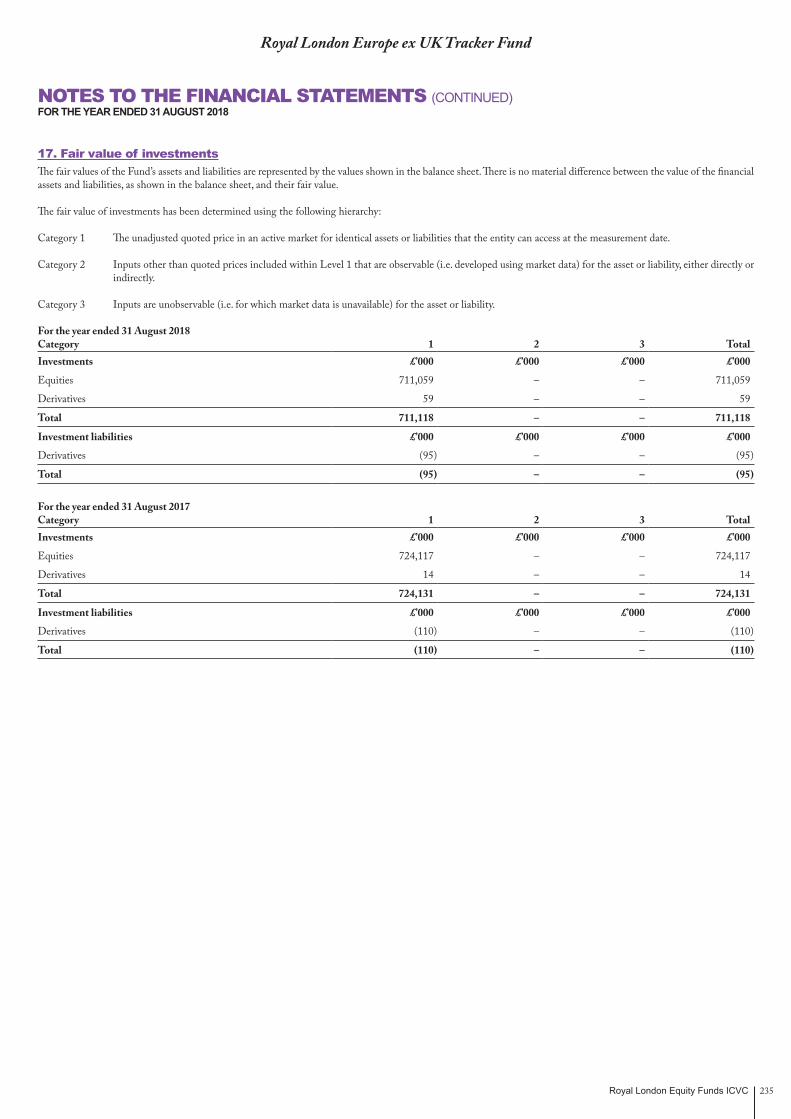
Royal London Equity Funds ICVC 235
Royal London Europe ex UK Tracker Fund
NOTES TO THE FINANCIAL STATEMENTS (CONTINUED)FOR THE YEAR ENDED 31 AUGUST 2018
17. Fair value of investmentsThe fair values of the Fund’s assets and liabilities are represented by the values shown in the balance sheet. There is no material difference between the value of the financial assets and liabilities, as shown in the balance sheet, and their fair value.
The fair value of investments has been determined using the following hierarchy:
Category 1 The unadjusted quoted price in an active market for identical assets or liabilities that the entity can access at the measurement date.
Category 2 Inputs other than quoted prices included within Level 1 that are observable (i.e. developed using market data) for the asset or liability, either directly or indirectly.
Category 3 Inputs are unobservable (i.e. for which market data is unavailable) for the asset or liability.
For the year ended 31 August 2018 Category 1 2 3 TotalInvestments £’000 £’000 £’000 £’000
Equities 711,059 – – 711,059
Derivatives 59 – – 59
Total 711,118 – – 711,118
Investment liabilities £’000 £’000 £’000 £’000
Derivatives (95) – – (95)
Total (95) – – (95)
For the year ended 31 August 2017 Category 1 2 3 TotalInvestments £’000 £’000 £’000 £’000
Equities 724,117 – – 724,117
Derivatives 14 – – 14
Total 724,131 – – 724,131
Investment liabilities £’000 £’000 £’000 £’000
Derivatives (110) – – (110)
Total (110) – – (110)
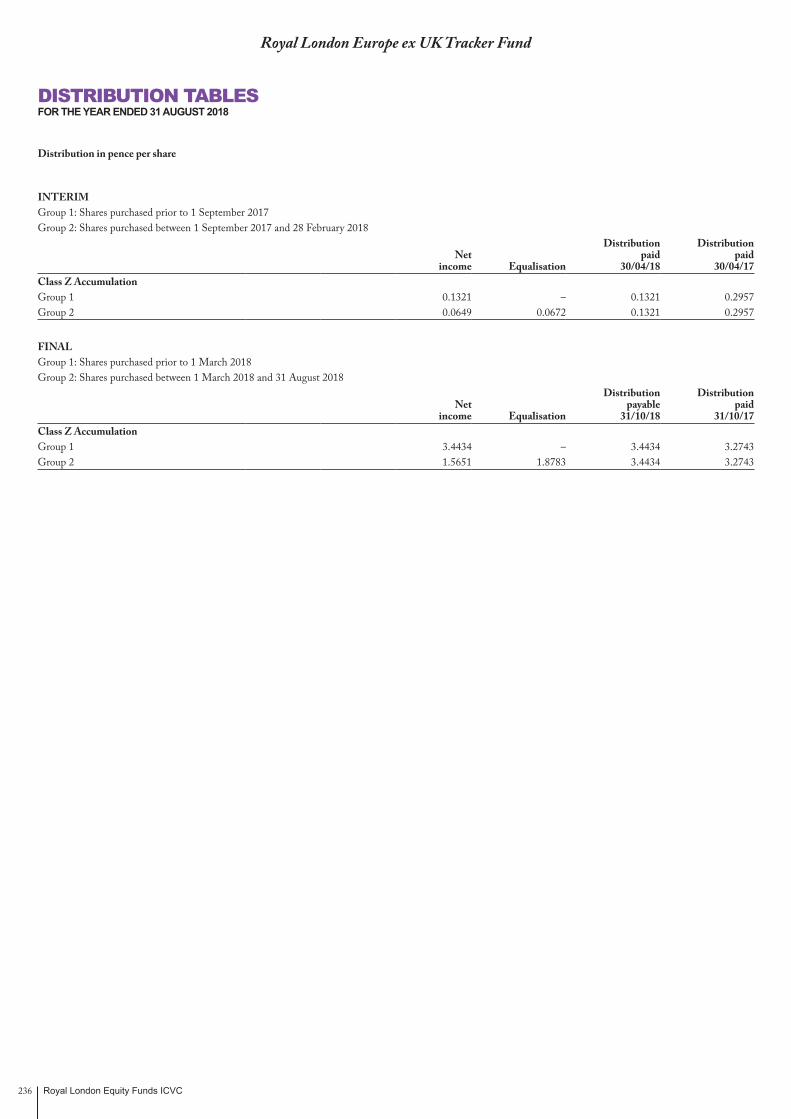
Royal London Equity Funds ICVC236
Royal London Europe ex UK Tracker Fund
DISTRIBUTION TABLESFOR THE YEAR ENDED 31 AUGUST 2018
Distribution in pence per share
INTERIMGroup 1: Shares purchased prior to 1 September 2017Group 2: Shares purchased between 1 September 2017 and 28 February 2018
Distribution DistributionNet paid paid
income Equalisation 30/04/18 30/04/17Class Z AccumulationGroup 1 0.1321 – 0.1321 0.2957Group 2 0.0649 0.0672 0.1321 0.2957
FINALGroup 1: Shares purchased prior to 1 March 2018Group 2: Shares purchased between 1 March 2018 and 31 August 2018
Distribution DistributionNet payable paid
income Equalisation 31/10/18 31/10/17Class Z AccumulationGroup 1 3.4434 – 3.4434 3.2743Group 2 1.5651 1.8783 3.4434 3.2743

Royal London Equity Funds ICVC 237
Royal London Emerging Markets Equity Tracker Fund
Fund Performance12 months to 31 August 2018
1 year return
%
3 year return
%
5 year return
%Royal London Emerging Markets Equity Tracker Fund, Class R Accumulation (Total return) -0.47 – –
MSCI EM (Emerging Markets) ESG Index (Capital return) -2.14 – –
Past performance is not necessarily a reliable indicator of future performance. The value of investments and the income from them is not guaranteed and may go down as well as up, and investors may not get back the amount originally invested.
Source: RLAM and Lipper, as at 31 August 2018. Returns are net of management fees. Investors should note that the total return is calculated on the Fund’s official midday price whereas the Fund has been valued as at close of business for the Net Asset Value quoted within the Comparative Table. Please also note, the total return shown in the table is being compared against the official end of day price of the benchmark. The tracking error shown in the performance overview below is calculated using the unofficial end of day fund price to align with the official end of day benchmark price.
Performance OverviewInvestors should note that the Fund price is taken at noon each day, whilst the index performance is recorded at the close of business. Significant intra-day market movements at the start or end of the day may therefore distort comparisons. This, along with the impact of income and the charges associated with the Fund, accounts for the majority of the difference between the performance of the Fund and the MSCI EM (Emerging Markets) ESG Price Index.
The tracking error between the Fund and the MSCI EM (Emerging Markets) ESG Price Index was 0.75% during the past 12 months. This was below the anticipated tracking error of 1.00% to 1.50%. We will always experience a small tracking difference between Fund and index for reasons including exchange rate risk on some dividends, trading costs, optimisation and the use of index futures to manage cashflows.
Market and portfolio commentaryThe Fund aims to achieve the capital return of the MSCI EM (Emerging Markets) ESG Price Index. However, perfect replication can result in unnecessary and costly trading which may outweigh the benefits. The Fund uses an optimiser to help construct a portfolio designed to track the performance of the benchmark without necessarily holding all the constituents in their exact benchmark weights. It generates efficient rebalancing and cashflow trades and allows flexibility not to trade every index or cashflow event. In practice, the Fund holds most of its benchmark’s names, as well as holding futures and cash.
Symon BradfordFund Manager31 August 2018Royal London Asset Management
The views expressed are the author’s own and do not constitute investment advice and are not an indication of future fund performance. Portfolio holdings are subject to change, for information only and are not investment recommendations.
Source: Royal London Asset Management, unless otherwise stated.
MANAGER’S INVESTMENT REPORT

Royal London Equity Funds ICVC238
Royal London Emerging Markets Equity Tracker Fund
COMPARATIVE TABLE
Class R Accumulation31/08/18 31/08/17**
Change in net assets per share (p) (p)
Opening net asset value per share 105.85 100.00
Return before operating charges* (0.15) 5.88
Operating charges (0.07) (0.03)
Return after operating charges* (0.22) 5.85
Distributions on accumulation shares (2.31) (1.04)
Retained distributions on accumulation shares 2.31 1.04
Closing net asset value per share 105.63 105.85
* after direct transaction costs of: 0.07 0.15
Performance
Return after charges (0.21)% 5.85%
Other information
Closing net asset value (£’000) 989,910 687,994
Closing number of shares 937,172,500 649,992,923
Operating charges 0.07% 0.13%
Direct transaction costs 0.07% 0.15%
Prices^
Highest share price 116.60 106.30
Lowest share price 99.91 97.26
** The Fund launched on 12 June 2017.

Royal London Equity Funds ICVC 239
Class Z Accumulation31/08/18***
Change in net assets per share (p)
Opening net asset value per share 100.00
Return before operating charges* (4.09)
Operating charges (0.15)
Return after operating charges* (4.24)
Distributions on accumulation shares (1.36)
Retained distributions on accumulation shares 1.36
Closing net asset value per share 95.76
* after direct transaction costs of: 0.06
Performance
Return after charges (4.24)%
Other information
Closing net asset value (£’000) 958
Closing number of shares 1,000,000
Operating charges 0.32%
Direct transaction costs 0.07%
Prices^
Highest share price 103.80
Lowest share price 92.55
*** The share class launched 5 March 2018 so there are no comparatives for 31 August 2017.^ The high and low prices disclosed are the high and low prices for the accounting period and not the calendar year. The net asset value per share price is based on the net asset value in the published financial statements and may be different due to the prior year end accounting adjustments.
It should be remembered that past performance is not a reliable indicator of future performance and that the value of shares, and the income derived from them, can vary.
Royal London Emerging Markets Equity Tracker Fund
COMPARATIVE TABLE (CONTINUED)

Royal London Equity Funds ICVC240
Royal London Emerging Markets Equity Tracker Fund
Equities – 96.93% (31/08/17 – 96.82%) Bermuda – 0.44% (31/08/17 – 0.55%) Consumer Goods – 0.22% 1,514,000 Brilliance China Automotive Holdings 1,843 0.19 10,280,000 HengTen Networks Group 327 0.03
Consumer Services – 0.10% 7,080,000 Alibaba Pictures Group 652 0.06 4,826,000 Gome Retail Holdings 360 0.04
Utilities – 0.12% 2,810,000 Beijing Enterprises Water Group 1,173 0.12
Total Bermuda 4,355 0.44
Brazil – 5.17% (31/08/17 – 7.48%) Basic Materials – 0.33% 126,100 Fibria Celulose 1,863 0.19 19,500 Gerdau 58 – 325,700 Klabin 1,299 0.13 9,600 Suzano Papel 85 0.01
Consumer Goods – 0.23% 255,700 BRF 961 0.10 76,100 Cosan Industries 495 0.05 1,300 Hypermarcas 7 – 45,500 M. Dias Branco 359 0.04 82,400 Natura Cosmeticos 446 0.04
Consumer Services – 0.53% 70,300 Companhia Brasileira de Distribuicao 1,069 0.10 719,300 Kroton Educational 1,373 0.14 242,000 Localiza Rent 973 0.10 357,000 Lojas Renner 1,885 0.19
Financials – 3.35% 189,400 Atacadao Distribuicao Comercio e
Industria 514 0.05 1,039,500 B3 Brasil Bolsa Balcao 4,224 0.43 1,699,640 Banco Bradesco 9,004 0.91 394,300 BR Malls 672 0.07 630,700 Cielo 1,778 0.18 1,626,200 Itau Unibanco Banco Preference 12,836 1.29 2,084,720 Itausa Investimentos 3,729 0.38 115,200 Multiplan 401 0.04
Healthcare – 0.03% 120,400 OdontoPrev 295 0.03
Industrials – 0.14% 10,500 Embraer 38 – 386,230 Weg 1,370 0.14
Telecommunications – 0.27% 227,500 Telefonica Brasil 1,700 0.17 406,000 Tim 931 0.10
Utilities – 0.29% 403,200 Companhia Energetica 562 0.06 29,200 CPFL Energia 120 0.01 117,600 Energias Do Brasil 294 0.03 71,600 Engie Brasil 490 0.05 183,900 Ultrapar 1,413 0.14
Total Brazil 51,244 5.17
Cayman Islands – 12.97% (31/08/17 – 10.66%) Basic Materials – 0.06% 788,000 Lee & Man Paper 580 0.06
Consumer Goods – 1.07% 545,000 Anta Sports 2,281 0.23 2,510,000 Geely Automobile 4,104 0.41 384,000 Shenzhou International 3,873 0.39 204,000 Zhongsheng Group 344 0.04
Consumer Services – 1.21% 214,200 Ctrip ADR 6,452 0.65 71,800 New Oriental Education and Technology
Group ADR 4,341 0.44 218,600 Vipshop Holdings 1,172 0.12
Financials – 0.17% 608,940 Chailease 1,594 0.16 350,500 Shui On Land 64 0.01
Healthcare – 0.16% 505,000 3SBio 740 0.07 687,000 China Medical System 873 0.09
Industrials – 0.42% 365,500 AAC Technologies 3,117 0.31 3,555,000 Fullshare Holdings 1,091 0.11
Oil & Gas – 0.25% 800,000 China Conch Venture 2,113 0.21 6,673,000 GCL Poly Energy 340 0.04
Technology – 9.63% 2,863,700 Tencent Holdings 95,385 9.63
Total Cayman Islands 128,464 12.97
Chile – 1.26% (31/08/17 – 1.32%) Basic Materials – 0.35% 621,112 Empresas CMPC 1,875 0.19 47,662 Sociedad Quimica Y Minera 1,595 0.16
Consumer Goods – 0.04% 147,266 Embotelladora Andina 428 0.04
Consumer Services – 0.34% 150,547 Latam Airlines 1,092 0.11 374,090 S.A.C.I Falabella 2,273 0.23
Oil & Gas – 0.26% 218,862 Empresas Copec 2,557 0.26
Telecommunications – 0.05% 76,305 Empresa Nacional de Telecomunicaciones 479 0.05
Utilities – 0.22% 1,316,187 Aguas Andinas 540 0.05 14,637,252 Enel Americas 1,682 0.17
Total Chile 12,521 1.26
China – 6.25% (31/08/17 – 7.01%) Basic Materials – 0.35% 1,809,000 China Molybdenum 569 0.06 1,705,000 China Shenhua Energy 2,921 0.29
Consumer Goods – 0.40% 322,000 BYD 1,471 0.15 1,424,000 Dongfeng Motor Group 1,223 0.13 1,467,200 Guangzhou Automobile 1,224 0.12
PORTFOLIO STATEMENTAS AT 31 AUGUST 2018
Bid-Market Total net Holding Investment value (£’000) assets (%)
Bid-Market Total net Holding Investment value (£’000) assets (%)
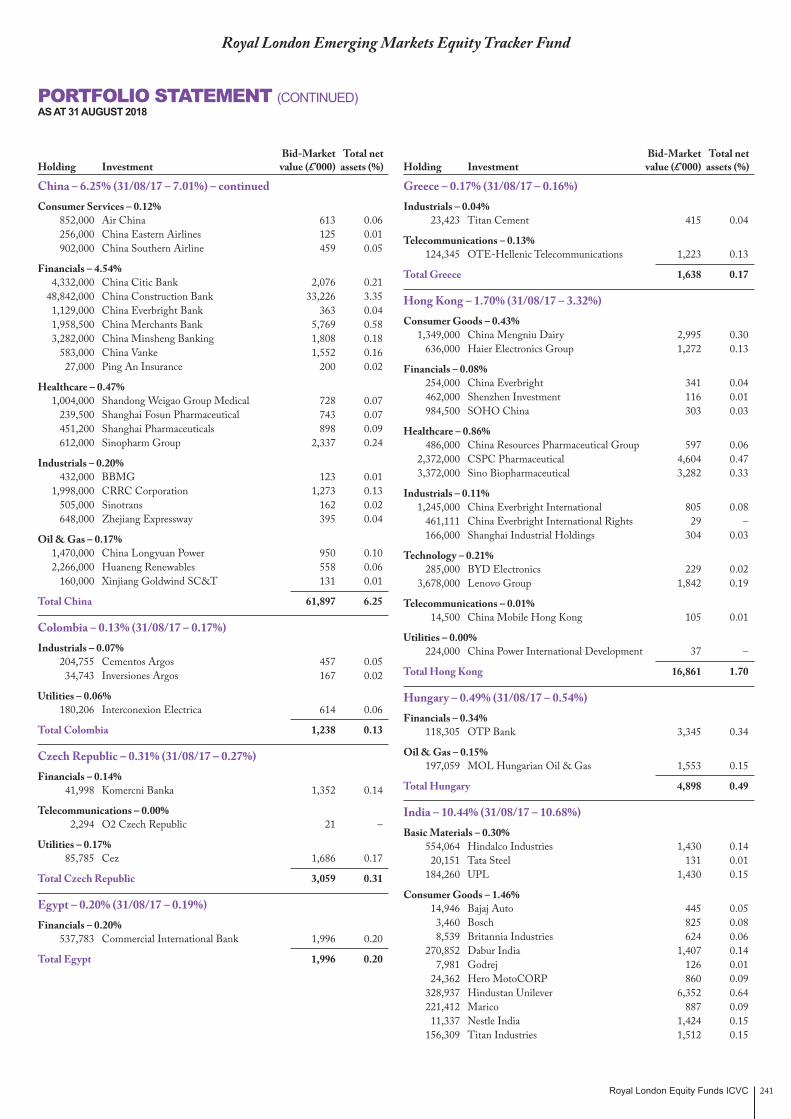
Royal London Equity Funds ICVC 241
Royal London Emerging Markets Equity Tracker Fund
China – 6.25% (31/08/17 – 7.01%) – continued Consumer Services – 0.12% 852,000 Air China 613 0.06 256,000 China Eastern Airlines 125 0.01 902,000 China Southern Airline 459 0.05
Financials – 4.54% 4,332,000 China Citic Bank 2,076 0.21 48,842,000 China Construction Bank 33,226 3.35 1,129,000 China Everbright Bank 363 0.04 1,958,500 China Merchants Bank 5,769 0.58 3,282,000 China Minsheng Banking 1,808 0.18 583,000 China Vanke 1,552 0.16 27,000 Ping An Insurance 200 0.02
Healthcare – 0.47% 1,004,000 Shandong Weigao Group Medical 728 0.07 239,500 Shanghai Fosun Pharmaceutical 743 0.07 451,200 Shanghai Pharmaceuticals 898 0.09 612,000 Sinopharm Group 2,337 0.24
Industrials – 0.20% 432,000 BBMG 123 0.01 1,998,000 CRRC Corporation 1,273 0.13 505,000 Sinotrans 162 0.02 648,000 Zhejiang Expressway 395 0.04
Oil & Gas – 0.17% 1,470,000 China Longyuan Power 950 0.10 2,266,000 Huaneng Renewables 558 0.06 160,000 Xinjiang Goldwind SC&T 131 0.01
Total China 61,897 6.25
Colombia – 0.13% (31/08/17 – 0.17%) Industrials – 0.07% 204,755 Cementos Argos 457 0.05 34,743 Inversiones Argos 167 0.02
Utilities – 0.06% 180,206 Interconexion Electrica 614 0.06
Total Colombia 1,238 0.13
Czech Republic – 0.31% (31/08/17 – 0.27%) Financials – 0.14% 41,998 Komercni Banka 1,352 0.14
Telecommunications – 0.00% 2,294 O2 Czech Republic 21 –
Utilities – 0.17% 85,785 Cez 1,686 0.17
Total Czech Republic 3,059 0.31
Egypt – 0.20% (31/08/17 – 0.19%) Financials – 0.20% 537,783 Commercial International Bank 1,996 0.20
Total Egypt 1,996 0.20
Greece – 0.17% (31/08/17 – 0.16%) Industrials – 0.04% 23,423 Titan Cement 415 0.04
Telecommunications – 0.13% 124,345 OTE-Hellenic Telecommunications 1,223 0.13
Total Greece 1,638 0.17
Hong Kong – 1.70% (31/08/17 – 3.32%) Consumer Goods – 0.43% 1,349,000 China Mengniu Dairy 2,995 0.30 636,000 Haier Electronics Group 1,272 0.13
Financials – 0.08% 254,000 China Everbright 341 0.04 462,000 Shenzhen Investment 116 0.01 984,500 SOHO China 303 0.03
Healthcare – 0.86% 486,000 China Resources Pharmaceutical Group 597 0.06 2,372,000 CSPC Pharmaceutical 4,604 0.47 3,372,000 Sino Biopharmaceutical 3,282 0.33
Industrials – 0.11% 1,245,000 China Everbright International 805 0.08 461,111 China Everbright International Rights 29 – 166,000 Shanghai Industrial Holdings 304 0.03
Technology – 0.21% 285,000 BYD Electronics 229 0.02 3,678,000 Lenovo Group 1,842 0.19
Telecommunications – 0.01% 14,500 China Mobile Hong Kong 105 0.01
Utilities – 0.00% 224,000 China Power International Development 37 –
Total Hong Kong 16,861 1.70
Hungary – 0.49% (31/08/17 – 0.54%) Financials – 0.34% 118,305 OTP Bank 3,345 0.34
Oil & Gas – 0.15% 197,059 MOL Hungarian Oil & Gas 1,553 0.15
Total Hungary 4,898 0.49
India – 10.44% (31/08/17 – 10.68%) Basic Materials – 0.30% 554,064 Hindalco Industries 1,430 0.14 20,151 Tata Steel 131 0.01 184,260 UPL 1,430 0.15
Consumer Goods – 1.46% 14,946 Bajaj Auto 445 0.05 3,460 Bosch 825 0.08 8,539 Britannia Industries 624 0.06 270,852 Dabur India 1,407 0.14 7,981 Godrej 126 0.01 24,362 Hero MotoCORP 860 0.09 328,937 Hindustan Unilever 6,352 0.64 221,412 Marico 887 0.09 11,337 Nestle India 1,424 0.15 156,309 Titan Industries 1,512 0.15
PORTFOLIO STATEMENT (CONTINUED)AS AT 31 AUGUST 2018
Bid-Market Total net Holding Investment value (£’000) assets (%)
Bid-Market Total net Holding Investment value (£’000) assets (%)

Royal London Equity Funds ICVC242
Royal London Emerging Markets Equity Tracker Fund
India – 10.44% (31/08/17 – 10.68%) – continued Consumer Services – 0.10% 174,136 Zee Entertainment Enterprises 944 0.10
Financials – 3.21% 913,256 Axis Bank 6,432 0.65 800,604 Housing Development Finance
Corporation 16,813 1.70 1,210,303 ICICI Bank 4,498 0.45 282,408 IDFC Bank 146 0.01 128,734 Mahindra & Mahindra Financial Services 683 0.07 865,263 YES Bank 3,224 0.33
Healthcare – 0.39% 1,717 Apollo Hospitals 22 – 131,664 Aurobindo Pharma 1,018 0.10 2,701 Dr Reddys Laboratories 73 0.01 67,849 Glenmark Pharmaceuticals 490 0.05 88,202 Lupin 891 0.09 39,655 Piramal Healthcare 1,376 0.14
Industrials – 1.13% 11,414 ACC 203 0.02 597,190 Ashok Leyland 836 0.08 148,562 Asian Paints 2,212 0.22 106,272 Bharat Forge 783 0.08 6,108 Eicher Motors 1,859 0.19 15,405 Havells India 121 0.01 377,249 Mahindra & Mahindra 3,950 0.40 3,378 Shree Cement 694 0.07 40,113 Siemens 444 0.05 2,584 Tata Motors 8 – 35,695 Tata Motors ‘A’ 55 0.01
Oil & Gas – 0.25% 387,463 Bharat Petroleum 1,522 0.15 311,688 Hindustan Petroleum 858 0.09 6,371 Reliance Industries 86 0.01
Technology – 3.20% 286,072 HCL Technologies 3,247 0.33 890,368 Infosys 13,919 1.40 468,884 Tata Consultancy Services 10,571 1.07 246,554 Tech Mahindra 2,048 0.21 595,758 Wipro 1,947 0.19
Telecommunications – 0.40% 710,219 Bharti Airtel 2,957 0.30 199,970 Bharti Infratel 622 0.06 791,071 Idea Cellular 423 0.04
Total India 103,428 10.44
Indonesia – 3.42% (31/08/17 – 3.72%) Basic Materials – 0.07% 7,041,300 Adaro Energy 686 0.07
Consumer Goods – 0.73% 10,507,800 Astra International 3,979 0.40 1,249,100 Indofood CBP Sukses Makmur 564 0.06 2,415,500 Indofood Sukses Makmur 801 0.08 806,600 Unilever Indonesia 1,845 0.19
Consumer Services – 0.08% 1,306,100 Matahari Department 512 0.05 498,600 Media Nusantra Citra 23 – 3,032,600 Surya Citra Media 331 0.03
Indonesia – 3.42% (31/08/17 – 3.72%) – continued Financials – 1.71% 5,121,700 Bank Central Asia 6,634 0.67 641,200 Bank Danamon 228 0.02 9,638,300 Bank Mandiri 3,448 0.35 3,836,200 Bank Negra Indonesia 1,558 0.16 28,509,400 Bank Ratyat Indonesia 4,720 0.48 6,860,700 PT. Pakuwon Jati 185 0.02 3,562,400 PT. Lippo Karawaci 65 0.01
Healthcare – 0.07% 10,126,100 Kalbe Farma 706 0.07
Industrials – 0.19% 1,402,700 Jasa Marga 332 0.03 860,400 United Tractor 1,541 0.16
Telecommunications – 0.51% 26,642,500 Telekomunikasi Indonesia 4,857 0.49 1,367,100 XL Axiata 219 0.02
Utilities – 0.06% 5,464,200 Perusahaan Gas Negara 608 0.06
Total Indonesia 33,842 3.42
Isle of Man – 0.14% (31/08/17 – 0.18%) Financials – 0.14% 194,666 Nepi Rockcastle 1,430 0.14
Total Isle of Man 1,430 0.14
Malaysia – 3.44% (31/08/17 – 2.83%) Basic Materials – 0.08% 115,600 Hap Seng Consolidated Berhad 212 0.02 620,300 Press Metal Berhad 574 0.06
Consumer Goods – 0.18% 191,600 Kuala Lumpur Kepong 885 0.09 268,920 PPB Group Berhad 845 0.09
Consumer Services – 0.02% 504,300 Astro Malaysia Holdings 164 0.02
Financials – 1.57% 987,300 AMMB Holdings 756 0.08 2,381,163 CIMB Group 2,715 0.27 113,400 Hong Leong Bank 436 0.04 240,600 IOI Properties 79 0.01 2,206,656 Malayan Banking 4,115 0.42 1,565,800 Public Bank 7,364 0.74 111,000 RHB Capital Berhad 112 0.01
Healthcare – 0.30% 713,000 Hartalega 945 0.10 1,286,000 IHH Healthcare 1,336 0.13 331,500 Top Glove 691 0.07
Industrials – 0.19% 467,700 Malaysia Airports 819 0.08 735,700 Misc Berhad 817 0.08 553,700 Sime Darby Berhad 264 0.03
Oil & Gas – 0.11% 565,700 Dialog Group 368 0.04 137,300 Petronas Dagangan 698 0.07 932,100 Sapurakencana Petroleum 59 –
PORTFOLIO STATEMENT (CONTINUED)AS AT 31 AUGUST 2018
Bid-Market Total net Holding Investment value (£’000) assets (%)
Bid-Market Total net Holding Investment value (£’000) assets (%)
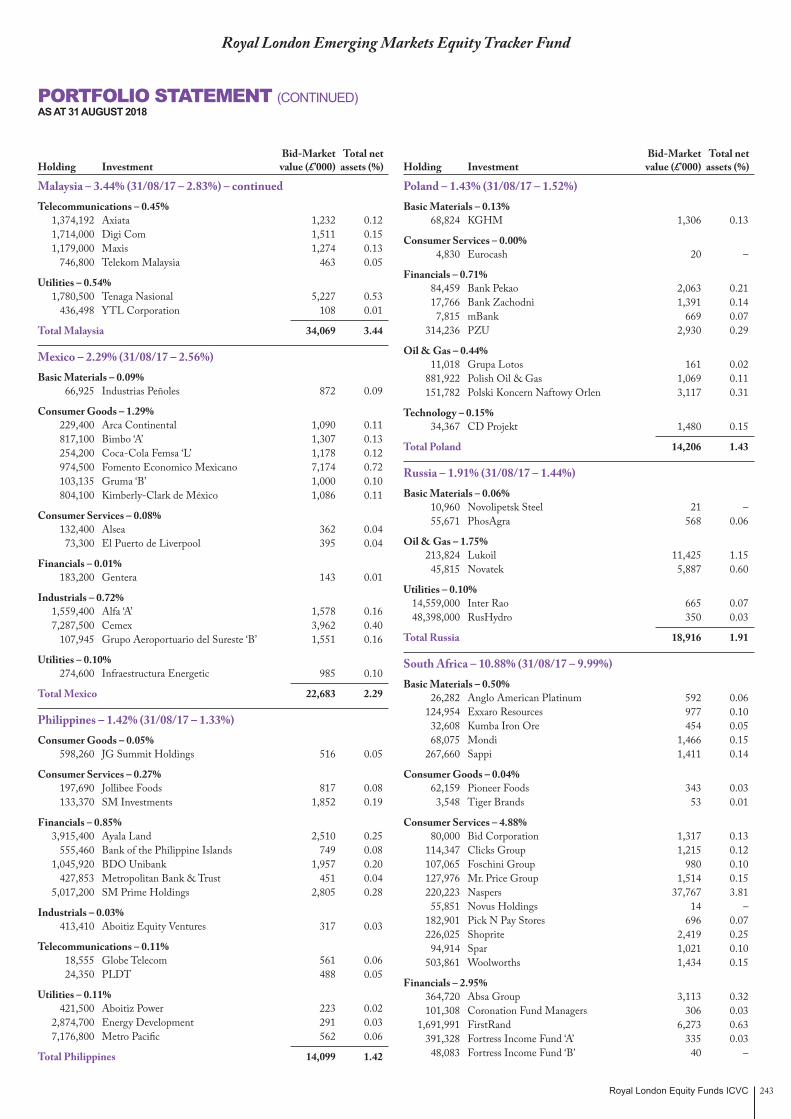
Royal London Equity Funds ICVC 243
Royal London Emerging Markets Equity Tracker Fund
Malaysia – 3.44% (31/08/17 – 2.83%) – continued Telecommunications – 0.45% 1,374,192 Axiata 1,232 0.12 1,714,000 Digi Com 1,511 0.15 1,179,000 Maxis 1,274 0.13 746,800 Telekom Malaysia 463 0.05
Utilities – 0.54% 1,780,500 Tenaga Nasional 5,227 0.53 436,498 YTL Corporation 108 0.01
Total Malaysia 34,069 3.44
Mexico – 2.29% (31/08/17 – 2.56%) Basic Materials – 0.09% 66,925 Industrias Peñoles 872 0.09
Consumer Goods – 1.29% 229,400 Arca Continental 1,090 0.11 817,100 Bimbo ‘A’ 1,307 0.13 254,200 Coca-Cola Femsa ‘L’ 1,178 0.12 974,500 Fomento Economico Mexicano 7,174 0.72 103,135 Gruma ‘B’ 1,000 0.10 804,100 Kimberly-Clark de México 1,086 0.11
Consumer Services – 0.08% 132,400 Alsea 362 0.04 73,300 El Puerto de Liverpool 395 0.04
Financials – 0.01% 183,200 Gentera 143 0.01
Industrials – 0.72% 1,559,400 Alfa ‘A’ 1,578 0.16 7,287,500 Cemex 3,962 0.40 107,945 Grupo Aeroportuario del Sureste ‘B’ 1,551 0.16
Utilities – 0.10% 274,600 Infraestructura Energetic 985 0.10
Total Mexico 22,683 2.29
Philippines – 1.42% (31/08/17 – 1.33%) Consumer Goods – 0.05% 598,260 JG Summit Holdings 516 0.05
Consumer Services – 0.27% 197,690 Jollibee Foods 817 0.08 133,370 SM Investments 1,852 0.19
Financials – 0.85% 3,915,400 Ayala Land 2,510 0.25 555,460 Bank of the Philippine Islands 749 0.08 1,045,920 BDO Unibank 1,957 0.20 427,853 Metropolitan Bank & Trust 451 0.04 5,017,200 SM Prime Holdings 2,805 0.28
Industrials – 0.03% 413,410 Aboitiz Equity Ventures 317 0.03
Telecommunications – 0.11% 18,555 Globe Telecom 561 0.06 24,350 PLDT 488 0.05
Utilities – 0.11% 421,500 Aboitiz Power 223 0.02 2,874,700 Energy Development 291 0.03 7,176,800 Metro Pacific 562 0.06
Total Philippines 14,099 1.42
Poland – 1.43% (31/08/17 – 1.52%) Basic Materials – 0.13% 68,824 KGHM 1,306 0.13
Consumer Services – 0.00% 4,830 Eurocash 20 –
Financials – 0.71% 84,459 Bank Pekao 2,063 0.21 17,766 Bank Zachodni 1,391 0.14 7,815 mBank 669 0.07 314,236 PZU 2,930 0.29
Oil & Gas – 0.44% 11,018 Grupa Lotos 161 0.02 881,922 Polish Oil & Gas 1,069 0.11 151,782 Polski Koncern Naftowy Orlen 3,117 0.31
Technology – 0.15% 34,367 CD Projekt 1,480 0.15
Total Poland 14,206 1.43
Russia – 1.91% (31/08/17 – 1.44%) Basic Materials – 0.06% 10,960 Novolipetsk Steel 21 – 55,671 PhosAgra 568 0.06
Oil & Gas – 1.75% 213,824 Lukoil 11,425 1.15 45,815 Novatek 5,887 0.60
Utilities – 0.10% 14,559,000 Inter Rao 665 0.07 48,398,000 RusHydro 350 0.03
Total Russia 18,916 1.91
South Africa – 10.88% (31/08/17 – 9.99%) Basic Materials – 0.50% 26,282 Anglo American Platinum 592 0.06 124,954 Exxaro Resources 977 0.10 32,608 Kumba Iron Ore 454 0.05 68,075 Mondi 1,466 0.15 267,660 Sappi 1,411 0.14
Consumer Goods – 0.04% 62,159 Pioneer Foods 343 0.03 3,548 Tiger Brands 53 0.01
Consumer Services – 4.88% 80,000 Bid Corporation 1,317 0.13 114,347 Clicks Group 1,215 0.12 107,065 Foschini Group 980 0.10 127,976 Mr. Price Group 1,514 0.15 220,223 Naspers 37,767 3.81 55,851 Novus Holdings 14 – 182,901 Pick N Pay Stores 696 0.07 226,025 Shoprite 2,419 0.25 94,914 Spar 1,021 0.10 503,861 Woolworths 1,434 0.15
Financials – 2.95% 364,720 Absa Group 3,113 0.32 101,308 Coronation Fund Managers 306 0.03 1,691,991 FirstRand 6,273 0.63 391,328 Fortress Income Fund ‘A’ 335 0.03 48,083 Fortress Income Fund ‘B’ 40 –
PORTFOLIO STATEMENT (CONTINUED)AS AT 31 AUGUST 2018
Bid-Market Total net Holding Investment value (£’000) assets (%)
Bid-Market Total net Holding Investment value (£’000) assets (%)

Royal London Equity Funds ICVC244
Royal London Emerging Markets Equity Tracker Fund
South Africa – 10.88% (31/08/17 – 9.99%) – continued Financials – 2.95% – continued 1,547,343 Growthpoint Properties 2,065 0.21 132,576 Hyprop Investments 710 0.07 157,696 Investec 794 0.08 64,398 Liberty 394 0.04 116,403 Nedbank Group 1,698 0.17 2,866,475 Redefine Properties 1,553 0.16 133,048 Resilient Properties 398 0.04 359,947 RMB Holdings 1,586 0.16 865,371 Sanlam 3,605 0.36 655,125 Standard Bank 6,394 0.65
Healthcare – 0.45% 196,875 Aspen Pharmacare 3,013 0.31 310,000 Life Healthcare 434 0.04 633,952 Netcare 977 0.10
Industrials – 0.58% 169,313 Bidvest Group 1,920 0.19 70,603 Imperial Holdings 764 0.08 274,402 Remgro 3,082 0.31
Oil & Gas – 0.86% 282,707 Sasol 8,551 0.86
Telecommunications – 0.62% 872,997 MTN Group 4,080 0.41 315,777 Vodacom Group 2,096 0.21
Total South Africa 107,854 10.88
South Korea – 11.71% (31/08/17 – 12.54%) Basic Materials – 0.98% 54,867 Hanwha Chemical 768 0.08 879 Hyosung Chemical Corporation 114 0.01 22,968 LG Chemical 5,802 0.59 3,925 LG Chemical Preference 543 0.05 8,274 Lotte Chemical Corporation 1,807 0.18 8,108 OCI 644 0.07
Consumer Goods – 1.69% 15,713 AmorePacific 1,046 0.11 16,425 AmorePacific Corporation 2,980 0.30 1,188 AmorePacific Corporation Preference 118 0.01 4,262 CJ Cheiljedang 1,003 0.10 7,726 CJ Corporation 705 0.07 25,042 Coway 1,582 0.16 37,561 Hankook Tire 1,211 0.12 94,877 Hanon Systems 784 0.08 646 Hanssem 37 – 1,192 Hyosung TNC 155 0.02 616 Hyundai Wia Corporation 18 – 52,923 LG Electronics 2,809 0.28 4,676 LG Household & Healthcare 4,088 0.41 147 LG Household & Healthcare Preference 75 0.01 616 Lotte Confectionery 69 0.01 1,953 Lotte Holdings 65 0.01
Consumer Services – 0.17% 16,182 Hotel Shilla 1,208 0.12 19,671 Korean Airlines 381 0.04 636 Lotte Shopping 79 0.01
PORTFOLIO STATEMENT (CONTINUED)AS AT 31 AUGUST 2018
Bid-Market Total net Holding Investment value (£’000) assets (%)
Bid-Market Total net Holding Investment value (£’000) assets (%)
South Korea – 11.71% (31/08/17 – 12.54%) – continued Financials – 2.55% 132,408 BNK Financial 763 0.08 89,462 DGB Financial 631 0.06 152,725 Hana Financial Holdings 4,507 0.45 29,729 Hyundai Marine & Fire Insurance 764 0.08 126,672 Indus Bank of Korea 1,300 0.13 203,648 KB Financial 7,277 0.73 14,446 Samsung Card 352 0.04 15,614 Samsung Fire & Marine Insurance 2,854 0.29 1,628 Samsung Life Insurance 104 0.01 217,962 Shinhan Financial 6,553 0.66 17,097 Woori Bank 192 0.02
Healthcare – 0.18% 3,067 Hanmi Pharmaceutical 1,055 0.11 4,383 Yuhan Corporation 723 0.07
Industrials – 1.98% 12,945 Daelim Industrial 732 0.07 5,877 Daewoo Engineering & Construction 21 – 22,877 GS Engineering & Construction 757 0.08 12,076 HDC Group 204 0.02 16,873 HDC Hyundai Development 652 0.07 3,802 Hyosung 120 0.01 1,234 Hyosung Advanced Materials 135 0.01 2,570 Hyosung Heavy Industries 105 0.01 18,441 Hyundai Heavy Industries 1,504 0.15 37,906 Hyundia Engineering & Construction 1,569 0.16 47,243 LG Corporation 2,331 0.24 6,658 LG Innotek 660 0.07 38,464 Samsung C&T Corporation 3,257 0.33 27,620 Samsung Electro-Mechanics 3,064 0.31 27,510 Samsung SDI 4,487 0.45 12,200 SK Networks 38 –
Oil & Gas – 0.73% 20,523 Doosan Heavy Industries & Construction 201 0.02 24,585 GS Holdings 902 0.09 32,215 SK Innovation 4,286 0.43 22,488 S-Oil Corporation 1,850 0.19
Technology – 3.20% 115,430 LG Display 1,691 0.17 14,143 Naver Corporation 7,341 0.74 17,628 Samsung SDS 2,949 0.30 16,577 SK Holdings 3,008 0.30 292,297 SK Hynix 16,748 1.69
Telecommunications – 0.18% 9,992 SK Telecom 1,803 0.18
Utilities – 0.05% 13,426 Korea Gas Corporation 488 0.05
Total South Korea 116,069 11.71
Taiwan – 16.50% (31/08/17 – 14.32%) Basic Materials – 0.92% 6,224,000 China Steel 3,913 0.39 2,478,000 Nan Ya Plastics 5,282 0.53
Consumer Goods – 0.88% 89,640 Eclat Textile 838 0.08 1,703,000 Far Eastern New Century 1,525 0.15 134,000 Feng Tay Enterprises 624 0.06 106,000 Formosa Taffeta 95 0.01

Royal London Equity Funds ICVC 245
Royal London Emerging Markets Equity Tracker Fund
Taiwan – 16.50% (31/08/17 – 14.32%) – continued Consumer Goods – 0.88% – continued 14,000 Merida Industry 52 0.01 242,240 Standard Foods 316 0.03 841,000 Teco Electric & Machinery 471 0.05 2,501,000 Uni-President Enterprises 4,849 0.49
Consumer Services – 0.38% 1,025,000 China Airlines 242 0.02 863,350 Eva Airways 336 0.03 51,000 Hotai Motor Company 340 0.03 74,000 Nien Made Enterprise 440 0.04 307,000 President Chain Store 2,565 0.26
Financials – 2.00% 1,594,800 Chang Hwa Commercial Bank 761 0.08 8,915,000 CTBC Financial 4,801 0.49 5,128,544 E.Sun Financial 2,897 0.29 1,314,010 First Financial 675 0.07 3,378,000 Fubon Financial 4,298 0.43 486,000 Ruentex Development 421 0.04 1,007,000 Shin Kong Financial 305 0.03 1,887,000 SinoPac 529 0.05 5,266,394 Taishin Financial 1,906 0.19 2,358,440 Taiwan Business Bank 656 0.07 3,045,617 Taiwan Cooperative Financials 1,388 0.14 3,046,000 Yuanta Financial 1,183 0.12
Industrials – 0.73% 322,000 Catcher Technology 3,033 0.31 1,009,000 Delta Electronic Industry 3,096 0.31 912,089 Evergreen Marine Corporation 297 0.03 108,618 Hiwin Technologies 754 0.08
Technology – 10.61% 1,385,000 Acer 890 0.09 179,998 Advantech 940 0.09 1,654,000 ASE Industrial Holding 3,116 0.31 357,000 Asustek Computer 2,334 0.24 4,214,000 AU Optronics 1,399 0.14 313,901 Chicony Electronics 508 0.05 2,166,000 Compal Electronics 1,042 0.11 4,476,000 Innolux 1,278 0.13 1,286,000 Inventec 886 0.09 1,095,000 Lite-On Technology 1,013 0.10 918,005 Macronix International 759 0.08 759,000 MediaTek 4,772 0.48 320,000 Micro-Star International 850 0.09 1,395,000 Quanta Computer 1,842 0.19 12,383,000 Taiwan Semiconductor Manufacturing 79,251 8.00 6,124,000 United Microelectronics 2,654 0.27 420,000 Vanguard International Semiconductor 784 0.08 1,297,194 Wistron 703 0.07
Telecommunications – 0.98% 698,000 Asia Pacific Telecom 126 0.01 2,039,000 Chunghwa Telecom 5,516 0.56 842,000 Far EasTone Telecommunications 1,540 0.16 906,000 Taiwan Mobile 2,428 0.25
Total Taiwan 163,519 16.50
Thailand – 3.43% (31/08/17 – 3.09%) Basic Materials – 0.36% 1,110,900 Banpu 527 0.05 5,194,600 IRPC 843 0.08 1,172,000 PTT Global Chemical 2,245 0.23
Consumer Services – 0.66% 311,100 BEC World 56 0.01 2,650,300 CP All 4,205 0.42 1,951,500 Home Product Center 665 0.07 1,226,400 Minor International 1,132 0.11 327,600 Robinson Department Store 501 0.05
Financials – 1.02% 682,600 Central Pattana 1,320 0.13 919,100 Kasikornbank 4,559 0.46 1,654,400 Krung Thai Bank 751 0.08 906,700 Siam Commercial Bank (foreign) 3,144 0.32 6,189,500 TMB Bank 320 0.03
Healthcare – 0.20% 1,925,900 Bangkok Dusit Medical Services (foreign) 1,188 0.12 181,000 Bumrungrad Hospital (foreign) 770 0.08
Industrials – 0.71% 2,222,400 Airports of Thailand 3,474 0.35 57,700 Berli Jucker 78 0.01 3,208,500 BTS 694 0.07 356,500 BTS Warrants 0 – 223,500 Delta Electronics 365 0.04 61,100 Kce Electronics 65 0.01 216,500 Siam Cement 2,290 0.23
Oil & Gas – 0.12% 73,400 Energy Absolute 67 0.01 571,800 Thai Oil 1,126 0.11
Telecommunications – 0.25% 523,400 Advanced Info Service 2,473 0.25
Utilities – 0.11% 78,500 Electricity Generating 417 0.04 306,600 Glow Energy 676 0.07
Total Thailand 33,951 3.43
Turkey – 0.20% (31/08/17 – 0.40%) Consumer Goods – 0.05% 138,735 Arcelik 214 0.02 41,261 Coca-Cola Icecek 137 0.02 78,545 Ulker Biskuvi Sanayi 135 0.01
Financials – 0.06% 362,818 KOC 631 0.06
Oil & Gas – 0.09% 65,143 Tupras-Turkiye Petrol Rafine 893 0.09
Total Turkey 2,010 0.20
PORTFOLIO STATEMENT (CONTINUED)AS AT 31 AUGUST 2018
Bid-Market Total net Holding Investment value (£’000) assets (%)
Bid-Market Total net Holding Investment value (£’000) assets (%)
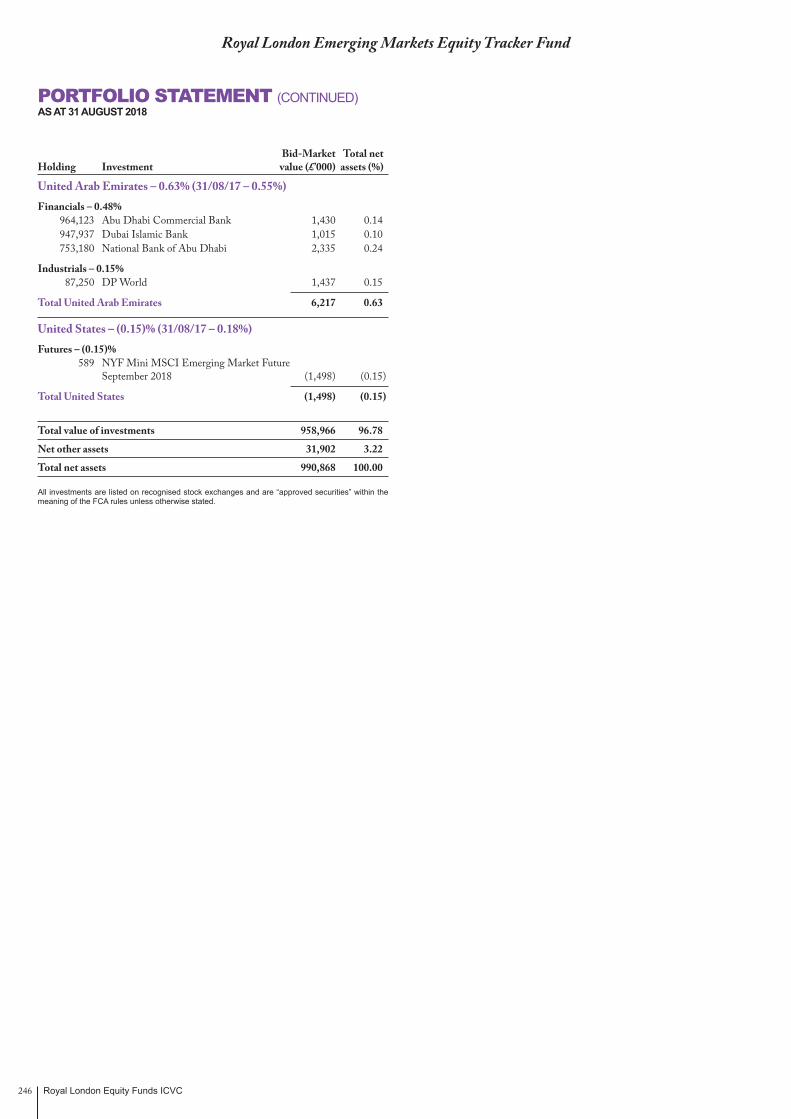
Royal London Equity Funds ICVC246
Royal London Emerging Markets Equity Tracker Fund
PORTFOLIO STATEMENT (CONTINUED)AS AT 31 AUGUST 2018
Bid-Market Total net Holding Investment value (£’000) assets (%)
United Arab Emirates – 0.63% (31/08/17 – 0.55%) Financials – 0.48% 964,123 Abu Dhabi Commercial Bank 1,430 0.14 947,937 Dubai Islamic Bank 1,015 0.10 753,180 National Bank of Abu Dhabi 2,335 0.24
Industrials – 0.15% 87,250 DP World 1,437 0.15
Total United Arab Emirates 6,217 0.63
United States – (0.15)% (31/08/17 – 0.18%) Futures – (0.15)% 589 NYF Mini MSCI Emerging Market Future
September 2018 (1,498) (0.15)
Total United States (1,498) (0.15)
Total value of investments 958,966 96.78
Net other assets 31,902 3.22
Total net assets 990,868 100.00
All investments are listed on recognised stock exchanges and are “approved securities” within the meaning of the FCA rules unless otherwise stated.
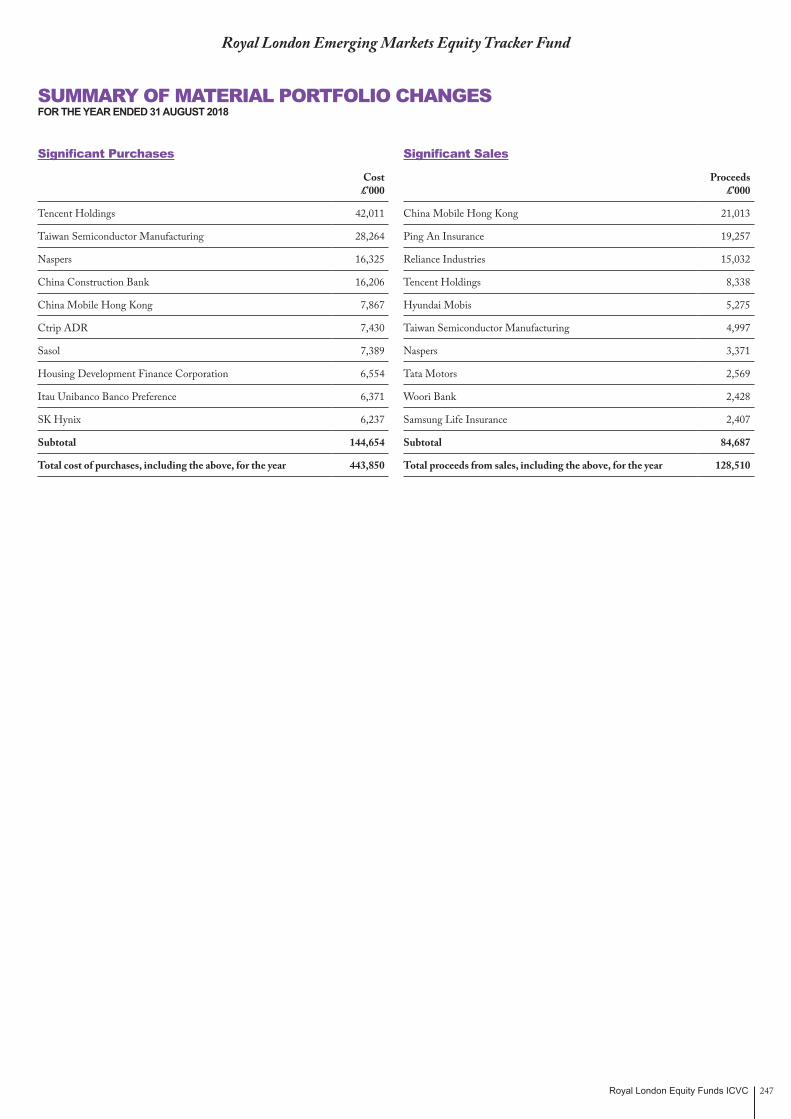
Royal London Equity Funds ICVC 247
Royal London Emerging Markets Equity Tracker Fund
SUMMARY OF MATERIAL PORTFOLIO CHANGESFOR THE YEAR ENDED 31 AUGUST 2018
Significant Purchases
Cost £’000
Tencent Holdings 42,011
Taiwan Semiconductor Manufacturing 28,264
Naspers 16,325
China Construction Bank 16,206
China Mobile Hong Kong 7,867
Ctrip ADR 7,430
Sasol 7,389
Housing Development Finance Corporation 6,554
Itau Unibanco Banco Preference 6,371
SK Hynix 6,237
Subtotal 144,654
Total cost of purchases, including the above, for the year 443,850
Significant Sales
Proceeds £’000
China Mobile Hong Kong 21,013
Ping An Insurance 19,257
Reliance Industries 15,032
Tencent Holdings 8,338
Hyundai Mobis 5,275
Taiwan Semiconductor Manufacturing 4,997
Naspers 3,371
Tata Motors 2,569
Woori Bank 2,428
Samsung Life Insurance 2,407
Subtotal 84,687
Total proceeds from sales, including the above, for the year 128,510

Royal London Equity Funds ICVC248
Royal London Emerging Markets Equity Tracker Fund
FINANCIAL STATEMENTS
Statement of Total Returnfor the year ended 31 August 2018
Note £’000
Year ended31 August 2018
£’000 £’000
Period from12 June 2017 to
31 August 2017* £’000
Income Net capital (losses)/gains 2 (22,425) 31,042 Revenue 3 25,148 4,700
Expenses 4 (616) (88)Interest payable and similar charges (78) (9)
Net revenue before taxation 24,454 4,603 Taxation 5 (2,843) (651)
Net revenue after taxation 21,611 3,952
Total (deficit)/return before distributions (814) 34,994 Distributions 6 (21,456) (3,867)
Change in net assets attributable to shareholders from investment activities (22,270) 31,127
Statement of Change in Net Assets Attributable to Shareholdersfor the year ended 31 August 2018
£’000
Year ended31 August 2018
£’000 £’000
Period from12 June 2017 to
31 August 2017* £’000
Opening net assets attributable to shareholders 687,994 –
Amounts receivable on creation of shares 412,678 650,119 Amounts payable on cancellation of shares (109,945) –
302,733 650,119
Dilution levy charged 742 –Change in net assets attributable to shareholders from investment activities (22,270) 31,127 Retained distribution on accumulation shares 21,669 6,748
Closing net assets attributable to shareholders 990,868 687,994
* The Fund launched on 12 June 2017.
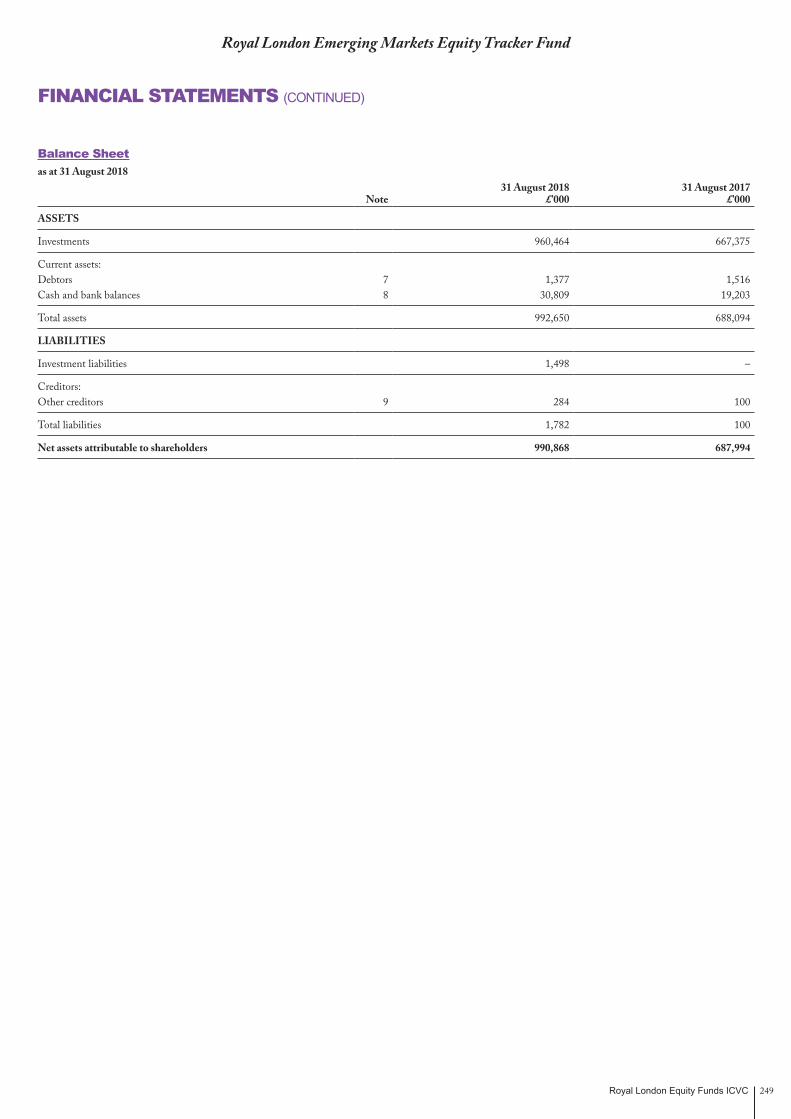
Royal London Equity Funds ICVC 249
Royal London Emerging Markets Equity Tracker Fund
FINANCIAL STATEMENTS (CONTINUED)
Balance Sheetas at 31 August 2018
Note31 August 2018
£’00031 August 2017
£’000
ASSETS
Investments 960,464 667,375
Current assets:Debtors 7 1,377 1,516 Cash and bank balances 8 30,809 19,203
Total assets 992,650 688,094
LIABILITIES
Investment liabilities 1,498 –
Creditors:Other creditors 9 284 100
Total liabilities 1,782 100
Net assets attributable to shareholders 990,868 687,994
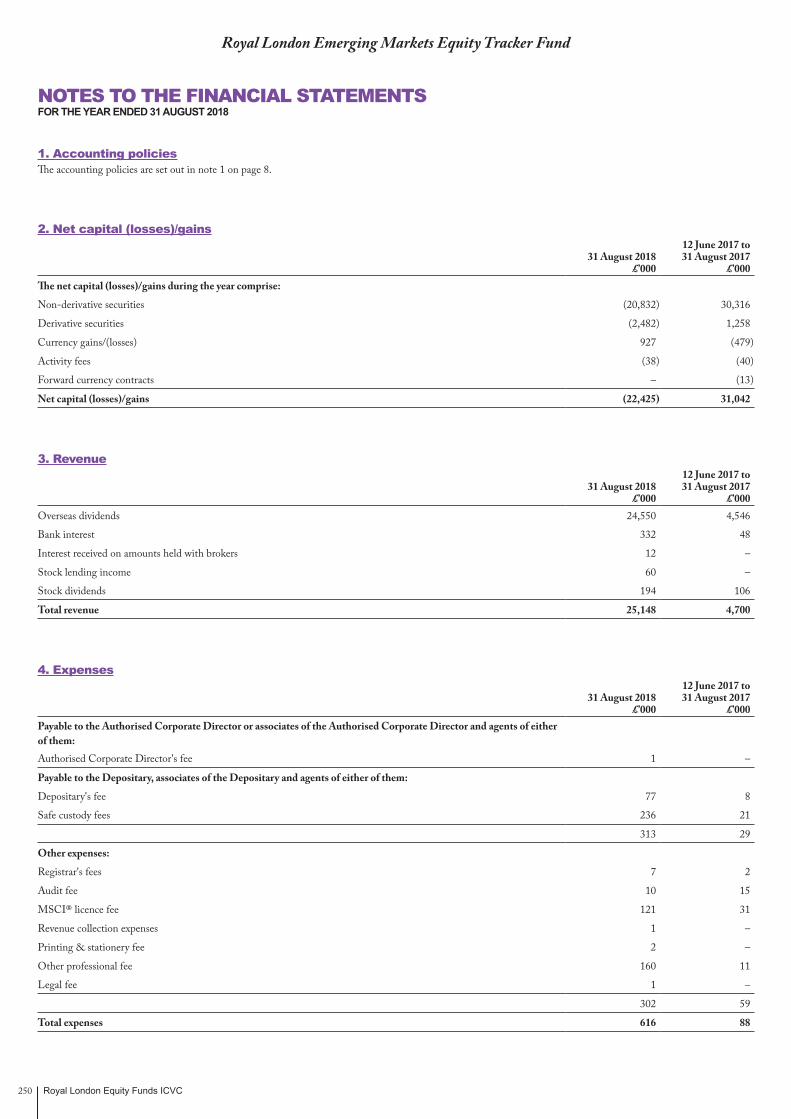
Royal London Equity Funds ICVC250
Royal London Emerging Markets Equity Tracker Fund
NOTES TO THE FINANCIAL STATEMENTSFOR THE YEAR ENDED 31 AUGUST 2018
1. Accounting policiesThe accounting policies are set out in note 1 on page 8.
2. Net capital (losses)/gains
31 August 2018£’000
12 June 2017 to 31 August 2017
£’000The net capital (losses)/gains during the year comprise:
Non-derivative securities (20,832) 30,316
Derivative securities (2,482) 1,258
Currency gains/(losses) 927 (479)
Activity fees (38) (40)
Forward currency contracts – (13)
Net capital (losses)/gains (22,425) 31,042
3. Revenue
31 August 2018£’000
12 June 2017 to 31 August 2017
£’000Overseas dividends 24,550 4,546
Bank interest 332 48
Interest received on amounts held with brokers 12 –
Stock lending income 60 –
Stock dividends 194 106
Total revenue 25,148 4,700
4. Expenses
31 August 2018£’000
12 June 2017 to 31 August 2017
£’000Payable to the Authorised Corporate Director or associates of the Authorised Corporate Director and agents of either of them:Authorised Corporate Director's fee 1 –
Payable to the Depositary, associates of the Depositary and agents of either of them:
Depositary's fee 77 8
Safe custody fees 236 21
313 29
Other expenses:
Registrar's fees 7 2
Audit fee 10 15
MSCI® licence fee 121 31
Revenue collection expenses 1 –
Printing & stationery fee 2 –
Other professional fee 160 11
Legal fee 1 –
302 59
Total expenses 616 88

Royal London Equity Funds ICVC 251
5. Taxationa) Analysis of charge for the year
31 August 2018£’000
12 June 2017 to 31 August 2017
£’000Corporation tax at 20% 445 56
Irrecoverable overseas tax 2,726 635
Double tax relief (328) (40)
Current tax charge for the year 2,843 651
b) Factors affecting the current tax charge for the year The tax assessed for the year is lower (31/08/17: lower) than the standard rate of corporation tax in the UK for an Open Ended Investment Company (20%).
The differences are explained below:
Net revenue before taxation 24,454 4,603
Corporation tax at 20% (31/08/17: 20%) 4,891 921
Effects of:
Revenue not subject to taxation (4,446) (865)
Irrecoverable overseas tax 2,726 635
Double tax relief (328) (40)
Current tax charge for the year 2,843 651
Authorised Open Ended Investment Companies are exempt from UK tax on capital gains, therefore any capital gains/(losses) are not included in the reconciliation above.
c) Provision for deferred taxThere was no provision required for deferred tax at the balance sheet date (31/08/17: same).
6. DistributionsThe distributions take account of income received on the issue of shares and income deducted on the cancellation of shares and comprise:
31 August 2018£’000
12 June 2017 to 31 August 2017
£’000Accumulation shares
Final 21,669 6,748
21,669 6,748
Add: Amounts deducted on cancellation of shares 1,262 –
Deduct: Amounts received on the creation of shares (1,475) (2,881)
Net distributions for the year 21,456 3,867
The difference between the net revenue after taxation and the distribution paid is as follows:
Net revenue after taxation 21,611 3,952
Stock dividend charged to capital (194) (106)
Tax relief on stock dividend 39 21
Net distributions for the year 21,456 3,867
Details of the distribution per share are set out on page 257.
Royal London Emerging Markets Equity Tracker Fund
NOTES TO THE FINANCIAL STATEMENTS (CONTINUED)FOR THE YEAR ENDED 31 AUGUST 2018
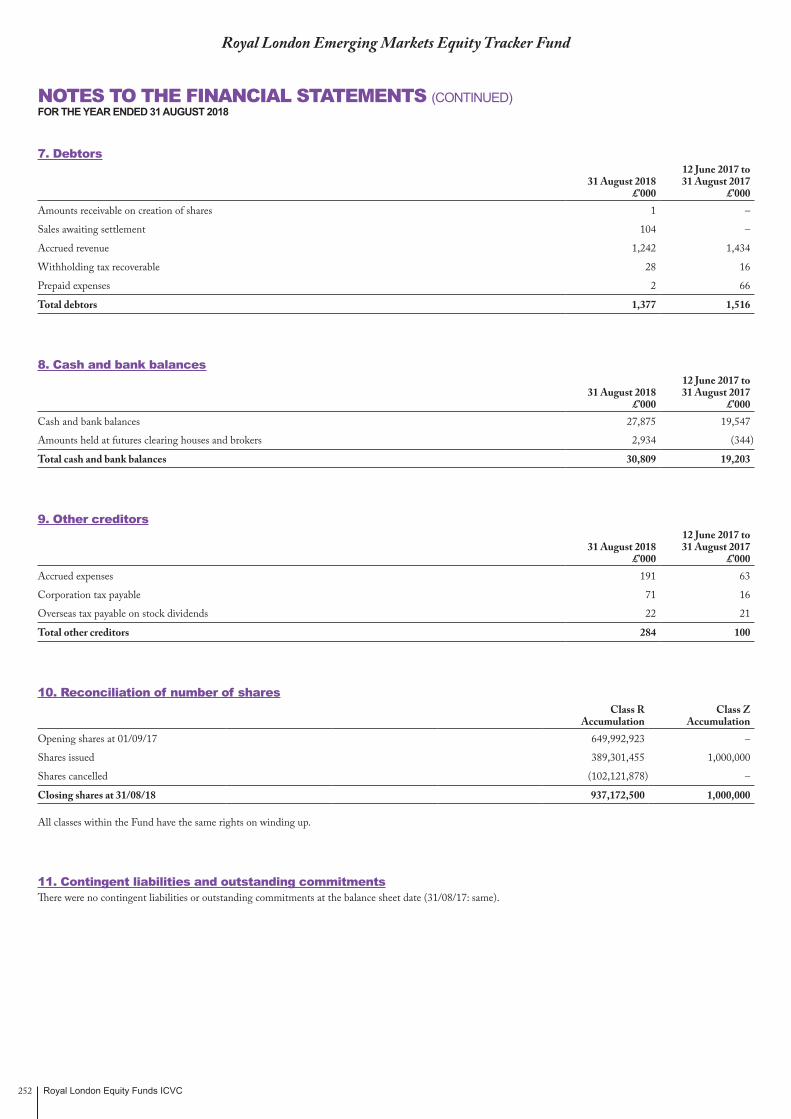
Royal London Equity Funds ICVC252
Royal London Emerging Markets Equity Tracker Fund
NOTES TO THE FINANCIAL STATEMENTS (CONTINUED)FOR THE YEAR ENDED 31 AUGUST 2018
7. Debtors
31 August 2018£’000
12 June 2017 to 31 August 2017
£’000Amounts receivable on creation of shares 1 –
Sales awaiting settlement 104 –
Accrued revenue 1,242 1,434
Withholding tax recoverable 28 16
Prepaid expenses 2 66
Total debtors 1,377 1,516
8. Cash and bank balances
31 August 2018£’000
12 June 2017 to 31 August 2017
£’000Cash and bank balances 27,875 19,547
Amounts held at futures clearing houses and brokers 2,934 (344)
Total cash and bank balances 30,809 19,203
9. Other creditors
31 August 2018£’000
12 June 2017 to 31 August 2017
£’000Accrued expenses 191 63
Corporation tax payable 71 16
Overseas tax payable on stock dividends 22 21
Total other creditors 284 100
10. Reconciliation of number of sharesClass R
AccumulationClass Z
AccumulationOpening shares at 01/09/17 649,992,923 –
Shares issued 389,301,455 1,000,000
Shares cancelled (102,121,878) –
Closing shares at 31/08/18 937,172,500 1,000,000
All classes within the Fund have the same rights on winding up.
11. Contingent liabilities and outstanding commitmentsThere were no contingent liabilities or outstanding commitments at the balance sheet date (31/08/17: same).
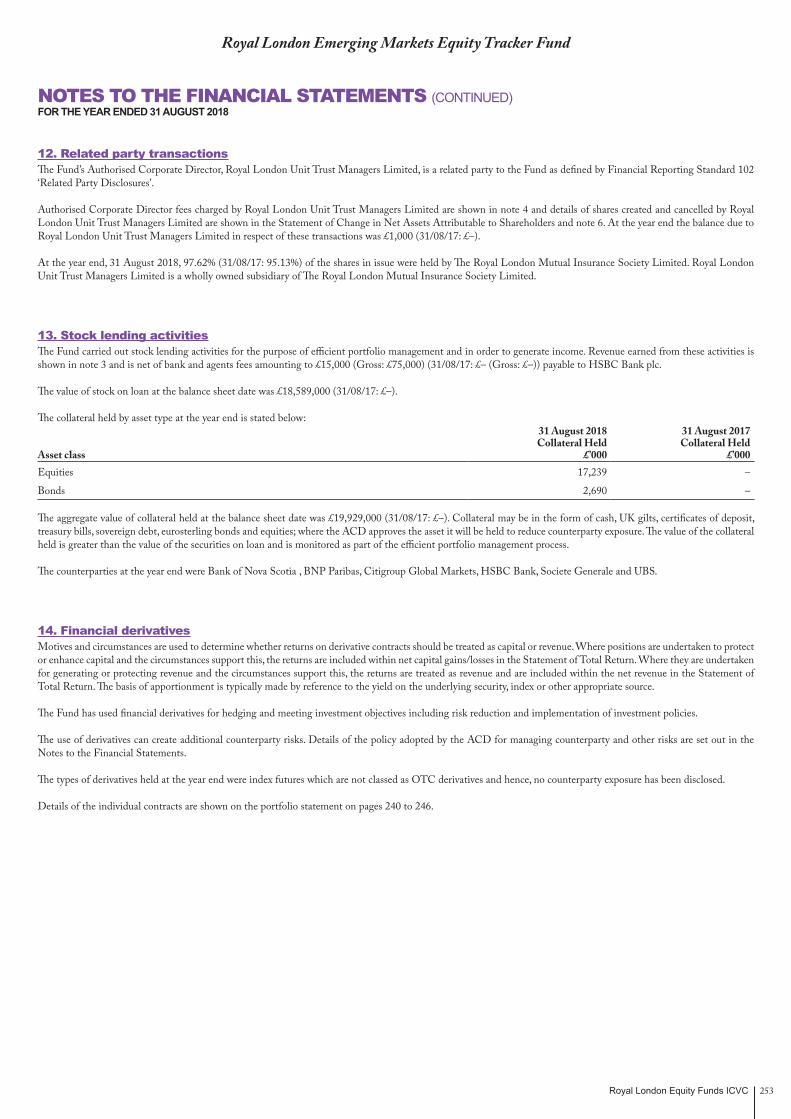
Royal London Equity Funds ICVC 253
12. Related party transactionsThe Fund’s Authorised Corporate Director, Royal London Unit Trust Managers Limited, is a related party to the Fund as defined by Financial Reporting Standard 102 ‘Related Party Disclosures’.
Authorised Corporate Director fees charged by Royal London Unit Trust Managers Limited are shown in note 4 and details of shares created and cancelled by Royal London Unit Trust Managers Limited are shown in the Statement of Change in Net Assets Attributable to Shareholders and note 6. At the year end the balance due to Royal London Unit Trust Managers Limited in respect of these transactions was £1,000 (31/08/17: £–).
At the year end, 31 August 2018, 97.62% (31/08/17: 95.13%) of the shares in issue were held by The Royal London Mutual Insurance Society Limited. Royal London Unit Trust Managers Limited is a wholly owned subsidiary of The Royal London Mutual Insurance Society Limited.
13. Stock lending activitiesThe Fund carried out stock lending activities for the purpose of efficient portfolio management and in order to generate income. Revenue earned from these activities is shown in note 3 and is net of bank and agents fees amounting to £15,000 (Gross: £75,000) (31/08/17: £– (Gross: £–)) payable to HSBC Bank plc.
The value of stock on loan at the balance sheet date was £18,589,000 (31/08/17: £–).
The collateral held by asset type at the year end is stated below:
Asset class
31 August 2018 Collateral Held
£’000
31 August 2017 Collateral Held
£’000Equities 17,239 –
Bonds 2,690 –
The aggregate value of collateral held at the balance sheet date was £19,929,000 (31/08/17: £–). Collateral may be in the form of cash, UK gilts, certificates of deposit, treasury bills, sovereign debt, eurosterling bonds and equities; where the ACD approves the asset it will be held to reduce counterparty exposure. The value of the collateral held is greater than the value of the securities on loan and is monitored as part of the efficient portfolio management process.
The counterparties at the year end were Bank of Nova Scotia , BNP Paribas, Citigroup Global Markets, HSBC Bank, Societe Generale and UBS.
14. Financial derivativesMotives and circumstances are used to determine whether returns on derivative contracts should be treated as capital or revenue. Where positions are undertaken to protect or enhance capital and the circumstances support this, the returns are included within net capital gains/losses in the Statement of Total Return. Where they are undertaken for generating or protecting revenue and the circumstances support this, the returns are treated as revenue and are included within the net revenue in the Statement of Total Return. The basis of apportionment is typically made by reference to the yield on the underlying security, index or other appropriate source.
The Fund has used financial derivatives for hedging and meeting investment objectives including risk reduction and implementation of investment policies.
The use of derivatives can create additional counterparty risks. Details of the policy adopted by the ACD for managing counterparty and other risks are set out in the Notes to the Financial Statements.
The types of derivatives held at the year end were index futures which are not classed as OTC derivatives and hence, no counterparty exposure has been disclosed.
Details of the individual contracts are shown on the portfolio statement on pages 240 to 246.
Royal London Emerging Markets Equity Tracker Fund
NOTES TO THE FINANCIAL STATEMENTS (CONTINUED)FOR THE YEAR ENDED 31 AUGUST 2018
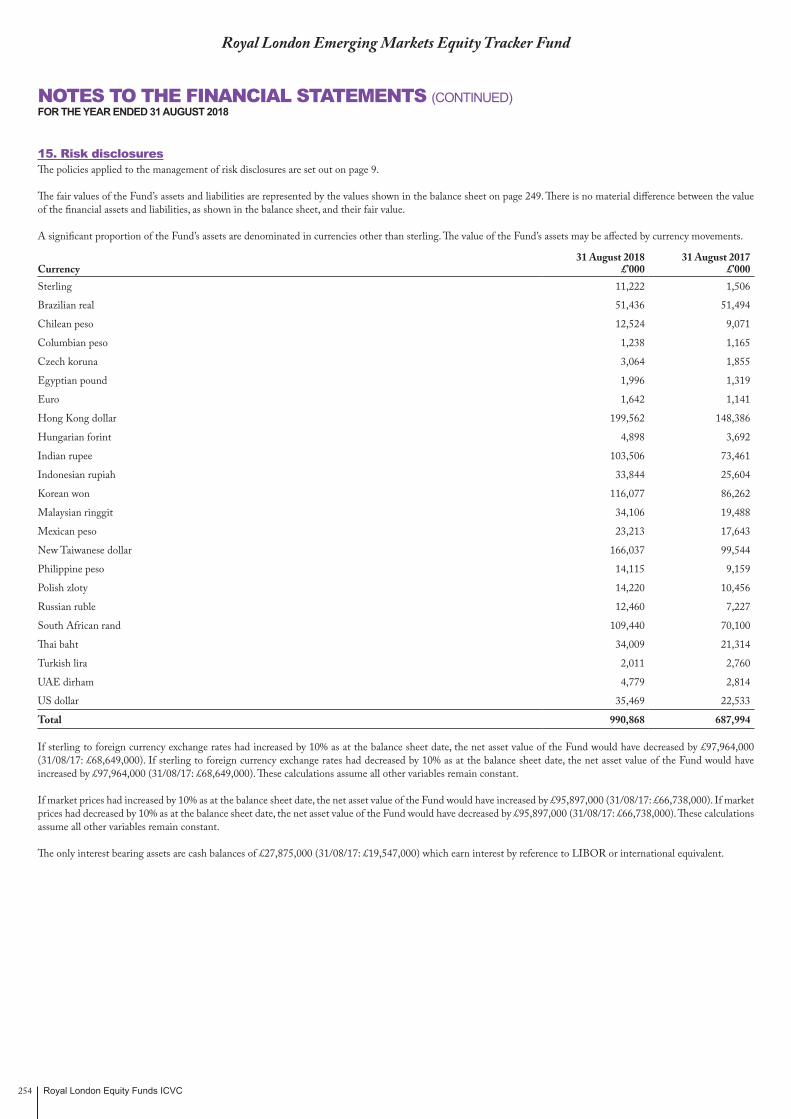
Royal London Equity Funds ICVC254
Royal London Emerging Markets Equity Tracker Fund
NOTES TO THE FINANCIAL STATEMENTS (CONTINUED)FOR THE YEAR ENDED 31 AUGUST 2018
15. Risk disclosuresThe policies applied to the management of risk disclosures are set out on page 9.
The fair values of the Fund’s assets and liabilities are represented by the values shown in the balance sheet on page 249. There is no material difference between the value of the financial assets and liabilities, as shown in the balance sheet, and their fair value.
A significant proportion of the Fund’s assets are denominated in currencies other than sterling. The value of the Fund’s assets may be affected by currency movements.
Currency31 August 2018
£’00031 August 2017
£’000Sterling 11,222 1,506
Brazilian real 51,436 51,494
Chilean peso 12,524 9,071
Columbian peso 1,238 1,165
Czech koruna 3,064 1,855
Egyptian pound 1,996 1,319
Euro 1,642 1,141
Hong Kong dollar 199,562 148,386
Hungarian forint 4,898 3,692
Indian rupee 103,506 73,461
Indonesian rupiah 33,844 25,604
Korean won 116,077 86,262
Malaysian ringgit 34,106 19,488
Mexican peso 23,213 17,643
New Taiwanese dollar 166,037 99,544
Philippine peso 14,115 9,159
Polish zloty 14,220 10,456
Russian ruble 12,460 7,227
South African rand 109,440 70,100
Thai baht 34,009 21,314
Turkish lira 2,011 2,760
UAE dirham 4,779 2,814
US dollar 35,469 22,533
Total 990,868 687,994
If sterling to foreign currency exchange rates had increased by 10% as at the balance sheet date, the net asset value of the Fund would have decreased by £97,964,000 (31/08/17: £68,649,000). If sterling to foreign currency exchange rates had decreased by 10% as at the balance sheet date, the net asset value of the Fund would have increased by £97,964,000 (31/08/17: £68,649,000). These calculations assume all other variables remain constant.
If market prices had increased by 10% as at the balance sheet date, the net asset value of the Fund would have increased by £95,897,000 (31/08/17: £66,738,000). If market prices had decreased by 10% as at the balance sheet date, the net asset value of the Fund would have decreased by £95,897,000 (31/08/17: £66,738,000). These calculations assume all other variables remain constant.
The only interest bearing assets are cash balances of £27,875,000 (31/08/17: £19,547,000) which earn interest by reference to LIBOR or international equivalent.
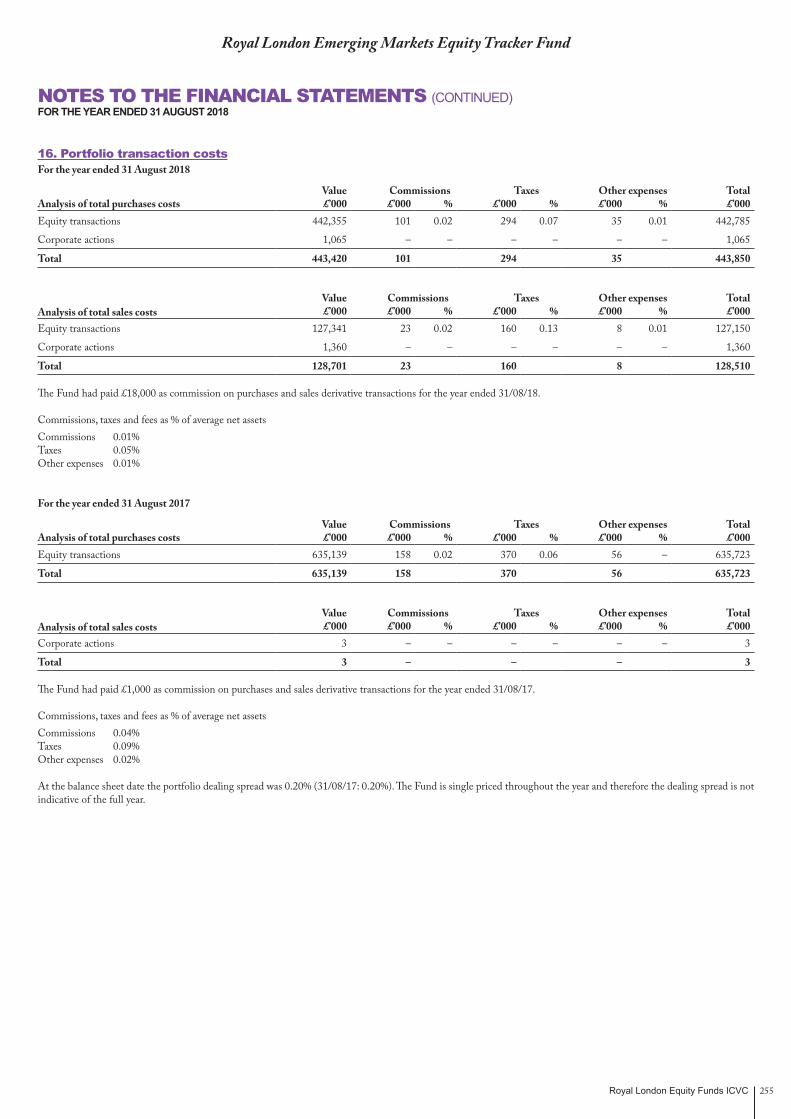
Royal London Equity Funds ICVC 255
16. Portfolio transaction costsFor the year ended 31 August 2018
Value Commissions Taxes Other expenses TotalAnalysis of total purchases costs £’000 £’000 % £’000 % £’000 % £’000Equity transactions 442,355 101 0.02 294 0.07 35 0.01 442,785
Corporate actions 1,065 – – – – – – 1,065
Total 443,420 101 294 35 443,850
Value Commissions Taxes Other expenses TotalAnalysis of total sales costs £’000 £’000 % £’000 % £’000 % £’000Equity transactions 127,341 23 0.02 160 0.13 8 0.01 127,150
Corporate actions 1,360 – – – – – – 1,360
Total 128,701 23 160 8 128,510
The Fund had paid £18,000 as commission on purchases and sales derivative transactions for the year ended 31/08/18.
Commissions, taxes and fees as % of average net assetsCommissions 0.01%Taxes 0.05%Other expenses 0.01%
For the year ended 31 August 2017
Value Commissions Taxes Other expenses TotalAnalysis of total purchases costs £’000 £’000 % £’000 % £’000 % £’000Equity transactions 635,139 158 0.02 370 0.06 56 – 635,723
Total 635,139 158 370 56 635,723
Value Commissions Taxes Other expenses TotalAnalysis of total sales costs £’000 £’000 % £’000 % £’000 % £’000Corporate actions 3 – – – – – – 3
Total 3 – – – 3
The Fund had paid £1,000 as commission on purchases and sales derivative transactions for the year ended 31/08/17.
Commissions, taxes and fees as % of average net assetsCommissions 0.04%Taxes 0.09%Other expenses 0.02%
At the balance sheet date the portfolio dealing spread was 0.20% (31/08/17: 0.20%). The Fund is single priced throughout the year and therefore the dealing spread is not indicative of the full year.
Royal London Emerging Markets Equity Tracker Fund
NOTES TO THE FINANCIAL STATEMENTS (CONTINUED)FOR THE YEAR ENDED 31 AUGUST 2018

Royal London Equity Funds ICVC256
Royal London Emerging Markets Equity Tracker Fund
NOTES TO THE FINANCIAL STATEMENTS (CONTINUED)FOR THE YEAR ENDED 31 AUGUST 2018
17. Fair value of investmentsThe fair values of the Fund’s assets and liabilities are represented by the values shown in the balance sheet. There is no material difference between the value of the financial assets and liabilities, as shown in the balance sheet, and their fair value.
The fair value of investments has been determined using the following hierarchy:
Category 1 The unadjusted quoted price in an active market for identical assets or liabilities that the entity can access at the measurement date.
Category 2 Inputs other than quoted prices included within Level 1 that are observable (i.e. developed using market data) for the asset or liability, either directly or indirectly.
Category 3 Inputs are unobservable (i.e. for which market data is unavailable) for the asset or liability.
For the year ended 31 August 2018 Category 1 2 3 TotalInvestments £’000 £’000 £’000 £’000
Equities 960,464 – – 960,464
Total 960,464 – – 960,464
Investment liabilities £’000 £’000 £’000 £’000
Derivatives (1,498) – – (1,498)
Total (1,498) – – (1,498)
For the year ended 31 August 2017 Category 1 2 3 TotalInvestments £’000 £’000 £’000 £’000
Equities 666,117 – – 666,117
Derivatives 1,258 – – 1,258
Total 667,375 – – 667,375
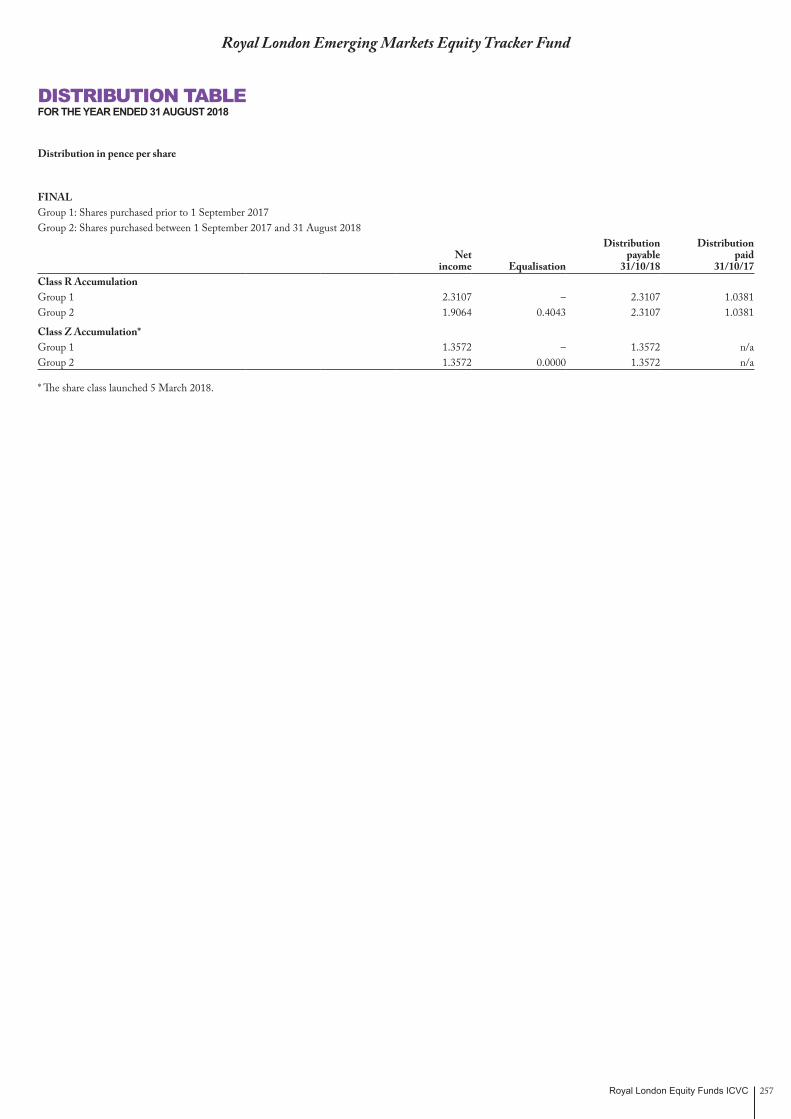
Royal London Equity Funds ICVC 257
Royal London Emerging Markets Equity Tracker Fund
DISTRIBUTION TABLEFOR THE YEAR ENDED 31 AUGUST 2018
Distribution in pence per share
FINALGroup 1: Shares purchased prior to 1 September 2017Group 2: Shares purchased between 1 September 2017 and 31 August 2018
Distribution DistributionNet payable paid
income Equalisation 31/10/18 31/10/17Class R AccumulationGroup 1 2.3107 – 2.3107 1.0381Group 2 1.9064 0.4043 2.3107 1.0381
Class Z Accumulation*Group 1 1.3572 – 1.3572 n/aGroup 2 1.3572 0.0000 1.3572 n/a
* The share class launched 5 March 2018.

Royal London Equity Funds ICVC258
Royal London Global Equity Diversified Fund
Fund PerformanceFor the period 10 October 2017 to 31 August 2018
The Fund was launched in October 2017. This means that it lacks a full year of performance history, and as a result, it is not possible to display annual performance data. However, the return from the Fund was ahead of the wider global equity market during the six months through 31 August 2018, using the MSCI World Net Total Return Index as a guide. Stock selection contributed to this performance.
Market and Portfolio CommentaryGlobal economic growth was broadly supportive for equities during the period under review, although expansion slowed noticeably outside the US in 2018. Corporate earnings also tended to be generally positive, particularly in the US following tax cuts. However, concern about protectionism was a negative theme, as the US and China maintained heated rhetoric on trade and imposed tariffs on some imported products. Political developments in Europe also were problematic, underlining the continued loss of support for mainstream parties and stronger backing for more extreme views; German and Italian elections ended with no clear outcome, and an openly eurosceptic and anti-immigrant government took office in Italy. The US Federal Reserve (Fed) continued to raise its benchmark interest rate at a measured pace; elsewhere, central banks were in no hurry to tighten policy. The dollar strengthened during the period as a whole, as the gap between policy rates in the US and other countries widened.
The allocations to Amazon, Five Below and Costco Wholesale contributed to returns. Shares of Amazon rose sharply as the company continued to see strong growth in revenue from areas such as its Prime subscription service and cloud computing that are more profitable than its core online retail business. Amazon also broadened its expansion into other areas of the economy with the takeover of Internet pharmacy Pillpack, after acquiring supermarket chain Whole Foods Market in 2017. Five Below, a US discount retailer aimed at younger shoppers, recorded further very strong sales gains, helped by a focus on trends among teenagers and by continued expansion of its store network. The company also announced a stock repurchase programme. US warehouse club Costco Wholesale continued to benefit from low prices as well as a steady membership renewal rate, maintaining a stream of membership fees that helped to bolster profit.
Exxon Mobil, Comcast and Goodyear Tire & Rubber were prominent detractors from Fund performance. Exxon repeatedly missed targets for profit and production of oil and gas during the review period; the company also suffered from a perceived focus on investment in its business at the same time that competitors were returning money to investors with buybacks and higher dividends. Comcast became involved in bidding contests for media assets being sold by Rupert Murdoch’s 21st Century Fox and for satellite broadcaster Sky. Comcast offered in June to pay $65 billion for the Fox assets, but subsequently withdrew; at the end of the review period, the company was still a contender to acquire Sky and had offered to pay $34 billion. Goodyear was undermined by the background of trade-related tensions, including China’s imposition of tariffs on vehicles imported from the US. The company issued a profit warning in July, in the same week that carmakers General Motors, Ford and Fiat Chrysler Automotive lowered their own outlooks for the market.
Fund activity including establishing a position in Tate & Lyle (financed by selling the holding of Sysco), while shares of Comcast were sold against New York Times and World Wrestling Entertainment. East Japan Railway, Novo Nordisk and National Australia Bank were among allocations that were increased to invest cash flows.
The Fund aims to deliver long-term capital growth by investing in a diversified portfolio of global equities, and will typically hold 175 to 225 stocks. The equities in which the Fund invests may be from both developed and emerging market countries and from any sector, industry or market capitalisation.
Investment OutlookOur base case is for global growth to remain at a rate of 3.5% to 4%, slowing through 2020, with inflation pressures building, but not strongly. We expect central banks to remain cautious, with the Fed continuing to tighten monetary policy at a gradual rate, and the European Central Bank and the Bank of Japan maintaining their loose policies.
Peter Rutter Fund Manager31 August 2018Royal London Asset Management
The views expressed are the author’s own and do not constitute investment advice and are not an indication of future fund performance. Portfolio holdings are subject to change, for information only and are not investment recommendations.
Source: Royal London Asset Management, unless otherwise stated.
MANAGER’S INVESTMENT REPORT
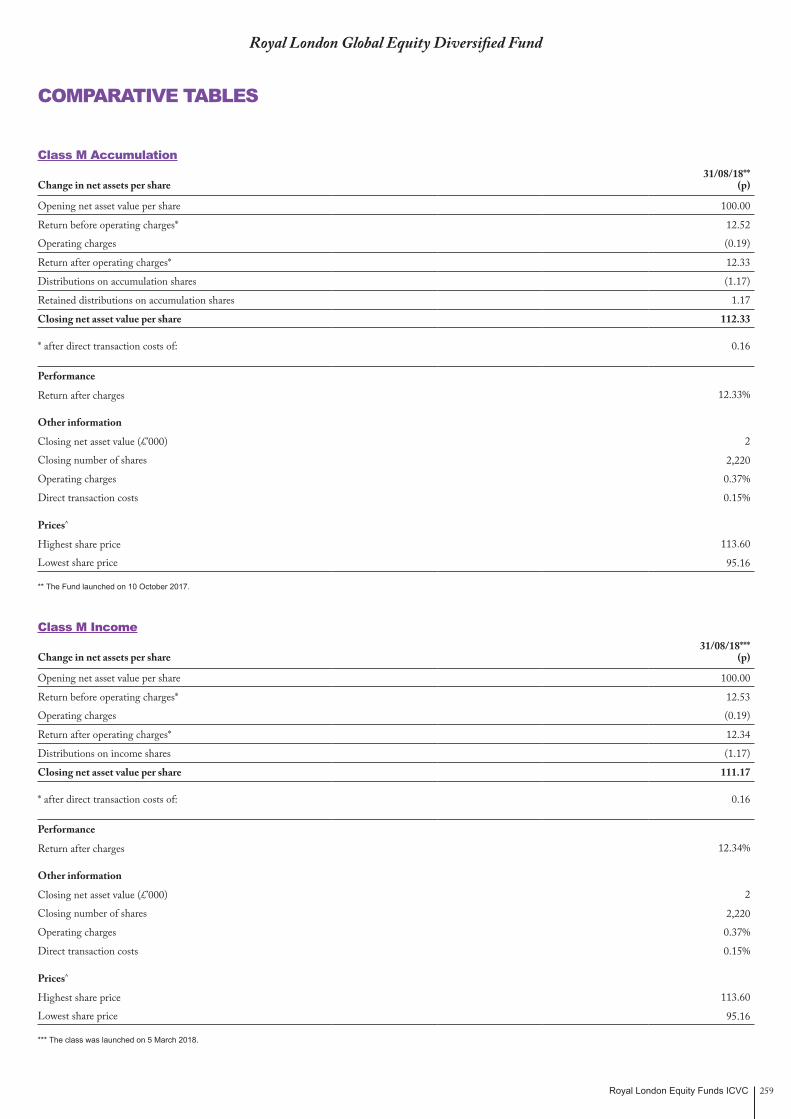
Royal London Equity Funds ICVC 259
Royal London Global Equity Diversified Fund
COMPARATIVE TABLES
Class M Accumulation31/08/18**
Change in net assets per share (p)
Opening net asset value per share 100.00
Return before operating charges* 12.52
Operating charges (0.19)
Return after operating charges* 12.33
Distributions on accumulation shares (1.17)
Retained distributions on accumulation shares 1.17
Closing net asset value per share 112.33
* after direct transaction costs of: 0.16
Performance
Return after charges 12.33%
Other information
Closing net asset value (£’000) 2
Closing number of shares 2,220
Operating charges 0.37%
Direct transaction costs 0.15%
Prices^
Highest share price 113.60
Lowest share price 95.16
** The Fund launched on 10 October 2017.
Class M Income31/08/18***
Change in net assets per share (p)
Opening net asset value per share 100.00
Return before operating charges* 12.53
Operating charges (0.19)
Return after operating charges* 12.34
Distributions on income shares (1.17)
Closing net asset value per share 111.17
* after direct transaction costs of: 0.16
Performance
Return after charges 12.34%
Other information
Closing net asset value (£’000) 2
Closing number of shares 2,220
Operating charges 0.37%
Direct transaction costs 0.15%
Prices^
Highest share price 113.60
Lowest share price 95.16
*** The class was launched on 5 March 2018.

Royal London Equity Funds ICVC260
Royal London Global Equity Diversified Fund
COMPARATIVE TABLES (CONTINUED)
Class R Accumulation31/08/18**
Change in net assets per share (p)
Opening net asset value per share 100.00
Return before operating charges* 12.38
Operating charges (0.09)
Return after operating charges* 12.29
Distributions on accumulation shares (1.83)
Retained distributions on accumulation shares 1.83
Closing net asset value per share 112.29
* after direct transaction costs of: 0.16
Performance
Return after charges 12.29%
Other information
Closing net asset value (£’000) 130,641
Closing number of shares 116,337,457
Operating charges 0.09%
Direct transaction costs 0.15%
Prices^
Highest share price 113.50
Lowest share price 95.01
** The class was launched on 10 October 2017.^ The high and low prices disclosed are the high and low prices for the accounting period and not the calendar year. The net asset value per share price is based on the net asset value in the published financial statements and may be different due to the prior year end accounting adjustments.
It should be remembered that past performance is not a reliable indicator of future performance and that the value of shares, and the income derived from them, can vary.

Royal London Equity Funds ICVC 261
Royal London Global Equity Diversified Fund
Equities – 99.42% Australia – 1.97% Basic Materials – 0.41% 74,415 Northern Star Resources 288 0.22 24,983 Orica 244 0.19
Consumer Services – 0.31% 14,450 Wesfarmers 412 0.31
Financials – 1.25% 8,730 Commonwealth Bank of Australia 346 0.26 125,614 General Property 361 0.28 7,989 Macquarie 573 0.44 22,255 National Australia Bank 351 0.27
Total Australia 2,575 1.97
Belgium – 0.62% Consumer Services – 0.28% 7,939 Colruyt 364 0.28
Financials – 0.34% 8,126 KBC Group 444 0.34
Total Belgium 808 0.62
Canada – 3.25% Consumer Goods – 0.29% 12,263 Spin Master Corporation 374 0.29
Financials – 1.02% 8,153 Bank of Nova Scotia 363 0.28 14,495 Great-West Lifeco 272 0.21 15,095 Toronto Dominion Bank 700 0.53
Oil & Gas – 1.47% 20,878 Canadian Natural Resources 548 0.42 29,042 Inter Pipeline 410 0.31 30,469 Suncor Energy 965 0.74
Technology – 0.47% 1,045 Constellation Software 612 0.47
Total Canada 4,244 3.25
Denmark – 1.48% Consumer Goods – 0.29% 8,814 Bakkafrost 388 0.29
Healthcare – 0.83% 13,003 Lundbeck 587 0.45 13,033 Novo Nordisk ‘B’ 495 0.38
Industrials – 0.36% 6,499 DSV 469 0.36
Total Denmark 1,939 1.48
Finland – 0.68% Basic Materials – 0.48% 21,083 UPM-Kymmene 626 0.48
Financials – 0.20% 6,602 Sampo Oyj ‘A’ 260 0.20
Total Finland 886 0.68
France – 2.63% Consumer Goods – 0.82% 2,316 LVMH 626 0.48 3,662 Pernod-Ricard 445 0.34
Consumer Services – 0.25% 4,035 Sodexo 324 0.25
Financials – 0.66% 21,400 AXA 417 0.32 9,759 BNP Paribas 442 0.34
Industrials – 0.90% 8,750 Legrand 508 0.39 6,773 Safran 681 0.51
Total France 3,443 2.63
Germany – 3.00% Basic Materials – 1.09% 11,266 BASF 802 0.61 8,790 Bayer 634 0.48
Consumer Goods – 1.13% 3,126 Adidas 601 0.46 8,317 Daimler 414 0.32 4,623 Henkel Preference 455 0.35
Healthcare – 0.24% 5,326 Fresenius 313 0.24
Industrials – 0.24% 3,322 Krones 311 0.24
Technology – 0.30% 4,975 Bechtle 399 0.30
Total Germany 3,929 3.00
Hong Kong – 1.28% Financials – 0.79% 290,000 Hang Lung Properties 441 0.33 78,500 Link 601 0.46
Telecommunications – 0.19% 599,000 PCCW 245 0.19
Utilities – 0.30% 43,500 CLP Holdings 392 0.30
Total Hong Kong 1,679 1.28
Ireland – 0.99% Consumer Services – 0.18% 3,316 Paddy Power 233 0.18
Healthcare – 0.45% 7,877 Medtronic 584 0.45
Industrials – 0.36% 18,662 CRH 476 0.36
Total Ireland 1,293 0.99
PORTFOLIO STATEMENTAS AT 31 AUGUST 2018
Bid-Market Total net Holding Investment value (£’000) assets (%)
Bid-Market Total net Holding Investment value (£’000) assets (%)
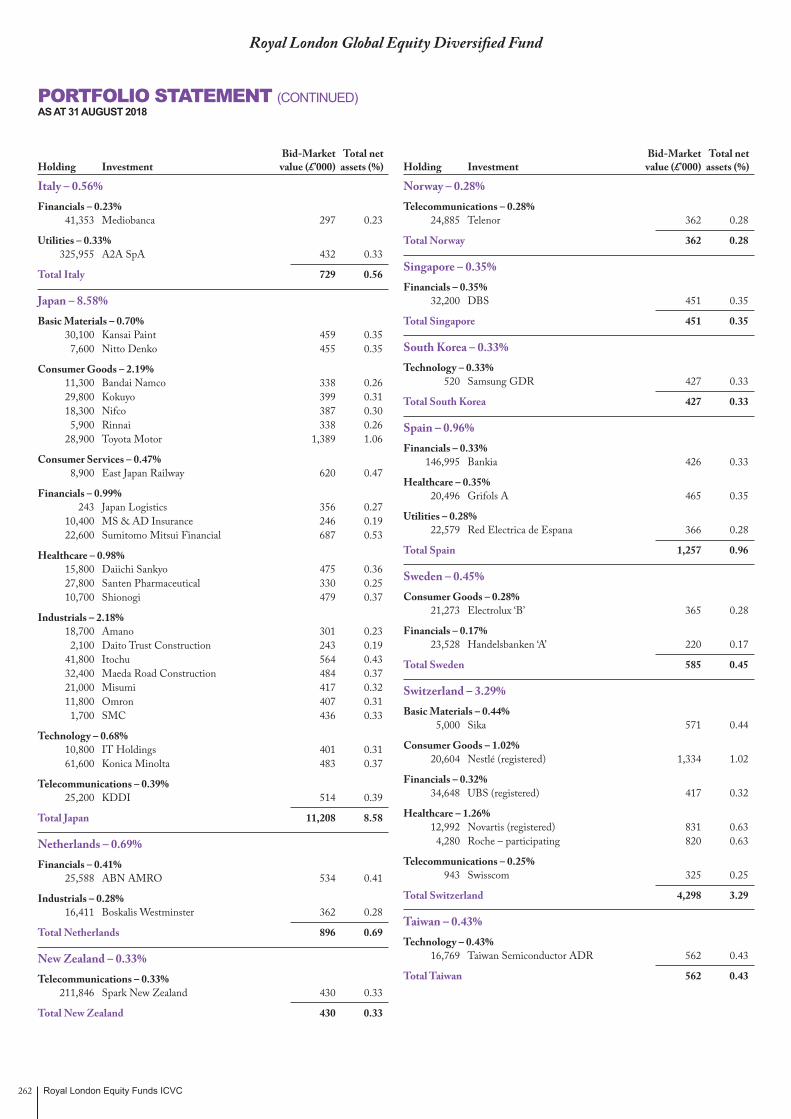
Royal London Equity Funds ICVC262
Royal London Global Equity Diversified Fund
Italy – 0.56% Financials – 0.23% 41,353 Mediobanca 297 0.23
Utilities – 0.33% 325,955 A2A SpA 432 0.33
Total Italy 729 0.56
Japan – 8.58% Basic Materials – 0.70% 30,100 Kansai Paint 459 0.35 7,600 Nitto Denko 455 0.35
Consumer Goods – 2.19% 11,300 Bandai Namco 338 0.26 29,800 Kokuyo 399 0.31 18,300 Nifco 387 0.30 5,900 Rinnai 338 0.26 28,900 Toyota Motor 1,389 1.06
Consumer Services – 0.47% 8,900 East Japan Railway 620 0.47
Financials – 0.99% 243 Japan Logistics 356 0.27 10,400 MS & AD Insurance 246 0.19 22,600 Sumitomo Mitsui Financial 687 0.53
Healthcare – 0.98% 15,800 Daiichi Sankyo 475 0.36 27,800 Santen Pharmaceutical 330 0.25 10,700 Shionogi 479 0.37
Industrials – 2.18% 18,700 Amano 301 0.23 2,100 Daito Trust Construction 243 0.19 41,800 Itochu 564 0.43 32,400 Maeda Road Construction 484 0.37 21,000 Misumi 417 0.32 11,800 Omron 407 0.31 1,700 SMC 436 0.33
Technology – 0.68% 10,800 IT Holdings 401 0.31 61,600 Konica Minolta 483 0.37
Telecommunications – 0.39% 25,200 KDDI 514 0.39
Total Japan 11,208 8.58
Netherlands – 0.69% Financials – 0.41% 25,588 ABN AMRO 534 0.41
Industrials – 0.28% 16,411 Boskalis Westminster 362 0.28
Total Netherlands 896 0.69
New Zealand – 0.33% Telecommunications – 0.33% 211,846 Spark New Zealand 430 0.33
Total New Zealand 430 0.33
PORTFOLIO STATEMENT (CONTINUED)AS AT 31 AUGUST 2018
Bid-Market Total net Holding Investment value (£’000) assets (%)
Bid-Market Total net Holding Investment value (£’000) assets (%)
Norway – 0.28% Telecommunications – 0.28% 24,885 Telenor 362 0.28
Total Norway 362 0.28
Singapore – 0.35% Financials – 0.35% 32,200 DBS 451 0.35
Total Singapore 451 0.35
South Korea – 0.33% Technology – 0.33% 520 Samsung GDR 427 0.33
Total South Korea 427 0.33
Spain – 0.96% Financials – 0.33% 146,995 Bankia 426 0.33
Healthcare – 0.35% 20,496 Grifols A 465 0.35
Utilities – 0.28% 22,579 Red Electrica de Espana 366 0.28
Total Spain 1,257 0.96
Sweden – 0.45% Consumer Goods – 0.28% 21,273 Electrolux ‘B’ 365 0.28
Financials – 0.17% 23,528 Handelsbanken ‘A’ 220 0.17
Total Sweden 585 0.45
Switzerland – 3.29% Basic Materials – 0.44% 5,000 Sika 571 0.44
Consumer Goods – 1.02% 20,604 Nestlé (registered) 1,334 1.02
Financials – 0.32% 34,648 UBS (registered) 417 0.32
Healthcare – 1.26% 12,992 Novartis (registered) 831 0.63 4,280 Roche – participating 820 0.63
Telecommunications – 0.25% 943 Swisscom 325 0.25
Total Switzerland 4,298 3.29
Taiwan – 0.43% Technology – 0.43% 16,769 Taiwan Semiconductor ADR 562 0.43
Total Taiwan 562 0.43

Royal London Equity Funds ICVC 263
Royal London Global Equity Diversified Fund
PORTFOLIO STATEMENT (CONTINUED)AS AT 31 AUGUST 2018
Bid-Market Total net Holding Investment value (£’000) assets (%)
Bid-Market Total net Holding Investment value (£’000) assets (%)
United Kingdom – 6.30% Basic Materials – 0.91% 72,409 BHP Billiton 1,190 0.91
Consumer Goods – 1.75% 12,518 Berkeley 456 0.35 17,381 Diageo 468 0.36 14,614 Imperial Brands 401 0.30 6,920 Reckitt Benckiser 454 0.35 76,154 Tate & Lyle 511 0.39
Financials – 1.77% 16,197 Admiral 337 0.26 100,925 Aviva 489 0.37 18,840 Close Brothers 301 0.23 64,225 HSBC 430 0.33 461,158 Lloyds Banking Group 273 0.21 10,312 London Stock Exchange 477 0.37
Healthcare – 0.38% 33,263 ABCAM 504 0.38
Industrials – 0.36% 8,558 Renishaw 466 0.36
Oil & Gas – 0.82% 196,215 BP 1,074 0.82
Utilities – 0.31% 49,730 National Grid 403 0.31
Total United Kingdom 8,234 6.30
United States – 60.97% Basic Materials – 1.35% 15,397 International Paper 606 0.46 12,797 Southern Copper 430 0.33 20,799 Steel Dynamics 732 0.56
Consumer Goods – 3.15% 15,931 Church & Dwight 693 0.53 10,492 Colgate-Palmolive 536 0.41 23,570 Goodyear Tire & Rubber 411 0.31 4,954 Lear Corporation 618 0.47 11,216 Philip Morris International 672 0.51 5,128 Snap-on 697 0.53 10,562 Tyson Foods 510 0.39
Consumer Services – 9.68% 3,385 Allegiant Travel 355 0.27 2,141 Amazon.com 3,316 2.54 9,377 Bright Horizons 861 0.66 6,300 Casey’s General Stores 553 0.42 6,094 Costco Wholesale 1,093 0.84 6,823 CVS Health 395 0.30 5,775 Five Below 517 0.40 7,654 Home Depot 1,182 0.90 2,010 NetFlix 569 0.44 22,870 New York Times 409 0.31 8,602 Omnicom 459 0.35 11,962 PayPal 850 0.65 11,243 TJX Companies 951 0.73 2,982 Ulta Beauty 596 0.46 8,056 WWE 542 0.41
United States – 60.97% – continued Financials – 11.89% 4,874 Affiliated Managers 548 0.42 11,298 Aflac 402 0.31 8,137 American Express 663 0.51 6,372 American Tower 731 0.56 3,986 AvalonBay Communities 562 0.43 9,263 Bank of the Ozarks 288 0.22 8,646 Berkshire Hathaway ‘B’ 1,387 1.06 1,747 BlackRock 644 0.49 3,894 Goldman Sachs 712 0.54 2,455 Jones Lang LaSalle 288 0.22 29,574 JP Morgan Chase 2,605 1.99 2,230 MarketAxess Holdings 326 0.25 5,187 PNC Financial Services 573 0.44 7,779 Primerica 731 0.56 14,888 Progressive 773 0.59 9,188 State Street 614 0.47 15,997 US Bancorp 666 0.51 15,936 Visa ‘A’ 1,800 1.38 27,250 Wells Fargo 1,225 0.94
Healthcare – 7.22% 11,204 Abbvie 827 0.63 2,258 Biogen IDEC 614 0.47 7,985 Cantel Medical 596 0.46 12,691 Eli Lilly 1,031 0.79 9,217 Express Scripts ‘A’ 624 0.48 8,441 Gilead Sciences 492 0.38 6,170 HCA Holdings 637 0.49 6,604 Henry Schein 395 0.30 14,940 Johnson & Johnson 1,547 1.18 8,187 Mylan 246 0.19 5,241 Thermo Fisher Scientific 964 0.74 7,009 UnitedHealth 1,446 1.11
Industrials – 6.20% 7,347 AGCO Holdings 337 0.26 9,089 Ametek 538 0.41 9,542 Danaher 760 0.58 9,713 Fortive 628 0.48 7,121 Honeywell International 871 0.67 3,873 Littelfuse 666 0.51 5,864 Old Dominion Freight Line 688 0.53 12,487 Paccar 657 0.50 6,041 Raytheon 926 0.71 4,055 Roper Technologies 931 0.71 9,508 Union Pacific 1,101 0.84
Oil & Gas – 4.55% 46,731 Exxon Mobil 2,881 2.21 9,436 Helmerich & Payne 476 0.36 30,501 Kinder Morgan 415 0.32 19,670 Newfield Exploration 413 0.32 11,207 Occidental Petroleum 689 0.53 21,586 OGE Energy 612 0.47 9,220 Schlumberger 448 0.34
Technology – 14.12% 1,648 Alphabet ‘A’ 1,561 1.19 1,532 Alphabet ‘C’ 1,436 1.10 6,034 Ansys 863 0.66 18,149 Apple 3,177 2.43 410 Booking Holdings 616 0.47 3,989 Broadcom Corporation 672 0.51
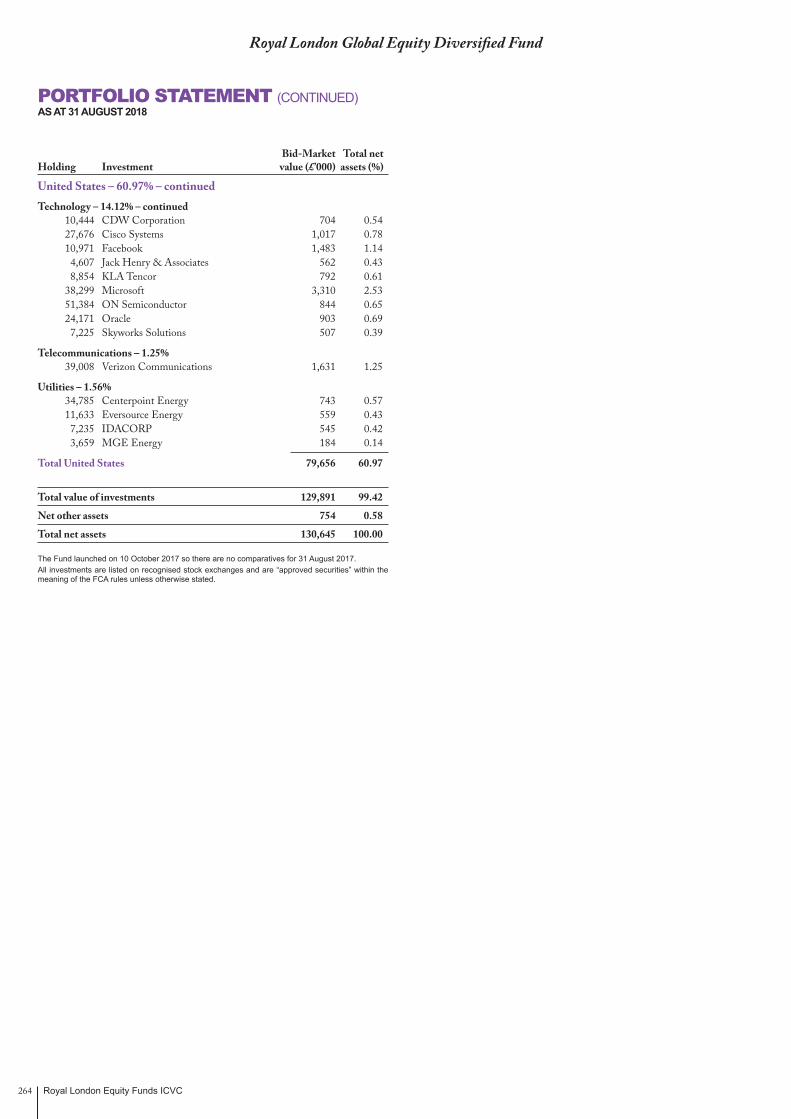
Royal London Equity Funds ICVC264
Royal London Global Equity Diversified Fund
PORTFOLIO STATEMENT (CONTINUED)AS AT 31 AUGUST 2018
Bid-Market Total net Holding Investment value (£’000) assets (%)
United States – 60.97% – continued Technology – 14.12% – continued 10,444 CDW Corporation 704 0.54 27,676 Cisco Systems 1,017 0.78 10,971 Facebook 1,483 1.14 4,607 Jack Henry & Associates 562 0.43 8,854 KLA Tencor 792 0.61 38,299 Microsoft 3,310 2.53 51,384 ON Semiconductor 844 0.65 24,171 Oracle 903 0.69 7,225 Skyworks Solutions 507 0.39
Telecommunications – 1.25% 39,008 Verizon Communications 1,631 1.25
Utilities – 1.56% 34,785 Centerpoint Energy 743 0.57 11,633 Eversource Energy 559 0.43 7,235 IDACORP 545 0.42 3,659 MGE Energy 184 0.14
Total United States 79,656 60.97
Total value of investments 129,891 99.42
Net other assets 754 0.58
Total net assets 130,645 100.00
The Fund launched on 10 October 2017 so there are no comparatives for 31 August 2017.All investments are listed on recognised stock exchanges and are “approved securities” within the meaning of the FCA rules unless otherwise stated.
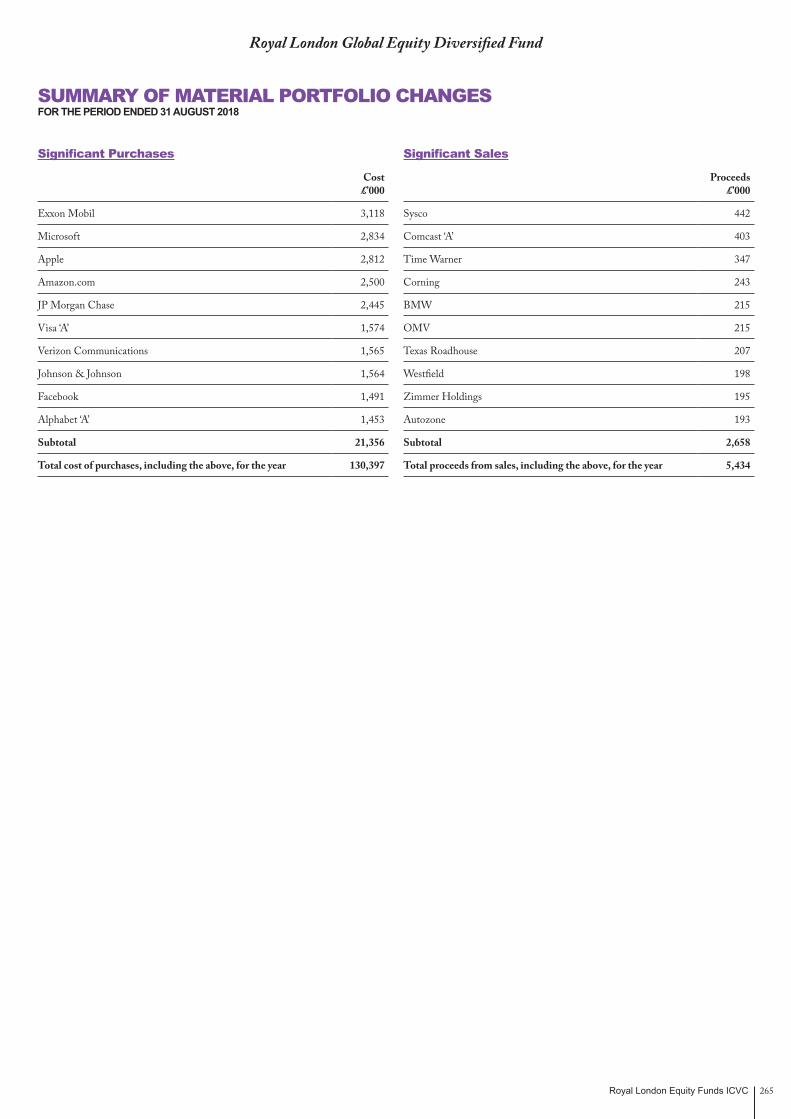
Royal London Equity Funds ICVC 265
Royal London Global Equity Diversified Fund
SUMMARY OF MATERIAL PORTFOLIO CHANGESFOR THE PERIOD ENDED 31 AUGUST 2018
Significant Purchases
Cost £’000
Exxon Mobil 3,118
Microsoft 2,834
Apple 2,812
Amazon.com 2,500
JP Morgan Chase 2,445
Visa ‘A’ 1,574
Verizon Communications 1,565
Johnson & Johnson 1,564
Facebook 1,491
Alphabet ‘A’ 1,453
Subtotal 21,356
Total cost of purchases, including the above, for the year 130,397
Significant Sales
Proceeds £’000
Sysco 442
Comcast ‘A’ 403
Time Warner 347
Corning 243
BMW 215
OMV 215
Texas Roadhouse 207
Westfield 198
Zimmer Holdings 195
Autozone 193
Subtotal 2,658
Total proceeds from sales, including the above, for the year 5,434

Royal London Equity Funds ICVC266
Royal London Global Equity Diversified Fund
FINANCIAL STATEMENTS
Statement of Total Returnfor the period 10 October 2017 to 31 August 2018
Note £’000
Period from10 October 2017 to
31 August 2018*£’000
Income Net capital gains 2 5,108 Revenue 3 1,125
Expenses 4 (39)Interest payable and similar charges (1)
Net revenue before taxation 1,085 Taxation 5 (120)
Net revenue after taxation 965
Total return before distributions 6,073 Distributions 6 (965)
Change in net assets attributable to shareholders from investment activities 5,108
Statement of Change in Net Assets Attributable to Shareholdersfor the period 10 October 2017 to 31 August 2018
£’000
Period from10 October 2017 to
31 August 2018*£’000
Opening net assets attributable to shareholders –
Amounts receivable on creation of shares 123,759 Amounts payable on cancellation of shares (16)
123,743
Change in net assets attributable to shareholders from investment activities 5,108
Retained distributions on accumulation shares 1,794
Closing net assets attributable to shareholders 130,645
* The Fund launched on 10 October 2017 so there are no comparatives for 31 August 2017.

Royal London Equity Funds ICVC 267
Royal London Global Equity Diversified Fund
FINANCIAL STATEMENTS (CONTINUED)
Balance Sheetas at 31 August 2018
Note31 August 2018*
£’000
ASSETS
Investments 129,891
Current assets:Debtors 7 30,151 Cash and bank balances 8 253
Total assets 160,295
LIABILITIES
Creditors:Other creditors 9 29,650
Total liabilities 29,650
Net assets attributable to shareholders 130,645
* The Fund launched on 10 October 2017 so there are no comparatives for 31 August 2017.
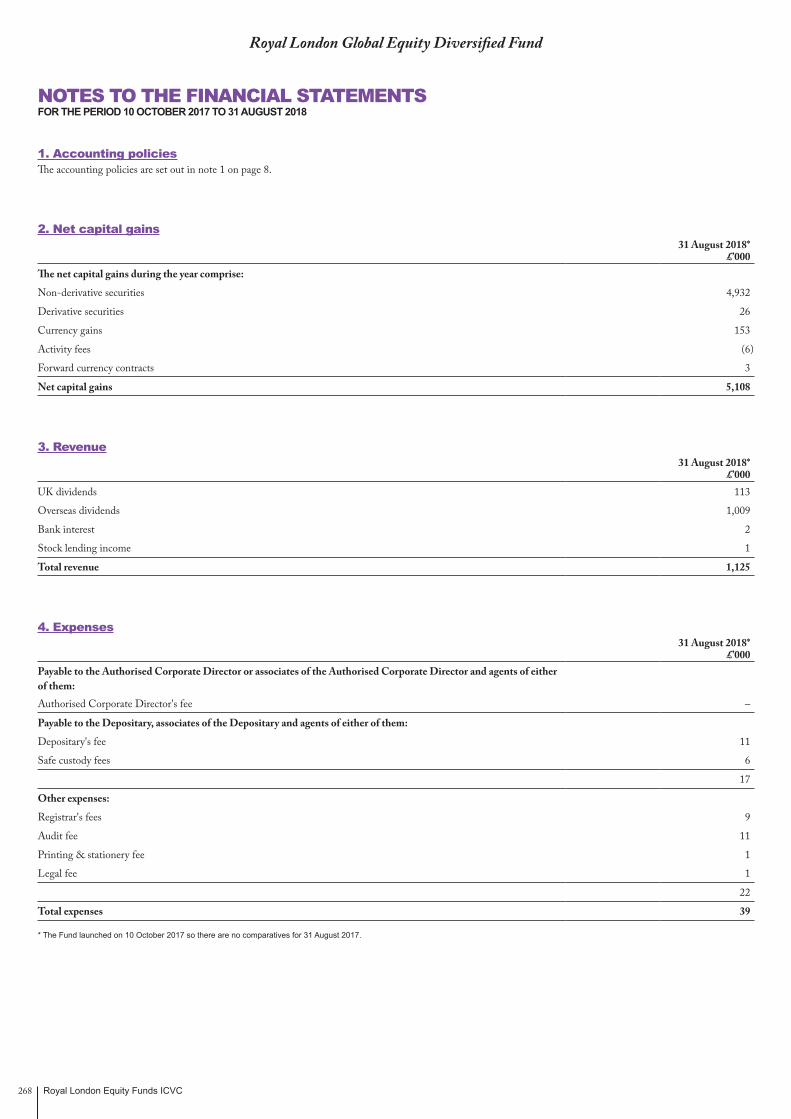
Royal London Equity Funds ICVC268
1. Accounting policiesThe accounting policies are set out in note 1 on page 8.
2. Net capital gains31 August 2018*
£’000The net capital gains during the year comprise:
Non-derivative securities 4,932
Derivative securities 26
Currency gains 153
Activity fees (6)
Forward currency contracts 3
Net capital gains 5,108
3. Revenue31 August 2018*
£’000UK dividends 113
Overseas dividends 1,009
Bank interest 2
Stock lending income 1
Total revenue 1,125
4. Expenses31 August 2018*
£’000Payable to the Authorised Corporate Director or associates of the Authorised Corporate Director and agents of either of them:Authorised Corporate Director's fee –
Payable to the Depositary, associates of the Depositary and agents of either of them:
Depositary's fee 11
Safe custody fees 6
17
Other expenses:
Registrar's fees 9
Audit fee 11
Printing & stationery fee 1
Legal fee 1
22
Total expenses 39
* The Fund launched on 10 October 2017 so there are no comparatives for 31 August 2017.
NOTES TO THE FINANCIAL STATEMENTSFOR THE PERIOD 10 OCTOBER 2017 TO 31 AUGUST 2018
Royal London Global Equity Diversified Fund
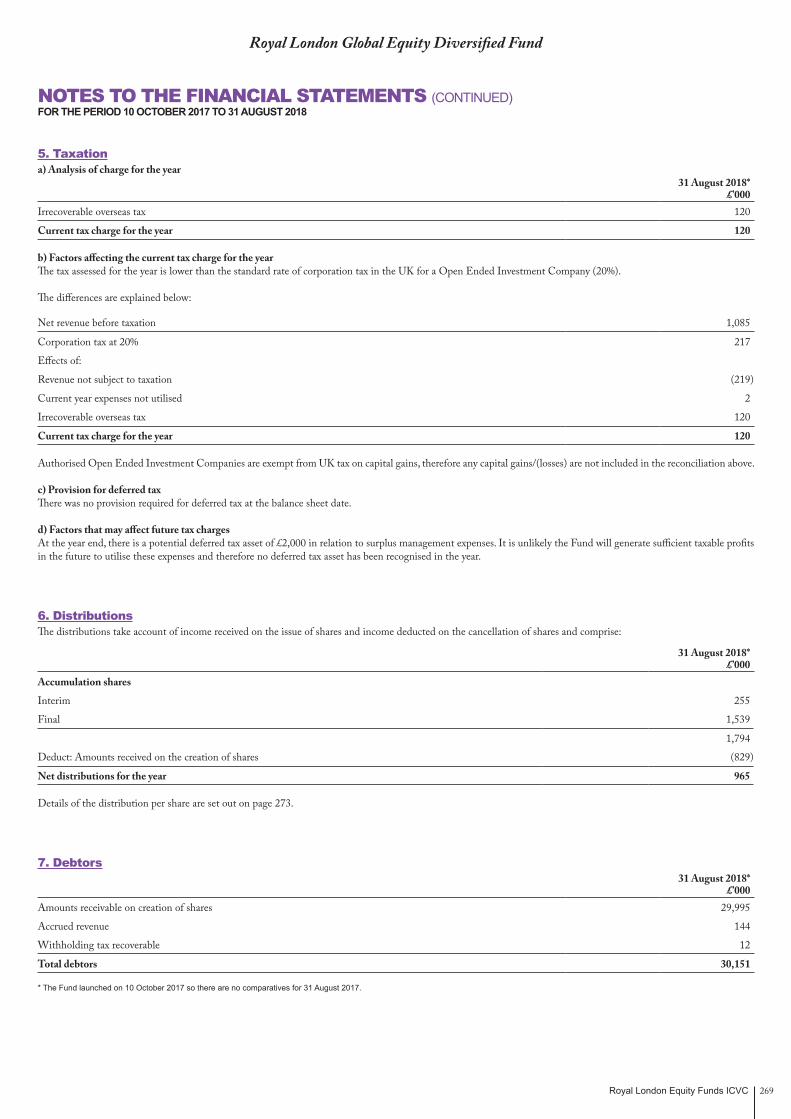
Royal London Equity Funds ICVC 269
5. Taxationa) Analysis of charge for the year
31 August 2018*£’000
Irrecoverable overseas tax 120
Current tax charge for the year 120
b) Factors affecting the current tax charge for the year The tax assessed for the year is lower than the standard rate of corporation tax in the UK for a Open Ended Investment Company (20%).
The differences are explained below:
Net revenue before taxation 1,085
Corporation tax at 20% 217
Effects of:
Revenue not subject to taxation (219)
Current year expenses not utilised 2
Irrecoverable overseas tax 120
Current tax charge for the year 120
Authorised Open Ended Investment Companies are exempt from UK tax on capital gains, therefore any capital gains/(losses) are not included in the reconciliation above.
c) Provision for deferred taxThere was no provision required for deferred tax at the balance sheet date.
d) Factors that may affect future tax chargesAt the year end, there is a potential deferred tax asset of £2,000 in relation to surplus management expenses. It is unlikely the Fund will generate sufficient taxable profits in the future to utilise these expenses and therefore no deferred tax asset has been recognised in the year.
6. DistributionsThe distributions take account of income received on the issue of shares and income deducted on the cancellation of shares and comprise:
31 August 2018* £’000
Accumulation shares
Interim 255
Final 1,539
1,794
Deduct: Amounts received on the creation of shares (829)
Net distributions for the year 965
Details of the distribution per share are set out on page 273.
7. Debtors31 August 2018*
£’000Amounts receivable on creation of shares 29,995
Accrued revenue 144
Withholding tax recoverable 12
Total debtors 30,151
* The Fund launched on 10 October 2017 so there are no comparatives for 31 August 2017.
NOTES TO THE FINANCIAL STATEMENTS (CONTINUED)FOR THE PERIOD 10 OCTOBER 2017 TO 31 AUGUST 2018
Royal London Global Equity Diversified Fund
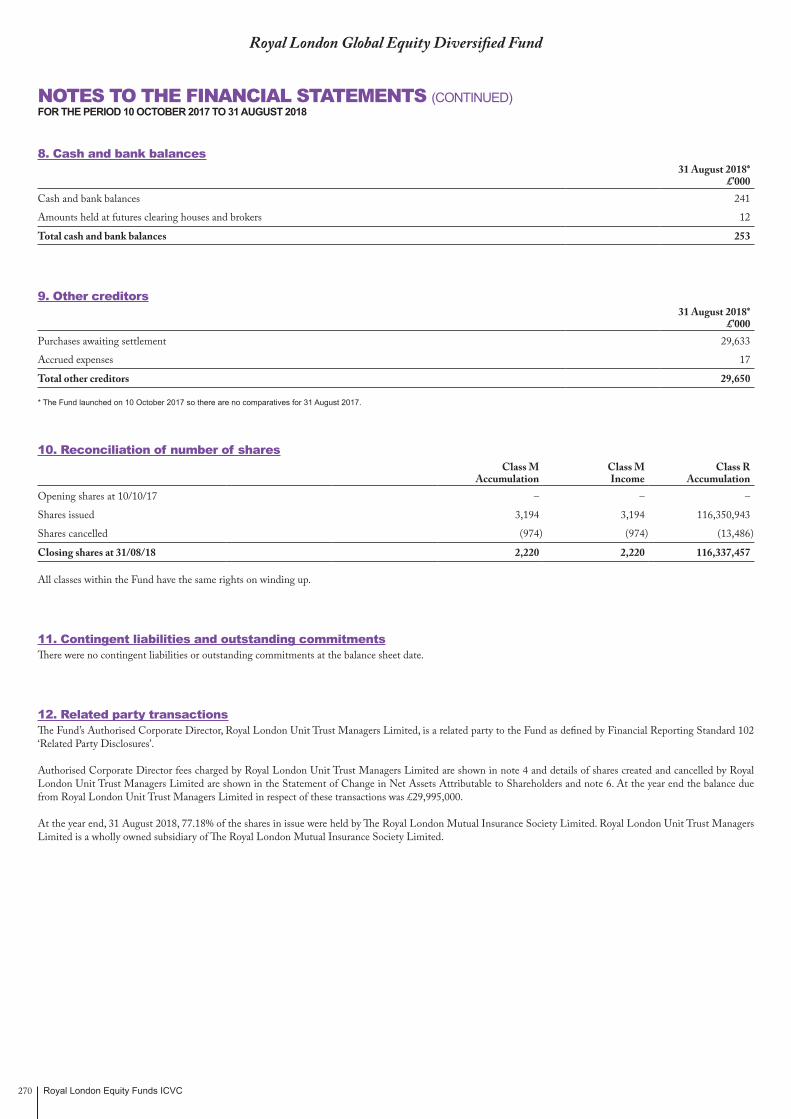
Royal London Equity Funds ICVC270
8. Cash and bank balances31 August 2018*
£’000Cash and bank balances 241
Amounts held at futures clearing houses and brokers 12
Total cash and bank balances 253
9. Other creditors31 August 2018*
£’000Purchases awaiting settlement 29,633
Accrued expenses 17
Total other creditors 29,650
* The Fund launched on 10 October 2017 so there are no comparatives for 31 August 2017.
10. Reconciliation of number of sharesClass M
AccumulationClass MIncome
Class RAccumulation
Opening shares at 10/10/17 – – –
Shares issued 3,194 3,194 116,350,943
Shares cancelled (974) (974) (13,486)
Closing shares at 31/08/18 2,220 2,220 116,337,457
All classes within the Fund have the same rights on winding up.
11. Contingent liabilities and outstanding commitmentsThere were no contingent liabilities or outstanding commitments at the balance sheet date.
12. Related party transactionsThe Fund’s Authorised Corporate Director, Royal London Unit Trust Managers Limited, is a related party to the Fund as defined by Financial Reporting Standard 102 ‘Related Party Disclosures’.
Authorised Corporate Director fees charged by Royal London Unit Trust Managers Limited are shown in note 4 and details of shares created and cancelled by Royal London Unit Trust Managers Limited are shown in the Statement of Change in Net Assets Attributable to Shareholders and note 6. At the year end the balance due from Royal London Unit Trust Managers Limited in respect of these transactions was £29,995,000.
At the year end, 31 August 2018, 77.18% of the shares in issue were held by The Royal London Mutual Insurance Society Limited. Royal London Unit Trust Managers Limited is a wholly owned subsidiary of The Royal London Mutual Insurance Society Limited.
NOTES TO THE FINANCIAL STATEMENTS (CONTINUED)FOR THE PERIOD 10 OCTOBER 2017 TO 31 AUGUST 2018
Royal London Global Equity Diversified Fund
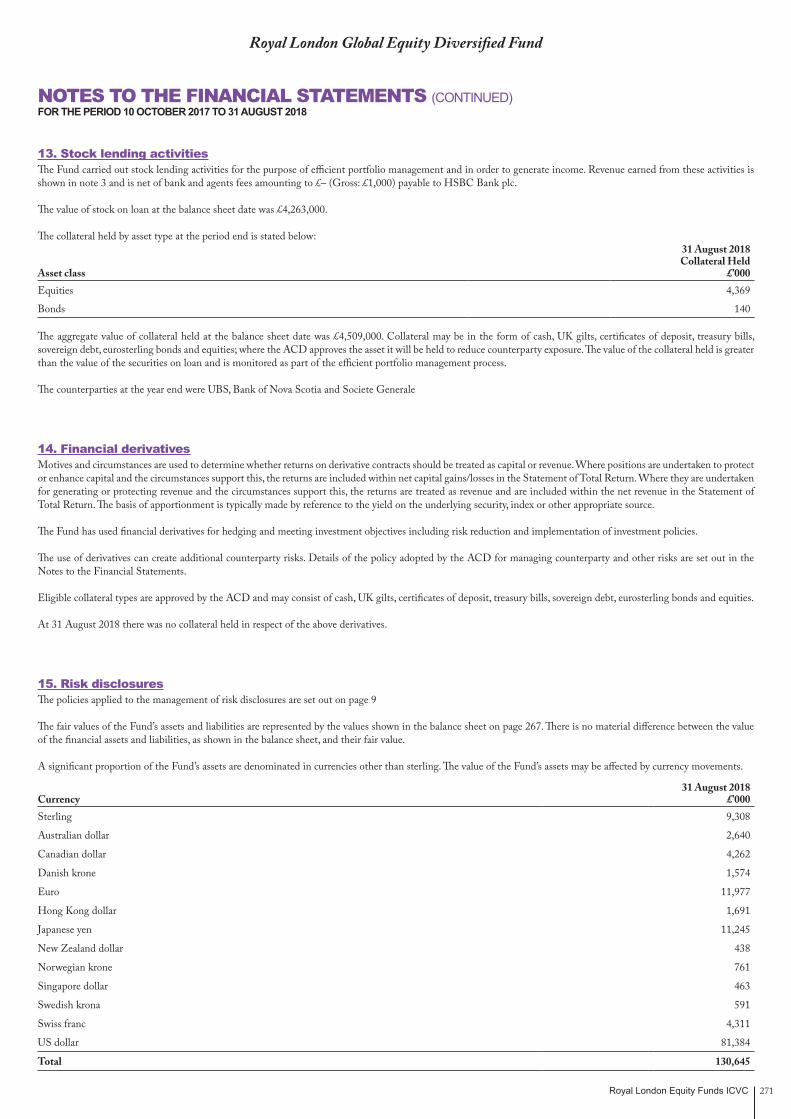
Royal London Equity Funds ICVC 271
13. Stock lending activitiesThe Fund carried out stock lending activities for the purpose of efficient portfolio management and in order to generate income. Revenue earned from these activities is shown in note 3 and is net of bank and agents fees amounting to £– (Gross: £1,000) payable to HSBC Bank plc.
The value of stock on loan at the balance sheet date was £4,263,000.
The collateral held by asset type at the period end is stated below:
Asset class
31 August 2018 Collateral Held
£’000Equities 4,369
Bonds 140
The aggregate value of collateral held at the balance sheet date was £4,509,000. Collateral may be in the form of cash, UK gilts, certificates of deposit, treasury bills, sovereign debt, eurosterling bonds and equities; where the ACD approves the asset it will be held to reduce counterparty exposure. The value of the collateral held is greater than the value of the securities on loan and is monitored as part of the efficient portfolio management process.
The counterparties at the year end were UBS, Bank of Nova Scotia and Societe Generale
14. Financial derivativesMotives and circumstances are used to determine whether returns on derivative contracts should be treated as capital or revenue. Where positions are undertaken to protect or enhance capital and the circumstances support this, the returns are included within net capital gains/losses in the Statement of Total Return. Where they are undertaken for generating or protecting revenue and the circumstances support this, the returns are treated as revenue and are included within the net revenue in the Statement of Total Return. The basis of apportionment is typically made by reference to the yield on the underlying security, index or other appropriate source.
The Fund has used financial derivatives for hedging and meeting investment objectives including risk reduction and implementation of investment policies.
The use of derivatives can create additional counterparty risks. Details of the policy adopted by the ACD for managing counterparty and other risks are set out in the Notes to the Financial Statements.
Eligible collateral types are approved by the ACD and may consist of cash, UK gilts, certificates of deposit, treasury bills, sovereign debt, eurosterling bonds and equities.
At 31 August 2018 there was no collateral held in respect of the above derivatives.
15. Risk disclosuresThe policies applied to the management of risk disclosures are set out on page 9
The fair values of the Fund’s assets and liabilities are represented by the values shown in the balance sheet on page 267. There is no material difference between the value of the financial assets and liabilities, as shown in the balance sheet, and their fair value.
A significant proportion of the Fund’s assets are denominated in currencies other than sterling. The value of the Fund’s assets may be affected by currency movements.
Currency31 August 2018
£’000Sterling 9,308
Australian dollar 2,640
Canadian dollar 4,262
Danish krone 1,574
Euro 11,977
Hong Kong dollar 1,691
Japanese yen 11,245
New Zealand dollar 438
Norwegian krone 761
Singapore dollar 463
Swedish krona 591
Swiss franc 4,311
US dollar 81,384
Total 130,645
NOTES TO THE FINANCIAL STATEMENTS (CONTINUED)FOR THE PERIOD 10 OCTOBER 2017 TO 31 AUGUST 2018
Royal London Global Equity Diversified Fund
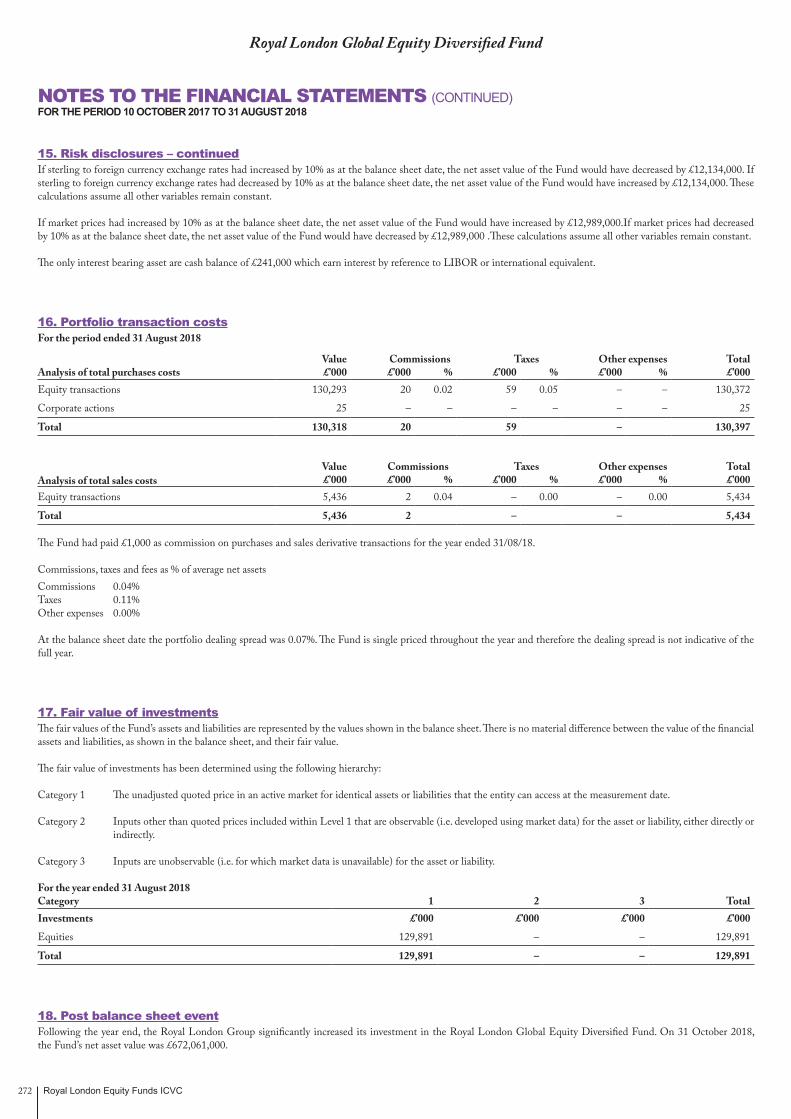
Royal London Equity Funds ICVC272
15. Risk disclosures – continuedIf sterling to foreign currency exchange rates had increased by 10% as at the balance sheet date, the net asset value of the Fund would have decreased by £12,134,000. If sterling to foreign currency exchange rates had decreased by 10% as at the balance sheet date, the net asset value of the Fund would have increased by £12,134,000. These calculations assume all other variables remain constant.
If market prices had increased by 10% as at the balance sheet date, the net asset value of the Fund would have increased by £12,989,000.If market prices had decreased by 10% as at the balance sheet date, the net asset value of the Fund would have decreased by £12,989,000 .These calculations assume all other variables remain constant.
The only interest bearing asset are cash balance of £241,000 which earn interest by reference to LIBOR or international equivalent.
16. Portfolio transaction costsFor the period ended 31 August 2018
Value Commissions Taxes Other expenses TotalAnalysis of total purchases costs £’000 £’000 % £’000 % £’000 % £’000Equity transactions 130,293 20 0.02 59 0.05 – – 130,372
Corporate actions 25 – – – – – – 25
Total 130,318 20 59 – 130,397
Value Commissions Taxes Other expenses TotalAnalysis of total sales costs £’000 £’000 % £’000 % £’000 % £’000Equity transactions 5,436 2 0.04 – 0.00 – 0.00 5,434
Total 5,436 2 – – 5,434
The Fund had paid £1,000 as commission on purchases and sales derivative transactions for the year ended 31/08/18.
Commissions, taxes and fees as % of average net assetsCommissions 0.04%Taxes 0.11%Other expenses 0.00%
At the balance sheet date the portfolio dealing spread was 0.07%. The Fund is single priced throughout the year and therefore the dealing spread is not indicative of the full year.
17. Fair value of investmentsThe fair values of the Fund’s assets and liabilities are represented by the values shown in the balance sheet. There is no material difference between the value of the financial assets and liabilities, as shown in the balance sheet, and their fair value.
The fair value of investments has been determined using the following hierarchy:
Category 1 The unadjusted quoted price in an active market for identical assets or liabilities that the entity can access at the measurement date.
Category 2 Inputs other than quoted prices included within Level 1 that are observable (i.e. developed using market data) for the asset or liability, either directly or indirectly.
Category 3 Inputs are unobservable (i.e. for which market data is unavailable) for the asset or liability.
For the year ended 31 August 2018 Category 1 2 3 TotalInvestments £’000 £’000 £’000 £’000
Equities 129,891 – – 129,891
Total 129,891 – – 129,891
18. Post balance sheet eventFollowing the year end, the Royal London Group significantly increased its investment in the Royal London Global Equity Diversified Fund. On 31 October 2018, the Fund’s net asset value was £672,061,000.
NOTES TO THE FINANCIAL STATEMENTS (CONTINUED)FOR THE PERIOD 10 OCTOBER 2017 TO 31 AUGUST 2018
Royal London Global Equity Diversified Fund
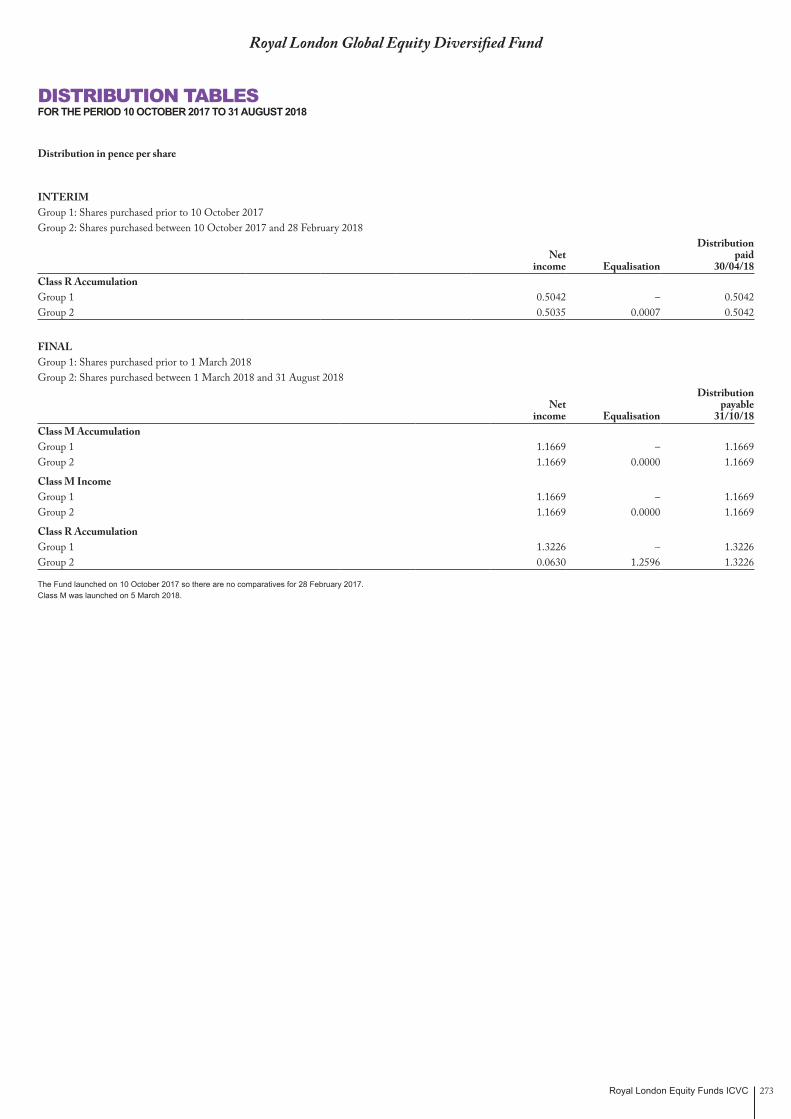
Royal London Equity Funds ICVC 273
Royal London Global Equity Diversified Fund
DISTRIBUTION TABLESFOR THE PERIOD 10 OCTOBER 2017 TO 31 AUGUST 2018
Distribution in pence per share
INTERIMGroup 1: Shares purchased prior to 10 October 2017Group 2: Shares purchased between 10 October 2017 and 28 February 2018
DistributionNet paid
income Equalisation 30/04/18Class R AccumulationGroup 1 0.5042 – 0.5042Group 2 0.5035 0.0007 0.5042
FINALGroup 1: Shares purchased prior to 1 March 2018Group 2: Shares purchased between 1 March 2018 and 31 August 2018
DistributionNet payable
income Equalisation 31/10/18Class M AccumulationGroup 1 1.1669 – 1.1669Group 2 1.1669 0.0000 1.1669
Class M IncomeGroup 1 1.1669 – 1.1669Group 2 1.1669 0.0000 1.1669
Class R AccumulationGroup 1 1.3226 – 1.3226Group 2 0.0630 1.2596 1.3226
The Fund launched on 10 October 2017 so there are no comparatives for 28 February 2017.Class M was launched on 5 March 2018.
Royal London Equity Funds ICVC274
Royal London Global Equity Select Fund
Fund PerformanceFor the period 10 October 2017 to 31 August 2018
The Fund was launched in October 2017. This means that it lacks a full year of performance history, and as a result, it is not possible to display annual performance data. However, the return from the Fund was ahead of the wider global equity market during the six months through 31 August 2018, using the MSCI World Net Total Return Index as a guide. Stock selection contributed to this performance.
Market and Portfolio CommentaryGlobal economic growth was broadly supportive for equities during the period under review, although expansion slowed noticeably outside the US in 2018. Corporate earnings also tended to be generally positive, particularly in the US following tax cuts. However, concern about protectionism was a negative theme, as the US and China maintained heated rhetoric on trade and imposed tariffs on some imported products. Political developments in Europe also were problematic, underlining the continued loss of support for mainstream parties and stronger backing for more extreme views; German and Italian elections ended with no clear outcome, and an openly eurosceptic and anti-immigrant government took office in Italy. The US Federal Reserve (Fed) continued to raise its benchmark interest rate at a measured pace; elsewhere, central banks were in no hurry to tighten policy. The dollar strengthened during the period as a whole, as the gap between policy rates in the US and other countries widened.
Church & Dwight, Eli Lilly and Helmerich & Payne made prominent contributions to Fund performance. Church & Dwight, a US maker of household goods, benefited from investment in its brands that helped to drive organic growth, contributions from acquisitions and the introduction of new products. The company raised forecasts for annual results as sales and profit exceeded its own targets. Eli Lilly recorded a particularly strong increase in July as the US pharmaceutical company again increased projections for full year results, supported by a material contribution to sales from new medicines and by good demand for established treatments, particularly for diabetes. Helmerich & Payne reported strong operating results as climbing oil prices led to increased drilling activity, enabling the company to raise hire rates for its rigs. Demand was particularly robust for the most advanced ‘super spec’ rigs, a category in which Helmerich has a market leading position.
The holdings of Bayer, Daimler and Svenska Handelsbanken detracted from returns. German life sciences company Bayer completed its takeover of US agrochemical company Monsanto in June, paying more than $60 billion; only two months later, in the first of a wave of lawsuits to go to trial, a US jury said Monsanto had failed to warn of health risks from an herbicide and imposed an award for damages, causing Bayer stock to fall sharply. Daimler was undermined by allegations that it manipulated emissions data for its Mercedes-Benz vehicles and by the backdrop of trade-related tensions, which included a US threat to impose tariffs on autos imported from Europe. Daimler recalled more than 3 million diesel-powered Mercedes-Benz vehicles in Europe and issued a profit warning after China levied tariffs on US-made cars. Svenska Handelsbanken was weighed down by pressure on earnings as Sweden’s central bank maintained negative interest rates, as well as losses on loans to collapsed UK construction company Carillion. In addition, some analysts expressed doubt about the viability of the bank’s branch-centred operating model in an increasingly digital world.
Fund activity included initiating positions in Telenor, Steel Dynamics and Daimler, while Roche Holding, Henkel and Casey’s General Stores were among holdings that were sold. Allocations to Eli Lilly and Svenska Handelsbanken were increased, and exposures to Constellation Software and Helmerich & Payne were reduced.
The Fund aims to deliver long-term capital growth by investing in a concentrated portfolio of global equities, and will typically hold 25 to 45 stocks. The equities in which the Fund invests may be from both developed and emerging market countries and from any sector, industry or market capitalisation. While concentrated at the stock level, RLAM’s Global Equity Team will seek diversification across the Corporate Life Cycle, which holds that corporate returns on productive capital tend to progress along a life cycle with defined stages.
Investment OutlookOur base case is for global growth to remain at a rate of 3.5% to 4%, slowing through 2020, with inflation pressures building, but not strongly. We expect central banks to remain cautious, with the Fed continuing to tighten monetary policy at a gradual rate, and the European Central Bank and the Bank of Japan maintaining their loose policies.
Peter RutterFund Manager31 August 2018Royal London Asset Management
The views expressed are the author’s own and do not constitute investment advice and are not an indication of future fund performance. Portfolio holdings are subject to change, for information only and are not investment recommendations.
Source: Royal London Asset Management, unless otherwise stated.
MANAGER’S INVESTMENT REPORT
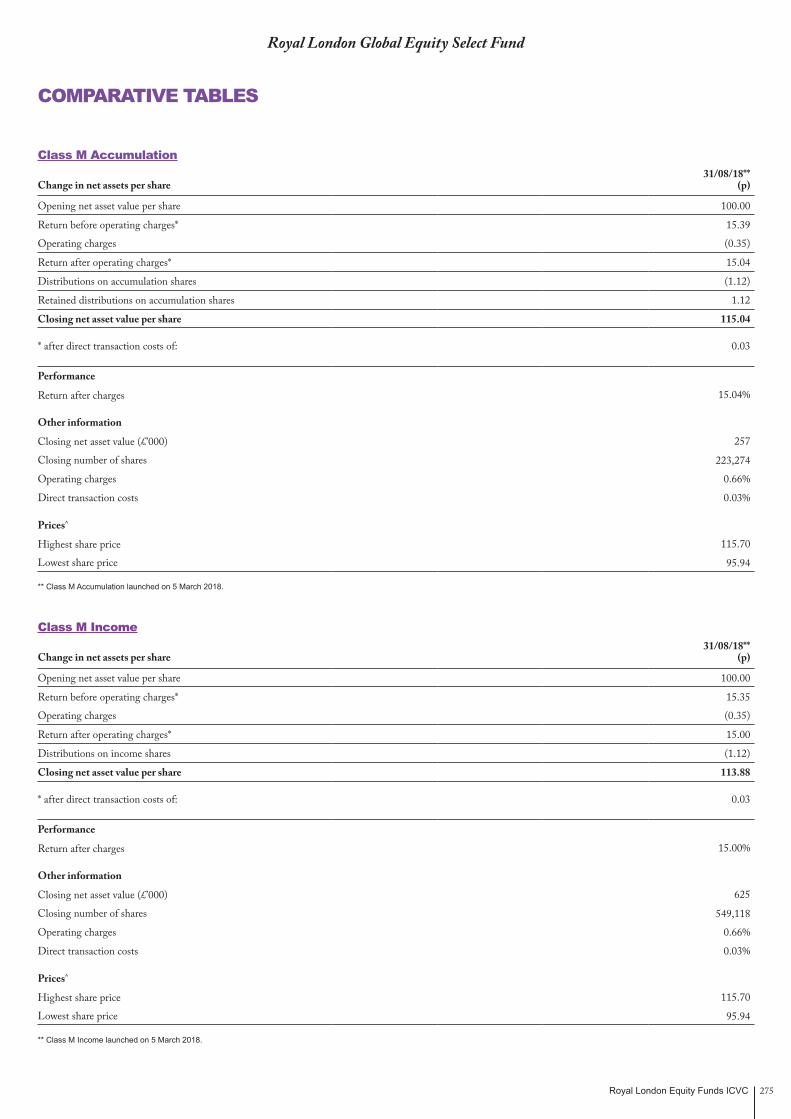
Royal London Equity Funds ICVC 275
Royal London Global Equity Select Fund
COMPARATIVE TABLES
Class M Accumulation31/08/18**
Change in net assets per share (p)
Opening net asset value per share 100.00
Return before operating charges* 15.39
Operating charges (0.35)
Return after operating charges* 15.04
Distributions on accumulation shares (1.12)
Retained distributions on accumulation shares 1.12
Closing net asset value per share 115.04
* after direct transaction costs of: 0.03
Performance
Return after charges 15.04%
Other information
Closing net asset value (£’000) 257
Closing number of shares 223,274
Operating charges 0.66%
Direct transaction costs 0.03%
Prices^
Highest share price 115.70
Lowest share price 95.94
** Class M Accumulation launched on 5 March 2018.
Class M Income31/08/18**
Change in net assets per share (p)
Opening net asset value per share 100.00
Return before operating charges* 15.35
Operating charges (0.35)
Return after operating charges* 15.00
Distributions on income shares (1.12)
Closing net asset value per share 113.88
* after direct transaction costs of: 0.03
Performance
Return after charges 15.00%
Other information
Closing net asset value (£’000) 625
Closing number of shares 549,118
Operating charges 0.66%
Direct transaction costs 0.03%
Prices^
Highest share price 115.70
Lowest share price 95.94
** Class M Income launched on 5 March 2018.
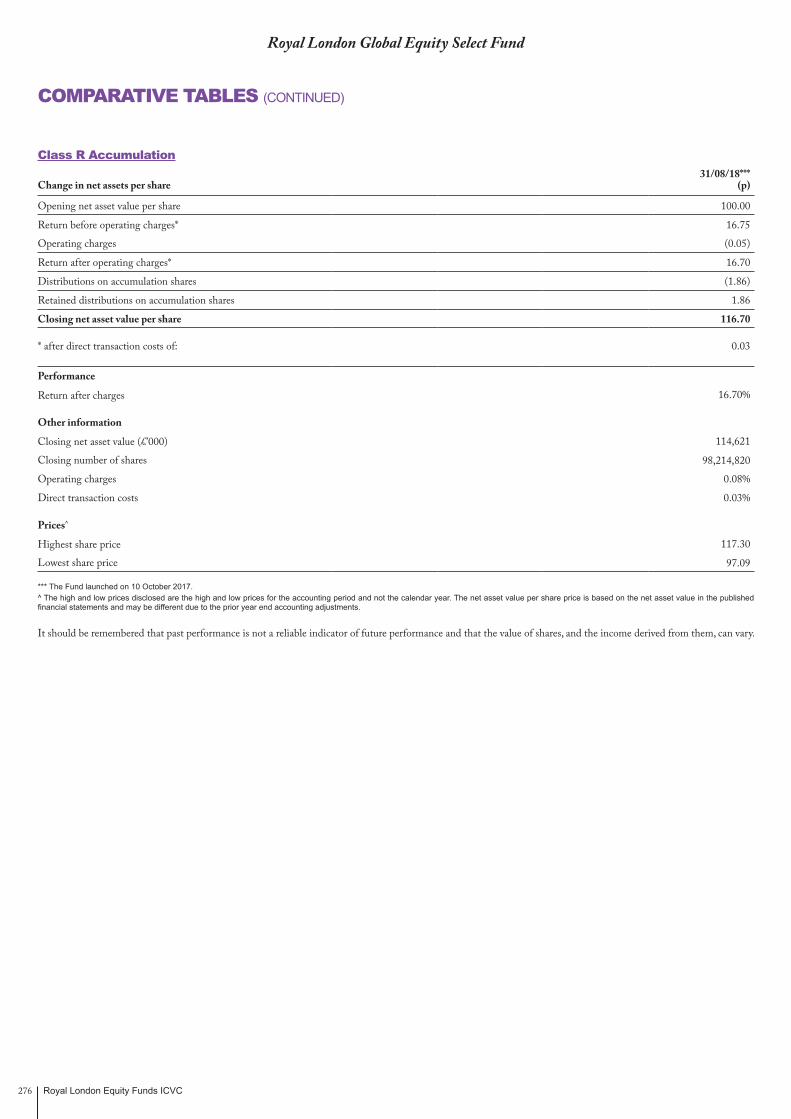
Royal London Equity Funds ICVC276
Royal London Global Equity Select Fund
COMPARATIVE TABLES (CONTINUED)
Class R Accumulation31/08/18***
Change in net assets per share (p)
Opening net asset value per share 100.00
Return before operating charges* 16.75
Operating charges (0.05)
Return after operating charges* 16.70
Distributions on accumulation shares (1.86)
Retained distributions on accumulation shares 1.86
Closing net asset value per share 116.70
* after direct transaction costs of: 0.03
Performance
Return after charges 16.70%
Other information
Closing net asset value (£’000) 114,621
Closing number of shares 98,214,820
Operating charges 0.08%
Direct transaction costs 0.03%
Prices^
Highest share price 117.30
Lowest share price 97.09
*** The Fund launched on 10 October 2017.^ The high and low prices disclosed are the high and low prices for the accounting period and not the calendar year. The net asset value per share price is based on the net asset value in the published financial statements and may be different due to the prior year end accounting adjustments.
It should be remembered that past performance is not a reliable indicator of future performance and that the value of shares, and the income derived from them, can vary.
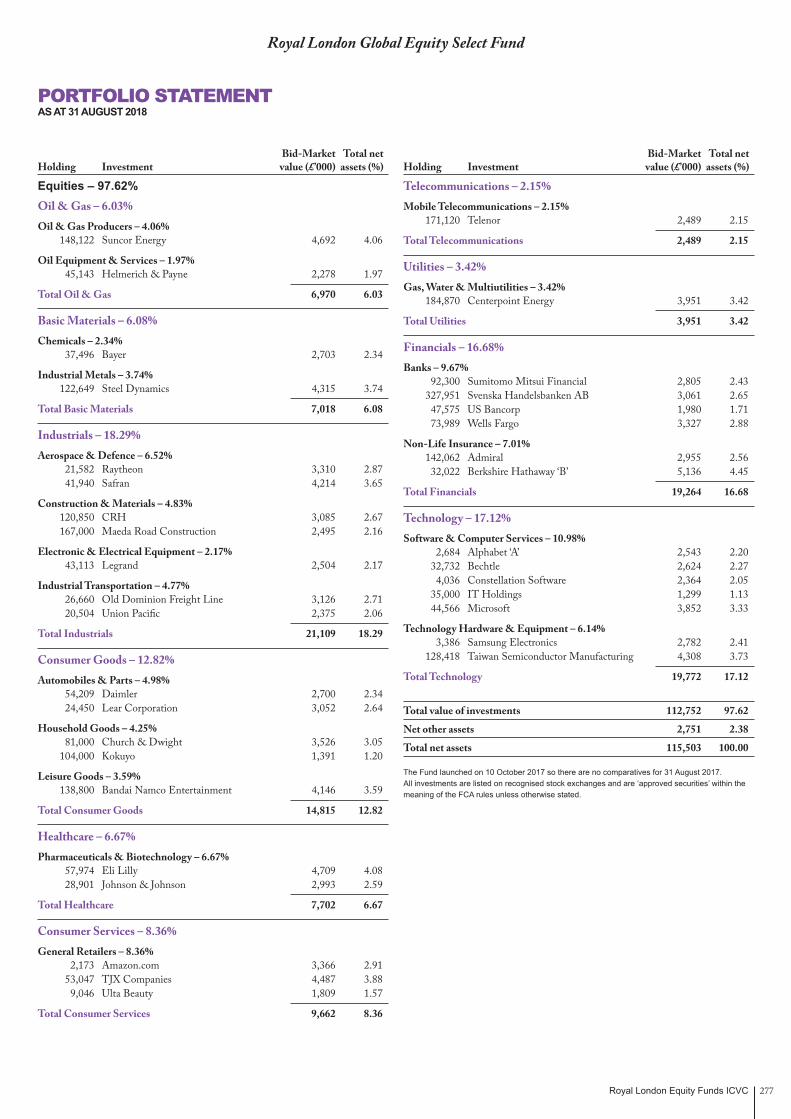
Royal London Equity Funds ICVC 277
Royal London Global Equity Select Fund
Equities – 97.62% Oil & Gas – 6.03% Oil & Gas Producers – 4.06% 148,122 Suncor Energy 4,692 4.06
Oil Equipment & Services – 1.97% 45,143 Helmerich & Payne 2,278 1.97
Total Oil & Gas 6,970 6.03
Basic Materials – 6.08% Chemicals – 2.34% 37,496 Bayer 2,703 2.34
Industrial Metals – 3.74% 122,649 Steel Dynamics 4,315 3.74
Total Basic Materials 7,018 6.08
Industrials – 18.29% Aerospace & Defence – 6.52% 21,582 Raytheon 3,310 2.87 41,940 Safran 4,214 3.65
Construction & Materials – 4.83% 120,850 CRH 3,085 2.67 167,000 Maeda Road Construction 2,495 2.16
Electronic & Electrical Equipment – 2.17% 43,113 Legrand 2,504 2.17
Industrial Transportation – 4.77% 26,660 Old Dominion Freight Line 3,126 2.71 20,504 Union Pacific 2,375 2.06
Total Industrials 21,109 18.29
Consumer Goods – 12.82% Automobiles & Parts – 4.98% 54,209 Daimler 2,700 2.34 24,450 Lear Corporation 3,052 2.64
Household Goods – 4.25% 81,000 Church & Dwight 3,526 3.05 104,000 Kokuyo 1,391 1.20
Leisure Goods – 3.59% 138,800 Bandai Namco Entertainment 4,146 3.59
Total Consumer Goods 14,815 12.82
Healthcare – 6.67% Pharmaceuticals & Biotechnology – 6.67% 57,974 Eli Lilly 4,709 4.08 28,901 Johnson & Johnson 2,993 2.59
Total Healthcare 7,702 6.67
Consumer Services – 8.36% General Retailers – 8.36% 2,173 Amazon.com 3,366 2.91 53,047 TJX Companies 4,487 3.88 9,046 Ulta Beauty 1,809 1.57
Total Consumer Services 9,662 8.36
Telecommunications – 2.15% Mobile Telecommunications – 2.15% 171,120 Telenor 2,489 2.15
Total Telecommunications 2,489 2.15
Utilities – 3.42% Gas, Water & Multiutilities – 3.42% 184,870 Centerpoint Energy 3,951 3.42
Total Utilities 3,951 3.42
Financials – 16.68% Banks – 9.67% 92,300 Sumitomo Mitsui Financial 2,805 2.43 327,951 Svenska Handelsbanken AB 3,061 2.65 47,575 US Bancorp 1,980 1.71 73,989 Wells Fargo 3,327 2.88
Non-Life Insurance – 7.01% 142,062 Admiral 2,955 2.56 32,022 Berkshire Hathaway ‘B’ 5,136 4.45
Total Financials 19,264 16.68
Technology – 17.12% Software & Computer Services – 10.98% 2,684 Alphabet ‘A’ 2,543 2.20 32,732 Bechtle 2,624 2.27 4,036 Constellation Software 2,364 2.05 35,000 IT Holdings 1,299 1.13 44,566 Microsoft 3,852 3.33
Technology Hardware & Equipment – 6.14% 3,386 Samsung Electronics 2,782 2.41 128,418 Taiwan Semiconductor Manufacturing 4,308 3.73
Total Technology 19,772 17.12
Total value of investments 112,752 97.62
Net other assets 2,751 2.38
Total net assets 115,503 100.00
The Fund launched on 10 October 2017 so there are no comparatives for 31 August 2017.All investments are listed on recognised stock exchanges and are ‘approved securities’ within themeaning of the FCA rules unless otherwise stated.
PORTFOLIO STATEMENTAS AT 31 AUGUST 2018
Bid-Market Total net Holding Investment value (£’000) assets (%)
Bid-Market Total net Holding Investment value (£’000) assets (%)

Royal London Equity Funds ICVC278
Royal London Global Equity Select Fund
SUMMARY OF MATERIAL PORTFOLIO CHANGESFOR THE PERIOD 10 OCTOBER 2017 TO 31 AUGUST 2018
Significant Purchases
Cost £’000
Taiwan Semiconductor Manufacturing 5,129
Berkshire Hathaway ‘B’ 4,552
Suncor Energy 4,231
Bechtle 4,161
Eli Lilly 3,948
Centerpoint Energy 3,913
Bayer 3,840
Raytheon 3,757
Bandai Namco Entertainment 3,632
Steel Dynamics 3,482
Subtotal 40,645
Total cost of purchases, including the above, for the period 125,449
Significant Sales
Proceeds £’000
IT Holdings 3,083
Henkel 2,596
Casey’s General Stores 2,593
Bechtle 2,438
Omnicom 2,105
Deluxe 1,936
Roche holding 1,908
International Paper 1,790
Old Dominion Freight Line 1,578
Constellation Software 1,547
Subtotal 21,574
Total proceeds from sales, including the above, for the period 27,345

Royal London Equity Funds ICVC 279
Royal London Global Equity Select Fund
FINANCIAL STATEMENTS
Statement of Total Returnfor the period 10 October 2017 to 31 August 2018
Note £’000
Period from10 October 2017 to
31 August 2018*£’000
Income Net capital gains 2 14,610 Revenue 3 2,132
Expenses 4 (52)
Net revenue before taxation 2,080 Taxation 5 (247)
Net revenue after taxation 1,833
Total return before distributions 16,443 Distributions 6 (1,833)
Change in net assets attributable to shareholders from investment activities 14,610
Statement of Change in Net Assets Attributable to Shareholdersfor the period 10 October 2017 to 31 August 2018
£’000
Period from10 October 2017 to
31 August 2018*£’000
Opening net assets attributable to shareholders –
Amounts transferred from other funds** 97,984Amounts receivable on creation of shares 1,119Amounts payable on cancellation of shares (43)
99,060
Change in net assets attributable to shareholders from investment activities 14,610
Retained distribution on accumulation shares 1,833
Closing net assets attributable to shareholders 115,503
* The Fund launched on 10 October 2017 so there are no comparatives for 31 August 2017.** On 10 October 2017 £97,983,501 was transferred in from RL Global Equity Select Life Fund.
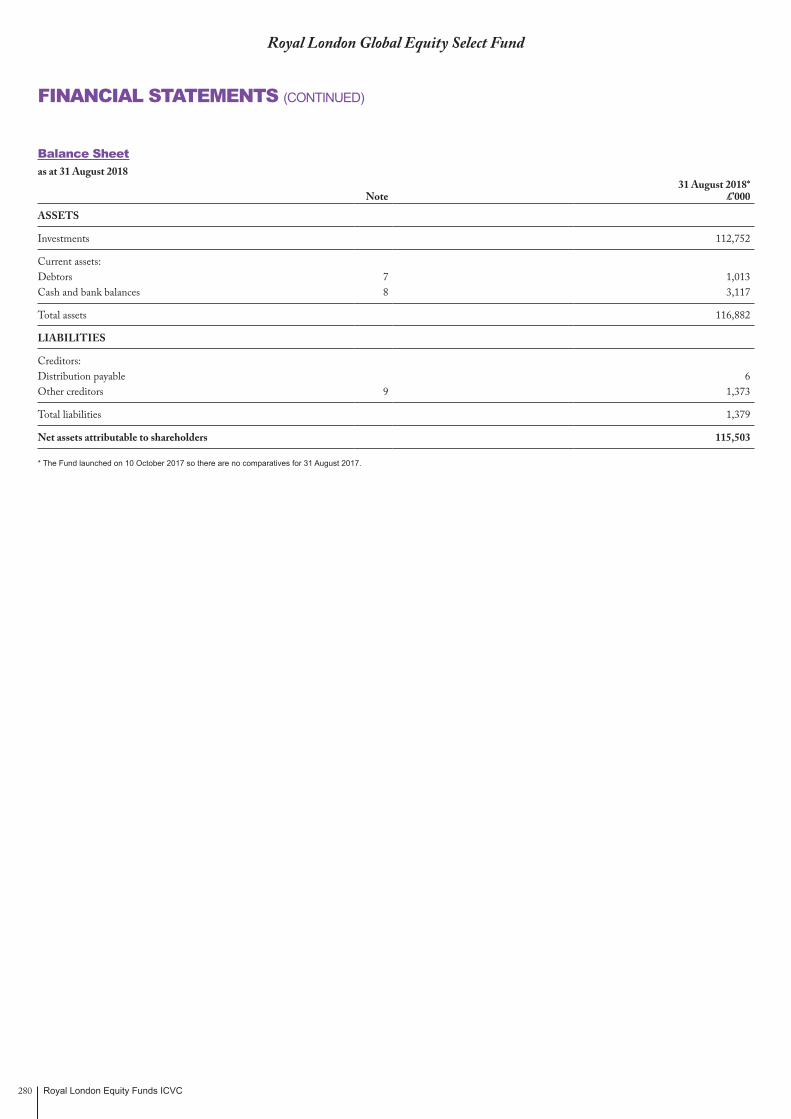
Royal London Equity Funds ICVC280
Royal London Global Equity Select Fund
FINANCIAL STATEMENTS (CONTINUED)
Balance Sheetas at 31 August 2018
Note31 August 2018*
£’000
ASSETS
Investments 112,752
Current assets:Debtors 7 1,013 Cash and bank balances 8 3,117
Total assets 116,882
LIABILITIES
Creditors:Distribution payable 6 Other creditors 9 1,373
Total liabilities 1,379
Net assets attributable to shareholders 115,503
* The Fund launched on 10 October 2017 so there are no comparatives for 31 August 2017.
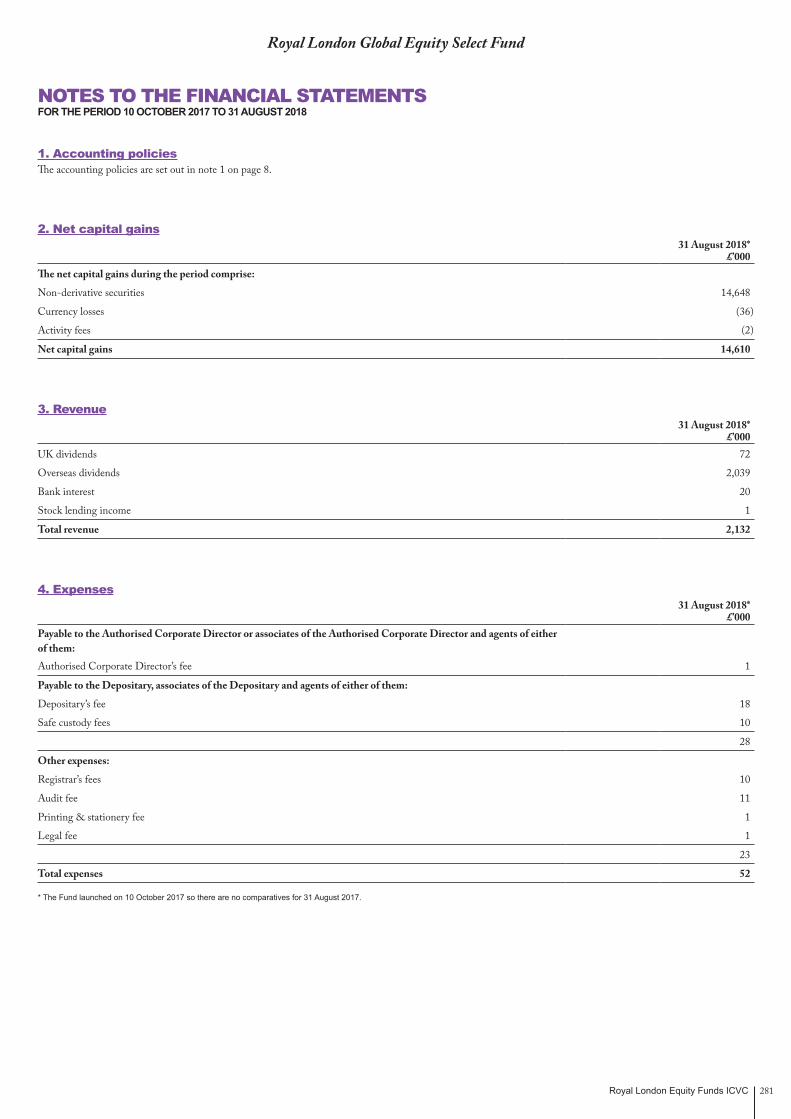
Royal London Equity Funds ICVC 281
1. Accounting policiesThe accounting policies are set out in note 1 on page 8.
2. Net capital gains31 August 2018*
£’000The net capital gains during the period comprise:
Non-derivative securities 14,648
Currency losses (36)
Activity fees (2)
Net capital gains 14,610
3. Revenue31 August 2018*
£’000UK dividends 72
Overseas dividends 2,039
Bank interest 20
Stock lending income 1
Total revenue 2,132
4. Expenses31 August 2018*
£’000Payable to the Authorised Corporate Director or associates of the Authorised Corporate Director and agents of either of them:Authorised Corporate Director’s fee 1
Payable to the Depositary, associates of the Depositary and agents of either of them:
Depositary’s fee 18
Safe custody fees 10
28
Other expenses:
Registrar’s fees 10
Audit fee 11
Printing & stationery fee 1
Legal fee 1
23
Total expenses 52
* The Fund launched on 10 October 2017 so there are no comparatives for 31 August 2017.
NOTES TO THE FINANCIAL STATEMENTSFOR THE PERIOD 10 OCTOBER 2017 TO 31 AUGUST 2018
Royal London Global Equity Select Fund
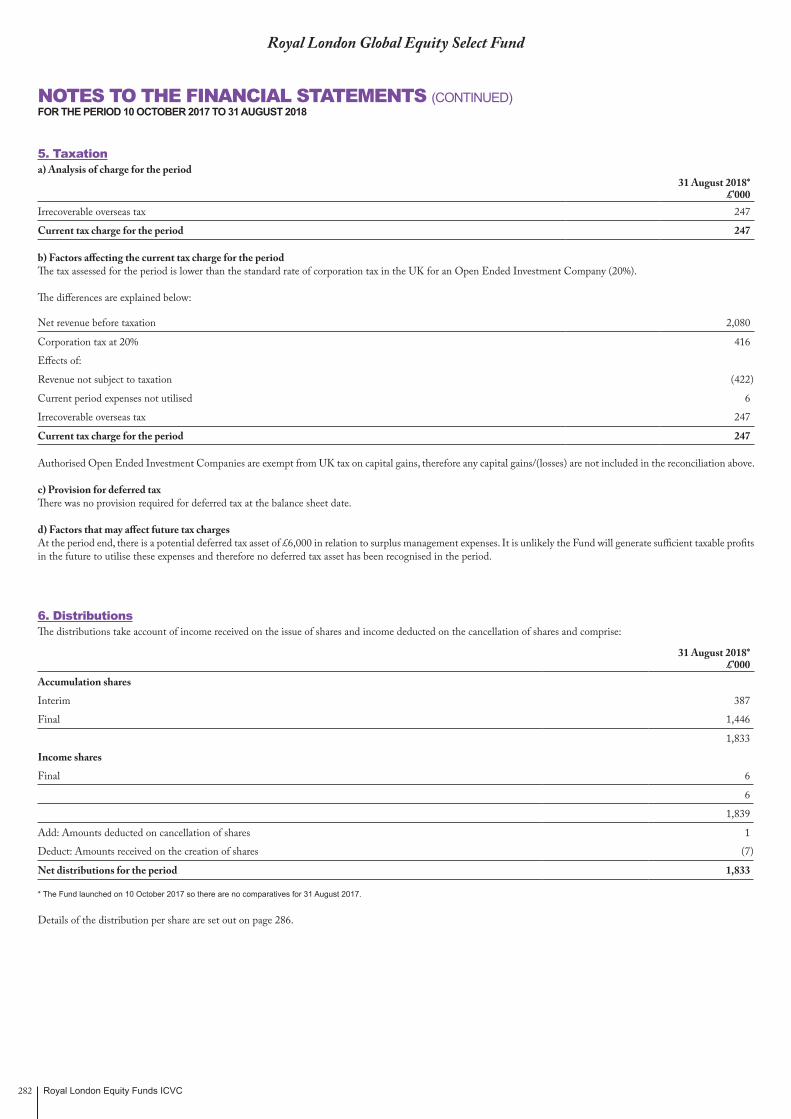
Royal London Equity Funds ICVC282
5. Taxationa) Analysis of charge for the period
31 August 2018*£’000
Irrecoverable overseas tax 247
Current tax charge for the period 247
b) Factors affecting the current tax charge for the period The tax assessed for the period is lower than the standard rate of corporation tax in the UK for an Open Ended Investment Company (20%).
The differences are explained below:
Net revenue before taxation 2,080
Corporation tax at 20% 416
Effects of:
Revenue not subject to taxation (422)
Current period expenses not utilised 6
Irrecoverable overseas tax 247
Current tax charge for the period 247
Authorised Open Ended Investment Companies are exempt from UK tax on capital gains, therefore any capital gains/(losses) are not included in the reconciliation above.
c) Provision for deferred taxThere was no provision required for deferred tax at the balance sheet date.
d) Factors that may affect future tax chargesAt the period end, there is a potential deferred tax asset of £6,000 in relation to surplus management expenses. It is unlikely the Fund will generate sufficient taxable profits in the future to utilise these expenses and therefore no deferred tax asset has been recognised in the period.
6. DistributionsThe distributions take account of income received on the issue of shares and income deducted on the cancellation of shares and comprise:
31 August 2018* £’000
Accumulation shares
Interim 387
Final 1,446
1,833
Income shares
Final 6
6
1,839
Add: Amounts deducted on cancellation of shares 1
Deduct: Amounts received on the creation of shares (7)
Net distributions for the period 1,833
* The Fund launched on 10 October 2017 so there are no comparatives for 31 August 2017.
Details of the distribution per share are set out on page 286.
NOTES TO THE FINANCIAL STATEMENTS (CONTINUED)FOR THE PERIOD 10 OCTOBER 2017 TO 31 AUGUST 2018
Royal London Global Equity Select Fund
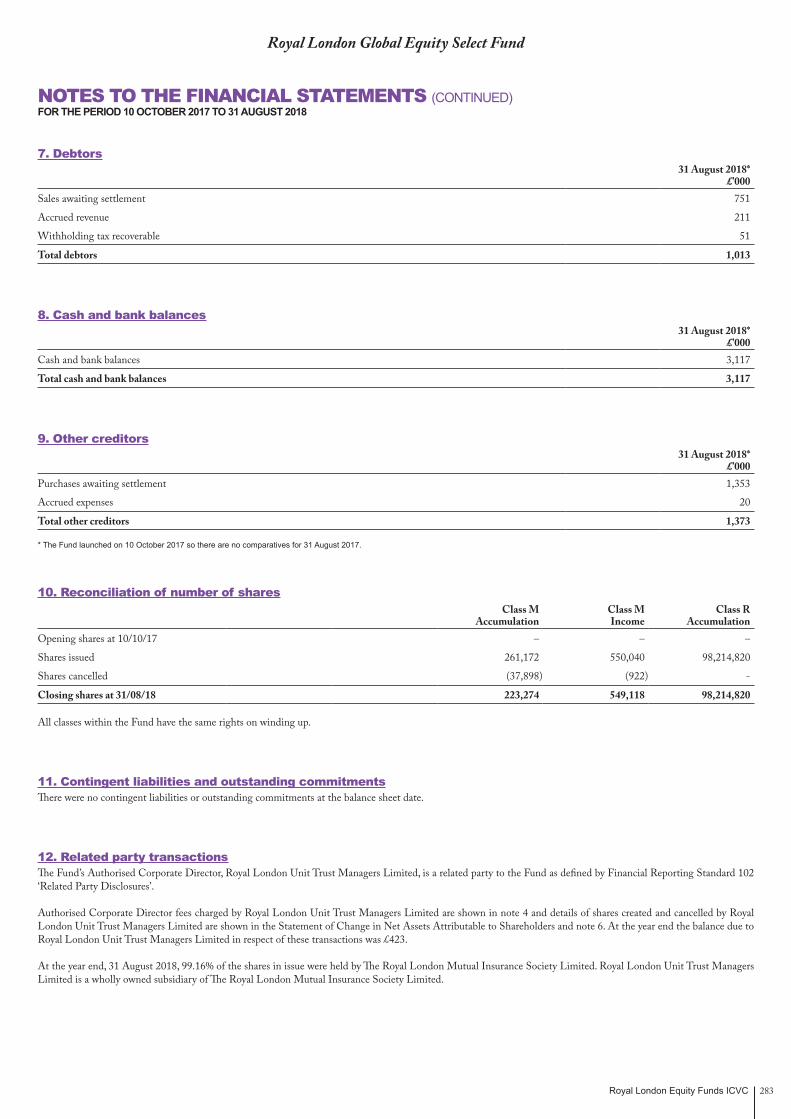
Royal London Equity Funds ICVC 283
7. Debtors31 August 2018*
£’000Sales awaiting settlement 751
Accrued revenue 211
Withholding tax recoverable 51
Total debtors 1,013
8. Cash and bank balances31 August 2018*
£’000Cash and bank balances 3,117
Total cash and bank balances 3,117
9. Other creditors31 August 2018*
£’000Purchases awaiting settlement 1,353
Accrued expenses 20
Total other creditors 1,373
* The Fund launched on 10 October 2017 so there are no comparatives for 31 August 2017.
10. Reconciliation of number of sharesClass M
AccumulationClass MIncome
Class RAccumulation
Opening shares at 10/10/17 – – –
Shares issued 261,172 550,040 98,214,820
Shares cancelled (37,898) (922) -
Closing shares at 31/08/18 223,274 549,118 98,214,820
All classes within the Fund have the same rights on winding up.
11. Contingent liabilities and outstanding commitmentsThere were no contingent liabilities or outstanding commitments at the balance sheet date.
12. Related party transactionsThe Fund’s Authorised Corporate Director, Royal London Unit Trust Managers Limited, is a related party to the Fund as defined by Financial Reporting Standard 102 ‘Related Party Disclosures’.
Authorised Corporate Director fees charged by Royal London Unit Trust Managers Limited are shown in note 4 and details of shares created and cancelled by Royal London Unit Trust Managers Limited are shown in the Statement of Change in Net Assets Attributable to Shareholders and note 6. At the year end the balance due to Royal London Unit Trust Managers Limited in respect of these transactions was £423.
At the year end, 31 August 2018, 99.16% of the shares in issue were held by The Royal London Mutual Insurance Society Limited. Royal London Unit Trust Managers Limited is a wholly owned subsidiary of The Royal London Mutual Insurance Society Limited.
NOTES TO THE FINANCIAL STATEMENTS (CONTINUED)FOR THE PERIOD 10 OCTOBER 2017 TO 31 AUGUST 2018
Royal London Global Equity Select Fund
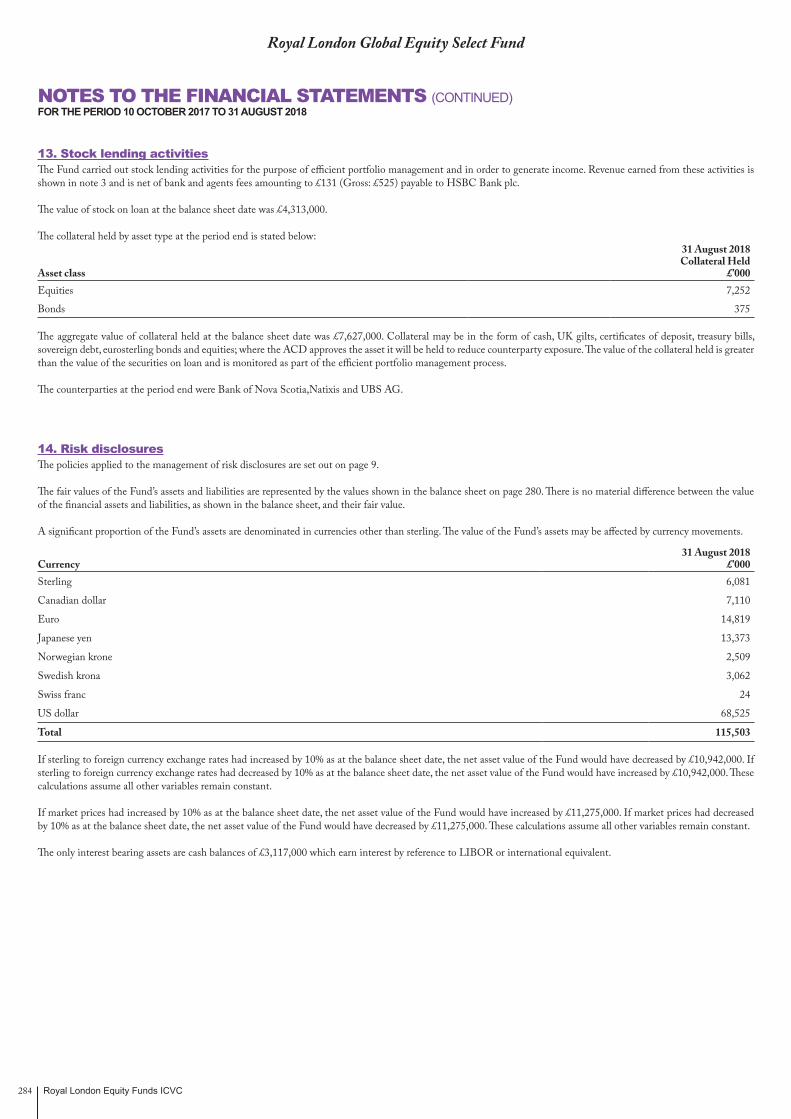
Royal London Equity Funds ICVC284
13. Stock lending activitiesThe Fund carried out stock lending activities for the purpose of efficient portfolio management and in order to generate income. Revenue earned from these activities is shown in note 3 and is net of bank and agents fees amounting to £131 (Gross: £525) payable to HSBC Bank plc.
The value of stock on loan at the balance sheet date was £4,313,000.
The collateral held by asset type at the period end is stated below:
Asset class
31 August 2018 Collateral Held
£’000Equities 7,252
Bonds 375
The aggregate value of collateral held at the balance sheet date was £7,627,000. Collateral may be in the form of cash, UK gilts, certificates of deposit, treasury bills, sovereign debt, eurosterling bonds and equities; where the ACD approves the asset it will be held to reduce counterparty exposure. The value of the collateral held is greater than the value of the securities on loan and is monitored as part of the efficient portfolio management process.
The counterparties at the period end were Bank of Nova Scotia,Natixis and UBS AG.
14. Risk disclosuresThe policies applied to the management of risk disclosures are set out on page 9.
The fair values of the Fund’s assets and liabilities are represented by the values shown in the balance sheet on page 280. There is no material difference between the value of the financial assets and liabilities, as shown in the balance sheet, and their fair value.
A significant proportion of the Fund’s assets are denominated in currencies other than sterling. The value of the Fund’s assets may be affected by currency movements.
Currency31 August 2018
£’000Sterling 6,081
Canadian dollar 7,110
Euro 14,819
Japanese yen 13,373
Norwegian krone 2,509
Swedish krona 3,062
Swiss franc 24
US dollar 68,525
Total 115,503
If sterling to foreign currency exchange rates had increased by 10% as at the balance sheet date, the net asset value of the Fund would have decreased by £10,942,000. If sterling to foreign currency exchange rates had decreased by 10% as at the balance sheet date, the net asset value of the Fund would have increased by £10,942,000. These calculations assume all other variables remain constant.
If market prices had increased by 10% as at the balance sheet date, the net asset value of the Fund would have increased by £11,275,000. If market prices had decreased by 10% as at the balance sheet date, the net asset value of the Fund would have decreased by £11,275,000. These calculations assume all other variables remain constant.
The only interest bearing assets are cash balances of £3,117,000 which earn interest by reference to LIBOR or international equivalent.
NOTES TO THE FINANCIAL STATEMENTS (CONTINUED)FOR THE PERIOD 10 OCTOBER 2017 TO 31 AUGUST 2018
Royal London Global Equity Select Fund

Royal London Equity Funds ICVC 285
15. Portfolio transaction costsFor the period ended 31 August 2018
Value Commissions Taxes Other expenses TotalAnalysis of total purchases costs £’000 £’000 % £’000 % £’000 % £’000Equity transactions 29,104 14 0.05 3 0.01 – – 29,121
In specie transactions 96,115 – – – – – – 96,115
Corporate actions 213 – – – – – – 213
Total 125,432 14 3 – 125,449
Value Commissions Taxes Other expenses TotalAnalysis of total sales costs £’000 £’000 % £’000 % £’000 % £’000Equity transactions 27,359 14 0.05 – – – – 27,345
Total 27,359 14 – – 27,345
Commissions, taxes and fees as % of average net assetsCommissions 0.03%Taxes 0.00%Other expenses 0.00%
At the balance sheet date the portfolio dealing spread was 0.07%. The Fund is single priced throughout the period and therefore the dealing spread is not indicative of the full period.
16. Fair value of investmentsThe fair values of the Fund’s assets and liabilities are represented by the values shown in the balance sheet. There is no material difference between the value of the financial assets and liabilities, as shown in the balance sheet, and their fair value.
The fair value of investments has been determined using the following hierarchy:
Category 1 The unadjusted quoted price in an active market for identical assets or liabilities that the entity can access at the measurement date.
Category 2 Inputs other than quoted prices included within Level 1 that are observable (i.e. developed using market data) for the asset or liability, either directly or indirectly.
Category 3 Inputs are unobservable (i.e. for which market data is unavailable) for the asset or liability.
For the period ended 31 August 2018 Category 1 2 3 TotalInvestments £’000 £’000 £’000 £’000
Equities 112,752 – – 112,752
Total 112,752 – – 112,752
NOTES TO THE FINANCIAL STATEMENTS (CONTINUED)FOR THE PERIOD 10 OCTOBER 2017 TO 31 AUGUST 2018
Royal London Global Equity Select Fund

Royal London Equity Funds ICVC286
Royal London Global Equity Select Fund
DISTRIBUTION TABLESFOR THE PERIOD 10 OCTOBER 2017 TO 31 AUGUST 2018
Distribution in pence per share
INTERIMGroup 1: Shares purchased prior to 10 October 2017Group 2: Shares purchased between 10 October 2017 and 28 February 2018
DistributionNet paid
income Equalisation 30/04/18Class R AccumulationGroup 1 0.3945 – 0.3945Group 2 0.3941 0.0004 0.3945
FINALGroup 1: Shares purchased prior to 1 March 2018Group 2: Shares purchased between 1 March 2018 and 31 August 2018
DistributionNet payable
income Equalisation 31/10/18Class M Accumulation*Group 1 1.1211 – 1.1211Group 2 0.2586 0.8625 1.1211
Class M Income*Group 1 1.1167 – 1.1167Group 2 0.1920 0.9247 1.1167
Class R AccumulationGroup 1 1.4701 – 1.4701Group 2 1.4701 0.0000 1.4701
The Fund launched on 10 October 2017 so there are no comparatives for any of the distribution periods.*The share class launched on 5 March 2018.

Royal London Equity Funds ICVC 287
Royal London Equity Funds ICVC
Royal London European Opportunities FundLaunch date 30 October 2009Accounting end dates 31 August (final)
Last day of February (interim)Distribution dates 31 October (final)
30 April (interim)Minimum investment Class M £100,000 (thereafter £1,000)Management charges Initial Class M nil
Annual Class M 0.70%
Royal London UK Mid Cap Growth FundLaunch date 30 October 2009Accounting end dates 31 August (final)
Last day of February (interim)Distribution dates 31 October (final)Minimum investment Class M £100,000 (thereafter £1,000)
Class Z £25,000,000 (thereafter £50,000)Management charges: Initial Class M nil
Class Z nilAnnual Class M 0.70%
Class Z 0.55%
Royal London UK Opportunities FundLaunch date 30 October 2009Accounting end dates 31 August (final)
Last day of February (interim)Distribution dates 31 October (final)Minimum investment Class M £100,000 (thereafter £1,000)Management charges: Initial Class M nil
Annual Class M 0.70%
Royal London Japan Tracker FundLaunch date 26 February 2010Accounting end dates 31 August (final)
Last day of February (interim)Distribution dates 31 October (final)
30 April (interim)Minimum investment Class Z £1,000,000 (thereafter £50,000)Management charges: Initial Class Z nil
Annual Class Z 0.20%
Royal London FTSE® 350 Tracker FundLaunch date 26 February 2010Accounting end dates 31 August (final)
Last day of February (interim)Distribution dates 31 October (final)
30 April (interim)Minimum investment Class Z Acc £500,000 (thereafter £50,000)
Class Z Inc £1,000 (thereafter £100)Management charges: Initial Class Z Acc nil
Class Z Inc nilAnnual Class Z Acc 0.10%
Class Z Inc 0.10%
Royal London UK All Share Tracker FundLaunch date 26 February 2010Accounting end dates 31 August (final)
Last day of February (interim)Distribution dates 31 October (final)
30 April (interim)Minimum investment Class Z £1,000,000 (thereafter £50,000)Management charges: Initial Class Z nil
Annual Class Z 0.10%
Royal London US Tracker FundLaunch date 26 February 2010Accounting end dates 31 August (final)
Last day of February (interim)Distribution dates 31 October (final)Minimum investment Class Z £500,000 (thereafter £50,000)Management charges: Initial Class Z nil
Annual Class Z 0.20%
Royal London European Growth FundLaunch date 30 April 2010Accounting end dates 31 August (final)
Last day of February (interim)Distribution dates 31 October (final)
30 April (interim)Minimum investment Class A £1,000 (thereafter £100)
Class M £100,000 (thereafter £1,000)Management charges: Initial Class A nil
Class M nilAnnual Class A 1.25%
Class M 0.62%
FACT FILE
Constitution
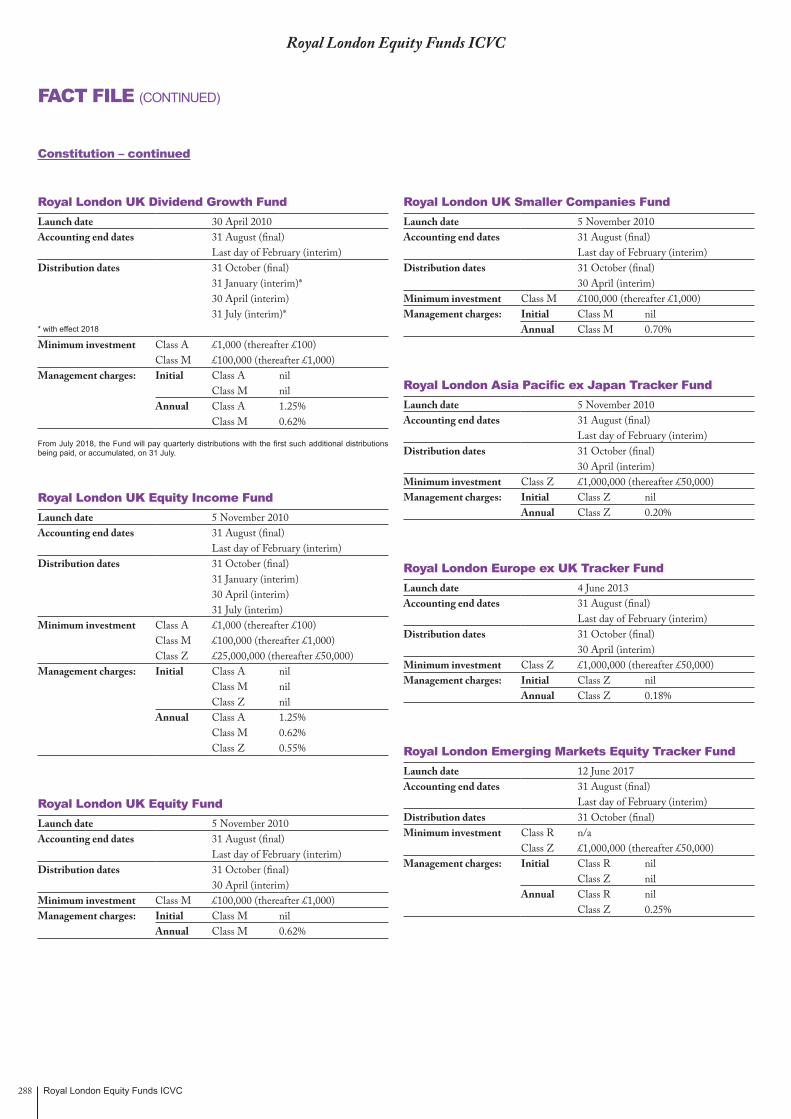
Royal London Equity Funds ICVC288
Royal London UK Dividend Growth FundLaunch date 30 April 2010Accounting end dates 31 August (final)
Last day of February (interim)Distribution dates 31 October (final)
31 January (interim)*30 April (interim)31 July (interim)*
* with effect 2018
Minimum investment Class A £1,000 (thereafter £100)Class M £100,000 (thereafter £1,000)
Management charges: Initial Class A nilClass M nil
Annual Class A 1.25%Class M 0.62%
From July 2018, the Fund will pay quarterly distributions with the first such additional distributions being paid, or accumulated, on 31 July.
Royal London UK Equity Income FundLaunch date 5 November 2010Accounting end dates 31 August (final)
Last day of February (interim)Distribution dates 31 October (final)
31 January (interim)30 April (interim)31 July (interim)
Minimum investment Class A £1,000 (thereafter £100)Class M £100,000 (thereafter £1,000)Class Z £25,000,000 (thereafter £50,000)
Management charges: Initial Class A nilClass M nilClass Z nil
Annual Class A 1.25%Class M 0.62%Class Z 0.55%
Royal London UK Equity FundLaunch date 5 November 2010Accounting end dates 31 August (final)
Last day of February (interim)Distribution dates 31 October (final)
30 April (interim)Minimum investment Class M £100,000 (thereafter £1,000)Management charges: Initial Class M nil
Annual Class M 0.62%
Royal London UK Smaller Companies FundLaunch date 5 November 2010Accounting end dates 31 August (final)
Last day of February (interim)Distribution dates 31 October (final)
30 April (interim)Minimum investment Class M £100,000 (thereafter £1,000)Management charges: Initial Class M nil
Annual Class M 0.70%
Royal London Asia Pacific ex Japan Tracker FundLaunch date 5 November 2010Accounting end dates 31 August (final)
Last day of February (interim)Distribution dates 31 October (final)
30 April (interim)Minimum investment Class Z £1,000,000 (thereafter £50,000)Management charges: Initial Class Z nil
Annual Class Z 0.20%
Royal London Europe ex UK Tracker FundLaunch date 4 June 2013Accounting end dates 31 August (final)
Last day of February (interim)Distribution dates 31 October (final)
30 April (interim)Minimum investment Class Z £1,000,000 (thereafter £50,000)Management charges: Initial Class Z nil
Annual Class Z 0.18%
Royal London Emerging Markets Equity Tracker FundLaunch date 12 June 2017Accounting end dates 31 August (final)
Last day of February (interim)Distribution dates 31 October (final)Minimum investment Class R n/a
Class Z £1,000,000 (thereafter £50,000)Management charges: Initial Class R nil
Class Z nilAnnual Class R nil
Class Z 0.25%
Constitution – continued
FACT FILE (CONTINUED)
Royal London Equity Funds ICVC
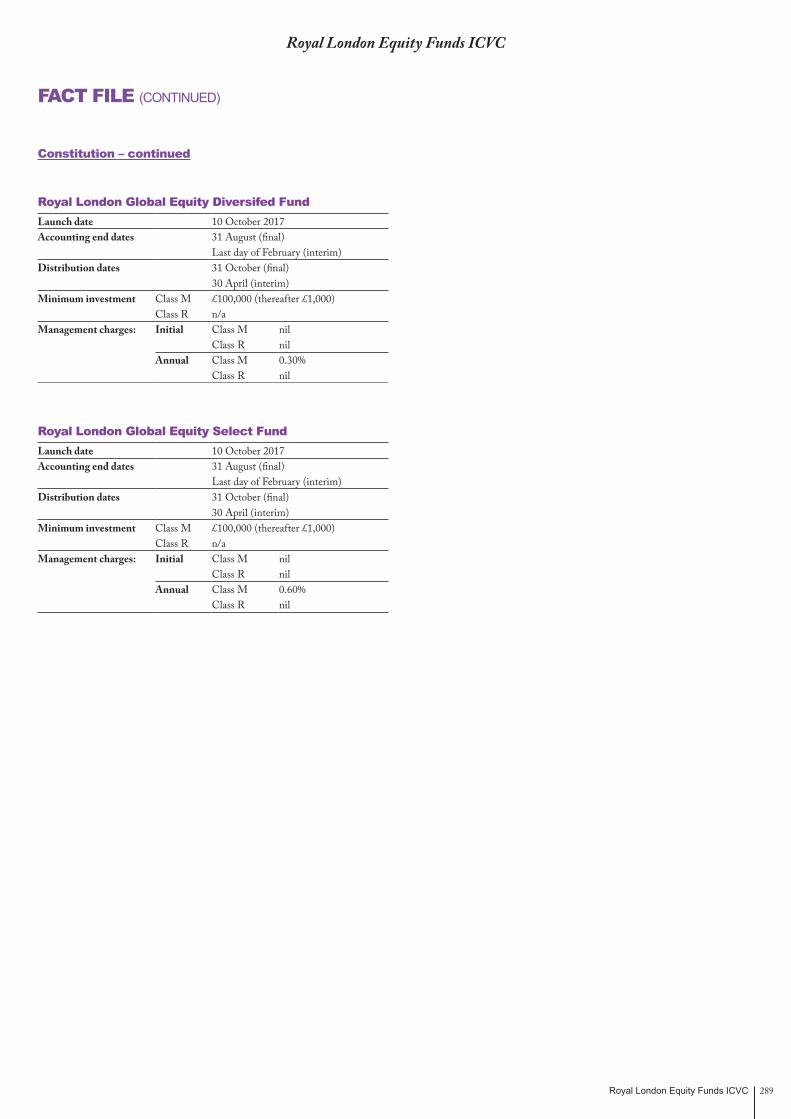
Royal London Equity Funds ICVC 289
FACT FILE (CONTINUED)
Royal London Equity Funds ICVC
Royal London Global Equity Diversifed FundLaunch date 10 October 2017Accounting end dates 31 August (final)
Last day of February (interim)Distribution dates 31 October (final)
30 April (interim)Minimum investment Class M £100,000 (thereafter £1,000) Class R n/aManagement charges: Initial Class M nil
Class R nilAnnual Class M 0.30%
Class R nil
Royal London Global Equity Select FundLaunch date 10 October 2017Accounting end dates 31 August (final)
Last day of February (interim)Distribution dates 31 October (final)
30 April (interim)Minimum investment Class M £100,000 (thereafter £1,000)
Class R n/aManagement charges: Initial Class M nil
Class R nilAnnual Class M 0.60% Class R nil
Constitution – continued
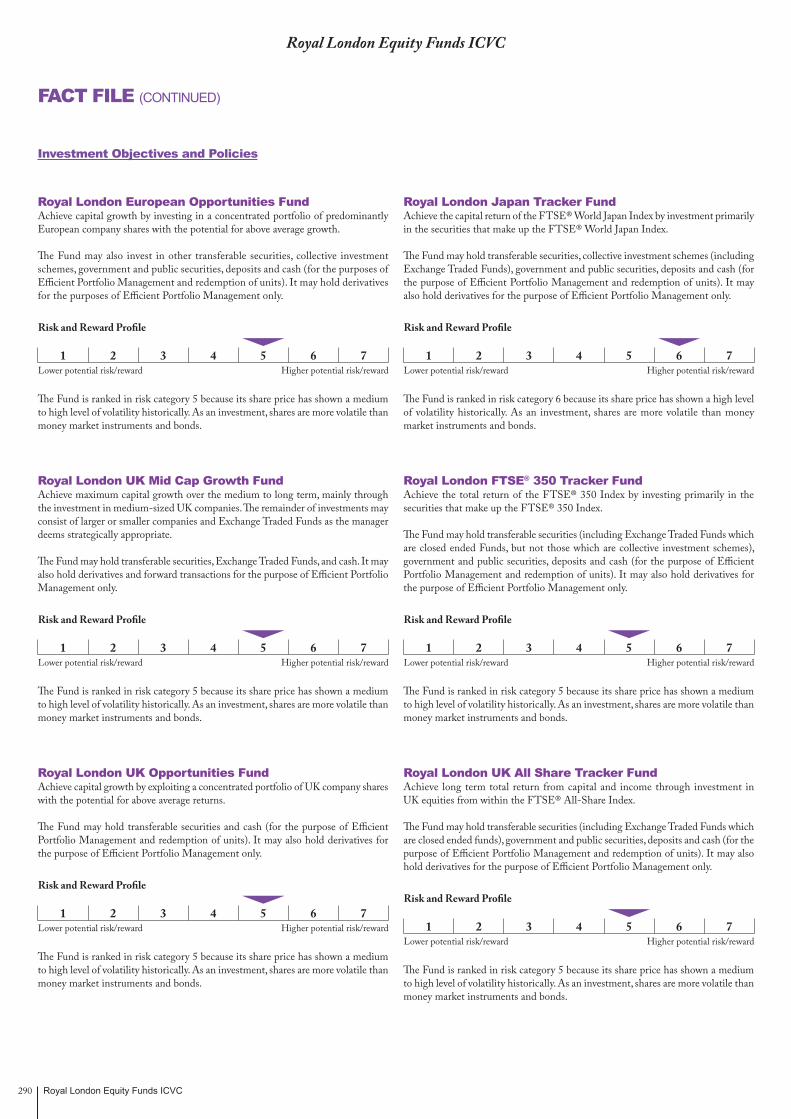
Royal London Equity Funds ICVC290
Royal London Equity Funds ICVC
Royal London European Opportunities FundAchieve capital growth by investing in a concentrated portfolio of predominantly European company shares with the potential for above average growth.
The Fund may also invest in other transferable securities, collective investment schemes, government and public securities, deposits and cash (for the purposes of Efficient Portfolio Management and redemption of units). It may hold derivatives for the purposes of Efficient Portfolio Management only.
Risk and Reward Profile
1 2 3 4 5 6 7Lower potential risk/reward Higher potential risk/reward
The Fund is ranked in risk category 5 because its share price has shown a medium to high level of volatility historically. As an investment, shares are more volatile than money market instruments and bonds.
Royal London UK Mid Cap Growth FundAchieve maximum capital growth over the medium to long term, mainly through the investment in medium-sized UK companies. The remainder of investments may consist of larger or smaller companies and Exchange Traded Funds as the manager deems strategically appropriate.
The Fund may hold transferable securities, Exchange Traded Funds, and cash. It may also hold derivatives and forward transactions for the purpose of Efficient Portfolio Management only.
Risk and Reward Profile
1 2 3 4 5 6 7Lower potential risk/reward Higher potential risk/reward
The Fund is ranked in risk category 5 because its share price has shown a medium to high level of volatility historically. As an investment, shares are more volatile than money market instruments and bonds.
Royal London UK Opportunities FundAchieve capital growth by exploiting a concentrated portfolio of UK company shares with the potential for above average returns.
The Fund may hold transferable securities and cash (for the purpose of Efficient Portfolio Management and redemption of units). It may also hold derivatives for the purpose of Efficient Portfolio Management only.
Risk and Reward Profile
1 2 3 4 5 6 7Lower potential risk/reward Higher potential risk/reward
The Fund is ranked in risk category 5 because its share price has shown a medium to high level of volatility historically. As an investment, shares are more volatile than money market instruments and bonds.
Royal London Japan Tracker FundAchieve the capital return of the FTSE® World Japan Index by investment primarily in the securities that make up the FTSE® World Japan Index.
The Fund may hold transferable securities, collective investment schemes (including Exchange Traded Funds), government and public securities, deposits and cash (for the purpose of Efficient Portfolio Management and redemption of units). It may also hold derivatives for the purpose of Efficient Portfolio Management only.
Risk and Reward Profile
1 2 3 4 5 6 7Lower potential risk/reward Higher potential risk/reward
The Fund is ranked in risk category 6 because its share price has shown a high level of volatility historically. As an investment, shares are more volatile than money market instruments and bonds.
Royal London FTSE® 350 Tracker FundAchieve the total return of the FTSE® 350 Index by investing primarily in the securities that make up the FTSE® 350 Index.
The Fund may hold transferable securities (including Exchange Traded Funds which are closed ended Funds, but not those which are collective investment schemes), government and public securities, deposits and cash (for the purpose of Efficient Portfolio Management and redemption of units). It may also hold derivatives for the purpose of Efficient Portfolio Management only.
Risk and Reward Profile
1 2 3 4 5 6 7Lower potential risk/reward Higher potential risk/reward
The Fund is ranked in risk category 5 because its share price has shown a medium to high level of volatility historically. As an investment, shares are more volatile than money market instruments and bonds.
Royal London UK All Share Tracker FundAchieve long term total return from capital and income through investment in UK equities from within the FTSE® All-Share Index.
The Fund may hold transferable securities (including Exchange Traded Funds which are closed ended funds), government and public securities, deposits and cash (for the purpose of Efficient Portfolio Management and redemption of units). It may also hold derivatives for the purpose of Efficient Portfolio Management only.
Risk and Reward Profile
1 2 3 4 5 6 7Lower potential risk/reward Higher potential risk/reward
The Fund is ranked in risk category 5 because its share price has shown a medium to high level of volatility historically. As an investment, shares are more volatile than money market instruments and bonds.
FACT FILE (CONTINUED)
Investment Objectives and Policies
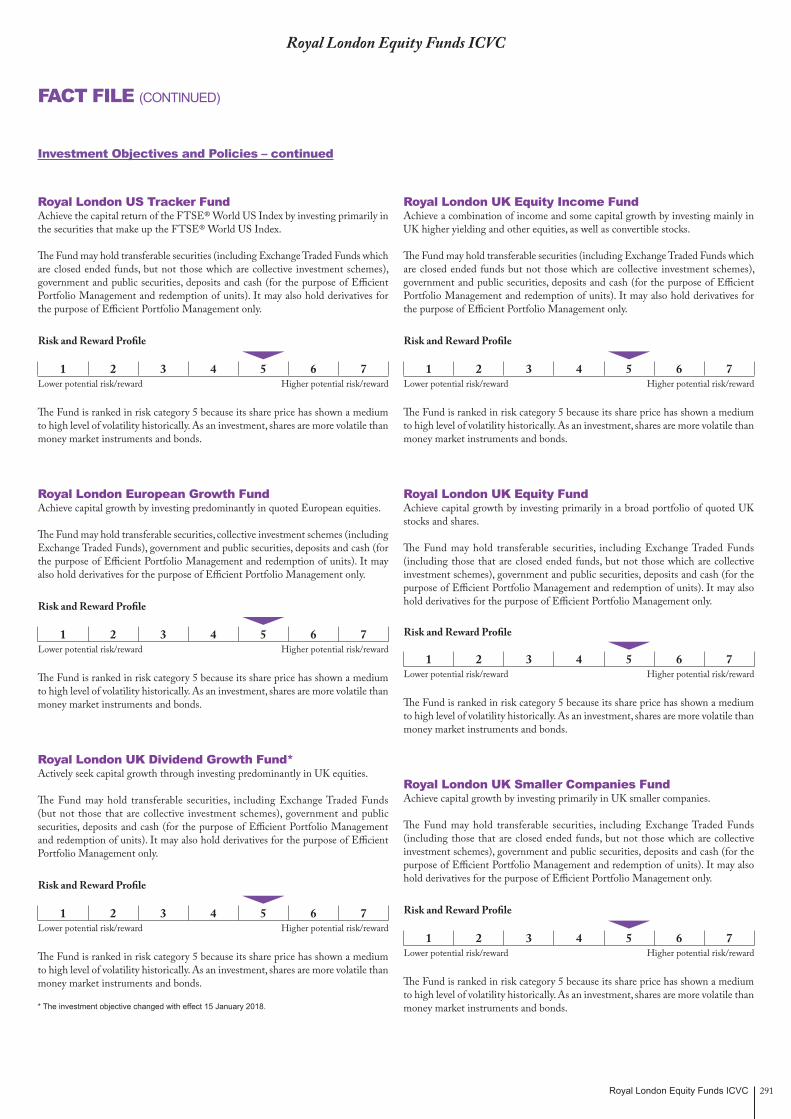
Royal London Equity Funds ICVC 291
FACT FILE (CONTINUED)
Royal London Equity Funds ICVC
Royal London US Tracker FundAchieve the capital return of the FTSE® World US Index by investing primarily in the securities that make up the FTSE® World US Index.
The Fund may hold transferable securities (including Exchange Traded Funds which are closed ended funds, but not those which are collective investment schemes), government and public securities, deposits and cash (for the purpose of Efficient Portfolio Management and redemption of units). It may also hold derivatives for the purpose of Efficient Portfolio Management only.
Risk and Reward Profile
1 2 3 4 5 6 7Lower potential risk/reward Higher potential risk/reward
The Fund is ranked in risk category 5 because its share price has shown a medium to high level of volatility historically. As an investment, shares are more volatile than money market instruments and bonds.
Royal London European Growth FundAchieve capital growth by investing predominantly in quoted European equities.
The Fund may hold transferable securities, collective investment schemes (including Exchange Traded Funds), government and public securities, deposits and cash (for the purpose of Efficient Portfolio Management and redemption of units). It may also hold derivatives for the purpose of Efficient Portfolio Management only.
Risk and Reward Profile
1 2 3 4 5 6 7Lower potential risk/reward Higher potential risk/reward
The Fund is ranked in risk category 5 because its share price has shown a medium to high level of volatility historically. As an investment, shares are more volatile than money market instruments and bonds.
Royal London UK Dividend Growth Fund*Actively seek capital growth through investing predominantly in UK equities.
The Fund may hold transferable securities, including Exchange Traded Funds (but not those that are collective investment schemes), government and public securities, deposits and cash (for the purpose of Efficient Portfolio Management and redemption of units). It may also hold derivatives for the purpose of Efficient Portfolio Management only.
Risk and Reward Profile
1 2 3 4 5 6 7Lower potential risk/reward Higher potential risk/reward
The Fund is ranked in risk category 5 because its share price has shown a medium to high level of volatility historically. As an investment, shares are more volatile than money market instruments and bonds.
* The investment objective changed with effect 15 January 2018.
Royal London UK Equity Income FundAchieve a combination of income and some capital growth by investing mainly in UK higher yielding and other equities, as well as convertible stocks.
The Fund may hold transferable securities (including Exchange Traded Funds which are closed ended funds but not those which are collective investment schemes), government and public securities, deposits and cash (for the purpose of Efficient Portfolio Management and redemption of units). It may also hold derivatives for the purpose of Efficient Portfolio Management only.
Risk and Reward Profile
1 2 3 4 5 6 7Lower potential risk/reward Higher potential risk/reward
The Fund is ranked in risk category 5 because its share price has shown a medium to high level of volatility historically. As an investment, shares are more volatile than money market instruments and bonds.
Royal London UK Equity FundAchieve capital growth by investing primarily in a broad portfolio of quoted UK stocks and shares.
The Fund may hold transferable securities, including Exchange Traded Funds (including those that are closed ended funds, but not those which are collective investment schemes), government and public securities, deposits and cash (for the purpose of Efficient Portfolio Management and redemption of units). It may also hold derivatives for the purpose of Efficient Portfolio Management only.
Risk and Reward Profile
1 2 3 4 5 6 7Lower potential risk/reward Higher potential risk/reward
The Fund is ranked in risk category 5 because its share price has shown a medium to high level of volatility historically. As an investment, shares are more volatile than money market instruments and bonds.
Royal London UK Smaller Companies FundAchieve capital growth by investing primarily in UK smaller companies.
The Fund may hold transferable securities, including Exchange Traded Funds (including those that are closed ended funds, but not those which are collective investment schemes), government and public securities, deposits and cash (for the purpose of Efficient Portfolio Management and redemption of units). It may also hold derivatives for the purpose of Efficient Portfolio Management only.
Risk and Reward Profile
1 2 3 4 5 6 7Lower potential risk/reward Higher potential risk/reward
The Fund is ranked in risk category 5 because its share price has shown a medium to high level of volatility historically. As an investment, shares are more volatile than money market instruments and bonds.
Investment Objectives and Policies – continued
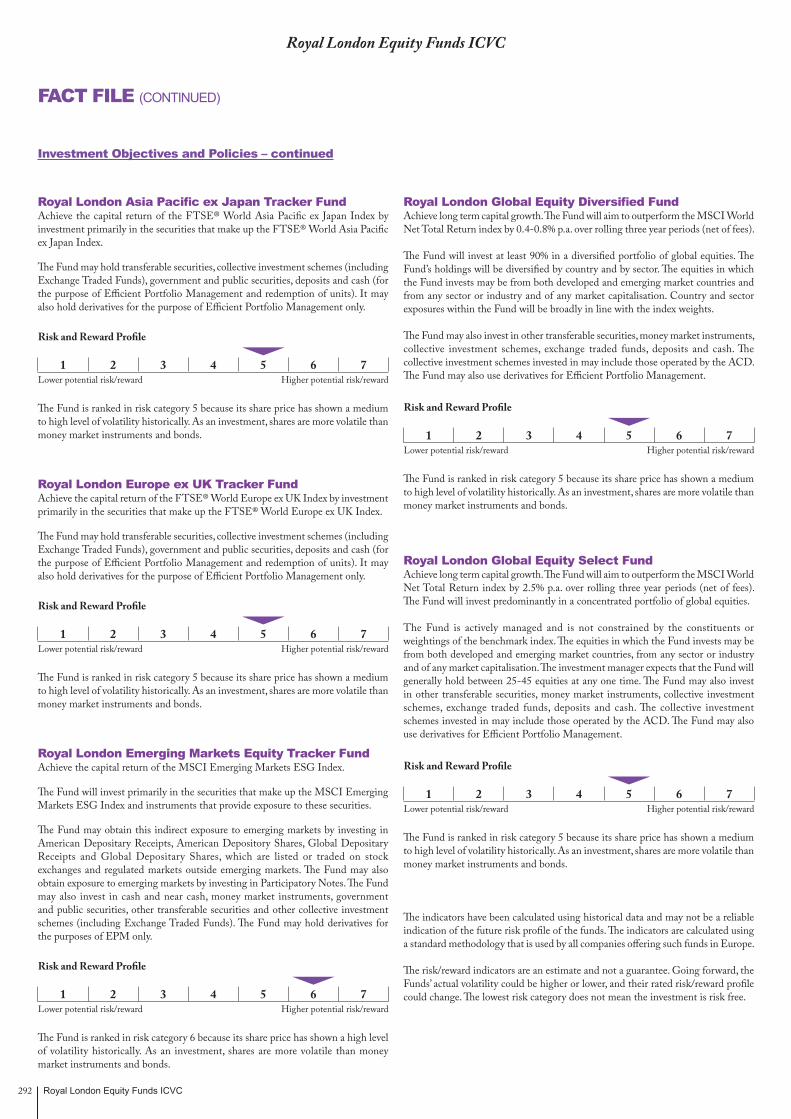
Royal London Equity Funds ICVC292
Royal London Asia Pacific ex Japan Tracker FundAchieve the capital return of the FTSE® World Asia Pacific ex Japan Index by investment primarily in the securities that make up the FTSE® World Asia Pacific ex Japan Index.
The Fund may hold transferable securities, collective investment schemes (including Exchange Traded Funds), government and public securities, deposits and cash (for the purpose of Efficient Portfolio Management and redemption of units). It may also hold derivatives for the purpose of Efficient Portfolio Management only.
Risk and Reward Profile
1 2 3 4 5 6 7Lower potential risk/reward Higher potential risk/reward
The Fund is ranked in risk category 5 because its share price has shown a medium to high level of volatility historically. As an investment, shares are more volatile than money market instruments and bonds.
Royal London Europe ex UK Tracker FundAchieve the capital return of the FTSE® World Europe ex UK Index by investment primarily in the securities that make up the FTSE® World Europe ex UK Index.
The Fund may hold transferable securities, collective investment schemes (including Exchange Traded Funds), government and public securities, deposits and cash (for the purpose of Efficient Portfolio Management and redemption of units). It may also hold derivatives for the purpose of Efficient Portfolio Management only.
Risk and Reward Profile
1 2 3 4 5 6 7Lower potential risk/reward Higher potential risk/reward
The Fund is ranked in risk category 5 because its share price has shown a medium to high level of volatility historically. As an investment, shares are more volatile than money market instruments and bonds.
Royal London Emerging Markets Equity Tracker FundAchieve the capital return of the MSCI Emerging Markets ESG Index.
The Fund will invest primarily in the securities that make up the MSCI Emerging Markets ESG Index and instruments that provide exposure to these securities.
The Fund may obtain this indirect exposure to emerging markets by investing in American Depositary Receipts, American Depository Shares, Global Depositary Receipts and Global Depositary Shares, which are listed or traded on stock exchanges and regulated markets outside emerging markets. The Fund may also obtain exposure to emerging markets by investing in Participatory Notes. The Fund may also invest in cash and near cash, money market instruments, government and public securities, other transferable securities and other collective investment schemes (including Exchange Traded Funds). The Fund may hold derivatives for the purposes of EPM only.
Risk and Reward Profile
1 2 3 4 5 6 7Lower potential risk/reward Higher potential risk/reward
The Fund is ranked in risk category 6 because its share price has shown a high level of volatility historically. As an investment, shares are more volatile than money market instruments and bonds.
Royal London Global Equity Diversified FundAchieve long term capital growth. The Fund will aim to outperform the MSCI World Net Total Return index by 0.4-0.8% p.a. over rolling three year periods (net of fees).
The Fund will invest at least 90% in a diversified portfolio of global equities. The Fund’s holdings will be diversified by country and by sector. The equities in which the Fund invests may be from both developed and emerging market countries and from any sector or industry and of any market capitalisation. Country and sector exposures within the Fund will be broadly in line with the index weights.
The Fund may also invest in other transferable securities, money market instruments, collective investment schemes, exchange traded funds, deposits and cash. The collective investment schemes invested in may include those operated by the ACD. The Fund may also use derivatives for Efficient Portfolio Management.
Risk and Reward Profile
1 2 3 4 5 6 7Lower potential risk/reward Higher potential risk/reward
The Fund is ranked in risk category 5 because its share price has shown a medium to high level of volatility historically. As an investment, shares are more volatile than money market instruments and bonds.
Royal London Global Equity Select FundAchieve long term capital growth. The Fund will aim to outperform the MSCI World Net Total Return index by 2.5% p.a. over rolling three year periods (net of fees). The Fund will invest predominantly in a concentrated portfolio of global equities.
The Fund is actively managed and is not constrained by the constituents or weightings of the benchmark index. The equities in which the Fund invests may be from both developed and emerging market countries, from any sector or industry and of any market capitalisation. The investment manager expects that the Fund will generally hold between 25-45 equities at any one time. The Fund may also invest in other transferable securities, money market instruments, collective investment schemes, exchange traded funds, deposits and cash. The collective investment schemes invested in may include those operated by the ACD. The Fund may also use derivatives for Efficient Portfolio Management.
Risk and Reward Profile
1 2 3 4 5 6 7Lower potential risk/reward Higher potential risk/reward
The Fund is ranked in risk category 5 because its share price has shown a medium to high level of volatility historically. As an investment, shares are more volatile than money market instruments and bonds.
The indicators have been calculated using historical data and may not be a reliable indication of the future risk profile of the funds. The indicators are calculated using a standard methodology that is used by all companies offering such funds in Europe.
The risk/reward indicators are an estimate and not a guarantee. Going forward, the Funds’ actual volatility could be higher or lower, and their rated risk/reward profile could change. The lowest risk category does not mean the investment is risk free.
Royal London Equity Funds ICVC
FACT FILE (CONTINUED)
Investment Objectives and Policies – continued

Royal London Equity Funds ICVC 293
APPENDIX – ADDITIONAL INFORMATION (UNAUDITED)
The Funds engage in Securities Financing Transactions (as defined in Article 3 of Regulation (EU) 2015/2365, securities financing transactions include repurchase transactions, securities or commodities lending and securities or commodities borrowing, buy-sell back transactions or sell-buy back transactions and margin lending transactions). In accordance with Article 13 of the Regulation, the Funds’ involvement in and exposures related to securities lending for the year ended 31 August 2018 are detailed below.
Royal London European Opportunities FundThe Fund carried out stock lending activities for the purpose of efficient portfolio management and in order to generate income. Revenue earned from these activities is shown in note 3.
Global dataAmount of securities and commodities on loan
% of total lendable assets*
Securities 5.69%
Amount of assets engaged in each type of SFT
Amount of assets % of AUM£25,186,385 5.50%* Total lendable assets excludes cash and cash equivalents. It also excludes other monetary amounts such as net debtors and creditors which are not deemed ‘lendable assets’.
Concentration dataTop ten collateral issuers (across all SFT)
Collateral
Issuer Holding Fair value
£’000Apple 5,700 987Royal Bank of Scotland 398,682 972Mastercard 5,900 971Alphabet 1,000 965France Government 4.25% 25/10/2023 853,829 963HP 50,300 957RSA Insurance 151,245 953Amazon.com 600 924Quest Diagnostics 10,900 924Royal Dutch Shell ‘B’ 35,496 921
All counterparties
Gross volume of outstanding transactions
CounterpartyFair value
£’000Natixis 9,269 Bank of Nova Scotia 9,108 Credit Suisse Securities (Europe) Limited 6,612 Morgan Stanley & Co International 197
25,186
Aggregate transaction dataType and quality of collateral
Type Quality*Fair value
£’000Equities n/a 23,924Bonds Investment grade 2,954
26,878* Quality of collateral has been interpreted as pertaining to bond instruments, which have been assessed and reported in accordance with whether they are considered investment grade, below investment grade or not-rated.
Maturity tenor of collateral
MaturityFair value
£’000Rolling Maturity 26,878
26,878
Currency of collateral
CurrencyFair value
£’000Sterling 6,173Euro 4,982Hong Kong dollar 2,058Japanese yen 3,773Swedish krona 921US dollar 8,971
26,878
Maturity tenor of SFTs
MaturityFair value
£’000Rolling Maturity 25,186
25,186
Country in which counterparties are established
CounterpartyAll counterparties are UK based
Return and cost
£’000% of overall
returnsFund gross return 100Agents fee (20) 20.00%Fund net return 80 80.00%
Royal London Equity Funds ICVC
Securities Financing Transactions
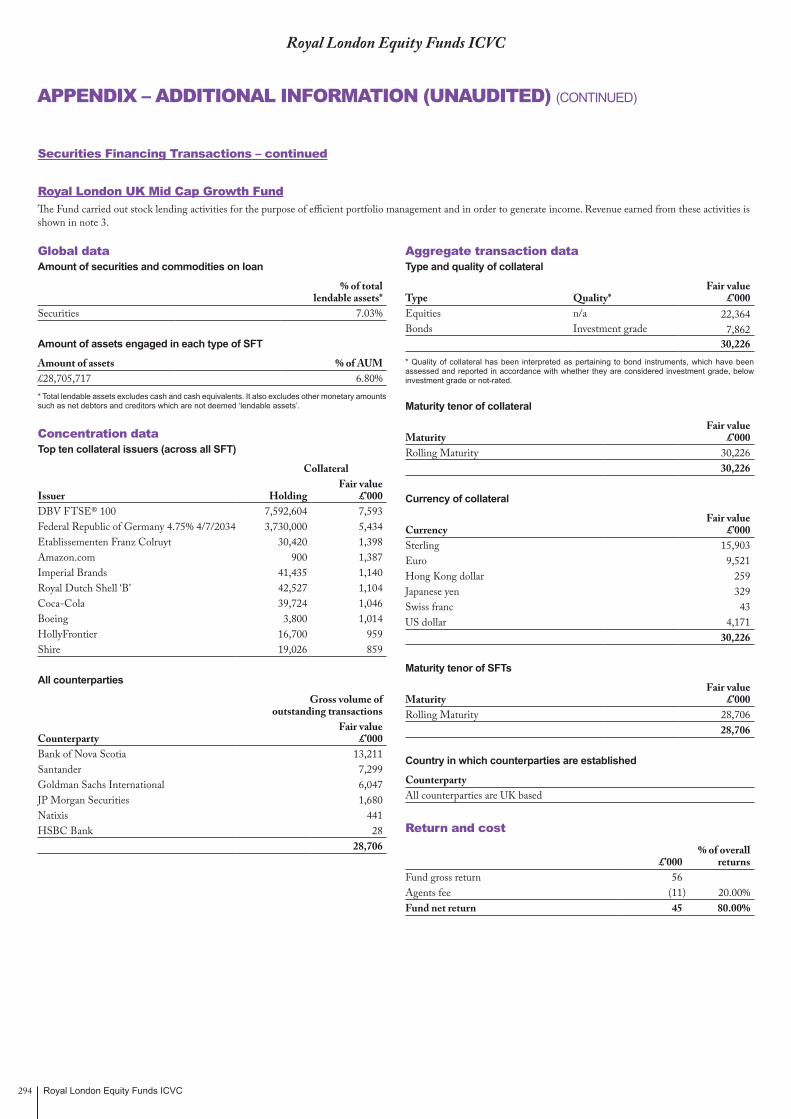
Royal London Equity Funds ICVC294
APPENDIX – ADDITIONAL INFORMATION (UNAUDITED) (CONTINUED)
Royal London UK Mid Cap Growth FundThe Fund carried out stock lending activities for the purpose of efficient portfolio management and in order to generate income. Revenue earned from these activities is shown in note 3.
Global dataAmount of securities and commodities on loan
% of total lendable assets*
Securities 7.03%
Amount of assets engaged in each type of SFT
Amount of assets % of AUM£28,705,717 6.80%* Total lendable assets excludes cash and cash equivalents. It also excludes other monetary amounts such as net debtors and creditors which are not deemed ‘lendable assets’.
Concentration dataTop ten collateral issuers (across all SFT)
Collateral
Issuer Holding Fair value
£’000DBV FTSE® 100 7,592,604 7,593Federal Republic of Germany 4.75% 4/7/2034 3,730,000 5,434Etablissementen Franz Colruyt 30,420 1,398Amazon.com 900 1,387Imperial Brands 41,435 1,140Royal Dutch Shell ‘B’ 42,527 1,104Coca-Cola 39,724 1,046Boeing 3,800 1,014HollyFrontier 16,700 959Shire 19,026 859
All counterparties
Gross volume of outstanding transactions
CounterpartyFair value
£’000Bank of Nova Scotia 13,211 Santander 7,299 Goldman Sachs International 6,047 JP Morgan Securities 1,680 Natixis 441 HSBC Bank 28
28,706
Aggregate transaction dataType and quality of collateral
Type Quality*Fair value
£’000Equities n/a 22,364Bonds Investment grade 7,862
30,226* Quality of collateral has been interpreted as pertaining to bond instruments, which have been assessed and reported in accordance with whether they are considered investment grade, below investment grade or not-rated.
Maturity tenor of collateral
MaturityFair value
£’000Rolling Maturity 30,226
30,226
Currency of collateral
CurrencyFair value
£’000Sterling 15,903Euro 9,521Hong Kong dollar 259Japanese yen 329Swiss franc 43US dollar 4,171
30,226
Maturity tenor of SFTs
MaturityFair value
£’000Rolling Maturity 28,706
28,706
Country in which counterparties are established
CounterpartyAll counterparties are UK based
Return and cost
£’000% of overall
returnsFund gross return 56Agents fee (11) 20.00%Fund net return 45 80.00%
Royal London Equity Funds ICVC
Securities Financing Transactions – continued

Royal London Equity Funds ICVC 295
APPENDIX – ADDITIONAL INFORMATION (UNAUDITED) (CONTINUED)
Royal London UK Opportunities FundThe Fund carried out stock lending activities for the purpose of efficient portfolio management and in order to generate income. Revenue earned from these activities is shown in note 3.
Global dataAmount of securities and commodities on loan
% of total lendable assets*
Securities 6.85%
Amount of assets engaged in each type of SFT
Amount of assets % of AUM£52,753,444 6.69%* Total lendable assets excludes cash and cash equivalents. It also excludes other monetary amounts such as net debtors and creditors which are not deemed ‘lendable assets’.
Concentration dataTop ten collateral issuers (across all SFT)
Collateral
Issuer Holding Fair value
£’000DBV FTSE® 100 17,975,337 17,975 Rolls-Royce 303,797 3,088 3i Group 339,276 3,088 AXA 157,105 3,084 easyJet 199,427 3,048 Tesco 1,231,851 3,014 Shire 66,147 2,985 Amazon.com 1,600 2,465 RLX 137,045 2,357 Royal Bank of Scotland 691,675 1,687
All counterparties
Gross volume of outstanding transactions
CounterpartyFair value
£’000Bank of Nova Scotia 28,173Santander 17,112JP Morgan Securities 3,480Citigroup 2,531Goldman Sachs International 1,183ABN Amro Bank 274
52,753
Aggregate transaction dataType and quality of collateral
Type Quality*Fair value
£’000Equities n/a 55,056Bonds Investment grade 1,536
56,592* Quality of collateral has been interpreted as pertaining to bond instruments, which have been assessed and reported in accordance with whether they are considered investment grade, below investment grade or not-rated.
Maturity tenor of collateral
MaturityFair value
£’000Rolling Maturity 56,592
56,592
Currency of collateral
CurrencyFair value
£’000Sterling 38,604Euro 9,841Japanese yen 84Swiss franc 73US dollar 7,990
56,592
Maturity tenor of SFTs
MaturityFair value
£’000Rolling Maturity 52,753
52,753
Country in which counterparties are established
CounterpartyAll counterparties are UK based
Return and cost
£’000% of overall
returnsFund gross return 35Agents fee (7) 20.00%Fund net return 28 80.00%
Royal London Equity Funds ICVC
Securities Financing Transactions – continued
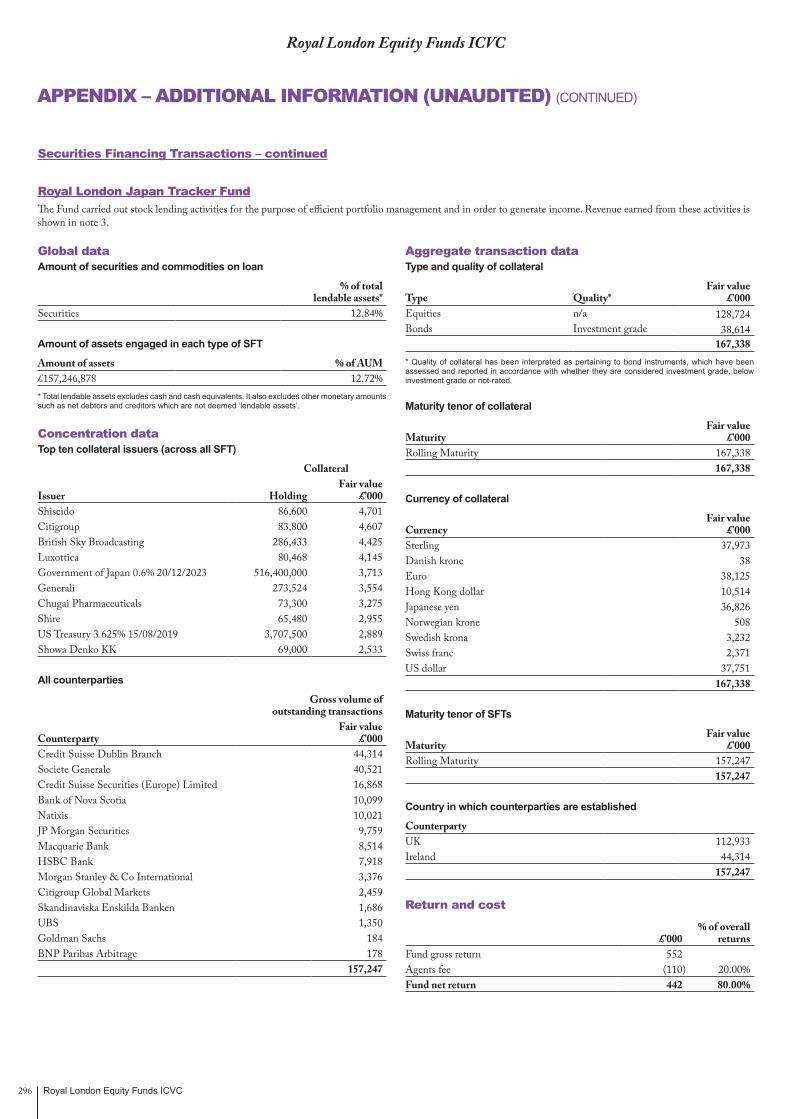
Royal London Equity Funds ICVC296
APPENDIX – ADDITIONAL INFORMATION (UNAUDITED) (CONTINUED)
Royal London Japan Tracker FundThe Fund carried out stock lending activities for the purpose of efficient portfolio management and in order to generate income. Revenue earned from these activities is shown in note 3.
Global dataAmount of securities and commodities on loan
% of total lendable assets*
Securities 12.84%
Amount of assets engaged in each type of SFT
Amount of assets % of AUM£157,246,878 12.72%* Total lendable assets excludes cash and cash equivalents. It also excludes other monetary amounts such as net debtors and creditors which are not deemed ‘lendable assets’.
Concentration dataTop ten collateral issuers (across all SFT)
Collateral
Issuer Holding Fair value
£’000Shiseido 86,600 4,701Citigroup 83,800 4,607British Sky Broadcasting 286,433 4,425Luxottica 80,468 4,145Government of Japan 0.6% 20/12/2023 516,400,000 3,713Generali 273,524 3,554Chugai Pharmaceuticals 73,300 3,275Shire 65,480 2,955US Treasury 3.625% 15/08/2019 3,707,500 2,889Showa Denko KK 69,000 2,533
All counterparties
Gross volume of outstanding transactions
CounterpartyFair value
£’000Credit Suisse Dublin Branch 44,314 Societe Generale 40,521 Credit Suisse Securities (Europe) Limited 16,868 Bank of Nova Scotia 10,099 Natixis 10,021 JP Morgan Securities 9,759 Macquarie Bank 8,514 HSBC Bank 7,918 Morgan Stanley & Co International 3,376 Citigroup Global Markets 2,459 Skandinaviska Enskilda Banken 1,686 UBS 1,350 Goldman Sachs 184 BNP Paribas Arbitrage 178
157,247
Aggregate transaction dataType and quality of collateral
Type Quality*Fair value
£’000Equities n/a 128,724Bonds Investment grade 38,614
167,338* Quality of collateral has been interpreted as pertaining to bond instruments, which have been assessed and reported in accordance with whether they are considered investment grade, below investment grade or not-rated.
Maturity tenor of collateral
MaturityFair value
£’000Rolling Maturity 167,338
167,338
Currency of collateral
CurrencyFair value
£’000Sterling 37,973Danish krone 38Euro 38,125Hong Kong dollar 10,514Japanese yen 36,826Norwegian krone 508Swedish krona 3,232Swiss franc 2,371US dollar 37,751
167,338
Maturity tenor of SFTs
MaturityFair value
£’000Rolling Maturity 157,247
157,247
Country in which counterparties are established
CounterpartyUK 112,933 Ireland 44,314
157,247
Return and cost
£’000% of overall
returnsFund gross return 552 Agents fee (110) 20.00%Fund net return 442 80.00%
Royal London Equity Funds ICVC
Securities Financing Transactions – continued
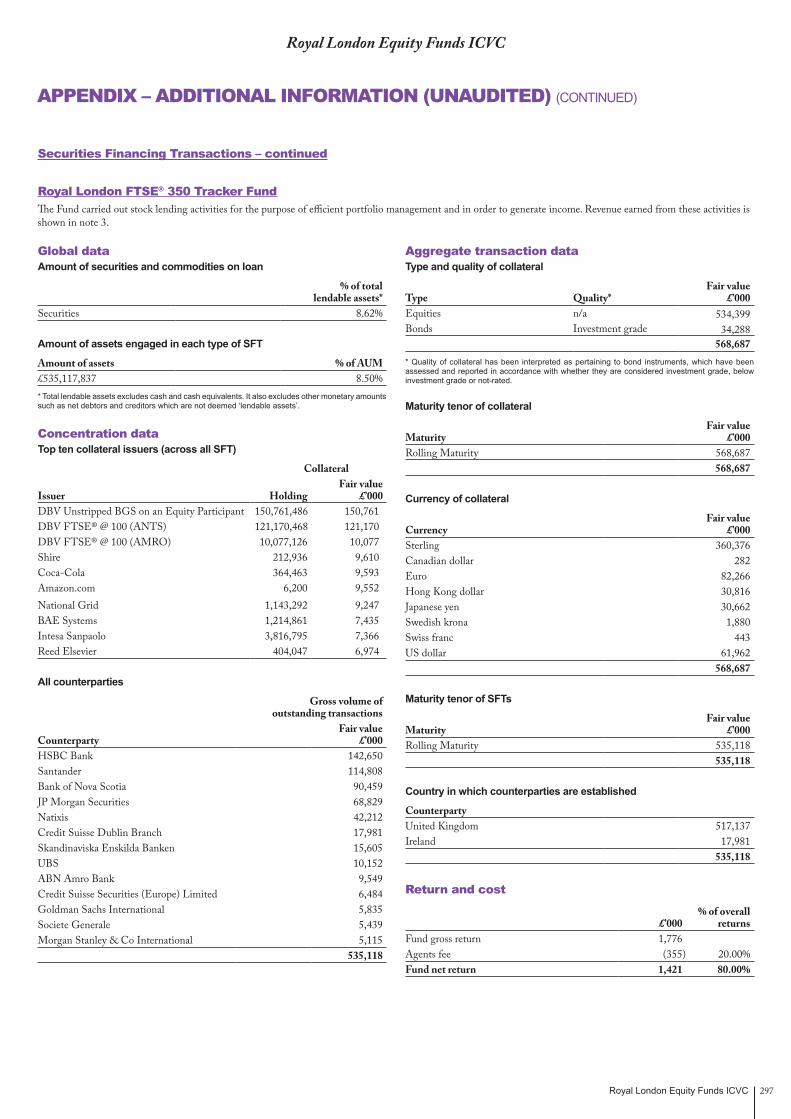
Royal London Equity Funds ICVC 297
APPENDIX – ADDITIONAL INFORMATION (UNAUDITED) (CONTINUED)
Royal London FTSE® 350 Tracker FundThe Fund carried out stock lending activities for the purpose of efficient portfolio management and in order to generate income. Revenue earned from these activities is shown in note 3.
Global dataAmount of securities and commodities on loan
% of total lendable assets*
Securities 8.62%
Amount of assets engaged in each type of SFT
Amount of assets % of AUM£535,117,837 8.50%* Total lendable assets excludes cash and cash equivalents. It also excludes other monetary amounts such as net debtors and creditors which are not deemed ‘lendable assets’.
Concentration dataTop ten collateral issuers (across all SFT)
Collateral
Issuer Holding Fair value
£’000DBV Unstripped BGS on an Equity Participant 150,761,486 150,761DBV FTSE® @ 100 (ANTS) 121,170,468 121,170DBV FTSE® @ 100 (AMRO) 10,077,126 10,077Shire 212,936 9,610Coca-Cola 364,463 9,593Amazon.com 6,200 9,552National Grid 1,143,292 9,247BAE Systems 1,214,861 7,435Intesa Sanpaolo 3,816,795 7,366Reed Elsevier 404,047 6,974
All counterparties
Gross volume of outstanding transactions
CounterpartyFair value
£’000HSBC Bank 142,650 Santander 114,808 Bank of Nova Scotia 90,459 JP Morgan Securities 68,829 Natixis 42,212 Credit Suisse Dublin Branch 17,981 Skandinaviska Enskilda Banken 15,605 UBS 10,152 ABN Amro Bank 9,549 Credit Suisse Securities (Europe) Limited 6,484 Goldman Sachs International 5,835 Societe Generale 5,439 Morgan Stanley & Co International 5,115
535,118
Aggregate transaction dataType and quality of collateral
Type Quality*Fair value
£’000Equities n/a 534,399Bonds Investment grade 34,288
568,687* Quality of collateral has been interpreted as pertaining to bond instruments, which have been assessed and reported in accordance with whether they are considered investment grade, below investment grade or not-rated.
Maturity tenor of collateral
MaturityFair value
£’000Rolling Maturity 568,687
568,687
Currency of collateral
CurrencyFair value
£’000Sterling 360,376 Canadian dollar 282 Euro 82,266 Hong Kong dollar 30,816 Japanese yen 30,662 Swedish krona 1,880 Swiss franc 443 US dollar 61,962
568,687
Maturity tenor of SFTs
MaturityFair value
£’000Rolling Maturity 535,118
535,118
Country in which counterparties are established
CounterpartyUnited Kingdom 517,137 Ireland 17,981
535,118
Return and cost
£’000% of overall
returnsFund gross return 1,776Agents fee (355) 20.00%Fund net return 1,421 80.00%
Royal London Equity Funds ICVC
Securities Financing Transactions – continued
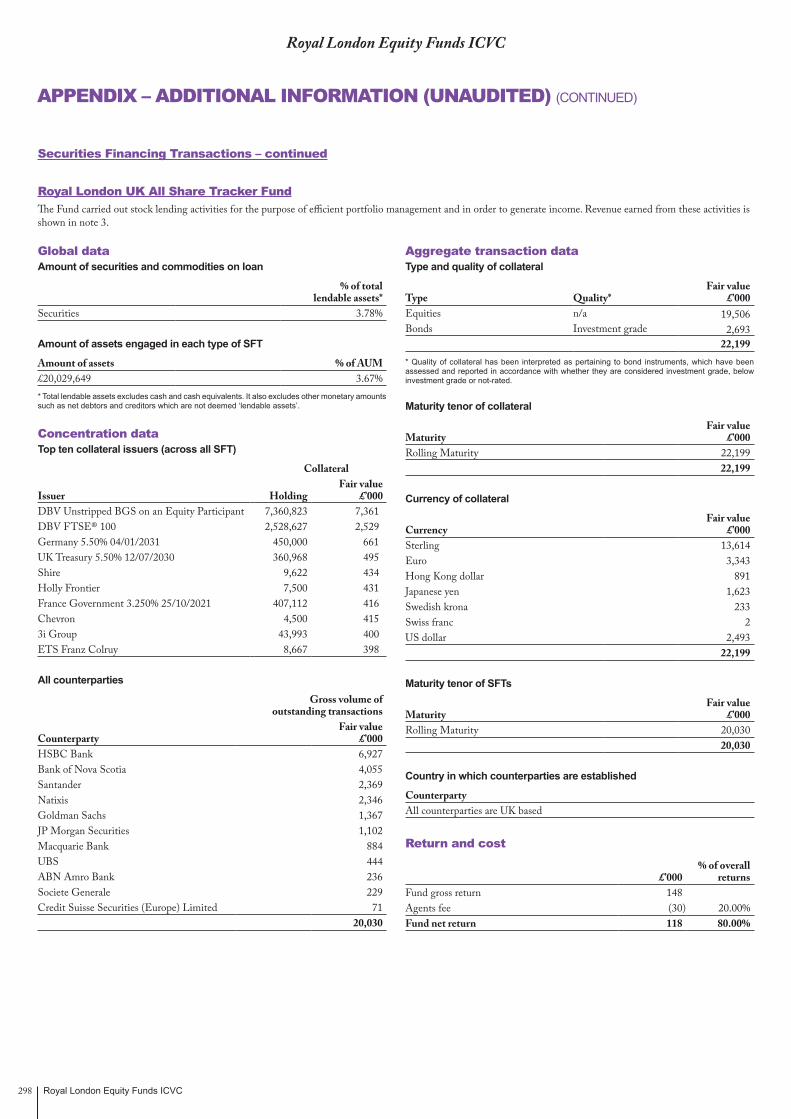
Royal London Equity Funds ICVC298
APPENDIX – ADDITIONAL INFORMATION (UNAUDITED) (CONTINUED)
Royal London UK All Share Tracker FundThe Fund carried out stock lending activities for the purpose of efficient portfolio management and in order to generate income. Revenue earned from these activities is shown in note 3.
Global dataAmount of securities and commodities on loan
% of total lendable assets*
Securities 3.78%
Amount of assets engaged in each type of SFT
Amount of assets % of AUM£20,029,649 3.67%* Total lendable assets excludes cash and cash equivalents. It also excludes other monetary amounts such as net debtors and creditors which are not deemed ‘lendable assets’.
Concentration dataTop ten collateral issuers (across all SFT)
Collateral
Issuer Holding Fair value
£’000DBV Unstripped BGS on an Equity Participant 7,360,823 7,361DBV FTSE® 100 2,528,627 2,529Germany 5.50% 04/01/2031 450,000 661UK Treasury 5.50% 12/07/2030 360,968 495Shire 9,622 434Holly Frontier 7,500 431France Government 3.250% 25/10/2021 407,112 416Chevron 4,500 4153i Group 43,993 400ETS Franz Colruy 8,667 398
All counterparties
Gross volume of outstanding transactions
CounterpartyFair value
£’000HSBC Bank 6,927 Bank of Nova Scotia 4,055 Santander 2,369 Natixis 2,346 Goldman Sachs 1,367 JP Morgan Securities 1,102 Macquarie Bank 884 UBS 444 ABN Amro Bank 236 Societe Generale 229 Credit Suisse Securities (Europe) Limited 71
20,030
Aggregate transaction dataType and quality of collateral
Type Quality*Fair value
£’000Equities n/a 19,506Bonds Investment grade 2,693
22,199* Quality of collateral has been interpreted as pertaining to bond instruments, which have been assessed and reported in accordance with whether they are considered investment grade, below investment grade or not-rated.
Maturity tenor of collateral
MaturityFair value
£’000Rolling Maturity 22,199
22,199
Currency of collateral
CurrencyFair value
£’000Sterling 13,614Euro 3,343Hong Kong dollar 891Japanese yen 1,623Swedish krona 233Swiss franc 2US dollar 2,493
22,199
Maturity tenor of SFTs
MaturityFair value
£’000Rolling Maturity 20,030
20,030
Country in which counterparties are established
CounterpartyAll counterparties are UK based
Return and cost
£’000% of overall
returnsFund gross return 148Agents fee (30) 20.00%Fund net return 118 80.00%
Royal London Equity Funds ICVC
Securities Financing Transactions – continued

Royal London Equity Funds ICVC 299
APPENDIX – ADDITIONAL INFORMATION (UNAUDITED) (CONTINUED)
Royal London US Tracker FundThe Fund carried out stock lending activities for the purpose of efficient portfolio management and in order to generate income. Revenue earned from these activities is shown in note 3.
Global dataAmount of securities and commodities on loan
% of total lendable assets*
Securities 8.38%
Amount of assets engaged in each type of SFT
Amount of assets % of AUM£478,274,040 8.33%* Total lendable assets excludes cash and cash equivalents. It also excludes other monetary amounts such as net debtors and creditors which are not deemed ‘lendable assets’.
Concentration dataTop ten collateral issuers (across all SFT)
Collateral
Issuer Holding Fair value
£’000National Grid 1,890,032 15,287Shire 325,910 14,708British American Tobacco 333,617 12,606UK Treasury 1.875% 22/11/2022 7,373,251 11,901Royal Bank of Scotland 4,807,667 11,726Standard Life Aberdeen 3,606,798 11,466Government of France 3.25% 25/10/2021 11,128,598 11,383Coca-Cola 432,359 11,380Government of Japan 01/10/2019 1,607,650,000 11,161Apple 56,800 9,834
All counterparties
Gross volume of outstanding transactions
CounterpartyFair value
£’000HSBC Bank 136,133 Bank of Nova Scotia 105,851 Societe Generale 77,812 UBS 76,993 Natixis 64,082 Credit Suisse Dublin Branch 10,440 JP Morgan Securities 4,043 Credit Suisse Securities (Europe) Limited 2,920
478,274
Aggregate transaction dataType and quality of collateral
Type Quality*Fair value
£’000Equities n/a 414,667Bonds Investment grade 106,828
521,495* Quality of collateral has been interpreted as pertaining to bond instruments, which have been assessed and reported in accordance with whether they are considered investment grade, below investment grade or not-rated.
Maturity tenor of collateral
MaturityFair value
£’000Rolling Maturity 521,495
521,495
Currency of collateral
CurrencyFair value
£’000Sterling 242,521 Canadian dollar 2,723 Danish krone 102 Euro 109,486 Hong Kong dollar 6,458 Japanese yen 41,464 Norwegian krone 1,610 Swedish krona 1,108 Swiss franc 751 US dollar 115,272
521,495
Maturity tenor of SFTs
MaturityFair value
£’000Rolling Maturity 478,274
478,274
Country in which counterparties are established
CounterpartyUnited Kingdom 467,834 Ireland 10,440
478,274
Return and cost
£’000% of overall
returnsFund gross return 754Agents fee (151) 20.00%Fund net return 603 80.00%
Royal London Equity Funds ICVC
Securities Financing Transactions – continued

Royal London Equity Funds ICVC300
APPENDIX – ADDITIONAL INFORMATION (UNAUDITED) (CONTINUED)
Royal London European Growth FundThe Fund carried out stock lending activities for the purpose of efficient portfolio management and in order to generate income. Revenue earned from these activities is shown in note 3.
Global dataAmount of securities and commodities on loan
% of total lendable assets*
Securities 2.98%
Amount of assets engaged in each type of SFT
Amount of assets % of AUM£26,782,372 2.90%* Total lendable assets excludes cash and cash equivalents. It also excludes other monetary amounts such as net debtors and creditors which are not deemed ‘lendable assets’.
Concentration dataTop ten collateral issuers (across all SFT)
Collateral
Issuer Holding Fair value
£’000Japan 2.2% 20/06/2024 306,400,000 2,412Japan 2.2% 20/03/2049 242,800,000 2,316UK Treasury 1.875% 22/11/2022 720,061 1,162Federal Republic of Germany 4.75% 04/07/2028 886,090 1,141Government of Austria 3.50% 15/09/2021 1,050,000 1,084Otsuka Holdings 28,700 1,038Kao 17,300 1,035British Sky Broadcasting 66,934 1,034Bridgestone 36,300 1,031Bank of China 2,957,000 1,023
All counterparties
Gross volume of outstanding transactions
CounterpartyFair value
£’000Morgan Stanley & Co International 11,455 Credit Suisse Securities (Europe) Limited 9,712 HSBC Bank 4,387 Natixis 1,119 Skandinaviska Enskilda Banken 109
26,782
Aggregate transaction dataType and quality of collateral
Type Quality*Fair value
£’000Equities n/a 14,530Bonds Investment grade 15,254
29,784* Quality of collateral has been interpreted as pertaining to bond instruments, which have been assessed and reported in accordance with whether they are considered investment grade, below investment grade or not-rated.
Maturity tenor of collateral
MaturityFair value
£’000Rolling Maturity 29,784
29,784
Currency of collateral
CurrencyFair value
£’000Sterling 5,138Danish krone 51Euro 7,895Hong Kong dollar 1,445Japanese yen 11,552Norwegian krone 8Swedish krona 51Swiss franc 142US dollar 3,502
29,784
Maturity tenor of SFTs
MaturityFair value
£’000Rolling Maturity 26,782
26,782
Country in which counterparties are established
CounterpartyAll counterparties are UK based
Return and cost
£’000% of overall
returnsFund gross return 140Agents fee (28) 20.00%Fund net return 112 80.00%
Royal London Equity Funds ICVC
Securities Financing Transactions – continued

Royal London Equity Funds ICVC 301
APPENDIX – ADDITIONAL INFORMATION (UNAUDITED) (CONTINUED)
Royal London UK Dividend Growth Fund (Formerly Royal London UK Growth Fund)The Fund carried out stock lending activities for the purpose of efficient portfolio management and in order to generate income. Revenue earned from these activities is shown in note 3.
Global dataAmount of securities and commodities on loan
% of total lendable assets*
Securities 5.19%
Amount of assets engaged in each type of SFT
Amount of assets % of AUM£42,961,124 5.08%* Total lendable assets excludes cash and cash equivalents. It also excludes other monetary amounts such as net debtors and creditors which are not deemed ‘lendable assets’.
Concentration dataTop ten collateral issuers (across all SFT)
Collateral
Issuer Holding Fair value
£’000DBV FTSE® 100 19,296,900 19,297Germany 4.75% 15/7/2024 1,700,000 1,699Shire 29,656 1,338Royal Bank of Scotland 548,773 1,3383i Group 138,165 1,257Amazon.com 800 1,232Reed Elsevier 70,117 1,210Tesco 493,129 1,207BHP Billiton 71,188 1,186Germany 6.25% 04/1/2030 751,000 1,138
All counterparties
Gross volume of outstanding transactions
CounterpartyFair value
£’000Banco Santander 18,655 Bank of Nova Scotia 12,370 JP Morgan Securities 8,644 Goldman Sachs International 3,198 HSBC Bank 94
42,961
Aggregate transaction dataType and quality of collateral
Type Quality*Fair value
£’000Equities n/a 22,557Bonds Investment grade 22,684
45,241* Quality of collateral has been interpreted as pertaining to bond instruments, which have been assessed and reported in accordance with whether they are considered investment grade, below investment grade or not-rated.
Maturity tenor of collateral
MaturityFair value
£’000Rolling Maturity 45,241
45,241
Currency of collateral
CurrencyFair value
£’000Sterling 28,840Euro 6,891Hong Kong dollar 5,570Japanese yen 434US dollar 3,506
45,241
Maturity tenor of SFTs
MaturityFair value
£’000Rolling Maturity 42,961
42,961
Country in which counterparties are established
CounterpartyAll counterparties are UK based
Return and cost
£’000% of overall
returnsFund gross return 286Agents fee (57) 20.00%Fund net return 229 80.00%
Royal London Equity Funds ICVC
Securities Financing Transactions – continued
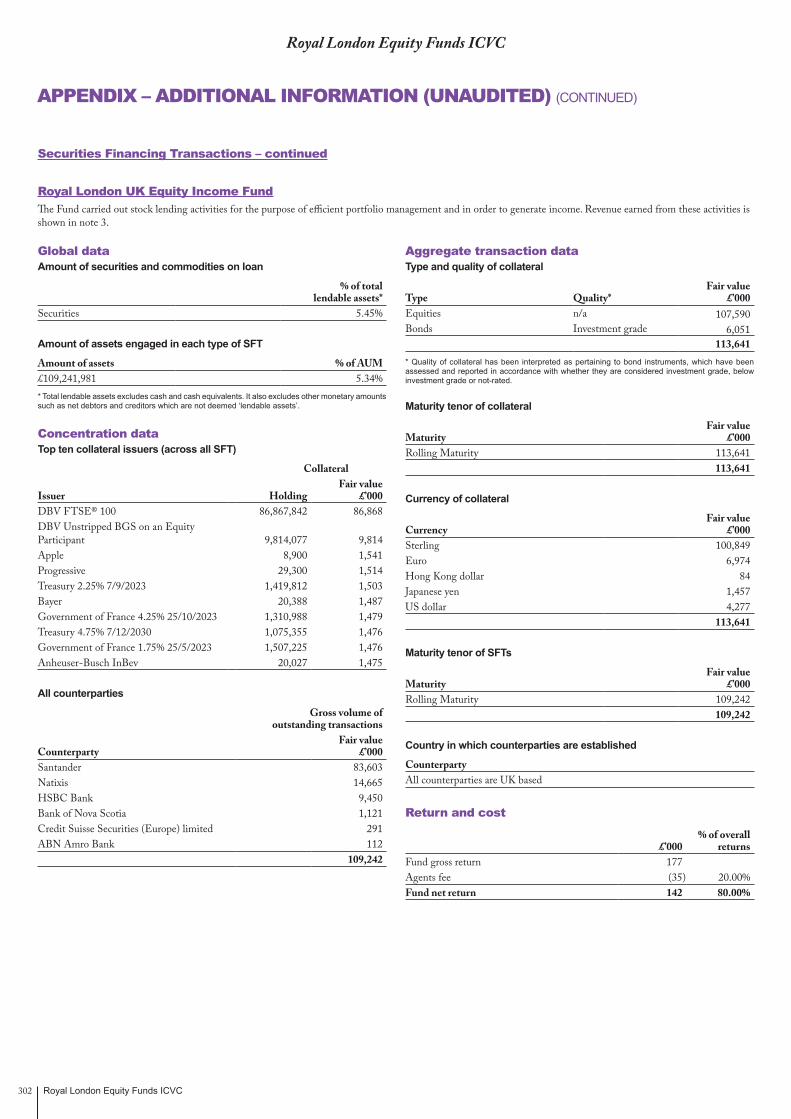
Royal London Equity Funds ICVC302
APPENDIX – ADDITIONAL INFORMATION (UNAUDITED) (CONTINUED)
Royal London UK Equity Income FundThe Fund carried out stock lending activities for the purpose of efficient portfolio management and in order to generate income. Revenue earned from these activities is shown in note 3.
Global dataAmount of securities and commodities on loan
% of total lendable assets*
Securities 5.45%
Amount of assets engaged in each type of SFT
Amount of assets % of AUM£109,241,981 5.34%* Total lendable assets excludes cash and cash equivalents. It also excludes other monetary amounts such as net debtors and creditors which are not deemed ‘lendable assets’.
Concentration dataTop ten collateral issuers (across all SFT)
Collateral
Issuer Holding Fair value
£’000DBV FTSE® 100 86,867,842 86,868DBV Unstripped BGS on an Equity Participant 9,814,077 9,814Apple 8,900 1,541Progressive 29,300 1,514Treasury 2.25% 7/9/2023 1,419,812 1,503Bayer 20,388 1,487Government of France 4.25% 25/10/2023 1,310,988 1,479Treasury 4.75% 7/12/2030 1,075,355 1,476Government of France 1.75% 25/5/2023 1,507,225 1,476 Anheuser-Busch InBev 20,027 1,475
All counterparties
Gross volume of outstanding transactions
CounterpartyFair value
£’000Santander 83,603 Natixis 14,665 HSBC Bank 9,450 Bank of Nova Scotia 1,121 Credit Suisse Securities (Europe) limited 291 ABN Amro Bank 112
109,242
Aggregate transaction dataType and quality of collateral
Type Quality*Fair value
£’000Equities n/a 107,590Bonds Investment grade 6,051
113,641* Quality of collateral has been interpreted as pertaining to bond instruments, which have been assessed and reported in accordance with whether they are considered investment grade, below investment grade or not-rated.
Maturity tenor of collateral
MaturityFair value
£’000Rolling Maturity 113,641
113,641
Currency of collateral
CurrencyFair value
£’000Sterling 100,849Euro 6,974Hong Kong dollar 84Japanese yen 1,457US dollar 4,277
113,641
Maturity tenor of SFTs
MaturityFair value
£’000Rolling Maturity 109,242
109,242
Country in which counterparties are established
CounterpartyAll counterparties are UK based
Return and cost
£’000% of overall
returnsFund gross return 177Agents fee (35) 20.00%Fund net return 142 80.00%
Royal London Equity Funds ICVC
Securities Financing Transactions – continued
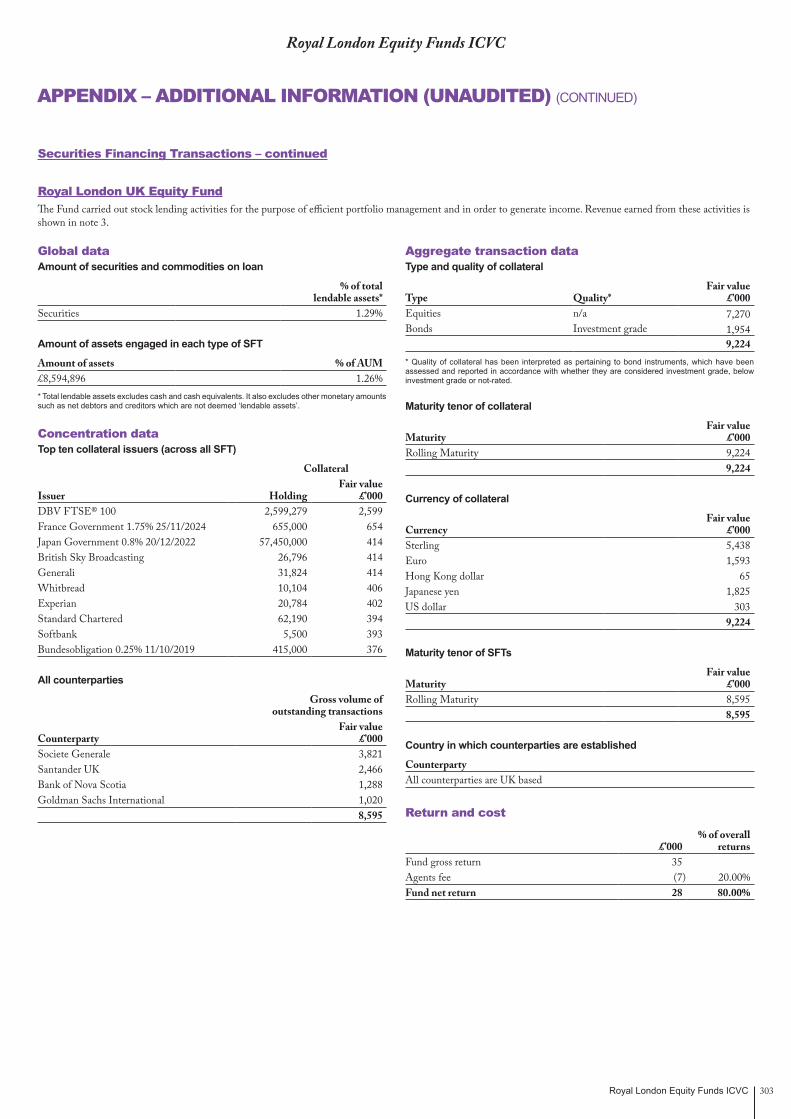
Royal London Equity Funds ICVC 303
APPENDIX – ADDITIONAL INFORMATION (UNAUDITED) (CONTINUED)
Royal London UK Equity FundThe Fund carried out stock lending activities for the purpose of efficient portfolio management and in order to generate income. Revenue earned from these activities is shown in note 3.
Global dataAmount of securities and commodities on loan
% of total lendable assets*
Securities 1.29%
Amount of assets engaged in each type of SFT
Amount of assets % of AUM£8,594,896 1.26%* Total lendable assets excludes cash and cash equivalents. It also excludes other monetary amounts such as net debtors and creditors which are not deemed ‘lendable assets’.
Concentration dataTop ten collateral issuers (across all SFT)
Collateral
Issuer Holding Fair value
£’000DBV FTSE® 100 2,599,279 2,599France Government 1.75% 25/11/2024 655,000 654Japan Government 0.8% 20/12/2022 57,450,000 414British Sky Broadcasting 26,796 414Generali 31,824 414Whitbread 10,104 406Experian 20,784 402Standard Chartered 62,190 394Softbank 5,500 393Bundesobligation 0.25% 11/10/2019 415,000 376
All counterparties
Gross volume of outstanding transactions
CounterpartyFair value
£’000Societe Generale 3,821 Santander UK 2,466 Bank of Nova Scotia 1,288 Goldman Sachs International 1,020
8,595
Aggregate transaction dataType and quality of collateral
Type Quality*Fair value
£’000Equities n/a 7,270Bonds Investment grade 1,954
9,224* Quality of collateral has been interpreted as pertaining to bond instruments, which have been assessed and reported in accordance with whether they are considered investment grade, below investment grade or not-rated.
Maturity tenor of collateral
MaturityFair value
£’000Rolling Maturity 9,224
9,224
Currency of collateral
CurrencyFair value
£’000Sterling 5,438Euro 1,593Hong Kong dollar 65Japanese yen 1,825US dollar 303
9,224
Maturity tenor of SFTs
MaturityFair value
£’000Rolling Maturity 8,595
8,595
Country in which counterparties are established
CounterpartyAll counterparties are UK based
Return and cost
£’000% of overall
returnsFund gross return 35Agents fee (7) 20.00%Fund net return 28 80.00%
Royal London Equity Funds ICVC
Securities Financing Transactions – continued

Royal London Equity Funds ICVC304
APPENDIX – ADDITIONAL INFORMATION (UNAUDITED) (CONTINUED)
Royal London Asia Pacific ex Japan Tracker FundThe Fund carried out stock lending activities for the purpose of efficient portfolio management and in order to generate income. Revenue earned from these activities is shown in note 3.
Global dataAmount of securities and commodities on loan
% of total lendable assets*
Securities 10.81%
Amount of assets engaged in each type of SFT
Amount of assets % of AUM£90,745,484 10.31%* Total lendable assets excludes cash and cash equivalents. It also excludes other monetary amounts such as net debtors and creditors which are not deemed ‘lendable assets’.
Concentration dataTop ten collateral issuers (across all SFT)
Collateral
Issuer Holding Fair value
£’000UK Treasury 0.625% 22/3/2040 1,951,711 3,976 France Government of 1.75% 25/11/2024 3,905,000 3,900 Belgium Kingdom of 3% 22/6/2034 3,153,046 3,580 France Government of 4.25% 25/4/2024 3,420,000 3,202 Germany 0.25% 11/10/2019 3,150,000 2,854 British Sky Broadcasting 166,128 2,567 China Construction Bank 3,353,000 2,284 Netherlands Government of 1.75% 15/7/2023 2,133,394 2,096 Austria Republic of 1.15% 19/10/2018 1,893,000 1,715 Intesa 887,676 1,713
All counterparties
Gross volume of outstanding transactions
CounterpartyFair value
£’000Credit Suisse Securities 24,006 BNP Paribas 16,149 Goldman Sachs International 9,634 JP Morgan Securities 9,604 Credit Suisse Securities (Dublin) 8,356 Macquarie Bank 5,255 HSBC Bank 4,833 Bank of Nova Scotia 4,056 UBS AG 4,015 Societe Generale 2,391 Natixis 1,482 Morgan Stanley Securities 964
90,745
Aggregate transaction dataType and quality of collateral
Type Quality*Fair value
£’000Equities n/a 60,175Bonds Investment grade 39,830
100,005* Quality of collateral has been interpreted as pertaining to bond instruments, which have been assessed and reported in accordance with whether they are considered investment grade, below investment grade or not-rated.
Maturity tenor of collateral
MaturityFair value
£’000Rolling Maturity 100,005
100,005
Currency of collateral
CurrencyFair value
£’000Sterling 15,676Canadian dollar 540Danish krone 32Euro 46,291Hong Kong dollar 15,166Japanese yen 9,589Norwegian krone 122Swedish krona 513US dollar 12,076
100,005
Maturity tenor of SFTs
MaturityFair value
£’000Rolling Maturity 90,745
90,745
Country in which counterparties are established
CounterpartyUnited Kingdom 82,389Ireland 8,356
90,745
Return and cost
£’000% of overall
returnsFund gross return 665Agents fee (133) 20.00%Fund net return 532 80.00%
Royal London Equity Funds ICVC
Securities Financing Transactions – continued
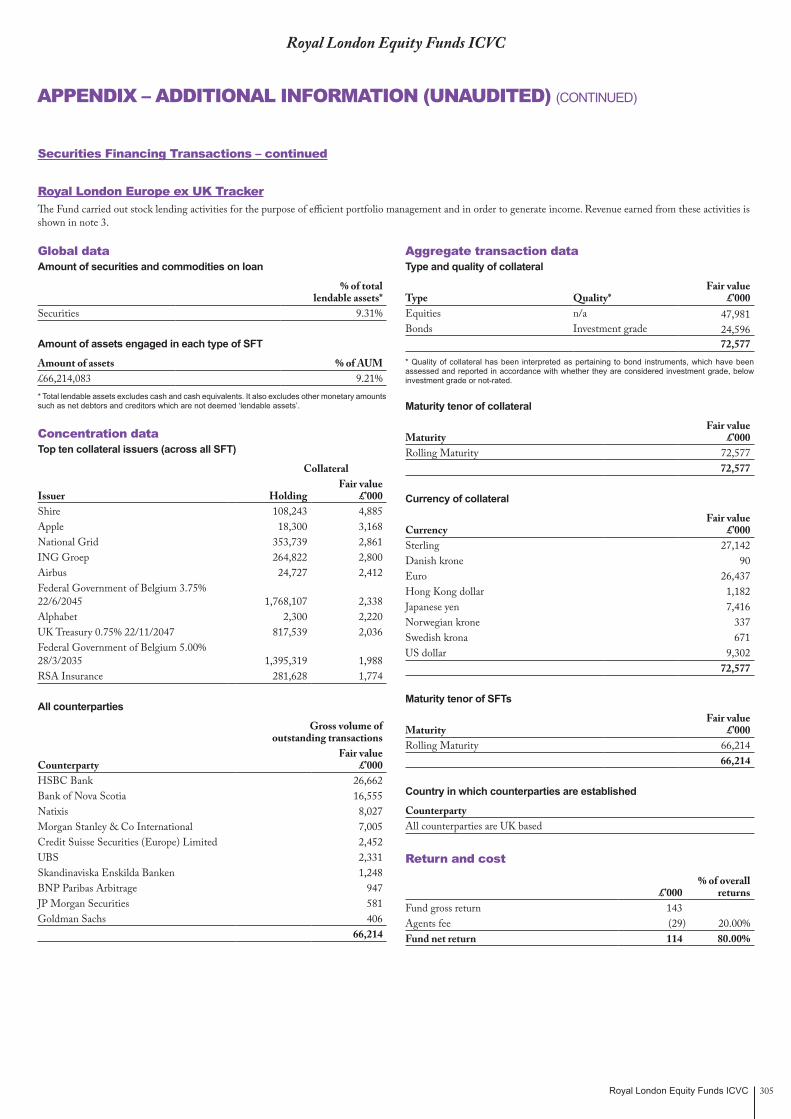
Royal London Equity Funds ICVC 305
APPENDIX – ADDITIONAL INFORMATION (UNAUDITED) (CONTINUED)
Royal London Europe ex UK TrackerThe Fund carried out stock lending activities for the purpose of efficient portfolio management and in order to generate income. Revenue earned from these activities is shown in note 3.
Global dataAmount of securities and commodities on loan
% of total lendable assets*
Securities 9.31%
Amount of assets engaged in each type of SFT
Amount of assets % of AUM£66,214,083 9.21%* Total lendable assets excludes cash and cash equivalents. It also excludes other monetary amounts such as net debtors and creditors which are not deemed ‘lendable assets’.
Concentration dataTop ten collateral issuers (across all SFT)
Collateral
Issuer Holding Fair value
£’000Shire 108,243 4,885Apple 18,300 3,168National Grid 353,739 2,861ING Groep 264,822 2,800Airbus 24,727 2,412Federal Government of Belgium 3.75% 22/6/2045 1,768,107 2,338Alphabet 2,300 2,220UK Treasury 0.75% 22/11/2047 817,539 2,036Federal Government of Belgium 5.00% 28/3/2035 1,395,319 1,988RSA Insurance 281,628 1,774
All counterparties
Gross volume of outstanding transactions
CounterpartyFair value
£’000HSBC Bank 26,662 Bank of Nova Scotia 16,555 Natixis 8,027 Morgan Stanley & Co International 7,005 Credit Suisse Securities (Europe) Limited 2,452 UBS 2,331 Skandinaviska Enskilda Banken 1,248 BNP Paribas Arbitrage 947 JP Morgan Securities 581 Goldman Sachs 406
66,214
Aggregate transaction dataType and quality of collateral
Type Quality*Fair value
£’000Equities n/a 47,981Bonds Investment grade 24,596
72,577* Quality of collateral has been interpreted as pertaining to bond instruments, which have been assessed and reported in accordance with whether they are considered investment grade, below investment grade or not-rated.
Maturity tenor of collateral
MaturityFair value
£’000Rolling Maturity 72,577
72,577
Currency of collateral
CurrencyFair value
£’000Sterling 27,142 Danish krone 90 Euro 26,437 Hong Kong dollar 1,182 Japanese yen 7,416 Norwegian krone 337 Swedish krona 671 US dollar 9,302
72,577
Maturity tenor of SFTs
MaturityFair value
£’000Rolling Maturity 66,214
66,214
Country in which counterparties are established
CounterpartyAll counterparties are UK based
Return and cost
£’000% of overall
returnsFund gross return 143Agents fee (29) 20.00%Fund net return 114 80.00%
Royal London Equity Funds ICVC
Securities Financing Transactions – continued
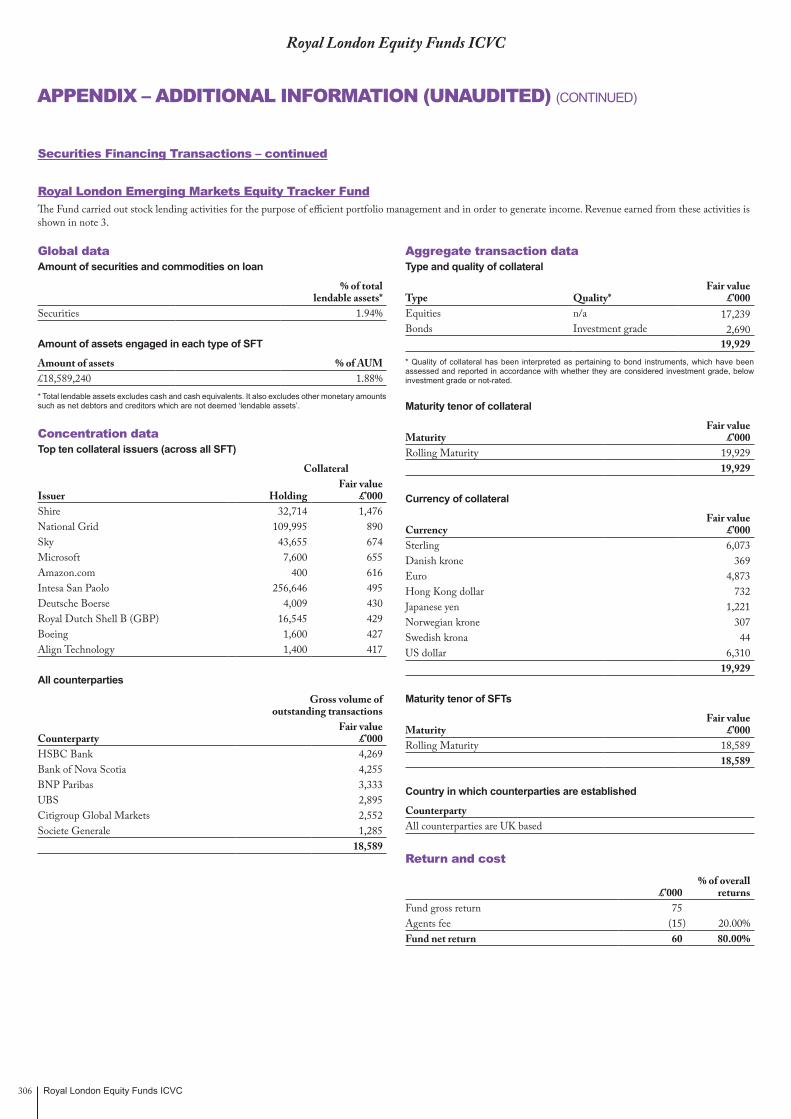
Royal London Equity Funds ICVC306
APPENDIX – ADDITIONAL INFORMATION (UNAUDITED) (CONTINUED)
Royal London Emerging Markets Equity Tracker FundThe Fund carried out stock lending activities for the purpose of efficient portfolio management and in order to generate income. Revenue earned from these activities is shown in note 3.
Global dataAmount of securities and commodities on loan
% of total lendable assets*
Securities 1.94%
Amount of assets engaged in each type of SFT
Amount of assets % of AUM£18,589,240 1.88%* Total lendable assets excludes cash and cash equivalents. It also excludes other monetary amounts such as net debtors and creditors which are not deemed ‘lendable assets’.
Concentration dataTop ten collateral issuers (across all SFT)
Collateral
Issuer Holding Fair value
£’000Shire 32,714 1,476National Grid 109,995 890Sky 43,655 674Microsoft 7,600 655Amazon.com 400 616Intesa San Paolo 256,646 495Deutsche Boerse 4,009 430Royal Dutch Shell B (GBP) 16,545 429Boeing 1,600 427Align Technology 1,400 417
All counterparties
Gross volume of outstanding transactions
CounterpartyFair value
£’000HSBC Bank 4,269 Bank of Nova Scotia 4,255 BNP Paribas 3,333 UBS 2,895 Citigroup Global Markets 2,552 Societe Generale 1,285
18,589
Aggregate transaction dataType and quality of collateral
Type Quality*Fair value
£’000Equities n/a 17,239Bonds Investment grade 2,690
19,929* Quality of collateral has been interpreted as pertaining to bond instruments, which have been assessed and reported in accordance with whether they are considered investment grade, below investment grade or not-rated.
Maturity tenor of collateral
MaturityFair value
£’000Rolling Maturity 19,929
19,929
Currency of collateral
CurrencyFair value
£’000Sterling 6,073 Danish krone 369 Euro 4,873 Hong Kong dollar 732 Japanese yen 1,221 Norwegian krone 307 Swedish krona 44 US dollar 6,310
19,929
Maturity tenor of SFTs
MaturityFair value
£’000Rolling Maturity 18,589
18,589
Country in which counterparties are established
CounterpartyAll counterparties are UK based
Return and cost
£’000% of overall
returnsFund gross return 75Agents fee (15) 20.00%Fund net return 60 80.00%
Royal London Equity Funds ICVC
Securities Financing Transactions – continued
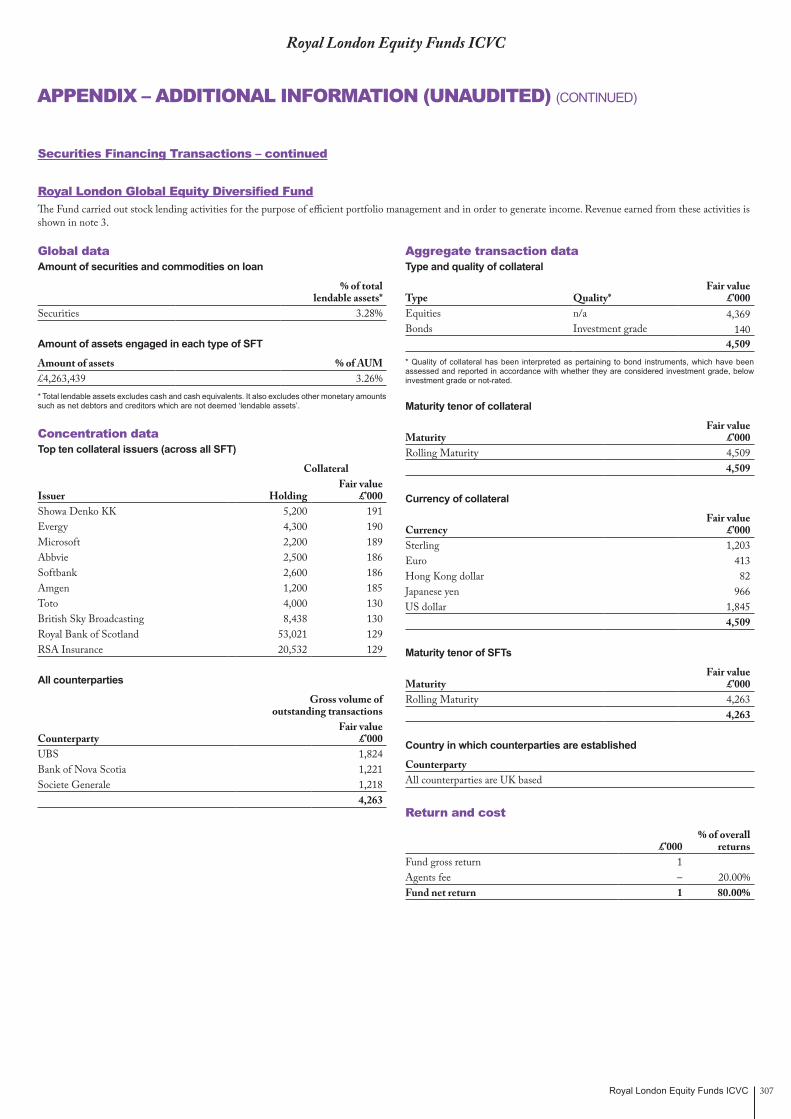
Royal London Equity Funds ICVC 307
APPENDIX – ADDITIONAL INFORMATION (UNAUDITED) (CONTINUED)
Royal London Global Equity Diversified FundThe Fund carried out stock lending activities for the purpose of efficient portfolio management and in order to generate income. Revenue earned from these activities is shown in note 3.
Global dataAmount of securities and commodities on loan
% of total lendable assets*
Securities 3.28%
Amount of assets engaged in each type of SFT
Amount of assets % of AUM£4,263,439 3.26%* Total lendable assets excludes cash and cash equivalents. It also excludes other monetary amounts such as net debtors and creditors which are not deemed ‘lendable assets’.
Concentration dataTop ten collateral issuers (across all SFT)
Collateral
Issuer Holding Fair value
£’000Showa Denko KK 5,200 191Evergy 4,300 190Microsoft 2,200 189Abbvie 2,500 186Softbank 2,600 186Amgen 1,200 185Toto 4,000 130British Sky Broadcasting 8,438 130Royal Bank of Scotland 53,021 129RSA Insurance 20,532 129
All counterparties
Gross volume of outstanding transactions
CounterpartyFair value
£’000UBS 1,824 Bank of Nova Scotia 1,221 Societe Generale 1,218
4,263
Aggregate transaction dataType and quality of collateral
Type Quality*Fair value
£’000Equities n/a 4,369Bonds Investment grade 140
4,509* Quality of collateral has been interpreted as pertaining to bond instruments, which have been assessed and reported in accordance with whether they are considered investment grade, below investment grade or not-rated.
Maturity tenor of collateral
MaturityFair value
£’000Rolling Maturity 4,509
4,509
Currency of collateral
CurrencyFair value
£’000Sterling 1,203 Euro 413 Hong Kong dollar 82 Japanese yen 966 US dollar 1,845
4,509
Maturity tenor of SFTs
MaturityFair value
£’000Rolling Maturity 4,263
4,263
Country in which counterparties are established
CounterpartyAll counterparties are UK based
Return and cost
£’000% of overall
returnsFund gross return 1Agents fee – 20.00%Fund net return 1 80.00%
Royal London Equity Funds ICVC
Securities Financing Transactions – continued
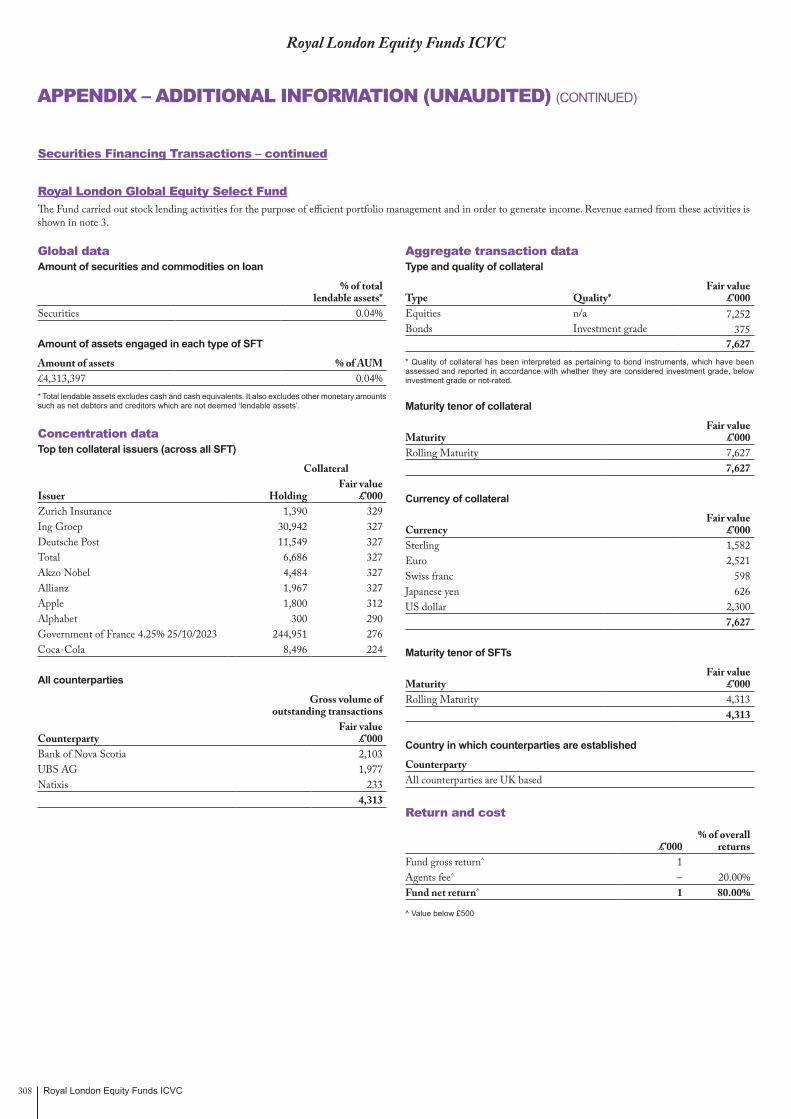
Royal London Equity Funds ICVC308
APPENDIX – ADDITIONAL INFORMATION (UNAUDITED) (CONTINUED)
Royal London Global Equity Select FundThe Fund carried out stock lending activities for the purpose of efficient portfolio management and in order to generate income. Revenue earned from these activities is shown in note 3.
Global dataAmount of securities and commodities on loan
% of total lendable assets*
Securities 0.04%
Amount of assets engaged in each type of SFT
Amount of assets % of AUM£4,313,397 0.04%* Total lendable assets excludes cash and cash equivalents. It also excludes other monetary amounts such as net debtors and creditors which are not deemed ‘lendable assets’.
Concentration dataTop ten collateral issuers (across all SFT)
Collateral
Issuer Holding Fair value
£’000Zurich Insurance 1,390 329Ing Groep 30,942 327Deutsche Post 11,549 327Total 6,686 327Akzo Nobel 4,484 327Allianz 1,967 327Apple 1,800 312Alphabet 300 290Government of France 4.25% 25/10/2023 244,951 276Coca-Cola 8,496 224
All counterparties
Gross volume of outstanding transactions
CounterpartyFair value
£’000Bank of Nova Scotia 2,103 UBS AG 1,977 Natixis 233
4,313
Aggregate transaction dataType and quality of collateral
Type Quality*Fair value
£’000Equities n/a 7,252Bonds Investment grade 375
7,627* Quality of collateral has been interpreted as pertaining to bond instruments, which have been assessed and reported in accordance with whether they are considered investment grade, below investment grade or not-rated.
Maturity tenor of collateral
MaturityFair value
£’000Rolling Maturity 7,627
7,627
Currency of collateral
CurrencyFair value
£’000Sterling 1,582 Euro 2,521Swiss franc 598Japanese yen 626US dollar 2,300
7,627
Maturity tenor of SFTs
MaturityFair value
£’000Rolling Maturity 4,313
4,313
Country in which counterparties are established
CounterpartyAll counterparties are UK based
Return and cost
£’000% of overall
returnsFund gross return^ 1 Agents fee^ – 20.00%Fund net return^ 1 80.00%
^ Value below £500
Royal London Equity Funds ICVC
Securities Financing Transactions – continued
Royal London Equity Funds ICVC 309
REMUNERATION POLICY (UNAUDITED)
The Authorised Corporate Director of the Royal London Equity Funds ICVC, Royal London Unit Trust Managers Limited (“RLUTM”), is subject to remuneration policies, procedures and practices (together, the “Remuneration Policy”), as required under the UCITS Directive (“UCITS V”). RLUTM has appointed Royal London Asset Management Limited (“RLAM”) as the Investment Adviser to the Fund.
The Remuneration Policy is in line with the business strategy, objectives and values of the ACD and the interests of the Royal London Equity Funds ICVC and the investors in the ICVC and includes measures to avoid conflicts of interest. The Remuneration Policy applies to staff of the ACD whose professional activities have a material impact on the risk profile of the ACD or the ICVC, and ensures that an individual cannot be involved in determining or approving their own remuneration. The Remuneration Policy will be reviewed and updated annually by the board of directors of the ACD (the “Board of Directors”). Details of the up-to-date Remuneration Policy (provided in the form of the “UCITS Summary Remuneration Policy”), include a description of how remuneration and benefits are calculated, the identity of persons responsible for awarding the remuneration and benefits and the composition of the remuneration committee (if any). The UCITS Summary Remuneration Policy is available on the ACD’s website and a paper copy may be obtained, free of charge, at the registered office of the ACD, upon request.
RLUTM must identify its code staff, whose professional activities have a material impact on the risk profiles of RLUTM and the Fund. Code staff includes senior management, risk takers, control functions, and any employees receiving total remuneration that takes them into the same remuneration bracket as senior management and risk takers. The Remuneration Policy outlines how fixed and variable remuneration is calculated, which includes, but not limited to:
• an assessment of the individual member of staff ’s performance, the relevant Fund, the business unit and its risks;
• restrictions on the awarding of guaranteed variable remuneration;
• the balance between fixed and variable remuneration;
• payment of non-financial remuneration in the form of units or shares in the UCITS funds the Authorised Unit Trust Manager manages;
• a mandatory deferral period of at least 3 years for the payment of a substantial portion of the variable remuneration component; and
• the reduction or cancellation of remuneration in the case of under-performance.
RLUTM has a board of directors (the “Directors”). The Directors have waived their entitlement to receive a director’s fee from RLUTM. RLUTM has no employees and therefore there are no other controlled functions, or senior management employed and paid by RLUTM. In addition, the ICVC does not make any payments directly to any staff of the delegates. However, for the financial year ending 31 December 2017, total remuneration of £4,566,185 was paid to 9 individuals whose actions may have a material impact on the risk profile of RLUTM, of which £3,756,725 related to senior management. The fixed element of the total remuneration mentioned above is £2,082,000 and the variable element is £2,484,185.
In accordance with the Remuneration Policy and the requirements of UCITS V, staff working for RLAM are not remunerated by the ACD but they are subject to remuneration requirements which are equally as effective as those in place under the UCITS Directive.
RLAM is also subject to the Financial Conduct Authority’s Remuneration Codes.

Royal London Equity Funds ICVC310
GENERAL INFORMATION
Pricing and DealingThe prices of shares are determined by reference to the underlying market value of the net assets of each sub-fund at the relevant valuation point.
Share prices are normally calculated daily however, if the markets are exceptionally volatile the ACD may conduct more frequent valuations to reflect any significant changes in the value of a sub-fund’s underlying assets.
Dealing prices, yields and details of risks and charges are published on our website, www.rlam.co.uk.
Dealing in shares is conducted between 9.00am and 5.00pm on a forward pricing basis.
Buying SharesShares may be bought on any business day via an authorised intermediary or from the ACD by telephoning the Dealing desk on 03456 04 04 04*. Alternatively, an application form should be completed and sent to the ACD. Shares will be allocated at the price ruling at the next valuation point and a contract note confirming the purchase will be issued immediately thereafter.
Selling SharesShares may be sold back to the ACD on any business day. Shares can be sold by telephone by calling the Dealing desk on 03456 04 04 04* or alternatively by putting your request in writing. The ACD will allocate the price calculated from the next valuation point and issue a contract note as evidence of the sale. Settlement will be issued within 4 business days following receipt of satisfactory evidence to title of the shares.
* In the interest of investors’ protection all telephone calls to the Dealing desk are recorded.
Cancellation RightsWhere a person purchases shares the Conduct Of Business Sourcebook Instrument 2001 (as amended from time to time) may give the investor the right to cancel the relevant purchase within 14 days of receipt of the requisite notice of a right to cancel. The right to cancel does not arise if (a) the investor is not a private customer, (b) the investor is not an execution-only customer, (c) the agreement to purchase is entered into through a direct offer financial promotion, or (d) the agreement is entered into under a customer agreement or during negotiations (which are not ISA or PEP related) intended to lead to a client agreement.
UK TaxationThe Company is not subject to Capital Gains Tax.
Capital gains established when shares are sold are subject to tax, but at the present time investors are not liable unless their total gains in any tax year from all disposals of assets exceed the Capital Gains Tax annual exemption.
Investors receive a distribution of net revenue with tax credit equivalent to the lower rate of income tax. Where the distribution is retained within a sub-fund and not paid out it should be included in investors’ Income Tax Return. No further liability exists if they pay at the lower or basic rate, but higher rate tax will be payable as appropriate. If investors are not liable to tax they are unable to claim repayment of the tax credit from HM Revenue & Customs. The treatment of distributions as received by corporate shareholders is detailed on the reverse of dividend warrants. The first distribution received after purchasing shares includes an amount described as ‘equalisation’. This is a repayment of capital and is therefore not liable to Income Tax. It should, however, be deducted from the initial cost of shares for Capital Gains Tax purposes.
CommissionPayable to UK authorised intermediaries. Details are available on request.
AuthorisationThe Company was authorised by the Financial Conduct Authority on 9 October 2009. The Company is a UCITS umbrella scheme.
Company Reports and ProspectusCopies of the latest yearly and half yearly financial statements and copies of the Prospectus may be obtained from Royal London Unit Trust Managers Limited upon request.

All rights in the FTSE Indices mentioned within the Royal London Equity ICVC report and accounts (the “Indices”) vest in FTSE International Limited (“FTSE”). “FTSE®” is a trade mark of the London Stock Exchange Group companies and is used by FTSE under licence. The Royal London Equity ICVC Funds (the “Funds”) have been developed solely by Royal London Asset Management. The Index is calculated by FTSE or its agent. FTSE and its licensors are not connected to and do not sponsor, advise, recommend, endorse or promote the Funds and do not accept any liability whatsoever to any person arising out of (a) the use of, reliance on or any error in the Index or (b) investment in or operation of the Funds. FTSE makes no claim, prediction, warranty or representation either as to the results to be obtained from the Funds or the suitability of the Index for the purpose to which it is being put by Royal London Asset Management.
Royal London Asset Management is a brand which includes Royal London Unit Trust Managers Limited, authorised and regulated by the Financial Conduct Authority and which manages collective investment schemes, registered in England and Wales number 2372439.
This company is a subsidiary of The Royal London Mutual Insurance Society Limited, registered in England and Wales number 99064. Registered office: 55 Gracechurch Street, London EC3V 0RL. S
RE
P R
LAM
PD
007
3