Annual Report 2020 - SIG Combibloc
220
Annual Report 2020 WE DELIVER MORE
-
Upload
khangminh22 -
Category
Documents
-
view
0 -
download
0
Transcript of Annual Report 2020 - SIG Combibloc

Annual Report 2020
WE DELIVER MORE

WE DELIVER MORESIG is a leading systems and solutions provider for aseptic carton packaging. We work in partnership with our customers to bring food and beverage products to consumers around the world in a safe, sustainable and affordable way.
We deliver more
2 For customers and consumers8 For our planet14 For communities
Our Company
21 Letter from the Chairman andtheChiefExecutiveOfficer24 Our business model26 Our strategy29 Our team31 Technology and innovation
Business review
34 Responsible business review43 Regional review43 EMEA46 APAC48 Americas49 Key performance highlights50 Financial review59 Risk management
Governance
61 Board of Directors65 Group Executive Board68 Corporate Governance Report
Compensation
92 Letter from the Chairwoman ofthe CompensationCommittee94 Compensation Report
Financials
117 Consolidatedfinancialstatements205 Financial statements of the Company
Want the full experience?
Our 2020 Annual Report is also published online. The online version offers additional interactive features and content.
Visit the report at https://reports.sig.biz/annual-report-2020

FOR CUSTOMERS AND CONSUMERS
WE DELIVER MORE
Annual Report 2020

BRAZIL — EXPANDING OUR CUSTOMER PARTNERSHIPS
9 filling machinesinstalled in 2020 with two new customers in Sao Paulo and Paraná.
São Paulo
Paraná
Over the last 15 years, our business in Brazil has expanded rapidly, helped by the construction and subsequent expansion of our factory at Curitiba. This has enabled us to be closer to our customers and to respond rapidly to their needs. We have combined our technology expertise with our strong sales force and service excellence to consistently win new customers.
3

Early in 2020 we started placing filling machines with Shefa and Líder Alimentos, two large dairy companies in Brazil. The filling machines were installed in record time and production exceeded expectations, enabling the customers to meet strong consumer demand for milk.
TogetherShefaandLíderAlimentosorderedninefillingmachinesand at thesametimesignedcontractsforthesupplyofcartonsleeves.One of thekeyfactorsenablingSIGtowinthesecontractswastheformat andvolumeflexibilityofoursystem.Customerscan fillawidevarietyofliquiddairyproducts–includingplain,flavouredand plant-basedmilks–aswellasteaandjuices.
“We are very happy with our new partnership with SIG. The high flexibility and speed of the SIG filling machines, as well as low waste rates, were the main reasons for implementing this project with SIG. The partnership will help us to expand our product portfolio and to offer many more
options to consumers.” Roberto Adabo
CEO at Shefa
We deliver more For customers and consumers
Annual Report 2020

Placementofthefillingmachinescommencedatthebeginningof2020.The customerschoseacombinationofbrandnewandoverhauledfillingmachinesfromSIG’sexistingstock.Inordertospeedupdeploymentandthe startofproduction,threeofthefillingmachineswereoverhauledlocallyinBrazilbySIG’sexpertengineers.Allninefillingmachineswereinstalledwithin eight months – a record achievement given the complex engineering ofthefillingmachinesandtheneedforflawlessefficiencyandsterility.
SIG IS THE PREFERRED PARTNER FOR SHEFA AND LÍDER ALIMENTOS
SIG’sclosecooperationwithbothShefaandLíder AlimentosofferstrueproductinnovationanddifferentiationaspartofSIG’sValue Proposition, which aims to deliver innovative product and packaging solutions that enable businessestosatisfyever-changingneeds.
5

From the outset, production was significantly ahead of plan, driven by strong demand for milk during COVID-19 related lockdowns.
Anditwasnotjustdemandthatexceededexpectations.AtSIGweundertaketodeliverahighlevelofefficiencyon our machines and we also promise that waste rates willbebelowacertainthreshold.Ourfillingmachinesexceededthetargetedefficiencylevelwhilewasterateswerewellbelowthethresholdset.
8 monthsIt took only eight months to install all nine filling machines for both of our partners in Brazil.
Annual Report 2020
We deliver more For customers and consumers

SIG aseptic packaging to meet increasing customer and consumer demand.Shefa and Líder Alimentos are now offering their entire product ranges – from plain milk and flavoured dairy products to plant-based milks and nectars – in SIG carton packs.
São Paulo and Paraná Throughfastandefficientdeliveryandservice,we enabled Líder Alimentos and Shefa to meet increased consumer demand for milk, which became even more important as a source of proteinduringlockdowns.
7

FOR OUR PLANET
WE DELIVER MORE
Annual Report 2020

INNOVATING FOR SUSTAINABILITY
1bn+ packssold with our aluminium-free combibloc ECOPLUS packaging material
Environmental considerations are central to product developmentatSIGaswecreatesolutionstohelpcustomersmeet growing consumer demand for sustainable packaging andadapttoanever-changingworld.
Fully recyclable and mainly made from renewable paper board, ourstandardpackshavea28%to70%lowercarbonfootprintthanalternativetypesofpackaging.Overthepast10years,we have been leading the industry with a series of sustainable innovationsthatreducetheimpactofourpacksevenmore.
A strong focus on sustainable packaging innovation has produced a decade of industry firsts from SIG. Our SIGNATURE portfolio is delivering for our business, our customers and our planet.
9
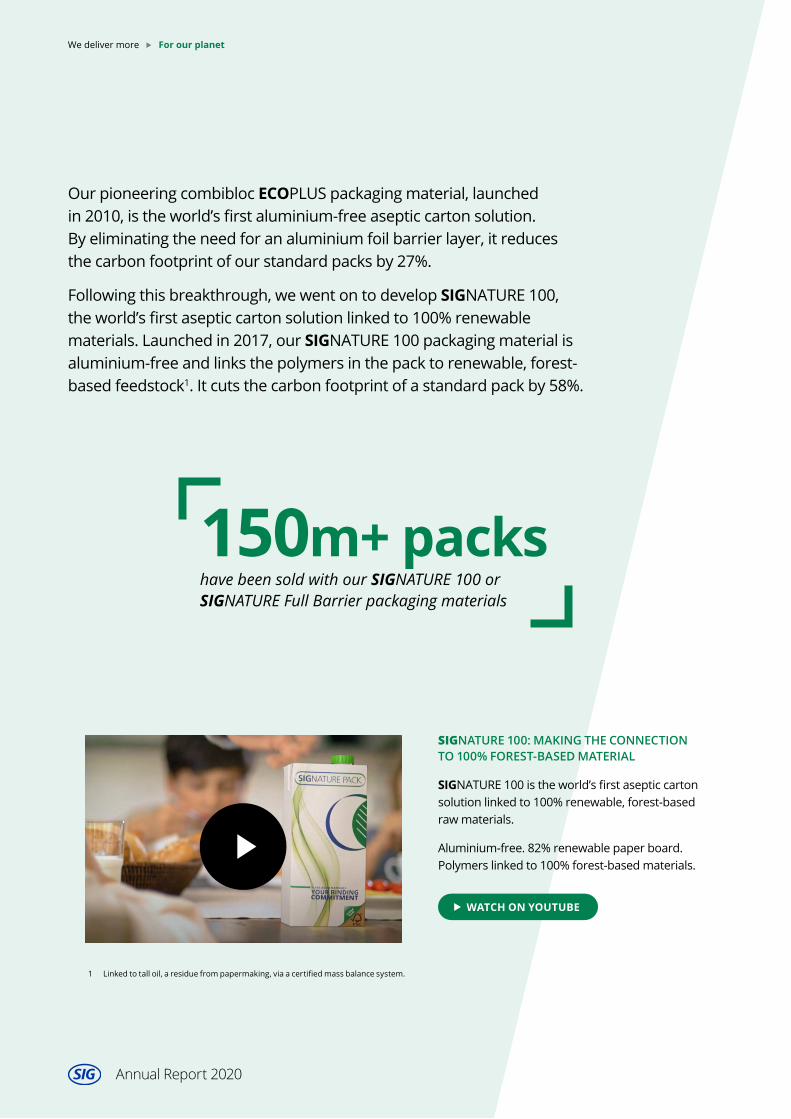
Our pioneering combibloc ECOPLUS packaging material, launched in 2010,istheworld’sfirstaluminium-freeasepticcartonsolution.By eliminatingtheneedforanaluminiumfoilbarrierlayer,itreducesthe carbonfootprintofourstandardpacksby27%.
Following this breakthrough, we went on to develop SIGNATURE100,the world’sfirstasepticcartonsolutionlinkedto100%renewablematerials.Launchedin2017,ourSIGNATURE100packagingmaterialisaluminium-freeandlinksthepolymersinthepacktorenewable,forest-based feedstock1.Itcutsthecarbonfootprintofastandardpackby58%.
SIGNATURE 100: MAKING THE CONNECTION TO 100% FOREST-BASED MATERIAL
SIGNATURE100istheworld’sfirstasepticcartonsolutionlinkedto100%renewable,forest-basedrawmaterials.
Aluminium-free.82%renewablepaperboard.Polymerslinkedto100%forest-basedmaterials.
150m+ packshave been sold with our SIGNATURE 100 or SIGNATURE Full Barrier packaging materials
WATCH ON YOUTUBE
1 Linkedtotalloil,aresiduefrompapermaking,viaacertifiedmassbalancesystem.
We deliver more For our planet
Annual Report 2020

SIGNATURE CIRCULAR: THE WORLD’S FIRST ASEPTIC CARTON WITH RECYCLED PLASTICS
With combibloc ECOPLUS and SIGNATURE100,weareofferingthemostsustainablepackagingsolutionsonthemarketforUHTmilkproducers.
Our SIGNATURE Full Barrier packaging material enables other customers togetthebenefitsofpolymerslinkedto100%renewablefeedstock,whilemaintainingtheultra-thinaluminiumfoilbarrierlayerneededtoprotectmoresensitivefoodproductslikejuicesandwater.Thiscutsthecarbonfootprintofourstandardpacksby45%.
“SIGNATURE enables us to offer the most sustainable packaging solution, which at the same time
guarantees the premium quality expected by our valued CoolBest customers. Switching to this new carton underlines our leading role in sustainability
within the fruit juice industry.”Sabine Blom
Marketing Manager CoolBest at Riedel
Our SIGNATURE Circular solution, launched in2020,introducespost-consumerrecycledcontentinasepticcartonsforthefirsttime2.In agroundbreakingpartnershipwithSABIC,we areusingchemicalrecyclingtotransformusedplasticpackagingintohigh-qualitypolymersthataresafeforfoodpackaging.
2 Linkedtopost-consumerrecycledplasticsviaacertifiedmassbalancesystem.
11

The polymers used in our SIGNATURE100andSIGNATURE Full Barrier packaging materials are linked to renewable materials via an innovativemassbalanceapproach.
IndependentlycertifiedtoISCCPLUS,thissystemensurestheamountofforest-basedrawmaterialsweneedaremixedinwithconventionalfossil-basedmaterialstoproducepolymerstothehighgraderequiredforasepticfoodpackaging.
WeusethesameISCCPLUScertifiedmassbalanceapproachtolinkthe polymers used in our SIGNATURE Circular packaging material to 100%post-consumerrecycledplastics.
Themassbalancesystemsupportsatransitionfromfossil-basedtorenewable or recycled raw materials within the conventional and highly efficientpolymerindustry.ThisapproachisendorsedbyTheEllenMacArthurFoundationasawaytoadvancethecirculareconomy.3
From plastic to paper straws
SIG was the first in the industry to offer a paper straw solution
for aseptic cartons. We launched both straight and U-shaped paper
straws in 2019.
3 Source:TheEllenMacArthurFoundationNetwork,MassBalanceWhitePaper2020.
We deliver more For our planet
Annual Report 2020

“At Intermarché, our commitment to sustainable development is a priority.
We decided early on to introduce SIG’s paper straw solution for aseptic carton packs to offer consumers a more sustainable alternative to
plastic straws, while maintaining the on-the-go convenience of small-size packs.”
Alain PlougastelAdhérentIntermarché
We are going further. Our mission is to create food packaging that makes the world a better place. And our continued focus on sustainable innovation will help us drive progress on this journey WAY BEYOND GOOD.
13

FOR COMMUNITIES
WE DELIVER MORE
Annual Report 2020

STANDING UP TO COVID-19 IN BANGLADESH WITH CARTONS FOR GOOD
20%Nearly 20% of the population in Bangladesh are malnourished and almost half the children are underweight.
The Cartons for Good initiative, flagship project of the SIG WAY BEYOND GOOD Foundation, extended its support to communities during the COVID-19 crisis and lockdown in Bangladesh. Aid packages containing basic foodstuffs and hygiene items have been distributed to families in need.
15

From Waste to Worth
CartonsforGoodoffersinnovativesolutionsagainstfoodlossandmalnutrition.InBangladesh,wherethefoundationisrunningtheproject,surplusfoodispreservedinSIGpackagesforschoolstoofferunderprivilegedchildrenregularlunchesthroughouttheyear.This means that they can come to school instead of having to work fortheirfood.
HOW IT WORKS
1 — Helping farmersFarmers are paid for their surplus vegetables.Thisgivesthemextraincomefromcropstheywouldn’t
otherwisebeabletosell.
2 — Communities use SIG packaging
Communities use the mobile fillingunittocookthevegetablesandpreservetheminSIG’slong-
lifecartonpackages.
3 — Local schools help to distribute the packs
The food is distributed to local schools.Childrengetahealthy,hotmealeveryday.Thisencouragesthem to stay in school and gives
thembetterprospectsforthefuture.
4 — Packaging is collected for recycling
After use, the packs are collected for recycling at a local facility, so the materials can be
usedagain.
Annual Report 2020
We deliver more For communities

The issue of food loss
Althoughnearly20%ofthepopulationaremal-nourishedandalmosthalfthechildrenareunderweight,large quantitiesoffoodgotowasteeverydayinBangladesh.Eachyearatharvest-time,farmersproducemorefoodthantheycanselland, with no way to preserve the surplus crops, the food rots andisthrownaway.
“There used to be wastage of surplus crops from our farming land, but this will now be put to use with Cartons for Good. We can use the extra money from selling the surplus for next
year’s farming and the SIG WAY BEYOND GOOD FOUNDATION is taking care of children by
giving them school meals.” Samsul Alam
Farmers’CommunityRepresentative
17

Challenges to schooling in Bangladesh
Children living in Bangladeshi urban slums face many barriers when it comes to going to and staying in school – in fact, only half of the childrenlivingintheseareasendupattendingschool.Aspectslikelowfamilyincomeandhighpopulationdensityamplifytheproblem.Often, in order to ensure the family has something to eat, children havetodropoutofschooltocontributeasmanuallabourers.This deprives the country of needed talent as well as thousands of childrenoftheirhopesanddreams.
>1,000 aid packageshave been given to underprivileged families where the adults had no income due to the lockdown.
SIG FOUNDATION: #CARTONS FOR GOOD PROJECT IN BANGLADESH
TheSIGWAYBEYONDGOODFOUNDATIONhaslauncheditsflagshipCartonsforGoodprojectinBangladesh.CartonsforGoodappliesSIG’stechnology to empower communities to reduce foodloss,supportfarmers’livelihoodsandpromotechildren’snutritionandeducation.
The project provides healthy school meals for underprivileged children in partnership with leadingdevelopmentNGO,BRAC.
Annual Report 2020
We deliver more For communities

Extended support during crisis
DuringtheCOVID-19lockdown,whenschoolswereclosed,it became more important than ever for children as well as theirfamiliestokeepreceivinghealthy,nutritiousfood.Thatiswhy the Cartons for Good team in Bangladesh has delivered essential food and hygiene parcels to school children and their familiesatatimewhentheyneeditmost.
Rice, potatoes, onions, lentils, spices, eggs, soya bean oil, mustard oil, salt, bars of soap and antiseptic soap were included in the aid packages – alongside the Cartons for Good packagesproducedfromsurplusvegetableswhichotherwisewouldhavebeenwasted.
“The packages help me much to survive nowadays. As I am so much
in need, it is so helpful to me.”Hazera (35)
mother of two girls
19

OUR COMPANY
21 Letter from the Chairman and the Chief Executive Officer
24 Our business model
26 Our strategy
29 Our team
31 Technology and innovation
Annual Report 2020
20

LETTER FROM THE CHAIRMAN AND THE CHIEF EXECUTIVE OFFICER
Aswelookbackontheunexpectedeventsof2020,wecanbeproudofwhatSIGhasachieved.The early implementation of a global pandemic preparedness plan, starting in China, enabled ourfactoriestokeeprunningthroughouttheCOVID-19crisis.Thisinturnmeantthatwewereable to keep delivering to our customers and accommodate shifts in demand caused by the crisis.Itwouldbeinaccurate,however,toattributethiscontinuitysimplytogoodmanagementandprocesses.Itisinlargepartduetothededicationandflexibilityofouremployees–mostnotably those in our factories, who continued coming to work without interruption and adapted toatighteningofouralreadyrigoroushealthandsafetypractices.Thisensuredthatourfactoriesremainedfullyoperational.Toallouremployees,whoperformedatahighleveldespitethemanyconstraints,weextendourheartfeltthanks.Wealsowanttothankourcustomersfortheirclosecollaborationinourjointeffortstocontinuedeliveringessentialnutritiontoconsumers.
Increased demand for liquid dairy in Europe and the Americas
Theyearwasproofoftherobustnessofourbusinessmodelandtheresilienceofourendmarkets.Thiswasnotablythecaseforliquiddairy,whichaccountsforaround70%ofourrevenueand,inadditiontoplainmilk,includesawidevarietyofproductssuchasplant-basedmilks,creamersandnutritionaldrinks.SalesoftheseproductsbenefitedfromincreaseddemandinEuropeandtheAmericas,ashouseholdsconsumedmoreduringlockdowns.Theneedtopreparemoremealsathomealsoboostedfoodsalesincategoriessuchassoupsandsauces.Ourasepticcartonsenable foodandbeverages tobekept forupto12monthswhileretainingall theirnutritionalbenefits–anidealsolutionwhenpeopleareshoppinglessfrequentlyororderingonline.InAsiaPacific,ontheotherhand,lockdownshadanegativeimpactonourbusiness,whichisgearedtowardstheon-the-goconsumptionhabitstypicalofthelifestylesintheregion.
Andreas UmbachChairman
Samuel SigristChiefExecutiveOfficer
Annual Report 2020
Our Company Letter from the Chairman and the Chief Executive Officer 21

Ongoing investment and strong free cash flow generation
The fact that we were still able to grow our global core revenueby5.5%atconstantexchangeratesistestimonytotheportfolioeffectcreatedbythedeliberategeographicdiversification of our business over many years. Thesustainedtop-linegrowthwasaccompaniedbyaslightimprovementintheadjustedEBITDAmargin.Anegativeimpact from exchange rates, resulting from the impact of theCOVID-19crisisonemergingmarket currencies,was more than offset by operational leverage, lowerrawmaterialcostsandproductionefficiencies.Adjustednet income increased to €232 million. Net capitalexpenditure as a percentage of revenue was within the targetrangeof8–10%andincludedinvestmentsrelatingto the construction of a new plant in China, which is now in operation. Free cash flow generation neverthelessremained strong and we are proposing a dividend of CHF 0.42pershare,comparedwithCHF 0.38persharefor2019.
Maintaining service excellence and winning new business
Ourbusinessplaysavitalroleinthefoodvaluechain.Manyofourcustomershaveexpressedtheirappreciationatthecontinuityofoursupplyandserviceduringthecrisis.Ourserviceengineersovercamemany challenges in terms of travel and logistics in order to keep fillingmachinesrunning,helpedbyavarietyofremoteserviceoptions.Wecontinuedtoplacenewfillingmachinesand to enter into new contracts, including a record win in Europe with the German dairy company Hochwald.Whetherwewinanewcustomerorincreaseourpresencewithanexistingone,theflexibilityofoursystemanditslowwasteratesconsistentlyprovetheirworth.
Focus on environmental, social and governance issues
Wealsohelpourcustomersmeetthegrowingsocietaldemandforenvironmentalstewardship.We do not simply rely on the fact that our carton packs all have a more favourable environmental profilethanotherformsofpackaging.Wehavetakensustainabilitytothenext level;andinthis report, you can read about innovations in the composition of our cartons which increase renewablecontentandfurtherreducethecarbonfootprint.Theprogress inourtechnologyisnotconfinedtoourpacks.Wearealsomakingadvancesinourfillingmachineswhich,forexample, reduce energy andwater use.Morebroadly, as a companywe continue todrivesystemic change to become a net positive business that gives more to people and the planet thanittakesout.WewereoneofthefirstcompaniesinourindustrytosetaclimatetargetthatisapprovedbytheScienceBasedTargetsInitiative(SBTi)andisinlinewiththegoaloflimitingglobalwarmingto1.5°abovepre-industriallevels.AndwemeasureourprogressagainstaraftofadditionalmetricswhichyouwillfinddetailedinourCorporateResponsibilityReporttobepublishedinMarch2021.
Environmental,socialandgovernance(ESG)issuesareanincreasinglyimportantpartofourongoingdialoguewithinvestors.In2020,wepublishedourESGpoliciesforthefirsttime,inorder to give more visibility to our objectives and to demonstrate the level of attention we havegiven to these topicsovermanyyears.However,werecognise thatwecanalwaysdomore, as demonstrated by our current initiatives to promote diversity and inclusion > Our team.
Tomeetcurrentandfuturecustomerdemand,thenew120,000squaremeterplantinChinaissituatedattheSuzhouIndustrialPark,closetotheCompany’sexistingproductionfacilityandTechCentre.
Annual Report 2020
Our Company Letter from the Chairman and the Chief Executive Officer 22

And we listen to feedback from our shareholders: We have made changes to our executive compensation programme as from 2021 in response to feedback received after the 2020AnnualGeneralMeeting.> Compensation Report
OneoftheconsequencesoftheCOVID-19crisiswasthatthe2020AnnualGeneralMeetinghadtobehelddigitallyandwithoutthephysicalpresenceofshareholders.Unfortunately,thiswillalsobethecaseforthe2021AnnualGeneralMeeting.Wegreatlyregretthelossoftheopportunitytomeetwithyou,ourshareholders,inpersonandwouldliketothankyouforyourongoingsupport.
Further expanding our geographic footprint
Thegeographicdiversificationwhichstoodusingoodsteadin2020willbefurtherstrengthenedbytheplannedacquisition,announcedinNovember,ofthe50percentnotalreadyownedofourMiddleEastandAfricajointventure.Thetransaction,whichweexpecttocloseinthefirstquarterof2021,enhancesourgeographicpresenceinaregionwithattractivegrowthprospects.Aseptic carton, which can be transported and stored without refrigeration, is ideally suited to countrieswithahotclimate.Wewillhavetheopportunitytomoveclosertocustomersandconsumersintheregion,inordertocreatevaluethroughourconsumer-centricinnovationandthedeliveryofsustainableandaffordablefoodpackagingsolutions.Thejointventurebusinesshasanattractivefinancialprofileaswellasawell-investedfootprint.Thetransactionwillbefinanced through a combination of cash and shares, leaving the leverage of the combinedbusiness broadly unchanged. As a consequence, theObeikan InvestmentGroup (OIG), ourjointventurepartner,willholdapproximatelyfivepercentoftheSIGsharecapital.AbdallahalObeikan,theCEOofOIG,willbeproposedforelectiontoourBoardofDirectorsattheAnnualGeneralMeetingon21 April2021.Thiswillensurethatwecontinuetobenefitfromhisexpertise,industryexperienceandknowledgeoftheMiddleEastandAfricaregion.
Changes to the Group Executive Board
After12yearsasCEO,RolfStangltookthedecisiontoleavetheCompanyattheendof2020.RolfplayedakeyroleinexpandingthebusinessandinmakingSIGaleaderinsustainability.Mostrecently,heledtheCompanythroughthesuccessful IPOin2018andsteereditsafelythroughthechallengesof theCOVID-19crisis.Wewould like to thankRolfonbehalfof theBoardofDirectorsandtheentireCompanyandwishhimallthebestforthefuture.
The Board has always devoted close attention to succession planning and this has enabled aseamlesstransitionoftheCEOrole.WearepleasedtowelcometwonewmemberstotheGroupExecutiveBoard:FrankHerzogsucceedsSamuelSigristasChiefFinancialOfficerandJoséMatthijssejoinsasPresident&GeneralManagerEurope.Bothbringdiverseexperienceandabroadrangeofskillswhichideallyequipthemfortheirnewroles.WelookforwardtoworkingtogethertocontinueSIG’ssuccessfultrackrecord.TheCompanycontinuestoinvestandinnovateandiswellpositionedforthefutureinanattractiveindustry.Wewillmaintainourfocus on delivering value to our shareholders while pursuing our ambitious environmental and societalobjectives.
Andreas Umbach Samuel SigristChairman ChiefExecutiveOfficer
Annual Report 2020
Our Company Letter from the Chairman and the Chief Executive Officer 23

OUR BUSINESS MODELOur unique technology and outstanding innovation capacity enable us to provide our customers with end-to-end solutions for differentiated products, smarter factories and connected packs, all to address the ever-changing needs of consumers.
The full interactive version of our business model can be found online at https://reports.sig.biz/annual-report-2020/our-company/our-business-model
INPUTS
THE SIG DIFFERENCE
2
1
PARTNERSHIPS WITH CUSTOMERS
3
BROAD GEOGRAPHIC BASE
ENGINEERING KNOW-HOW
~5,500employees with >60nationalities
111,556hours of training Focus on diversity &
inclusion
100%100%paperboardfrom FSC™ Chain of Custody-certifiedmills
100%of energy for production from renewable sources
ASI-certified aluminium available in all regions
€ 987mproperty, plant & equipment
€ 68mnetfillercapital expenditure
€ 51minvestment in R&D
9sleeve production plants(incl.JV)
2fillerassemblyplants
1,266fillersinthefield
PEOPLE
ENVIRONMENT
FINANCIAL
OPERATIONS
Annual Report 2020
Our Company Our business model

OUTPUTS
+21Employee Net Promoter Score
0.3Lost Time Case Rate
4 %voluntary turnover rate
All packs fully recyclable
97 %of packs sold with FSC™ label
Fillers with reduced water and energy use
5.5 %core revenue growth at constant currency
29.5 %ROCE
€ 233 mfreecashflow
~38 bnpacks produced in 2020
>270differentpackagingoptions
>10,000differentproductsfilled
PEOPLE
ENVIRONMENT
FINANCIAL
OPERATIONSOurfillingandpackagingtechnology is at the heart of our customers’operations.Weworkin close collaboration with our customers to develop innovative product and packaging solutions that meet consumer demand for differentiation,convenienceandsustainability.Weenablecustomerstoincreasetheirefficiencywithsolutions for intelligent, automated andfullyintegratedplants.Allthisresults in customer relationships that spanmanyyearsorevendecades.
Originally a European business, SIGhassteadilyexpandeditsinternational presence, realising 55%ofitssalesoutsidetheEMEAregionin2020.Thisexpansionhascontributed to the resilience of the business by diversifying the drivers of growth.Weoperatesleevefactoriesineachofourregions.Withourglobally integrated footprint and supply chain, we are able to support customers locally and to meet their needsquicklyandefficiently.
Ouruniquesleeve-basedfillingtechnologyoffersourcustomersunmatched volume and format flexibility,enablingthemtomeetthe rapidly changing demands of consumers.Thebreadthofourfillingcapabilities is complemented by consumer-centricinnovationandafocusonsustainability.Oursuperiorsystem reliability, supported by over 600serviceengineersworldwide,ensures that our customers are part ofasafeandefficientsupplychain.
1
2
3
25

OUR STRATEGYOur dream is to see every consumer in the world with a SIG pack in their hand and a smile on their face, every single day. This dream is at the heart of our corporate compass – a strategy made for growth. Our goal is to be the leading solution provider for the food and beverage industry, fulfilling our promise of “Excellence – Engineered. Solutions – Delivered.”
The three strategic goals in our corporate compass are to “Grow above market”, “Win at the customer” and “Foster a winning team”, accompanied
by our ambition to go WAY BEYOND GOOD for people and the planet.
Growth Grow above market
Customer Win at the customer
People Foster a winning team
Responsibility Going WAY BEYOND GOOD
Annual Report 2020
Our Company Our strategy 26

PRIORITIES FOR 2021 AND BEYOND
– IntegrateourMiddleEastand Africa joint venture and leverageSIG’sfullsolutionportfolio in the region
– Rampupcommercialproduc-tionat ournewplantinChina
– Fullyleveragetheenviron-mental advantages of aseptic cartons and promote our sustainable innovation portfolio
PRIORITIES FOR 2021 AND BEYOND
– Extend our local sales and marketing in recently added countriessuchasIndia
– Create more value for our customers through our SIGNATURE portfolio and sustainable solutions
– Further implement our digital service, smart factory and connected pack solutions
– Increaseshareofrevenuesfrom new countries, new segments and our sustainable innovation portfolio
1 Growth Grow above market
2 Customer Win at the customer
Over this challenging year, which was marked bytheglobalCOVID-19pandemic,wedemonstrated the resilience of our strategy andperformance.Wewereableto growourcorebusinesswithsignificantnewcustomerwins such as dairy brands Líder Alimentos andShefainBrazil.Wealsoincreasedourshare of wallet with existing customers, includingamajorcontractfor15asepticfillinglinesatthenewproductionsiteofHochwald,oneofthe largestGermandairycooperatives.
We continued to grow in new and emerging segmentssuchasplant-baseddairyalter-natives,proteindrinksandwater.Andwesignificantlystrengthenedourplatformforgeographic growth through new customer wins in South American countries like Chile andEcuador,theintegrationofVisyCartonsin Australia and New Zealand and the plannedacquisitionoftheremaining50%of sharesinSIGCombiblocObeikan,ourjoint ventureinMiddleEastandAfrica.
In2020,sustainabilityprovedtobearealdriver for growth with new customers choosing our most sustainable packaging solutions including the paper straw, combibloc ECOPLUS and SIGNATURE.Ourleadingenvironmental credentials and innovative sustainable solutions have become an ever more important decision criterion for new projectsandcustomerpitches.
In2020,thepandemicposedmanychallengesin terms of health and safety, travel, supply chainsandlogistics.SIGisespeciallyproudofhow its worldwide operations and technical serviceteamsperformedthroughout2020.To keep up with demand, many of our plants have been operating day and night, and our service technicians have done their utmost tokeepSIGfillinglinesrunningwithoutinterruptionatourcustomers’sites.Alltoensure that our customers could provide a continuous supply of food and beverages to consumers.Thelettersofthankswehavereceived from customers testify that we were able to not only maintain but often increase the level of customer satis faction in a very challengingyear.
Our strategy for winning at the customer isunderpinnedbyoursolution-sellingapproachandthekeycustomerbenefitsofouruniquepackagingandfillingtechno-logy.Thesebenefitsincludeflexibility,speed,differentiatedfillingcapabilitiesandTotalCostofOwnership,aswellassustain-ability.Wearesuccessfullydeployingourdigitalservicesolutionstoinstallnewfillinglinesand maintainexistinglines.Increased interest in our digital smart factory solutions is resulting in further projects with customers suchasAlmarai,theMiddleEast’sleadingfoodandbeveragemanufacturer.
+392020
+272017
SIG Net Promoter Score (NPS)
Core revenue growth at constant currency 2017–2020
5.7%
Annual Report 2020
Our Company Our strategy 27

PRIORITIES FOR 2021 AND BEYOND
– Roll out our diversity and inclusion programmes and training
– Promote our new employer branding and foster a ‘We BelieveinMore’cultureatSIG
– Further advance our talent and succession management
– Implementthesecondphaseof our transformational leadership training
PRIORITIES FOR 2021 AND BEYOND
Bring our vision of a net positive, regenerative food packaging system closer to reality with four far-reachingactions:
– FOREST POSITIVE: working with others to greatly expand sustainable forestry
– CLIMATE POSITIVE: combining sustainable innovation with our Forest Positive actions to turn our packaging into a carbon sink that stores more carbon than it emits
– RESOURCE POSITIVE: makingallpacksfromrenew-able or recycled materials using renewableenergy−andmakingsure every carton is recycled
– FOOD POSITIVE: continuing to innovate and work with partners to deliver safe nutrition and hydration to more people
3 People Foster a winning team
4 ResponsibilityGoing WAY BEYOND GOOD
We aim to create an environment where each ofourapproximately5,500employeesworld-widefeelsfreetobelieveinmore.Webelievethat by fostering an inclusive culture, support-ing fair and equal oppor tunities for everyone and creating a working environment free of biases, we enable our employees to develop their full potential and deliver outstanding serviceandperformance.Thatiswhy,in2020,weintroducedSIG’snewemployerbrandingwiththeslogan“We BelieveinMore”.
Wewanttofostera”WeBelieveinMore”culture where people feel empowered to dream big, go above and beyond and make theimpossiblepossible.EveryinnovationorachievementatSIGstartswithbelieving.This isthedrivingforceforustoalways
deliverthe bestsolution–theperfectpackage–for ourcustomers.
In2020,wemadesignificantprogresstowardsour goal of becoming the best employer in our industryandbeyond.Inour globalemployeesurvey,wesawasignificantincreaseintheemployeeNetPromoterScore(eNPS)from–1in2018to21in2020andachievedanoverallengagementlevelof87%,upninepercentagepointsfrom2018andabovetheindustrybenchmarkof80%.
We began rolling out our new diversity and inclusion training, which is mandatory for all our leaders, and established a Diversity & InclusionFocusGroupmadeupofemployeerepresentatives to drive our diversity and inclusionstrategyacrossthebusiness.Wehave set ourselves the target of increas-ingthefemale-to-maleratioinleadershippositionsto30%.On1February2021,wewelcomedthefirstwomantoourGroupExecutive Board > Profile José Matthijsse.
Wealsointroducedanemployeeshareowner-shipplanin2020tofurtheralignemployeeinterestswiththoseofourshareholders.
Our vision is to create a net positive, regenerative food packaging system that gives more to people and the planet than it takesout.Wewantourpackstobecomeliketrees–makingtheworldabetterplace.
We started developing fully recyclable carton packs made mostly from renewable materials manyyearsago.Thesearepartofahighlyefficientandversatilepackagingsystemthatcuts food loss and gives customers all the optionstomeetfast-changingconsumerneeds.Fiveyearsago,wecommittedtobecoming a net positive company by giving more to the world than we take out and goingWAYBEYONDGOOD.
Today, we have embedded sustainability at the heart of our business and are driving systemic change to become a net positive business.
In2020,wecontinuedtodeliverthemostsustainablesolutionstoourcustomers.WeofferASI-certifiedaluminiumforallSIGpacksinEuropeasstandard,anditisavailableinotherregionsaswell.Wehavesoldover150millionpacksfeaturingSIGNATURE,theworld’sfirstasepticcartonpackagingmateriallinkedupto100%torenewable,forest-basedmaterials.Andnewcustomers in Europe and South America have opted for our paper straw solutions, thefirstforasepticcartonpacks.
-58% up to 58% carbon footprint reduction with our sustainableinnovationsvs.astandard1-litreSIGpack
+21 2020
2018 -1
eNPS 2018–202020
Annual Report 2020
Our Company Our strategy 28

OUR TEAMSIG – The best place to turn your dreams into reality
Weaimtocreateanenvironmentwhereallofourapproximately5,500employeesworldwidefeelsfreetobelieveinmorebyhelpingourCompanytoexplorenewpathsandcreatewhat’snext.Webelievethatbyfosteringaninclusiveculture,supportingfairandequalopportunitiesfor everyone and creating a working environment free of biases, we enable our employees to developtheirfullpotentialandtofeelrecognisedandrewarded.
Talent development
OurCompanyoffersawiderangeofpositions,whichareasindividualasourpeople.Weaimtomatch the skills of each employee to the opportunities within the Company and to continuously improvethewayweaddressemployeeneeds.Weundertaketogiveeveryemployeethechancetotakepartininternalorexternaltrainingprogrammes,coachingandmentoring,pluson-the-joblearningexperiences.Allup-skillinganddevelopmentrequirementsareidentifiedaspartofthereviewandfeedbackprocessthroughouttheyear.Weidentifytalentsthatweneedtofosteraswellasgapsinoursuccessionpipelinethatweneedtofill.Theideaofourtalentandsuccession management is to establish frameworks, processes, tools and skills to systematically andeffectivelyidentify,manage,activelydevelopandretainemployeeswithhighperformanceandpotential.Weadaptourtalentadvancementapproachtocertaincareerpathsinordertoprepareourtalentsforsuccessintheirtargetedfuturerole.
Our leadershipprogrammesprovide intensive training in theSIGLeadershipModel so thattransformational leadership becomes our common leadership philosophy – inspiring and empoweringotherstocontinuouslylearn,innovateandgrow.
Employee satisfaction
By creating an engaging and energising working environment, we aim to enable our employees tounfoldtheirfullpotentialandtoimprovetheirworkplaceexperience.Bylisteningtothemandrespondingtotheirviews,wehelptosustainhighlevelsofjobsatisfaction.
To further foster engagement, we give our employees a voice in our biennial Employee Engagement Survey and in the implementation of concrete improvement measures in their areaofresponsibility,scopeofinfluenceanddirectworkingandteamenvironment.WealsoengageemployeesinthebusinessthroughvirtualQ&AswithourCEO,town-hallmeetingsandsmallergroupsessionswithSIGC-Levelexecutives.Furthermore,in2020welaunchedournewemployeevalueproposition,‘BelieveinMore’–boththroughinternalcommunicationsandonsocialmediaandonourSIGcareerwebsitesoastoengageexistingandprospectiveemployees.Asresult,ournetpromoterscoresignificantlyimprovedandoursustainableengagementscoreexceededtheindustrybenchmarkinthe2020survey.
Annual Report 2020
Our Company Our team 29

So that our employees feel motivated and energised at work, we are implementing measures thatsupportahealthywork-lifebalance.Weofferemployeebenefitsreflectingtheregional,legalandculturalcontext.Theseincluderetirementbenefits,healthandlifeinsurance,flexibleworkarrangements(e.g.part-timepositions,workingfromhome),andparentalbenefitsandleave.Weremunerateemployees in linewithexistingmarketpractices.Webenchmarkourcompensation approach against other companies to ensure that our compensation packages arecompetitiveineachofourmarkets.TheCompanyensuresthatperformanceisrecognisedandrewardedinafairandtransparentmanner.
Employment and labour rights
TheSIGCodeofConductaddressesethicalandlegalprinciplesingeneral,whilsttheSIG BusinessEthicsCodesetsoutmorespecificprinciplesregardingemploymentandlabourrights.EmployeesareencouragedtoreportanyviolationoftheprinciplesthroughtheSIGEthics &ComplianceHotlineoranyotheravailablechannel.AspartofourSedex (SupplierEthicalDataExchange)membership,allourproductionsitesundergoSMETA(SedexMembersEthicalTradeAudit)four-pillarauditsonaregularbasis.
Diversity and inclusion
Webelievethatbyfosteringamoreinclusiveculture,empoweringpeoplewithdifferentabilitiesand supporting equal opportunities, we can add value to our business, improve the lives of our employeesandmakeasignificantcontributiontosociety.Wehaveestablishedadiversityandinclusionstrategywithanoverarchingvisionandsettargetstoimproveourgenderequality.TosustainourD&Istrategyandculturalchangeactivities,welistentoournewlyformedDiversity &InclusionFocusGroupwithdiverserepresentativesfromourglobalorganisation.Ourleadershave been trained to recognise their unconscious biases and to create relevant conditions to fosterdiversityandinclusionbyactivelydrivingchange.
The Company is fully committed to preventing discrimination on any grounds, and we have publicly committed to promoting diversity throughout our organisation as a signatory of the GermanDiversityCharter(ChartaderVielfalt).
In our last Employee Engagement Survey, the vast majority agreed that the Company isperceivedasanopen-mindedorganisationwithabroaddiversityofemployees.
Annual Report 2020
Our Company Our team 30

TECHNOLOGY AND INNOVATIONExcellence – Engineered. Solutions – Delivered.
Our innovation capabilities enable us to address multiple customer needs and respond to fast-changingconsumertrends.Wedrawontheunmatchedflexibilityofoursystemtocreatemodular solutions that give customers the optionality they need.We spend approximately3% ofrevenueonR&D,andourinnovationsarepatent-protected.
OurR&D is conducted at twomajor TechCentres in Linnich,Germany and Suzhou,China.Here we design, engineer and test innovative packaging structures and shapes as well as new productformulations.Weconductfillingtestsonthelatestfillingmachines,andourcustomerscan visit the centres themselves to try out the new product formulations in an industrial setting.InLinnich,theTechCentrehasfoodaccreditation,enablingusandourcustomerstocarryout consumertrials,withproductsmarketeddirectlyinretail.TheTechCentreinSuzhou,openedin2018,isenablingustofasterservetherapidinnovationcyclesthataretypicaloftheAPAC region.
Our unique technology
TheuniqueadvantagesoftheSIGportfoliolieinourproprietaryfillingtechnologyandsleeve-basedsystem.Weofferarangeofpackagingformats,volumesandopeningsolutions,providingourcustomerswithmorethan270packagingoptions.Takingadvantageofourdifferentiatedfillingcapabilities,customersfillmorethan10,000foodandbeverageproductsintoourpacks.Theflexibilityofoursystemlimitschangeoverdowntimeandresultsinbetterassetutilisationformanycustomers.Aswellasahighlevelofreliability,oursystemofferslowwasteratesforboththepackagingandthefinishedproduct.
ADDRESSING MULTIPLE CUSTOMER AND CONSUMER NEEDS
Traceability solutions
7
Supply chain solutions
6
Service solutions
5
End-to-end design solutions
3
Digital marketing solutions
8
Filling line solutions
4
Packaging solutions
2
1
OUR PROMISEExcellence – Engineered.
Solutions – Delivered.
Product solutions
Annual Report 2020
Our Company Technology and innovation 31

Benefits for customers and the environment
In2020,weintroducedfurtherenhancementstoourfillingmachines,withbenefitsforthecustomerandtheenvironment.Thetemperatureoftheheatersthatarerequiredatvariouspointsinthefillingprocesscannowbereducedduringidletimes,deliveringanenergyreductionofupto85%.
Wealsolaunchedtwowater-savingsolutionsin2020:aconversionkitforfillingmachinestoreduce water usage around the pocket chain and SureBrite, a cleaning machine that reduces manuallabouraswellaswateruseforcleaning.
Digital solutions in the factory…
AllnewfillingmachinesfromSIGnowcomewithindustry-standardOPCUnifiedArchitecture(OPC-UA) connectivity built in. This enables horizontal machine-to-machine and verticalcommunicationwithintheentireproductionplant–fromshopfloortotopfloor.AllexistingSIGfillingmachinescannowalsoberetrofittedwithasimpleplug-and-playinstallationprovidingOPC-UAconnectivity.
After successful piloting in the Middle East, the Plant 360 Asset Management solution, co-developedwithGEDigital,isnowbeingrolledoutinAsia-PacificandtheAmericas.
… and in the supermarket
Our PAC.ENGAGEsolutionprovidesavarietyofdigitalcommunicationoptionsthatbrandscanusetointeractwithconsumersdirectlyonthepackage.Withasimplescanfromasmartphone,theuniqueQRcodecanlaunchdynamicengagementintheformofluckyraffles,loyaltyprograms,quizzesandmore.InBrazil,milkproducerGloriawantedtoraiseitsprofileandbetterunderstandwhereitfitsintheBrazilianmarket.GloriausedthePAC.ENGAGEstaticcodetosetupaprogramwhereconsumerswhoscannedthecodeandcompleteda10-minutesurveywererewardedwiththechancetowinprizessuchastelevisions,iPadsandiPhones.ThesurveysprovidedGloriawithadeeperconsumerunderstandingthaniftheyhadusedamoreexpensiveresearchagency.
Continuous innovation
Throughourconsumer-ledresearch,wehelpourcustomersbringnewproductstothemarketinpacksthatperfectlymatchtheproductconcept.Wearealsoenablingcustomerstorespondto growing environmental concerns by offering fully renewable packaging, including theindustry’sfirstaluminium-freesolutions–ECOPLUS and SIGNATURE100.Wehavestartedtoreplacefossil-basedpolyethylenewithplant-basedmaterial(SIGNATURE100andFullBarrier)viaamass-balancesystemandrecentlybecamethefirstcompanytoofferbeveragecartonswithcircularpolymersmadefromrecycledpost-consumerplasticwaste.
Andtoshowthatwearealwayslookingtowardsthefuture,SIG–togetherwithNestlé,Logitechand other industry partners – is funding a new Chair for Sustainable Materials Research at EPFL, theSwissFederalInstituteofTechnologyinLausanne,Switzerland.
Energy reduction of up to
85%
Water use reduction for filling machines and for cleaning of up to
50%
Annual Report 2020
Our Company Technology and innovation 32

BUSINESS REVIEW
34 Responsible business review
43 Regional review43 EMEA46 APAC48 Americas
49 Key performance highlights
50 Financial review
59 Risk management
Annual Report 2020
33

Going WAY BEYOND GOOD
Choosing a SIG carton is like planting a tree − it makes the world a better place. That is our vision, and our WAY BEYOND GOOD ambitions will help us make it a reality.
Our mission
It is our mission to create food packaging that makes the world a better place by
• expanding forests across the world,• taking carbon from the atmosphere,• creating more resources for future generations, and• ensuring nutrition and hydration comes safely to ever more people.
Thesefar-reachingambitionsfocusonfouractionareasthattogetherwillproducethebiggestpositive impact – for the environment, society and our business. All four action areas areinterconnected.Eachnurturestheothersandallareneededtoachievesustainablechange.
Building on strong foundations
We started developing fully recyclable carton packs made mostly from renewable materials many yearsago.Thesearepartofahighlyefficientandversatilefillingsystemthatcutsfoodlossandhelpscustomersmeetfast-changingconsumerneeds.
Fiveyearsago,wecommittedtobecominganet-positivecompany−givingmoretosocietyandtheenvironmentthanwetakeout.WecallthisgoingWAY BEYOND GOOD.In2020,wecompletedthefirstphaseofourroadmap.Nowwearesettingnewtargetsfor2025andbeyond.
Ourapproachcoversallaspectsofsustainability:social,environmental,economicandgovernance.Itaffectseverythingwedo–onourownandwithoursuppliers,customersandstakeholders.WAY BEYOND GOOD is an integral part of our business strategy, our compass, and senior managers areresponsibleforimplementingspecificworkstreamsandtargets.
Accelerating progress
Withsustainabilityfirmlyembeddedattheheartofourbusiness,wecontinuetodrivesystemicchange to become a net positive business and help create a net positive, regenerative food packagingsystem.
RESPONSIBLE BUSINESS REVIEWCO2 scope 1 and 2 emissions (t)
84.1k2019:105.8k
Annual Report 2020
Business review Responsible business review 34

Wewillbuildonourresponsiblecultureandindustry-leadingsustainableinnovationtopushforward with WAY BEYOND GOOD.Wearedevelopingaclearroadmaptogetusthere.Andwewillpartnerwithstakeholderstoacceleratepositivechange.
Throughout this journey, our bold ambitions will help us maintain our momentum as we learn along the way and evolve our approach to overcome challenges and maximise impact as we get ever-closertoourvision.
Forest Positive
Today, all our raw paperboard is sourced from sustainably managed forests. Next we are focused on greatly expanding sustainable forestry across the world.
Sustainably managed forests help to preserve vital ecosystem functions, support biodiversity and provide a wide range of essentials – from renewable raw materials to oxygen in the air webreathe.Worldwide,oneinfivepeopledependonforestsfortheirlivelihoods.Forestsalsohaveacriticalroletoplayintacklingclimatechangebecausetreesstorecarbonastheygrow.TheUNaimsnotonlytopreventfurtherdeforestationbuttoexpandglobalforestareaby3%–or around120millionhectares–by2030.
By sourcing renewable raw materials from sustainably managed forests, we are helping forests –andthecommunitiesthatdependonthem–tothrive.
Our progress
Around75%ofeverySIGpackismadefromforest-basedliquidpackagingboard.OurcombiblocECOPLUSsolutionincreasesthisto82%andSIGNATURE100istheonlyasepticcartonintheworldthatislinkedto100%forest-basedmaterials.1
Our Forest Stewardship Council™ (FSC™) Chain of Custody certification (licence code FSC™C020428)enablesus–andourcustomers–totraceourrawmaterialsbackthroughthesupplychaintosustainablymanagedforests.FSC™standardsrequireforestmanagementthatsupportsbiodiversity, prevents deforestation and degradation, and respects the rights of workers, local communitiesandindigenouspeoples.
Overthelastdecade,wehaveledtheindustryindrivingprogressonFSC™certification.Since2009,allourliquidpackagingboardhascomefromFSC™-certifiedmillsand–asofJanuary 2021 –100%ofitispurchasedwithFSC™-Mixcertification.ThismeansthatallourboardismadewithamixoffibressourcedfromFSC™-certifiedsustainableforestsandotherFSC™-controlledsources.
We achieved this milestone by engaging with our board suppliers – large and small – to embrace the wide-reaching benefits of FSC™ certification. And we are extending our forest positiveimpact even further by calling on our customers to include the FSC™ logo on their packs to raiseconsumerawarenessofresponsiblesourcingandencouragethemtobuymorecertifiedproducts.Over96%ofthepackswesoldin2020carriedthelogo.
1 Linkedtowoodresiduesfrompapermakingviaanindependentlycertifiedmassbalancesystem.
100%of our liquid packaging board comes with FSC™-Mixcertification(asofJanuary2021)
97%ofSIGpackssoldin2020 carried theFSC™label
Annual Report 2020
Business review Responsible business review 35

“SIG has led the market with bold ambitions for FSC™ certification and I’m impressed they have been able to do it on a global scale.
The Company is showing the way for others by making a commitment not just to meeting requirements with 100% FSC™-certified board, but to using FSC™ labelling on its packs as a platform for consumer awareness.”Kim Carstensen, Executive Director, Forest Stewardship Council
Climate Positive
Today, our packs offer the lowest-carbon solutions available. Next, we are combining sustainable innovation with our Forest Positive actions to make food packaging like a tree – taking carbon from the atmosphere and making the world a better place.
We have just witnessed the warmest decade on record, with greenhouse gas levels rising to new recordsin20192despitetheParisAgreementtosignificantlyreduceemissionsglobally.Changingweatherpatternsandmore frequentextremeweathereventsarealreadyaffecting livesandlivelihoodsaroundtheworld.
Urgent action is needed to tackle the climate emergency, and we have joined other leading companiesincallingongovernmentstoRecoverBetterbyaligningCOVID-19recoveryeffortswiththeParis goals.
Our progress
Wehavesetbold targets,approvedby theScience-BasedTargets Initiative, tocut thecarbonfootprintofourownoperationsby60% in linewith the latest climatescience tokeepglobalwarmingbelow1.5°Candreduceourvaluechainfootprintperlitrepackedby25%–bothby2030.
Byswitchingto100%renewableenergytomanufactureourpacks,wehaveachievedcarbonneutralproductionsince2018–anindustryfirst–andwearecontinuingtoextendouron-siterenewableenergygenerationcapacity.Wenowhave4.8MWpofrooftopsolararrays inoperation,withfurtherinstallationsindevelopmenttoincreasethistotaltoaround18MWp.
We are also encouraging suppliers to use renewable energy and take steps to reduce their climate impacts.Suppliersrepresentingover60%ofourglobalaluminiumfoilsupplyarealreadycertifiedtotheASIstandard,whichsetsstrictlimitsforgreenhousegasemissionsfromtheenergy-intensivealuminiumproductionprocess.Thishelpstocutourownvaluechainfootprintandhasawiderpositiveimpactbydecarbonisingsupplychainsinourindustryandbeyond.
2 https://www.un.org/sustainabledevelopment/climate-change/
Annual Report 2020
Business review Responsible business review 36

Ourlow-carbonpackagingsolutionsarehelpingtoreducetheclimateimpactoftheglobalfoodsupplysystem.Witharesource-efficientdesign,ahighproportionofrenewablematerialandnoneedforrefrigeration,ourpackshavealife-cyclecarbonfootprintthatisupto70%lowerthanalternativetypesofpackagingsuchasplasticandglassbottles,cansandpouches.
The latest innovations in our SIGNATURE portfolio cut the carbon footprint of our standard packsbyafurther27%to58%.Wearealsohelpingcustomerscutemissionsfromusingourfillingmachines in their factories. Forexample,ournewupgradekit can cutenergyusebyaround85%instandbymode.
100%renewable energy for productionsince2018
Resource Positive
Today, all our packs are recyclable, with some made entirely from renewable raw materials. Next we are going to work on making all our packs exclusively from renewable or recycled materials using only renewable energy and on ensuring every carton is recycled – all to make sure we help create more resources for future generations.
Thetraditionaltake-make-wasteeconomyisputtingtoomuchpressureontheplanet’sfiniteresourcesand limitedcapacity toabsorbwaste.A circulareconomy–one thatdesignsoutwaste, regenerates natural systems and keeps products and materials in circulation – can help to relieve this pressure, prevent environmental impacts of packaging waste and halve carbon emissionsby2030inEuropealone.
Unlike most packaging alternatives, our cartons are made mainly from renewable materials (around75%onaverage).Thismeanstheyarealreadycontributingtothecirculareconomyatthestartoftheirlifebyusingrenewablematerialsthatsupporttheregenerationofnaturalresources.
Our progress
SIGNATURE100islinkedto100%renewablematerial3,andourpaperstrawsolutionoffersthefirstrenewablealternativetoplasticstrawsforusewithasepticcartonpacks.
Someofourrawmaterialsaremadefromby-productsfromotherindustries–suchaswoodchips, papermaking residues and scrap aluminium. In a groundbreaking partnership withSABIC,wehaveintroducedtheworld’sfirstasepticcartonpackagingmaterialmadefrompost-consumerrecycledmaterial.
All our packs are designed to be fully recyclable, and we are working with others to boost recyclingratesandkeephigh-qualitymaterialsincirculation–includingrenewablefibresforpaperandboardproducts,polymersandaluminium(separatelyandcombinedasPolyAlforrooftilesandfurniture).
3 Linkedtowoodresiduesfrompapermakingviaanindependentlycertifiedmassbalancesystem.
Annual Report 2020
Business review Responsible business review 37

Through industry partnerships, such as the Global Recycling Alliance for Beverage Cartons and the Environment (GRACE), EXTR:ACT and 4evergreen, we are advocating for enablingregulationsandcollaboratingonspecificprojectstosupportthecollectionandrecyclingnotonlyofbeveragecartonsbutothertypesofpackaging,too.
We also partner with NGOs, customers and industry on local projects in priority countries – including the innovative so+ma and Cidade+Recicleiros waste collection initiatives in Brazil (whichbringbothenvironmentalandsocialbenefits),supermarketcollectionpointswithNestléinIndonesiaandanewrecyclingfacilityinGermanythatwillenabletherecoveryofpolymersandaluminiumfromPolyAl.
Food Positive
Today, our filling technology minimises food loss, and our packs keep food safe for months without the need for refrigeration. Next we are going to continue to innovate and work with partners and communities to deliver safe, affordable nutrition and hydration to ever more people while further reducing food loss.
Nearly690millionpeoplearehungryandafurthertwobilliondonothaveregularaccesstosafe,nutritiousandsufficientfood.4 At the same time, a third of food globally is lost or wasted5 which hasknock-oneffects for climateand landuse.TheUnitedNationshascalled foraprofoundchangeintheglobalfoodandagriculturesystemtofeedtheworld’sgrowingpopulation.6 And the COVID-19pandemichasshownhowcriticalaresilientsupplychainistokeepfoodsuppliesgoing.
Our aseptic packaging solutions are ideally suited to help customers preserve and deliver nutritiousfoodlikemilk,fruitjuiceandsouptoconsumers.
“Our ambition is to make 100% of our packaging to be reusable or recyclable by 2025. But it is also important that the infrastructure is in place to allow recycling to happen. The Cidade+ Recicleiros partnership between Nestlé and SIG is the basis for the development of a lasting infrastructure that will make a positive impact on the environment, communities and business.”Cristiani Vieira, Environmental Sustainability Manager, Nestlé
4 https://www.un.org/sustainabledevelopment/hunger/
5 https://www.un.org/sustainabledevelopment/sustainable-consumption-production/
6 https://www.un.org/sustainabledevelopment/hunger/
Annual Report 2020
Business review Responsible business review 38

Takemilk, forexample. It is fullofessentialvitamins,calciumandprotein.But freshmilk isperishable,only lastinga fewdays in therefrigeratoror less.Ourasepticpackagingsystempreservesthemilk–anditsnutrients–forsixmonthsormoreinacost-effectiveway.Anditcanbe transported and stored safely without needing to keep it cold, which requires a lot of energy andcanbechallengingindevelopingcountries.
Our progress
In2020,weproduced38billionpackstohelpourcustomersdelivernutritionandhydrationtoconsumersaroundtheworld.Wemaintainrobustqualityandsafetymanagementsystemscertifiedtorecognisedstandardsatallourplants.
Withourhighlyefficientmachines,lessthan0.5%ofpacks–andtheirfoodcontents–arelostduringfilling.Wearecontinuallylookingforwaystoreducethisevenfurtheraswedesignnewmachinesandupgradekitsforexistingones.ThroughournewSIGCUBATOR programme, we aremakingourhighlyefficientmachinesavailableforstart-upsbyenablingthemtousesparefillingcapacitytohelpthemdelivernutritiousnewproducts.
We are creating innovative models to get food to the people who need it most through the SIGWAY BEYOND GOOD Foundation – and exploring how to scale these models to expand our positiveimpact.
Cartons for Good,thefoundation’sflagshipproject,ishelpingtopreventfoodlossandmalnutritioninBangladeshbyusingadown-sizedfillingunittohelpcommunitiespreservesurpluscropsinSIG packs.Everymonth,itturnsuptotwotonnesoffoodlossinto6,000mealsforunderprivilegedschoolchildren.DuringCOVID-19schoolclosures,wemaintainedoursupportwithregularaidpackagesforthechildrenandtheirfamilies.
The latest campaign of our WAY BEYOND GOODChampionsfocusedontheroleSIGcartonsplayindeliveringnutritious,healthyfood.Theyinvitedemployeesfromacrossthebusinesstogetinvolved with interactive quizzes, nutrition webinars and virtual cooking competitions to present theirfavouriterecipeusingfoodfromSIGcartons.Teamsaroundtheworldalsodonatedfoodtosupportpeopleinneedintheirlocalcommunities.
<0.5%industry-leadingwasterate forfillingmachines
Annual Report 2020
Business review Responsible business review 39

Sustainable innovation
Our focus on sustainable innovation is driving progress in all four of our WAY BEYOND GOOD action areas.
Sustainabilityisoneofthecorevaluedriversforallourproductdevelopment.WeareguidedbyindependentISO-compliantlife-cycleassessmentstoensurewetakeintoaccountenvironmentalimpacts–fromsourcingrawmaterialstomaking,fillinganddistributingourpacksthroughtotheirdisposalbyconsumersafteruse.
Our mainly renewable, fully recyclable, low-carbon packaging solutions can support thetransitiontoalow-carbon,circulareconomy.Overthelastdecade,wehavebeeninnovatingtocut their life-cycle impactseven further, raising thebarwithahostof industryfirsts (see> For our planet).
Our progress
This year, we once again led the industry once again with the launch of SIGNATURE Circular, the firstasepticcartonsolutionmadefrompost-consumerrecycledmaterial.7
Uptake of our most sustainable solutions – our SIGNATUREportfolio–continuestogrow.Wehave now sold over one billion packs with combibloc ECOPLUSandover150millionpackswithSIGNATURE100orSIGNATURE Full Barrier packaging materials that use polymers linked to 100%renewablematerial.8
Customers such as Riedel, Hartung Nahrungsmittel Produktions and nutpods have extended SIGNATURE Full Barrier to further products in their portfolios. Finnish start-up Juustoporttichose our new combismile format with our SIGNATURE Full Barrier solution for its new range ofoat-baseddrinks.AndSteLaitièredesVolcansd’AuvergneswitchedtoourSIGNATURE 100packagingmaterialforitsLesFayesorganicUHTmilkinFrance.
Severalcustomersarenowusingourpaperstrawsolutions–thefirstintheindustry–forsmallformaton-the-gopacks,includingNestléinBrazilandEcuador,TofusaninThailandandsevencustomersinEurope.Thiswillsave10tonnesofplasticayearforIntermarchéalone.
Wearealsocontinuingtoimprovetheefficiencyofournewfillingmachinesandintroducingtechnical upgrades to help customers reduce resource use from existing machines in their factories.Ourlatestupgradecutswaterconsumptionbyupto50%andcanbecombinedina‘greenbundle’withakitthatcancutenergyusebyaround85%duringproductionstoppages.
Our technical service solutionshave supported sustainability improvements for 37%ofourcustomerssince2016.
7/8 Viaanindependentlycertifiedmassbalancesystem.
Annual Report 2020
Business review Responsible business review 40

Responsible culture
Our commitment to go WAY BEYOND GOOD for people and the planet is underpinned by our responsible culture.
We take a responsible approach across the value chain – sourcing certifiedmaterials fromresponsible suppliers, supporting our own employees and keeping them safe, managing environmental impacts from our operations, engaging communities and acting with integrity ineverythingwedo.
Indoingso,wearenotonlysupportingourbusinessandWAY BEYOND GOOD ambitions, we canalsohavewiderpositiveimpacts.Forexample,whenwetrainingemployeestoadoptsafebehavioursatworktheyalsotakethosesafebehaviourshometotheirfamilies.
Our progress
Transparency ispartofour responsible culture.Wehavepublisheddetaileddisclosuresonour commitments and approach to environmental, social and governance (ESG) topics, with ourlastfullCRReportfor2018winningtheedieSustainabilityLeadersAwardforSustainabilityReportingandCommunicationsinrecognitionofitstransparentapproach.
We train employees on our Code of Conduct, and all our production sites complete regular SEDEX SMETA audits on ethics, labour rights, safety and environmental criteria.We expectsuppliers to meet similar high standards, and those supplying key raw materials are required to meettherequirementsofrelevantcertifications.
Weoffertheonlyasepticcartonswithall threekeymaterials fromcertifiedsources–FSC™liquidpackagingboard,ASIaluminiumfoilandISCCPLUSpolymerslinkedto100%renewablematerials9.AsofJanuary2021,100%oftheliquidpackagingboardusedinourpackscomesfromFSC™-certifiedforests.WenowofferASI-certifiedaluminiumfoilasstandardforcustomersinEuropeandNorthAmerica.Andalltheforest-basedpolymersweusearecertifiedtoISCCPLUSor REDcert2.
Keeping our people safe and well is always a priority, and we increased our focus on health andwellbeingtosupportthemthroughCOVID-19.Ourlost-timecaseratefurtherdecreasedin2020,andtwoplantswonourCEOSafetyExcellenceAwardforreachingsignificantmilestoneswithoutlost-timecases.
Engagementlevelshavesignificantlyimprovedinthisyear’semployeesurvey,andoutperformingthe industrybenchmark in every category.We continued toprovide extensive training anddevelopment opportunities, including more online options for those working remotely during the pandemic, andwe established an employee-led focus group to drive our diversity andinclusionstrategy.
9 Viaanindependentlycertifiedmassbalancesystem.
Annual Report 2020
Business review Responsible business review 41

Weretainedourpositionamongthetop1%ofparticipating businesses with a Platinum rating in the latest assessment on sustainability by EcoVadis.Thisrecognisedassessmenthelpsusdemonstrate our credentials to customers and drive leading sustainability practices within our
business.Ournewsustainability-linkedloanisalsotiedtoourEcoVadisscore.Theratingisbasedon a detailed independent assessment of our policies, processes and performance with regard to environment, labour and human rights, ethics andsustainableprocurementcriteria.
EcoVadis Platinum: top 1% for sustainability
Wealsocontinuedtoengagewithcommunities,withaparticularfocusonCOVID-19support.Since2016,wehaveincreasedthecumulativeimpactofourcommunityengagementprogrammesnearlytenfoldcomparedwiththebaselineyear.
Our responsible approach is recognised by leading independent raters and rankers, with a Platinumrating fromEcoVadis,anAAranking fromMSCIanda lowriskscoreof18.8 fromSustainalytics.In2020,weenteredintonewsustainability-linkedloanfacilities.
2021
Annual Report 2020
Business review Responsible business review 42

REGIONAL REVIEW
EMEA
Introduction
SIG’s aseptic carton packaging business originated in Germany, and our largest sleeveproductionplantgloballyisinLinnich,wherewealsoassemblefillingmachinesandconductR&Dandconsumertrials.
OurpresenceintheMiddleEastandAfricahasuntilnowbeenthrougha50/50jointventure,SIGCombiblocObeikan.The jointventure’ssalesarenotconsolidated,butourshareofnetincomeisrecognisedintheGroupincomestatement.On25November2020,SIGannounceditsintentiontoacquirethe50percentofthejointventurewhichitdoesnotalreadyown.Uponcompletion,thetransactionwillleadtofullconsolidationoftheMiddleEastandAfricabusiness.
2020 overview
Responding rapidly to increased orders in Europe
Europe isa relativelymaturemarketwithahigh levelofper capitamilk consumption.Our go-to-marketstrategyisbasedonwinningnewcustomersandgrowingwithexistingcustomersbyofferingflexibleandcost-efficientsolutions.Wearealsoenteringintoandgrowinginnewcategories.
In2020,ourbusinesssawanunexpectedtailwindarisingfromtheCOVID-19crisis.AslockdownswereimposedacrossEuropeinMarch,consumersstockeduponshelf-stablegoodssuchasthosefilledbySIG.Thegrowthindemandforcartonpacksacceleratedinthesecondquarterasat-homeconsumptionincreased,withhouseholdseatingmoremealstogetherandconsumingmorebeveragesathome.Atthesametime,customersandretailersbuiltstocksinordertoavoidarepeatoftheshortagesthatoccurredduringtheearlydaysofthecrisis.Whilethesestocks were partly drawn down in the second half of the year, a further wave of lockdowns resultedindemandremainingatahighlevel.
AlargeportionofourbusinessinEuropeconsistsoflitrepackswhicharesuitedforat-homeconsumption.Butitwasnotjusttheproductrangethatmetcustomers’needs.Theteamsatourfactories worked tirelessly to meet the high level of demand, and in April our factories recorded anall-timeproductionrecord.Wealsoovercamethemanylogisticalchallengescausedbythecrisistoensurethatweachievedon-timedeliveryandahighlevelofcustomersatisfaction.
Core revenue
€798m2019:€755m
Growth at constant currency
+5.6%
Annual Report 2020
Business review Regional review 43
Capitalising on growth opportunities in Middle East and Africa
SIGCombiblocObeikan’sgeographicterritoryspans70countriesinMiddleEastandAfrica(MEA),withrevenuecurrentlygeneratedin17countries.Growthpotentialcomesfromtheyoungandgrowing populations in countries where GDP per capita is on the rise, and it is further driven byurbanisationanddisposable incomegrowth.Changing lifestylesandconsumptionhabitsfavour processed and packaged food, an area where our aseptic carton packaging solutions playan important role.Ashousehold incomes remain low inmany countries, theability toprovideaffordablesolutionsisalsoakeysuccessfactor.
Performance highlights
Meeting customer needs in Europe
In2020,wefurtherstrengthenedourpresencewithleadingcustomerssuchasArla,whichuseourpacksnotonlyfortheEuropeanmarketbutalsotoexportmilktoAsia.ArlahasastrongsustainabilitypositioninginEurope,whichisperfectlycomplementedbyouraluminium-freestructures ECOPLUS and SIGNATURE.
At the same time, our drive to win new customers continued and we fully leveraged the versatility ofourportfolioandourrecentinnovations.
We expanded our presence in the fast-growing category of plant-based milks. We signeda contract with MONA, which is part of the Hain Celestial Group and one of the largest co-packersandproducers.Thefirstfillingmachinewasplacedtowardstheendoftheyearandnowproducesone-litrepacksofrice,soy,almondandcoconutmilk,featuringournovelfullyresealableandleak-proofcombiMaxxclosure.InFrance,TribillathasadoptedSIG’stechnologyforitsflavouredsoydrinks,alsowithcombiMaxx.
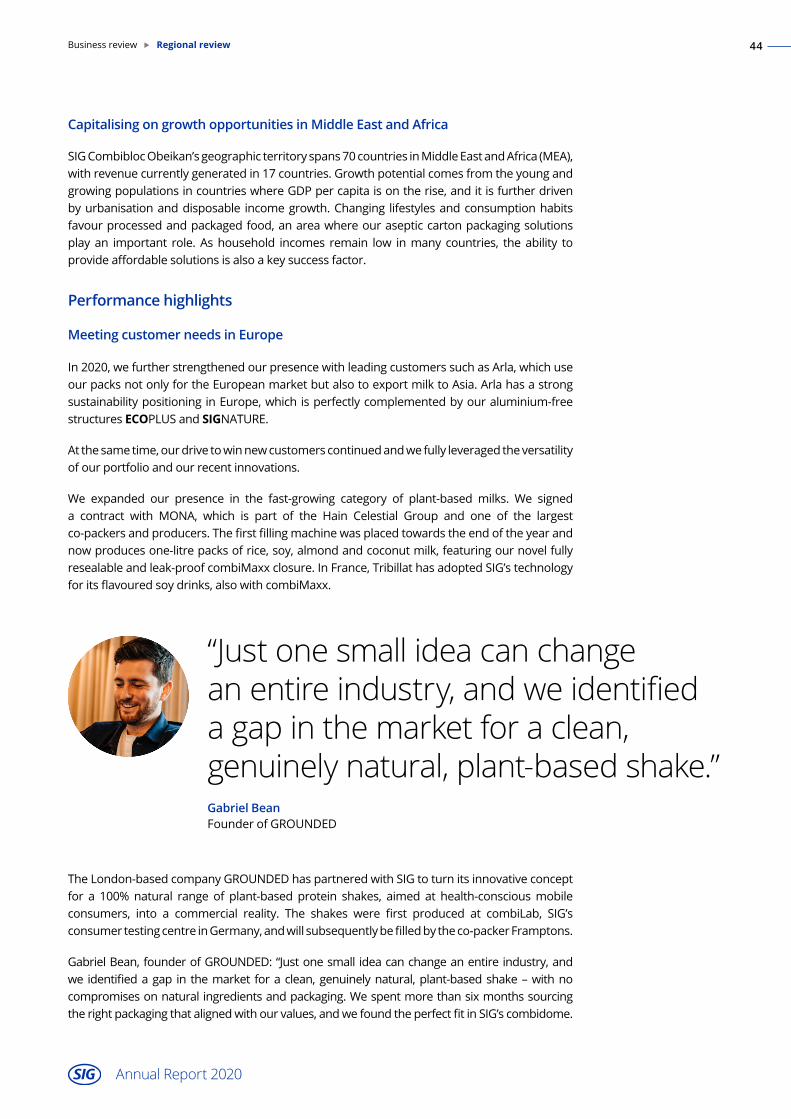
TheLondon-basedcompanyGROUNDEDhaspartneredwithSIGtoturnitsinnovativeconceptfor a 100%natural range of plant-basedprotein shakes, aimed at health-consciousmobileconsumers, into a commercial reality. The shakes were first produced at combiLab, SIG’sconsumertestingcentreinGermany,andwillsubsequentlybefilledbytheco-packerFramptons.
Gabriel Bean, founder of GROUNDED: “Just one small idea can change an entire industry, and we identifiedagap in themarket foraclean,genuinelynatural,plant-basedshake–withnocompromisesonnaturalingredientsandpackaging.Wespentmorethansixmonthssourcingtherightpackagingthatalignedwithourvalues,andwefoundtheperfectfitinSIG’scombidome.
“Just one small idea can change an entire industry, and we identified a gap in the market for a clean, genuinely natural, plant-based shake.”Gabriel BeanFounder of GROUNDED
Annual Report 2020
Business review Regional review 44

Finnish food producer Juustoportti has launched a new range of premiumoat-baseddrinksinSIG’s combismilecartonpackaging.
Its sustainabilitystoryanduniqueshapemakeittheperfectoptionforourrange.Beyondthecarton,theteamandpeopleatSIGwerejustasalignedwithourvalues,andwecouldn’thavefoundabetterpartnershipwithwhichtolaunchtheseproducts.TheysupportedusallthewayfromourfirstcontactwiththeirUKteamthroughtotheirexceptionalcombiLaboperation inGermany.Welookforwardtocontinuingourpartnershipherewithsuchprofessionalsintheirfield.”
Our combismile cartons made their European début in Finland with a launch by Finnish food producerJuustoportti.Juustoporttihaslaunchedanewrangeofpremiumoat-baseddrinks–FriendlyViking’sOatDrinks–whichwillhelptodeveloptheon-the-gomarket.Therangehastwodrinkingoptions–asingle-actionclosureorapaperstraw–withadrinksplusoptiontoallowtheadditionofhealthyingredientssuchasfruitsoroats.
Andthefuturelooksverypromising.InApril,weannouncedthatHochwald,aleadingGermandairycooperative,haschosenSIGasitspreferredpartnerforanewdairyproductionsite.Wewillsupply15ofthe16newfillingmachinesfortheplant,whichwillhaveacapacityofmorethan800millionlitresofmilkayear.Theplantisscheduledtocomeon-streamin2022.
Liquid dairy wins in MEA
In2020,SIGCombiblocObeikancontinueditsstrategicfocusonliquiddairy,whichrepresentsacheapandeasilyaccessibleformofproteinforconsumerswithlimitedpurchasingpower.Over60%ofthejointventure’ssalesarenowinliquiddairy,comparedtolessthanhalffiveyearsago.
Mazoon Dairy, the largest integrated dairy company in the Sultanate of Oman, chose SIG CombiblocObeikanforthelaunchofafullrangeofliquiddairyproductsinvarioussizesandformats.MazoonDairywillalsouseSIGpacksforjuices.Otherdairy-relatedsuccessesincludedafurtherexpansionofbusinesswithAlmaraiinSaudiArabia,ZakiGroupinIraqandTchinLaitinAlgeria,aswellasapartnershipwithAlJaiedinLibyatolaunchthefirstevaporatedmilkinasepticcartonpackaging.
AfterasuccessfultransitiontoSIGfillinglines,SoummaminAlgeriawasabletolaunchnewformats and sizes to enter new product categories, including cream, enriched milk, blended milk andflavouredmilkforchildren,aswellasfoodproductssuchasbéchamelsauce.
Annual Report 2020
Business review Regional review 45

APAC
2020 overview
MostofthecartonswesellinAsia-Pacificaresmallinsizeandthereforesuitableforon-the-goconsumption,inlinewiththebehaviourandlifestylesofconsumersintheregion.TheCOVID-19crisisnaturallyreducedtheopportunitiesforpurchasingandconsumingsuchproducts.Takingthis intoaccount,oursales in theregionheldupwell, reflecting theessentialnatureof theproductswefill.
InChina, customersbuiltupsafetystocksduring theheightof theCOVID-19crisis inordertoensuresufficientsupplygiventhelogisticalchallengesatthattime.Followingtheliftingoflockdowns, consumption gradually returned to a more normal pattern in the second half of theyear.Anincreasedconcernwithhealthynutritionintheaftermathofthecrisisledtostrongdemandformilk.
IntherestofAsia,lockdownsstartedlaterandcontinuedforlonger.Withtravelandtourismcurtailed, on-the-go consumption continued to be affected in the second half of the year.Schools remained closed in some areas, causing school milk programmes for which our cartonsareusedtobesuspended.Whiletheseconditionsdidhaveatemporaryimpactonthepurchasingpatternsofourcustomers,themedium-andlong-termfundamentalsforthissub-regionremainfirmlyintact.
Visy Cartons, acquired at the end of November 2019, was successfully integrated into theAsia-Pacific region in 2020. Business in Australia progressed well during the year, and theimplementationofsynergiesisontrack.
Performance highlights
Health concerns top of mind
NewgrowthcategoriesinAsia-Pacificincludebeverageswithaddedbenefits,suchasvitamindrinks,immunesystemboostersandnutritionaldrinks.OneexampleisProlac,adrinklaunchedin2020byDutchMillThailand,whichismadefrommilkandsoyandboastsahighproteinandcalciumcontentalongwith13vitaminsandminerals.
NestléVietnamlaunchedanumberofproductsincombismilepacks.Theseincludedadrinkingyoghurtwithfibre,inulinandproteinundertheActi-VbrandandanexpansionoftheMilomaltedmilkrangetocatertoteenagersandyoungadultslookingfornutritiouson-the-godrinks.
Core revenue
€660m2019:€667m
Growth at constant currency
+1.2%
Annual Report 2020
Business review Regional review 46

SIGandNestléVietnamlaunchcombismileinVietnamtotargetthegrowing demand for convenient andnutritionalon-the-godrinks– Readmorehere!
“combismileisthebestchoiceforwinningovertheheartsofourteenageaudience.Notonlyisthepackaginghighlysuitableforvalue-addedproducts,butwithitsroundcornersitcanbeeasilypickedupandcarriedabout.AddinthecombiGoclosureforeasyopeningandclosing,andyouhaveaproductthatwill,withoutadoubt,standoutonsupermarketshelves.”–Mr Ali Abbas,DairyBusinessDirectoratNestléVietnam.
ProjectsareunderwaytoplacecombismilelinesinIndiaandKorea.AlsoinKorea,Daesanghaslaunched nutritional drinks in microwaveable Heat&Go packs, which have no aluminium layer butofferasimilarbarrierfunctionandshelflifetostandardpacks.
Tofusan,themarketleaderinThailandforpasteurisedsoymilk,teamedupwithSIGtolaunchThailand’sfirstorganicUHTsoymilkinasepticcartonpacks.TofusanchoseSIGbecausethepackaging solution perfectly matched its ‘less is more’ natural premium product. We alsorecentlywonanewtendertoplacemorefillingmachineswiththestate-ownedDairyFarmingPromotionOrganizationofThailand(DPO),furtherexpandingourstrongpartnership.
Most of our APAC business consists of single-serve packswhich are suitable for on-the-goconsumption.Wearenowdiversifyingintolargerformatsandhavewoncontractstosupplylitre-packfillinglinestoYHSinMalaysiaandDiamondinIndonesia.
Building for the future
In2020,theconstructionofoursecondfactoryinSuzhou,China,continuedaccordingtoplan,withthenewplantreadytoopenbytheendoftheyear.Theplantisdesignedtoachieveworld-class environmental, safety and operational performance. It will be part of our Asia-Pacificproductionnetworkandwillenableustomeettheexpectedgrowthindemandintheregion.
“combismile is the best choice for winning over the hearts of our teenage audience.”Ali AbbasDairyBusinessDirectorofNestléVietnam
Annual Report 2020
Business review Regional review 47

Americas
2020 overview
OurbusinessintheAmericasshowedremarkableresilienceinthefaceofCOVID-19,benefitingfrombothfavourableconsumptiontrendsandcustomerwins.GrowthwasdriveninparticularbystrongdemandinBrazilandMexico.IntheUSA,anegativeimpactfromthespreadofthevirus–asfoodservicesaleswereaffectedbyclosuresduetolockdownsofoutletssuchasquick-servicerestaurantsandschools–wasoffsetbyincreasedat-homeconsumptionoffoodproducts.
InBrazil,anincreaseinat-homeconsumptionofmilk,culinaryproductsanddairycreamwasfurtherstimulatedbyhigherwelfarepaymentsduringtheheightofthecrisis.Overall,themarketbecamemore polarised,with consumers focusing either on basic affordable products or onindulgencepurchases.SIGwasabletohelpitscustomersmeetthesetrends,byprovidingboth“pocketmoney”andbasicformatsandbyofferingpremiumproductpacksinmultiplesizes.
Aftera strongperformance in2019,Mexicosaw furthergrowth inwhitemilk consumptioninmediumandlargesizes.Demandcontinuedtoincreaseforrecombinedmilk,whichisanaffordableready-to-drinkdairyformula.Salesofevaporatedmilk,tomatoproductsandsaucesalsoincreasedaspeoplepreparedmoremealsathome.
Performance highlights
InadditiontothepositiveconsumptiontrendsinBrazilandMexico,ourperformanceinBrazilreflectedthesuccessoffillerplacementsmadeduringtheyearwithtwolargeBraziliandairycompanies,ShefaandLíderAlimentos.> For customers and consumers
WealsocontinuedtoexpandourpartnershipwithNestléinBrazil.ThankstotheflexibilityofSIG’ssystem,Nestléhaslaunchedfourdifferentpacksizesforsweetcondensedmilktocatertodifferentconsumerneeds.NestléhasalsoadoptedSIG’srenewableandrecyclablepaperstrawsolutionforitsNESCAUbeveragerangeandSIGisthesoleproviderofsmall-sizepackagingforNESCAU,whichisthesecondlargestbrandofflavouredmilkinBrazil.
InnovationdidnotstandstillintheUSA.Theindustry-leadingcoffeecreamercompanynutpodsintroducedazero-sugaroatcreamer,expandingitsofferingsbeyonditsclassicalmond/coconutline.Bothlinesareavailableincombidome,whichcombinesthebestfeaturesofacartonpackwiththebestfeaturesofabottleanddemonstratescleardifferentiationontheshelf.Thestrongenvironmental footprint of the pack also perfectly aligns with the environmental positioning of nutpods,whichwillcontinuetoexpanditscombidomeproductofferingsin2021andbeyond.
WearecontinuingtoexpandourfootprintinLatinAmericanmarketsoutsideBrazil.WesignedanagreementwithCOLUN,thelargestdairycompanyinChile,replacingthreecompetitorfillingmachineswithoneSIGfillingmachine.Thisagaindemonstratestheadvantagesofoursysteminofferingflexibilityandoperationalexcellencetoourcustomers.
Core revenue
€321m2019:€330m
Growth at constant currency
+14.7%
Annual Report 2020
Business review Regional review 48

KEY PERFORMANCE HIGHLIGHTS
1 Atconstantcurrency.
10
11
12
13
14
15
16
17
18
19
20
21
22
December2019
December2020
March2020
June2020
September2020
SIG Combibloc Swiss Performance Index Switzerland SMI Mid
Core revenue
€1.80bn2019:€1.77bn
Core revenue growth1
5.5%2019:5.2%
Adjusted EBITDA
€498m2019:€485m
Adjusted net income
€232m2019:€217m
ROCE
29.5%2019:22.8%
Adjusted EBITDA margin
27.4%2019:27.2%
Adjusted EPS diluted
€0.73€0.21EPSdiluted
Free cash flow
€233m€0.73pershare
Leverage
2.7x2019:2.8x
2020
2019
2020
2019
2020
2019
2020
2019
2020
2019
2020
2019
Share information
fortheyearended31December2020
Market capitalisation CHF6.57bn
Number of issued shares 320,053,240
Share price on 31 December
CHF20.5
Total shareholder return in2020
35.3%
Share price closing high CHF20.9
Share price closing low CHF11.8
Average daily volume 1,762,543
Annual Report 2020
Business review Key performance highlights 49

FINANCIAL REVIEWStrong revenue and free cash flow performance in unprecedented times.
Financial performance
Revenue
In2020,geographicaldiversitysupportedour2020performance.Corerevenueincreasedby5.5%onaconstantcurrencybasis(1.7%asreported),reaching€1,796.4million(totalrevenue€1,816.1million).Growthin2020wassupportedbyourbroadgeographicreachandourroleinthesupplychainforessentialfoodandbeverages.
EMEA,AmericasandtheacquisitionofVisyCartonsinlate2019werethekeycontributorstogrowthintheyear.TheacquisitionofVisyCartonscontributed260basispointstotheconstantcurrencycorerevenuegrowthin2020.
INCREASED GEOGRAPHIC CORE REVENUE DIVERSITY
32%
68%
55%
45%
Outside EMEA EMEA
2010 2020
“The year was proof of the robustness of our business model and the resilience of our end markets. We continued to invest in the business and are well-positioned to continue delivering shareholder value.”Frank Herzog, Chief Financial Officer
Annual Report 2020
Business review Financial review 50

CORE REVENUE 2020 by segment
SLEEVE & CLOSURE REVENUE 2020 by end market
EMEA,with5.6%growth,benefitedfroman increase inat-homeconsumption,asCOVID-19restrictionscontinuedatvaryinglevelsinmostEuropeancountriesduringtheyear.ThegrowthinEMEAisunderpinnedbytheramp-upofnewfillinglinesatourcustomers’sites,whicharecontributingpositivelytorevenue.
GrowthintheAmericas,14.7%atconstantcurrency,wasprimarilydrivenbytheramp-upoflargeprojectsinBrazil,whereweplacedninefillinglineswithtwolargedairycompanies.Theramp-upofthesefillinglinesexceededourexpectations.RevenueinMexicoalsoincreased,withhigherat-homeconsumptionofliquiddairyasaresultoftheCOVID-19pandemiccontributingtothegrowth.Thesepositiveimpactswereoffsetbythe32%depreciationoftheBrazilianRealagainsttheEuroin2020.
InAPAC,theacquisitionofVisyCartonsinNovember2019contributed€44.3milliontothesegmentconstantcurrencygrowthof1.2%,thispartlyoffsetheadwindsfromCOVID-19.RevenueinChinastagnatedinthefirsthalfoftheyear,withloweron-the-goconsumptionduringlockdowns.SouthEast Asian countries continued to face some form of restrictions throughout the second half of 2020,whichalsoaffectedon-the-goconsumption.Theimpactwasamplifiedbytravelandtourismrestrictionsandbyrelativelyhighstocklevelsaswellasweakerlocalcurrencies.WhileAPACwasnegativelyimpactedbythepandemicin2020,themid-andlong-termfundamentalsremainintact.
SIG REVENUE SPLIT1
1 Revenuesplitbasedonrevenuegeneratedthroughsaleoffillersystemcomponentsandsleeves&closuresfor2020.
Seasonality
TheGroup’sbusinessexperiencesmoderateseasonalfluctuations,primarilyduetoseasonalconsumption patterns and performance incentive programmes relating to sleeves that generallyend in the fourthquarter.Customers tendtopurchaseadditionalsleevesprior totheendoftheyear,typicallyresultinginhighersalesduringthefourthquarter.Historically,this
€798m2019: €755m
€660m2019: €667m
€321m2019: €330m
EMEA APAC Americas
69%2019: 70%
9%2019: 8%
LD NCSD Food
22%2019: 22%
Fillers
7%Service
7%Sleeves
86%
Annual Report 2020
Business review Financial review 51

hasresultedinrelativelylowsalesinthefirstquarter,withinventoryreturningtonormallevelsand the settlement of performance incentives that have been accrued over the course of the year.Thesefactorscontributetoanincreaseinworkingcapitallevelsandlowercashflowsfromoperatingactivitiesinthefirstquarter.Whilethiseffectwasvisibleinthefirstquarterof2020,salesandstockbuildinginthefourthquarterof2020werelesspronouncedthaninprioryears.
ADJUSTED EBITDA 2020 by segment
NET CAPEX 2020 by segment
FILLERS 2020 infield(units)
EBITDA
ADJUSTED EBITDA MARGIN1
As of 31 Dec. 2020 As of 31 Dec. 2019
EMEA 34.4% 32.1%
APAC 31.6% 33.5%
Americas 22.7% 25.5%
SIG Group 27.4% 27.2%
1 AdjustedEBITDAdividedbyrevenuefromtransactionswithexternalcustomers.
AdjustedEBITDAincreasedfrom€485.4millionin2019to€498.3millionin2020.Thisincreasewasprimarilydrivenbyatop-linecontributionof€34.8millionreflectingthefactorsdescribedabove.
Rawmaterialcostshada€20.9millionpositiveimpactonadjustedEBITDAin2020.Ascommoditypricesweakenedinthefirsthalfoftheyear,webenefitedfromlowerspotandhedgedpricesforboth polymers and aluminium, and we were also able to negotiate lower prices with selected suppliers.
While we saw a significant contribution from revenue growth and raw material sourcing,adjustedEBITDAwasnegativelyimpactedbyanamountof€41.6millionasaresultofforeigncurrencyfluctuationsin2020.ThisnegativeimpactwaslargelyduetothedepreciationoftheBrazilianReal,andtoalesserextenttheThaiBath,againsttheEuro.
Increasedcartondemand inEuropeand the continuedexecutionofoperationalexcellenceprogrammesinourproductionfacilitiescontributedtoproductionefficiencygainsof€5.1 millionyearonyear.
€274m2019: €242m
€215m2019: €229m
€73m2019: €84m
EMEA APAC Americas
€24m2019: €30m
€82m2019: €49m
€46m2019: €38m
EMEA APAC Americas
6872019: 678
4192019: 404
1602019: 151
EMEA APAC Americas
1,266
Annual Report 2020
Business review Financial review 52

SG&Amarginallyincreasedby€4.0millioncomparedto2019.COVID-19-relatedrestrictionsandsaving initiativesresulted in lowerexpenses inareassuchastravel,whichmorethanoffsetinvestmentsingrowthandhigheremployeecosts.R&Dinvestmentsasaproportionofrevenueweresteadyatapproximately3%.
OurjointventuresintheMiddleEastcontinuedtogeneratestrongcashflows,andthedividendin2020,at€23million,wasslightlyabovetheprioryear.
TheadjustedEBITDAmargin inEMEAwaspositively impactedby revenuecontributionandproductionefficiencies,asthe increase inat-homeconsumption inEurope increasedcartondemand. In addition, EMEA benefitted from lower rawmaterial costs as described above.Positiverevenuecontribution intheAmericasandAPACweremorethanoffsetbycurrencyheadwinds.
Foreign currencies
WhilstourreportingcurrencyistheEuro,wegenerateasignificantportionofourrevenueandcostsincurrenciesotherthanEuro.IncreasesordecreasesinthevalueoftheEuroagainstothercurrenciesincountrieswhereweoperatecanaffectourresultsofoperationsandthevalueofbalancesheetitemsdenominatedinforeigncurrencies.Ourstrategyistoreducethisexposurethroughthenaturalhedgingthatarisesfromthelocalisationofouroperations.Inaddition,wesystematicallyhedgeallkeycurrenciesagainsttheEurousingatwelve-monthrollinglayeredapproach.
In2020,ourresultswerenegativelyimpactedbyforeigncurrencyfluctuations.Thecontinuingdepreciation of the Brazilian Real after a particularly large drop in March was the main contributortothisimpact.
Capex
Net capex as a percentage of total revenue increased from6.2% in 2019 to 8.0% in 2020.Investments in property, plant and equipment increased, primarily relating to productionequipmentforthenewsleevesmanufacturingfacilityinChina.HighernetfillercapexreflectsalowerproportionofupfrontcashduetofillerplacementsintheAmericas,whereourfillinglinecontractsareusuallyoperatingleasecontractswithnoupfrontcash.
Weplaced59fillingmachinesinthefieldin2020.Takingaccountofwithdrawals,thenumberoffillingmachinesgloballyreached1,266,anetincreaseof33.
GROUP NET CAPEX 2020
-54Upfront cash
Gross filler
PP&E
122
77
Annual Report 2020
Business review Financial review 53
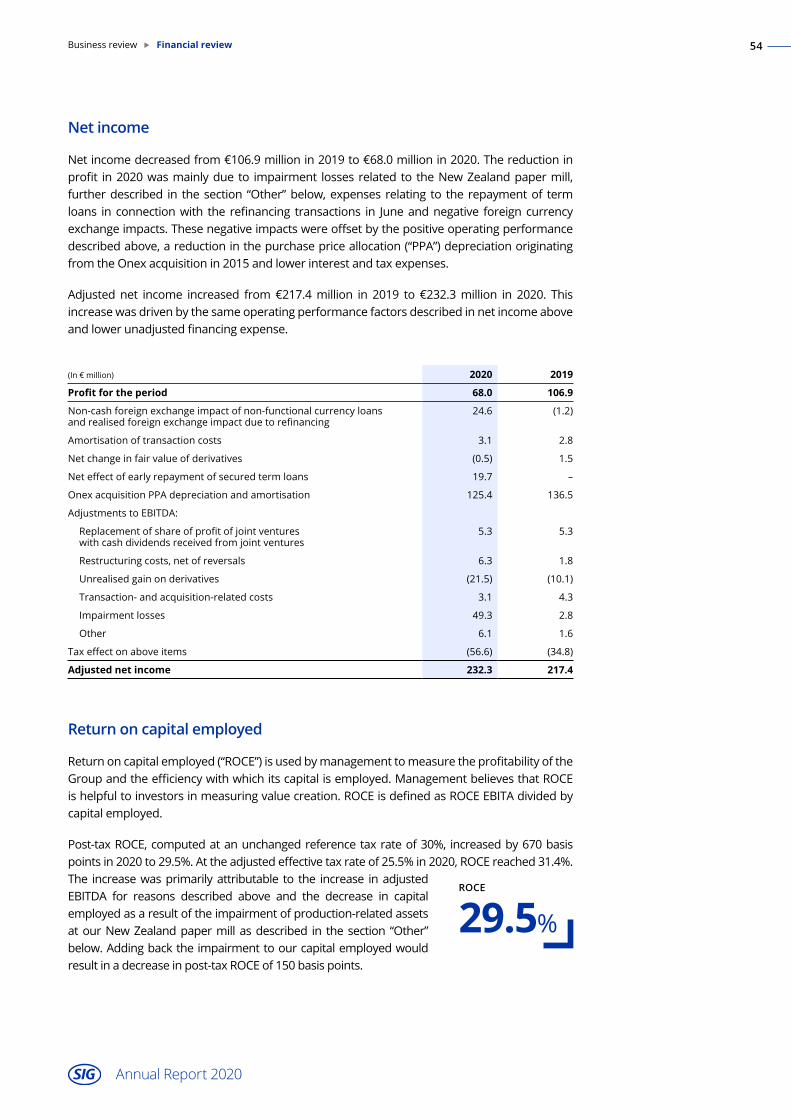
Net income
Netincomedecreasedfrom€106.9millionin2019to€68.0millionin2020.Thereductioninprofit in2020wasmainlydue to impairment lossesrelated to theNewZealandpapermill,furtherdescribed in thesection “Other”below,expenses relating to therepaymentof termloans in connectionwith the refinancing transactions in Juneandnegative foreigncurrencyexchangeimpacts.Thesenegativeimpactswereoffsetbythepositiveoperatingperformancedescribedabove,areductioninthepurchasepriceallocation(“PPA”)depreciationoriginatingfromtheOnexacquisitionin2015andlowerinterestandtaxexpenses.
Adjustednet income increased from€217.4million in 2019 to €232.3million in 2020. Thisincrease was driven by the same operating performance factors described in net income above andlowerunadjustedfinancingexpense.
(In€ million) 2020 2019
Profit for the period 68.0 106.9
Non-cashforeignexchangeimpactofnon-functionalcurrencyloansand realisedforeignexchangeimpactduetorefinancing
24.6 (1.2)
Amortisation of transaction costs 3.1 2.8
Net change in fair value of derivatives (0.5) 1.5
Neteffectofearlyrepaymentofsecuredtermloans 19.7 –
Onex acquisition PPA depreciation and amortisation 125.4 136.5
AdjustmentstoEBITDA:
Replacementofshareofprofitofjointventures with cash dividends received from joint ventures
5.3 5.3
Restructuring costs, net of reversals 6.3 1.8
Unrealised gain on derivatives (21.5) (10.1)
Transaction-andacquisition-relatedcosts 3.1 4.3
Impairmentlosses 49.3 2.8
Other 6.1 1.6
Taxeffectonaboveitems (56.6) (34.8)
Adjusted net income 232.3 217.4
Return on capital employed
Returnoncapitalemployed(“ROCE”)isusedbymanagementtomeasuretheprofitabilityoftheGroupandtheefficiencywithwhichitscapitalisemployed.ManagementbelievesthatROCEishelpfultoinvestorsinmeasuringvaluecreation.ROCEisdefinedasROCEEBITAdividedbycapitalemployed.
Post-taxROCE,computedatanunchangedreferencetaxrateof30%, increasedby670basispointsin2020to29.5%.Attheadjustedeffectivetaxrateof25.5%in2020,ROCEreached31.4%.The increase was primarily attributable to the increase in adjusted EBITDA for reasons described above and the decrease in capitalemployedasaresultoftheimpairmentofproduction-relatedassetsatourNewZealandpapermillasdescribed in thesection “Other”below.Addingbacktheimpairmenttoourcapitalemployedwouldresultinadecreaseinpost-taxROCEof150basispoints.
ROCE
29.5%
Annual Report 2020
Business review Financial review 54

Cash flows
Wecontinuedin2020togeneratestrongnetoperatingcashinflowsof€425.8millionandfreecashflowof€233.2 million.
NetcashfromoperatingactivitieswaspositivelyimpactedbyadjustedEBITDAgrowthof2.7%,describedabove,andnetworkingcapitalinflows.Thesepositiveinflowswereoffsetbyrefinancingcosts of €15.4 million and additional tax payments of approximately€20 million.Theadditionalpaymentswereprimarilydrivenbypaymentsof2019taxliabilitiesin2020.
Investingcashflowswerenegativelyimpactedbyadditionalcapexcomparedto2019,asdescribedabove.Financingcashflowsremainedstablecomparedto2019,withapositive impact from lowermandatory loanrepaymentsyearonyearoffsetbyadditionalleasepaymentsandahigher2019dividendthatwaspaidoutin2020.
Net debt
(In€ million)As of
31 Dec. 2020As of
31 Dec. 2019
Gross total debt1 1,697.0 1,614.4
Cash and cash equivalents2 355.1 261.0
Net total debt 1,341.9 1,353.4
Total net leverage ratio3 2.7x 2.8x
1 Currentandnon-currentloansandborrowings(includingleaseliabilities,andwithnotesandcreditfacilitiesatprincipalamounts).
2 Includesrestrictedcash.
3 NettotaldebtdividedbyadjustedEBITDA.
Netleveragein2020waspositivelyimpactedbystrongcashflowgenerationwith€355.1millioncashandcashequivalentsatyearendandanincreasedadjustedEBITDAyearonyear.Offsettingthe positive cash impacts were additional capitalisation of lease liabilities of approximately€110millionin2020,primarilyrelatedtoournewsleevesmanufacturingfacilityinChinaandproductionequipmentforclosures.
Debt refinancing
InJune,theGrouprefinanceditsdebt.Wereplacedtwoexistingsecuredtermloans,maturingin2023and2025,withanewunsecuredtermloanof€550millionandtwoissuesofseniorunsecured notes in the aggregate amount of €1,000 million. We also entered into a new€300 millionrevolvingcreditfacility.ThenotesaretradedontheGlobalExchangeMarketofEuronextDublin.
Principal amount Maturity date Interest rate
2023notes €450million June2023 1.875%
2025notes €550million June2025 2.125%
Term loan €550million June2025 Euribor+1.00%1,withaEuriborfloorof0.00%
Revolving credit facility €300million June2025 Euribor+1.00%1,withaEuriborfloorof0.00%
1 Subjecttoincreaseanddecreasedependingonnetleverageratioandreachingcertainsustainabilitytargets.
Cash conversion
71%
Leverage
2.7x
Annual Report 2020
Business review Financial review 55

Therefinancinghasenabledustomovefromasecuredtoanunsecureddebtstructureoninvestmentgradetermsandtodiversifyoursourcesofdebt.Withboththetermloanandthelargerofthetwonoteissuesmaturingin2025,wehaveextendedouroverallmaturityprofileatfavourableterms.Thenewinterestratesbringdownouraveragecostofdebtto1.6%,assumingafullydrawn-downrevolvingcreditfacilityandexcludingthetransactioncosts.
Debt rating
Company rating As of
Moody's Ba2 Stable June2020
S&P BBB- Stable March2020
Other
Acquisition
We announced in November our plan to acquire from Obeikan Investment Group (“OIG”)theremaining50%ofthesharesinourtwojointventurecompaniesintheMiddleEast.TheacquisitionwillgiveSIGfullcontroloverabusinesswithstronggrowthprospectsinagrowingmarketandexpanditsglobalpresence.Weexpecttheacquisitiontocompletebeforetheendofthefirstquarterof2021.
Theconsiderationforthesharesofthejointventureswillbemadeupof€167millionincashand17.5millionnewlyissuedSIGordinaryshares(tobeissuedoutofauthorisedsharecapital).Afterthetransaction,OIGwillholdapproximately5%oftheissuedSIGshares.Theacquisition,including the cash consideration, is expected to only marginally impact our Group leverage as ourjointventuresheld,asof31December2020,approximately€70millionofnetdebt.
Subject to the completion of the acquisition, Abdallah Obeikan, Chief Executive Officer ofOIG and currently Chief ExecutiveOfficer of the two joint ventures in theMiddle East,willbe nominated for election to SIG’s Board of Directors at the next Annual GeneralMeetinginApril 2020.AbdelghanyEladib,currentlyChiefOperatingOfficerof the jointventures,willbecome amember of SIG’s Group Executive Board and take on the role as President andGeneralManagerofMiddleEastandAfricaoncompletionoftheacquisition.
In2020, the two jointventurecompaniesgeneratedrevenueofapproximately€266million(excludingrevenuefrominter-companytransactionsbetweenthetwojointventurecompanies)andadjustedEBITDAofapproximately€78million.Post-acquisition,ourpreviouslyexternalsales to the jointventurecompanieswillbecome inter-companysales,andthedividendwereceived from the joint venture companies will be replaced by fully consolidating the joint ventures’adjustedEBITDA.SIGwillsplititscurrentsegmentEMEA(“Europe,MiddleEastandAfrica”)intotwosegments:EuropeandMEA(“MiddleEastandAfrica”).
Cost of debt
1.6%
Annual Report 2020
Business review Financial review 56

New Zealand paper mill
Wehavebeenassessingthecontinuedviabilityanddifferentstrategicalternativesforourpapermill inNewZealand(Whakatane).Themillprimarilyproduces liquidpaperboardforusebySIG entitiesandourjointventuresintheMiddleEast.Asaconsequenceoftheassessments,werecordedimpairmentlossesof€38.0million(€33millionnetoftaxes)onproduction-relatedassets. The impairment losseswere excluded fromour calculationof adjusted EBITDAandadjustednetincome.
Subsequentto31December2020,theBoardofDirectorsmadethedecisiontoclosethepapermillandtheCompanywillenterintotherequiredconsultationprocesswithemployees.ThemillwouldneedsignificantinvestmenttomaintainitsviabilityandtheGroupwillbenefitfromexpandedsourcingopportunitieswithitsexistingthird-partysuppliersofliquidpaperboard.As a result of the closure decision, management expects to recognise plant decommissioning costsandredundancycostsofaround€30millioninthefirsthalfof2021.Asassetsofthemillaremonetisedovertime,thefreecashflowimpactofthesecostsisexpectedtobereducedtoapproximately€15million,ofwhich€10millionwouldbethecashflowimpactin2021.Thebenefitsoftheclosureareexpectedtoresultinapay-backperiodonthecashoutflowsinlinewiththeGroup’snormalstandards.
Dividend
To allow our shareholders to participate in the cash generative nature of our business, we have setadividendpayouttargetof50–60%ofadjustednetincome.
AttheAnnualGeneralMeetingtobeheldon21April2021,theBoardofDirectorswillproposeadividendpaymentfor2020ofCHF0.42pershare,totallingCHF134.4million(equivalentto€124.4millionaspertheexchangerateasof31December2020,andexcludinganyadditionalshares in circulation as a result of the potential acquisition of the joint ventures in the Middle East),payableoutofforeigncapitalcontributionreserves.
Dividend
CHF 0.42TSR1
+35.3%1 Dividendreinvested
Annual Report 2020
Business review Financial review 57

Outlook
SIGwillcontinuetofocusonprofitablegrowthbyexpandingitsbusinesswithexistingandnewcustomersandfurtherdevelopingsustainablesolutions.In2021,theCompanyexpectstofullyconsolidaterevenuesintheMiddleEastandAfricafromthebeginningofMarch,subjecttofinalcompletionofthetransaction.Onalike-for-likebasis,thecombinedbusinessisexpectedtoachievecorerevenuegrowthatconstantcurrencyinthelowerhalfofthe4–6%range,takingaccount of the continuing restrictions in South East Asia affecting on-the-go consumptionand thegeneraluncertaintyabout thecontinuingglobaleffectsof theCOVID-19crisis.Thisrepresentsanaccelerationoftheorganicgrowthratecomparedwith2020excludingtheeffectofconsolidatingVisyCartons.
Assumingnomajordeteriorationinexchangerates,theadjustedEBITDAmargin,includingtheconsolidationoftheMiddleEastandAfricabusiness,isexpectedtobeinthe27–28%range.Net capitalexpenditureisforecasttobewithinthetargeted8–10%ofrevenuerangein2020.
TheCompanymaintainsitsmedium-termguidanceofcorerevenuegrowthof4–6%atconstantcurrencyandanadjustedEBITDAmarginofaround29%.Netcapitalexpenditureshouldremainwithin8–10%ofrevenue.TheCompanyplanstomaintainadividendpayoutratioof50–60%ofadjustednetincomewhilereducingnetleveragetowards2x.
Alternative performance measures
For alternative performance measures and their related reconciliations that are not included in this document, pleaserefertothefollowinglink:https://reports.sig.biz/annual-report-2020/services/chart-generator
Annual Report 2020
Business review Financial review 58

RISK MANAGEMENTInadditiontocommonbusiness-relatedriskfactors,wepaycloseattentiontoothersignificantrisks we may be exposed to, such as sustainability, political, reputational, regulatory and compliancerisks.Wehavedevelopedinstrumentsandknow-howthathelptheGroupidentifyandassesssuchrisks.
We have implemented a risk management process led by the Group General Counsel and approved by the Board of Directors, which sets out a structured process to systematically managerisks. In thisprocess,variousrisksare identified,analysedandevaluated,andrisk-controlmeasurementsaredetermined.Theobjectivesoftheriskmanagementprocessaretocontinuously ensure and improve compliance with laws and regulations as well as corporate governance guidelines and best practices. The risk management process is also designedto protect the Group from loss of confidence and/or public reputational damage resultingfrom,forexample,inadequateorfailedinternalprocessesorsystems.Furthermore,theriskmanagementprocess facilitates thedisclosureofpotential risks tokey stakeholders.At thesame time, the process makes all key executives aware of the magnitude of risks and provides themwithinformationforeffectivedecision-making.Aspartofthisprocess,riskmanagementworkshopswithregionalandfunctional leadership teamswereheld in2020to identifyandevaluaterisks.MitigatingactionswerealsodiscussedduringtheseriskmanagementworkshopsandsubsequentlysignedoffbytheBoardofDirectors.Inaddition,aseparateriskworkshopwasheldwiththeGroupExecutiveBoardin2020todiscussandvalidatetheoverallriskportfolio.
Themonitoringandcontrolofrisksaresupportedbyourinternalcontrolsystemforfinancialreporting,whichdefinesmeasuresthatreducepotentialrisks.Managementisresponsibleforimplementing, tracking and reporting risk mitigation measures, including periodic reporting to the Audit and Risk Committee and the Board of Directors. Eachmaterial risk identifiedhas a risk owner atmanagement level who is responsible for the implementation of risk-managementmeasuresinhisorherareaofresponsibility.Furthermore,eachmaterialriskhasa mitigation action owner, mostly in global functions with regional counterparts to ensure local implementation.
The Audit and Risk Committee regularly discusses risks that could materially impact our business andfinancial position, aswell as thedevelopmentof internal controls tomitigatesuchrisks.Inaddition,themembersoftheAuditandRiskCommitteeperiodicallyreviewtheinternal policies and procedures designed to secure compliance with laws, regulations and internalrulesregardinginsiderinformation,confidentiality,briberyandcorruption,sanctionsandadherencetoethicalstandards,andassesstheeffectivenessthereof.TheAuditandRiskCommittee discusses with the CFO and the Group General Counsel any legal matters that may haveamaterialimpactontheGroup’sbusinessorfinancialpositionandanymaterialreportsorinquiriesbyregulatoryorgovernmentalagenciesthatcouldmateriallyimpacttheGroup’sbusinessorfinancialposition.TheAuditandRiskCommittee,withthesupportofmanagement,informs the Board of Directors at least annually about any major changes in risk assessment, riskmanagementandanymitigationactions taken. In2020, the riskportfoliosignedoffbymanagement was discussed with the Audit and Risk Committee as well as with the entire Board ofDirectorsintheirDecembermeetings.
We carry out an annual risk assessment in conformity with the Swiss Code of Best Practice forCorporateGovernance.TheGroup’s riskmanagementsystemscoverbothfinancialandoperationalrisks.
Annual Report 2020
Business review Risk management 59
GOVERNANCE61 Board of Directors
65 Group Executive Board
68 Corporate Governance Report1. Groupstructure
and shareholders2. Capitalstructure3. BoardofDirectors4. Committees5. Frequencyofmeetings
of the Board of Directors and its Committees
6. Areasofresponsibility7. Informationandcontrol
instrumentsvis-à-visthe Group Executive Board
8. GroupExecutiveBoard9. Compensation,shareholdings
and loans10. Shareholders’rights
of participation11. Changeofcontrol
and defence measures12. Auditors13. Informationpolicy
Annual Report 2020
60

BOARD OF DIRECTORS
Andreas UmbachChairman of the Board
Andreas Umbach is a Swiss and German citizen and has served astheChairmanoftheBoardofDirectorssincetheInitialPublicOfferingin2018.Mr UmbachhasfurtherservedaschairmanoftheboardofdirectorsofLandis+GyrGroup AG(SIX:LAND)sinceJuly2017,aschairmanofthesupervisoryboardofTechemEnergyServicesGmbHsinceAugust2018andaschairmanoftheboardofdirectorsofRovensaSAsinceSeptember2020.HehasbeenthepresidentoftheZugChamberofCommerceandIndustrysince2016.Mr UmbachpreviouslyservedasamemberoftheboardofdirectorsofAscomHolding AG(SIX:ASCN)(2010–2020),from2017–2019asitschairman.HealsoservedasamemberoftheboardofdirectorsofWWZ AG(2013–2020)andasamemberoftheboardofdirectorsofLichtBlickSE(2012–2016).From2002to2017,Mr UmbachwasthepresidentandCEO/COOofLandis+Gyr AG.PriortoservingasCEO,Mr UmbachservedaspresidentoftheSiemens Metering Division within the Power Transmission and DistributionGroupandheldotherpositionswithinSiemens.Mr UmbachholdsanMBAfromtheUniversityofTexasatAustinand an MSc in mechanical engineering (Diplomingenieur) from the TechnicalUniversityofBerlin.
Matthias WährenAudit & Risk Committee Chair
Matthias Währen is a Swiss citizen and has served as a member of the BoardofDirectorssincetheIPO.Mr WährenhasfurtherservedasamemberoftheboardofdirectorsofKetoSwiss AGsinceJuly2020,ofBloomBiorenewablesSAsinceSeptember2020andasamemberoftheboardofdirectorsofph. AGsinceDecember 2020,aswellasbeingamemberoftheboardoftrusteesoftheGivaudanFoundation(since2013)andtheHBMFondation(since2018).Mr Währenwaspreviouslyamemberoftheregulatoryboardof SIXSwissExchangefrom2006to2017,amemberoftheboardofscienceindustriesfrom2009to2017,amemberoftheboardofSwissHoldingsfrom2015to2017andamemberoftheboardofdirectorsof variousGivaudansubsidiariesfrom2005to2019.Mostrecently,heservedasCFOandamemberoftheexecutivecommitteeofGivaudanSAfrom2005untilhisretirementin2017.Priortothat,heservedastheglobalheadoffinanceandinformaticsoftheRochevitamindivisionandheldavarietyofotherpositionsatRoche,includingvicepresidentfinanceandinformaticsatRocheUSA,Nutley,NewJersey,headoffinanceandinformationtechnologyatNipponRoche,TokyoandfinancedirectorofRocheKorea.Mr WährenstartedhiscareerincorporateauditingatRochein1983.Mr Währenholdsa master’sdegreeineconomicsfromtheUniversityofBasel,Switzerland.
Annual Report 2020
Governance Board of Directors 61

Werner BauerAudit & Risk Committee Member, Nomination & Govern. Com. Member
Werner Bauer is a Swiss and German citizen and has served as a member of theBoardofDirectorssincetheIPO.From2015untiltheIPO,heservedasanadvisoryboardmemberfortheCompany.Mr BauerisalsocurrentlyvicechairmanoftheboardofdirectorsofGivaudanSA(SIX:GIVN)(since2014)andBertelsmannSE&Co.KGaA(since2012),chairmanoftheboardoftrusteesattheBertelsmannFoundation(since2011),andamemberoftheboardofdirectorsofLonzaGroupAG(SIX:LONN)(since 2013).From2011until2018healsoservedasamemberoftheboardofdirectorsofGEAGroup AG.Priortothatheheldanumber of other board positions, including chairman of the board of directors ofNestléDeutschland AG(from2005to2017)andchairmanoftheboardofdirectorsofGaldermaPharma SA(from2011to2014).Mostrecently,Mr Bauerwas the executive vice president and head of innovation, technology, research &developmentforNestléSAfrom2007to2013,andpriortothatheservedasexecutive vice president and head of technical, production, environment, research &developmentforNestléSAandheldotherpositionswithinNestlé.Furthermore,Mr BauerservedaschairmanoftheboardofdirectorsofSofinolS.A.(from2006to2012),andasamemberoftheboardofdirectorsofL’Oréal(from2005to2012)andofAlconInc.(from2002to2010).Mr Bauerstartedhiscareerin1980asaprofessorof chemical engineering at Hamburg University of Technology, after which he was aprofessorinfoodbioprocessinganddirectoroftheFraunhoferInstituteforFoodTechnology&PackagingattheTechnicalUniversityofMunich.Mr BauerholdsadegreeandPhDinchemicalengineeringfromtheUniversityofErlangen-Nürnberg.
Colleen GogginsComp. Committee Chair
Colleen Goggins is an American citizen and has served as a member of the BoardofDirectorssincetheIPO.From2015untiltheIPO,sheservedasanadvisoryboardmemberfortheCompany.Ms GogginsisalsocurrentlyamemberoftheboardofdirectorsofTDBankGroup(TSE:TD)(since2012),where she serves on the risk committee, a member of the supervisory board ofBayerAG(ETR:BAYN)(since2017),wheresheservesonthenominatingand ad hoc legal committee, and a member of the board of directors of IQVIA(NYSE:IQV)(since2017),whereshesitsontheauditandnominatingandgovernancecommittees.Ms GogginsisalsoamemberoftheadvisoryboardsofZO SkinHeathandSabertInc.(since2020).Shehasbeenamemberof the University of Wisconsin Foundation and a member of the board of theUniversity’scentreforbrandandproductmanagement,amemberoftheboardofdirectorsofNewYorkCitymealsonWheelsandatrusteeoftheInternationalInstituteofEducation.Ms GogginspreviouslyservedasasupervisoryboardmemberforKraussMaffeifrom2013to2016andasamemberoftheboardofdirectorsofValeantPharmaceuticalsInternationalfrom2014to2016,whereshewasamemberofthenominatingcommitteeandspecialadhoccommittee.Prior tothat,Ms GogginsworkedatJohnson&Johnsonuntil2011,wheresheheldvariousleadershippositions,includingworldwide chairwoman of the consumer group, company group chairwoman, and president of the Johnson & Johnson Consumer Products Company, amongothers,andsheservedasamemberoftheexecutivecommittee.Ms GogginsholdsaBachelorofScience(“BSc”)degreeinfoodchemistryfromtheUniversityofWisconsin-Madisonandamaster’sdegreeinmanagementfromtheKelloggGraduateSchoolofManagementatNorthwesternUniversity.
Annual Report 2020
Governance Board of Directors 62

Mariel HochAudit & Risk Committee Member, Comp. Committee Member
Mariel Hoch is a Swiss and German citizen and has served as a memberoftheBoardofDirectorssincetheIPO.Ms HochhasbeenapartnerattheSwisslawfirmBär&Karrersince2012.Sheis currently also a serving board member at Comet Holding AG (SIX:COTN)(since2016),whereshealsochairsthenominationandcompensationcommittee,atKomaxHoldingAG(SIX KOMN)(since2019),whereshealsositsontheauditcommittee,andatMEXAB AG(since2014).Ms HochservedasamemberoftheboardofdirectorsofAdunic AGfrom2015to2018.Shehasbeena member of the foundation board of The Schörling Foundation since2013andamemberofthefoundationboardoftheIrene M. StaehelinFoundationsince2020.Ms Hochhasalsobeen co-chairoftheZurichCommitteeofHumanRightsWatchsince2017.Ms HochwasadmittedtotheZurichbarin2005andholdsalawdegreeandaPhDfromtheUniversityofZurich.
Wah-Hui ChuComp. Committee Member, Nomination & Govern. Com. Member
Wah-HuiChuisaChinesecitizenandhasservedasamemberoftheBoardofDirectorssincetheIPO.From2015untiltheIPO,heservedasanadvisoryboardmemberfortheCompany.Mr Chuis currently also the founder and has been chairman of iBridge TT InternationalLimited(HongKong)since2018,amemberoftheboardofdirectorsofMettlerToledoInternational(NYSE:MTD)since2007andwasthefounderofM&WConsultantsLimited(HongKong)in2007.From2013to2014whenheretired,Mr Chuserved as the CEO and a member of the board of directors of TingyiAsahiBeveragesHolding,andfrom2008to2011heactedasexecutivedirectorandCEOofNextMediaLimited.Healsoserved as a member of the board of directors of Li Ning Company Limitedfrom2007to2012andaschairmanofPepsiCoInvestment(China)Limitedfrom1998to2007,andagainfrom2012to2013.Mr ChuspentmanyyearsasanexecutiveatPepsiCo,servingasnon-executivechairmanofPepsiCoInternational’sAsiaregionin2008andpresidentofPepsiCoInternational–Chinabeveragesbusinessunitbetween1998and2007.BeforejoiningPepsiCo,Mr ChuheldmanagementpositionsatMonsantoCompany,WhirlpoolCorporation,H.J.HeinzCompanyandtheQuakerOatsCompany.Mr ChuholdsaBScinagronomyfromtheUniversityofMinnesotaandanMBAfromRooseveltUniversity.
Annual Report 2020
Governance Board of Directors 63

Nigel WrightNomination & Govern. Com. Chair
Nigel Wright is a Canadian citizen and has been a member of the BoardofDirectorssince2014.Mr WrightisaseniormanagingdirectoratOnexCorporation(TSE:ONEX),wherehemanagesEuropeanoriginationeffortsinthebusinessservices,healthcareandpackagingsectorsforOnex’slarge-capfund,OnexPartners.Furthermore,heisamemberofOnexPartners’investmentcommittee.Hecurrentlyservesasnon-executivechairofAcaciumGroup(since2020),asnon-executivechairofChildcare BV(operatingasKidsFoundation),asanon-executivedirectorofJustitia,andasatrusteeofthePolicyExchange.Mr WrightjoinedOnexin1997,althoughfrom2010to2013heworkedaschiefofstaffforthePrimeMinisterofCanada.PriortojoiningOnex,Mr WrightwasapartneratthelawfirmofDavies,Ward&Beck,andbeforethatheworkedinpolicydevelopmentintheofficeofthePrimeMinisterofCanada.MrWrightholdsanLL.M.fromHarvardLawSchool,anLL.B.(withhonours)fromtheUniversityofTorontoLawSchoolandabachelor’sdegreeinpoliticsandeconomicsfromTrinityCollegeattheUniversityofToronto.
Annual Report 2020
Governance Board of Directors 64

GROUP EXECUTIVE BOARD
Samuel SigristChief Executive Officer1
Samuel Sigrist is a Swiss citizen and has served as CFO and ChairmanoftheMiddleEastJointVenturesince2017.Witheffectfrom1January2021,hebecamethenewCEOoftheSIG Group.Mr SigristjoinedtheCompanyin2005andhasworkedinvariousfinanceandcorporatedevelopmentroles,includingdirectorofgroupcontrolling&reporting,headoffinance/CFOofEuropeandheadofgroupprojects.From2013to2017,Mr SigristwastheCompany’sPresident&GeneralManagerEurope,andpriortojoiningtheCompanyheworkedasaconsultant.Mr Sigristholdsabachelor’sdegreeinbusinessadministrationfromtheZurich University of Applied Sciences, an MBA from the University of Toronto and a Global Executive MBA from the University of St.Gallen.Mr SigristisalsoaSwisscertifiedpublicaccountant.
Frank HerzogChief Financial Officer since 1 January 20212
FrankHerzogjoinedSIGin2021asChiefFinancialOfficer.PriortoSIG,MrHerzog wastheCFOofVFSGlobal,basedinZurichandDubai.He haspreviouslyheldfinanceleadershippositions as CFO of Dematic Group in the USA and Head ofCorporateFinanceattheKIONGroupinGermany.Healso gained extensive experience in investment banking at GoldmanSachs,RothschildandCitigroup.MrHerzogisaGerman citizen and holds a graduate business degree from WHU Koblenz and a Master of Business Administration degreefromtheUniversityofTexas.MrHerzogisbasedatSIG’sheadquartersinNeuhausen,Switzerland.
2 SamuelSigristwastheChiefFinancialOfficer until31December2020.
1 RolfStanglwastheChiefExecutiveOfficeruntil31December2020.
Annual Report 2020
Governance Group Executive Board 65
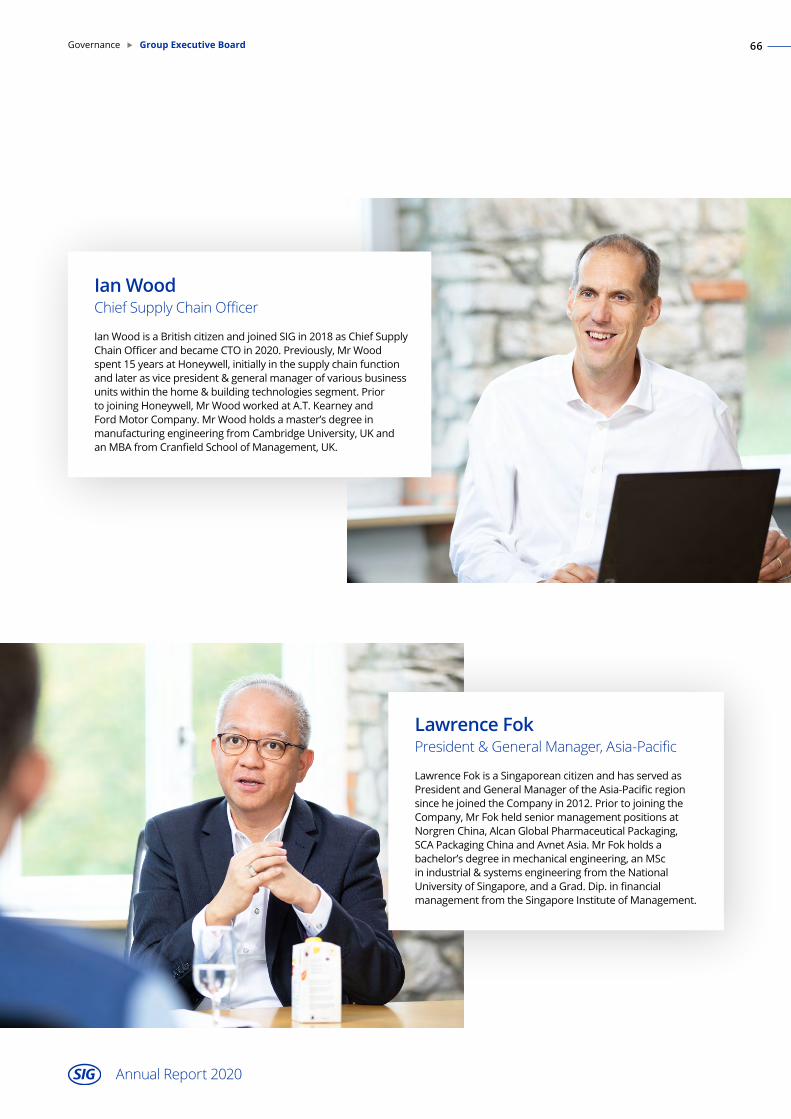
Lawrence FokPresident & General Manager, Asia-Pacific
Lawrence Fok is a Singaporean citizen and has served as PresidentandGeneralManageroftheAsia-PacificregionsincehejoinedtheCompanyin2012.PriortojoiningtheCompany,Mr FokheldseniormanagementpositionsatNorgren China, Alcan Global Pharmaceutical Packaging, SCAPackagingChinaandAvnetAsia.Mr Fokholdsabachelor’sdegreeinmechanicalengineering,anMScinindustrial&systems engineeringfromtheNationalUniversityofSingapore,andaGrad.Dip.infinancialmanagementfromtheSingaporeInstituteofManagement.
Ian WoodChief Supply Chain Officer
IanWoodisaBritishcitizenandjoinedSIGin2018asChiefSupplyChainOfficerandbecameCTOin2020.Previously,Mr Woodspent15yearsatHoneywell,initiallyinthesupplychainfunctionand later as vice president & general manager of various business unitswithinthehome&buildingtechnologiessegment.PriortojoiningHoneywell,Mr WoodworkedatA.T.KearneyandFordMotorCompany.Mr Woodholdsamaster’sdegreeinmanufacturing engineering from Cambridge University, UK and anMBAfromCranfieldSchoolofManagement,UK.
Annual Report 2020
Governance Group Executive Board 66

José MatthijssePresident & General Manager, Europe since 1 February 20213
José Matthijsse has held the position of President &GeneralManager,Europe,sinceshejoinedSIGin2021.Shecamewithconsiderableexperienceinthefood and beverage industry, having held senior and general management positions at FrieslandCampina and Heineken in a number of countries in Europe, AmericasandAfrica.MsMatthijsseisaDutchcitizenandholdsaMasters’degreeinFoodScienceTechnology from Wageningen Agricultural University intheNetherlands.MsMatthijsseisbasedinLinnich,Germany.
Ricardo RodriguezPresident & General Manager, Americas
Ricardo Rodriguez is a Brazilian and Spanish citizen and has served as President and General Manager of the Americas region since2015.Mr RodriguezjoinedtheCompanyin2003andpreviously served as Director & General Manager, South America andTechnicalServiceDirector,SouthAmerica.PriortojoiningtheCompany,Mr RodriguezworkedatTetraPakinanumberofroles, including general manager of the Belo Horizonte branch, keyaccountmanagerandtechnicalservicemanager.HeholdsaBScdegreeinaeronautical/mechanicalengineeringfromtheTechnologicalInstituteofAeronauticsinBrazil,anMBAfromtheGetúlioVargasFoundation,andgraduatedfromaspecialistbusinessmanagementcourseatIMD,Lausanne.
3 MartinHerrenbrückwasthePresident&GeneralManager,Europeuntil31December2020.
Annual Report 2020
Governance Group Executive Board 67

CORPORATE GOVERNANCE REPORTThis corporate governance report contains the information that is stipulated by the directive on information relating to corporate governance issued by the SIX Swiss Exchange AG (“SIX Swiss Exchange”) and follows its structure.
1. Group structure and shareholders
1.1 Group structure
SIGCombiblocGroup AG,NeuhausenamRheinfall (the“Company”) istheparentcompanyoftheSIG Group1, which directly or indirectly holds all other Group companies and interests in joint ventures2.ThesharesoftheCompanyarelistedonSIXSwissExchange(symbol:SIGN,valornumber:43537795, ISIN:CH0435377954).Themarket capitalizationof theCompanyamountedtoCHF 6,573.9millionasof31 December 2020.
Pleaseseenote26oftheconsolidatedfinancialstatementsfortheyearended31 December 2020fora comprehensive listof theGroup’s subsidiariesandof its joint ventureentities. ExceptfortheCompany,theGroupdoesnotincludeanylistedcompanies.TheGrouphaseffectiveoversightandefficientmanagementstructuresatalllevels.TheoperationalGroupstructureasof31 December 2020isasfollows:
TheCompany’sboardofdirectors(the“Board of Directors” or the “Board”),actingcollectively,has the ultimate responsibility for the conduct of business of the Company and for delivering sustainableshareholderandstakeholdervalue.TheBoardsetstheCompany’sstrategicaims,ensuresthatthenecessaryfinancialandhumanresourcesareinplacetomeettheCompany’sobjectives, and supervises and controls themanagementof theCompany. Thereare threepermanentBoardcommittees:anauditandriskcommittee(“Audit and Risk Committee”),acompensationcommittee(“Compensation Committee”),andnominationandgovernancecommittee(“Nomination and Governance Committee”;collectively“Committees”).
Inaccordancewith,andsubjectto,Swisslaw,theCompany’sarticlesofassociation(“Articles of Association”)andtheCompany’sorganisationalregulations(“Organisational Regulations”),theBoardofDirectorshasdelegatedtheexecutivemanagementoftheCompany’sbusiness(Geschäftsleitung) to the Group Executive Board (“Group Executive Board”) which isheadedby thechiefexecutiveofficer (“Chief Executive Officer” or “CEO”)pursuant to theOrganisationalRegulations.3TheGroupExecutiveBoardcomprisessixmembers,specifically
1 Referencesto“SIG Group”,“Group”or“we”aretotheCompanyanditsconsolidatedsubsidiaries.
2 On24November 2020,theCompanyenteredintoanagreementtopurchasetheremainingsharesinitsjointventurecompaniesinSaudiArabia(i.e.AlObeikanSIGCombiblocCompanyLtd.,Riyadh)andintheUAE(SIGCombiblocObeikanFZCO,Dubai),subjectto severalcustomaryclosingconditionsandapprovalsfromregulatoryauthorities.The closingofthetransactioniscontemplatedtooccurbefore the endofQ12021.
3 Foracomprehensivedescriptiononthedelegationpleaserefertoart.19oftheArticlesofAssociationandtheOrganisationalRegulations.
Annual Report 2020
Governance Corporate Governance Report 68

theCEO,the chieffinancialofficer(“Chief Financial Officer” or “CFO”),thechieftechnologyofficer(“Chief Technology Officer” or “CTO”),thepresident&generalmanagerofAmericas(“ President & General Manager Americas”), the president & generalmanager of Europe(“President & General Manager Europe”), and the president & generalmanager of Asia-Pacific(“President & General Manager Asia-Pacific”).4ForfurtherinformationontheGroup’ssegmentspleaserefertonote7oftheconsolidatedfinancialstatementsfortheyearended31 December 2020.TheGroupExecutiveBoardisdirectlysupervisedbytheBoardofDirectorsanditsCommittees.
1.2 Significant shareholders
According to the disclosure notifications reported to the Company during 2020 andpublishedbytheCompanyviatheelectronicpublishingplatformofSIXSwissExchange,thefollowingshareholdershadholdingsof3%ormoreofthevotingrightsoftheCompanyasof31 December 20205:
Significant shareholders % of voting rights1 Number of shares2
Haldor Foundation3 6.00% 19,203,194
NorgesBank(theCentralBankofNorway) 5.94% 18,997,128
Fahad al Obeikan4,5 5.4577% 17,467,632
BlackRock,Inc.(parentcompany) 3.57%/0.01% 11,434,1686 /45,468
UBSFundManagement(Switzerland) AG 3.18% 10,176,211
AmeripriseFinancial,Inc.7 3.042% 9,735,7728
1 AccordingtoSIX:https://www.six-exchange-regulation.com/en/home/publications/significant-shareholders.html/
2 AccordingtoSIX:https://www.six-exchange-regulation.com/en/home/publications/significant-shareholders.html/
3 DirectShareholder:WinderInvestmentPteLtd.
4 DirectShareholder:AlObeikanPrintingandPackagingCompanyCJS.
5 SeealsodescriptionofthetransactionwithObeikanInvestmentGroupbelow.
6 OfwhichthefollowingvotingrightsweredelegatedbyathirdpartyandcanbeexercisedatBlackRock,Inc.’sowndiscretion:627,144 companyshares.
7 Directshareholders:ThreadneedleInvestmentFundsICVC,ThreadneedleManagementLuxembourgSA,ThreadneedleSpecialistInvestmentFundsICVC,ThreadneedleAssetManagementLimited,StateStreetNomineesLimited,NortrustNomineesLimited,SecuritiesServicesNomineesLtd,CitiLondon.
8 OfwhichthefollowingvotingrightsweredelegatedbyathirdpartyandcanbeexercisedatAmeripriseFinancial,Inc.’sown discretion:2,169,944companyshares.
Notifications made in 2020 in accordance with art. 120 et seqq. of the Financial MarketInfrastructureAct(“FMIA”)canbeviewedusingthefollowinglink:https://www.ser-ag.com/en/resources/notifications-market-participants/significant-shareholders.html#/
As regards the value of the percentage of voting rights shown, it should be noted that any changesinthepercentagevotingrightsbetweenthenotifiablethresholdvaluesarenotsubjecttodisclosurerequirements.
On24November 2020,theCompanyenteredintoanagreementtopurchasetheremainingsharesinitsjointventurecompaniesinSaudiArabia(i.e.AlObeikanSIGCombiblocCompany Ltd.,Riyadh)andintheUAE(i.e.SIGCombiblocObeikanFZCO,Dubai)fromObeikanInvestmentGroup(“OIG”), subject to customary closing conditions and approvals from regulatory authorities.
4 SubjecttoandasofclosingofthetransactionwithOIGreferredtoinSection2.1,theCompanywillappointAbdelghanyEladib,currentlyChiefOperatingOfficerofAlObeikanSIGCombiblocCompanyLtd.,totheCompany’sGroupExecutiveBoard asPresident&GeneralManager,MiddleEastandAfrica.
5 ThenumberofsharesshownhereaswellastheholdingpercentagesarebasedonthelastdisclosureofshareholdingscommunicatedbytheshareholdertotheCompanyandtheDisclosureOfficeofSIXSwissExchange.Thenumberofshares heldbytherelevantshareholdermayhavechangedsincethedateofsuchshareholder’snotification.
Annual Report 2020
Governance Corporate Governance Report 69

Aspartofthepurchasepriceconsideration,SIGwilltransfertoOIG 17,467,632newlyissuedsharesof theCompany, tobecreatedoutof theCompany’sauthorizedsharecapital.Afterconsummationoftheclosing,whichisexpectedtooccurbeforetheendofQ1 2021,OIG willholdapproximately5.175%ofthesharesintheCompany.
Asof31 December 2020,theCompanyheld6,274treasuryshares.
1.3 Cross-shareholdings
TheCompanyhasnocross-shareholdingsexceeding5%inanycompanyoutsidetheGroup.
2. Capital structure
2.1 Ordinary share capital
The ordinary share capital of the Company as registered with the commercial register of the CantonofSchaffhausenamountstoCHF 3,200,532.40asof31 December 2020.
It currently consists of 320,053,240 fully paid-up registered shareswith a nominal value ofCHF 0.01pershare.
As part of the transaction to purchase the remaining shares in its joint venture companies in Saudi Arabia(i.e.AlObeikanSIGCombiblocCompanyLtd.,Riyadh)andintheUAE(i.e. SIG CombiblocObeikan FZCO, Dubai) from OIG, the Company intends to increase its share capital byCHF 174,676.32throughissuing17,467,632fullypaid-upregisteredshareswithanominalvalueofCHF 0.01pershare.ItisanticipatedthatthistransactionwillbecompletedbeforetheendofQ12021,subjecttocustomaryclosingconditionsandapprovalsfromregulatoryauthorities.
2.2 Authorized and conditional share capital
TheCompanyhasauthorizedsharecapitalandconditional sharecapitalofCHF 640,106.48eachasof31 December 2020.
TheBoardofDirectorsisauthorizedtoincreasethesharecapitalatanytimeuntil7April2022byamaximumofCHF 640,106.48throughtheissueofupto64,010,648sharesofCHF 0.01nominalvalueeach.SeeSection 2.1ofthisreportregardingtheintentionoftheCompanytoincreaseitssharecapitalbyissuingsharesoutofitsauthorizedsharecapital.
TheconditionalcapitalofCHF 640,106.48 (i.e.64,010,648sharesofCHF 0.01nominalvalueeach)isdividedintothefollowingamounts:
• CHF 160,026.62foremployeebenefitplans• CHF 480,079.86forequity-linkedfinancinginstruments
Capital increases from authorized and conditional share capital are subject to a single combinedlimit,i.e.thetotalnumberofnewsharesthatmaybeissuedfromtheauthorizedandconditionalsharecapitaltogetherinaccordancewithart.4,5and6oftheArticlesofAssociationmaynotexceed64,010,648shares(i.e.CHF 640,106.48,correspondingto20%oftheexistingsharecapital).Withinthelimitoutlinedabove,theproportionofnewsharesassignedtoeachofthecategoriesisstipulatedbytheBoardofDirectors.Anynewlyissuedsharesaresubjecttotherestrictionssetout inart.7oftheArticlesofAssociation.However,theshares issued
Annual Report 2020
Governance Corporate Governance Report 70

from authorized and conditional share capital under the exclusion of subscription and advance subscriptionrights,respectively,islimiteduntil7April2022toasinglecombinedmaximumof32,005,324shares(equallingCHF 320,053.24or10%ofexistingsharecapital).
Reference is made to the Articles of Association for the precise wording of provisions relating to authorizedandconditionalsharecapital,inparticularart.4,5and6oftheArticlesofAssociation.Among other matters, these contain details regarding the beneficiaries of the employeebenefitplanandtheentitlementstowithdraworrestrictshareholders’subscriptionrights.Therelevant provisions can be downloaded as a pdf document at https://www.sig.biz/investors/en/governance/articles-of-association.
2.3 Changes in capital
Until 4September2018, the legal formof theCompanywasa Luxembourg limited liabilitycompany (société à responsabilité limitée).AsaLuxembourgcompany,equitycontributionsweremadeon30June2017.Additionalnewshares,48,366ordinarysharesand44,327 preferenceshares,wereissuedandfullypaid.ThisincreasedsharecapitalbyEUR927andadditionalpaid-incapitalbyEUR639,073.
On4September2018 (prior to the listingof theCompany), anextraordinary shareholders’meeting of the Company approved the conversion of the Company from a Luxembourg limited liability company (société à responsabilité limitée) into a Luxembourg corporation (société anonyme).Thesameshareholders’meetingresolvedtoconvertwitheffectfrom25September 2018(i)thesixclassesofordinaryshares(eachwithanominalvalueofEUR0.01)intooneclassofordinaryshareswithanominalvalueofEUR0.01pershareand(ii)thefiveclassesofpreferenceshares(eachwithanominalvalueofEUR0.01)intooneclassofpreferenceshareswithanominalvalueofEUR0.01pershare.
On 27 September 2018, an extraordinary shareholders’meeting of the Company resolvedtoconvertthe100,091,015preferenceshares into100,091,015ordinaryshares.Further,themeeting unanimously resolved to change the currency of the share capital of the Company fromEURtoCHF.Asaresult,theCompany’ssharecapitalimmediatelypriortothemigrationtoSwitzerlandwasCHF 2,150,532.40andconsistedsolelyofordinaryshareswithanominalvalueofCHF 0.01pershare.
ForthepurposesoftheIPO,theCompanyfurtherincreaseditssharecapitalbyCHF 1,050,000.00from CHF 2,150,532.40 to CHF 3,200,532.40 through the issue of 105,000,000 shares. Theshareholders’resolutionapprovingthesharecapitalincreasewaspassedatanextraordinaryshareholders’meetingon27September2018excludingthesubscriptionrights(Bezugsrechte) of theexistingshareholdersoftheCompany.
SeeSection2.1ofthisreportregardingtheintentionoftheCompanytoincreaseitssharecapitalby issuing shares out of its authorized share capital as part of the transaction to purchase the remainingsharesinitsjointventurecompaniesinSaudiArabia(i.e.AlObeikanSIGCombiblocCompanyLtd.,Riyadh)andintheUAE(SIGCombiblocObeikanFZCO,Dubai).
2.4 Shares, participation certificates and profit-sharing certificates
ThesharesareregisteredshareswithanominalvalueofCHF 0.01eachandarefullypaid-in.Eachsharecarriesonevoteatashareholders’meeting.Thesharesrankpari passu in all respects with each other, including, in respect of entitlements to dividends, to a share in the liquidation proceedsinthecaseofaliquidationoftheCompany,andtopre-emptiverights.
Annual Report 2020
Governance Corporate Governance Report 71

TheCompany issues its shares as uncertificated securities (Wertrechte), within the meaning ofart.973coftheSwissCodeofObligations(“CO”)andinaccordancewithart.973cCO,theCompanymaintainsaregisterofuncertificatedsecurities(Wertrechtebuch).
TheshareswhichareenteredintothemainregisterofSIXSIS AGconsequentlyconstitutebook-entry securities (Bucheffekten)withinthemeaningoftheFederalActonIntermediatedSecurities(“FISA”).
TheCompanyhasneitheroutstandingparticipationcertificatesnorshareswithpreferentialrights.
TheCompanyhasnotissuedanyprofit-sharingcertificates(Genussscheine).
2.5 Limitations on transferability and nominee registrations
Accordingtoart.7oftheArticlesofAssociation,anypersonholdingshareswilluponapplicationbe entered in the share register without limitation as shareholders with voting rights, provided it expresslydeclarestohaveacquiredthesharesinitsownnameandforitsownaccount.
Any person who does not expressly state in its application to the Company that the relevant shares were acquired for its own account may be entered in the share register as a shareholder withvotingrightswithoutfurtherinquiryuptoamaximumof5%oftheissuedsharecapitaloutstandingatthattime.Abovethislimit,sharesheldbynomineesareenteredintheshareregister with voting rights only if the nominee in question makes known the names, addresses andshareholdingsofthepersonsforwhoseaccountitisholding1%ormoreoftheoutstandingshare capital available at the time, and provided that the disclosure requirement stipulated in the FMIAiscompliedwith.Inaddition,theBoardofDirectorshastherighttoconcludeagreementswithnomineesconcerningtheirdisclosurerequirements.Suchagreementsmayfurtherspecifythedisclosureofbeneficialownersandcontainrulesontherepresentationofshareholdersandthevotingrights.Thepercentagelimitmentionedabovealsoappliesifsharesareacquiredbywayofexercisingpre-emptive,subscription,optionorconversionrightsarisingfromsharesoranyothersecuritiesissuedbytheCompanyoranythirdparty.1
The setting and cancelling of the limitation on transferability in the Articles of Association require a resolutionoftheshareholders’meetingoftheCompanypassedbyatleast2/3 oftherepresentedsharevotesandanabsolutemajorityoftheparvalueofrepresentedshares.
2.6 Convertible bonds and warrants/options
As of 31 December 2020, the Company has no outstanding bonds or debt instrumentsconvertibleintooroptionrightsintheCompany’ssecurities.
Asof31December2020,atotalof602,531PerformanceShareUnit(“PSU”)andRestrictedShareUnit (“RSU”) awardswereoutstanding, subject to fulfilmentofpre-definedvestingconditionsin connectionwith SIG’s compensation framework, in particular the SIG Long-Term IncentivePlan.EachawardedPSUandRSUrepresentsthecontingentrighttoreceiveoneSIGshare.TheGroup expects to settle its obligations under these plans and arrangements by using own shares (treasuryshares).Hence,thevestingofthePSUsandRSUsdonotresultinanincreaseoftheexistingsharecapital.PleaserefertotheCompensationReportonpages99to112forfurtherinformation pertaining to any PSUs and RSUs awarded as an element of Board and executive compensation.
1 Foracomprehensivedescriptionofthelimitationstotransferabilityandnomineeregistrationrefertoart.7 oftheArticlesofAssociation.
Annual Report 2020
Governance Corporate Governance Report 72

Furthermore,theGroupintroducedin 2020anequityinvestmentplan(“EIP”)forawidergroupof management in leadership positions under which the participants may choose to invest in sharesintheCompanyatmarketvalue.ThenumberofemployeesinvitedtoparticipateintheEIPislimitedperyearto2%oftheGroup’semployees.Theamountaparticipantmayinvestperyearislimitedtothevalueoftheannualshort-termincentivetargetamountfortheparticipantin therelevantyear.Thesharesareblockedfor threeyears.Foreachpurchasedshare, theGroupgrantstheparticipantstwomatchingoptionstopurchaseanothertwosharesatapre-definedexercisepriceattheendofathree-yearvestingperiod.TheGroupexpectstosettleitsobligationsunder theseplansandarrangementsbyusingownshares (treasury shares).Hence,theexerciseoftheEIPoptionsisnotexpectedtoresultinanincreaseoftheexistingsharecapital.Pleaserefertonote31oftheconsolidatedfinancialstatementsfortheyearended31 December2020foradditionalinformationabouttheEIPoptions.
As part of the transaction to purchase the remaining shares in its joint venture companies in Saudi Arabia(i.e.AlObeikanSIGCombiblocCompanyLtd.,Riyadh)andintheUAE(i.e.SIGCombiblocObeikanFZCO,Dubai),OIGhasarighttoreceive17,467,632fullypaid-upregisteredshareswithanominalvalueofCHF 0.01pershare,correspondingto5.175%oftheexistingsharecapital.ItisanticipatedthattheclosingofthistransactionwillbeconsummatedbeforetheendofQ12021,subjecttocustomaryclosingconditionsandapprovalsfromregulatoryauthorities.
3. Board of Directors
3.1 Members of the Board of Directors
The Articles of Association provide that the Board of Directors shall consist of a minimum of threemembers,includingthechairmanoftheBoard(“ChairmanoftheBoardofDirectors”or“Chairman”).Currently,theBoardconsistsofthefollowingsevenmembers1:
Name Nationality Position Since Expires1
Andreas Umbach Swiss & German Chairman 2018 AGM2021
Matthias Währen Swiss Member 2018 AGM2021
Colleen Goggins American Member 2018 AGM2021
Werner Bauer Swiss & German Member 2018 AGM2021
Wah-HuiChu Chinese Member 2018 AGM2021
Mariel Hoch Swiss & German Member 2018 AGM2021
Nigel Wright Canadian Member 2014 AGM2021
1 AllBoardmembersareelectedannuallyinaccordancewithSwisscorporatelawandtheArticlesofAssociation.
AllsevenmembersoftheBoardwerere-electedattheannualgeneralmeetingoftheCompany(“Annual General Meeting” or “AGM”)on7 April 2020(“Annual General Meeting 2020” or “AGM 2020”)foraone-yeartermofoffice.
AllcurrentmembersoftheBoardofDirectorsarenon-executivedirectors.Noneofthemembersof the Board of Directors has been a member of the management of the Company or subsidiary oftheGroupinthethreeyearsprecedingtheyearunderreview.However,from2015untilthelistingoftheCompanyon28September2018(“IPO”),ColleenGoggins,WernerBauer,Wah-HuiChuandNigelWrightservedasadvisoryboardmembersoftheCompany.
1 SubjecttoclosingofthetransactionwithOIGreferredtoinSection2.1inadvanceoftheAGM2021andcertainothercustomaryconditions,theCompanyundertooktonominateattheAGM2021Mr AbdallahalObeikananewmemberoftheBoard.Such appointmentwouldincreasethetotalnumberofBoardmemberstoeightmembers.
Annual Report 2020
Governance Corporate Governance Report 73

Andreas Umbach is a Swiss and German citizen and has served as the Chairman of the Board ofDirectorssincetheInitialPublicOfferingin2018.Mr UmbachhasfurtherservedaschairmanoftheboardofdirectorsofLandis+GyrGroup AG(SIX:LAND)sinceJuly2017,aschairmanofthesupervisoryboardofTechemEnergyServicesGmbHsinceAugust2018andaschairmanoftheboardofdirectorsofRovensaSAsinceSeptember2020.HehasbeenthepresidentoftheZugChamberofCommerceandIndustrysince2016.Mr UmbachpreviouslyservedasamemberoftheboardofdirectorsofAscomHolding AG(SIX:ASCN)(2010–2020),from2017–2019asitschairman.HealsoservedasamemberoftheboardofdirectorsofWWZ AG(2013–2020)andasamemberoftheboardofdirectorsofLichtBlickSE(2012–2016).From2002to2017,Mr UmbachwasthepresidentandCEO/COOofLandis+Gyr AG.PriortoservingasCEO,Mr Umbachservedas president of the Siemens Metering Division within the Power Transmission and Distribution GroupandheldotherpositionswithinSiemens.Mr UmbachholdsanMBAfromtheUniversityof Texas at Austin and an MSc in mechanical engineering (Diplomingenieur) from the Technical UniversityofBerlin.
Matthias Währen is a Swiss citizen and has served as a member of the Board of Directors sincetheIPO.Mr WährenhasfurtherservedasamemberoftheboardofdirectorsofKetoSwiss AGsinceJuly2020,ofBloomBiorenewablesSAsinceSeptember2020andasamemberoftheboardofdirectorsofph. AGsinceDecember2020,aswellasbeingamemberoftheboardoftrusteesoftheGivaudanFoundation(since2013)andtheHBMFondation(since2018).Mr WährenwaspreviouslyamemberoftheregulatoryboardofSIXSwissExchangefrom2006to2017,amemberof theboardof scienceindustries from2009 to2017,amemberof theboardofSwissHoldingsfrom2015to2017andamemberoftheboardofdirectorsofvariousGivaudansubsidiariesfrom2005to2019.Mostrecently,heservedasCFOandamemberoftheexecutivecommitteeofGivaudanSAfrom2005untilhisretirementin2017.Priortothat,heservedastheglobalheadoffinanceandinformaticsoftheRochevitamindivisionandheldavarietyofotherpositionsatRoche,includingvicepresidentfinanceandinformaticsatRocheUSA,Nutley,NewJersey,headoffinanceandinformationtechnologyatNipponRoche,TokyoandfinancedirectorofRocheKorea.Mr Währenstartedhiscareer incorporateauditingatRochein1983.Mr Währenholdsamaster’sdegreeineconomicsfromtheUniversityofBasel,Switzerland.
Colleen Goggins is an American citizen and has served as a member of the Board of Directors since the IPO. From 2015 until the IPO, she served as an advisory boardmember for theCompany.Ms GogginsisalsocurrentlyamemberoftheboardofdirectorsofTDBankGroup(TSE:TD)(since2012),wheresheservesontheriskcommittee,amemberofthesupervisoryboardofBayerAG(ETR:BAYN)(since2017),wheresheservesonthenominatingandadhoclegalcommittee,andamemberoftheboardofdirectorsofIQVIA(NYSE:IQV)(since2017),whereshesitsontheauditandnominatingandgovernancecommittees.Ms GogginsisalsoamemberoftheadvisoryboardsofZOSkinHeathandSabertInc.(since2020).ShehasbeenamemberoftheUniversityofWisconsinFoundationandamemberoftheboardoftheUniversity’scentreforbrandandproductmanagement,amemberoftheboardofdirectorsofNewYorkCitymealsonWheelsandatrusteeoftheInternationalInstituteofEducation.Ms GogginspreviouslyservedasasupervisoryboardmemberforKraussMaffeifrom2013to2016andasamemberoftheboardofdirectorsofValeantPharmaceuticalsInternationalfrom2014to2016,whereshewasamemberofthenominatingcommitteeandspecialadhoccommittee.Priortothat,Ms GogginsworkedatJohnson&Johnsonuntil2011,wheresheheldvariousleadershippositions,includingworldwide chairwoman of the consumer group, company group chairwoman, and president of the Johnson & Johnson Consumer Products Company, among others, and she served as a memberoftheexecutivecommittee.Ms GogginsholdsaBachelorofScience(“BSc”)degreeinfoodchemistryfromtheUniversityofWisconsin-Madisonandamaster’sdegreeinmanagementfromtheKelloggGraduateSchoolofManagementatNorthwesternUniversity.
Annual Report 2020
Governance Corporate Governance Report 74

Werner Bauer is a Swiss and German citizen and has served as a member of the Board of DirectorssincetheIPO.From2015untiltheIPO,heservedasanadvisoryboardmemberfortheCompany.Mr BauerisalsocurrentlyvicechairmanoftheboardofdirectorsofGivaudan SA(SIX: GIVN)(since2014)andBertelsmannSE&Co.KGaA(since2012),chairmanoftheboardoftrusteesattheBertelsmannFoundation(since2011),andamemberoftheboardofdirectorsofLonzaGroupAG(SIX:LONN)(since2013).From2011until2018healsoservedasamemberoftheboardofdirectorsofGEAGroup AG.Priortothatheheldanumberofotherboardpositions,includingchairmanoftheboardofdirectorsofNestléDeutschland AG(from2005to2017)andchairmanoftheboardofdirectorsofGaldermaPharmaSA(from2011to2014).Mostrecently,Mr Bauerwas the executive vice president and head of innovation, technology, research&development forNestléSAfrom2007to2013,andprior tothatheservedasexecutivevicepresidentandheadoftechnical,production,environment,research&developmentforNestlé SAandheldotherpositionswithinNestlé.Furthermore,Mr BauerservedaschairmanoftheboardofdirectorsofSofinolS.A.(from2006to2012),andasamemberoftheboardofdirectorsofL’Oréal(from2005to2012)andofAlconInc.(from2002to2010).Mr Bauerstartedhiscareerin1980asaprofessorofchemicalengineeringatHamburgUniversityofTechnology,afterwhichhewas a professor in food bioprocessing and director of the Fraunhofer Institute for FoodTechnology&PackagingattheTechnicalUniversityofMunich.Mr BauerholdsadegreeandPhDinchemicalengineeringfromtheUniversityofErlangen-Nürnberg.
Wah-Hui Chu is a Chinese citizen and has served as a member of the Board of Directors since theIPO.From2015untiltheIPO,heservedasanadvisoryboardmemberfortheCompany.Mr ChuiscurrentlyalsothefounderandhasbeenchairmanofiBridgeTTInternationalLimited(HongKong)since2018,amemberoftheboardofdirectorsofMettlerToledoInternational(NYSE:MTD)since2007andwasthefounderofM&WConsultantsLimited(HongKong)in2007.From2013to2014whenheretired,Mr ChuservedastheCEOandamemberoftheboardofdirectorsofTingyiAsahiBeveragesHolding,andfrom2008to2011heactedasexecutivedirectorandCEOofNextMediaLimited.HealsoservedasamemberoftheboardofdirectorsofLiNingCompanyLimitedfrom2007to2012andaschairmanofPepsiCoInvestment(China)Limited from1998 to2007,andagain from2012 to2013.Mr ChuspentmanyyearsasanexecutiveatPepsiCo,servingasnon-executivechairmanofPepsiCoInternational’sAsiaregionin2008andpresidentofPepsiCoInternational–Chinabeveragesbusinessunitbetween1998and2007.BeforejoiningPepsiCo,Mr ChuheldmanagementpositionsatMonsantoCompany,WhirlpoolCorporation,H.J.HeinzCompanyandtheQuakerOatsCompany.Mr ChuholdsaBScinagronomyfromtheUniversityofMinnesotaandanMBAfromRooseveltUniversity.
Mariel Hoch is a Swiss and German citizen and has served as a member of the Board of Directors sincetheIPO.Ms HochhasbeenapartnerattheSwisslawfirmBär&Karrersince2012.SheiscurrentlyalsoaservingboardmemberatCometHoldingAG(SIX:COTN)(since2016),whereshealsochairsthenominationandcompensationcommittee,atKomaxHolding AG(SIX:KOMN)(since2019),whereshealsositsontheauditcommittee,andatMEXAB AG(since2014).Ms HochservedasamemberoftheboardofdirectorsofAdunic AGfrom2015to2018.ShehasbeenamemberofthefoundationboardofTheSchörlingFoundationsince2013andamemberofthefoundationboardoftheIreneM.StaehelinFoundationsince2020.Ms Hochhasalsobeen co-chairoftheZurichCommitteeofHumanRightsWatchsince2017.Ms HochwasadmittedtotheZurichbarin2005andholdsalawdegreeandaPhDfromtheUniversityofZurich.
Nigel WrightisaCanadiancitizenandhasbeenamemberoftheBoardofDirectorssince2014.Mr WrightisaseniormanagingdirectoratOnexCorporation(TSE:ONEX),wherehemanagesEuropean origination efforts in the business services, healthcare and packaging sectorsforOnex’s large-cap fund,Onex Partners. Furthermore, he is amember ofOnex Partners’investment committee.He currently servesasnon-executive chairofAcaciumGroup (since2020),asnon-executivechairofChildcareBV(operatingasKidsFoundation),asanon-executive
Annual Report 2020
Governance Corporate Governance Report 75

directorof Justitia,andasa trusteeof thePolicyExchange.Mr Wright joinedOnex in1997,althoughfrom2010to2013heworkedaschiefofstaffforthePrimeMinisterofCanada.PriortojoiningOnex,Mr WrightwasapartneratthelawfirmofDavies,Ward&Beck,andbeforethatheworkedinpolicydevelopmentintheofficeofthePrimeMinisterofCanada.MrWrightholdsanLL.M.fromHarvardLawSchool,anLL.B.(withhonours)fromtheUniversityofTorontoLawSchoolandabachelor’sdegreeinpoliticsandeconomicsfromTrinityCollegeattheUniversityofToronto.
Asof31 December 2020,therearenomaterialbusinessrelationshipsofanyBoardmemberwiththeCompanyorwithanysubsidiaryorjointventure.
3.2 Number of permissible activities
Intheinterestofgoodgovernance,theCompany’sArticlesofAssociationlimitthenumberofoutside mandates that may be held by members of our Board as follows:
(i) uptofourmandatesinlistedfirms;
(ii) uptotenmandatesinnon-listedfirms2;and
(iii) uptotenmandatesinfoundations,associations,charitableorganisationsandotherlegal entities.
Such a mandate is deemed to be any activity in the superior governing or administrative bodies of legal entities that are obliged to be registered in the commercial register or any comparable foreignregister,otherthantheCompanyandanyentitycontrolledbyorcontrollingtheCompany.TheBoardofDirectorsshallensurethatsuchactivitiesdonotconflictwiththeexercisingoftheirdutiesfortheGroup.Functionsinvariouslegalentitiesthatareunderjointcontrol,orinentitiesinwhichthislegalentityhasamaterialinterest,arecountedasonefunction.
3.3 Election and term of office
The members of the Board of Directors are elected individually each year by the Annual General MeetingoftheCompanyforatermofofficeofoneyearandcanbere-elected.TheChairmanofthe Board of Directors is also elected each year by the Annual General Meeting for a period of officeofoneyear.Thereisnolimitontheterminoffice.TheinitialelectionyearofeachBoardmemberisshowninthetableonpage73.
3.4 Internal organisation – Division of roles within the Board of Directors and working methods
TheBoardofDirectorsrepresentstheCompanyvis-à-visthirdpartiesandattendstoallmatterswhichhavenotbeendelegatedtoorreservedforanothercorporatebodyoftheCompany.TheChairmanconvenesmeetingsoftheBoardofDirectorsasoftenastheGroup’sbusinessrequires,butat leastfourtimesayear.TheChairmanpreparesthemeetings,drawsuptheagenda,andchairs them.Anymemberof theBoardcanask forameetingtobeconvenedandfortheinclusionofanitemontheagenda.Inordertopassresolutions,notlessthanamajorityoftheBoardmembersmustbeparticipatinginthemeeting.Exceptasrequiredbymandatorylaw,theBoardwilladoptresolutionsbyasimplemajorityofthevotescast.Incaseofatie,theChairmanhasnocastingvote.Boardresolutionsmayalsobepassedinwritingby
2 Pursuanttoart.727para.1number1CO.
Annual Report 2020
Governance Corporate Governance Report 76

way of circular resolution, provided that no member of the Board of Directors requests oral deliberation(inwriting,includingbyemail)oftheChairmanorthesecretary.BoardresolutionsbymeansofawrittenresolutionrequiretheaffirmativevoteofamajorityofallthemembersoftheBoard.
4. Committees
The Board of Directors may delegate the preparation and execution of its decisions to committeesortoitsindividualmembers.TheBoardofDirectorshasappointedthreestandingcommittees: the Audit and Risk Committee, the Compensation Committee and the Nomination and Governance Committee. For each of the committees, the Board of Directors elects achairmanfromthemembersoftheBoardofDirectors.TheperiodofofficeofallCommitteemembersisoneyear.Re-electionispossible.
Subject to the provisions of the Articles of Association1, the Audit and Risk Committee and the Compensation Committee shall generally comprise three or more members of the Board of Directors.TheNominationandGovernanceCommitteeshallgenerallycomprisetwoormoremembersoftheBoardofDirectors.
4.1 Compensation Committee
As required by Swiss law, the members of the Compensation Committee are elected each year bytheAnnualGeneralMeeting.Asof31 December 2020,themembersoftheCompensationCommitteewereColleenGoggins(chairwoman),MarielHochandWah-HuiChu.
Meetings of the Compensation Committee are held as often as required but in any event at leastthreetimesayear,orasrequestedbyanyofitsmembers.
ThemembersoftheCompensationCommitteeshallbenon-executiveandindependent,anda majority of the members of the Compensation Committee, including its chairperson, should be experienced in the areas of succession planning and performance evaluation, as well as the compensationofmembersofBoardsofDirectorsandexecutivemanagementboards.
TheCompensationCommitteeshallassisttheBoardinfulfillingitsresponsibilitiesrelatingtothecompensationofthemembersoftheBoardofDirectorsandtheGroupExecutiveBoard.TheCompensationCommittee’sresponsibilitiesinclude,interalia:
• issuance and review of the compensation policy and the performance criteria and periodical review of the implementation and submission of suggestions and recommendations to the Board,includingasregardscompliancewithapplicablelaws;
• preparationoftheBoardofDirectors’proposalstotheAnnualGeneralMeetingregardingthecompensationoftheBoardofDirectorsandtheGroupExecutiveBoard;
• reviewoftheprinciplesanddesignofcompensationplans,long-termincentiveandequityplans,pensionarrangementsandfurtherbenefitsfortheGroupExecutiveBoard,includingreview of the contractual terms of the members of the Group Executive Board and submission ofadjustmentstotheBoardofDirectorsforapproval;
• for each performance period, preparation of the decisions for the Board of Directors regarding the compensation of the members of the Board of Directors and the Group Executive Board, includingthebreakdownofcompensationelements(withintheamountapprovedbytheAnnualGeneralMeeting);
1 https://www.sig.biz/investors/en/governance/articles-of-association
Annual Report 2020
Governance Corporate Governance Report 77

• submissionofsuggestionstotheBoardofDirectorsregardingtherecipientsofperformance-relatedand/orlong-termincentivecompensationandsubmissionofsuggestionstotheBoardofDirectorsregardingthedefinitionofannualorothertargetsforperformance-relatedand/orlong-termincentivecompensation;and
• reviewofthecompensationreportandsubmissiontotheBoardofDirectorsforapproval.
The Board of Directors may entrust the Compensation Committee with additional duties in relatedmatters.TheCompensationCommitteeisrequiredtoreportitsactivitiestotheBoardofDirectors on a regular basis and to make recommendations and propose appropriate measures totheBoardofDirectors.2
4.2 Audit and Risk Committee
The members and the chairman of the Audit and Risk Committee are appointed by the Board ofDirectors.Asof31 December 2020, themembersof theAuditandRiskCommitteewereMatthiasWähren(chairman),MarielHochandWernerBauer.
Meetings of the Audit and Risk Committee are held as often as required, but in any event at least fourtimesayear,orasrequestedbyanyofitsmembers.
ThemembersoftheAuditandRiskCommitteeshallbenon-executiveandindependent,andamajority of the members of the Audit and Risk Committee, including its chairperson, must be experiencedinfinancialandaccountingmatters.
TheAuditandRiskCommittee(i)assiststheBoardinfulfillingitssupervisoryresponsibilitieswithrespectto(a)theintegrityoftheCompany’sfinancialstatementsandfinancialreportingprocess, (b)theCompany’scompliancewith legal,regulatory,andcompliancerequirements,(c)thesystemofinternalcontrols,and(d)theauditprocess;(ii)monitorstheperformanceoftheCompany’sinternalauditorsandtheperformance,qualification,andindependenceoftheCompany’sindependentauditors;and(iii)considerstheproperassessmentandprofessionalmanagementofrisksbysupervisingtheCompany’sriskmanagementsystemandprocesses.
The responsibilities of the Audit and Risk Committee in particular include, inter alia, to review and discuss with the CFO and, both together with the CFO and separately, with the auditors the Company’s annual and semi-annual and quarterly (if quarterly financial statements areprepared)financialstatementsandreportsintendedforpublication,aswellasanyotherfinancialstatements(includingthenotesthereto)intendedforpublication.TheAuditandRiskCommitteealso recommends theannualfinancial statements forapprovalby theBoardofDirectors forsubmissiontotheAnnualGeneralMeeting,andapprovessemi-annualandquarterly(if quarterlyfinancial statements are prepared) financial statements (including the notes thereto) forpublication.Inaddition,theAuditandRiskCommitteediscusseswiththeCFOandtheauditorssignificantfinancialreportingissuesandjudgmentsmadeinconnectionwiththepreparationoftheCompany’sfinancialstatements,includinganysignificantchangesintheCompany’saccountingprinciples,theselectionanddisclosureofcriticalaccountingestimates,andtheeffectofalternativeassumptions,estimatesoraccountingprinciplesontheCompany’sfinancialstatements.
In connection with the risk management of the Company, the Audit and Risk Committeediscusses with the CFO and, if appropriate, the Group General Counsel any legal matters (includingthestatusofpendingorthreatenedlitigation)thatmayhaveamaterialimpactontheCompany’sbusinessorfinancial statementsandanymaterial reportsor inquiries from
2 Theorganization,detailedresponsibilitiesandreportingdutiesoftheCompensationCommitteearestipulated intheArticlesofAssociation.
Annual Report 2020
Governance Corporate Governance Report 78

regulatory or governmental agencies that couldmaterially impact the Company’s businessorcontingentliabilitiesandrisks.ItsmembersperiodicallyreviewtheCompany’spoliciesandprocedures designed to secure compliance with laws, regulations and internal rules regarding insiderinformation,confidentiality,briberyandcorruption,sanctionsandadherencetoethicalstandards,andassesstheeffectivenessthereof.TheAuditandRiskCommitteeobtainsandreviews reports submitted at least annually by the Group General Counsel and any other persons thecommitteehasdesignatedasbeingresponsible forassuringtheCompany’scompliancewithlawsandregulations.Inthiscontext,itinformstheBoardatleastannuallyaboutthemostsignificantrisksfortheCompanyandtheGroupandhowsuchrisksaremanagedormitigated.
The Board of Directors may entrust the Audit and Risk Committee with additional duties in financial matters. In discharging its responsibilities, the Audit and Risk Committee hasunrestricted and direct access to all relevant information in relation to the Company and the Group.TheAuditandRiskCommitteeensuresthatitisinformedbytheindependentauditorson a regular basis. TheAudit and Risk Committee is required to report its activities to theBoard of Directors on a regular basis and to make recommendations and propose appropriate measurestotheBoardofDirectors.
4.3 Nomination and Governance Committee
The members and the chairman of the Nomination and Governance Committee are appointed by theBoard ofDirectors. As of 31 December 2020, themembers of theNomination andGovernanceCommitteewereNigelWright(chairman),Wah-HuiChuandWernerBauer.
Meetings of the Nomination and Governance Committee are held as often as required, but in anyeventatleasttwotimesayear,orasrequestedbyanyofitsmembers.
Themajorityof themembersof theNominationandGovernanceCommitteeshallbenon-executive and a majority of the members of the Nomination and Governance Committee, including its chairperson, must be experienced in nomination of members of Boards of Directors andtheGroupExecutiveBoardandcorporategovernancematters.
The Nomination and Governance Committee assists the Board of Directors in fulfilling itsresponsibilitiesanddischargingtheBoard’sresponsibilityto(i)establishandmaintainaprocessrelatingtonominationofthemembersoftheBoardandtheGroupExecutiveBoardand(ii) establishsoundpracticesincorporategovernanceacrosstheGroup.Itsresponsibilitiesinclude,interalia,assistingtheBoardtoidentifyindividualswhoarequalifiedtobecomemembersoftheBoardorqualifiedtobecomeCEOwhenvacanciesariseand,inconsultationwiththeCEO,membersoftheGroupExecutiveBoard.Furthermore,theNominationandGovernanceCommitteereviewsthe performance of each current member of the Board of Directors, the CEO and each of the othermembersoftheGroupExecutiveBoard.ItalsoprovidesrecommendationstotheBoardofDirectorsastohowtheBoard’sperformancecanbeimproved.
The Nomination and Governance Committee also develops and makes recommendations to the Board of Directors regarding corporate governance matters and practices, including the effectivenessoftheBoardofDirectors,itsCommitteesandindividualdirectors.ItalsooverseestheCompany’sstrategyandgovernanceinrelationtocorporateresponsibilityforenvironmental,socialandgovernancematters,inparticularregardingkeyissuesthatmayaffecttheCompany’sbusinessandreputation.
The Board of Directors may entrust the Nomination and Governance Committee with additional duties inrelatedmatters.TheNominationandGovernanceCommitteeisrequiredtoreportits activities to the Board of Directors on a regular basis and to make recommendations and proposeappropriatemeasurestotheBoardofDirectors.
Annual Report 2020
Governance Corporate Governance Report 79

5. Frequency of meetings of the Board of Directors and its Committees
TheChairmanconvenesmeetingsoftheBoardofDirectorsasoftenastheGroup’sbusinessrequires, but at least four times a year, and whenever a member of the Board or the CEO requestsameetingoftheBoardindicatingthereasonsforsuchameetinginwriting.
TheBoardofDirectorsusuallyconvenesforfull-dayordinarymeetingsaswellasanannualjointstrategymeetingwiththeGroupExecutiveBoard.Thetaskatthesemeetingsistoanalysethe positioning of the Group in the light of currentmacroeconomic and Company-specificcircumstancesandtoreview,andifnecessaryredefine,thestrategicorientation.
InviewoftheCOVID-19situation,theBoardofDirectorshasadaptedthescheduleandformatof its meetings by increasing the number of meetings but shortening their duration and holding mostmeetingsvirtually.
Intheperiodunderreview,theBoardhasheldsixordinarymeetings,thereofonefull-dayin-personmeeting,fivevirtualhalf-daymeetingsplusastrategymeetingheldinpersonsplitovertwohalf-days.Inaddition,theBoardheldfiveextraordinaryvirtualone-hourmeetings.Inallofthesemeetings,thefullBoardwaspresent.Therefore,theboardmeetingshadanoverallattendanceof100%intheperiodunderreview.
Fortheperiodunderreview,theCompensationCommitteeheldfivemeetingswithanaveragedurationofapproximatelytwohours,oneofwhichwasin-personandfourwerevirtualmeetings.Themeetingshadanoverallattendancerateof100%.Inaddition,therewasonecombinedCompensation Committee and Nomination and Governance Committee virtual meeting lasting one hour to jointly address overarching topics which was attended by all members of these Committees.
In addition to the aforementioned joinedmeeting with the Compensation committee, theNomination and Governance Committee held four ordinary meetings with an average duration of approximately 1.5 hours, one of which was in-person and three were virtualmeetings.Furthermore, the Nomination and Governance Committee held two extraordinary virtual meetingsforonehoureach.Themeetingshadanoverallattendancerateof100%.
TheAuditandRiskCommitteeheldfivemeetingswithanaveragedurationofapproximatelyfourhours,oneofwhichwasin-personandfourwerevirtualmeetings.Themeetingshadanoverallattendancerateof100%.Allof themeetingsof theAuditandRiskCommitteewerepartiallyattendedbytheexternalauditors.
TheBoardmeetingswere,withtheexceptionofcertaindirectors-onlysessions,usuallyattendedby the CEO, CFO and other members of the Group Executive Board and other representatives ofseniormanagement.Somemeetingsof theBoardofDirectorswerepartiallyattendedbyexternaladvisers.MeetingsoftheAuditandRiskCommitteewereattendedbytheCFOandtheChiefComplianceOfficer,andusuallyalsobytheCEO.MeetingsoftheCompensationCommitteewere regularly attended by an external advisor to the Compensation Committee, the CEO and the VicePresidentGroupHumanResources.TheNominationandGovernanceCommitteemeetingwasattendedbytheCEOandbyamemberofmanagementactingasSecretary.
Annual Report 2020
Governance Corporate Governance Report 80

6. Areas of responsibility
The Board, acting collectively, has the ultimate responsibility for the conduct of business of theCompanyand fordelivering sustainable shareholder and stakeholder value. TheBoardsetstheCompany’sstrategicaims,ensuresthatthenecessaryfinancialandhumanresourcesareinplacetomeettheCompany’sobjectives,andsupervisesandcontrolsthemanagementoftheCompany. Itmaytakedecisionsonallmattersthatarenotexpresslyreservedtotheshareholders’meetingortoanothercorporatebodybylaw,bytheArticlesofAssociationorbytheOrganisationalRegulations.TheBoard’snon-transferableandirrevocableduties,assetoutintheCOandart.19para.3oftheArticlesofAssociation,include:1
• theultimatedirectionoftheCompanyandthepowerforissuingthenecessarydirectives;• determiningtheorganisationoftheCompany;• theoverallstructureoftheaccountingsystem,financialcontrolandfinancialplanning;• the appointment and dismissal of those persons responsible for the conduct of business and
for representing the Company, the regulation of signatory authorities and the determination oftheirotherauthorities;
• the ultimate supervision of the persons entrusted with the management of the Company, in particular with respect to their compliance with the law, the Articles of Association, regulations anddirectives;
• thepreparationoftheAnnualReport,CompensationReportandtheshareholders’meeting,includingimplementationoftheresolutionsadoptedbytheshareholders’meeting;
• thenotificationofajudgeintheeventofover-indebtedness;• the passing of resolutions regarding the subsequent payment of capital with respect to
non-fullypaid-insharesandtherespectiveamendmentsoftheArticlesofAssociation;• the passing of resolutions concerning an increase of the share capital and regarding the
preparation of capital increase reports as well as the respective amendments to the Articles ofAssociation;and
• thenon-transferableandinalienabledutiesandpowersoftheBoardofDirectorsby law,such as the Swiss Federal Merger Act on Merger, Demerger, Transformation and Transfer of Assetsof1July2004,asamended,ortheArticlesofAssociation.
Inaddition,Swiss lawand theOrganisationalRegulations reserve to theBoard thepowers,inter alia:
• to determine the overall business strategy, taking into account the information, proposals andalternativespresentedbytheCEO;
• to set financial objectives and approve, via the budget and financial planning process,the necessary means to achieve these objectives, including approving a capital allocation framework;
• to decide on the Group entering into substantial new business areas or exiting from a substantial existing business area, insofar as this is not covered by the current approved strategicframework;
• toappointandremovetheCEOandtheothermembersoftheGroupExecutiveBoard;• tosettheriskprofileandtheriskcapacitiesoftheGroup;and• to approve all matters and business decisions where such decisions exceed the authority
delegatedbytheBoardtoitsCommittees,theCEOortheGroupExecutiveBoard.
1 AdetaileddescriptionoftheseresponsibilitiesanddutiesoftheBoardofDirectors,itsCommitteesandtheGroupExecutiveBoardisprovidedintheArticlesofAssociationandtheOrganisationalRegulations.
Annual Report 2020
Governance Corporate Governance Report 81

The Board of Directors has delegated the operational management of the Company and the Group to the Group Executive Board headed by the CEO, subject to the duties and powers reserved totheBoardbySwisslaw,theArticlesofAssociationandtheOrganisationalRegulations.TheGroupExecutiveBoardisresponsibleforimplementingandachievingtheCompany’scorporateobjectives and for the management and control of all Group companies2.TheGroupExecutiveBoardisdirectlysupervisedbytheBoardofDirectorsanditsCommittees.
Pursuant to the Organisational Regulations, the CEO is appointed upon recommendation by the NominationandGovernanceCommitteeandmayberemovedbytheBoardofDirectors.Theother members of the Group Executive Board are appointed by the Board of Directors upon recommendation by the Nomination and Governance Committee in consultation with the CEO andmayberemovedbytheBoardofDirectors.
7. Information and control instruments vis-à-vis the Group Executive Board
The Board of Directors supervises the Group Executive Board and uses reporting and controlling processestomonitor itsoperatingmethods.Ateachof itsmeetings,theBoardofDirectorsis informed by the CEO, or by another member of the Group Executive Board, of the current businessandsignificantevents.Atthesemeetings,membersoftheBoardofDirectorsmayaskother members of the Board of Directors or the CEO to provide information about the Group thattheyrequireinordertocarryouttheirduties.TheChairmanhasregularinteractionwiththeCEObetweenBoardmeetings.Thecourseofbusinessandallmajorissuesofcorporaterelevance are discussed at least once a month. Executive Management provides monthlyreportstotheBoardregardingthefinancialandoperationalperformanceofthebusiness.AllmembersoftheBoardofDirectorsarenotifiedimmediatelyofanyexceptionaloccurrences.
TheHeadofInternalAudit,GeneralCounsel,andauditingbodiesassisttheBoardofDirectorsincarryingoutitscontrollingandsupervisoryduties.Inaddition,theCommitteesmonitortheperformanceoftheGroupExecutiveBoard.ThescopeofthisremitisagreedwiththeBoardofDirectors.
TheCommitteesregularlyreceiveinformationintheformofGroupreportsrelevanttotheirneeds.ThesereportsaretypicallydiscussedindepthatordinarymeetingsoftheCommitteesinvolved.TheGroupExecutiveBoarddefinesandevaluatestheGroup’smostsignificantrisksonthebasisofacoordinatedandconsistentapproachtoriskmanagementandcontrol.Basedonalistofthemost important risks, the Group Executive Board establishes a list of measures to prevent and mitigatepotentiallossanddamage.ThelistispresentedtotheAuditandRiskCommittee.Afterreview and discussion, the Audit and Risk Committee informs the Board of Directors, which directs theGroupExecutiveBoardtoensurethatthemeasuresareputintopractice.
Inaddition,theBoardofDirectorsissupportedbyInternalAudit.TheAuditandRiskCommitteereviewsanddiscusseswiththeHeadofInternalAuditmaterialmattersarisingininternalauditreportsprovidedtotheAuditandRiskCommittee.InternalAudithasanunrestrictedrighttodemandinformationandexaminetherecordsofallGroupcompaniesanddepartments. Inaddition, after consultation with the Audit and Risk Committee, the Group Executive Board may askInternalAudittocarryoutspecialinvestigationsaboveandbeyonditsusualremit.TheHeadofInternalAuditsubmitsareporttotheAuditandRiskCommitteeatleastannually.TheAuditand Risk Committee is responsible for reviewing and discussing such reports, the internal audit planfortheCompanyandbudgetedresourcesforInternalAudit.
2 TheGroupExecutiveBoardexercisesthosedutieswhichtheBoardofDirectorshasdelegatedtothemanagementinaccordancewiththeCompany’sOrganisationalRegulationsandSwisslaw.
Annual Report 2020
Governance Corporate Governance Report 82

TheSIG GrouphasriskmanagementsystemsinplaceatallitsGroupcompanies.PotentialrisksarereviewedperiodicallyandsignificantriskstowhichtheCompanyisexposedareidentifiedandassessedforprobabilityofoccurrenceandimpact.ActiontomanageandcontaintheserisksisapprovedbytheBoardofDirectors.
8. Group Executive Board
8.1 Members of the Group Executive Board
TheGroupExecutiveBoardisheadedbytheCEOandcomprisessixmembers,specificallytheCEO,theCFO,theCTO,thePresident&GeneralManagerAsia-Pacific,thePresident&GeneralManagerAmericasandthePresident&GeneralManagerEurope.
The Company announced in press releases published on 31 August 2020 that by mutualagreementMarkusBoehmwouldceasehisroleasChiefMarketOfficerandmemberof theGroupExecutiveBoardwitheffectfromtheendof31 August 2020.Inthesamepressrelease,theCompanyalsoannouncedthatMartinHerrenbrückhasdecidedtotakeupapositionoutsideSIGandwillleavetheCompanywitheffectfromtheendof31 December 2020.1
Furthermore,theCompanyannouncedinpressreleasespublishedon9 November 2020thatRolf Stangl has decided to leave the Company to pursue personal interests and would cease his roleasCEOwitheffectfromtheendof31 December 2020.RolfStanglwassucceededbySamuelSigristwitheffectfrom1 January 2021andbecamethenewCEOonthatdate.FrankHerzogtookoverSamuelSigrist’spositionasCFOasof1 January 2021andalsobecameamemberoftheGroupExecutiveBoardonthatdate.FrankHerzogjoinedSIG GroupfromVFS Global,basedinZurichandDubai,wherehewasChiefFinancialOfficer.
AspartofthetransactionwithOIGreferredtoinSection2.1,theCompanyannouncedthatAbdelghanyEladib,currentlyChiefOperatingOfficerofAlObeikanSIGCombiblocCompanyLtd.,willjoin–subjecttoandasofcompletionoftheacquisitionwithOIG–theGroupExecutiveBoardasPresident&GeneralManager,MiddleEastandAfrica.
TheGroupExecutiveBoardcomprisedthefollowingmemberson31 December 2020:
Name Nationality Position
Rolf Stangl Swiss and German CEO
Samuel Sigrist Swiss CFO
IanWood British CTO
Lawrence Fok Singaporean President&GeneralManagerAsiaPacific
Ricardo Rodriguez Brazilian and Spanish President & General Manager Americas
MartinHerrenbrück1 German President & General Manager Europe
1 Inofficeuntil31 December 2020.On12January2021,theCompanyannouncedtheappointmentofJoséMatthijssetosucceed MartinHerrenbrückasPresident&GeneralManagerEuropeandmemberoftheGroupExecutiveBoardwith effectfrom1 February2021.
The biographies on the following pages provide information about the Group Executive Board membersinofficeon31 December 2020.
1 On12January2021,theCompanyinformedthatithasannouncedJoséMatthijsseasPresident&GeneralManagerEuropewitheffectfrom1February2021.Ms MatthijssesucceedsMartinHerrenbrückandwillalsobecomeamemberoftheGroupExecutiveBoard.
Annual Report 2020
Governance Corporate Governance Report 83

Rolf Stangl is a Swiss and German citizen and has served as a CEO from 2008 until31 December 2020.Asof1January2021hewassucceededasCEObySamuelSigrist.Mr Stangljoined the Company in 2004 and has held a number of positions across the organisation,including,amongothers,HeadofCorporateDevelopmentandM&A,ChiefExecutiveOfficerofSIG Beverage(a divisionsubsequentlydivested)andCMO.RolfStangljoinedtheboardofdirectorsofPactiv EvergreenInc.(NASDAQ:PTVE)in2020.PriortojoiningtheCompany,Mr Stanglservedasaninvestmentdirectorforsmallandmid-capbuyoutsatafamilyofficeinLondonandasaseniorconsultantwithRolandBergerStrategyConsultantsinGermany.Mr Stanglholdsabachelor’sdegreeinbusinessadministrationfromESCReims &ESBReutlingen.
Samuel Sigrist is a Swiss citizen and has served as CFO and chairman of the Middle East Joint Venturesince2017.Witheffectfrom1January2021,hebecamethenewCEOoftheSIG Group.Mr Sigrist joined the Company in 2005 and has worked in various finance and corporatedevelopmentroles,includingdirectorofgroupcontrolling&reporting,headoffinance/CFOofEuropeandheadofgroupprojects.From2013to2017,Mr SigristwastheCompany’sPresident&GeneralManager Europe, and prior to joining the Company heworked as a consultant.Mr Sigristholdsabachelor’sdegreeinbusinessadministrationfromtheZurichUniversityofApplied Sciences, an MBA from the University of Toronto and a Global Executive MBA from the UniversityofSt.Gallen.Mr SigristisalsoaSwisscertifiedpublicaccountant.
Ian WoodisaBritishcitizenandjoinedSIGin2018asChiefSupplyChainOfficerandbecameCTO in2020.Previously,Mr Woodspent15yearsatHoneywell, initially in thesupplychainfunction and later as vice president & general manager of various business units within the home &buildingtechnologiessegment.PriortojoiningHoneywell,Mr WoodworkedatA.T.KearneyandFordMotorCompany.Mr Woodholdsamaster’sdegree inmanufacturingengineeringfromCambridgeUniversity,UKandanMBAfromCranfieldSchoolofManagement,UK.
Lawrence Fok is a Singaporean citizen and has served as President and General Manager of the Asia-PacificregionsincehejoinedtheCompanyin2012.PriortojoiningtheCompany,Mr Fokheld senior management positions at Norgren China, Alcan Global Pharmaceutical Packaging, SCAPackagingChinaandAvnetAsia.Mr Fokholdsabachelor’sdegreeinmechanicalengineering,an MSc in industrial & systems engineering from the National University of Singapore, and a Grad.Dip.infinancialmanagementfromtheSingaporeInstituteofManagement.
Ricardo Rodriguez is a Brazilian and Spanish citizen and has served as President and General ManageroftheAmericasregionsince2015.Mr RodriguezjoinedtheCompanyin2003andpreviously served as Director & General Manager, South America and Technical Service Director, SouthAmerica.PriortojoiningtheCompany,Mr RodriguezworkedatTetraPakinanumberof roles, including general manager of the Belo Horizonte branch, key account manager and technicalservicemanager.HeholdsaBScdegreeinaeronautical/mechanicalengineeringfromtheTechnologicalInstituteofAeronauticsinBrazil,anMBAfromtheGetúlioVargasFoundation,andgraduatedfromaspecialistbusinessmanagementcourseatIMD,Lausanne.
Martin Herrenbrück is a German citizen and has served as President & General Manager Europe from 2017 until 31 December 2020, when he left the Company. He previously heldthepositionofHeadofClusterEurope.SincejoiningSIGin2006,Mr HerrenbrückservedinavarietyofpositionsincludingHeadofClusterAsia-PacificSouth,HeadofGlobalMarketingandvariouscorporatedevelopmentroles.PriortojoiningSIG,heworkedatRolandBergerStrategyConsultantsinGermanyforseveralyears.Mr HerrenbrückholdsanMScinmanagementfromHHLLeipzigGraduateSchoolofManagementandanMBAfromtheKDISchoolofPublicPolicyandManagementinSeoul,SouthKorea.
Annual Report 2020
Governance Corporate Governance Report 84

8.2 Number of permissible activities
Intheinterestofgoodgovernance,theCompany’sArticlesofAssociationlimitthenumberofoutside mandates that may be held by members of the Group Executive Board as follows:
(i) uptoonemandateinlistedfirms2;
(ii) uptofivemandatesinnon-listedfirms;and
(iii) uptofivemandatesinfoundations,associations,charitableorganisationsandotherlegal entities.
Such a mandate is deemed to be any activity in the superior governing or administrative bodies of legal entities that are obliged to be registered in the commercial register or any comparable foreignregister,otherthantheCompanyandanyentitycontrolledbyorcontrollingtheCompany.TheBoardofDirectorsshallensurethatsuchactivitiesdonotconflictwiththeexercisingoftheirdutiesfortheGroup.Functionsinvariouslegalentitiesthatareunderjointcontrol,orinentitiesinwhichthislegalentityhasamaterialinterest,arecountedasonefunction.
8.3 Management agreements
The Company has not entered into any management contracts with persons outside the Group forthedelegationofexecutivemanagementtasks.
9. Compensation, shareholdings and loans
All details of compensation, shareholdings and loans are listed in the Compensation Report on pages94until114.
10. Shareholders’ rights of participation
10.1 Restrictions of voting rights and representation
Eachsharethatisenteredintheshareregisterentitlestheshareholdertoonevote.ThevotingrightsmaybeexercisedonlyafterashareholderhasbeenregisteredintheCompany’sshareregisterasashareholderwithvotingrightsuptoaspecificqualifyingday(recorddate)whichisdesignatedbytheBoardofDirectors.Onapplication,personsacquiringsharesareenteredinthe share register as shareholders with voting rights without limitations, provided they expressly declare having acquired the shares in their own name and for their own account and that they complywiththedisclosurerequirementstipulatedbytheFMIA.EntryintheshareregisterofregisteredshareswithvotingrightsissubjecttotheapprovaloftheCompany.
Entrymayberefusedbasedonthegroundsset forth inart.7para.3,para.4,para.5andpara.6oftheArticlesofAssociation.TherespectiveruleshavebeendescribedinSection 2.5“Limitationsontransferabilityandnomineeregistrations”ofthisCorporateGovernanceReport.IftheCompanydoesnotrefusetoregistertheapplicantacquirerasashareholderwithvotingrightswithin20calendardaysuponreceiptoftheapplication,theacquirerisdeemedtobea
2 Pursuanttoart.727para.1number1CO.
Annual Report 2020
Governance Corporate Governance Report 85

shareholderwithvotingrights.Acquirersthatarenoteligibleforregistrationareenteredintheshareregisterasshareholderswithoutvotingrights.ThecorrespondingsharesareconsideredasnotrepresentedintheGeneralMeeting.Arevocationofthestatutoryrestrictionsofvotingrights requires the approval of a simple majority of votes cast, regardless of the number of shareholderspresentorshares represented.Abstentionsand invalidvotesdonotcountasvotescast.
The rights of shareholders to participate in General Meetings comply with legal requirements and the Articles of Association (https://www.sig.biz/investors/en/governance/articles-of-association).EveryshareholdermaypersonallyparticipateintheGeneralMeetingandcasthis/hervote(s),orbe represented by a proxy appointed in writing, who need not be a shareholder, or be represented bytheindependentproxy.Shareholdersmayissuetheirpowerofattorneyandinstructionstotheindependentproxybypostorelectronically.Theindependentproxyisobligedtoexercisethevotingrightsthataredelegatedtohim/herbyshareholdersaccordingtotheirinstructions.Shouldhe/shehavereceivednoinstructions,he/sheshallabstainfromvoting.
On an annual basis, the Annual General Meeting elects the independent proxy with the right ofsubstitution.His/hertermofofficeterminatesattheconclusionofthenextAnnualGeneralMeeting.Re-electionispossible.ShouldtheCompanyhavenoindependentproxy,theBoardofDirectorsshallappointanindependentproxyforthenextAnnualGeneralMeeting.
10.2 Quorum requirements
UnlessaqualifiedmajorityisstipulatedbylawortheArticlesofAssociation,theGeneralMeetingmakes its decisions on the basis of the relative majority of valid votes cast, regardless of the numberofshareholderspresentorsharesrepresented.Abstentionsandblankvotesdonotcountasvotes.Resolutionsrequiretheapprovalofasimplemajorityofvotesrepresented.
10.3 Convening the Annual General Meeting
The Annual General Meeting is convened by the Board of Directors or, if necessary, by the Company’sindependentauditors.ExtraordinaryGeneralMeetingsmaybeheldwhendeemednecessaryby theBoardofDirectorsor theCompany’sauditors.LiquidatorsmayalsocallaGeneralMeeting.Furthermore,ExtraordinaryGeneralMeetingsmustbeconvenedifresolvedataGeneralMeetingoruponwrittenrequestbyoneormoreshareholder(s)representinginaggregateatleast10%oftheCompany’ssharecapitalregisteredwiththecommercialregister.
GeneralMeetingsareconvenedbypublicationintheSwissOfficialGazetteofCommerceatleast20dayspriortothedateofthemeeting.Suchpublicationandlettersofinvitationmustindicate the date, time and venue of the meeting, the items on the agenda, and the wording of any motions proposed by the Board of Directors or by shareholders who have requested the conventionofaGeneralMeetingortheinclusionofanitemonthemeeting’sagenda.
10.4 Inclusion of agenda items
TheBoardofDirectorsisresponsibleforspecifyingtheagenda.Registeredshareholderswithvoting rights individually or jointly representing at least 5%of the Company’s share capitalorshareswithanominalvalueofatleastCHF 1millionmayrequestthatanitembeplacedon the agenda of a General Meeting of the Company, provided they submit details thereof totheCompanyinwritingatleast45calendardaysinadvanceoftheshareholders’meetingconcerned.
Annual Report 2020
Governance Corporate Governance Report 86

10.5 Registration in the share register
Only shareholders who are registered in the share register as shareholders with voting rights on aspecificqualifyingday(recorddate)designatedbytheBoardofDirectorsareentitledtoattendaGeneralMeetingandtoexercisetheirvotingrights.IntheabsenceofarecorddatedesignatedbytheBoardofDirectors,therecorddateshallbetendayspriortotheGeneralMeeting.
11. Change of control and defence measures
11.1 Duty to make an offer
Art.9oftheCompany’sArticlesofAssociationprovidesfora“selectiveopting-out”,accordingtowhich the Onex Persons1 are, acting individually or in joint agreement with other Onex Persons, exemptedfromtheobligationtosubmitapublictakeoverofferpursuanttoart.135para.1FMIAinrespectofthefollowingcircumstances:
a) transactionsinsharesorotherreportablesecuritiesunderFMIA(i)betweenanyOnexPersonand(ii)betweenanyOnexPersonontheonehandandanymemberoftheBoardofDirectorsorthemanagementoftheCompanyoroftheSIG Groupontheotherhand;
a) anyotherarrangementsbetweenthepersonsmentionedin(a)abovepotentiallytriggeringtheobligationtosubmitapublictakeoveroffer;and
b) anychangeoftheholderofmultiplevotingshares(MVS)ofOnexCorporationheldbyitspresidentandCEO,GeraldW.Schwartz,butnotanychangeofcontrolinthesubordinatedvoting shares (SVS) ofOnexCorporation that are publicly tradedon the Toronto StockExchange.
11.2 Change of control clauses
There are no change of control provisions in favour of any member of the Board of Directors and/ortheGroupExecutiveBoardand/orothermanagementpersonnel.However,intheeventof a change of control, restricted share units, performance share units as well as shares subject to transfer restrictions or vesting periods granted to members of the Board and the Group Executive Board may be subject to accelerated vesting or early lifting of restrictions under the applicableplans.2
12. Auditors
12.1 Duration of the mandate and term of office of the auditor in charge
TheauditorsareelectedannuallyattheAnnualGeneralMeetingforoneyear.Thegroundsforselection of external auditors are customary criteria such as independence, quality, reputation andcostofservices.PricewaterhouseCoopers AG,St.Jakobstrasse25,4002Basel,Switzerland(“PwC”)havebeenthestatutoryauditorsoftheCompanysincethemigrationoftheCompany
1 OnexPartnersIVLP,GeorgeTown,CaymanIslands;OnexPartnersIVPVLP,Wilmington,Delaware,UnitedStatesofAmerica;Onex PartnersIVSelectLP,GeorgeTown,CaymanIslands;OnexPartnersIVGPLP,GeorgeTown,CaymanIslands;OnexUSPrincipals LP,Wilmington,Delaware,UnitedStatesofAmerica;OnexPartnersHoldingsLimitedSARL,Munsbach,GrandDuchyofLuxembourg;OnexAdvisorSubcoLLC,Delaware,UnitedStatesofAmerica;OnexSIGCo-InvestLP,GeorgeTown,CaymanIslands;WizardManagementIGmbH&Co.KG,Munich,GermanyandWizardManagementIIGmbH&Co.KG,Munich,Germany,aswellasall othercompaniesdirectlyorindirectlyheldnoworinthefuturebyOnexCorporation,Toronto,Ontario,Canada.
2 Forfurtherinformationoncompensationwithrespecttoachangeofcontrolpleaserefertopage108oftheCompensationReport.
Annual Report 2020
Governance Corporate Governance Report 87

fromLuxembourgtoSwitzerlandon27September2018andwerere-electedattheAGM 2020.Prior to theCompany’smigration, the independentregisteredauditors (réviseur d’entreprises agréé) of SIG Combibloc Group AG (formerly SIG Combibloc Group Holdings S.à r.l.) werePricewaterhouseCoopers, Société cooperative, Luxembourg, who have been the independent registeredauditorsoftheCompanysincetheperiodended31 December 2015.ThemainGroupcompaniesarealsoauditedbyPwC.
BrunoRossi(auditexpert)asauditorinchargehasbeenresponsibleforauditingthefinancialstatementsoftheCompanyaswellastheconsolidatedfinancialstatementsoftheGroupsinceMarch2020.TheleadauditorhastorotateeverysevenyearsinaccordancewithSwisslaw.
12.2 Fees
The fees charged by PwC as the auditors of the Company and of the Group companies audited bythem,aswellastheirfeesforaudit-relatedandadditionalservices,areasfollows:
(inCHF1,000) 2020
Audit 1,490
Audit-relatedservices 278
Tax and other services 165
Total 1,933
12.3 Informational instruments pertaining to the auditors
The Board exercises its responsibilities for supervision and control of the external auditors throughtheAuditandRiskCommittee.TheAuditandRiskCommitteeassessestheprofessionalqualifications,independence,qualityandexpertiseoftheauditorsaswellasthefeespaidtothemeach year andprepares an annual appraisal. It recommends to theBoardproposalsfor thegeneral shareholdersmeeting regarding theelectionordismissal of theCompany’sindependentauditors.Theassessmentof theperformanceof theexternalauditor isbasedonkeycriteria,suchasefficiencyoftheauditprocess,validityoftheprioritiesaddressedintheaudit, objectivity, scope of the audit focus, quality and results of the audit reports, resources used and the overall communication and coordination with the Audit and Risk Committee andGroupExecutiveBoardaswellastheauditfees.TheAuditandRiskCommitteefurthercoordinatescooperationbetweentheexternalauditorsandtheinternalauditors.
Priortotheaudit,theauditorsagreetheproposedauditplanandscope,approach,staffingandfeesoftheauditwiththeAuditandRiskCommittee.SpecialassignmentsfromtheBoardofDirectorsarealsoincludedinthescopeoftheaudit.
PwC presents to the Audit and Risk Committee, on an annual basis, a comprehensive report ontheresultsoftheauditoftheconsolidatedfinancialstatements,thefindingsonsignificantaccountingandreportingmatters,andfindingsonthe internalcontrolsystem, includinganysignificantchangesintheCompany’saccountingprinciples,theselectionanddisclosureofcriticalaccountingestimates,andtheeffectofalternativeassumptions,estimatesoraccountingprinciplesontheCompany’sfinancialstatementsaswellasthestatusoffindingsandrecommendationsfrompreviousaudits.TheresultsandfindingsofthisreportarediscussedindetailwiththeCFOand the Audit and Risk Committee where representatives of the auditor explain their activities andrespondtoquestions.TheAuditandRiskCommitteealsomonitorswhetherandhowtheGroupExecutiveBoardimplementsmeasuresbasedontheauditor’sfindings.
Annual Report 2020
Governance Corporate Governance Report 88

Each year, the Audit and Risk Committee evaluates the effectiveness of the external audit,performance, fees and independence of the auditors and the audit strategy. TheBoard ofDirectorsdiscussesandreviewsthescopeoftheauditsandtheresultingreports.Onthisbasis,itdecidesonanychangesorimprovementstobemade.RepresentativesoftheauditorattendindividualmeetingsorindividualagendaitemsofmeetingsoftheAuditandRiskCommittee.There is also regular contact between the auditors, the Group Executive Board, and the Audit and RiskCommitteeoutsideofmeetings.PwCasexternalauditoroftheGrouppartiallyattendedallfiveAuditandRiskCommitteemeetingsin2020atwhichtheydiscussed,amongothertopics,thescopeoftheauditandcertainauditresults.
Additional services or consulting assignments are delegated to the auditors only if they are permittedbylawandtheauditor’scodeofindependence.Theauditorsarerequiredtoconfirmthattheirperformanceoftheseadditionalserviceswillnotaffectthe independenceoftheirauditingmandate.TheAuditandRiskCommitteepre-approvesallpermittednon-auditservicesperformed by the auditors, and reviews the compatibility of non-audit services performedby themwith their independence requirements.Thisprocedure isaimedatensuringPwC’sindependence in their capacity as auditors to the Group. PwCmonitors its independencethroughouttheyearandconfirmsitsindependencetotheAuditandRiskCommitteeannually.
13. Information policy
The Group is committed to communicating in a timely and transparent way to shareholders, potentialinvestors,financialanalystsandcustomers.Tothisend,theBoardofDirectorstakesan active interest in fostering good relations and engagement with shareholders and other stakeholders.Inaddition,theCompanycomplieswithitsobligationsundertherulesofSIXSwissExchange, including the requirements on the dissemination ofmaterial and price-sensitiveinformation.
TheGrouppublishesanannualreportthatprovidesauditedconsolidatedfinancialstatements,audited financial statements and information about the Company including the businessresults,strategy,productsandservices,corporategovernanceandexecutivecompensation.Theannualreportispublishedwithinfourmonthsafterthe31 December balancesheetdate.Theannualresultsarealsosummarizedintheformofapressrelease.Inaddition,theCompanyreleasesresultsforthefirsthalfofeachyearwithinthreemonthsafterthe30Junebalancesheetdate.Thepublishedhalf-yearandannualconsolidatedfinancialstatementscomplywiththerequirementsofSwisscompanylaw,thelistingrulesofSIXSwissExchangeandInternationalFinancialReportingStandards(“IFRS”).Furthermore,theGrouppublishestradingstatementsfor thefirstand thirdquarters in the formofapress release.Thequarterlypress releasescontainunauditedfinancialinformationpreparedinaccordancewithIFRS.
TheCompany’sannualreport,half-yearreport,andquarterlyreleasesaredistributedpursuanttotherulesandregulationsofSIXSwissExchangeandareannouncedviapressreleasesandinvestorconferencesinpersonorviatelephone.Anarchivecontainingannualreports,half-yearreports, quarterly releases, and related presentations can be found at https://investor.sig.biz.
In addition, the Company publishes a corporate responsibility report on an annual basis,producedinaccordancewiththeGlobalReportingInitiative(GRI)G4GuidelinesCoreoption.An archive containing corporate responsibility reports can be found in the “Responsibility”section athttps://www.sig.biz/investors/en/performance/corporate-responsibility-report.
The Group reports in accordance with the disclosure requirements of art. 124 FMIA andtheadhocpublicationrequirementsofart.53of the listingrulesofSIXSwissExchange.At https://investor.sig.biz/en-gb/contact/, interested parties can register for the free Company email
Annual Report 2020
Governance Corporate Governance Report 89

distributionlistinordertoreceivedirect,up-to-dateinformationatthetimeofanypotentiallyprice-sensitive event (ad hoc announcements). Ad hoc announcements may be viewed athttps://www.sig.biz/investors/en/news-events/media-releasesat thesametimeasnotificationtoSIXSwissExchangeandfortwoyearsthereafter.
Noticestoshareholdersaremadebypublication intheSwissOfficialGazetteofCommerce(Schweizerisches Handelsamtsblatt).TotheextenttheCompanycommunicatestoitsshareholdersby mail, such communications will be sent by ordinary mail to the recipient and address recorded intheshareregisterorinsuchotherformastheBoardofDirectorsdeemsfit.
The Company’s website:https://www.sig.biz
Ad hoc announcements (pull system):https://www.sig.biz/investors/en/news-events/media-releases
Subscription for ad hoc announcements (push system):At https://www.sig.biz/investors/en/contact
Financial reports:https://www.sig.biz/investors/en/performance/historical-financial-statements
Corporate responsibility reports:https://www.sig.biz/investors/en/performance/corporate-responsibility-report
Corporate calendar:https://www.sig.biz/investors/en/news-events/overview
Contact address:
TheSIGCombiblocGroupInvestorRelationsDepartmentcanbecontactedthroughthewebsiteorbytelephone,emailorletter.
SIGCombiblocGroup AGLaufengasse188212NeuhausenamRheinfall,Switzerland+41(52)[email protected]
Financial calendar
Keydatesfor2021include:
2020full-yearresults 23February2021
Intendedpublicationofinvitationtothe2021AnnualGeneralMeeting 26March2021
2021AnnualGeneralMeeting 21April2021
Releaseoffirstquarter2021keyfinancialdata 4May2021
Publicationof2021half-yearreport2021 27July2021
Releaseofthirdquarter2021keyfinancialdata 27October2021
Annual Report 2020
Governance Corporate Governance Report 90

COMPENSATION92 Letter from the Chairwoman
of the Compensation Committee
94 Compensation Report1. Introduction2. Compensationgovernance3. Compensationprinciples4. Compensationframework
for the BoardofDirectors5. Compensationframework
for the GroupExecutiveBoard6. ShareholdingGuidelines7. Previousanddiscontinued
compensation plans8. Loansgrantedtomembers
of the BoardofDirectorsorthe GroupExecutiveBoard
9. Outlookfor2021
115 Report of the statutory auditor
Annual Report 2020
91

Colleen GogginsChairwoman of the Compensation Committee
LETTER FROM THE CHAIRWOMAN OF THE COMPENSATION COMMITTEE
Dear Shareholders,
On behalf of the Board of Directors and the Compensation Committee, I am pleased tointroducetheCompensationReportofSIGCombiblocGroupAG(“SIG”orthe“Company”)fortheyearended31December2020.Thisreportoncompensationcomplementsourbusiness,financialandcorporategovernancereportsanddescribesSIG’scompensationsystemanditsgovernance, as well as the underlying principles that ensure that compensation, particularly the variablecomponents,arelinkedtotheoverallperformanceofSIG.
TheprinciplesguidingSIG’scompensationframeworkaretoattract,engageandretainexecutivesand employees, to drive sustainable performance and to encourage behaviours that are in line withSIG’svaluesaswellaswiththelong-terminterestsofshareholders.TheCompensationCommittee regularly assesses, reviews and develops the compensation framework to ensure thatitisalignedwiththeseprinciples.
SIGwelcomesfeedbackfromitsshareholders.In2020,weincreasedthelevelofengagementwith shareholders and worked to consider and address shareholders’ comments andquestions.Asyouwillreadinthe2020CompensationReport,certainchangesandadditionswillbeincorporatedfrom2021onwards.Theseincludetheadditionofaclawbackmechanismintheequity-basedLong-TermIncentivePlan(“LTIP”),anESGmetricintheShort-TermIncentivePlan(“STIP”),increasedlevelsofdisclosureregardingnon-competeprovisionsaswellashighertransparencyregardingattainmentofcompensation-relevantperformancemetrics.
Annual Report 2020
Compensation Letter from the Chairwoman of the Compensation Committee 92
To create a stronger shareholder alignment and performance orientation within the broader leadershipteambelowtheGroupExecutiveBoard,anEquityInvestmentPlanwassuccessfullyimplemented in2020. Inaddition to fosteringstrongshareholderalignmentalsobelow theGroup Executive Board level, the planwill enhance SIG’s attractiveness as an “employer ofchoice”inanincreasinglycompetitiveemploymentmarket.
The principle of equal pay recognises that women and men are entitled to equal pay for performing work of equal value. In 2020, equal pay gained increasing attention from theCompensationCommittee,asnewregulatorydevelopmentsshapethegloballandscape.TheCompensation Committee has reviewed the gender pay analysis of our main Swiss company, conductedbyanindependentthirdparty.WearehappytoreportthattheanalysisconfirmedthatSIGiscompliantwiththerequirementsofSwisslaw.TheCompensationCommitteewillfurthermonitorthistopicinaninternationalcontext.
At theupcomingAnnualGeneralMeeting (“AGM”),wewillaskourshareholders toapproveprospectively, in binding votes, the maximum aggregate amount of compensation for the Board ofDirectorsuntilthenextAGMin2022andthemaximumaggregateamountofcompensationfortheGroupExecutiveBoardfortheyear2022.Further, thisCompensationReportwillbesubmittedtoshareholdersforanon-binding,consultativevote.
We believe that this report includes all relevant information regarding SIG's compensationsystem and that our remuneration system rewards performance in a balanced and sustainable mannerthatalignswellwithshareholders’interestsandmakesSIGanattractiveemployer.
OnbehalfofSIG,theCompensationCommitteeandtheentireBoardofDirectors,Iwouldliketothankyou,ourshareholders,foryourcontributionsandyourcontinuedtrustinSIG.
Colleen GogginsChairwoman of the Compensation Committee
Annual Report 2020
Compensation Letter from the Chairwoman of the Compensation Committee 93

COMPENSATION REPORT
1. Introduction
This Compensation Report has been prepared in compliance with Swiss laws and regulations, including the Ordinance against Excessive Compensation in Listed Stock Companies. ThereportisinlinewiththeDirectiveonInformationrelatingtoCorporateGovernanceofSIXandalso takes into account the recommendations set out in the Swiss Code of Best Practice for CorporateGovernanceofeconomiesuisse.
The Compensation Report contains the following information:
• AdescriptionofthecompensationgovernanceandcompensationframeworkatSIG• ThecompensationofthemembersoftheBoardofDirectors(“Board”)for2020• ThecompensationoftheGroupExecutiveBoard(“GEB”)for2020
2. Compensation governance
FIGURE 1: COMPENSATION GOVERNANCE AT SIG
The compensation governance structure at SIG involves three primary bodies, as depictedin Figure 1: (1) the Board, (2) the Compensation Committee (“CC”), acting in an advisorycapacityfortheBoardand(3)SIG’sshareholdersattheAnnualGeneralMeeting(“AGM”).TheCompensationCommitteeCharterandtheArticlesofAssociationoutlineanddefinetherolesandresponsibilitiesofthesebodies.Figure2showstherelevantprovisionsoncompensationintheArticlesofAssociation.
Annual General Meeting(“AGM”)
Articles of Association
CompensationCommittee
Charter
approve Board of Directors &
Compensation Committee
Compensation governance
decisions by …defined in
defined in
Annual Report 2020
Compensation Compensation Report 94

FIGURE 2: RELEVANT PROVISIONS ON COMPENSATION IN THE ARTICLES OF ASSOCIATION OF SIG
Principles for the compensation of the members of the Board of Directors and the Group Executive Board (Art. 24 to 26)
MembersoftheBoardofDirectorsreceivefixedcompensation,whilemembersoftheGroupExecutiveBoardreceivefixedandvariablecompensation.Thevariablecompensationmayincludeshort-termandlong-termvariablecompensationcomponents.Thesearegoverned by quantitative and qualitative performance criteria that take into account the performanceofSIG.
Compensation approvals by the General Meeting (Art. 27)
The AGM has the authority to approve the maximum aggregate amount of compensation for theBoardofDirectorsfortheensuingtermofofficeandthemaximumaggregateamountofcompensationfortheGroupExecutiveBoardforthefollowingyear.
Supplementary amounts available for members joining the Group Executive Board or being promoted within the Group Executive Board to CEO after the relevant approval of compensation by the AGM (Art. 27, para. 4)
SIGisauthorisedtopaycompensationtosuchmembersoftheGroupExecutiveBoardwithout further approval even in excess of the maximum aggregate amount approved by the AGM for the relevant year, provided that the sum of such excess amount is not greater than 40%oftheapprovedmaximumaggregateamountofcompensationfortheGroupExecutiveBoardforsuchyear.
Retirement benefits (Art. 30) SIGmayestablishorjoinoneormoreindependentpensionfundsforoccupationalpensionbenefits.Insteadorinaddition,SIGmaydirectlyofferretirementbenefits(suchaspensions,purchaseofhealthcareinsurances,etc.)outsideofthescopeofoccupationalpensionbenefitregulationstomembersoftheGroupExecutiveBoardandmaypaythemoutafterretirement.
TheArticlesofAssociationcanbefoundontheSIGhomepageforinvestors https://www.sig.biz/investors/en/governance/articles-of-association or downloaded directly here:https://cms.sig.biz/media/6815/aoa-sig-combibloc-group-ag-2020_04_07.pdf.
The roles of the AGM and the Compensation Committee are described in more detail in the following paragraphs. The general split of responsibilities and authorities between theBoard,theCompensationCommitteeandtheAGMisillustratedinFigure3.
FIGURE 3: AUTHORITY TABLE REGARDING COMPENSATION
CEOCompensation
CommitteeBoard ofDirectors AGM
Compensationprinciples(ArticlesofAssociation) Approval(subjectto
AGMapproval)
Approval(incaseofchanges,
bindingvote)
Compensation strategy and guidelines Proposal Approval
Key terms of compensation plans and programmes for members of the Board of Directors and Group Executive Board
Proposal Approval
Total compensation for members of the Board of Directors Proposal Approval(subjectto
AGMapproval)
Approval(bindingvote)
Totalcompensationandbenefitsformembers of the Group Executive Board
Proposal Approval(subjectto
AGMapproval)
Approval(bindingvote)
Employment and termination agreements for the CEO Proposal Approval
Employment and termination agreements for members of the Group Executive Board
Proposal Review Approval
Compensation Report Proposal Approval Approval(consultativevote)
IndividualtotalcompensationoftheCEO Proposal Approval
Individualtotalcompensationofothermembers of the Group Executive Board
Proposal Review Approval
Annual Report 2020
Compensation Compensation Report 95

Role of the shareholders – shareholder engagement
InlinewithSIG’sArticlesofAssociation,particularlyArt.11andArt.27,theBoardwillsubmitthreeseparatecompensation-relatedresolutionsforshareholderapprovalatthe2021AGM,asillustrated in Figure 4:
FIGURE 4: OVERVIEW OF VOTES AT THE 2021 AGM
Role of the Compensation Committee – activities during 2020
TheCompensationCommitteeconsistsofthreeindependent,non-executiveBoardmemberswhoareelectedannuallyandindividuallybytheAnnualGeneralMeetingforaone-yeartermuntilthefollowingAnnualGeneralMeeting.ThemainroleoftheCompensationCommitteeistoassisttheBoardinfulfillingitsresponsibilitiesrelatingtothecompensationofthemembersoftheBoardandtheGroupExecutiveBoardofSIG.TheCompensationCommitteesupportsthe Board in discharging its duties, proposes guidelines regarding the compensation of the membersoftheBoard,theChiefExecutiveOfficer(“CEO”)andtheothermembersoftheGroupExecutive Board, proposes the maximum aggregate amounts of compensation to be submitted to the Annual General Meeting for approval, and assists the Board in preparing the related motionsfortheAnnualGeneralMeeting.
The Compensation Committee Chairwoman ensures that the Board members are kept informed in a timely and appropriate manner of all material matters within the Compensation Committee'sareaofresponsibility.
The Compensation Committee Chairwoman convenes the meetings of the Compensation Committee as often as the business affairs of SIG require, but at least three times a year.In 2020,theCommitteeheldsixmeetings.BecauseoftravellingrestrictionsduetotheCOVID-19pandemic,allmeetingsafterMarch2020wereheldasvideoconferences.ThetopicscoveredaredescribedinFigure5.DetailsontheCompensationCommitteemembersareprovidedintheCorporateGovernanceReportonpage77.AllmembersoftheCommitteehadfullmeetingattendanceduring2020.
2020 2021 2022
Board vote (Binding)
Group Executive Board vote
(Binding)
Report vote (Consultative)
AGM 2022AGM 2021
Vote at AGM 2021
Compensation ReportFY 2020
Vote at AGM 2021
Maximum aggregate amount for FY 2022
Vote at AGM 2021
Maximum aggregate amount for the termAGM 2021 – AGM 2022
Annual Report 2020
Compensation Compensation Report 96

FIGURE 5: TOPICS COVERED BY THE COMPENSATION COMMITTEE IN 2020
Agenda Item Jan Feb Jul Sep Oct Dec
Principles and design of compensation plans
Marketintelligence(recentdevelopmentsincompensation,legal,governancelandscapes)
Long-termincentiveframeworkfor2020 and onwards to enlarge participants group –Proposal to the Board of Director to implementEquityInvestmentPlan
Review and update of the Performance Share Plan regulation – Proposal to the Board of Directors to introduce a clawback clause
Compensation Group Executive Board
Short-TermIncentivePlan
– Targetachievement2019
– Targetsetting2020
– General target framework review
– DefineKPImeasures2021,includinganESGtarget
Long-TermIncentivePlan–Recommendationofplanparticipantsandtargetsettingforgrant2020
Review target compensation for the CEO andtheGroupExecutiveBoardfor2021
Compensation Board of Directors
Review compensation for the Board of Directors
General framework
Shareholding Guidelines Assessment
Review key terms of current and future employment contracts for members of the Group Executive Board
Gender Pay Analysis according to new Swiss Law
Communication AGM invitation including determination of the maximum amounts of compensation for the Board ofDirectors(forthetermAGM2020toAGM2021) andtheGroupExecutiveBoard(year2021)
Analysis of the compensation voting results oftheAGMandtheproxyadvisors’feedback
Compensation Report
A performance review of members of the Board and of the Group Executive Board was conductedbytheNominationandGovernanceCommitteeduring2020withthemembersoftheCompensationCommitteeinattendancesothatclosecoordinationwasensured.Inadditiontotheordinarymeetings,assummarisedinFigure5,theCompensationCommitteesetupadhoc conference calls at short notice, for example, to discuss tasks related to personnel changes intheGroupExecutiveBoard.
The Compensation Committee may ask members of the Group Executive Board, one or more senior managers in the human resources function and third parties to attend meetings in anadvisory capacityandmayprovide themwithall appropriate information.However, theCompensation Committee also regularly holds private sessions (i.e. without the presenceof members of the Group Executive Board, senior managers or third parties). Further, allmembersof theBoardmayattendanycommitteemeetingasguests.TheChairmanof theBoardandtheCEOdidnotattendthemeetingwhentheirowncompensationwasdiscussed.The Chairwoman of the Compensation Committee reported to the Board after each meeting on the substance of the meeting and explained the proposals of the Compensation Committee to theBoardofDirectors.Alldocumentsand theminutesof theCompensationCommitteemeetingsareavailabletoallmembersoftheBoard.TheCompensationCommitteemaydecideto consult external advisers for specific compensationmatters. In 2020, the CompensationCommitteeappointedHCMInternationalLtd.(“HCM”)asanexternalindependentadviseron
Annual Report 2020
Compensation Compensation Report 97

certaincompensationmattersaswellasontargetsettingfortheLong-TermIncentivePlan,asdescribedinthesectionLong-TermIncentivePlan.Otherthanfortheaforementionedadviceoncompensationmatters,HCMwasnotappointedforanyothermandatesin2020.
3. Compensation principles
ThecompensationframeworkofSIGreflectsthecommitmenttoattract,engageandretaintoptalentgloballyandtoaligntheinterestsofSIGleaderswiththoseofshareholders.SIG’soverallcompensationframeworkislong-terminnatureanddesignedtorewardoutperformanceandeffectively addressunderperformance,withperformancedefined relative to targets and, insomecases,relativetopeers.SIGendeavourstomakeitscompensationprinciplessimpleandtransparentforthebenefitofshareholders,theBoardandmanagement.ThecompensationprinciplesareillustratedinFigure6.
FIGURE 6: SIG COMPENSATION FRAMEWORK, OBJECTIVES AND PRINCIPLES
ToassessSIG’scompensationsystemnotonlyfromaninternalequityperspectivebutalsofroman external competitiveness perspective, compensation is regularly benchmarked against that ofsimilarrolesincomparablecompanies.TheCompensationCommitteeusesthisanalysistoreview the composition, the level as well as the structure of the compensation of the Board and theGroupExecutiveBoardonaregularbasis.
FortheBoard,Swiss-listedindustrialcompaniesareconsideredthemostrelevantreferencemarketforcompensationcomparison,reflectingthespecificgovernanceregimeandregulatoryaspects of the Swiss market1. For the Group Executive Board, a broader industry-relatedEuropean comparator group is considered appropriate to assess compensation practices, structureandpaylevelsgivenSIG’sinternationalfootprintandreflectingtherecruitingmarket2.Inbothcases,sizecriteriaapply.
Objectives and principles
Be competitive to attract and retain top
talent and at the same time be reasonable in terms of amount and
composition
Be balanced in terms of weight between base salary, STIP
and LTIP
Be long-term as well as simple
and transparent
Be developed to reward
outperformance and effectively tackle
underperformance
Be fully compliant with relevant laws
and regulations
Be aligned with shareholders'
interests
1 The comparison group used for the most recent compensation benchmarking analysis of the Board consisted of the following Swiss listedindustrialcompanies:ARYTZA,BarryCallebaut,BKW,Bucher,Clariant,DKSH,dormakaba,Dufry,FlughafenZuerich,Geberit,GeorgFischer,OCOerlikon,SFSGroup,Straumann,Sulzer,Sunrise,ViforPharma.
2 ThecomparisongroupusedforthecompensationbenchmarkinganalysisoftheGroupExecutiveBoardinitiallyconductedin2018andupdatedin2019consistedofthefollowingcomparators:Aalberts,AMS,ARYTZA,BarryCallebaut,BKW,Bucher,Clariant,DKSH,DMGMORI,dormakaba,Duerr,Dufry,FlughafenZuerich,GEA,GeorgFischer,IMI,Kingspan,OCOerlikon,SFSGroup,Spirax-Sarco,Straumann,Sulzer,ViforPharma,Weir.
Annual Report 2020
Compensation Compensation Report 98

Figure 7 provides an overview of the compensation elements for the Board and theGroup ExecutiveBoard:
FIGURE 7: OVERVIEW OF COMPENSATION ELEMENTS FOR THE BOARD OF DIRECTORS AND THE GROUP EXECUTIVE BOARD
Board of Directors Group Executive Board
Fixe
d co
mpe
nsat
ion
elem
ents
Annual base salary
Annual base fee
Annual Committee fee
Pension contributions
Otherbenefits
Vari
able
co
mpe
nsat
ion
elem
ents
Short-TermIncentivePlan
Long-TermIncentivePlan
Additionaldetailsforeachcompensationelementareincludedlaterinthisreport.
4. Compensation framework for the Board of Directors
Compensation overview for the Board of Directors
TounderlinetheroleoftheBoardtoperformindependentoversightandsupervisionofSIG,theentirecompensationoftheBoardisfixedanddoesnotcontainanyvariablepaycomponent.
The compensation for the members of the Board of Directors is composed of two components: a fixedannualbasefeeandfixedannualcommitteefee(s)forassumingtheroleoftheChairpersonofaBoardcommitteeorasamemberofBoardcommittees.OnlyordinarymembersoftheBoardareentitledtotheadditionalcommitteefees.ThecompensationoftheChairmanoftheBoardconsistsoftheannualbasefeeonly.Requiredemployeesocialsecuritycontributionsundertherelevantcountry’sapplicablelawareincludedinthecompensation.Noadditionalcompensationcomponentssuchaspensionentitlements,lump-sumexpensesorattendancefeesareawardedtothemembers.ThecompensationlevelsforthemembersoftheBoardofDirectorsremainedunchangedfromthoseestablishedin2018.
Annual Report 2020
Compensation Compensation Report 99

The amount of the annual base fee and annual committee fees for the Chairperson and the membersoftherespectivecommitteesareillustratedinFigure8.
FIGURE 8: OVERVIEW OF THE BOARD OF DIRECTORS' FEES
Annual basefee (in CHF,
gross)
Annual committee fees (in CHF, gross)
Audit and Risk CompensationNomination and
Governance
Chair Member Chair Member Chair Member
Chairperson 550,000 Not entitled
Ordinary member 175,000 50,000 25,000 40,000 15,000 40,000 15,000
The individual sum of the annual base fee and, where applicable, the annual committee fee per memberispaid60%incashand40%inblockedSIGshares.
Theequitycomponentisintendedtofurtherstrengthenthelong-termfocusoftheBoardinperformingitsdutiesandtoaligntheBoardmembers’interestswiththoseofSIG’sshareholders'.Both the cash and share elements are paid out in arrears on a quarterly basis in four equal instalments.A three-yearblockingperiod is applied to theSIG shares, expiringat the thirdanniversaryofeachrespectivegrant.ThisapproachisillustratedinFigure9.
FIGURE 9: COMPENSATION APPROACH OF THE BOARD OF DIRECTORS
Pay mix Term Term +1 Term +2 Term +3
Share element
Cash element
Share element
Cashelement60%
40% 3-year blocking period
Annual Report 2020
Compensation Compensation Report 100

Compensation awarded to the Board of Directors (Audited)
Table 1 summarises the compensation for 2020 of the seven non-executive members oftheBoard.As inprevious years,NigelWright is associatedwithOnexCorporation, amajorshareholderofSIGthroughoutalargerpartof2020,andwaivedanyformofcompensationforhisserviceontheBoardin2020.
TABLE 1: TOTAL COMPENSATION OF THE BOARD OF DIRECTORS IN 2020 (1 JANUARY–31 DECEMBER) INCLUDING INFORMATION OF THE PRIOR YEAR
Members of the Board of Directors on 31 December 2020
Board member-
ship ARC1 CC2 NGC3Settled in
cash, CHF4
Settled in SIG shares,
CHF5
Social security
payments, CHF6
Total com-pensation earned in 2020, CHF
Total com-pensation earned in 2019, CHF
Andreas Umbach Chair 330,000 220,032 37,596 587,628 586,859
Matthias Währen Chair 135,000 90,040 12,784 237,824 237,506
Colleen Goggins Chair 129,000 86,029 12,166 227,195 229,120
Werner Bauer 129,000 86,029 12,166 227,195 226,899
Wah-HuiChu 123,000 82,051 11,550 216,601 218,424
Mariel Hoch 129,000 86,029 15,347 230,376 230,056
Nigel Wright Chair – – – – –
Total 975,000 650,210 101,609 1,726,819 1,728,865
1 AuditandRiskCommittee.
2 CompensationCommittee.
3 NominationandGovernanceCommittee.
4 Representsgrossamountspaid,priortoanydeductionssuchasemployeesocialsecurityandincomewithholdingtax.
5 RepresentsgrossamountssettledinblockedSIGshares,priortoanydeductionssuchasemployeesocialsecurityandincomewithholdingtax.ThenumberofblockedSIGsharesisdeterminedbydividingeachBoardmember’sindividualcompensationamountforoneawardcyclebytheaverageclosingpriceoftheSIGshareofthefirsttentradingdaysofthethirdmonthofthequarterforwhichtheblockedSIGsharesaregranted.
6 Employersocialsecuritycontributions.
Annual Report 2020
Compensation Compensation Report 101

Reconciliation of approved and paid compensation to the Board of Directors
ThereconciliationoftheapprovedandgrantedamountsisillustratedinFigure10.
FIGURE 10: RECONCILIATION OF COMPENSATION OF THE BOARD OF DIRECTORS
2019 2020 2021Start of year 01.01.2020
AGM 2019 11.04.2019
AGM 2020 07.04.2020
AGM 2021 21.04.2021
End of year 31.12.2020
CHF 1.1mCompensation for the period AGM 2019 to December 2019
CHF 0.4mCompensation for the period January 2020 to AGM 2020
CHF 2.3mAmount approved by shareholders at the AGM 2019 (for the term AGM 2019 to AGM 2020)
CHF 2.1mAmount approved by shareholders at the 2020 AGM (for the term AGM 2020 to AGM 2021)
CHF 1.3mCompensation for the period AGM 2020 to December 2020
CHF 1.7mCompensation for 2020
CHF 1.5mCompensation for the term AGM 2019 to AGM 2020
CHF 1.3mCompensation for the term AGM 2020 to December 2020
Annual Report 2020
Compensation Compensation Report 102

5. Compensation framework for the Group Executive Board
Compensation overview for the Group Executive Board
Compensation for the members of the Group Executive Board is provided through the following main components: Annualbase salary andpensionbenefits/otherbenefits,which togetherformthefixedcompensationcomponent,aShort-TermIncentivePlan(“STIP”)andaLong-TermIncentivePlan(“LTIP”),whichtogetherformthevariablecompensationcomponentpresentedin Figure 11. Compensation principles are reviewedby the CompensationCommittee on aregular basis.
FIGURE 11: ILLUSTRATIVE OVERVIEW OF COMPENSATION FRAMEWORK OF THE GROUP EXECUTIVE BOARD IN 2020
Fixed compensation components:
Annual base salary
ThebasesalaryisthemainfixedcompensationcomponentpaidtothemembersoftheGroupExecutiveBoardatSIG.Itispaidincashintwelveequalmonthlyinstalmentsunlesslocallawrequiresotherwise.Thelevelofbasesalaryisdeterminedbythespecificroleperformedandtheresponsibilitiesacceptedthereunder.Itrewardstheexperience,expertiseandknow-hownecessarytofulfilthedemandsofaspecificposition.Inaddition,themarketvalueoftheroleinthelocationwheretheCompanycompetesfortalentisconsidered.
Pension benefits/other benefits
As the Group Executive Board is international in its nature, the members participate in the benefit plans available in the country of their employment contract. Pension benefits areprovidedthroughSIG’sregularpensionplan.MembersoftheGroupExecutiveBoardwhoareunderaforeignemploymentcontractreceivebenefitsinlinewithlocalcurrentmarketpractice.
Reporting year Reporting year +1 Reporting year +2 Reporting year +3
Long-Term Incentive Plan (LTIP) at target
Short-Term Incentive Plan (STIP) at target
Base salary
+ Other benefits
+ Pension contributions
Base salary
+ Other benefits
+ Pension contributions
LTIP grant 3-year performance/vesting period
0–200% of number of granted Performance
Share Units
0–200% of target value
Vesting of Long-Term
Incentive Plan (LTIP)
Payment of Short-Term Incentive Plan (STIP)
Annual Report 2020
Compensation Compensation Report 103

Besides the pension coverage, benefitsmainly include insurance and health care plans. Inaddition to this, the Group Executive Board members are also provided with certain executive perquisitesandbenefitsinkindaccordingtocompetitivemarketpracticeinthecountryoftheiremployment(e.g.companycars).
Members of the Group Executive Board with a Swiss employment contract, for example, alsoreceivealump-sumcashpaymentasreimbursementforbusinessandrepresentationalexpenses, in accordance with the expense policy document approved by the cantonal tax authorityofSchaffhausen.
ThefairvalueofthesebenefitsispartofthecompensationanddisclosedinTable2.
Variable compensation components:
The variable compensation consists of a short-term incentive and a long-term incentivecomponent.
Short-Term Incentive Plan (“STIP”)
UndertheSTIP,themembersoftheGroupExecutiveBoardarerewardedfortheachievementofpre-definedannualfinancialtargetsforkeyperformanceindicators(“KPIs”)thatarederivedfromSIG’sbusinessstrategy.ThetargetsaredeterminedbytheBoard,basedontherecommendationoftheCompensationCommitteeeachyearinadvance,followingawell-establishedprocess.Tocalibratetheachievementcurveforthefollowingyear,atargetachievementlevelisidentifiedbasedonthebudgetoftherespectiveyear.Minimumandmaximumperformanceachievementlevelsaredefinedconsidering,amongothermetrics,thepreviousyear’sperformancelevelaswell as the notion that higher payouts should require proportionally higher levels of performance achievement,whichleadstomoreambitioustargetcurvestoachievethemaximumpayout.Todeterminethepayout,theperformanceagainsteachKPIwillbeassessedindividuallyinarangefrom0%to200%andthencombinedaccordingtotheassignedweightings(seeFigure12).Theoverallpayoutiscappedat200%ofthetargetamountandcanfalltozeroshouldtheminimumperformanceachievementlevelnotbeattained.
GroupExecutiveBoardmemberswhohaveregionalresponsibilitieshaveKPIsreflectingtheirregionalaswellasthegroup-relatedperformance.ThesameweightingisassignedtogroupandregionalKPIsformemberswhohavesuchresponsibilities.OtherGroupExecutiveBoardmembers’performance,includingtheCEOandCFO,isassessedbasedongroupperformanceonly.TheframeworkisillustratedinFigure12.
In 2020, the target individual short-term incentive equals 100% of the base salary for theCEO andbetween 67% and 82%of the respective base salaries for othermembers of theGroup ExecutiveBoard.
Annual Report 2020
Compensation Compensation Report 104

FIGURE 12: OVERVIEW OF THE GROUP EXECUTIVE BOARD STIP COMPENSATION FRAMEWORK IN 2020
KPIs Weight 2020
Members of the Group Executive Board WITHOUT
regional responsibility
Members of the Group Executive Board WITH regional responsibility
Gro
up
GroupadjustedEBITDA 60%
100% 50%Group core revenue 20%
Groupfreecashflow 20%
Regi
onal
RegionaladjustedEBITDA 50%
50%Regional core revenue 30%
Regional adjusted Operating Net Working Capital (ONWC)asa%ofrevenue 20%
Long-Term Incentive Plan (“LTIP”)
TheLTIPofferseligibleemployeestheopportunitytoparticipateinthelong-termsuccessofSIG,therebyreinforcingtheirfocusonlonger-termperformanceandaligningtheir interestswiththoseofshareholders.Thefollowingprovidesanoutlineoftheplanspecifics.
ThemechanicsbehindtheLTIPareillustratedinFigure13.Atthebeginningofeachthree-yearperformanceperiod,acertainnumberofPerformanceShareUnits(“PSUs”)isgrantedtoeachparticipant,whichrepresentsacontingententitlementtoreceiveSIGsharesinthefuture.ThenumberofgrantedPSUsdependson(i)theindividualLTIPgrantlevelinCHF,determinedbytheBoardeachyearbutneverexceeding200%ofthebasesalaryofanymemberoftheGroupExecutiveBoard,includingtheCEO,and(ii)thefairvalueofonePSUatthegrantdate.In2020,theLTIPgrantinCHFamountedto183%ofthebasesalaryfortheCEOandbetween107%and183%ofthebasesalaryforothermembersoftheGroupExecutiveBoard.
Performance regarding financial targets
Actual individual short-term incentive
Target individual short-term incentive(100% of base salary for CEO,
67%-82% of base salary for other members of the
Group Executive Board)
(0%–200% of individual target short-term incentive)
Annual Report 2020
Compensation Compensation Report 105

FIGURE 13: OVERVIEW OF THE PRINCIPLES OF THE LTIP
Performance conditions
Fair value of one Performance Share Unit
(PSU) at grant date
Granted number of PSUs
0% to 200% of thegranted number of PSUs
LTIP grant in CHF
3 year relative TSR1 with a cap at 100% for a negative absolute TSR
3 year cumulative diluted adjusted EPS
3 year cumulative FCF
50%
25%
25%
Share price at vesting date
Number of PSUs vested in SIG shares
Value of the vested LTIP in CHF
Performance period = 3 years
200%
0%
200%
0%
200%
0%
1 SPI®ICBIndustryIndustrials(Return)Index
Afterthethree-yearperformanceperiod,acertainnumberofthegrantedPSUsvest,dependingontheperformanceofSIGovertheperiod.ThenumberofPSUsvestedinSIGsharesmayvarybetween0%and200%ofthegrantedPSUsandisbasedontheachievementofthefollowingthreeweightedperformancemeasures.
Performance measure
Relative total shareholder return
(rTSR)Adjusted earnings per
share (EPS) Free cash flow (FCF)
Weight 50% 25% 25%
Description Total shareholder return measured relative to theSPI®ICBIndustry
Industrials(Return)Index
SIG’scumulative diluted adjusted
earnings per share
SIG’scumulative freecashflow
TodeterminethemultipleofthegrantedPSUsultimatelyvestedinSIGshares,theperformanceagainsteachperformancemeasurewillbeassessedindividuallyinarangefrom0%to200%andthencombinedaccordingtotheassignedweightings.Thismeansthatalowperformanceinone performance measure can be balanced by a higher performance in another performance measure.Overall,thecombinedvestingmultiplewillneverexceed200%.Iftheperformanceof each of the three performance measures lies below the respective minimum performance requirement,theresultingcombinedvestingmultiplewouldbe0%andconsequentlynoPSUswouldvest.Additionally,iftheabsoluteTSRfallsbelowzeroovertherespectiveperformanceperiod,thevestingfactoroftherelativeTSRmetricwouldbecappedat1.0.
Annual Report 2020
Compensation Compensation Report 106

Insettingthetargets,theCompensationCommitteehasbeensupportedbyHCMInternationalLtd.,anexternal independentadviser. Investors’ returnexpectationsonmarketvalue,stockrisk profile, investment projections and current profitability levels were taken as a startingpoint and translated into EPS and FCF targets, using multifactor valuation models and statistical analysesinordertoestablishanappropriatelinkbetweenLTIPpayoutsandthevaluecreatedforinvestors.Theresultsoftheoutside-inapproachwereassessedagainsthistoricalcompanyperformance,aswellasequityanalysts’expectationsandthestrategicplanasapprovedbytheBoard,toreinforcetheCompensationCommittee’sandBoard’sconfidenceintheoverallqualityandrobustnessoftheEPSandFCFtargets.TheCompensationCommitteediscusseddifferentoptions for target setting and the corresponding vesting curves for each performance measure and submitted a recommendation to the Board, which approved the respective vesting curves fortheLTIP2020grant,illustratedinFigure14.
FIGURE 14: OVERVIEW OF THE VESTING CURVE OF THE LTIP 2020
Performance measuresThreshold
(0% vesting)Target
(100% vesting)Cap
(200% vesting)
3 yearstotalshareholderreturn measured relative totheSPI® ICBIndustryIndustrials(Return)Index
–16%ofindex –0%comparedto index +10%ofindex
3 yearscumulativedilutedadjustedearnings per share
64.6%oftarget 100%targetassetby the Board of Directors
135.4%oftarget
3 yearscumulativefree cash flow
62.5%oftarget 100%targetassetby the Board of Directors
137.5%oftarget
Other circumstances under which no PSUs vest include various forfeiture clauses relating to terminationofemploymentduringtheperformanceperiodoftheLTIP.
Annual Report 2020
Compensation Compensation Report 107
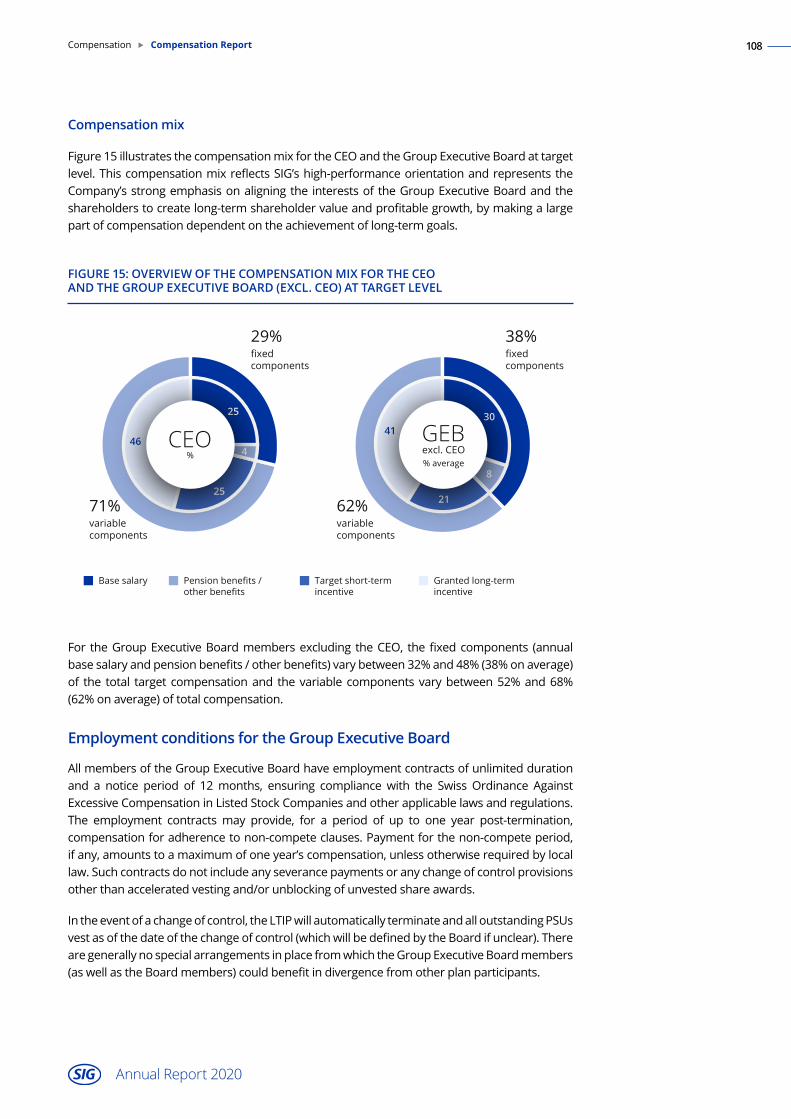
Compensation mix
Figure15illustratesthecompensationmixfortheCEOandtheGroupExecutiveBoardattargetlevel.ThiscompensationmixreflectsSIG’shigh-performanceorientationandrepresentstheCompany’sstrongemphasisonaligningthe interestsoftheGroupExecutiveBoardandtheshareholderstocreatelong-termshareholdervalueandprofitablegrowth,bymakingalargepartofcompensationdependentontheachievementoflong-termgoals.
FIGURE 15: OVERVIEW OF THE COMPENSATION MIX FOR THE CEO AND THE GROUP EXECUTIVE BOARD (EXCL. CEO) AT TARGET LEVEL
For theGroupExecutiveBoardmembersexcluding theCEO, thefixedcomponents (annualbasesalaryandpensionbenefits/otherbenefits)varybetween32%and48%(38%onaverage)of the total target compensationand thevariablecomponentsvarybetween52%and68%(62% onaverage)oftotalcompensation.
Employment conditions for the Group Executive Board
All members of the Group Executive Board have employment contracts of unlimited duration and a notice period of 12months, ensuring compliance with the Swiss Ordinance AgainstExcessiveCompensationinListedStockCompaniesandotherapplicablelawsandregulations.The employment contracts may provide, for a period of up to one year post-termination,compensationforadherencetonon-competeclauses.Paymentforthenon-competeperiod,ifany,amountstoamaximumofoneyear’scompensation,unlessotherwiserequiredbylocallaw.Suchcontractsdonotincludeanyseverancepaymentsoranychangeofcontrolprovisionsotherthanacceleratedvestingand/orunblockingofunvestedshareawards.
Intheeventofachangeofcontrol,theLTIPwillautomaticallyterminateandalloutstandingPSUsvestasofthedateofthechangeofcontrol(whichwillbedefinedbytheBoardifunclear).Thereare generally no special arrangements in place from which the Group Executive Board members (aswellastheBoardmembers)couldbenefitindivergencefromotherplanparticipants.
29%fixed components
38%fixed components
71%variable components
62%variable components
25
25
464
30
8
21
41
Base salary Pension benefits /other benefits
Target short-term incentive
Granted long-term incentive
GEBexcl. CEO% average
CEO%
Annual Report 2020
Compensation Compensation Report 108

Compensation awarded to the Group Executive Board (Audited)
Table2summarisesthetotalcompensationforthesixmembersoftheGroupExecutiveBoardactiveduring2020andonememberwholeftinthecourseoftheyear.ThetotalcompensationfortheGroupExecutiveBoardamountedtoCHF12.4million.
TABLE 2: TOTAL COMPENSATION OF THE GROUP EXECUTIVE BOARD IN 2020, INCLUDING INFORMATION OF THE PRIOR YEAR
CHF1
Group Executive Board (including
the CEO) 2020
Group Executive Board (including
the CEO) 2019CEO,
Rolf Stangl 2020CEO,
Rolf Stangl 2019
Annual base salary 3,222,482 3,214,722 875,000 875,000
Pensionbenefits 524,930 536,405 129,619 129,518
Short-termvariablecompensation(paid)2 2,524,156 3,410,295 875,000 1,224,720
Long-termvariable compensation(granted)3
4,900,000 4,700,000 1,600,000 1,600,000
Otherbenefits4 336,092 331,256 32,204 28,916
Social security contributions5 877,957 966,097 265,302 303,876
Total regular compensation 12,385,6176 13,158,775 3,777,125 4,162,030
Accrualsfornon-competeagreements7 3,017,876 – 1,898,746 –
1 Exchangerates2020:EUR/CHF1.07034;THB/CHF3.0013;CNY/CHF13.60521;BRL/CHF18.41503. Exchangerates2019:EUR/CHF1.11282;THB/CHF3.20216;CNY/CHF14.39436;BRL/CHF25.23583.
2 Representseffectiveshort-termvariablecompensationfor2020whichwillbepaidin2021,afterthepublicationofSIG’sauditedconsolidatedfinancialstatements.
3 AmountgrantedundertheLTIP;thenumberofPSUsthatvestsdependsontheachievementoftheperformancetargets.ThenumberofgrantedPSUsisequaltotheparticipants’grantedamountsundertheLTIPdividedbythefairvalueofonePSUatthegrantdate(CHF15.05forthe2020PSUplan,seenote31oftheconsolidatedfinancialstatementsforadditionaldetails).
4 Comprisespaymentsrelatedtoadditionalinsurances,carbenefitsandotherallowancesandbenefits.
5 EmployersocialsecuritycontributionsincludeestimatesfortheShort-TermIncentivePlanattributableto2020whichwillbepaidin2021 aswellasfortheLong-TermIncentivePlanattargetlevelonaccrualbasis.
6 IncludingcompensationforonememberwholefttheCompanyinAugust2020.
7 Thisitemincludesaccrualsforpaymentsfornon-competeagreementstothreemembersoftheGroupExecutiveBoardwholefttheCompanyinAugust(onemember) andasof31 December2020(twomembers),includingtheCEO.Theamountincludesemployersocialsecuritycontributionsonaccrualbasis.
Theone-timeeffectfornon-competeagreementsofCHF3.0millionisdisclosedinthecontextofpersonnelchangesintheGroupExecutiveBoardandwillbepayablein2021and2022.WithregardtotheLTIP,thesepersonnelchangesresultedintheforfeitureof341,414PSUsoutofthe2019and2020grants,representingatotalvalue(atgrantfairvalue)ofCHF4.2million.
TheseforfeituresarereflectedinTable4,whichgivesanoverviewofthePSUsgrantedunderthe2019and2020grants.
Approved versus total regular compensation for the Group Executive Board
ThetotalcompensationfortheGroupExecutiveBoardfor2020ofCHF12.4million(includingsocialsecuritycontributions)plustheextraone-offcompensationofCHF3.0millionrelatingto non-compete arrangements for threememberswho left the GEB in 2020, is below themaximumaggregatecompensationamountofCHF18.0million,whichwasapprovedattheAnnualGeneralMeetingon11April2019for2020.
Annual Report 2020
Compensation Compensation Report 109

STIP performance assessment
For 2020, the members of the Group Executive Board received base salary, Short-TermIncentivePlanandLong-TermIncentivePlanandpensionandotherbenefits,inlinewiththecompensationframework,asdetailedinFigure11.FortheGroupasawhole,2020results,asillustratedinFigure16below,werebelowthetargetsforGroupadjustedEBITDAandGroupcorerevenue,whiletheGroupfreecashflowKPIhasbeenoverachieved.
FIGURE 16: 2020 PERFORMANCE AT GROUP LEVEL RELEVANT FOR STIP PERFORMANCE ASSESSMENT
Thetargetachievementforthe2020STIPwas82.9%fortheCEO(140%in2019),notreflectingthe termination agreement with the CEO, and between 84.8% and 128.0% for the othermembersoftheGroupExecutiveBoard(85%to142%in2019).
Actual target achievement
0% 200%100%
Group adjusted EBITDA
Target achievement
Performance measure
Group core revenue
Group free cash flow
50% 150%
Annual Report 2020
Compensation Compensation Report 110

Assessment of actual compensation paid/granted to the Group Executive Board
In comparison to theprevious year, the total compensationof theGroupExecutiveBoard,excludingtheone-timenon-competeaccruals,decreasedby5.9%.Thismovement ismainlycausedbytheperformance-relatedaspectsregardingtheSTIPaswellassomeexchangeratemovements.TherewerenosignificantincreasesinbasesalariesnorintargetSTIPlevelsversusthepreviousyear.
Figure17illustratesthe2020actualcompensationmixfortheCEOandtheGroupExecutiveBoard,whichunderlinesthestrongfocusontheshort-andlong-termvariablecompensationelements.
FIGURE 17: OVERVIEW OF THE ACTUAL COMPENSATION MIX IN 2020 FOR THE CEO AND THE GROUP EXECUTIVE BOARD (EXCL. CEO) (REFLECTS THE AMOUNT GRANTED UNDER THE LTIP)
Performance Share Unit Plan
In2019,thePSUplanwasintroduced,andthemembersoftheGroupExecutiveBoardandselectedothermembersofmanagementweregrantedPSUsfor thefirst time.APSUgrantoccurredagainin2020.Table3givesanoverviewofthePSUgrantssince2019andTable4showsthestatusofoutstandingPSUs.
TABLE 3: OVERVIEW OF PERFORMANCE SHARE UNIT GRANTS
2020 2019
Grant date 01.04.2020 01.04.2019
Vestingdate 31.03.2023 31.03.2022
Fair value of one PSU at grant date CHF15.05 CHF9.49
Granted numbers of PSUs 342,198 537,414
Thereof granted to members of the Group Executive Board 325,586 495,263
29%fixed components
38%fixed components
71%variable components
62%variable components
30
8
21
41
Base salary Pension benefits /other benefits
Paid short-term incentive
Granted long-term incentive
25
25
464
GEBexcl. CEO% average
CEO%
Annual Report 2020
Compensation Compensation Report 111

TABLE 4: PERFORMANCE SHARE UNIT STATUS
2020 2019
Asof1January 537,414 –
Granted PSUs 342,198 537,414
VestedPSUs – –
Forfeited PSUs throughout the respective year (341,414) –
Outstandingasof31December 538,198 537,414
6. Shareholding Guidelines
Inordertofurtherstrengthenthelong-termfocusofthemembersoftheBoardandtheGroupExecutiveBoardandtoincreasethealignmentoftheirinterestswiththoseofSIG’sshareholders,Shareholding Guidelines are in place.Members of the Board (including the Chairman) arerequiredtobuildupaninvestmentinSIGsharesworththeequivalentof100%oftheirannualbasefees,withinathree-yearbuild-upperiodfromthefirstequitygrantdate.
Similarly,membersoftheGroupExecutiveBoardarerequiredtobuildupaninvestmentinSIGsharesworththeequivalentof100%oftheirannualbasesalary,or200%fortheCEO,withinafive-yearbuild-upperiod,startingwiththeirfirstgrantundertheequity-basedcompensationplan.
AllblockedorunblockedSIGsharesandvestedorunvestedentitlementstoSIGshares(suchasRestrictedShareUnits, “RSUs”)butexcludingPerformanceShareUnits (“PSUs”), receivedas compensation, and SIG shares acquired privately, either outright or beneficially, by themembers of the Board or Group Executive Board or their immediate family members count towardmeetingthesethresholds.
IftheShareholdingGuidelinesarenotmetbyamemberoftheBoardoramemberoftheGroupExecutiveBoardattheendofthebuild-upperiod,non-fulfilmentconsequences,includingsalerestrictions on equity instruments received as compensation, would apply until the Shareholding Guidelinesaremet.
Shareholdings of the Board of Directors (Audited)
Table5showstheshareholdingsoftheBoardasof31December2020.SincetheShareholdingGuidelinesforeseeabuild-upperiodformembersoftheBoardofthreeyearsafterthefirstequitygrantstartingfrom2019,adherencewillbeassessedforthefirsttimein2022.
Annual Report 2020
Compensation Compensation Report 112

TABLE 5: SHAREHOLDINGS OF THE BOARD OF DIRECTORS AS OF 31 DECEMBER 2020 INCLUDING INFORMATION OF THE PRIOR YEAR
Number of directly or beneficially held SIG
shares1 RSUs2
Total shareholdingsincluding RSUs
31 Dec., 2020
Total shareholdingsincluding RSUs
31 Dec., 2019
Andreas Umbach 81,026 – 81,026 67,529
Matthias Währen 26,483 – 26,483 20,960
Colleen Goggins 24,826 7,287 32,113 31,1074
Werner Bauer 51,939 – 51,939 46,6624
Wah-HuiChu 37,741 6,949 44,690 39,6574
Mariel Hoch 12,564 – 12,564 7,287
Nigel Wright – – –3 106,4223
Total 234,579 14,236 248,815 319,6245
1 OrdinaryregisteredsharesofSIGCombiblocGroupAG,includingblockedshares.
2 TheRSUswillbeconvertedintoSIGsharesafterathree-yearvestingperiod.
3 2019indirectlyattributableshareholdingsthroughminorityinvestmentinaffiliatesofOnexCorporation,themajorityshareholderattheendof2019.OnexCorporationanditsaffiliatessoldtheirremainingsharesinSIGon3 December2020, andOnexGrouptherebyceasedtohaveaparticipationinSIGandnoindirectshareholdingisshownany more.
4 Thereof23,820sharesheldindirectlythroughpartnershipinterestsinWizardManagementIIGmbH&Co.KG, whichheldordinaryregisteredsharesofSIGCombiblocGroupAG(forfurtherdetailsseesection7).
5 Thereof141,742sharesdirectlyorbeneficiallyheld;177,882sharesheldindirectly.
Shareholdings of the Group Executive Board (Audited)
Table6showstheshareholdingsoftheGroupExecutiveBoardat31December2020.SincetheShareholdingGuidelines foreseeafive-yearbuild-upperiod formembersof theGroupExecutiveBoardcommencingwiththefirstequitygrantin2019,compliancewillbeassessedforthefirsttimein2024.
TABLE 6: SHAREHOLDINGS OF THE MEMBERS OF THE GROUP EXECUTIVE BOARD AS OF 31 DECEMBER 2020 INCLUDING INFORMATION OF THE PRIOR YEAR
Total shareholdings 31 Dec., 2020 Number of directly or beneficially
held SIG shares1Total shareholdings
31 Dec., 2019
Rolf Stangl – 665,5442
Samuel Sigrist 200,063 290,0632
Markus Boehm n/a4 268,6482
IanWood 75,000 84,2253
Lawrence Fok 268,572 359,9552
MartinHerrenbrück 50,000 134,6333
Ricardo Rodriguez 250,002 263,7022
Total 843,637 2,066,770
1 OrdinaryregisteredsharesofSIGCombiblocGroupAG.
2 ShareswereheldindirectlythroughpartnershipinterestsinWizardManagementIGmbH&Co.KG, whichheldordinaryregisteredsharesofSIGCombiblocGroupAG(forfurtherdetailsseesection7).
3 ShareswereheldindirectlythroughpartnershipinterestsinWizardManagementIIGmbH&Co.KG, whichheldordinaryregisteredsharesofSIGCombiblocGroupAG(detailsseesection7).
4 Markus Boehm left the Group Executive Board in the course of the year so that the Shareholding Guidelines nolongerappliestohim.
Annual Report 2020
Compensation Compensation Report 113

7. Previous and discontinued compensation plans
Management Equity Plan (“MEP”)
In2015,whenSIGwasacquiredbyOnex,aManagementEquityPlan(“MEP”)wasestablishedfor selectedmanagersof SIG. Thepurposeof theMEPwas to enable eligiblemanagers toparticipateinthevaluecreationoftheCompany.Itwasintendedtogeneratereturnstotheeligiblemanagersuponliquidityevents.ThesharesintheCompanywereheldbythemanagersvia two limited liability partnerships. In accordancewith the plan regulations,managementexercisedtheirrighttowithdrawfromthemanagementequityplaninthefirsthalfof2020.Thesharesweredistributedtotheparticipantsintodirectownership.WiththesetransactionstheMEPwasclosedinMay2020.
8. Loans granted to members of the Board of Directors or the Group Executive Board
SIG’sArticlesofAssociationdonotallowforloanstobegrantedbytheGrouporitsconsolidatedsubsidiariestomembersoftheBoardortheGroupExecutiveBoard.Asaconsequence,noloansweregrantedtoorareoutstandingtoeitherBoardorGroupExecutiveBoardmembers.
9. Outlook for 2021
TheBoardhasintroducedaclawbackclauseintotheLTIPwhichentitlestheBoardofDirectorsto determine that PSUs forfeit in full or in part or that vested awards will be recovered in full or in partintheeventoffinancialmisstatementormisconduct,followingreviewofthespecificfactsandcircumstances.Theclawbackclauseisinlinewiththeperformance-relatedprinciplesoftheLTIPandprotectstheinterestsofshareholdersandotherrelevantstakeholders.
SustainabilityisingrainedinSIG’sbusinessstrategyandactivities,andthishasstrengthenedthewaywesource,produceandsell.Asalogicalstep,theBoardofDirectorsdecidedtoincludeinthe2021STIPGrouptargetsanadditionalESG-relatedmeasure.ThisisinlinewithSIG’slong-term commitment to contribute more to society and the environment than is taken out and this adjustmentoftheglobalSTIframeworkisanimportantmilestoneonthatjourney.
Annual Report 2020
Compensation Compensation Report 114

to the General Meeting of SIG Combibloc Group AG Neuhausen am Rheinfall
WehaveauditedtheaccompanyingcompensationreportofSIGCombiblocGroupAGfortheyearended31December2020.Theauditwaslimitedtotheinformationaccordingtoarticles14–16oftheordinanceagainstExcessiveCompensationinStockExchangeListedCompanies(Ordinance)containedinthetableslabelled‘audited’onpage101,page109andpages112–113ofthecompensationreport.
Board of Directors’ responsibility
The Board of Directors is responsible for the preparation and overall fair presentation of the compensation report in accordance with Swiss law and the Ordinance against Excessive Compensation inStockExchangeListedCompanies (Ordinance).TheBoardofDirectors isalsoresponsiblefordesigningtheremunerationsystemanddefiningindividualremunerationpackages.
Auditor’s responsibility
Our responsibility is toexpressanopinionon theaccompanying compensation report.Weconductedouraudit inaccordancewithSwissAuditingStandards.Thosestandards requirethat we comply with ethical requirements and plan and perform the audit to obtain reasonable assuranceaboutwhetherthecompensationreportcomplieswithSwisslawandarticles14–16oftheOrdinance.
An audit involves performing procedures to obtain audit evidence on the disclosures made in the compensation report with regard to remuneration, loans and credits in accordance with articles 14–16oftheOrdinance.Theproceduresselecteddependontheauditor’sjudgment,includingthe assessment of the risks of material misstatements in the compensation report, whether duetofraudorerror.Thisauditalsoincludesevaluatingthereasonablenessofthemethodsapplied to value components of remuneration, as well as assessing the overall presentation of thecompensationreport.
Webelievethattheauditevidencewehaveobtainedissufficientandappropriatetoprovideabasisforouropinion.
Opinion
In our opinion, the compensation report of SIG Combibloc Group AG for the year ended31 December2020complieswithSwisslawandarticles14–16oftheOrdinance.
PricewaterhouseCoopers AG
Bruno Rossi Manuela BaldisweilerAudit expert Audit expertAuditor in charge
Basel,18February2021
REPORT OF THE STATUTORY AUDITOR
Annual Report 2020
115Compensation Report of the statutory auditor
FINANCIALS117 Consolidated financial
statements
205 Financial statements of the Company
Annual Report 2020
116116

Financials ► Consolidated financial statements 1
Annual Report 2020
Consolidated financial statements for the year ended 31 December 2020
SIG Combibloc Group AG Consolidated statement of profit or loss and other comprehensive income 118
Consolidated statement of financial position 119
Consolidated statement of changes in equity 120
Consolidated statement of cash flows 121
Notes
Basis of preparation 122
Our operating performance 130
Our operating assets and liabilities 142
Our financing and financial risk management 158
Our Group structure and related parties 174
Our people 184
Other 192
Report of the statutory auditor on the audit of the consolidated financial statement 200
See note 3 for further details on the consolidated financial statements.
Annual Report 2020
Financials Consolidated financial statements 117

Financials ► Consolidated financial statements 2
Annual Report 2020
Consolidated statement of profit or loss and other comprehensive income
(In € million) Note
Year ended 31 Dec.
2020
Year ended 31 Dec.
2019
Revenue 6, 7 1,816.1 1,783.9 Cost of sales (1,422.2) (1,370.1) Gross profit 393.9 413.8
Other income 8 29.3 20.4 Selling, marketing and distribution expenses (75.1) (75.1) General and administrative expenses (181.1) (172.6) Other expenses 8 (12.4) (9.3) Share of profit of joint ventures 28 17.4 15.4 Profit from operating activities 172.0 192.6
Finance income 2.6 12.0 Finance expenses (83.6) (56.6) Net finance expense 23 (81.0) (44.6)
Profit before income tax 91.0 148.0
Income tax expense 32 (23.0) (41.1) Profit for the period 9 68.0 106.9
Other comprehensive income Items that may be reclassified to profit or loss Currency translations of foreign operations: - recognised in translation reserve (138.6) 60.0 Items that will not be reclassified to profit or loss Remeasurement of defined benefit plans 7.8 24.0 Total other comprehensive income, net of income tax (130.8) 84.0
Total comprehensive income (62.8) 190.9 Basic earnings per share (in €) 10 0.21 0.33 Diluted earnings per share (in €) 10 0.21 0.33
Annual Report 2020
Financials Consolidated financial statements 118

Financials ► Consolidated financial statements 3
Annual Report 2020
Consolidated statement of financial position
As of As of 31 Dec. 31 Dec. (In € million) Note 2020 2019
Cash and cash equivalents 17 355.1 261.0 Trade and other receivables 16 222.0 271.6 Inventories 15 170.7 167.2 Current tax assets 32 2.8 1.2 Other current assets 20 28.5 22.2 Total current assets 779.1 723.2
Non-current receivables 16 6.3 5.6 Investments in joint ventures 28 184.5 193.4 Deferred tax assets 32 30.5 21.8 Property, plant and equipment 12 986.6 1,073.1 Right-of-use assets 13 141.1 49.0 Intangible assets 14 2,292.8 2,460.3 Employee benefits 30 178.5 168.4 Other non-current assets 20 23.0 29.3 Total non-current assets 3,843.3 4,000.9
Total assets 4,622.4 4,724.1
Trade and other payables 18 501.2 492.3 Loans and borrowings 22 24.0 50.8 Current tax liabilities 32 37.3 43.5 Employee benefits 30 50.5 45.2 Provisions 19 14.1 12.1 Other current liabilities 20 59.8 59.9 Total current liabilities 686.9 703.8
Non-current payables 18 12.3 10.4 Loans and borrowings 22 1,659.7 1,541.9 Deferred tax liabilities 32 132.4 172.5 Employee benefits 30 131.5 126.3 Provisions 19 18.5 15.5 Other non-current liabilities 20 167.4 165.0 Total non-current liabilities 2,121.8 2,031.6
Total liabilities 2,808.7 2,735.4
Share capital 24 2.8 2.8 Additional paid-in capital 24 1,945.0 2,059.8 Translation reserve (220.7) (82.1) Treasury shares 24 (0.1) (0.1) Retained earnings 86.7 8.3 Total equity 1,813.7 1,988.7
Total liabilities and equity 4,622.4 4,724.1
Annual Report 2020
Financials Consolidated financial statements 119

Financials ► Consolidated financial statements 4
Annual Report 2020
Consolidated statement of changes in equity
(In € million) Note Share
capital
Additional paid-in capital
Transla-tion-
reserve Treasury
shares Retained earnings
Total equity
Equity as of 1 January 2020 2.8 2,059.8 (82.1) (0.1) 8.3 1,988.7 Profit for the period 68.0 68.0 Other comprehensive income Items that may be reclassified to profit or loss
Currency translations of foreign operations: - recognised in translation reserve
(138.6) (138.6)
Items that will not be reclassified to profit or loss
Remeasurement of defined benefit plans 7.8 7.8 Total other comprehensive income, net of income tax - - (138.6) - 7.8 (130.8)
Total comprehensive income for the period - - (138.6) - 75.8 (62.8) Share-based payments 31 3.2 3.2 Purchase of treasury shares 24 (0.6) (0.6) Settlement of share-based payment plans and arrangements 24 0.6 (0.6) - Dividends 24 (114.8) (114.8) Total transactions with owners - (114.8) - - 2.6 (112.2)
Equity as of 31 December 2020 2.8 1,945.0 (220.7) (0.1) 86.7 1,813.7
Equity as of 1 January 2019 2.8 2,158.8 (142.1) - (124.0) 1,895.5 Profit for the period 106.9 106.9 Other comprehensive income Items that may be reclassified to profit or loss
Currency translations of foreign operations: - recognised in translation reserve
60.0 60.0
Items that will not be reclassified to profit or loss
Remeasurement of defined benefit plans 24.0 24.0 Total other comprehensive income, net of income tax - - 60.0 - 24.0 84.0
Total comprehensive income for the period - - 60.0 - 130.9 190.9 Share-based payments 31 - 1.8 1.8 Purchase of treasury shares 24 (0.5) (0.5) Settlement of share-based payment plans and arrangements 24 - 0.4 (0.4) - Dividends 24 (99.0) (99.0) Total transactions with owners - (99.0) - (0.1) 1.4 (97.7)
Equity as of 31 December 2019 2.8 2,059.8 (82.1) (0.1) 8.3 1,988.7
Annual Report 2020
Financials Consolidated financial statements 120
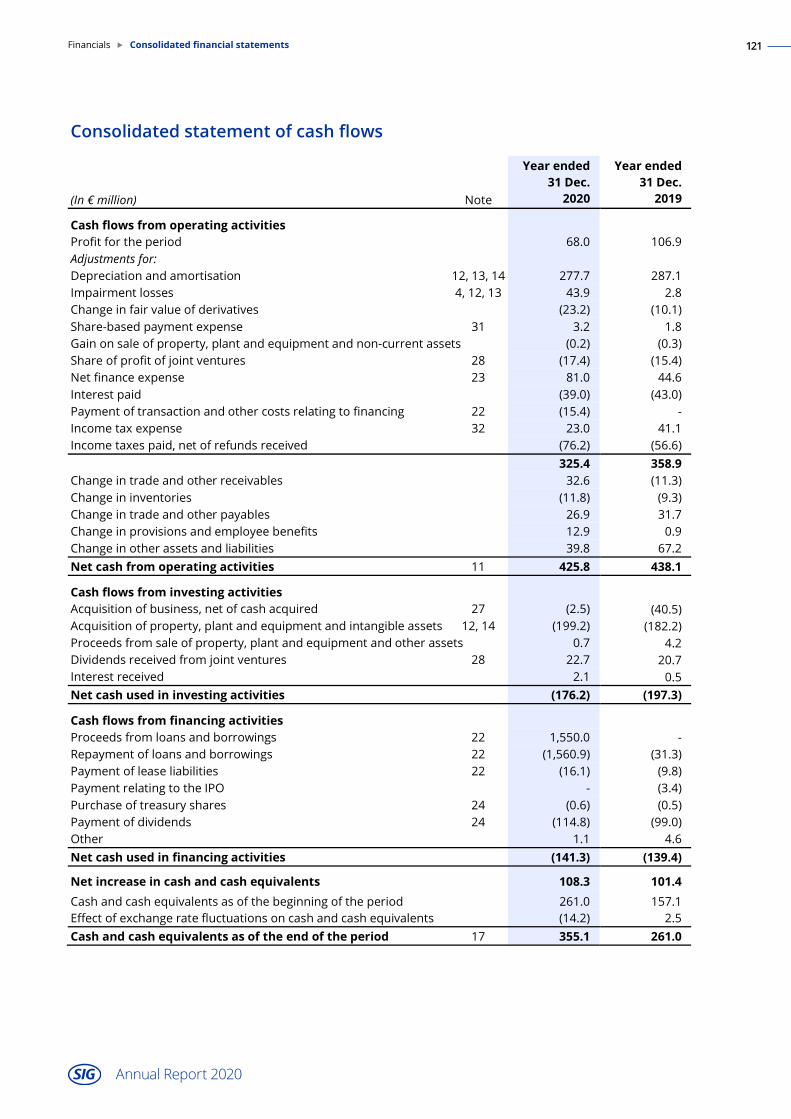
Financials ► Consolidated financial statements 5
Annual Report 2020
Consolidated statement of cash flows
(In € million) Note
Year ended 31 Dec.
2020
Year ended 31 Dec.
2019
Cash flows from operating activities Profit for the period 68.0 106.9 Adjustments for: Depreciation and amortisation 12, 13, 14 277.7 287.1 Impairment losses 4, 12, 13 43.9 2.8 Change in fair value of derivatives (23.2) (10.1) Share-based payment expense 31 3.2 1.8 Gain on sale of property, plant and equipment and non-current assets (0.2) (0.3) Share of profit of joint ventures 28 (17.4) (15.4) Net finance expense 23 81.0 44.6 Interest paid (39.0) (43.0) Payment of transaction and other costs relating to financing 22 (15.4) - Income tax expense 32 23.0 41.1 Income taxes paid, net of refunds received (76.2) (56.6) 325.4 358.9 Change in trade and other receivables 32.6 (11.3) Change in inventories (11.8) (9.3) Change in trade and other payables 26.9 31.7 Change in provisions and employee benefits 12.9 0.9 Change in other assets and liabilities 39.8 67.2 Net cash from operating activities 11 425.8 438.1
Cash flows from investing activities
Acquisition of business, net of cash acquired 27 (2.5) (40.5) Acquisition of property, plant and equipment and intangible assets 12, 14 (199.2) (182.2) Proceeds from sale of property, plant and equipment and other assets 0.7 4.2 Dividends received from joint ventures 28 22.7 20.7 Interest received 2.1 0.5 Net cash used in investing activities (176.2) (197.3)
Cash flows from financing activities Proceeds from loans and borrowings 22 1,550.0 - Repayment of loans and borrowings 22 (1,560.9) (31.3) Payment of lease liabilities 22 (16.1) (9.8) Payment relating to the IPO - (3.4) Purchase of treasury shares 24 (0.6) (0.5) Payment of dividends 24 (114.8) (99.0) Other 1.1 4.6 Net cash used in financing activities (141.3) (139.4)
Net increase in cash and cash equivalents 108.3 101.4 Cash and cash equivalents as of the beginning of the period 261.0 157.1 Effect of exchange rate fluctuations on cash and cash equivalents (14.2) 2.5 Cash and cash equivalents as of the end of the period 17 355.1 261.0
Annual Report 2020
Financials Consolidated financial statements 121

Financials ► Consolidated financial statements 6
Annual Report 2020
BASIS OF PREPARATION This section includes information on the parent company and the Group. It also includes details about the preparation of the consolidated financial statements and explains the structure of the consolidated financial statements.
1 Reporting entity and overview of the Group
SIG Combibloc Group AG (“SIG” or the “Company”) is domiciled in Switzerland and has since 28 September 2018 been listed on SIX Swiss Exchange.
The consolidated financial statements for the year ended 31 December 2020 comprise the Company and its subsidiaries (together referred to as the “Group”). The subsidiaries and joint ventures reflected in the consolidated financial statements of the Company are listed in note 26.
The Group is a global system supplier of aseptic carton packaging solutions for both beverage and liquid food products, ranging from juices and milk to soups and sauces. Its solutions offering consists of aseptic carton packaging filling machines, aseptic carton packaging sleeves and closures as well as after-market services.
2 Preparation of the consolidated financial statements
The consolidated financial statements for the year ended 31 December 2020 have been prepared in accordance with International Financial Reporting Standards (“IFRS”) as issued by the International Accounting Standards Board (“IASB”). They were approved by the Board of Directors of the Company on 18 February 2021. They also comply with the Listing Rules of SIX Swiss Exchange and with Swiss company law.
The consolidated financial statements are presented in Euros (“€” or EUR) as the Euro is deemed to be the currency most representative of the Group’s activities. The functional currency of the Company is Swiss Franc.
The consolidated financial statements are prepared on a historical cost basis except for certain financial instruments such as derivatives that are measured at fair value, certain components of inventory that are measured at net realisable value and defined benefit obligations that are measured under the projected unit credit method.
Annual Report 2020
Financials Consolidated financial statements 122

Financials ► Consolidated financial statements 7
Annual Report 2020
3 Structure of the consolidated financial statements
The consolidated financial statements are structured into different sections that should facilitate an overview and understanding of the Group’s operations, financial position and performance. The notes are included in these sections based on their relevance and include information that is material and relevant to the consolidated financial statements.
BASIS OF PREPARATION
OUR OPERATING PERFORMANCE
OUR OPERATING ASSETS AND LIABILITIES
OUR FINANCING AND FINANCIAL RISK MANAGEMENT
OUR GROUP STRUCTURE AND RELATED PARTIES OUR PEOPLE OTHER
1 Reporting entity and overview of the Group
2 Preparation of the consolidated financial statements
3 Structure of the consolidated financial statements
4 Key events and transactions
5 General accounting policies and topics
6 Revenue
7 Segment information
8 Other income and expenses
9 Alternative performance measures
10 Earnings per share
11 Cash flow information
12 Property, plant and equipment
13 Right-of-use assets
14 Intangible assets
15 Inventories
16 Trade and other receivables
17 Cash and cash equivalents
18 Trade and other payables
19 Provisions
20 Other assets and liabilities
21 Capital management
22 Loans and borrowings
23 Finance income and expenses
24 Equity
25 Financial risk management
26 Group entities
27 Business combinations
28 Joint ventures
29 Related parties
30 Employee benefits
31 Share-based payment plans and arrangements
32 Income tax
33 Financial instruments and fair value information
34 Contingent liabilities
35 Subsequent events
Significant accounting policies and information about management judgements, estimates and assumptions are provided in the respective notes throughout the consolidated financial statements. Accounting policies that relate to the financial statements as a whole or are relevant for several notes are included in this “Basis of preparation” section.
4 Key events and transactions
The following events and transactions took place during the year ended 31 December 2020.
Refinancing
The Group refinanced its debt in June 2020, which involved the following transactions:
The issue of senior unsecured notes on the Global Exchange Market of Euronext Dublin. The signing of a new senior unsecured term loan and a revolving credit facility. The repayment and derecognition of existing secured term loans.
The impacts of the refinancing transactions on the Group’s financial position and performance are described in more detail in note 22.
Annual Report 2020
Financials Consolidated financial statements 123

Financials ► Consolidated financial statements 8
Annual Report 2020
New sleeves manufacturing facility in China
The lease of the Group’s second sleeves manufacturing facility in China commenced in December 2020. The Group has during the year invested in its own production equipment to be used in the new facility. For information about the impacts of the commencement of the lease of the new sleeves manufacturing facility and the capital expenditure incurred on the Group’s financial position and performance, see further notes 11, 12, 13 and 22.
COVID-19
Management considers that the business of SIG is well placed to withstand the impacts of the global spread of the corona virus (COVID-19) and its repeated outbreaks due to its role in the supply chain for essential food and beverages and its broad geographic reach. There have been no significant COVID-19-related disruptions and operational impacts at any of SIG’s plants up to the date of approval of these consolidated financial statements. See note 5.4 for additional details.
Changes in ownership
Onex Corporation (“Onex”), which acquired the Group in 2015, has since the Company’s listing in 2018 gradually reduced its shareholding in the Company. Onex reduced its shareholding to below 20% in August 2020 and sold all its remaining shares in the Company in December 2020 (see further note 29).
Organisational changes in the Group Executive Board
The Group has during the year ended 31 December 2020 implemented or initiated organisational changes in its Group Executive Board. The former Chief Financial Officer (Samuel Sigrist) was appointed Chief Executive Officer effective 1 January 2021 following the voluntary departure of the former Chief Executive Officer (Rolf Stangl). On the same date, the appointment of Frank Herzog as Chief Financial Officer took effect. He joined the Group from an unrelated business. The position of Chief Market Officer (formerly held by Markus Boehm) was eliminated in August 2020, with the responsibilities of that position re-allocated within the Group. Martin Herrenbrück, who held the position of President and General Manager of Europe, voluntarily left the Group as of 31 December 2020. José Matthijsse took over his position as President and General Manager of Europe effective 1 February 2021. She joined the Group from a business in the food and beverage industry. See also note 29.
New Zealand paper mill
The Group has been assessing the continued viability and different strategic alternatives for its paper mill in New Zealand (Whakatane). The mill primarily produces liquid paper board for use by SIG entities and the Group’s joint ventures in the Middle East. As a consequence of the assessments, impairment losses of €38.0 million on production-related assets were recognised in the consolidated statements for the year ended 31 December 2020 (€33 million net of tax). See further notes 9, 12 and 15.
Subsequent to 31 December 2020, the Board of Directors made the decision to close the paper mill and increase the sourcing of liquid paper board from existing third-party suppliers. The Group will enter into the required consultation process with employees. As a result of the closure decision, management expects to recognise plant decommissioning and redundancy costs of around €30 million in the first half of 2021. As assets of the mill are monetised over time, the operating and free cash flow impact of these costs is expected to be reduced.
Annual Report 2020
Financials Consolidated financial statements 124

Financials ► Consolidated financial statements 9
Annual Report 2020
Announcement of agreement to acquire the remaining shares of the joint ventures in the Middle East
The Group announced on 25 November 2020 that it has entered into an agreement to acquire the remaining 50% of the shares in its two joint ventures in the Middle East from the joint venture partner Obeikan Investment Group (“OIG”). The joint ventures will thereby become fully owned subsidiaries. The acquisition will give the Group full control over a business with strong growth prospects in a growing market and expand its global presence.
The acquisition is expected to complete before the end of the first quarter of 2021. The completion is subject to customary closing conditions and approvals from regulatory authorities. The consideration for the shares of the joint ventures will be made up of €167 million in cash and around 17.5 million newly issued SIG ordinary shares (to be issued out of authorised share capital). After the transaction, OIG will hold approximately 5% of the issued SIG shares.
In the year ended 31 December 2020, the two joint ventures generated revenue of approximately €266 million (excluding revenue from inter-company transactions between the two joint ventures) and adjusted EBITDA of approximately €78 million (see note 9 for the Group’s definition of adjusted EBITDA). The net debt of the two joint ventures was approximately €70 million as of 31 December 2020 (see note 21 for the Group’s definition of net debt). For further information about the two joint ventures, see note 28.
Abdallah Obeikan, Chief Executive Officer of OIG and currently Chief Executive Officer of the two joint ventures in the Middle East, will be nominated for election to SIG’s Board of Directors at the next Annual General Meeting in April 2020 subject to completion of the acquisition and other customary conditions. Abdelghany Eladib, currently Chief Operating Officer of the joint ventures, will become a member of SIG’s Group Executive Board and take on the role of President and General Manager of Middle East and Africa subject to and as of completion of the acquisition. This will result in a split of SIG’s current segment EMEA (“Europe, Middle East and Africa”) into two segments: Europe and MEA (“Middle East and Africa”).
5 General accounting policies and topics
5.1 Application of accounting policies
The accounting policies applied by the Group in the consolidated financial statements for the year ended 31 December 2020 are consistent with those applied in the consolidated financial statements for the year ended 31 December 2019.
5.2 Impact of new or amended standards and interpretations
A number of new or amended standards and interpretations were effective for annual periods beginning on 1 January 2020. The applicable standards and interpretations had no, or no material, impact on the consolidated financial statements.
Regarding the comparative period, the Group adopted IFRS 16 Leases on 1 January 2019, applying the standard’s modified retrospective approach. Assets leased by the Group are since then recognised on the statement of financial position as a right-of-use asset with a corresponding liability, representing the present value of the future lease payments. The Group was not materially impacted by IFRS 16. The Group recognised lease liabilities on 1 January 2019 of €15.9 million relating to lease contracts that previously were accounted
Annual Report 2020
Financials Consolidated financial statements 125

Financials ► Consolidated financial statements 10
Annual Report 2020
for as operating leases. The same amount was recognised as right-of-use assets. Assets of €27.6 million relating to lease contracts that were previously accounted for as finance leases were reclassified from property, plant and equipment to right-of-use assets. The Group’s finance lease liabilities amounted to €26.5 million as of 31 December 2018. See notes 12 and 13.
5.3 Adoption of standards and interpretations in 2021 and beyond
A number of new or amended standards and interpretations are effective for annual periods beginning on 1 January 2021 or later and have not been applied in preparing these consolidated financial statements. The Group does not plan to adopt these standards and interpretations before their effective dates. Many of them are not applicable to the Group or are expected to have no, or no material, impact on the consolidated financial statements. This also applies in respect of the amendments to IFRS 7 Financial Instruments: Disclosures, IFRS 9 Financial Instruments and IFRS 16 Leases, which are effective from 1 January 2021, and issued by the IASB as a result of the global reform of interest rate benchmarks.
5.4 Critical accounting judgements, estimates and assumptions
In preparing these consolidated financial statements, management has made judgements, estimates and assumptions that affect the application of accounting policies and the reported amounts of assets and liabilities, income and expenses and disclosure of contingent assets and liabilities. The estimates and associated assumptions are based on historical experience and various other assumptions that are believed to be reasonable under the circumstances. Actual results may differ from estimates and assumptions made. The estimates and assumptions are reviewed on an ongoing basis. Revisions to accounting estimates are recognised in the period in which the estimate is revised if the revision affects only that period or in the period of the revision and future periods if the revision affects both the current and future periods.
Management believes that the following accounting policies involve the most significant judgements, estimates and assumptions:
Liabilities for various customer incentive programmes – see notes 6 and 18. Impairment testing and recognition of impairment losses – see notes 12 and 14. Business combinations and fair value assessments – see note 27. Measurement of obligations under defined benefit plans – see note 30. Determination of income tax liabilities – see note 32. Realisation of deferred tax assets – see note 32.
Management is closely monitoring the effects of COVID-19. Management evaluates on an ongoing basis how the COVID-19 pandemic impacts the Group’s financial position and performance. It assesses various aspects such as the value of the Group’s assets (including goodwill and pension assets), any impairment triggers, sales trends, liquidity needs and exposure to market and credit risks. Considering that the Group (as well as its customer base) is in a business that can be regarded as essential in the distribution of aseptic food and beverages, the Group is overall currently not significantly impacted by the COVID-19 pandemic. The impact of COVID-19 on the Group in future periods is difficult to assess and there is no assurance that the experience to date will be representative of future periods.
Significant judgements are involved regarding the assessment of the impact of COVID-19 on the global economy, and new facts and circumstances may lead to adjustments of management’s current estimates and assumptions. See also note 4.
Annual Report 2020
Financials Consolidated financial statements 126

Financials ► Consolidated financial statements 11
Annual Report 2020
5.5 Accounting policies and other topics relating to the consolidated financial statements as a whole
5.5.1 Foreign currency
Items included in the financial statements of individual Group entities are recognised in their respective functional currency, which is the currency of the primary economic environment in which each Group entity operates.
Foreign currency transactions
Foreign currency transactions are translated into the respective functional currency of the Group entity at the exchange rates at the dates of the transactions. Monetary assets and liabilities in foreign currencies at the reporting date are translated into the functional currency at the exchange rate at that date. Non-monetary assets and liabilities in foreign currencies that are measured based on historical cost are translated at the exchange rates at the dates of the transactions. Foreign currency exchange gains or losses are generally recognised in profit or loss.
Foreign operations
Assets and liabilities of foreign operations, including goodwill and fair value adjustments arising on acquisitions, are translated into Euro at the exchange rates at the reporting date. The income and expenses of foreign operations are translated into Euro at average rates for the reported periods, which approximate the exchange rates at the dates of the transactions. This also applies to the statement of cash flows and all movements in assets and liabilities as well as any items of other comprehensive income. The foreign currency exchange gains and losses arising on the translation of the net assets of foreign operations are recognised in other comprehensive income, in the translation reserve.
When a foreign operation is disposed of or liquidated, the cumulative amount in the translation reserve related to that foreign operation is reclassified to profit or loss as part of the gain or loss on disposal (or liquidation). The Group does not apply hedge accounting to the foreign currency exchange differences arising between the functional currency of the foreign operation and the Euro.
Significant exchange rates
The following significant exchange rates against the Euro applied during the periods presented:
Average rate for the year Spot rate as of
31 Dec.
2020 31 Dec.
2019 31 Dec.
2020 31 Dec.
2019
Australian Dollar (AUD) 1.65383 1.61017 1.58960 1.59949 Brazilian Real (BRL) 5.81232 4.40968 6.37350 4.51570 Chinese Renminbi (CNY) 7.86713 7.73094 8.02250 7.82050 Swiss Franc (CHF) 1.07034 1.11282 1.08020 1.08540 Mexican Peso (MXN) 24.35846 21.56039 24.41599 21.22019 New Zealand Dollar (NZD) 1.75466 1.69855 1.69840 1.66531 Thai Baht (THB) 35.66255 34.75217 36.72701 33.41502 US Dollar ($ or USD) 1.13971 1.11967 1.22710 1.12340
Annual Report 2020
Financials Consolidated financial statements 127

Financials ► Consolidated financial statements 12
Annual Report 2020
5.5.2 Lease accounting
The Group as lessor
The Group deploys filling lines at its customers’ sites under both lease and sale contracts. These contracts generally contain certain terms showing that the Group retains control of the filling line and does not transfer the significant risks and rewards of ownership to the customer. As a consequence of these contractual terms, the majority of the Group’s filling line contracts qualify to be accounted for as operating leases in accordance with IFRS 16 Leases. See further notes 6, 12 and 20. Sale contracts that do not contain such terms are accounted for in accordance with IFRS 15 Revenue from Contracts with Customers.
The Group’s lease contracts do not include unconditional rights for customers to extend the lease or to purchase the filling line at the end of the stated lease period. Due to the Group’s long-term relationships with its customers and changing customer needs, contracts could be modified or terminated at any time. Customers may for example want to change to a different filling machine model. Filling lines taken back from customers are generally overhauled and redeployed with other existing or new customers.
The Group as lessee
The Group leases office buildings, production-related buildings and equipment, warehouses and cars.
The majority of the Group’s leased assets are recognised as right-of-use assets with corresponding lease liabilities. See notes 13 and 22 for further details about the accounting for right-of-use assets and lease liabilities.
Leases of low-value assets and short-term leases (leases with a lease term of 12 months or less) are accounted for off-balance sheet. The lease payments are recognised as an expense on a straight-line basis over the lease term. Variable lease payments that are not included in the measurement of lease liabilities are also accounted for off-balance sheet and are recognised as expense when incurred. The Group’s off-balance sheet leases have an insignificant impact on the Group’s result.
The accounting for sale and leaseback transactions depends on whether the initial transfer of the Group’s underlying asset to the buyer-lessor is a sale. If the transfer of the asset is not a sale (i.e. control of the asset is retained), the Group accounts for the transaction as a financing transaction. The asset is kept on the statement of financial position (as part of property, plant and equipment) and a financial liability is recognised equal to the proceeds received from the buyer-lessor. The financial liability is decreased by the payments made less the portion considered interest expense. If the transfer of the asset is a sale (i.e. control of the asset is transferred), the Group derecognises the underlying asset and applies lease accounting to the lease back. The right-of-use asset is measured at the retained portion of the previous carrying amount of the asset. Such a transfer may result in a gain or loss.
5.5.3 Impairment of non-financial assets
The carrying amounts of the Group’s property, plant and equipment, right-of-use assets, intangible assets with finite useful lives and investments in joint ventures are reviewed regularly and at least annually to identify whether there is an indication of impairment. If an impairment indicator exists, the asset’s recoverable amount is estimated. Goodwill and intangible assets with indefinite useful lives are tested for impairment on an annual basis and whenever there is an indication that they may be impaired.
Annual Report 2020
Financials Consolidated financial statements 128

Financials ► Consolidated financial statements 13
Annual Report 2020
For impairment testing, assets are grouped together into the smallest group of assets that generates cash inflows from continuing use that are largely independent of the cash inflows of other assets or cash generating units.
The recoverable amount of an asset or cash generating unit is the greater of its value in use and its fair value less costs of disposal. In assessing the value in use, the estimated future cash flows are discounted to their present value using a pre-tax discount rate that reflects current market assessments of the time value of money and the risks specific to the asset or cash generating unit.
An impairment loss is recognised if the carrying amount of an asset or cash generating unit exceeds its recoverable amount. An impairment loss is allocated to first reduce the carrying amount of any goodwill allocated to the cash generating unit, and then to reduce the carrying amounts of the other assets in the cash generating unit on a pro rata basis. Impairment losses are recognised in profit or loss.
An impairment loss in respect of goodwill is not reversed. For other assets, an impairment loss is reversed only to the extent that the asset’s carrying amount does not exceed the carrying amount that would have been determined, net of depreciation or amortisation, if no impairment loss had been recognised.
Further details on impairment testing are provided in the respective notes on property, plant and equipment, right-of-use assets and intangible assets (see notes 12, 13 and 14).
5.5.4 Contingent assets
Contingent assets are possible assets arising from a past event to be confirmed by future events not wholly within the control of the Group. Contingent assets are not recognised in the statement of financial position but are separately disclosed.
Annual Report 2020
Financials Consolidated financial statements 129

Financials ► Consolidated financial statements 14
Annual Report 2020
OUR OPERATING PERFORMANCE This section covers our operating performance on a Group as well as on a segment level. It includes alternative performance measures that management believes are relevant in evaluating the Group’s performance and liquidity.
6 Revenue
Revenue derives from the sale of goods (i.e. sleeves, closures, board and filling lines) and the provision of after-market services and is presented net of returns, trade discounts, volume rebates and other customer incentives. The Group also presents income from the deployment of filling lines under contracts that qualify to be accounted for as operating leases and revenue under royalty agreements as part of revenue.
Approximately 86% of the Group’s revenue from its offering of aseptic carton packaging solutions relates to the sale of sleeves and closures in the year ended 31 December 2020 (87% in the year ended 31 December 2019). The remaining 14% consists of revenue relating to filling lines and to servicing of the Group’s deployed filling lines (13% in the year ended 31 December 2019).
Composition of revenue
(In € million)
Year ended 31 Dec.
2020
Year ended 31 Dec.
2019
Revenue from sale and service contracts (including royalty agreements) 1,716.2 1,691.8 Revenue from filling line contracts accounted for as operating leases 99.9 92.1 Total revenue 1,816.1 1,783.9 of which Core revenue 1,796.4 1,766.9
Core revenue represents revenue generated from the Group’s core activities and excludes revenue from sales of folding box board, which amounted to €19.7 million for the year ended 31 December 2020 and €17.0 million for the year ended 31 December 2019. Core revenue is not a defined performance measure in IFRS (see further note 9).
The Group’s total revenue is further disaggregated by major product/service lines in the following table. Filling line revenue is composed of revenue from the deployment of filling lines under contracts that qualify to be accounted for as operating leases and from the sale of filling lines (see note 5.5.2). Service revenue relates to after-market services in relation to the Group’s filling lines. Revenue under royalty agreements and from the sale of folding box board and liquid paper board is included in other revenue.
(In € million)
Year ended 31 Dec.
2020
Year ended 31 Dec.
2019
Revenue from sale of sleeves and closures 1,498.8 1,472.7 Filling line revenue 121.0 111.9 Service revenue 119.0 113.4 Other revenue 77.3 85.9 Total revenue 1,816.1 1,783.9
Annual Report 2020
Financials Consolidated financial statements 130

Financials ► Consolidated financial statements 15
Annual Report 2020
The Group’s three segments (EMEA, APAC and Americas) are providing the same aseptic carton packaging solutions, comprising filling machines, sleeves and closures as well as after-market services. The split of revenue between revenue from sale of sleeves and closures, filling line revenue and service revenue is broadly the same at Group level, between the Group’s three segments and over recent years. Other revenue is mainly divided between EMEA and APAC. See note 7 for further information about the Group’s segments.
Notes 18 and 20 include information about the Group’s liabilities relating to various incentive programmes, advance payments from customers and deferred revenue, which had or will have an impact on the amount of revenue recognised.
Accounting policy, significant judgements and estimates
Revenue from sale of sleeves and other related products, deployment of filling lines under contracts accounted for as sales contracts and provision of service is measured at the fair value of the consideration received or receivable net of returns, trade discounts, volume rebates and other customer sales incentives.
Revenue is recognised when the Group transfers control over a product or service to a customer. Transfer of control varies depending on the individual contract terms. Revenue from sale of sleeves and other related products and deployment of filling lines under contracts accounted for as sales contracts is recognised at a point in time while revenue from service contracts is recognised over time.
Lease payments for filling lines that are deployed under operating lease contracts are recognised on a straight-line basis over the lease period. The payment (i.e. the sale price) for the use of filling lines that are deployed under sale contracts that qualify to be accounted for as operating leases is recognised as a deferred revenue liability in the statement of financial position, and recognised as revenue on a straight-line basis over the shorter of the period over which the customer relationship is expected to last and the ten-year estimated useful life of a filling line. The control and significant risks and rewards of ownership are retained by the Group in respect of such sale contracts (see further note 5.5.2).
When sales incentives are offered to customers, only the amount of revenue that is highly probable not to be reversed is recognised. The amount of sales incentives expected to be earned or taken by customers in conjunction with incentive programmes is therefore estimated and deducted from revenue. Estimates in respect of the incentives are based on historical and current sales trends, which are affected by the business seasonality and competitiveness of promotional programmes being offered. Estimates are reviewed quarterly for possible revisions.
Annual Report 2020
Financials Consolidated financial statements 131

Financials ► Consolidated financial statements 16
Annual Report 2020
7 Segment information
The Group has three operating segments, which are also the reportable segments: Europe, Middle East and Africa (“EMEA”), Asia Pacific (“APAC”) and Americas. All segments provide aseptic carton packaging solutions.
Overview of segments and Group Functions
The following section provides an overview of the Group’s three segments as well as the activities not forming part of any of the segments (Group Functions).
EMEA includes sleeves manufacturing as well as production of closures for the Group’s customers in Europe. EMEA also supplies Americas and APAC with sleeves and, to a lesser extent, closures. EMEA further includes the result from the sale of supply from the Group’s European manufacturing entities to the Group’s joint ventures in the Middle East. The Group’s central procurement activities are part of EMEA, with the European sleeves manufacturing and closures production entities being the main internal customers. The Group’s joint ventures in the Middle East contribute to the performance of EMEA through dividend payments and royalty payments related to the use of SIG technical solutions and sleeves sales in the Middle East.
APAC includes sleeves manufacturing for the Group’s customers in China, South East Asia and Oceania. The China-based filling machine assembly facility is also included in APAC, as is the production of liquid paper board and folding box board in New Zealand. The liquid paper board produced in New Zealand is mainly used by the sleeves manufacturing facilities in Asia and the joint ventures in the Middle East.
Americas covers the Group’s customers in North and South America. North America is primarily supplied by sleeves from the European and Asian sleeves manufacturing facilities. South America has its own sleeves manufacturing facility.
The Group Functions include activities that are supportive to the Group’s business, such as the global filling machine assembly, global technology (including R&D), information technology, marketing, finance, legal, human resources and other support functions. The Group Functions are involved in transactions with third parties only in relation to the Group’s joint ventures, of which the majority relate to the sale of filling machines. Global filling machine assembly also sells filling machines and spare parts, and provides assembly-related services, to all three of the segments.
Inter-company transactions between the segments, and between the segments and the Group Functions, are eliminated in consolidation. They mainly relate to the sale of filling machines, sleeves and closures. Pricing is determined on a cost-plus basis.
Information about the Group’s segments is reported to the chief operating decision maker (”CODM”) on a regular basis for the purposes of resource allocation and assessment of performance of the segments. The performance of the segments is assessed by the CODM primarily on the basis of adjusted EBITDA (as defined in the section below).
Annual Report 2020
Financials Consolidated financial statements 132
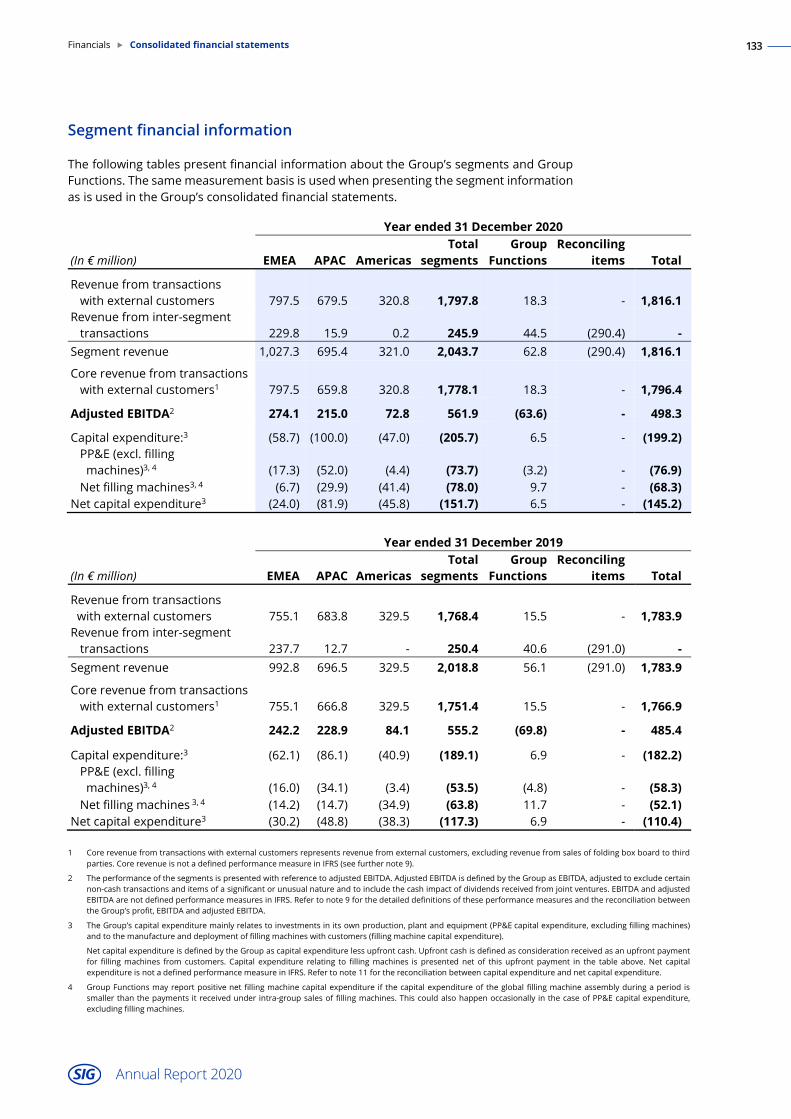
Financials ► Consolidated financial statements 17
Annual Report 2020
Segment financial information
The following tables present financial information about the Group’s segments and Group Functions. The same measurement basis is used when presenting the segment information as is used in the Group’s consolidated financial statements.
Year ended 31 December 2020
(In € million) EMEA APAC Americas Total
segments Group
Functions Reconciling
items Total
Revenue from transactions with external customers 797.5 679.5 320.8 1,797.8 18.3 - 1,816.1 Revenue from inter-segment transactions 229.8 15.9 0.2 245.9 44.5 (290.4) - Segment revenue 1,027.3 695.4 321.0 2,043.7 62.8 (290.4) 1,816.1
Core revenue from transactions with external customers1 797.5 659.8 320.8 1,778.1 18.3 - 1,796.4
Adjusted EBITDA2 274.1 215.0 72.8 561.9 (63.6) - 498.3
Capital expenditure:3 (58.7) (100.0) (47.0) (205.7) 6.5 - (199.2) PP&E (excl. filling machines)3, 4 (17.3) (52.0) (4.4) (73.7) (3.2) - (76.9) Net filling machines3, 4 (6.7) (29.9) (41.4) (78.0) 9.7 - (68.3) Net capital expenditure3 (24.0) (81.9) (45.8) (151.7) 6.5 - (145.2)
Year ended 31 December 2019 (In € million) EMEA APAC Americas
Total segments
Group Functions
Reconciling items Total
Revenue from transactions with external customers 755.1 683.8 329.5 1,768.4 15.5 - 1,783.9 Revenue from inter-segment transactions 237.7 12.7 - 250.4 40.6 (291.0) - Segment revenue 992.8 696.5 329.5 2,018.8 56.1 (291.0) 1,783.9
Core revenue from transactions with external customers1 755.1 666.8 329.5 1,751.4 15.5 - 1,766.9
Adjusted EBITDA2 242.2 228.9 84.1 555.2 (69.8) - 485.4
Capital expenditure:3 (62.1) (86.1) (40.9) (189.1) 6.9 - (182.2) PP&E (excl. filling machines)3, 4 (16.0) (34.1) (3.4) (53.5) (4.8) - (58.3) Net filling machines 3, 4 (14.2) (14.7) (34.9) (63.8) 11.7 - (52.1) Net capital expenditure3 (30.2) (48.8) (38.3) (117.3) 6.9 - (110.4) 1 Core revenue from transactions with external customers represents revenue from external customers, excluding revenue from sales of folding box board to third
parties. Core revenue is not a defined performance measure in IFRS (see further note 9).
2 The performance of the segments is presented with reference to adjusted EBITDA. Adjusted EBITDA is defined by the Group as EBITDA, adjusted to exclude certain non-cash transactions and items of a significant or unusual nature and to include the cash impact of dividends received from joint ventures. EBITDA and adjusted EBITDA are not defined performance measures in IFRS. Refer to note 9 for the detailed definitions of these performance measures and the reconciliation between the Group’s profit, EBITDA and adjusted EBITDA.
3 The Group’s capital expenditure mainly relates to investments in its own production, plant and equipment (PP&E capital expenditure, excluding filling machines) and to the manufacture and deployment of filling machines with customers (filling machine capital expenditure).
Net capital expenditure is defined by the Group as capital expenditure less upfront cash. Upfront cash is defined as consideration received as an upfront payment for filling machines from customers. Capital expenditure relating to filling machines is presented net of this upfront payment in the table above. Net capital expenditure is not a defined performance measure in IFRS. Refer to note 11 for the reconciliation between capital expenditure and net capital expenditure.
4 Group Functions may report positive net filling machine capital expenditure if the capital expenditure of the global filling machine assembly during a period is smaller than the payments it received under intra-group sales of filling machines. This could also happen occasionally in the case of PP&E capital expenditure, excluding filling machines.
Annual Report 2020
Financials Consolidated financial statements 133

Financials ► Consolidated financial statements 18
Annual Report 2020
Segment revenue per major product/service lines
Information about the Group’s revenue is included in note 6, where total revenue is disaggregated by major product/service lines. In respect of the segments, the split of revenue between revenue from sale of sleeves and closures, filling line revenue and service revenue is broadly the same as at Group level and over recent years. Other revenue is primarily divided between EMEA and APAC.
Geographic information
The Group operates eight manufacturing facilities that produce carton sleeves (two in Germany and in China, and one each in Austria, Thailand, Brazil and Australia). The second facility in China became operational in December 2020 (see further notes 13 and 22). The facility in Australia was part of the business combination that took place in November 2019 (see note 27). The Group also operates two assembly facilities for filling machines in Germany and China, a production facility for closures in Switzerland and a paper mill for the production of liquid paper board and folding box board in New Zealand (see note 4 regarding a strategic assessment of the paper mill). It further operates three R&D centres (one each in Germany, Switzerland and China) as well as four training centres (one each in Germany, Brazil, Thailand and China). Furthermore, the joint ventures in the Middle East operate a sleeves manufacturing facility and a training centre in their region.
The below table includes information about the Group’s non-current assets on a country basis. Non-current assets exclude financial instruments, deferred tax assets and net defined benefit assets.
(In € million)
As of 31 Dec.
2020
As of 31 Dec.
2019
Germany 1,076.8 1,110.7 Switzerland1 492.5 501.9 China 619.9 547.9 Thailand 484.4 548.7 Austria 339.4 342.6 Other countries 613.0 749.8 Total non-current assets 3,626.0 3,801.6 1 The Company's country of domicile is Switzerland.
The non-current assets are reported based on the geographic location of the business operations. The non-current assets are predominantly located in the countries in which the Group’s manufacturing, assembly and production facilities are situated. The Group’s intellectual property is primarily held by a company based in Switzerland.
Annual Report 2020
Financials Consolidated financial statements 134

Financials ► Consolidated financial statements 19
Annual Report 2020
The below table includes information about the Group’s revenue from external customers on a country basis.
(In € million)
Year ended 31 Dec.
2020
Year ended 31 Dec.
2019
China 296.1 292.4 Germany 211.7 198.0 Brazil 129.6 151.3 Switzerland 13.1 12.3 Other countries 1,165.6 1,129.9 Total revenue from external customers 1,816.1 1,783.9
Revenue is reported based on the geographic location of customers. The customer base of the Group includes international companies, large national and regional companies as well as small local companies.
Information about major customers
The Group does not have revenue from transactions with a single external customer amounting to 10% or more of the Group’s revenue in any of the periods presented.
8 Other income and expenses
Other income and expenses relate to activities and transactions that are outside the Group’s principal revenue generating activities. Foreign currency exchange gains and losses as well as fair value changes on commodity and foreign currency exchange derivatives entered into as part of the operating business are also presented as other income and expenses. Activities and transactions of a significant or unusual nature are generally adjusted for in the performance measures adjusted EBITDA and adjusted net income used by management (see note 9).
Composition of other income
(In € million)
Year ended 31 Dec.
2020
Year ended 31 Dec.
2019
Net change in fair value of derivatives 21.5 10.1 Income from miscellaneous services 3.7 4.0 Rental income 0.7 0.7 Other 3.4 5.6 Total other income 29.3 20.4
Annual Report 2020
Financials Consolidated financial statements 135

Financials ► Consolidated financial statements 20
Annual Report 2020
Composition of other expenses
(In € million)
Year ended 31 Dec.
2020
Year ended 31 Dec.
2019
Net foreign currency exchange loss (8.1) (4.1) Transaction- and acquisition-related costs (3.1) (4.1) Other (1.2) (1.1) Total other expenses (12.4) (9.3)
For the year ended 31 December 2020, the Group recognised a net foreign currency exchange loss of €8.1 million (a net loss of €4.1 million for the year ended 31 December 2019). Foreign currency exchange losses mainly arose due to the depreciation of the Thai Baht against the Euro and the US Dollar, and the depreciation of the Brazilian Real against the Euro. The Brazilian Real foreign currency exchange losses were mitigated by Brazilian Real hedging gains.
Transaction- and acquisition-related costs are excluded in the calculation of adjusted EBITDA and adjusted net income (see note 9 for further details).
9 Alternative performance measures
Management uses a number of measures to assess the performance of the Group that are not defined in IFRS, including core revenue, adjusted EBITDA, adjusted net income, adjusted earnings per share, net capital expenditure, free cash flow and net leverage ratio.
These alternative non-IFRS performance measures are presented as management believes that they are important supplemental measures of the Group’s performance. Management believes that they are useful and widely used in the markets in which the Group operates as a means of evaluating performance. In certain cases, these alternative performance measures are also used to determine compliance with covenants in the Group’s credit agreement and compensation of certain members of management. However, these alternative performance measures should not be considered as substitutes for the information contained elsewhere in these consolidated financial statements.
This note includes information about adjusted EBITDA and adjusted net income. Core revenue is presented in notes 6 and 7, adjusted earnings per share in note 10 and net capital expenditure and free cash flow in note 11. Information about the Group’s net leverage ratio is included in note 21.
Adjusted EBITDA
Adjusted EBITDA is used by management for business planning and to measure operational performance. Management believes that adjusted EBITDA provides investors with further transparency into the Group’s operational performance and facilitates comparison of the performance of the Group on a period-to-period basis and versus peers.
EBITDA is defined by the Group as profit or loss before net finance expense, income tax expense, depreciation of property, plant and equipment and right-of-use assets, and amortisation of intangible assets. Adjusted EBITDA is defined by the Group as EBITDA, adjusted to exclude certain non-cash transactions and items of a significant or unusual nature including, but not limited to, transaction- and acquisition-related costs, restructuring costs, unrealised gains or losses on derivatives, gains or losses on the sale of non-strategic
Annual Report 2020
Financials Consolidated financial statements 136

Financials ► Consolidated financial statements 21
Annual Report 2020
assets, asset impairments and write-downs and share of profit or loss of joint ventures, and to include the cash impact of dividends received from joint ventures.
The following table reconciles profit to EBITDA and adjusted EBITDA.
(In € million)
Year ended 31 Dec.
2020
Year ended 31 Dec.
2019
Profit for the period 68.0 106.9
Net finance expense 81.0 44.6 Income tax expense 23.0 41.1 Depreciation and amortisation 277.7 287.1 EBITDA 449.7 479.7
Adjustments to EBITDA:
Replacement of share of profit of joint ventures with cash dividends received from joint ventures
5.3 5.3
Restructuring costs, net of reversals 6.3 1.8 Unrealised gain on derivatives (21.5) (10.1) Transaction- and acquisition-related costs 3.1 4.3 Impairment losses 49.3 2.8 Other 6.1 1.6 Adjusted EBITDA 498.3 485.4
The Group has a number of ongoing restructuring programmes focused on reducing costs, streamlining the organisation and reducing headcount to be more closely aligned with the Group’s needs and changing market demands. For the year ended 31 December 2020, restructuring costs primarily relate to a move of production resources within the APAC segment and organisational changes in the leadership team. See also notes 19 and 29.
Transaction- and acquisition-related costs include acquisition-related costs and costs for pursuing other initiatives.
Impairment losses for the year ended 31 December 2020 primarily relate to impairment of production-related assets comprising the Group’s paper mill in New Zealand (€38.0 million) and impairment losses resulting from the reallocation of production within the APAC segment. See further notes 4, 12 and 15.
The “Other” category for the year ended 31 December 2020 mainly includes termination benefits relating to the former CEO (see further note 29) and integration costs in respect of Visy Cartons, which was acquired in November 2019. For the year ended 31 December 2019, “Other” mainly includes operational process-related costs.
Annual Report 2020
Financials Consolidated financial statements 137

Financials ► Consolidated financial statements 22
Annual Report 2020
Adjusted net income
Adjusted net income is used by management to measure performance. Management believes that adjusted net income is a meaningful measure because by removing certain non-recurring charges and non-cash expenses, the Group’s operating result directly associated with the period’s performance is presented. The use of adjusted net income may also be helpful to investors because it provides consistency and comparability with past performance and facilitates period-to-period comparisons of results of operations.
Adjusted net income is defined by the Group as profit or loss adjusted to exclude certain items of significant or unusual nature including, but not limited to, the non-cash foreign exchange impact of non-functional currency loans, amortisation of transaction costs, the net change in fair value of financing-related derivatives, purchase price allocation (“PPA”) depreciation and amortisation, adjustments made to reconcile EBITDA to adjusted EBITDA and the estimated tax impact of the foregoing adjustments. The PPA depreciation and amortisation arose due to the acquisition accounting that was performed when the Group was acquired by Onex in 2015. No adjustments are made for PPA depreciation and amortisation other than in connection with the Onex acquisition.
The following table reconciles profit for the period to adjusted net income.
(In € million)
Year ended 31 Dec.
2020
Year ended 31 Dec.
2019
Profit for the period 68.0 106.9
Non-cash foreign exchange impact of non-functional currency loans and realised foreign exchange impact due to refinancing 24.6 (1.2) Amortisation of transaction costs 3.1 2.8 Net change in fair value of derivatives (0.5) 1.5 Net effect of early repayment of secured term loans 19.7 - Onex acquisition PPA depreciation and amortisation 125.4 136.5 Adjustments to EBITDA: Replacement of share of profit of joint ventures with cash dividends received from joint ventures 5.3 5.3 Restructuring costs, net of reversals 6.3 1.8 Unrealised gain on derivatives (21.5) (10.1) Transaction- and acquisition-related costs 3.1 4.3 Impairment losses 49.3 2.8 Other 6.1 1.6 Tax effect on above items (56.6) (34.8) Adjusted net income 232.3 217.4
Annual Report 2020
Financials Consolidated financial statements 138

Financials ► Consolidated financial statements 23
Annual Report 2020
10 Earnings per share
Basic and diluted earnings per share
Basic earnings per share are calculated by dividing the consolidated profit for the period by the weighted average number of shares in issue during the period, excluding the weighted average number of treasury shares. Diluted earnings per share reflects the effect of potentially dilutive shares under the Group’s share-based payment plans and arrangements.
The following table shows the weighted average numbers of shares outstanding before and after adjustments for the effect of potentially dilutive shares.
Weighted average number of ordinary shares
Issued shares as of 1 January 2019 320,053,240 Effect of treasury shares held (10,732) Weighted average number of shares as of 31 December 2019 - basic 320,042,508
Effect of share-based payment plans and arrangements 15,552 Weighted average number of shares as of 31 December 2019 - diluted 320,058,060
Issued shares as of 1 January 2020 320,053,240 Effect of treasury shares held (8,360) Weighted average number of shares as of 31 December 2020 - basic 320,044,880
Effect of share-based payment plans and arrangements 34,373 Weighted average number of shares as of 31 December 2020 - diluted 320,079,253
The below table shows the profit attributable to shareholders and the weighted average number of outstanding shares used in the calculation of basic and diluted earnings per share.
(In € million unless indicated)
Year ended 31 Dec.
2020
Year ended 31 Dec.
2019
Profit for the period 68.0 106.9 Weighted average number of shares for the period - basic (in numbers) 320,044,880 320,042,508 Basic earnings per share (in €) 0.21 0.33
Profit for the period 68.0 106.9 Weighted average number of shares for the period - diluted (in numbers) 320,079,253 320,058,060 Diluted earnings per share (in €) 0.21 0.33
Adjusted earnings per share
Adjusted earnings per share is defined by the Group as adjusted net income divided by the weighted average number of shares. Management believes that (basic) adjusted earnings per share is a useful measure as adjusted net income is used to measure performance. Adjusted net income and adjusted earnings per share are not defined performance measures in IFRS (see further note 9).
Annual Report 2020
Financials Consolidated financial statements 139

Financials ► Consolidated financial statements 24
Annual Report 2020
The following table shows the adjusted net income and the weighted average number of outstanding shares used in the calculation of basic and diluted adjusted earnings per share.
(In € million unless indicated)
Year ended 31 Dec.
2020
Year ended 31 Dec.
2019
Adjusted net income 232.3 217.4 Weighted average number of shares for the period - basic (in numbers) 320,044,880 320,042,508 Adjusted earnings per share - basic (in €) 0.73 0.68
Adjusted net income 232.3 217.4 Weighted average number of shares for the period - diluted (in numbers) 320,079,253 320,058,060 Adjusted earnings per share - diluted (in €) 0.73 0.68
11 Cash flow information
This note includes information about the Group’s cash flows as well as non-cash transactions. Where more relevant for the understanding of a transaction, cash inflows and outflows are described in the notes of the respective assets or liabilities to which the cash flows relate. The same applies to non-cash transactions.
Net capital expenditure
The Group’s capital expenditure primarily relates to investments in own production, plant and equipment (PP&E capital expenditure, excluding filling machines) and to the manufacture and deployment of filling machines with customers under contracts accounted for as operating leases (filling machine capital expenditure).
Net capital expenditure is defined by the Group as capital expenditure less upfront cash. Upfront cash is defined as consideration received as an upfront payment for filling machines from customers. Net capital expenditure is not a defined performance measure in IFRS (see further note 9).
Management uses net capital expenditure as it better demonstrates how cash generative the business is. As the Group typically receives a portion of the total consideration for a filling machine as an upfront payment from the customer (see also note 20), the cash outflow relating to filling machines is generally lower than implied by the gross capital expenditure figure. Payments received for filling lines (including upfront payments) are included in cash flows from operating activities.
The following table reconciles capital expenditure to net capital expenditure.
(In € million)
Year ended 31 Dec.
2020
Year ended 31 Dec.
2019
PP&E (excl. filling machines) 76.9 58.3 Gross filling machines 122.3 123.9 Capital expenditure (gross) 199.2 182.2 Upfront cash (for filling machines) (54.0) (71.8) Net capital expenditure 145.2 110.4
Annual Report 2020
Financials Consolidated financial statements 140

Financials ► Consolidated financial statements 25
Annual Report 2020
Free cash flow
Free cash flow is used by management to evaluate the performance of the Group. Free cash flow is defined by the Group as net cash from operating activities plus dividends received from the joint ventures less capital expenditure and payments of lease liabilities. Free cash flow is not a defined performance measure in IFRS (see further note 9).
The following table reconciles net cash from operating activities to free cash flow.
(In € million)
Year ended 31 Dec.
2020
Year ended 31 Dec.
2019
Net cash from operating activities 425.8 438.1
Dividends received from joint ventures 22.7 20.7 Acquisition of PP&E and intangible assets (199.2) (182.2) Payment of lease liabilities (16.1) (9.8) Free cash flow 233.2 266.8
Non-cash transactions
Non-cash transactions for the year ended 31 December 2020 include the derecognition of capitalised transaction costs and original issue discount in the amount of €17.6 million resulting from the repayment of the secured term loans in June 2020 (see notes 22, 23 and 25). Other non-cash transactions include the initial recognition of leases on the statement of the financial position (see notes 13 and 22). Notably for the year ended 31 December 2020, the increase in right-of-use assets and lease liabilities compared to the prior year is mainly due to the commencement in December 2020 of the 20-year lease of the Group’s second sleeves manufacturing facility in China (with an initial lease liability and related right-of-use asset recognised of approximately €60 million each) but also to an increase of leases of production equipment for closures. The granting of instruments under the Group’s 2019 and 2020 equity-settled share-based payment plans and arrangements are also non-cash transactions (see note 31).
Cash outflows under lease contracts
The total cash outflow for the Group’s lease contracts for the year ended 31 December 2020 was €21.8 million (€15.7 million for the year ended 31 December 2019).
Annual Report 2020
Financials Consolidated financial statements 141

Financials ► Consolidated financial statements 26
Annual Report 2020
OUR OPERATING ASSETS AND LIABILITIES This section includes certain information about the Group’s operating assets and liabilities. The main operating assets relate to the Group’s production equipment and its deployed filling lines accounted for as operating leases. The Group also has right-of-use assets resulting from lease contracts entered into as a lessee. The Group’s trade receivables balance is reduced by selling trade receivables under securitisation and factoring programmes. A substantial part of the Group’s assets relates to goodwill and other intangible assets. Impairment testing of goodwill and trademarks with indefinite useful lives is described in this section. The main operating liabilities relate to trade payables and accruals for various incentive programmes. Other liabilities mainly comprise deferred revenue relating to advance payments received in relation to filling lines deployed under contracts accounted for as operating leases.
12 Property, plant and equipment
Property, plant and equipment (“PP&E”) is mainly composed of filling lines that are deployed at customers’ sites under contracts that qualify to be accounted for as operating leases (see note 5.5.2) and the Group's plant and production equipment. PP&E also includes work in progress, which relates to construction of filling machines and to filling lines under installation at customers’ sites as well as to construction of various types of production equipment used by the Group in its manufacturing and assembly facilities. The Group is a lessor only in respect of its filling lines deployed with its customers.
Composition of PP&E
(In € million) Land Buildings Plant and
equipment Work in
progress Filling
lines Total
Cost 40.1 181.6 620.7 156.0 854.2 1,852.6 Accumulated depreciation and impairment losses - (47.0) (399.6) - (332.9) (779.5) Carrying amount as of 31 December 2019 40.1 134.6 221.1 156.0 521.3 1,073.1
Cost 38.1 173.2 610.2 187.0 875.2 1,883.7 Accumulated depreciation and impairment losses (9.5) (64.4) (443.7) (8.5) (371.0) (897.1) Carrying amount as of 31 December 2020 28.6 108.8 166.5 178.5 504.2 986.6
Carrying amount as of 1 January 2019 39.3 148.2 250.2 170.0 461.1 1,068.8 Additions - 0.5 3.5 167.7 6.5 178.2 Additions through business combination - - 6.4 2.8 4.7 13.9 Reclassification to right-of-use assets - (14.3) (13.3) - - (27.6) Disposals - - (4.3) - (5.4) (9.7) Depreciation - (9.2) (75.5) - (92.5) (177.2) Impairment losses - - - - (2.8) (2.8) Transfers - 7.6 49.3 (186.6) 129.7 - Effect of movements in exchange rates 0.8 1.8 4.8 2.1 20.0 29.5 Carrying amount as of 31 December 2019 40.1 134.6 221.1 156.0 521.3 1,073.1
Annual Report 2020
Financials Consolidated financial statements 142

Financials ► Consolidated financial statements 27
Annual Report 2020
(In € million) Land Buildings Plant and
equipment Work in progress
Filling lines Total
Carrying amount as of 1 January 2020 40.1 134.6 221.1 156.0 521.3 1,073.1 Additions - 0.8 2.4 191.7 4.4 199.3 Disposals - - (0.1) - (0.4) (0.5) Depreciation - (9.1) (62.3) - (88.8) (160.2) Impairment losses (9.2) (11.6) (13.1) (8.6) (1.3) (43.8) Transfers - 1.6 34.7 (149.3) 110.7 (2.3) Effect of movements in exchange rates (2.3) (7.5) (16.2) (11.3) (41.7) (79.0) Carrying amount as of 31 December 2020 28.6 108.8 166.5 178.5 504.2 986.6
Notes 7 and 11 include further information about the Group’s capital expenditure with regard to its production equipment and filling lines.
Depreciation and impairment of PP&E
Depreciation of PP&E is recognised in the following components in the statement of profit or loss and other comprehensive income.
(In € million)
Year ended 31 Dec.
2020
Year ended 31 Dec.
2019
Cost of sales 154.3 170.9 Selling, marketing and distribution expenses 1.0 1.2 General and administrative expenses 4.9 5.1 Total depreciation 160.2 177.2
The impairment losses recognised in the year ended 31 December 2020 primarily relate to production-related assets of Whakatane, the Group’s paper mill in New Zealand. Out of the total amount of impairment losses of €43.8 million, €32.5 million relate to the paper mill (see further note 4). The remaining amount mainly relates to impairment losses resulting from the reallocation of production within the APAC segment. The recoverable amounts of the impaired assets are not material. The impairment losses are recognised as part of cost of sales in the statement of profit or loss and other comprehensive income.
Capital expenditure commitments
As of 31 December 2020, the Group had entered into contracts to incur capital expenditure of €62.0 million (€99.7 million as of 31 December 2019) for the acquisition of PP&E. The commitments relate to filling machine assembly, certain downstream equipment and equipment for the Group’s sleeves manufacturing facilities, including some remaining investments in relation to the second sleeves manufacturing facility in China that became operational in December 2020, which explains the decrease in commitments between the two periods. The new facility is leased by the Group (see note 13).
Annual Report 2020
Financials Consolidated financial statements 143

Financials ► Consolidated financial statements 28
Annual Report 2020
Accounting policy, significant judgements and estimates
Items of PP&E are measured at cost less accumulated depreciation and accumulated impairment losses. Gains and losses on disposals of items of PP&E are recognised in profit or loss as part of other income or expenses.
The cost of an acquired or self-constructed item of PP&E includes any costs directly attributable to bringing the asset to the location and condition necessary for it to be capable of operating in the manner intended by management. Borrowing costs that are directly attributable to the acquisition, construction or production of a qualifying asset form part of the cost of that asset. The cost of the Group’s filling lines also includes the estimated cost of dismantling to the extent such an amount is recognised as a provision. Subsequent expenditure is capitalised only if it is probable that the future economic benefits associated with the expenditure will flow to the Group and the cost can be measured reliably. The costs of the day-to-day servicing of PP&E are recognised in profit or loss as incurred.
Items of PP&E are depreciated on a straight-line basis over their estimated useful lives, with depreciation generally recognised in profit or loss. Land is not depreciated. The estimated useful lives for the current and comparative periods are as follows:
Buildings 15 to 40 years Plant and equipment: Production-related equipment and machinery 4 to 12 years Furniture and fixtures 3 to 8 years Filling lines (leased assets, SIG as the lessor) 10 years
The Group as a lessor – filling lines
The Group mainly deploys filling lines under contracts that qualify to be accounted for as operating leases (see note 5.5.2 for additional details). As further described in this accounting policy section, the filling lines are measured at cost and depreciated over their estimated useful life of ten years and tested for impairment when there is an impairment indicator.
Impairment of PP&E
Items of PP&E are reviewed regularly and at least annually to identify whether there is an indication of impairment. If an impairment indicator exists, the asset’s recoverable amount is estimated. See note 5.5.3 for further details about impairment testing of non-financial assets.
A change in the Group’s intended use of certain assets, such as a decision to rationalise manufacturing locations, may trigger a future impairment. Value in use calculations require management to estimate the future cash flows expected to arise from an individual asset or cash generating unit and to determine a suitable discount rate to calculate present value.
Annual Report 2020
Financials Consolidated financial statements 144

Financials ► Consolidated financial statements 29
Annual Report 2020
13 Right-of-use assets
The Group generally purchases its production-related buildings and equipment (see note 12). However, it also enters into lease contracts. Right-of-use assets relate to lease contracts that the Group has entered into as a lessee. The contracts mainly cover leases of assets such as office buildings, production-related buildings and equipment, warehouses and cars.
Composition of right-of-use assets
(In € million) Buildings Plant and
equipment Cars Total
Cost 29.9 26.4 4.9 61.2 Accumulated depreciation and impairment losses
(5.8) (4.8) (1.6) (12.2)
Carrying amount as of 31 December 2019 24.1 21.6 3.3 49.0
Cost 113.1 49.4 7.5 170.0 Accumulated depreciation and impairment losses
(12.6) (12.7) (3.6) (28.9)
Carrying amount as of 31 December 2020 100.5 36.7 3.9 141.1
Carrying amount as of 1 January 2019 - - - - Initial effect of adopting IFRS 16 12.0 1.1 2.8 15.9 Reclassification from PP&E upon adoption of IFRS 16 14.3 13.3 - 27.6 Additions 2.0 10.1 2.3 14.4 Additions through business combination 0.9 0.5 0.1 1.5 Depreciation (5.3) (3.1) (1.6) (10.0) Other adjustments (0.2) (0.5) (0.3) (1.0) Effect of movements in exchange rates 0.4 0.2 - 0.6 Carrying amount as of 31 December 2019 24.1 21.6 3.3 49.0
Carrying amount as of 1 January 2020 24.1 21.6 3.3 49.0 Additions 86.1 23.8 3.0 112.9 Depreciation (7.3) (8.1) (2.1) (17.5) Other adjustments (0.2) (0.2) (0.2) (0.6) Effect of movements in exchange rates (2.2) (0.4) (0.1) (2.7) Carrying amount as of 31 December 2020 100.5 36.7 3.9 141.1
The Group’s most significant leases are the 20-year lease of its second sleeves manufacturing facility in China that commenced in December 2020, and the 20-year lease of the SIG Tech Centre in China that commenced in 2018. Together, these two leases make up the larger part of the carrying amount of leased buildings. Approximately 70% of the increase in buildings in the year ended 31 December 2020 is related to the lease of the new sleeves manufacturing facility (see also note 11). The Group has entered into an increased number of leases of production equipment for closures during the current year compared to the prior year. The larger part of the plant and equipment category relates to leases of production equipment for closures with a lease term of four to five years. The lease term of other assets is most commonly in the range of three to five years.
Annual Report 2020
Financials Consolidated financial statements 145

Financials ► Consolidated financial statements 30
Annual Report 2020
Depreciation of right-of-use assets
Depreciation of right-of-use assets is recognised in the following components in the statement of profit or loss and other comprehensive income.
(In € million)
Year ended 31 Dec.
2020
Year ended 31 Dec.
2019
Cost of sales 11.8 5.8 Selling, marketing and distribution expenses 3.0 1.8 General and administrative expenses 2.7 2.4 Total depreciation 17.5 10.0
Lease commitments
The Group has entered into lease contracts that have not yet commenced. The present value of estimated future lease payments under these lease contracts approximates €35 million as of 31 December 2020 (€74 million as of 31 December 2019). These contracts mainly concern production equipment for closures, with the leases expected to commence within the next twelve to fifteen months. As of 31 December 2019, the lease commitments mainly related to the 20-year lease of the Group’s second sleeves manufacturing facility in China but also to leases of production equipment for closures.
Accounting policy
At the commencement date of lease, the Group recognises a lease liability and a related right-of-use asset. The accounting for lease liabilities is described in note 22.
The right-of-use asset represents the Group’s right to use the leased asset. A right-of-use asset is initially measured at cost, which in many cases will equal the amount recognised as a lease liability. However, adjustments are required for any lease payments made at or before the commencement date of the lease and any initial direct costs incurred. The cost also includes the estimated cost to dismantle and remove the leased asset, to restore it to the condition required under the lease contract or to restore the site on which it is located, to the extent such an amount is recognised as a provision.
Subsequent to initial recognition, a right-of-use asset is measured at cost less accumulated depreciation and impairment losses. A right-of-use asset is subsequently also adjusted for certain remeasurements of the related lease liability.
Right-of-use assets are depreciated on a straight-line basis from the commencement date of the lease over the shorter of the lease term and their useful lives unless it is reasonably certain that the Group will obtain ownership by the end of the lease term.
As for PP&E, right-of-use assets are reviewed regularly and at least annually to identify whether there is an indication of impairment. If an impairment indicator exists, the asset’s recoverable amount is estimated. See note 5.5.3 for further details about impairment testing of non-financial assets.
Annual Report 2020
Financials Consolidated financial statements 146

Financials ► Consolidated financial statements 31
Annual Report 2020
14 Intangible assets
The largest portion of the Group's intangible assets is goodwill, arising as a result of the acquisition of the Group by Onex in 2015. The other intangible assets mainly consist of trademarks, customer relationships and technology-related assets. The trademarks have indefinite useful lives.
Composition of intangible assets
(In € million) Goodwill Trade-marks
Customer relation-
ships
Technology and other
assets Total
Cost 1,621.9 309.6 646.2 365.2 2,942.9 Accumulated amortisation and impairment losses - - (305.4) (177.2) (482.6) Carrying amount as of 31 December 2019 1,621.9 309.6 340.8 188.0 2,460.3
Cost 1,566.7 311.1 614.6 366.6 2,859.0 Accumulated amortisation and impairment losses - - (351.7) (214.5) (566.2) Carrying amount as of 31 December 2020 1,566.7 311.1 262.9 152.1 2,292.8
Carrying amount as of 1 January 2019 1,583.7 298.2 388.6 216.1 2,486.6 Additions - - - 1.6 1.6 Additions through business combination 14.5 - 9.7 - 24.2 Amortisation - - (63.6) (36.3) (99.9) Effect of movements in exchange rates 23.7 11.4 6.1 6.6 47.8 Carrying amount as of 31 December 2019 1,621.9 309.6 340.8 188.0 2,460.3
Carrying amount as of 1 January 2020 1,621.9 309.6 340.8 188.0 2,460.3 Additions - - - 1.0 1.0 Amortisation - - (62.5) (37.5) (100.0) Impairment losses - - - (0.1) (0.1) Effect of movements in exchange rates (55.2) 1.5 (15.4) 0.7 (68.4) Carrying amount as of 31 December 2020 1,566.7 311.1 262.9 152.1 2,292.8
The acquisition of Visy Cartons in 2019 resulted in an increase of goodwill and customer relationships. See further note 27.
Research and development
Research and development costs (excluding depreciation and amortisation expense) are recognised as a component of general and administrative expenses, totalling €50.9 million for the year ended 31 December 2020 and €51.7 million for the year ended 31 December 2019.
Annual Report 2020
Financials Consolidated financial statements 147

Financials ► Consolidated financial statements 32
Annual Report 2020
Amortisation of intangible assets
Amortisation of intangible assets is recognised in the following components in the statement of profit or loss and other comprehensive income.
(In € million)
Year ended 31 Dec.
2020
Year ended 31 Dec.
2019
Cost of sales 62.6 63.9 General and administrative expenses 37.4 36.0 Total amortisation 100.0 99.9
Annual impairment tests of goodwill and trademarks with indefinite useful lives
Goodwill with a carrying amount of €1,566.7 million as of 31 December 2020 (€1,621.9 million as of 31 December 2019) and trademarks with indefinite useful lives with a carrying amount of €311.1 million as of 31 December 2020 (€309.6 million as of 31 December 2019) are not subject to amortisation but tested for impairment on an annual basis and whenever there is an impairment indicator. The annual impairment tests are performed in the fourth quarter each year.
The Group does not monitor goodwill at a lower level than Group level for internal management purposes but goodwill must for impairment testing purposes be allocated to a cash generating unit (“CGU”), or group of CGUs, that is not larger than an operating segment before aggregation. The Group has allocated the goodwill for impairment testing purposes to its three operating segments (EMEA, APAC and Americas).
Goodwill
For the impairment test of goodwill, the recoverable amount has been estimated with reference to value in use. In assessing the value in use, the estimated future cash flows over the next five years have been discounted to their present value using a pre-tax discount rate that reflects current market assessments of the time value of money as well as the risks specific to each segment. The weighted average cost of capital (“WACC”) is used to determine the discount rate. Cash flows for the first five years are based on financial plans approved by management. Cash flows after the five-year internal planning period are extrapolated using terminal growth rates based on the estimated global and regional market growth for companies in the aseptic carton packaging industry. The terminal growth rates used by the Group for impairment testing purposes are conservative and do not exceed the estimated long-term growth rates in the aseptic carton packaging industry.
Goodwill is allocated to the Group’s three operating (and reportable) segments as per the following table. The goodwill that resulted from the acquisition of Visy Cartons in November 2019 is allocated to APAC and was considered as of 31 December 2019. The table also includes information about the key assumptions used in the impairment test.
Annual Report 2020
Financials Consolidated financial statements 148

Financials ► Consolidated financial statements 33
Annual Report 2020
Year ended 31 December 2020 Year ended 31 December 2019
(In € million or %) Carrying Growth Pre-tax Carrying Growth Pre-tax amount rate discount rate amount rate discount rate
EMEA 757.2 1.25% 6.1% 757.2 1.25% 7.1% APAC 632.7 2.5% 7.8% 657.3 2.5% 9.0% Americas 176.8 2.25% 10.8% 207.4 2.25% 12.1% Total goodwill 1,566.7 1,621.9
No impairment of goodwill was identified in either of the periods. Management considers it unlikely that any realistic change in the assumptions used would result in an impairment loss. The estimated recoverable amounts of the goodwill allocated to the segments significantly exceed the respective carrying amounts in both periods. The Group is overall currently not significantly impacted by the COVID-19 pandemic (see notes 4 and 5.4). Management does not believe that the effects of the COVID-19 pandemic will have any significant long-term negative impacts on the Group’s estimated future cash flows. However, there is no assurance that the Group’s experience to date, which has been reflected in the assessment of future cash flows, will be representative of future periods.
Trademarks with indefinite useful lives
The value of the Group’s trademarks with indefinite useful lives is associated with the Group as a whole. Trademarks are tested for impairment at Group level as all SIG entities benefit from the trademarks. The entities are charged a royalty fee for the use of the SIG trademarks. For the impairment test, the recoverable amount has been estimated with reference to value in use. The assessed royalty fees over the next five years have been discounted to their present value using a pre-tax discount rate at Group level of 7.6% (8.8% in the 2019 annual impairment test) and a terminal growth rate at Group level of 2.0% (2.0% in the 2019 annual impairment test). The WACC is used to determine the discount rate. The royalty fees for the first five years are based on financial plans approved by management. Cash flows after the five-year internal planning period are extrapolated using a terminal growth rate based on the estimated global market growth for companies in the aseptic carton packaging industry. The terminal growth rate used by the Group for impairment testing purposes is conservative and does not exceed the estimated long-term growth rates in the aseptic carton packaging industry.
No impairment of trademarks with indefinite useful lives was identified in any of the periods. Management considers it unlikely that any realistic change in the assumptions used would result in an impairment loss.
Accounting policy
Goodwill arising upon business combinations is measured at cost less accumulated impairment losses. With respect to investments in joint ventures accounted for using the equity method, the carrying amount of goodwill is included in the carrying amount of the investment.
The Group’s trademarks are assessed to have indefinite useful lives considering the long history of the SIG brand and its expected future continuous use. They are measured at cost less accumulated impairment losses. Other intangible assets, including customer relationships and technology assets, have finite useful lives and are measured at cost less accumulated amortisation and accumulated impairment losses. Gains and losses on disposals of intangible assets are recognised in profit or loss as part of other income or expenses.
Annual Report 2020
Financials Consolidated financial statements 149

Financials ► Consolidated financial statements 34
Annual Report 2020
Accounting policy (continued)
Development expenditure is capitalised only if the expenditure can be measured reliably, the product or process is technologically and commercially feasible, future economic benefits are probable and the Group intends to and has sufficient resources to complete the development and to use or sell the asset. If the capitalisation criteria are not met, development expenditure is recognised in profit or loss as incurred. Due to uncertainties inherent in the development of new products and processes, notably regarding the difficulty of reliably estimating expected future economic benefits, development costs typically do not meet the capitalisation criteria but are recognised as general and administrative expenses as incurred. Expenditure on research activities is recognised in profit or loss as incurred.
Intangible assets with finite useful lives are amortised on a straight-line basis over their estimated useful lives, with amortisation generally recognised in profit or loss. The estimated useful lives of amortisable intangible assets for the current and comparative periods are as follows:
Customer relationships 10 years Technology assets (including patented and non-patented technology and know-how) 6 to 10 years Other intangible assets (including software) 3 to 6 years
Impairment of goodwill and other intangible assets
Intangible assets with finite useful lives are reviewed regularly and at least annually to identify whether there is an indication of impairment. If an impairment indicator exists, the asset’s recoverable amount is estimated. Goodwill and intangible assets with indefinite useful lives are tested for impairment on an annual basis and whenever there is an indication that they may be impaired. Note 5.5.3 includes further details about the assessment of the recoverable amounts of non-financial assets and recognition of any impairment losses.
Significant judgements and estimates
Significant judgement is involved in the annual impairment testing of goodwill and trademarks with indefinite useful lives. The judgements and assumptions used in estimating the recoverable amount are included above under “Annual impairment tests of goodwill and trademarks with indefinite useful lives”, where the outcome of the annual impairment tests is also described.
15 Inventories
Composition of inventories and other financial information
(In € million)
As of As of 31 Dec. 31 Dec.
2020 2019
Raw materials and consumables 50.0 56.8 Work in progress 21.0 17.2 Finished goods 99.7 93.2 Total inventories 170.7 167.2
As of 31 December 2020, inventories included a provision of €15.5 million due to write-downs to net realisable value (€17.2 million as of 31 December 2019).
Annual Report 2020
Financials Consolidated financial statements 150
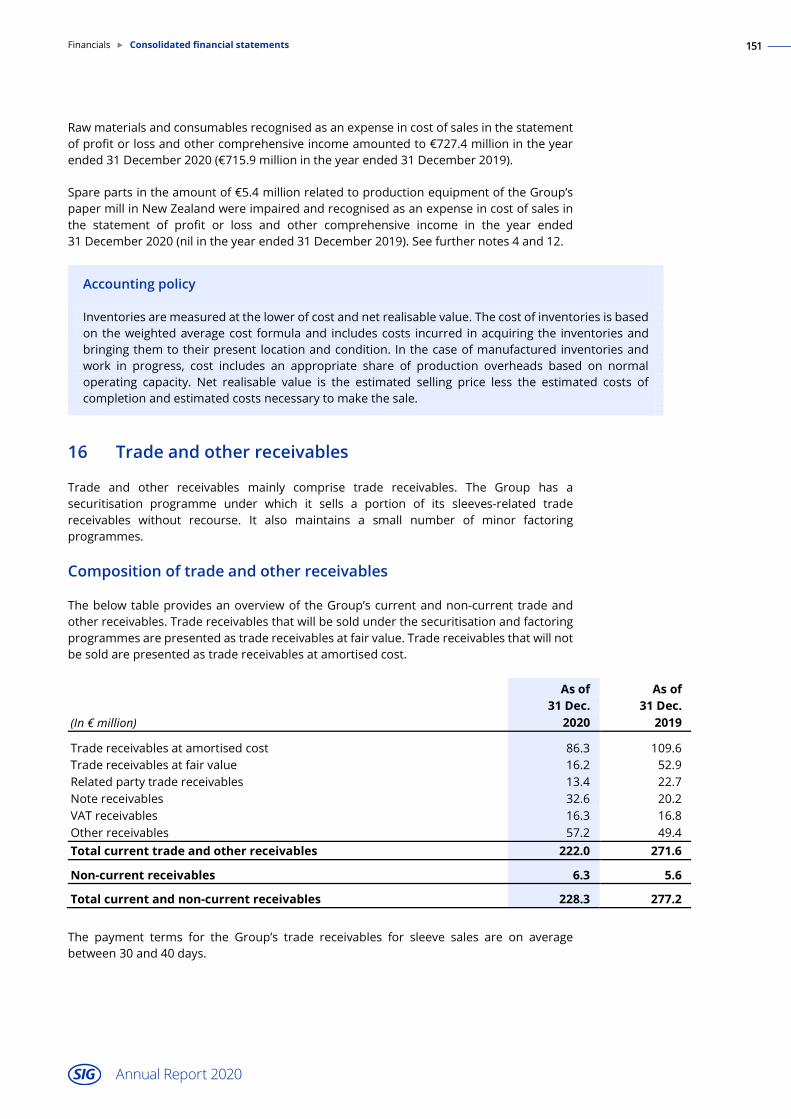
Financials ► Consolidated financial statements 35
Annual Report 2020
Raw materials and consumables recognised as an expense in cost of sales in the statement of profit or loss and other comprehensive income amounted to €727.4 million in the year ended 31 December 2020 (€715.9 million in the year ended 31 December 2019).
Spare parts in the amount of €5.4 million related to production equipment of the Group’s paper mill in New Zealand were impaired and recognised as an expense in cost of sales in the statement of profit or loss and other comprehensive income in the year ended 31 December 2020 (nil in the year ended 31 December 2019). See further notes 4 and 12.
Accounting policy
Inventories are measured at the lower of cost and net realisable value. The cost of inventories is based on the weighted average cost formula and includes costs incurred in acquiring the inventories and bringing them to their present location and condition. In the case of manufactured inventories and work in progress, cost includes an appropriate share of production overheads based on normal operating capacity. Net realisable value is the estimated selling price less the estimated costs of completion and estimated costs necessary to make the sale.
16 Trade and other receivables
Trade and other receivables mainly comprise trade receivables. The Group has a securitisation programme under which it sells a portion of its sleeves-related trade receivables without recourse. It also maintains a small number of minor factoring programmes.
Composition of trade and other receivables
The below table provides an overview of the Group’s current and non-current trade and other receivables. Trade receivables that will be sold under the securitisation and factoring programmes are presented as trade receivables at fair value. Trade receivables that will not be sold are presented as trade receivables at amortised cost.
(In € million)
As of As of 31 Dec. 31 Dec.
2020 2019
Trade receivables at amortised cost 86.3 109.6 Trade receivables at fair value 16.2 52.9 Related party trade receivables 13.4 22.7 Note receivables 32.6 20.2 VAT receivables 16.3 16.8 Other receivables 57.2 49.4 Total current trade and other receivables 222.0 271.6
Non-current receivables 6.3 5.6
Total current and non-current receivables 228.3 277.2
The payment terms for the Group’s trade receivables for sleeve sales are on average between 30 and 40 days.
Annual Report 2020
Financials Consolidated financial statements 151
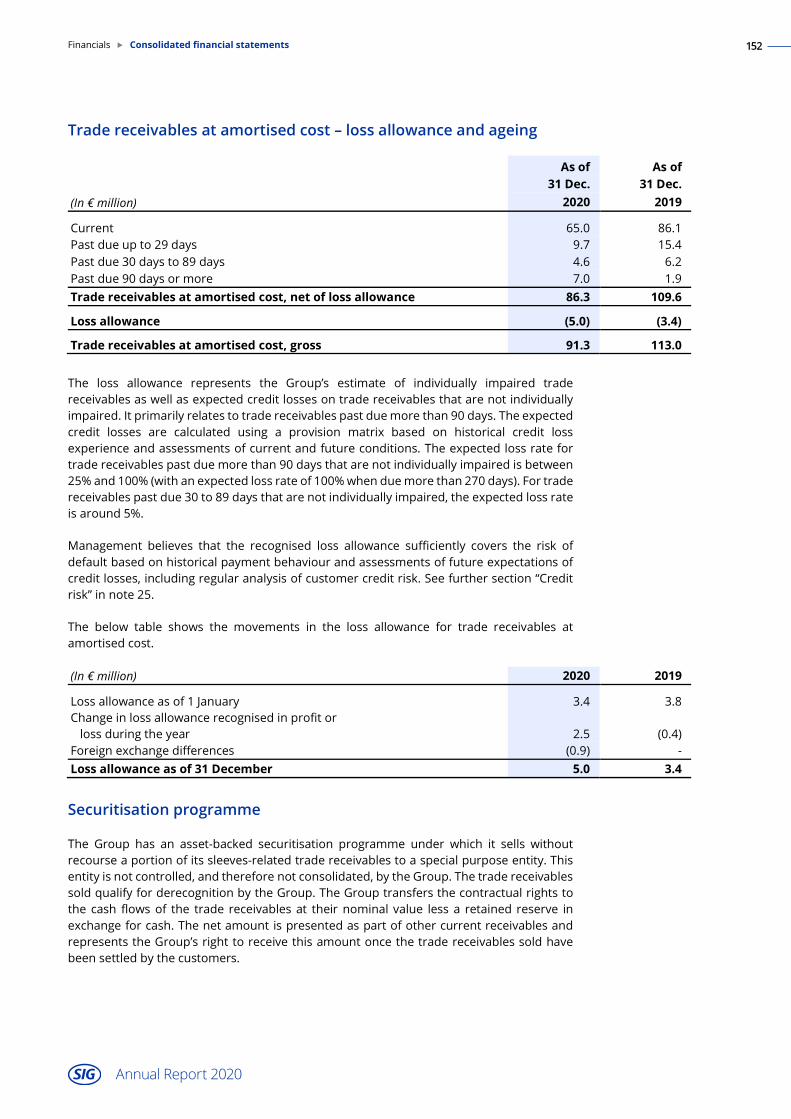
Financials ► Consolidated financial statements 36
Annual Report 2020
Trade receivables at amortised cost – loss allowance and ageing
(In € million)
As of As of 31 Dec. 31 Dec.
2020 2019
Current 65.0 86.1 Past due up to 29 days 9.7 15.4 Past due 30 days to 89 days 4.6 6.2 Past due 90 days or more 7.0 1.9 Trade receivables at amortised cost, net of loss allowance 86.3 109.6
Loss allowance (5.0) (3.4)
Trade receivables at amortised cost, gross 91.3 113.0
The loss allowance represents the Group’s estimate of individually impaired trade receivables as well as expected credit losses on trade receivables that are not individually impaired. It primarily relates to trade receivables past due more than 90 days. The expected credit losses are calculated using a provision matrix based on historical credit loss experience and assessments of current and future conditions. The expected loss rate for trade receivables past due more than 90 days that are not individually impaired is between 25% and 100% (with an expected loss rate of 100% when due more than 270 days). For trade receivables past due 30 to 89 days that are not individually impaired, the expected loss rate is around 5%.
Management believes that the recognised loss allowance sufficiently covers the risk of default based on historical payment behaviour and assessments of future expectations of credit losses, including regular analysis of customer credit risk. See further section “Credit risk” in note 25.
The below table shows the movements in the loss allowance for trade receivables at amortised cost.
(In € million) 2020 2019
Loss allowance as of 1 January 3.4 3.8 Change in loss allowance recognised in profit or loss during the year 2.5 (0.4) Foreign exchange differences (0.9) - Loss allowance as of 31 December 5.0 3.4
Securitisation programme
The Group has an asset-backed securitisation programme under which it sells without recourse a portion of its sleeves-related trade receivables to a special purpose entity. This entity is not controlled, and therefore not consolidated, by the Group. The trade receivables sold qualify for derecognition by the Group. The Group transfers the contractual rights to the cash flows of the trade receivables at their nominal value less a retained reserve in exchange for cash. The net amount is presented as part of other current receivables and represents the Group’s right to receive this amount once the trade receivables sold have been settled by the customers.
Annual Report 2020
Financials Consolidated financial statements 152

Financials ► Consolidated financial statements 37
Annual Report 2020
Trade receivables sold under the securitisation programme amounted to €115.6 million as of 31 December 2020 (€112.5 million as of 31 December 2019), of which €92.1 million (€95.8 million as of 31 December 2019) has been derecognised and €23.5 million (€16.7 million as of 31 December 2019), representing the retained reserve, is presented as part of other current receivables. The retained reserve represents the Group’s maximum exposure to any losses in respect of trade receivables previously sold under the programme. The interest expense paid under the asset-backed securitisation programme amounted to €2.1 million in the year ended 31 December 2020 (€2.4 million as of 31 December 2019) and is presented as part of other finance expenses.
Factoring programmes
The Group has a small number of minor factoring programmes under which trade receivables sold by the Group qualify for derecognition. The factored amounts totalled €13.3 million as of 31 December 2020 (€24.7 million as of 31 December 2019). The interest expense paid under the factoring programme amounted to €0.3 million in the year ended 31 December 2020 (€0.6 million as of 31 December 2019) and is presented as part of other finance expenses.
Accounting policy
Trade receivables at amortised cost
Trade and other receivables that will not be sold under the Group’s securitisation and factoring programmes are initially recognised at fair value plus any directly attributable transaction costs. Subsequent to initial recognition, these receivables are measured at amortised cost using the effective interest method less a loss allowance. The loss allowance represents the Group’s estimate of individually impaired trade receivables as well as expected credit losses on trade receivables that are not individually impaired. The expected credit losses are calculated using a provision matrix based on historical credit loss experience and assessments of current and future conditions. Any subsequent recoveries of amounts previously written off relating to individually impaired trade receivables are credited to the same line item in profit or loss where the original write-off was recognised. The Group holds these trade receivables to collect the contractual cash flows and these cash flows are solely payments of principal and interest on the principal outstanding.
Trade receivables at fair value through profit or loss
Trade receivables that will be sold under the Group’s securitisation and factoring programmes are initially recognised at fair value plus any directly attributable transaction costs. Subsequent to initial recognition, they are also recognised at fair value. These trade receivables are sold and derecognised shortly after their initial recognition in the statement of financial position. Any change in fair value is recognised through profit or loss. The objective with these trade receivables is to realise the cash flows primarily through selling them.
Derecognition of trade receivables
A financial asset is derecognised when the contractual rights to the cash flows from the asset have expired, when the contractual rights to receive the cash flows have been transferred and the Group has transferred substantially all of the risks and rewards of ownership, or when the Group transfers a financial asset but retains the contractual rights to receive the cash flows but at the same time assumes a contractual obligation to pay the cash flows to another recipient (and remits the cash flows to the other recipient once having collected an amount from the original asset without material delay, also being prohibited to sell or pledge the original asset). Any interest in such a derecognised financial asset that is retained by the Group is recognised as a separate asset or liability.
Annual Report 2020
Financials Consolidated financial statements 153

Financials ► Consolidated financial statements 38
Annual Report 2020
17 Cash and cash equivalents
(In € million)
As of As of 31 Dec. 31 Dec.
2020 2019
Cash and cash equivalents (unrestricted) 353.3 254.9 Restricted cash 1.8 6.1 Total cash and cash equivalents 355.1 261.0
Cash and cash equivalents mainly consist of cash at banks but may also include short-term deposits at banks with maturities of three months or less from the date of acquisition that are subject to an insignificant risk of changes in value (€12.5 million as of 31 December 2020 and €35.6 million as of 31 December 2019). The restricted cash relates to cash collected for the benefit of the Group’s securitisation partner.
18 Trade and other payables
Trade and other payables are mainly comprised of trade payables, accruals for various customer incentives and other accrued expenses.
Composition of trade and other payables
(In € million)
As of As of 31 Dec. 31 Dec.
2020 2019
Trade payables 163.9 179.6 Related party payables 0.7 2.9 Liability for various customer incentive programmes 238.7 210.7 VAT payables 8.1 9.5 Accrued interest third parties 5.9 6.2 Other current payables and accrued expenses 83.9 83.4 Current trade and other payables 501.2 492.3
Related party payables 2.6 2.7 Other non-current payables 9.7 7.7 Non-current payables 12.3 10.4
Total current and non-current trade and other payables 513.5 502.7
Liabilities with an impact on the Group’s revenue
In respect of liabilities relating to contracts with customers accounted for under the revenue standard, the Group has refund and contract liabilities.
The Group’s incentive programmes relate to trade discounts, volume rebates and other customer incentives linked to sleeve volumes (see also note 6). These programmes generally run over a calendar year, resulting in a gradual build-up over the year of an accrual liability against revenue from sale of sleeves. As of 31 December 2020 and 31 December 2019, the liabilities for customer incentive programmes mainly represent incentives earned by customers under programmes running over a calendar year that have not yet been settled by the Group. The remaining part represents accruals built up for incentive programmes running over periods other than a calendar year (i.e. refund liabilities). The Group has
Annual Report 2020
Financials Consolidated financial statements 154

Financials ► Consolidated financial statements 39
Annual Report 2020
recognised an insignificant amount as revenue in the current period that was included in the balance of liabilities for customer incentive programmes at the beginning of the period but was never paid out as the conditions for the incentive payments were not met (also applicable to the comparative period).
The Group’s contract liabilities relate to advance payments received from customers in relation to the sale of sleeves and the sale of filling lines under contracts accounted for under the revenue standard. These advance payments are recognised as revenue within a short time frame from their initial recognition in the statement of financial position. As of 31 December 2020, the Group had contract liabilities in the amount of €11.4 million (€11.6 million as of 31 December 2019). These advance payments are presented in the table above as part of other current payables and accrued expenses. The amount of advance payments recognised as of 31 December 2019 has been recognised as revenue in 2020.
Accounting policy and significant estimates
Trade and other payables are initially recognised at fair value less any directly attributable transaction costs. Subsequent to initial recognition, these liabilities are carried at amortised cost using the effective interest method. The liability for accruals for various customer incentives is estimated based on historical and current market trends as further described in note 6. The accruals are presented against revenue.
19 Provisions
The Group’s provisions mainly relate to dismantling costs, warranties and restructuring programmes.
Composition of provisions
(In € million) Dismantling Product
warranty Restructur
-ing Other Total
Carrying amount as of 1 January 2019 11.2 8.4 13.3 3.3 36.2 Provisions made 2.3 5.8 2.2 0.8 11.1 Provisions used (0.2) (4.9) (10.6) (0.3) (16.0) Provisions reversed (1.8) (1.8) (0.4) (0.5) (4.5) Effect of movements in exchange rates 0.7 0.1 - - 0.8 Carrying amount as of 31 December 2019 12.2 7.6 4.5 3.3 27.6
Current 0.1 7.6 3.6 0.8 12.1 Non-current 12.1 - 0.9 2.5 15.5 Carrying amount as of 31 December 2019 12.2 7.6 4.5 3.3 27.6
Carrying amount as of 1 January 2020 12.2 7.6 4.5 3.3 27.6 Provisions made 1.6 8.5 6.3 4.3 20.7 Provisions used - (3.0) (6.9) (0.7) (10.6) Provisions reversed - (3.0) - (0.2) (3.2) Effect of movements in exchange rates (0.9) (0.5) - (0.5) (1.9) Carrying amount as of 31 December 2020 12.9 9.6 3.9 6.2 32.6
Current 0.1 9.6 2.6 1.8 14.1 Non-current 12.8 - 1.3 4.4 18.5 Carrying amount as of 31 December 2020 12.9 9.6 3.9 6.2 32.6
Annual Report 2020
Financials Consolidated financial statements 155

Financials ► Consolidated financial statements 40
Annual Report 2020
Restructuring provision
The Group’s restructuring programmes are focused on reducing costs, streamlining the organisation and adjusting headcount to be more closely aligned with the Group’s needs and changing market demands. Payments are generally expected to be executed within the next one or two years. See also notes 9 and 29.
Other provisions
Other provisions mainly relate to legal claims.
Accounting policy
A provision is recognised if, as a result of a past event, the Group has a present legal or constructive obligation that can be reliably estimated and if it is probable that an outflow of economic benefits will be required to settle the obligation. Provisions are discounted if the time value of money is material. The unwinding of the discount is recognised as part of finance expenses. A provision is classified as current or non-current depending on whether the expected timing of the payment of the amounts provided for is more than 12 months after the reporting date.
A provision for dismantling is recognised when the Group has an obligation to pay for dismantling costs arising upon the return of a filling line. This obligation typically arises upon deployment of the filling line.
A provision for warranties is recognised for products under warranty as of the reporting date based upon known failures and defects as well as sales volumes and past experience of the level of problems reported and products returned.
A provision for restructuring is recognised when the Group has approved a detailed and formal restructuring plan, and the restructuring has either commenced or has been publicly announced. The provision only includes direct costs that are necessarily entailed by the restructuring and not associated with ongoing activities. No provision is made for future operating costs.
A provision for onerous contracts is recognised when the expected benefits to be derived by an entity from a contract are lower than the unavoidable cost of meeting its obligations under the contract.
A provision for legal claims reflects management’s best estimate of the outcome based on the facts known as of the reporting date.
Annual Report 2020
Financials Consolidated financial statements 156

Financials ► Consolidated financial statements 41
Annual Report 2020
20 Other assets and liabilities
Other assets mainly comprise accrued income, prepaid expenses and deferred expenditure. Other liabilities mainly comprise deferred revenue relating to advance payments received in relation to filling lines deployed under contracts that are accounted for as operating leases. The Group’s derivative assets and liabilities are also presented as part of other assets or other liabilities. The derivatives primarily relate to commodity and foreign currency exchange derivatives. Prior to the refinancing transactions in June 2020, the Group also had interest rate swaps. See notes 25 and 33 for additional details about the Group’s derivatives.
Composition of other assets
(In € million)
As of As of 31 Dec. 31 Dec.
2020 2019
Derivative assets 17.6 2.1 Other current assets 10.9 20.1 Other current assets 28.5 22.2
Other non-current assets 23.0 29.3 Other non-current assets 23.0 29.3
Total other current and non-current assets 51.5 51.5
Composition of other liabilities
(In € million)
As of As of 31 Dec. 31 Dec.
2020 2019
Derivative liabilities 5.1 11.1 Deferred revenue 54.7 48.8 Other current liabilities 59.8 59.9
Derivative liabilities - 2.6 Deferred revenue 167.4 162.4 Other non-current liabilities 167.4 165.0
Total other current and non-current liabilities 227.2 224.9
Deferred revenue relates to deployment of filling lines under lease and sale contracts that qualify to be accounted for as operating leases (see notes 5.5.2, 6 and 12 for further details). Advance payments received under such contracts vary between contracts and customers but are recognised as a deferred revenue liability in the statement of financial position and released to profit or loss to achieve recognition of revenue on a straight-line basis over in general ten years for sale contracts and over in general six years for lease contracts.
Annual Report 2020
Financials Consolidated financial statements 157

Financials ► Consolidated financial statements 42
Annual Report 2020
OUR FINANCING AND FINANCIAL RISK MANAGEMENT This section includes information about the Group’s financing in the form of loans and borrowings and equity. The expenses for the financing are also presented in this section. Lastly, the Group’s financial risk management policy and exposure to liquidity, market and credit risks are described.
21 Capital management
The Directors of the Company are responsible for monitoring and managing the Group’s capital structure, which is comprised of equity (share capital and additional paid-in capital) as well as loans and borrowings.
The Directors’ policy is to maintain an acceptable capital base to give confidence to the Group’s shareholders, holders of senior unsecured notes and lenders under the senior unsecured credit facilities, and to sustain the future development of the business. The Directors monitor the Group’s financial position to ensure that it complies at all times with its financial and other covenants as set out in the indenture governing the senior unsecured notes and the credit agreement for the senior unsecured credit facilities, as well as to ensure the payment of an appropriate level of dividends to the shareholders.
As part of monitoring the Group’s financial position, the Directors evaluate the Group’s net debt and development of its net leverage ratio. Net leverage is defined by the Group as net debt divided by adjusted EBITDA. Net debt comprises the Group’s current and non-current loans and borrowings (including lease liabilities, and with notes and credit facilities at principal amounts) less cash and cash equivalents (including any restricted cash). See note 9 for the definition of adjusted EBITDA. The Group is under the credit agreement for its senior unsecured credit facilities required to not exceed a net leverage ratio of 4.5x until 31 December 2020 (4.25x until 31 December 2021 and 4.0x thereafter). Note 22 includes further details about the Group’s loans and borrowings.
The table below presents the components of net debt and the net leverage ratio.
(In € million)
As of As of 31 Dec. 31 Dec. 2020 2019
Gross total debt 1,697.0 1,614.4 Cash and cash equivalents 355.1 261.0 Net total debt 1,341.9 1,353.4
Total net leverage ratio 2.7x 2.8x
The Company purchases its own shares on the market. The repurchased shares are intended to be used to settle the Group’s obligations under its share-based payment plans and arrangements offered to certain members of management and the Board of Directors (see notes 24 and 31).
In order to maintain or adjust the capital structure, the Directors may elect to take a number of measures, including for example to dispose of assets of the business, alter its short- to medium term plans with respect to capital projects and working capital levels, or to rebalance the level of equity and debt in place.
Annual Report 2020
Financials Consolidated financial statements 158

Financials ► Consolidated financial statements 43
Annual Report 2020
22 Loans and borrowings
The Group has in the year ended 31 December 2020, via some of its subsidiaries, issued senior unsecured Euro-denominated notes and entered into new senior unsecured credit facilities. The senior unsecured credit facilities consist of one Euro-denominated term loan and a multi-currency revolving credit facility. The Group repaid its existing Euro-denominated secured term loans, mainly using the proceeds received from the refinancing transactions. The credit agreement covering the new senior unsecured credit facilities was negotiated with a new loan syndicate. Liabilities under lease contracts where SIG is the lessee are also included in loans and borrowings.
Composition of loans and borrowings
The below table shows the carrying amount of the Group’s loans and borrowings.
As of As of 31 Dec. 31 Dec. (In € million) 2020 2019
Senior secured credit facilities - 39.0 Lease liabilities 24.0 11.8 Current loans and borrowings 24.0 50.8
Senior unsecured notes 992.2 - Senior unsecured credit facilities 544.5 - Senior secured credit facilities - 1,500.2 Lease liabilities 123.0 41.7 Non-current loans and borrowings 1,659.7 1,541.9
Total loans and borrowings 1,683.7 1,592.7
The following table presents the components of the carrying amount of the loans and borrowings.
As of As of 31 Dec. 31 Dec. (In € million) 2020 2019
Principal amount 1,000.0 - Deferred transaction costs (7.8) - Senior unsecured notes 992.2 -
Principal amount (including repayments) 550.0 1,560.9 Deferred original issue discount (1.4) (11.2) Deferred transaction costs (4.1) (10.5) Senior unsecured/secured credit facilities 544.5 1,539.2
Lease liabilities 147.0 53.5
Total loans and borrowings 1,683.7 1,592.7
Annual Report 2020
Financials Consolidated financial statements 159

Financials ► Consolidated financial statements 44
Annual Report 2020
Notes – 2020 refinancing
On 18 June 2020, SIG Combibloc PurchaseCo S.à r.l. issued €1,000 million aggregate principal amount of senior unsecured notes. The proceeds from the issue of notes were, together with the proceeds from the new term loan and available cash, used to repay the existing secured term loans. The notes are traded on the Global Exchange Market of Euronext Dublin.
The below table provides a summary of the main terms of the senior unsecured notes.
Principal amount Maturity date Interest rate
2023 notes €450 million 18 June 2023 1.875% 2025 notes €550 million 18 June 2025 2.125%
Interest on the notes is paid semi-annually. The notes can be redeemed in whole or in part prior to 18 March 2023 for the 2023 notes, and prior to 18 March 2025 for the 2025 notes, at par plus a make-whole premium. The notes can be redeemed in whole or in part on or after 18 March 2023 for the 2023 notes, and on or after 18 March 2025 for the 2025 notes, at a price equal to 100% of their respective principal amounts.
Directly attributable transaction costs in the form of arrangement and advisory fees relating to the issue of notes totalled €9.1 million are being amortised over the maturity of the respective notes issue, using the effective interest method.
The obligations under the notes are guaranteed on a senior subordinated basis by Group subsidiaries in Austria, Brazil, Germany, Luxembourg, Switzerland, the United Kingdom and the United States. The indenture governing the notes contains customary restrictive covenants. It also contains customary events of default. The Group was in compliance with all covenants and there were no events of default as of 31 December 2020.
Senior unsecured credit facilities – 2020 refinancing
Certain subsidiaries, including SIG Combibloc PurchaseCo S.à r.l., have in June 2020 entered into new senior unsecured credit facilities, consisting of one Euro-denominated term loan and a multi-currency revolving credit facility. The proceeds from the new term loan were, together with the proceeds from the issue of notes and available cash, used to repay the existing secured term loans.
The below table provides a summary of the main terms of the new unsecured term loan and the revolving credit facility.
Principal amount Maturity date Interest rate
Term loan €550 million June 2025 Euribor+1.00%, with a Euribor floor of 0.00% Revolving credit facility €300 million June 2025 Euribor+1.00%, with a Euribor floor of 0.00%
Interest on the term loan is paid semi-annually. The margin of 1.00% will be subject to half-yearly adjustments based on the Group’s net leverage (as defined in the credit agreement). The margin will also be subject to a maximum 0.05% per annum increase or decrease based upon the achievement of certain annual sustainability-linked targets (greenhouse gas emissions, or “GHG” emissions, and rankings per the EcoVadis Report). No repayments of the term loan are due prior to maturity. The Group has the right to repay the term loan in whole or in part without premium or penalty.
Annual Report 2020
Financials Consolidated financial statements 160

Financials ► Consolidated financial statements 45
Annual Report 2020
Directly attributable transaction costs in the form of arrangement and advisory fees for the term loan amounted to €4.6 million and are, together with an original issue discount of €1.5 million, being amortised over the term of the loan, using the effective interest method.
The amount available under the multi-currency revolving credit facility is €299.4 million as of 31 December 2020 due to €0.6 million in letters of credit being outstanding under an ancillary facility. The Group pays a fee for the undrawn revolver amount per year for the right to use the revolving credit facility (35% of the margin percentage on an annualised basis applied to the undrawn balance of the revolving credit facility).
The obligations under the senior unsecured credit facilities are guaranteed by Group subsidiaries in Austria, Brazil, Germany, Luxembourg, Switzerland, the United Kingdom and the United States. The credit agreement contains customary positive and negative covenants. It also contains customary events of default. The Group was in compliance with all covenants and there were no events of default as of 31 December 2020.
Senior secured credit facilities – pre 2020 refinancing
In June 2020, the Group fully repaid its secured term loans existing as of that time without premium or penalty by using available cash and the proceeds from its new term loan and issue of notes.
The difference between the carrying amount of the secured term loans as of the repayment date and the amount paid is presented as part of the net finance expense. The derivatives associated with the secured term loans were also derecognised. See also note 23.
The below table provides a summary of the main terms of the repaid secured term loan and the revolving credit facility.
Principal amount Maturity date Interest rate
Term loan A €1,250 million October 2023 Euribor+2.00%, with a Euribor floor of 0.00% Term loan B €350 million October 2025 Euribor+2.50%, with a Euribor floor of 0.00% Revolving credit facility €300 million October 2023 Euribor+1.75%, with a Euribor floor of 0.00%
Up until the final repayment of term loan A, the Group made repayments in quarterly instalments of 0.625% of the initial principal amount. No repayments of term loan B were due prior to maturity.
The obligations under the senior secured credit facilities were guaranteed and secured by Group subsidiaries. The credit agreement contained customary affirmative and negative covenants. It also contained customary events of default. The Group was in compliance with all covenants and there were no events of default as of 31 December 2019.
The amount available under the multi-currency revolving credit facility was €297.4 million as of 31 December 2019 due to €2.6 million in letters of credit being outstanding under an ancillary facility.
Annual Report 2020
Financials Consolidated financial statements 161

Financials ► Consolidated financial statements 46
Annual Report 2020
Lease liabilities
A maturity analysis of the Group’s lease liabilities is included below.
Contractual undiscounted
cash flows Interest Lease liabilities (In € million) 2020 2019 2020 2019 2020 2019
Less than 1 year 31.2 13.8 7.2 2.0 24.0 11.8 Between 1 and 5 years 70.3 32.1 27.3 5.8 43.0 26.3 More than 5 years 142.1 26.3 62.1 10.9 80.0 15.4
243.6 72.2 96.6 18.7 147.0 53.5
The Group’s lease liabilities mainly relate to leases of office buildings, production-related buildings and equipment, warehouses and cars (see also note 13). The increase of lease liabilities in the current year is largely attributable to the commencement of the 20-year lease of the Group’s second sleeves manufacturing facility in China. As of 31 December 2020, €60.0 million of the total lease liabilities related to this new lease. The remaining increase in lease liabilities between the years is mainly related to an increased number of leases of production equipment for closures in the current year.
Note 13 includes information about lease contracts to which the Group has committed but where the lease has not yet commenced.
Changes in liabilities arising from financing activities
The following tables present changes in liabilities arising from financing activities, including changes arising from both cash flows and non-cash changes. The main transactions in the year ended 31 December 2020 relate to the issuance of senior unsecured notes and the entering into of new senior unsecured credit facilities as well as the repayment of the secured term loans.
Annual Report 2020
Financials Consolidated financial statements 162

Financials ► Consolidated financial statements 47
Annual Report 2020
(In € million) 1 Jan. 2020
Cash flows from/(used in):
Net effect of early repay-
Fair value changes
and other
Effect of move-
ments in 31 Dec.
2020 Financing activities
Operating activities
-ment of loans
non-cash movements
exchange rates
Principal amount1 1,560.9 (10.9) - - - - 1,550.0 Transaction costs (10.5) - (13.0) 9.5 2.1 - (11.9) Original issue discount (11.2) - (1.5) 10.0 1.3 - (1.4) Loans and borrowings, excl. lease liabilities 1,539.2 (10.9) (14.5) 19.5 3.4 - 1,536.7
Lease liabilities 53.5 (16.1) - - 112.3 (2.7) 147.0 Total loans and borrowings 1,592.7 (27.0) (14.5) 19.5 115.7 (2.7) 1,683.7
Capitalised cost for revolving credit facility (0.8) (0.8) (0.9) 0.7 0.3 - (1.5) Interest: Accrued/paid 6.2 - (38.4) - 38.1 - 5.9 1,598.1 (27.8) (53.8) 20.2 154.1 (2.7) 1,688.1
Derivative (assets)/liabilities from financing activities 2.6 - (2.7) (0.5) 0.6 - - Total (assets)/liabilities from financing activities and cash/non-cash changes 1,600.7 (27.8) (56.5) 19.7 154.7 (2.7) 1,688.1 1 The cash flow amount relating to the principal amount of loans and borrowings (excluding lease liabilities) shows the net effect of issuing notes (€1,000.0 million of
cash inflow) and entering into a new unsecured term loan (€550 million of cash inflow) and repayment of debt (€1,560.9 million of cash outflow, split between quarterly repayments of €7.8 million relating to the secured term loan A and €1,553.1 million relating to the final repayment of the secured term loans A and B). For further information, see previous sections in this note and note 23.
(In € million) 1 Jan. 2019
Cash flows from/(used in):
Fair value changes
and other
Effect of move-
ments in Financing activities
Operating activities
non-cash movements
exchange rates
31 Dec. 2019
Principal amount 1,592.2 (31.3) - - - 1,560.9 Transaction costs (13.1) - - 2.6 - (10.5) Original issue discount (14.2) - - 3.0 - (11.2) Loans and borrowings, excl. lease liabilities 1,564.9 (31.3) - 5.6 - 1,539.2
Lease liabilities 26.5 (5.8) - 32.4 0.4 53.5 Total loans and borrowings 1,591.4 (37.1) - 38.0 0.4 1,592.7
Capitalised cost for revolving credit facility (1.1) - - 0.3 - (0.8) Interest: Accrued/paid 3.3 - (41.7) 44.6 - 6.2 1,593.6 (37.1) (41.7) 82.9 0.4 1,598.1
Derivative (assets)/liabilities from financing activities 1.2 - (1.3) 2.7 - 2.6 Total (assets)/liabilities from financing activities and cash/non-cash changes 1,594.8 (37.1) (43.0) 85.6 0.4 1,600.7
Annual Report 2020
Financials Consolidated financial statements 163

Financials ► Consolidated financial statements 48
Annual Report 2020
Accounting policy
Loans and borrowings (the notes and the term loans) are initially recognised at fair value less any directly attributable transaction costs. Subsequent to initial recognition, these liabilities are measured at amortised cost using the effective interest method. Loans and other borrowings are classified as current or non-current liabilities depending on whether the Group has an unconditional right to defer settlement for at least twelve months after the reporting period.
The accounting for a change to the cash flows of a financial liability measured at amortised cost (such as the Group’s notes and term loans) depends on the nature of change. When a floating rate debt instrument is modified to change its interest rate, the modification is regarded as a repricing to the new market interest rate, which is accounted for prospectively by adjusting the effective interest over the remaining life of the debt instrument. A floating rate instrument is one whose original contractual terms contain a provision such that the cash flows will (or might) be reset to reflect movements in market rates of interest. If a change in cash flows arises due to renegotiation or other modifications (including modifications that do not reflect movements in market rates of interest), and the renegotiation or modification does not result in the derecognition of the financial liability, the gross carrying amount is recalculated and any gain or loss recognised in profit or loss as part of the net finance expense. If a renegotiation or modification represents a settlement of the original debt, it is accounted for as being extinguished.
A financial liability (or a part of it) is derecognised when it is extinguished, i.e. when the contractual obligations are discharged, cancelled, expired or replaced by a new liability with substantially modified terms. The difference between the carrying amount of the financial liability (or part of a financial liability) extinguished and the consideration paid is recognised in profit or loss as part of the net finance expense. Any costs or fees incurred are recognised as part of the gain or loss on extinguishment.
Lease liabilities
The Group’s lease liabilities are initially measured at the present value of the lease payments outstanding as of the commencement date of a lease, discounted at the interest rate implicit in the lease or, if that rate cannot be determined (which is generally the case), at the incremental borrowing rate. Lease payments included in the measurement of the lease liabilities include fixed lease payments and variable lease payments that depend on an index. Other variable lease payments are recognised in profit or loss. The Group does not separate non-lease components from lease components in its lease contracts. Extension, termination and purchase options that, at the commencement date of the lease, are reasonably certain to be exercised are considered when assessing the lease term and/or measuring the lease liability.
Subsequent to initial recognition, the lease liabilities are measured by increasing the carrying amount to reflect interest on the lease liability (applying the effective interest method); reducing the carrying amount to reflect lease payments made; and remeasuring the carrying amount to reflect any contract modifications or reassessments relating to for example changed future lease payments linked to changes in an index and changes in the assessment of whether an extension, termination or purchase option will be exercised.
When a lease liability is remeasured, the corresponding adjustment is generally made to the carrying amount of the related right-of-use asset (see note 13).
Annual Report 2020
Financials Consolidated financial statements 164

Financials ► Consolidated financial statements 49
Annual Report 2020
23 Finance income and expenses
The Group’s net finance expense is mainly related to finance expenses for the Group’s loans and borrowings, fair value changes on associated derivative instruments and foreign exchange gains and losses relating to the loans and borrowings.
Composition of net finance expenses
(In € million)
Year ended 31 Dec.
2020
Year ended 31 Dec.
2019
Interest income 2.1 2.8 Net foreign currency exchange gain - 9.2 Net change in fair value of derivatives 0.5 - Finance income 2.6 12.0
Interest expense on: - Senior unsecured notes (10.7) - - Senior unsecured/secured credit facilities (18.2) (33.9) - Lease liabilities (2.9) (2.2) Amortisation of original issue discount (1.3) (3.0) Amortisation of transaction costs (3.1) (2.8) Net foreign currency exchange loss (19.6) - Net change in fair value of derivatives - (1.5) Net interest expense on interest rate swaps (0.6) (1.3) Net effect of early repayment of secured term loans (19.7) - Other (7.5) (11.9) Finance expenses (83.6) (56.6)
Net finance expense (81.0) (44.6)
The Group used proceeds from its new term loan and issue of notes in June 2020 as well as available cash to repay its existing secured term loans. The net expense effect of the early repayment of the existing secured term loans is €19.7 million, of which €2.1 million relates to cash settlement of interest rate swaps. For additional details, see notes 22 and 25.
Net change in fair value of derivatives consists of fair value changes on financing-related derivatives.
In the year ended 31 December 2020, the net foreign currency exchange loss primarily consists of negative translation effects on Euro-denominated debt held by a US Dollar functional currency entity and on intra-group loan payables, primarily resulting from the weakening of the Brazilian Real against the Euro.
Other finance expenses primarily consist of revolver commitment fees, securitisation and factoring expenses and interest expense on current tax liabilities.
Annual Report 2020
Financials Consolidated financial statements 165

Financials ► Consolidated financial statements 50
Annual Report 2020
24 Equity
This note includes information about the Company’s share capital and dividend payments. The other components of equity consist of additional paid-in capital, the translation reserve, treasury shares and retained earnings. The Company’s shares are listed on SIX Swiss Exchange.
Issued share capital
The Company has 320,053,240 shares in issue as of 31 December 2020 (also as of 31 December 2019 and 1 January 2019), all fully paid. The nominal value of each share is CHF 0.01. Each share is entitled to one vote at shareholders’ meetings. The shareholders are entitled to dividends as declared from time to time. The 320,053,240 shares represent €2.8 million of share capital.
Authorised share capital and conditional share capital
The Company has authorised share capital and conditional share capital of CHF 640,106.48 each as of 31 December 2020 and 31 December 2019.
The Board of Directors’ authority to increase the share capital out of authorised share capital is limited until 7 April 2022. Capital increases from authorised and conditional share capital are mutually exclusive, i.e. they are subject to a single combined limit, and may not exceed 64,010,648 shares (equalling CHF 640,106.48 or 20% of the existing share capital). However, the shares issued from authorised and conditional share capital under the exclusion of subscription and advance subscription rights, respectively, is limited until 7 April 2022 to a single combined maximum of 32,005,324 shares (equalling CHF 320,053.24 or 10% of existing share capital).
The authorised share capital can be used for various purposes. This creates a flexibility to seek additional capital, if required. The conditional share capital is divided into CHF 160,026.62 for employee benefit plans and CHF 480,079.86 for equity linked financing instruments.
See note 4 for information about a planned issue of shares out of the Company’s authorised share capital in connection with the acquisition of the remaining shares in the two joint ventures in the Middle East that is expected to be closed in the first quarter of 2021.
Treasury shares
The Company purchases its own shares on the market to settle its obligations under its share-based payment plans and arrangements (see note 31). The Company held 6,274 shares for this purpose as of 31 December 2020 (6,158 as of 31 December 2019), representing an amount of €0.1 million (€0.1 million as of 31 December 2019). All treasury shares are carried at acquisition cost.
2020 2019 (Number of treasury shares or in € million) Number Amount Number Amount
Balance as of 1 January 6,158 (0.1) - - Purchases 40,000 (0.6) 47,000 (0.5) Transfer under share-based payment plans and arrangements (39,884) 0.6 (40,842) 0.4 Balance as of 31 December 6,274 (0.1) 6,158 (0.1)
Annual Report 2020
Financials Consolidated financial statements 166

Financials ► Consolidated financial statements 51
Annual Report 2020
Dividends
For the year ended 31 December 2020, the Board of Directors will propose to the Annual General Meeting to be held on 21 April 2021 a dividend payment of CHF 0.42 per share, totalling CHF 134.4 million (which, as per the exchange rate as of 31 December 2020, would equal €124.4 million). This amount excludes any additional shares in circulation as a result of the planned acquisition of the remaining shares in the two joint ventures in the Middle East (see note 4). The dividend payment to be proposed is not recognised as a liability.
A dividend of CHF 0.38 per share, totalling CHF 121.6 million (€114.8 million) was paid to shareholders out of the capital contribution reserve (additional paid-in capital) in April 2020. The dividend payment was not recognised as a liability as of 31 December 2019.
A dividend of CHF 0.35 per share, totalling CHF 112.0 million (€99.0 million) was paid to shareholders out of the capital contribution reserve (additional paid-in capital) in April 2019.
Accounting policy
Incremental costs directly attributable to the issue of shares and purchase of treasury shares are recognised as a deduction from equity. Any resulting tax effects of any transaction costs that are recognised in equity are also reflected in equity.
Treasury shares
The cost of repurchased shares is presented as a deduction from equity, in the separate category treasury shares. When treasury shares are subsequently transferred to settle the Group’s obligations under its share-based payment plans and arrangements (or sold, if applicable), the related amount recognised as a share-based payment expense (or any amount received under a sale) is recognised as an increase in equity. Any resulting surplus or deficit is presented as an adjustment to additional paid-in capital. The Group applies the average cost method to calculate the surplus or deficit on the transfer or sale of treasury shares.
25 Financial risk management
In the course of its business, the Group is exposed to a number of financial risks: liquidity risk, market risk (including currency risk, commodity risk and interest rate risk) and credit risk. This note presents the Group’s objectives, policies and processes for managing its exposure to these financial risks. Note 33 includes an overview of the derivative financial instruments that the Group has entered into to mitigate its market risk exposure.
Exposure to liquidity, market and credit risks arises in the normal course of the Group’s business. Management and the Board of Directors have the overall responsibility for the establishment and oversight of the Group’s financial risk management framework. Management has established a treasury policy that identifies risks faced by the Group and sets out policies and procedures to mitigate those risks. Financial risk management is primarily carried out by the Treasury function of the Group. Management has delegated authority levels and authorised the use of various financial instruments to a restricted number of personnel within the Treasury function.
Annual Report 2020
Financials Consolidated financial statements 167

Financials ► Consolidated financial statements 52
Annual Report 2020
Liquidity risk
Liquidity risk is the risk that the Group will not meet contractual obligations as they fall due. The Group evaluates its liquidity requirements on an ongoing basis using various cash and financial planning analyses and ensures that it has sufficient cash to meet expected operating expenses, repayments of and interest payments on its debt and future lease payments.
The Group generates sufficient cash flows from its operating activities to meet obligations arising from its financial liabilities. It has a multi-currency revolving credit facility in place to cover potential shortfalls and access to local working capital facilities in various jurisdictions, which are available if needed to support the cash management of local operations. The Group had unrestricted cash and cash equivalents in the amount of €353.3 million (€254.9 million as of 31 December 2019) and access to an additional €299.4 million under its revolving credit facility as of 31 December 2020 (€297.4 million as of 31 December 2019).
The following table includes information about the remaining contractual maturities for the Group’s non-derivative financial liabilities as of 31 December 2020. The table includes both interest and principal cash flows. Balances due within one year equal their carrying amounts as the impact of discounting is not significant.
Contractual cash flows Carrying Up to More than (In € million) amount Total 1 year 1-2 years 2-5 years 5 years
As of 31 December 2020
Trade and other payables (505.4) (505.4) (493.1) (4.0) (7.5) (0.8) Loans and borrowings: - Senior unsecured notes (992.2) (1,073.0) (20.1) (20.1) (1,032.8) - - Senior unsecured credit facilities (544.5) (579.7) (6.7) (6.7) (566.3) - - Lease liabilities (147.0) (243.6) (31.2) (20.8) (49.5) (142.1) Total non-derivative financial liabilities (2,189.1) (2,401.7) (551.1) (51.6) (1,656.1) (142.9)
The agreements with the Group’s notes holders and the lenders under the senior unsecured notes contain covenants and certain clauses that may require earlier repayments than indicated in the table above. The Group monitors the covenants as well as the aforementioned clauses on a regular basis to ensure that it is in compliance with the agreements at all times.
The interest payments on the senior unsecured credit facilities are variable. The interest rate amounts included in the above table that relate to those facilities will therefore change if the market interest rate (Euribor) changes. The interest rate amounts are also subject to change depending on the Group’s net leverage and the achievement of sustainability-linked targets.
The Group enters into derivative contracts as part of operating and financing the business. The commodity derivative contracts are net cash settled. Other derivative contracts are net or gross cash settled. The derivative asset or liability recognised as of 31 December 2020 and 31 December 2019 represents the liquidity exposure to the Group as of that date (see note 33). The cash flows resulting from a settlement of the derivative contracts may change as commodity prices, interest rates and exchange rates change. However, the overall impact on the Group’s liquidity from the derivative contracts is not deemed to be significant.
Annual Report 2020
Financials Consolidated financial statements 168

Financials ► Consolidated financial statements 53
Annual Report 2020
The following table includes information about the remaining contractual maturities for the Group’s non-derivative financial liabilities as of 31 December 2019.
Contractual cash flows
(In € million) Carrying Up to More than amount Total 1 year 1-2 years 2-5 years 5 years
As of 31 December 2019
Trade and other payables (493.2) (493.2) (482.8) (2.3) (4.9) (3.2) Loans and borrowings: - Senior secured credit facilities (1,539.2) (1,703.5) (73.9) (96.3) (1,176.6) (356.7) - Finance lease liabilities (53.5) (72.2) (13.8) (13.0) (19.1) (26.3) Total non-derivative financial liabilities (2,085.9) (2,268.9) (570.5) (111.6) (1,200.6) (386.2)
Market risks
Market risk is the risk that changes in market prices, such as foreign currency exchange rates, commodity prices and interest rates, will affect the cash flows or the fair value of the Group’s holdings of financial instruments. The objective of market risk management is to manage and control market risk exposures within acceptable parameters.
The Group buys and sells derivatives in the ordinary course of business to manage market risks. The Group does not enter into derivative contracts for speculative purposes. Hedge accounting under IFRS 9 is not applied.
Currency risk
As a result of the Group’s international operations, foreign currency exchange risk exposures exist on sales, purchases, borrowings and dividend payments that are denominated in currencies that are not the functional currency of the entity involved in the transaction. The Group is also exposed to translation currency risk arising from the translation of the assets, liabilities and results of its foreign entities into Euro, the Group’s presentation currency, from their respective functional currencies. The functional currencies of the subsidiaries are mainly Euro, US Dollar, Swiss Franc, Chinese Renminbi, Thai Baht, Brazilian Real, Mexican Peso, Australian Dollar and New Zealand Dollar.
In accordance with the Group’s Treasury policy, the Group seeks to minimise transaction currency risk via natural offsets to the extent possible. Therefore, when commercially feasible, the Group incurs costs in the same currencies in which cash flows are generated. In addition, the Group systematically hedges its major transactional currency exposures, using a twelve-month rolling layered approach. See also note 8.
The Group does not hedge its exposure to translation gains or losses related to the financial results of its non-Euro functional currency entities.
As previously noted, the Group manages operational transaction currency risk via natural offsets and by systematically hedging its major transaction currency exposures (by entering into foreign currency exchange derivative contracts). The following table provides an overview of the outstanding foreign currency exchange derivative contracts entered into as part of the operating business as of 31 December 2020.
Annual Report 2020
Financials Consolidated financial statements 169

Financials ► Consolidated financial statements 54
Annual Report 2020
Type Contract
type Curr-ency
Contracted volume
Counter-currency
Contracted conversion range
Contracted date of maturity
Non-deliverable forwards Buy € 20,145,000 BRL 4.9116 - 6.9580 Jan. 2021 - Dec. 2021 Non-deliverable forwards Sell € 820,000 BRL 6.6684 Jan. 2021 Currency forwards Buy € 32,054,177 THB 34.6594 - 37.6264 Jan. 2021 - Dec. 2021 Currency swap Sell € 320,000 THB 35.9631 Apr. 2021 Currency forwards Sell $ 17,865,000 THB 29.7565 - 32.4070 Jan. 2021 - Dec. 2021 Currency forwards Buy € 27,850,000 CNY 7.7613 - 8.4257 Jan. 2021 - Dec. 2021 Currency forwards Buy $ 23,105,000 CNY 6.5749 - 7.1830 Jan. 2021 - Dec. 2021 Currency swap Sell € 3,100,000 CNY 7.8471 - 8.0323 Jan. 2021 - Apr. 2021 Currency swap Sell $ 3,500,000 CNY 6.5452 - 6.6122 Jan. 2021 Currency swap Buy € 845,000 NZD 1.7338 - 1.7852 Jan. 2021 - Oct. 2021 Currency swap Buy $ 1,220,000 NZD 0.6560 - 0.6683 Jan. 2021 Currency forwards Sell € 13,935,000 NZD 1.7155 - 1.8562 Jan. 2021 - Dec. 2021 Currency forwards Sell $ 22,215,000 NZD 0.5871 - 0.7129 Jan. 2021 - Dec. 2021 Currency forwards Buy € 3,179,500 AUD 1.6122 - 1.6859 Jan. 2021 - Jun. 2021 Currency forwards Buy € 37,948,000 $ 1.0873 - 1.2321 Jan. 2021 - Dec. 2021 Currency swap Buy € 50,000,000 $ 1.2199 Jan. 2021 Currency forwards Buy $ 1,144,226 AUD 0.7566 - 0.7569 Jan. 2021 - May 2021 Currency forwards Buy $ 33,300,000 MXN 19.6999 - 25.6022 Jan. 2021 - Dec. 2021 Currency swap Sell € 16,000,000 $ 1.2279 Jan. 2021 Currency swap Sell $ 5,390,000 MXN 21.2402 - 23.1884 Feb. 2021 - May 2021
The following table provides an overview of the outstanding foreign currency exchange derivative contracts as of 31 December 2019.
Type Contract
type Curr-ency
Contracted volume
Counter-currency
Contracted conversion range
Contracted date of maturity
Non-deliverable forwards Buy € 23,880,000 BRL 4.4065 - 4.8779 Jan. 2020 - Dec. 2020 Non-deliverable forwards Buy $ 745,000 BRL 3.8485 - 4.0652 Jan. 2020 - Apr. 2020 Non-deliverable forwards Sell $ 745,000 BRL 3.9605 - 3.9900 Jan. 2020 - Apr. 2020 Currency forwards Buy € 21,445,000 THB 33.8158 - 36.8500 Jan. 2020 - Dec. 2020 Currency forwards Sell $ 23,757,000 THB 29.8909 - 31.5849 Jan. 2020 - Dec. 2020 Currency forwards Buy € 20,645,000 CNY 7.8033 - 8.1287 Jan. 2020 - Dec. 2020 Currency forwards Buy $ 6,555,000 CNY 6.7446 - 7.2216 Jan. 2020 - Dec. 2020 Currency forwards Sell € 13,110,000 NZD 1.6927 - 1.7221 Jan. 2020 - Dec. 2020 Currency forwards Buy $ 5,000,000 NZD 0.6652 Jun. 2020 Currency forwards Sell $ 24,055,000 NZD 0.6327 - 0.6960 Jan. 2020 - Dec. 2020 Currency forwards Buy € 37,045,000 $ 1.1051 - 1.1777 Jan. 2020 - Dec. 2020 Currency swap Sell € 1,150,000 $ 1.1178 Apr. 2020 Currency forwards Buy $ 31,745,000 MXN 19.4047 - 21.1259 Jan. 2020 - Dec. 2020 Currency swap Sell $ 400,000 MXN 19.7828 Apr. 2020
Annual Report 2020
Financials Consolidated financial statements 170

Financials ► Consolidated financial statements 55
Annual Report 2020
The Group’s primary transaction currency exposure as of 31 December 2020 and 31 December 2019 related to an intra-group Euro-denominated loan held by a Swiss functional currency entity. A 5% weakening of the Euro against the Swiss Franc as of 31 December 2020 (31 December 2019) would have resulted in an additional unrealised foreign currency exchange loss of €14.1 million as of 31 December 2020 (an additional unrealised foreign currency exchange loss of €8.2 million as of 31 December 2019).
Commodity price risk
Commodity price risk is the risk that changes in the price of commodities purchased by the Group and used as inputs in the production process may impact the Group, as such price changes cannot always be passed on to the customers.
The Group’s exposure to commodity price risk arises principally from the purchase of polymers and aluminium. The Group’s objective is to ensure that the commodity price risk exposure is kept at an acceptable level. The Group generally purchases commodities at spot market prices and uses derivatives to hedge the exposure in relation to the cost of polymers (and their feedstocks) and aluminium. Due to this strategy, the Group is able to fix the raw material prices for the coming year for approximately 80% of the anticipated polymers and aluminium purchases, which substantially reduces the exposure to raw material price fluctuations over that period.
The realised gain or loss arising from derivative commodity contracts is recognised in cost of sales, while the unrealised gain or loss associated with derivative commodity contracts is recognised in other income or expenses.
The Group recognised an unrealised gain of €18.8 million in the year ended 31 December 2020 and an unrealised gain of €10.6 million in the year ended 31 December 2019 relating to its derivative commodity contracts as a component of other income. The Group recognised a realised loss of €18.7 million in the year ended 31 December 2020 and a realised loss of €21.5 million in the year ended 31 December 2019 relating to its derivative commodity contracts as a component of cost of sales.
The following table provides an overview of the outstanding commodity derivative contracts as of 31 December 2020.
Type Unit of
measure Contracted
volume Contracted
price range Contracted
date of maturity
Aluminium swaps metric tonne 22,800 $1,564.00 - $1,893.00 Jan. 2021 - Dec. 2021 Aluminium premium swaps metric tonne 8,340 $129.00 - $166.50 Jan. 2021 - Dec. 2021 Polymer swaps metric tonne 36,480 €1,218.00 - €1,294.00 Jan. 2021 - Dec. 2021 Polymer swaps metric tonne 8,280 €1,199.00 - €1,254.00 Jan. 2021 - Dec. 2021 Polymer swaps metric tonne 28,860 $915.00 - $1,020.00 Jan. 2021 - Dec. 2021 Monomer swaps metric tonne 24,540 €863.00 - €905.00 Jan. 2021 - Dec. 2021
Annual Report 2020
Financials Consolidated financial statements 171

Financials ► Consolidated financial statements 56
Annual Report 2020
The following table provides an overview of the outstanding commodity derivative contracts as of 31 December 2019.
Type Unit of
measure Contracted
volume Contracted
price range Contracted
date of maturity
Aluminium swaps metric tonne 23,040 $1,750.00 - $1,979.00 Jan. 2020 - Dec. 2020 Aluminium premium swaps metric tonne 8,280 $159 - $171 Jan. 2020 - Dec. 2020 Polymer swaps metric tonne 36,060 €1,344 - €1,410 Jan. 2020 - Dec. 2020 Polymer swaps metric tonne 8,100 €1,339 - €1,420 Jan. 2020 - Dec. 2020 Polymer swaps metric tonne 29,400 $980.00 - $1,175.00 Jan. 2020 - Dec. 2020 Monomer swaps metric tonne 22,920 €975 - €993.50 Jan. 2020 - Dec. 2020
There would have been an impact of €14.3 million on the Group’s profit from a remeasurement of commodity derivative contracts as of 31 December 2020 (an impact of €14.4 million on the profit as of 31 December 2019), assuming a 10% parallel upward or downward movement in the price curve used to value the commodity derivative contracts and assuming all other variables remain constant.
Interest rate risk
After the refinancing in June 2020, the Group’s interest rate risk primarily arises from its new term loan and drawings of the revolving credit facility at variable interest rates (see note 22) but also from its cash and cash equivalents. The Group pays a fixed interest rate on its notes.
Prior to the refinancing, the Group’s interest rate risk primarily arose from its secured term loans at variable interest rates. The Group had entered into interest rate swaps to hedge a portion of the cash flow exposure that arose on the secured term loans that were repaid in June 2020. The interest rate swaps were terminated at market rates in connection with the repayment of the secured term loans (see notes 22 and 23). The Group had not designated the interest rate swaps as hedging instruments, thus the fair value changes have been recognised in profit or loss.
The interest rate profile of the Group’s significant interest-bearing financial instruments as of 31 December 2020 and 31 December 2019 is presented in the following table.
(In € million)
As of 31 Dec.
2020
As of 31 Dec.
2019
Fixed rate instruments Financial assets 3.9 5.1 Financial liabilities (1,147.0) (53.5) (1,143.1) (48.4) Effect of interest rate swaps - (800.0) (1,143.1) (848.4)
Variable rate instruments Financial assets 355.1 261.0 Financial liabilities (550.0) (1,560.9) (194.9) (1,299.9) Effect of interest rate swaps - 800.0 (194.9) (499.9)
Annual Report 2020
Financials Consolidated financial statements 172

Financials ► Consolidated financial statements 57
Annual Report 2020
A 100 basis point increase in the variable component (six-month Euribor) of the interest rate on the new term loan would increase the annual interest expense by €2.6 million as of 31 December 2020. A 100 basis point increase in the variable component (three-month Euribor) of the interest rate on the secured term loans that were repaid in June 2020 would have increased the annual interest expense by €4.6 million as of 31 December 2019.
Credit risk
Credit risk is the risk of financial loss to the Group if a customer or counterparty to a financial instrument fails to meet its contractual obligations. This risk arises principally from the Group’s receivables from its customers. The carrying amount of financial assets represents the maximum credit exposure. Historically, there has been a low level of losses resulting from default by customers. As the Group’s customers are in the food and beverage industry, management does not believe that there are any material changes to the Group’s exposure to credit risk due to the COVID-19 pandemic.
The credit risk relating to trade receivables is influenced mainly by the individual characteristics of each customer. Given the diverse global operations and customers across the Group, credit control procedures are jointly managed by the Group’s Treasury function and each of the operating businesses within the Group. These joint responsibilities include, but are not limited to, reviewing the individual characteristics of new customers for creditworthiness before accepting the customer and agreeing upon purchase limits and terms of trade as well as regularly reviewing the creditworthiness of existing customers and previously agreed purchase limits and terms of trade.
The Group limits its exposure to credit risk by executing a credit limit policy, requiring advance payments in certain instances, taking out insurance for specific debtors as well as utilising securitisation and non-recourse factoring programmes. These programmes are further described in note 16.
In addition, concentration of credit risk is limited due to the customers comprising a diversified mix of international companies, large national and regional companies as well as small local companies, of which most have been customers of the Group for many years.
Management believes that the recognised loss allowance sufficiently covers the risk of default based on historical payment behaviour and assessments of future expectations of credit losses, including regular analysis of customer credit risk.
In line with its Treasury policy, the Group generally enters into transactions only with banks and financial institutions having a credit rating of at least investment grade (long term: A rating and short term: A1 or P1 rating, as per Standard & Poor’s or Moody’s). However, the Group may also enter into transactions with banks and financial institutions with a currently lower investment grade (long term: BBB rating and short term: A2 or P2 rating).
Annual Report 2020
Financials Consolidated financial statements 173

Financials ► Consolidated financial statements 58
Annual Report 2020
OUR GROUP STRUCTURE AND RELATED PARTIES This section provides details about the Group’s subsidiaries and joint ventures, including certain updates regarding the acquisition of Visy Cartons in 2019. It also covers other related parties.
26 Group entities
The Group only has wholly owned subsidiaries. It also has three joint ventures, with an ownership interest of 50% (see further note 28).
Overview of Group entities
The following table provides an overview of all the Group’s subsidiaries and joint ventures. The ownership and voting interests are the same for all Group entities. The ownership interests are the same as of 31 December 2020 and 31 December 2019, unless specifically stated. The reporting date of all Group entities is 31 December.
The table does not list subsidiaries of the Group’s joint ventures. In the context of the SIX Exchange Regulation Directive on Information relating to Corporate Governance, subsidiaries of the Group’s joint ventures are only listed if considered material. A subsidiary of a joint venture is considered material if its revenue corresponds to more than 5% of the total revenue of such joint venture in the relevant year.
As of 31 December 2020 Companies and countries Share capital8 Interest
Parent company
Switzerland SIG Combibloc Group AG, Neuhausen am Rheinfall1 3,200,532 CHF 100%
Subsidiaries
Argentina Combibloc S.R.L., Buenos Aires 724,015,120 ARS 100% Australia SIG Australia Holding Pty Ltd., Melbourne 32,100,000 AUD 100% SIG Combibloc Australia Pty Ltd., Broadmeadows2 40,000,001 AUD 100% Whakatane Mill Australia Pty Ltd., Melbourne3 - - Austria SIG Austria Holding GmbH, Saalfelden 1,000,000 EUR 100% SIG Combibloc GmbH, Saalfelden 35,000 EUR 100% SIG Combibloc GmbH & Co. KG, Saalfelden 4,500,000 EUR 100% Bangladesh SIG Combibloc Bangladesh Ltd., Dhaka 50,000,000 BDT 100% Brazil SIG Beverages Brasil Ltda., Sao Paulo 109,327,434 BRL 100% SIG Combibloc do Brasil Ltda., Sao Paulo 722,386,462 BRL 100% Chile SIG Combibloc Chile SpA, Santiago4 5,016,722,134 CLP 100%
Annual Report 2020
Financials Consolidated financial statements 174

Financials ► Consolidated financial statements 59
Annual Report 2020
As of 31 December 2020 Companies and countries Share capital8 Interest
China
SIG Combibloc (Suzhou) Co. Ltd., Suzhou 95,000,000 USD 100% Czech Republic SIG Combibloc s.r.o., Hradec Králové 19,340,000 CZK 100% France SIG Combibloc S.à.r.l., Asnières Cedex 31,000 EUR 100% Germany SIG Combibloc GmbH, Linnich 34,494,382 EUR 100% SIG Combibloc Systems GmbH, Linnich 1,000,000 EUR 100% SIG Combibloc Zerspanungstechnik GmbH, Aachen 256,000 EUR 100% SIG Euro Holding GmbH, Linnich 10,000,000 EUR 100% SIG Information Technology GmbH, Linnich 500,000 EUR 100% SIG International Services GmbH, Linnich 1,000,000 EUR 100% Hungary SIG Combibloc Kft., Budapest5 - - India SIG Combibloc India Private Ltd., Gurgaon, Haryana 34,000,000 INR 100% Indonesia P.T. SIG Combibloc Indonesia, Jakarta Selatan 13,549,682,000 IDR 100% Italy SIG Combibloc S.r.l., Parma 101,400 EUR 100% Korea SIG Combibloc Korea Ltd., Seoul 260,000,000 KRW 100% Luxembourg SIG Combibloc Holdings S.à r.l., Munsbach 2,000,001 EUR 100% SIG Combibloc PurchaseCo S.à r.l., Munsbach 4,012,500 EUR 100% Malaysia SIG Combibloc Malaysia SDN. BHD, Kuala Lumpur 1,000,000 MYR 100% Mexico SIG Combibloc México, S.A. de C.V., Mexico City 1,000,000 MXN 100% Netherlands SIG Combibloc B.V., Hengelo 40,000 EUR 100% New Zealand Whakatane Mill Ltd., Whakatane 108,120,047 NZD 100% Poland SIG Combibloc Sp. z o.o., Warsaw 249,934 PLN 100% Romania SIG Combibloc Services S.R.L., Cluj 1,000,000 RON 100% Russia OOO SIG Combibloc, Moscow 5,000,000 RUB 100% Spain SIG Combibloc S.A., Madrid 330,550 EUR 100% Sweden SIG Combibloc AB, Kista 100,000 SEK 100%
Annual Report 2020
Financials Consolidated financial statements 175

Financials ► Consolidated financial statements 60
Annual Report 2020
As of 31 December 2020 Companies and countries Share capital8 Interest
Switzerland SIG allCap AG, Neuhausen am Rheinfall 7,000,000 CHF 100% SIG Combibloc Services AG, Neuhausen am Rheinfall 37,931,400 CHF 100% SIG Combibloc Procurement AG, Neuhausen am Rheinfall 2,000,000 CHF 100% SIG Combibloc Receivables Management AG, Neuhausen am Rheinfall 1,000,000 CHF 100% SIG Schweizerische Industrie-Gesellschaft GmbH, Neuhausen am Rheinfall 20,000 CHF 100% SIG Technology AG, Neuhausen am Rheinfall 3,000,000 CHF 100% Taiwan SIG Combibloc Taiwan Ltd., Taipei 15,000,000 TWD 100% Thailand SIG Combibloc Ltd., Rayong 3,070,693,000 THB 100% United Kingdom SIG Combibloc Ltd., Houghton-le-Spring 1,500,000 GBP 100% USA SIG Combibloc US Acquisition Inc., Wilmington 10 USD 100% SIG Combibloc US Acquisition II Inc., Wilmington 10 USD 100% SIG Combibloc Inc., Wilmington 27,000,000 USD 100% SIG Holding USA, LLC, Wilmington 1,000 USD 100% Vietnam SIG Vietnam Ltd., Ho Chi Minh City 2,000,000,000 VND 100%
Joint ventures
Japan DNP • SIG Combibloc Co., Ltd., Tokyo 75,000,000 JPY 50% Saudi Arabia Al Obeikan SIG Combibloc Company Ltd., Riyadh6, 7 75,000,000 SAR 50% UAE SIG Combibloc Obeikan FZCO, Dubai7 24,000,000 AED 50%
1 The registered address of SIG Combibloc Group AG is Laufengasse 18, 8212 Neuhausen am Rheinfall, Switzerland.
2 Visy Cartons Pty Ltd. was acquired in the fourth quarter of 2019 (see note 27) and renamed to SIG Combibloc Australia Pty Ltd.
3 Whakatane Mill Australia Pty Ltd was liquidated in the second quarter of 2020.
4 Previously SIG Combibloc Chile Ltd. The company converted into a Sociedad por Acciones (SpA) in the first quarter of 2020.
5 SIG Combibloc Kft. was liquidated in the second quarter of 2020.
6 Previously SIG Combibloc Obeikan Company Ltd., renamed to Al Obeikan SIG Combibloc Company Ltd. in the third quarter of 2020.
7 On 25 November 2020, the Group announced its intention to acquire the remaining shares in the two joint ventures in the Middle East. The transaction is expected to close before the end of the first quarter of 2021. See note 4.
8 Unaudited.
Accounting policy/basis of consolidation
Subsidiaries
Subsidiaries are entities controlled by the Group. Control exists when the Group is exposed to, or has rights to, variable returns from its involvement with the entity and has the ability to affect those returns through its power over the entity. Subsidiaries are consolidated from their respective acquisition date, which is the date on which the Group obtains control. Subsidiaries are deconsolidated from their respective disposal date, which is the date on which control ceases. Any resulting gain or loss is recognised in profit or loss.
Annual Report 2020
Financials Consolidated financial statements 176

Financials ► Consolidated financial statements 61
Annual Report 2020
Accounting policy/basis of consolidation (continued)
Interests in joint ventures
A joint venture is a contractual arrangement in which the Group has joint control and has rights to the net assets of the arrangement rather than rights to its assets and obligations for its liabilities. Investments in joint ventures are accounted for using the equity method. On the date joint control is obtained, joint ventures are recognised at cost (including transaction costs). Subsequent to initial recognition, the Group’s share of the profit or loss and other comprehensive income is included in the consolidated financial statements until the date on which joint control ceases.
Intra-group transactions and balances
Intra-group transactions and balances are eliminated upon consolidation. Unrealised gains arising from transactions with joint ventures are eliminated to the extent of the Group’s interest in the investee. Unrealised losses are eliminated in the same manner as unrealised gains, but only to the extent that there is no evidence of impairment.
27 Business combination
Overview
The Group acquired 100% of the shares of Visy Cartons Pty Ltd. (“Visy Cartons”) on a cash-free, debt-free basis on 29 November 2019. Visy Cartons provides carton packaging solutions for beverages in Australia and New Zealand, including SIG’s aseptic carton packaging solutions. It operates a sleeves manufacturing facility in Australia. The Group acquired Visy Cartons to gain full access to the beverage carton market in Australia and New Zealand, and to realise synergies from supply chain efficiencies and the use of the Group’s latest technologies and solutions. Visy Cartons was renamed to SIG Combibloc Australia Pty Ltd. in December 2019 and is part of the Group’s business in Asia Pacific.
Finalisation of the acquisition accounting in 2020
The following tables provide an overview of the consideration transferred, and the recognised amounts of assets acquired and liabilities assumed as of the acquisition date.
(In € million)
Cash paid on acquisition date 40.5 Completion account adjustments 2.5 Fair value of consideration 43.0
Intangible assets 9.7 Property, plant and equipment 13.9 Inventories 10.5 Deferred tax liabilities (2.5) Other net liabilities acquired (3.1) Fair value of identifiable net assets acquired 28.5
Goodwill 14.5
Annual Report 2020
Financials Consolidated financial statements 177

Financials ► Consolidated financial statements 62
Annual Report 2020
The final consideration transferred totals €43.0 million. The Group paid €40.5 million (AUD 65.8 million) in cash on the acquisition date. Management had estimated that it would have an obligation to pay an additional €2.5 million upon the completion settlement and had therefore recognised a liability in the same amount as of 31 December 2019. The completion settlement was finalised in March 2020 and resulted in an additional consideration of €2.5 million. Consequently, there was no impact from the agreed additional payment on the amount of goodwill of €14.5 million initially recognised. The fair value of the identifiable net assets acquired was determined on a provisional basis as of 31 December 2019 but was deemed final in the second half of 2020. The goodwill arising on the acquisition thereby remains unchanged at €14.5 million.
Other information
The goodwill of €14.5 million mainly comprises expectations about expansion of the markets in Australia and New Zealand, introduction of new products in these markets and the skills and competence of the workforce. The goodwill has been allocated to the APAC segment for impairment testing purposes. The intangible assets acquired comprise customer relationships for which the useful lives are assessed to be ten years. The property, plant and equipment balance principally comprises plant and equipment, including filling lines leased to customers under contracts that qualify to be accounted for as operating leases.
The fair value of the customer relationships was assessed by applying the income approach, under which future net cash flows expected to accrue directly or indirectly to the investor are discounted to the present value. More specifically, the multi-period excess earnings method was used. Tax amortisation benefits were considered. Regarding property, plant and equipment, the fair values of production-related equipment and assets such as filling lines were estimated using a cost approach (depreciated replacement cost) while published market data was considered for other assets when possible. The fair value of inventories was estimated based on the estimated selling price in the ordinary course of business less the estimated cost of completion and sale, and reasonable profit margin.
For the one month ended 31 December 2019, Visy Cartons contributed revenue of €4.2 million and profit of €0.3 million to the Group’s results. If the acquisition had occurred on 1 January 2019, management estimates that consolidated revenue would have been €1,822.9 million and that consolidated profit for the year would have been €109.5 million. In determining these amounts, management has assumed that the fair value adjustments as of the date of acquisition would have been the same if the acquisition had occurred on 1 January 2019.
Accounting policy
Business combinations are accounted for using the acquisition method when the acquired set of activities and assets meets the definition of a business. Business combinations are accounted for at the acquisition date, which is when control is obtained. The consideration transferred is generally measured at fair value, as are the identifiable net assets acquired.
Goodwill is measured at the acquisition date as the fair value of the consideration transferred (including, if applicable, the fair value of any previously held equity interests and any non-controlling interests) less the net recognised amount (which is generally fair value) of the identifiable assets acquired and liabilities assumed. If the excess is negative, a bargain purchase gain is recognised immediately in profit or loss.
Annual Report 2020
Financials Consolidated financial statements 178

Financials ► Consolidated financial statements 63
Annual Report 2020
Accounting policy (continued)
Any contingent consideration is measured at fair value at the date of acquisition. If such a contingent consideration depends on the achievement of future earnings or other performance targets, any changes in the fair value are recognised in profit or loss.
Transaction costs, other than those associated with the issue of debt or equity securities incurred in connection with a business combination, are expensed as incurred.
Significant judgements and estimates
Significant judgements and estimates were made by management relating to the accounting for the acquisition of Visy Cartons. For example, the assessment of the fair values and the useful lives of the customer relationships involved significant judgement and estimates.
28 Joint ventures
The Group has investments in three joint ventures, which provide aseptic carton packaging solutions in their respective geographic markets. The Group and its 50-50 joint venture partner, OIG, invested in the two joint ventures in the Middle East in 2001. The joint venture in Japan was formed in 2018 with the joint venture partner DNP.
On 25 November 2020, the Group announced its intention to acquire the remaining shares in the two joint ventures in the Middle East. The transaction is expected to close before the end of the first quarter of 2021. For further information about the planned acquisition, see note 4.
The Group’s share of the profit or loss of its joint ventures (net of income tax) is presented as part of the Group’s profit or loss from operating activities due to the Group’s close interaction with its joint ventures.
Composition of the Group’s joint ventures
The below table provides an overview of the Group’s joint ventures.
Companies
Reporting
date Country of
incorporation
Interest held at
31 Dec.
2020 31 Dec.
2019
Al Obeikan SIG Combibloc Company Ltd.1 31 Dec. Saudi Arabia 50% 50% SIG Combibloc Obeikan FZCO 31 Dec. UAE 50% 50% DNP • SIG Combibloc Co., Ltd. 31 Dec. Japan 50% 50%
1 Previously SIG Combibloc Obeikan Company Ltd., renamed to Al Obeikan SIG Combibloc Company Ltd. in the third quarter of 2020.
Al Obeikan SIG Combibloc Company Ltd. operates a sleeves manufacturing facility in Saudi Arabia from which it supplies sleeves, also to SIG Combibloc Obeikan FZCO. Both of the joint ventures in the Middle East deploy filling lines in the Middle East and Africa and provide sleeves and other associated products and services to their customers.
There have been no significant transactions with the joint venture in Japan in the years ended 31 December 2020 and 31 December 2019.
Annual Report 2020
Financials Consolidated financial statements 179

Financials ► Consolidated financial statements 64
Annual Report 2020
Summary joint venture financial information
The following tables provide summary financial information about the three joint ventures, representing the amounts presented in the IFRS financial statements of the joint ventures and not adjusted for the Group’s ownership percentage.
Current
assets
Non-current
assets Total
assets Current
liabilities
Non-current
liabilities Total
liabilities Net
assets (In € million)
31 December 2020 Al Obeikan SIG Combibloc Company Ltd., Saudi Arabia 57.7 90.5 148.2 31.6 81.0 112.6 35.6 SIG Combibloc Obeikan FZCO, UAE 161.5 177.5 339.0 123.3 184.8 308.1 30.9 DNP • SIG Combibloc Co., Ltd., Japan 1.4 0.6 2.0 1.2 - 1.2 0.8 Total 220.6 268.6 489.2 156.1 265.8 421.9 67.3
31 December 2019 Al Obeikan SIG Combibloc Company Ltd., Saudi Arabia 61.9 110.1 172.0 45.5 99.1 144.6 27.4 SIG Combibloc Obeikan FZCO, UAE 168.1 200.7 368.8 96.4 218.7 315.1 53.7 DNP • SIG Combibloc Co., Ltd., Japan 6.0 - 6.0 6.2 - 6.2 (0.2) Total 236.0 310.8 546.8 148.1 317.8 465.9 80.9
(In € million) Revenue Expenses Profit
after tax
2020 Al Obeikan SIG Combibloc Company Ltd., Saudi Arabia 141.4 (125.2) 16.2 SIG Combibloc Obeikan FZCO, UAE 208.4 (190.9) 17.5 DNP • SIG Combibloc Co., Ltd., Japan 7.0 (6.0) 1.0 Total 356.8 (322.1) 34.7
2019
Al Obeikan SIG Combibloc Company Ltd., Saudi Arabia 162.5 (143.2) 19.3 SIG Combibloc Obeikan FZCO, UAE 213.1 (200.4) 12.7 DNP • SIG Combibloc Co., Ltd., Japan 0.5 (1.7) (1.2) Total 376.1 (345.3) 30.8
Joint venture impact on the consolidated financial statements
(In € million) 2020 2019
Carrying amount as of 1 January 193.4 198.7 Share of profit (net of income tax) 17.4 15.4 Dividends received (22.7) (20.7) Effect of movements in exchange rates (3.8) 0.8 Other 0.2 (0.8) Carrying amount as of 31 December 184.5 193.4
Amount of goodwill in carrying amount of joint ventures as of 31 Dec. 150.8 153.0
Accounting policy
The accounting policy for joint ventures is included in note 26.
Annual Report 2020
Financials Consolidated financial statements 180

Financials ► Consolidated financial statements 65
Annual Report 2020
29 Related parties
The Group has related party relationships with its shareholders, its subsidiaries and joint ventures, its key executive officers and Directors (including the members of the Group Executive Board of SIG and the Board of Directors).
Shareholders
The Company’s shares are listed on SIX Swiss Exchange.
Onex and a number of co-investors related to it gradually reduced their shareholding in the Company in 2020. Onex ceased to be a related party to the Company in August 2020, when its shareholding was reduced to below 20% (to 10.1% of the issued shares). Onex sold its remaining shares in the Company in December 2020. See also the below section “Related party transactions and balances”. According to the disclosure notifications reported to the Company during 2020 and published by the Company via the electronic publishing platform of SIX Swiss Exchange, Onex did not report any shareholding of 3% or more of the voting rights of the Company as of 31 December 2020 (32.9% as of 31 December 2019).
Certain members of SIG management participated in a management equity plan that was established in 2015. They held shares in the Company, acquired at fair value, via its participation in two limited liability partnerships. The limited liability partnerships held 1.1% of the shares as of 31 December 2019. In accordance with the plan regulations, management exercised their right to withdraw from the management equity plan in the first half of 2020. As such, they no longer indirectly hold shares in the Company through such limited liability partnerships.
The members of the Group Executive Board directly held 0.3% of the Company’s shares as of 31 December 2020 (indirectly 0.6% as of 31 December 2019). The members of the Board of Directors directly held 0.07% of the Company’s shares as of 31 December 2020 (directly 0.04% and indirectly 0.06% as of 31 December 2019).
Key management
The Company’s key management include the members of the Group Executive Board of SIG and the Board of Directors.
The below table includes information about compensation to the Group Executive Board.
(In € million)
Year ended 31 Dec.
2020
Year ended 31 Dec.
2019
Short-term employee benefits 6.0 6.8 Post-employment benefits 0.5 0.5 Share-based payments 2.1 1.1 Termination benefits 5.5 - Total compensation to the Group Executive Board 14.1 8.4
An expense of €5.5 million have been recognised in the year ended 31 December 2020 for termination benefits (including non-compete agreements) concerning three former members of the Group Executive Board. The Chief Market Officer (Markus Boehm) left the Company in August 2020 when the Group announced organisational changes in the Group Executive Board, including the elimination of his position and a reallocation of his
Annual Report 2020
Financials Consolidated financial statements 181

Financials ► Consolidated financial statements 66
Annual Report 2020
responsibilities within the Group. The President and General Manager of Europe (Martin Herrenbrück) announced in August 2020 that he would leave the Company as of 31 December 2020. The Chief Executive Officer (Rolf Stangl) announced in November 2020 that he would also leave the Company as of 31 December 2020. Their terminations have been reflected in the measurement of the amount recognised as a share-based payment expense, considering the good and bad leaver clauses in the share-based payment plans in which the three former members of the Group Executive Board participated.
See note 31 for information about the participation of the members of the Group Executive Board in share-based payment plans.
Compensation to the members of the Board of Directors totalled €1.6 million for the year ended 31 December 2020 (€1.6 million for the year ended 31 December 2019). The members of the Board of Directors receive part of their compensation in blocked shares (blocked shares and restricted share units in the year ended 31 December 2019). See note 31 for additional information.
Further details about compensation paid to the members of the Group Executive Board and the Board of Directors can be found in the Compensation Report included elsewhere in the 2020 Annual Report. Information about SIG shareholdings of these persons are included in the section Shareholders above and in the Compensation Report.
Other related parties
The Group’s subsidiaries are listed in note 26. Information about the joint ventures is included in note 28.
Related party transactions and balances
Onex used to provide consultancy services to the Company on various matters without any compensation other than for out-of-pocket expenses. Since December 2020, Onex no longer provides consultancy services to the Company. The information sharing agreement between SIG and Onex was terminated on 6 August 2020, when Onex ceased to be a related party to the Company.
Information about other related parties is provided in the following table. Transactions with Onex portfolio companies are reported up until 6 August 2020.
Transaction values for
the years ended Balance outstanding
as of
(In € million) 31 Dec.
2020 31 Dec.
2019 31 Dec.
2020 31 Dec.
2019
Joint ventures Sale of goods and services (sleeves, liquid paper board, filling machines and related goods and services), revenue under royalty agreements and other transactions/Net receivables 100.2 111.0 10.1 17.1 Purchase of goods 0.4 - - - Dividends received 22.7 20.7 - -
Onex portfolio companies Purchase of goods (supplies and machine parts): - Erwepa/Davis Standard 6.3 4.1 - -
Annual Report 2020
Financials Consolidated financial statements 182

Financials ► Consolidated financial statements 67
Annual Report 2020
There were no other significant related party transactions during the years ended 31 December 2020 and 31 December 2019. As of 31 December 2020, the Group had no commitments to incur capital expenditure with related parties (€9.3 million for the year ended 31 December 2019, concerning Erwepa).
The Group announced on 25 November 2020 that it has entered into an agreement to acquire the remaining 50% of the shares in its two joint ventures in the Middle East. The acquisition is expected to complete before the end of the first quarter of 2021. See further note 4.
Annual Report 2020
Financials Consolidated financial statements 183

Financials ► Consolidated financial statements 68
Annual Report 2020
OUR PEOPLE This section covers information about the Group’s employee-related expenses and pension plans as well as the Group’s share-based payment plans and arrangements. Details about compensation concerning the Group’s key management (Group Executive Board and Board of Directors) are included in note 29 on related parties.
30 Employee benefits
The Group operates various defined benefit plans, of which the largest is in Switzerland.
Overview of employee benefits
(In € million)
As of As of 31 Dec. 31 Dec.
2020 2019
Salaries and wages accrued 41.1 35.6 Provision for annual leave 9.4 9.6 Provision for other employee benefits 2.9 3.0 Net defined benefit obligations: Pension benefit liabilities 128.6 123.3 Total employee benefit liabilities 182.0 171.5
Current 50.5 45.2 Non-current 131.5 126.3 Total employee benefit liabilities 182.0 171.5
The Group has a net defined benefit asset in the amount of €178.5 million as of 31 December 2020 (€168.4 million as of 31 December 2019). It relates to the defined benefit pension plan in Switzerland. The Group’s net defined benefit liabilities relate to defined benefit pension plans in other countries.
Personnel expenses
Personnel expenses recognised in the statement of profit or loss and other comprehensive income were €347.0 million in the year ended 31 December 2020 and €320.6 million in the year ended 31 December 2019.
Defined benefit pension plans
The Group makes contributions to defined benefit pension plans. It operates defined benefit pension plans in countries including Austria, France, Germany, India, Indonesia, Switzerland, Taiwan and Thailand. The majority of the Group’s pension obligations are in Switzerland and are subject to governmental regulations relating to the funding of retirement plans. The Group generally funds its retirement plans in an amount equal to the annual minimum funding requirements specified by government regulations covering each plan. It has generally provided aggregated disclosures in respect of these plans on the basis that these plans are not exposed to materially different risks.
The Group’s largest pension plan is the Swiss retirement plan. As of 31 December 2020, the Swiss retirement plan comprises 74% (75% as of 31 December 2019) of the present value of the Group’s pension plan obligations. Therefore, certain information applicable to the Swiss
Annual Report 2020
Financials Consolidated financial statements 184

Financials ► Consolidated financial statements 69
Annual Report 2020
retirement plan has been separately disclosed. As of 31 December 2020, the fair value of the assets of the Swiss retirement plan exceeded the present value of its pension obligations by €178.5 million (€168.4 million as of 31 December 2019). An assessment of the investment strategy of the Swiss retirement plan is performed yearly.
Expected annual contributions to the Group’s defined benefit pension plans during the year ending 31 December 2021 are estimated to be €5.0 million. The Group’s pension plans had a weighted average duration of 14 years as of 31 December 2020 (13 years as of 31 December 2019).
Movement in net defined benefit obligation
Information about the net defined benefit obligation as of and for the year ended 31 December 2020 and the year ended 31 December 2019 is included below.
Defined benefit
obligation Fair value of plan
assets Net defined benefit
liability/(asset) (In € million) 2020 2019 2020 2019 2020 2019
Carrying amount as of the beginning of the year 504.5 497.0 (549.6) (518.3) (45.1) (21.3) Service cost 7.1 7.6 - - 7.1 7.6 Interest cost/(income) 1.8 4.7 (0.9) (3.6) 0.9 1.1 Administrative expenses - - 0.5 0.5 0.5 0.5 Curtailments 0.2 - - - 0.2 - Total expense/(income) recognised in profit or loss 9.1 12.3 (0.4) (3.1) 8.7 9.2
Actuarial (gains)/losses arising from: Demographic assumptions 9.0 (2.9) - - 9.0 (2.9) Financial assumptions 9.3 22.9 - - 9.3 22.9 Return on plan assets, excluding interest income - - (25.7) (43.3) (25.7) (43.3) Total remeasurement (gains)/losses included in other comprehensive income 18.3 20.0 (25.7) (43.3) (7.4) (23.3)
Contributions by the Group - - (4.8) (4.4) (4.8) (4.4) Contributions by plan participants 1.7 1.7 (1.7) (1.7) - - Benefits paid by the plans (25.6) (41.2) 25.6 41.2 - - Effect of movements in exchange rates 1.2 14.7 (2.5) (20.0) (1.3) (5.3) Total other movements (22.7) (24.8) 16.6 15.1 (6.1) (9.7) Carrying amount as of the end of the year 509.2 504.5 (559.1) (549.6) (49.9) (45.1)
Comprised of:
Swiss retirement plan 376.4 376.9 (554.9) (545.3) (178.5) (168.4) All other plans 132.8 127.6 (4.2) (4.3) 128.6 123.3 Carrying amount as of the end of the year 509.2 504.5 (559.1) (549.6) (49.9) (45.1)
Included in the statement of financial position as: Employee benefits (asset) (178.5) (168.4) Employee benefits (liability) 128.6 123.3 Total net defined pension benefits (49.9) (45.1)
Annual Report 2020
Financials Consolidated financial statements 185

Financials ► Consolidated financial statements 70
Annual Report 2020
Expense recognised in profit or loss
The net pension expense is recognised in the following components in the statement of profit or loss and comprehensive income.
(In € million)
Year ended 31 Dec.
2020
Year ended 31 Dec.
2019
Cost of sales 4.1 4.7 Selling, marketing and distribution expenses 0.9 0.9 General and administrative expenses 3.7 3.6 Total net pension expense 8.7 9.2
thereof the Swiss retirement plan 4.6 4.0
Expense recognised in other comprehensive income
The remeasurement of the Group’s defined benefit pension plans in the year ended 31 December 2020 resulted in a €7.8 million increase, net of income tax, in other comprehensive income (an increase of €24.0 million, net of income tax, in the year ended 31 December 2019).
Plan assets
(In € million)
As of 31 Dec.
2020
As of 31 Dec.
2019
Equity instruments 152.8 149.2 Debt instruments 224.1 216.3 Real estate 159.9 162.0 Other 22.3 22.1 Total plan assets 559.1 549.6
Approximately 99% of total plan assets are held by the Swiss retirement plan as of 31 December 2020 (99% as of 31 December 2019). The debt instruments consist principally of corporate and government bonds. The equity and debt instrument values are based on quoted market prices in active markets. The real estate is held through unlisted funds. The investment policy of the Swiss retirement plan is to target an asset mix of around 25% equity instruments, 45% debt instruments, 25% real estate funds and to hold 5% in cash.
Actuarial assumptions
The amounts recognised under the Group’s defined benefit pension plans are determined using actuarial methods. The actuarial valuations involve assumptions regarding discount rates, expected salary increases and the retirement age of employees. These assumptions are reviewed at least annually and reflect estimates as of the measurement date. Any change in these assumptions will impact the amounts reported in the statement of financial position, plus the net pension expense or income that may be recognised in future years. The mortality table used for the Swiss retirement plan for 2020 and 2019 was BVG 2015 GT.
Annual Report 2020
Financials Consolidated financial statements 186

Financials ► Consolidated financial statements 71
Annual Report 2020
While the Swiss retirement plan does not provide for compulsory benefit increases for pensioners, increases have been granted from time to time at the discretion of the foundation board, depending on the funding situation at the time.
The assumed discount rate and future salary increases are the assumptions with the most significant effect on the defined benefit obligation. They are presented in the below table.
Swiss retirement plan All plans
(In %)
As of 31 Dec.
2020
As of 31 Dec.
2019
As of 31 Dec.
2020
As of 31 Dec.
2019
Discount rates 0.10% 0.15% 0.10% - 6.60% 0.15% - 7.30% Future salary increases 1.50% 1.50% 0.0% - 9.0% 0.00% - 9.00%
The below table shows the effect on the defined benefit obligation of a change in the discount rate and future salary increases.
Swiss retirement plan All plans
(In € million)
As of 31 Dec.
2020
As of 31 Dec.
2019
As of 31 Dec.
2020
As of 31 Dec.
2019
Discount rates 50 basis points increase (4.8) (4.2) (15.3) (14.6) 50 basis points decrease 20.0 17.7 32.2 29.6
Future salary increases
50 basis points increase 1.1 1.2 2.0 2.2 50 basis points decrease (1.0) (1.1) (1.9) (2.1)
A 50 basis points decrease of the discount rate for the Swiss retirement plan would result in a negative discount rate, which explains the increased sensitivity to downward changes in discount rates.
Accounting policy
Short-term employee benefits
Short-term employee benefits are expensed in profit or loss as the related services are provided. A liability is recognised for the amount expected to be paid under short-term cash bonus or profit-sharing plans and outstanding annual leave balances if the Group has a present legal or constructive obligation to pay this amount as a result of past services provided by the employee and the obligation can be estimated reliably.
Pension obligations
The Group operates various defined benefit pension plans. The Group’s obligation with respect to defined benefit plans is calculated separately for each plan by estimating the amount of the future benefits to which employees are entitled in return for their services in the current and prior years, discounting that amount to determine the present value of the Group’s obligation and then deducting the fair value of any plan assets. The discount rate used is the yield on high-quality corporate bonds that are denominated in the currency in which the benefits will be paid and that have maturity dates approximating the terms of the Group’s obligations. The calculations are performed annually by qualified actuaries using the projected unit credit method.
Annual Report 2020
Financials Consolidated financial statements 187
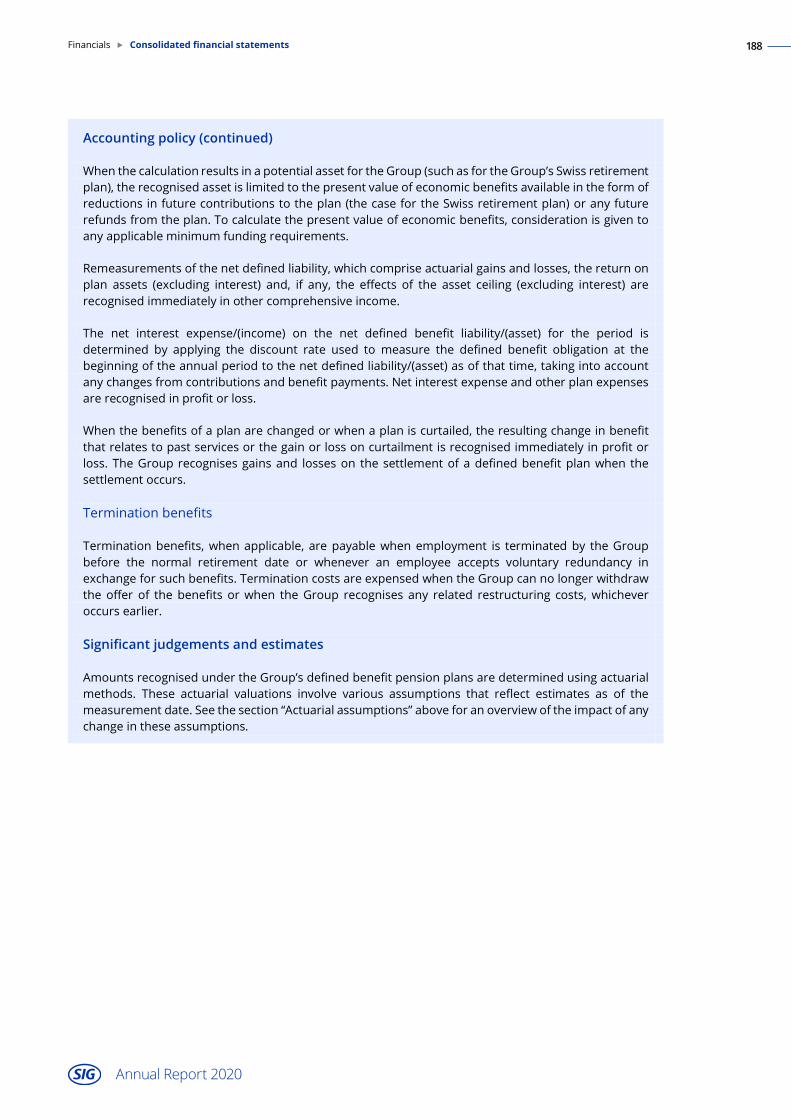
Financials ► Consolidated financial statements 72
Annual Report 2020
Accounting policy (continued)
When the calculation results in a potential asset for the Group (such as for the Group’s Swiss retirement plan), the recognised asset is limited to the present value of economic benefits available in the form of reductions in future contributions to the plan (the case for the Swiss retirement plan) or any future refunds from the plan. To calculate the present value of economic benefits, consideration is given to any applicable minimum funding requirements.
Remeasurements of the net defined liability, which comprise actuarial gains and losses, the return on plan assets (excluding interest) and, if any, the effects of the asset ceiling (excluding interest) are recognised immediately in other comprehensive income.
The net interest expense/(income) on the net defined benefit liability/(asset) for the period is determined by applying the discount rate used to measure the defined benefit obligation at the beginning of the annual period to the net defined liability/(asset) as of that time, taking into account any changes from contributions and benefit payments. Net interest expense and other plan expenses are recognised in profit or loss.
When the benefits of a plan are changed or when a plan is curtailed, the resulting change in benefit that relates to past services or the gain or loss on curtailment is recognised immediately in profit or loss. The Group recognises gains and losses on the settlement of a defined benefit plan when the settlement occurs.
Termination benefits
Termination benefits, when applicable, are payable when employment is terminated by the Group before the normal retirement date or whenever an employee accepts voluntary redundancy in exchange for such benefits. Termination costs are expensed when the Group can no longer withdraw the offer of the benefits or when the Group recognises any related restructuring costs, whichever occurs earlier.
Significant judgements and estimates
Amounts recognised under the Group’s defined benefit pension plans are determined using actuarial methods. These actuarial valuations involve various assumptions that reflect estimates as of the measurement date. See the section “Actuarial assumptions” above for an overview of the impact of any change in these assumptions.
Annual Report 2020
Financials Consolidated financial statements 188

Financials ► Consolidated financial statements 73
Annual Report 2020
31 Share-based payment plans and arrangements
The Group has three share-based long-term incentive plans for certain members of management. The members of the Board of Directors receive a part of their total compensation under share-based payment arrangements. These plans and arrangements have an insignificant impact on the Group’s result. The Group expects to settle its obligations under these plans and arrangements by using own shares (treasury shares) – see note 24.
Share-based long-term incentive plans for SIG management
Performance share unit plan
Since 2019, the Group grants performance share units (“PSUs”) annually to the members of the Group Executive Board and certain other members of management. The terms and vesting conditions of the 2020 PSU plan are equivalent to the terms and vesting conditions of the 2019 PSU plan.
One PSU represents the contingent right to receive one SIG share. The number of granted PSUs is determined by dividing each participant’s award under the plan by the fair value of one PSU at the grant date. Vesting of the PSUs occurs three years after the grant date. The exact number of PSUs that vests depends on the long-term performance of SIG during the vesting period. The plan includes the following vesting conditions:
Service condition: Employment at the vesting date. Two non-market performance conditions: Achievement of a cumulative diluted
adjusted earnings per share target and a cumulative free cash flow target. One market performance condition: Achievement of a relative total shareholder return
target, measured relative to the SPI® ICB Industry Industrials Index (with a vesting factor capped at 1.0 for a negative absolute TSR).
At vesting, the three performance conditions are first assessed individually to determine the level of achievement of the set targets (in a range from 0% to 200%). The achievement percentage of each performance condition is then combined based on a relative weighting of the performance conditions (50% for the total shareholder return target and 25% each for the earnings per share and cash flow targets). The combined vesting multiple determines how many shares the participants are entitled to at the end of the vesting period.
The fair value of one PSU is calculated based on a Monte Carlo simulation model, which reflects the probability of over- or underachieving the market performance condition. The model also takes into account various inputs such as the closing share price of one SIG share on the grant date and adjusts for expected dividends (discounted at a risk-free interest rate) to which the participants of the plan are not entitled until the PSUs vest after three years.
The grant date for the 2020 PSU plan was 1 April 2020 (1 April 2019 for the 2019 PSU plan). Under the 2020 PSU plan, eight employees were granted in total 342,198 PSUs, of which 325,586 PSUs relate to members of the Group Executive Board. Under the 2019 PSU plan, nine employees were granted in total 537,414 PSUs, of which 495,263 PSUs related to members of the Group Executive Board. For the 2020 plan, the fair value of one PSU was CHF 15.05 as of grant date (CHF 9.49 for the 2019 plan).
Three members of the Group Executive Board left the Company in the year ended 31 December 2020 (see further note 29). As a result, the total number of PSUs for both the 2019 and 2020 plans was reduced by 341,414 PSUs. These forfeited PSUs had an impact on the share-based payment expense recognised for the year ended 31 December 2020. As of 31 December 2020, a total of 538,198 PSUs were outstanding.
Annual Report 2020
Financials Consolidated financial statements 189

Financials ► Consolidated financial statements 74
Annual Report 2020
Restricted share unit plan
Since 2019, the Group annually grants restricted share units (“RSUs”) to a small number of selected employees. One RSU represents the contingent right to receive one SIG share, subject to the fulfilment of a three-year service vesting condition. The fair value of one RSU is calculated based on the closing share price of one SIG share on the grant date and adjusted for expected dividends (discounted at a risk-free interest rate) to which the participants of the plan are not entitled until the RSUs vest after three years.
The grant date for the 2020 RSU award was 1 April 2020 (1 April 2019 for the 2019 RSU plan). Under both the 2020 and 2019 RSU plans, two employees were granted a small number of RSUs. For the 2020 plan, the fair value of one RSU was CHF 13.60 as of grant date (CHF 9.27 for the 2019 plan).
Equity investment plan
In 2020, the Group introduced an equity investment plan (“EIP”) for a wider group of management in leadership positions under which the participants have the choice to invest in SIG shares at market value. The shares are blocked for three years. For each purchased share, the Group grants the participants two matching options to purchase another two shares at a pre-defined exercise price at the end of a three-year vesting period.
The grant date for the 2020 EIP award was 31 May 2020. 66 employees were granted in total 220,588 options. The fair value of one option, calculated using the Black-Scholes model, was CHF 2.82 as of grant date.
Share-based payment arrangements for members of the Board of Directors
The members of the Board of Directors receive 40% of their total compensation under share-based payment arrangements. The compensation amount is fixed. The share-based payment compensation is paid out in SIG shares that are blocked for three years. In the year ended 31 December 2019, a couple of members received RSUs instead of blocked shares. The grant date is the date of the Annual General Meeting (generally held in April), when the total compensation package for the next term of office is approved. The compensation is paid out four times during the one-year long term of office (i.e. there are four award dates, each relating to work performed during the quarter before the respective award date). The number of blocked shares is determined by dividing each board member’s individual compensation amount for one award cycle by the average closing price of the SIG share of the first ten trading days of the third month of the quarter for which the blocked shares are granted. The fair value of one blocked share is calculated based on the closing share price of one SIG share on the grant date.
The Group granted 39,884 blocked shares to the members of the Board of Directors in the year ended 31 December 2020 (40,842 blocked shares and 14,236 RSUs in the year ended 31 December 2019). The blocked shares have been delivered by using treasury shares (see note 24). The fair value of one granted instrument was CHF 14.93 as of grant date (CHF 10.02 for the year ended 31 December 2019).
Annual Report 2020
Financials Consolidated financial statements 190

Financials ► Consolidated financial statements 75
Annual Report 2020
Share-based payment expense
The share-based payment expense recognised as a personnel expense in the year ended 31 December 2020 relating to the PSU, RSU and equity investment plans for SIG management amounts to €2.6 million, of which €2.1 million relates to members of the Group Executive Board (€1.2 million for the year ended 31 December 2019, of which €1.1 million related to members of the Group Executive Board).
The share-based payment expense recognised as part of general and administrative expenses in the same period relating to the arrangement for the Board of Directors amounts to €0.6 million (€0.6 million for the year ended 31 December 2019).
Accounting policy
The Group’s share-based payment plans and arrangements are all equity-settled payment arrangements. The grant date fair value of the awards is recognised as an expense, with a corresponding increase in equity (retained earnings), over the vesting period of the awards. The amount recognised as an expense is adjusted to reflect the number of awarded instruments for which the related service and any non-market performance conditions are expected to be met, such that the amount ultimately recognised is based on the number of awarded instruments that meet the related service and any non-market performance conditions at the vesting date. Any market performance conditions are reflected in the grant date fair valuation of the awarded instruments and there is no true-up during the vesting period or at the vesting date for differences between expected and actual outcomes. If there is no vesting period, the grant date fair value is immediately recognised as an expense.
Annual Report 2020
Financials Consolidated financial statements 191

Financials ► Consolidated financial statements 76
Annual Report 2020
OTHER This section provides details about the Group’s income tax exposure, different categories of financial instruments (including derivative instruments), fair value information and off-balance sheet information.
32 Income tax
This note covers the Group’s current and deferred income tax exposure, with corresponding impacts on the statement of profit or loss and other comprehensive income and the statement of financial position. Management believes that its accruals for tax liabilities are sufficient for all open tax years based on its assessment of existing facts, prior experiences and interpretations of tax laws.
The Swiss tax reform became effective on 1 January 2020. It eliminates certain tax privileges for Swiss companies, which were no longer accepted internationally. At the same time, Cantonal and Municipal corporate tax rates were reduced, and new internationally accepted tax benefits introduced. The impact on the Group of the Swiss tax reform is not significant (see also the below section “Reconciliation of effective tax expense”).
Amounts recognised in profit or loss
(In € million)
Year ended 31 Dec.
2020
Year ended 31 Dec.
2019
Current year (70.1) (74.3) Adjustments for prior years 1.3 3.0 Current tax expense (68.8) (71.3)
Origination and reversal of temporary differences 43.2 33.1 Tax rate modifications - (2.0) Recognition of previously unrecognised tax losses 1.5 - Adjustments for prior years 1.1 (0.9) Deferred tax benefit 45.8 30.2
Income tax expense (23.0) (41.1)
Amounts recognised in other comprehensive income
The Group has recognised in other comprehensive income a deferred tax income of €0.3 million relating to the remeasurement of defined benefit plans for the year ended 31 December 2020 (€1.4 million deferred tax income for the year ended 31 December 2019).
Annual Report 2020
Financials Consolidated financial statements 192
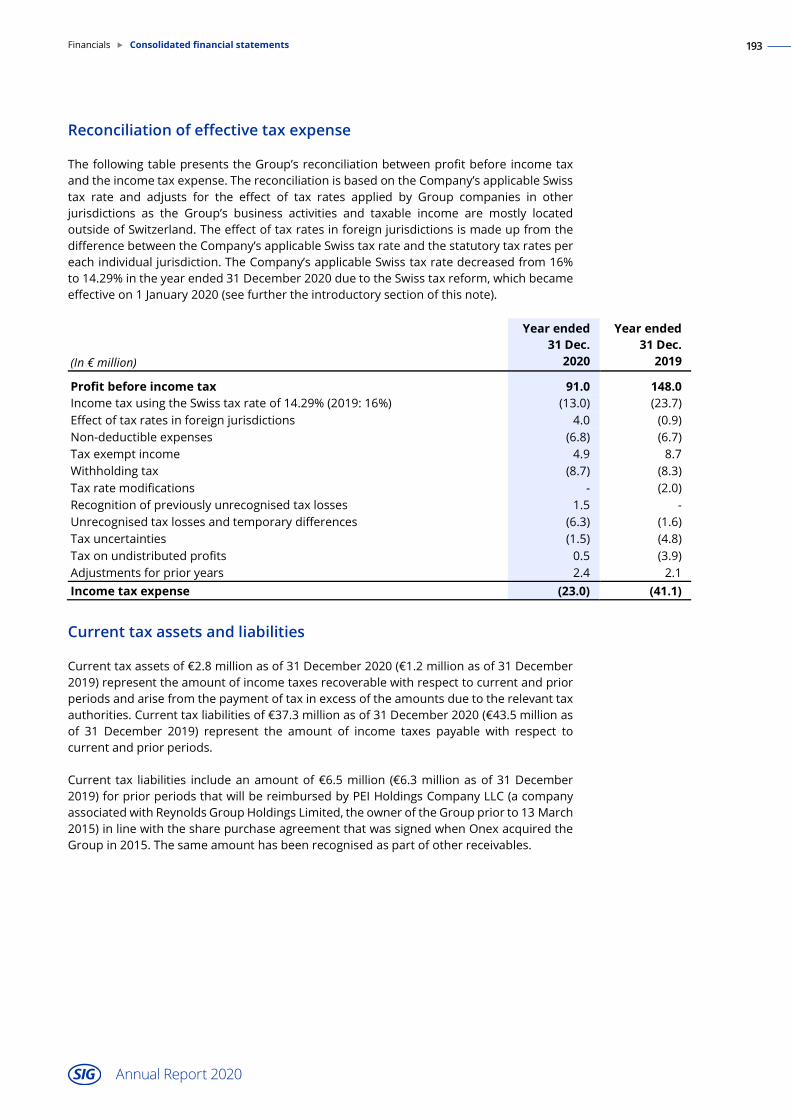
Financials ► Consolidated financial statements 77
Annual Report 2020
Reconciliation of effective tax expense
The following table presents the Group’s reconciliation between profit before income tax and the income tax expense. The reconciliation is based on the Company’s applicable Swiss tax rate and adjusts for the effect of tax rates applied by Group companies in other jurisdictions as the Group’s business activities and taxable income are mostly located outside of Switzerland. The effect of tax rates in foreign jurisdictions is made up from the difference between the Company’s applicable Swiss tax rate and the statutory tax rates per each individual jurisdiction. The Company’s applicable Swiss tax rate decreased from 16% to 14.29% in the year ended 31 December 2020 due to the Swiss tax reform, which became effective on 1 January 2020 (see further the introductory section of this note).
(In € million)
Year ended 31 Dec.
2020
Year ended 31 Dec.
2019
Profit before income tax 91.0 148.0 Income tax using the Swiss tax rate of 14.29% (2019: 16%) (13.0) (23.7) Effect of tax rates in foreign jurisdictions 4.0 (0.9) Non-deductible expenses (6.8) (6.7) Tax exempt income 4.9 8.7 Withholding tax (8.7) (8.3) Tax rate modifications - (2.0) Recognition of previously unrecognised tax losses 1.5 - Unrecognised tax losses and temporary differences (6.3) (1.6) Tax uncertainties (1.5) (4.8) Tax on undistributed profits 0.5 (3.9) Adjustments for prior years 2.4 2.1 Income tax expense (23.0) (41.1)
Current tax assets and liabilities
Current tax assets of €2.8 million as of 31 December 2020 (€1.2 million as of 31 December 2019) represent the amount of income taxes recoverable with respect to current and prior periods and arise from the payment of tax in excess of the amounts due to the relevant tax authorities. Current tax liabilities of €37.3 million as of 31 December 2020 (€43.5 million as of 31 December 2019) represent the amount of income taxes payable with respect to current and prior periods.
Current tax liabilities include an amount of €6.5 million (€6.3 million as of 31 December 2019) for prior periods that will be reimbursed by PEI Holdings Company LLC (a company associated with Reynolds Group Holdings Limited, the owner of the Group prior to 13 March 2015) in line with the share purchase agreement that was signed when Onex acquired the Group in 2015. The same amount has been recognised as part of other receivables.
Annual Report 2020
Financials Consolidated financial statements 193

Financials ► Consolidated financial statements 78
Annual Report 2020
Recognised deferred tax assets and liabilities
(In € million)
As of 31 Dec.
2020
As of 31 Dec.
2019
Included in the statement of financial position as: Deferred tax assets 30.5 21.8 Deferred tax liabilities (132.4) (172.5) Total recognised net deferred tax liabilities (101.9) (150.7)
The below table provides details about the components of deferred tax assets and liabilities.
(In € million)
Property, plant and
equipment Intangible
assets Employee
benefits
Tax loss carry-
forwards Other items
Net deferred tax
assets/ (liabilities)
Carrying amount as of 1 Jan. 2019 (96.3) (141.8) (0.7) 10.7 52.4 (175.7) Additions through business combination (1.2) (2.9) 1.1 - 0.5 (2.5) Recognised in profit or loss 3.1 20.3 2.3 (5.7) 10.2 30.2 Recognised in other comprehensive income - - 1.4 - - 1.4 Effect of movements in exchange rates (3.2) (2.5) (1.9) (0.3) 3.8 (4.1) Carrying amount as of 31 Dec. 2019 (97.6) (126.9) 2.2 4.7 66.9 (150.7)
Carrying amount as of 1 Jan. 2020 (97.6) (126.9) 2.2 4.7 66.9 (150.7) Recognised in profit or loss 8.6 19.3 1.1 (0.1) 16.9 45.8 Recognised in other comprehensive income - - 0.3 - - 0.3 Effect of movements in exchange rates 3.0 4.1 (0.6) - (3.8) 2.7 Carrying amount as of 31 Dec. 2020 (86.0) (103.5) 3.0 4.6 80.0 (101.9)
The net deferred tax assets for other items mainly relate to inventories, receivables, deferred revenue, liabilities for customer incentive programs and, for the year ended 31 December 2020, to a lesser extent derivatives.
Unrecognised deferred tax assets
Deferred tax assets have not been recognised with respect to tax losses in the amount of €23.0 million as of 31 December 2020 (€20.8 million as of 31 December 2019) because management has assessed that it is not probable that future taxable profit will be available against which the Group can utilise the benefits therefrom. The unrecognised tax losses do not expire under the current applicable tax legislation.
Annual Report 2020
Financials Consolidated financial statements 194

Financials ► Consolidated financial statements 79
Annual Report 2020
Accounting policy
Income tax expense is comprised of current and deferred tax. Income tax expense is recognised in profit or loss except to the extent that it relates to a business combination or items recognised directly in equity or in other comprehensive income.
For subsidiaries in which the profits are not considered to be permanently reinvested, the additional tax consequences of future dividend distributions are recognised as income tax expense.
Current tax
Current tax is the expected tax payable or receivable on the taxable income or loss for the year, using tax rates enacted or substantively enacted at the reporting date, and any adjustment to tax payable or receivable in respect to previous years. Current tax assets and liabilities are only offset if certain criteria are met.
Deferred tax
Deferred tax is recognised, using the balance sheet method, on temporary differences between the carrying amounts of assets and liabilities for financial reporting purposes and the amounts used for tax purposes. Deferred tax is not recognised for the following temporary differences: the initial recognition of goodwill, the initial recognition of assets or liabilities in a transaction that is not a business combination and that affects neither accounting nor taxable profit, and differences relating to investments in subsidiaries and joint arrangements to the extent that they probably will not reverse in the foreseeable future and the Group is in a position to control the timing of the reversal of the temporary differences. Deferred tax is measured at the tax rates that are expected to be applied to the temporary differences when they reverse, based on tax rates that have been enacted or substantively enacted at the reporting date.
Deferred tax assets are recognised for unused tax losses, unused tax credits and deductible temporary differences to the extent that it is probable that future taxable profits will be available against which they can be used. Future taxable profits are determined based on business plans for individual subsidiaries in the Group. The recoverability of deferred tax assets is reviewed at each reporting date. Unrecognised deferred tax assets are reassessed at each reporting date and recognised to the extent that it has become probable that future taxable profits will be available against which they can be used.
Deferred tax assets and liabilities are only offset if certain criteria are met.
Significant judgements and estimates
Determining the Group’s worldwide income tax liability requires significant judgement and the use of estimates and assumptions, some of which are highly uncertain. Each tax jurisdiction’s laws are complex and subject to different interpretations by the taxpayer and the respective tax authorities. Significant judgement is required in evaluating the Group’s tax positions, including evaluating uncertainties. To the extent actual results differ from these estimates relating to future periods and depending on the tax strategies that the Group may implement, the Group’s financial position may be directly affected.
Deferred tax assets represent deductions available to reduce taxable income in future years. The Group evaluates the recoverability of deferred tax assets by assessing the adequacy of future taxable income, including reversal of taxable temporary differences, forecasted earnings and available tax planning strategies. Determining the sources of future taxable income relies heavily on the use of estimates. The Group recognises deferred tax assets when the Group considers it probable that the deferred tax assets will be recoverable.
Annual Report 2020
Financials Consolidated financial statements 195

Financials ► Consolidated financial statements 80
Annual Report 2020
33 Financial instruments and fair value information
This note provides an overview of the Group’s financial instruments, including derivative financial instruments, and their categorisation under IFRS. Further details about the different types of financial assets and financial liabilities are provided throughout these consolidated financial statements. This note also contains information about the fair value of the Group’s financial instruments and some general accounting policies covering more than one type of financial assets and liabilities.
Categories of financial instruments and fair value information
The Group’s financial assets and liabilities are classified into the following categories: financial assets at amortised cost, financial assets at fair value through profit or loss, financial liabilities at amortised cost and financial assets and liabilities at fair value through profit or loss.
The following tables present the carrying amounts of financial assets and liabilities as of 31 December 2020 and 31 December 2019. They also present the respective levels in the fair value hierarchy for financial assets and liabilities measured at fair value. Items that do not meet the definition of financial assets or liabilities are not included in the tables.
Carrying amount as of 31 December 2020
(In € million)
At amortised
cost
At fair value through
profit or loss (mandatorily) Total
Fair value hierarchy
Level 1 2 3
Cash and cash equivalents 355.1 355.1 Trade and other receivables 194.0 16.2 210.2 x Other financial assets 3.9 3.9 Derivatives 17.6 17.6 x Total financial assets 553.0 33.8 586.8
Trade and other payables (505.4) (505.4) Loans and borrowings: - Senior unsecured notes (992.2) (992.2) - Senior unsecured credit facilities (544.5) (544.5) - Lease liabilities (147.0) (147.0) Derivatives (5.1) (5.1) x Total financial liabilities (2,189.1) (5.1) (2,194.2)
Annual Report 2020
Financials Consolidated financial statements 196

Financials ► Consolidated financial statements 81
Annual Report 2020
Carrying amount as of 31 December 2019
(In € million)
At amortised
cost
At fair value through
profit or loss (mandatorily) Total
Fair value hierarchy
Level 1 2 3
Cash and cash equivalents 261.0 261.0 Trade and other receivables 205.9 52.9 258.8 x Other financial assets 5.1 5.1 Derivatives 2.1 2.1 x Total financial assets 472.0 55.0 527.0
Trade, other payables and other liabilities (493.2) (493.2) Loans and borrowings: - Senior secured credit facilities (1,539.2) (1,539.2) - Lease liabilities (53.5) (53.5) Derivatives (13.7) (13.7) x Total financial liabilities (2,085.9) (13.7) (2,099.6)
Fair value of financial assets and liabilities at amortised cost
The carrying amount of the financial assets and liabilities that are not measured at fair value is a reasonable approximation of fair value. Excluding transaction costs and an original issue discount, this is also the case for the Group’s term loan that was entered into in June 2020. The fair value of the notes was €1,042 million as of 31 December 2020.
Fair value of trade receivables to be sold under securitisation and factoring programmes
Trade receivables that will be sold under the Group’s securitisation and factoring programmes are categorised as measured at fair value through profit or loss. They are sold shortly after being recognised by the Group and the amount initially recognised for these trade receivables is representative of their fair value.
Fair value of derivatives
The derivatives are entered into as part of the Group’s strategy to mitigate operational risks (commodity and foreign currency exchange derivatives) and to mitigate financing risks (interest rate swaps, for the secured term loans repaid in June 2020).
The following tables show the types of derivatives the Group had as of 31 December 2020 and 31 December 2019, and their presentation in the statement of financial position.
(In € million) Current
assets
Non-current
assets
Totalderivative
assetsCurrent
liabilities
Non-current
liabilities
Total derivative liabilities
Commodity derivatives 11.4 - 11.4 (0.8) - (0.8) Foreign currency exchange derivatives 6.2 - 6.2 (4.3) - (4.3) Total operating derivatives 17.6 - 17.6 (5.1) - (5.1)
Total derivatives as of 31 December 2020 17.6 - 17.6 (5.1) - (5.1)
Annual Report 2020
Financials Consolidated financial statements 197

Financials ► Consolidated financial statements 82
Annual Report 2020
(In € million) Current
assets
Non-current
assets
Totalderivative
assetsCurrent
liabilities
Non-current
liabilities
Total derivative liabilities
Commodity derivatives 0.8 - 0.8 (8.7) - (8.7) Foreign currency exchange derivatives 1.3 - 1.3 (2.4) - (2.4) Total operating derivatives 2.1 - 2.1 (11.1) - (11.1)
Interest rate swaps - - - - (2.6) (2.6) Total financing derivatives - - - - (2.6) (2.6)
Total derivatives as of 31 December 2019 2.1 - 2.1 (11.1) (2.6) (13.7)
The Group measures derivative assets and liabilities at fair value. The fair value is calculated based on valuation models commonly used in the market. These include consideration of credit risk, where applicable, and discounts the estimated future cash flows based on the terms and maturity of each contract, using forward interest rates extracted from observable yield curves and market forward exchange rates at the reporting date. The derivatives are categorised as level 2 fair value measurements in the fair value hierarchy as the measurements of fair value are based on observable market data, either directly (i.e. as prices) or indirectly (i.e. derived from prices). All changes in fair value are recognised in profit or loss as the Group does not apply hedge accounting under IFRS 9.
Accounting policy
The specific accounting policies for the Group’s different types of financial assets and liabilities are included in other sections of these consolidated financial statements. This section includes the accounting policy for topics covering more than one note.
Initial recognition of financial assets and liabilities
The Group initially recognises loans and receivables and any debt issued on the date when they are originated. All other financial assets and liabilities are initially recognised on the trade date when the entity becomes party to the contractual provisions of the financial instrument.
Offsetting
Financial assets and financial liabilities are only offset and the net amount presented in the statement of financial position when the Group currently has a legally enforceable right to offset the amounts and intends to either settle them on a net basis or realise the asset and settle the liability simultaneously.
Derivatives
Derivatives are measured at fair value with any related transaction costs expensed as incurred. All derivatives with a positive fair value are presented as other current or non-current assets in the statement of financial position, while all derivatives with a negative fair value are presented as other current or non-current liabilities.
The gain or loss on remeasurement to fair value is recognised in profit or loss. Net changes in the fair value of derivatives entered into as part of the operating business are presented as part of profit from operating activities, while net changes in the fair value of derivatives entered into in relation to the financing of the Group are presented in other finance income or expenses. The Group does not apply hedge accounting under IFRS.
Annual Report 2020
Financials Consolidated financial statements 198

Financials ► Consolidated financial statements 83
Annual Report 2020
Accounting policy (continued)
A derivative embedded in another contract is separated and accounted for separately when its economic characteristics and risks are not closely related to those of its host contract, a separate instrument with the same terms as the embedded derivative would meet the definition of a derivative, and the host contract is not measured at fair value with the fair value changes recognised in profit or loss. Changes in the fair value of a separated embedded derivative are recognised immediately in profit or loss.
34 Contingent liabilities
The Group has contingent liabilities relating to legal and other matters arising in the ordinary course of business. Based on legal and other advice, management is of the view that the outcome of any such proceedings will have no significant effect on the financial position of the Group beyond the recognised provision.
Accounting policy
Contingent liabilities are possible obligations arising from a past event to be confirmed by future events not wholly within the control of the Group, or present obligations arising from a past event of which the outflow of economic benefits is not probable, or which cannot be measured reliably. Contingent liabilities are not recognised in the statement of financial position, except for certain items assumed in a business combination, but are separately disclosed.
35 Subsequent events
There have been no events between 31 December 2020 and 18 February 2021 (the date these consolidated financial statements were approved) that would require an adjustment to or disclosure in these consolidated financial statements, expect for the disclosures given in note 4 regarding organisational changes in the Group Executive Board and the strategic assessment of the Group’s paper mill in New Zealand resulting in a decision to close the paper mill. This statement is also applicable regarding the assessment of information relating to the COVID-19 pandemic (see note 5.4).
Annual Report 2020
Financials Consolidated financial statements 199

to the General Meeting of SIG Combibloc Group AG Neuhausen am Rheinfall
Report on the audit of the consolidated financial statements
Opinion
WehaveauditedtheauditedtheconsolidatedfinancialstatementsofSIGCombiblocGroupAGand itssubsidiaries (theGroup),whichcomprisetheconsolidatedstatementofprofitorlossandothercomprehensiveincomefortheyearended31December2020,theconsolidatedstatementoffinancialpositionasat31December2020,theconsolidatedstatementofchangesinequity, theconsolidatedstatementofcashflows,andnotes to theconsolidatedfinancialstatementsfortheyearthenended,includingasummaryofsignificantaccountingpolicies.
Inouropinion,theconsolidatedfinancialstatements(pages118to199)giveatrueandfairviewoftheconsolidatedfinancialpositionoftheGroupasat31December2020anditsconsolidatedfinancialperformanceanditsconsolidatedcashflowsfortheyearthenendedinaccordancewiththeInternationalFinancialReportingStandards(IFRS)andcomplywithSwisslaw.
Basis for opinion
WeconductedourauditinaccordancewithSwisslaw,InternationalStandardsonAuditing (ISAs)andSwissAuditingStandards.Ourresponsibilitiesunderthoseprovisionsandstandardsarefurtherdescribed in the“Auditor’s responsibilities for theauditof theconsolidatedfinancialstatements”sectionofourreport.
We are independent of the Group in accordance with the provisions of Swiss law and the requirements of the Swiss audit profession, aswell as the International Code of Ethics forProfessionalAccountants(includingInternationalIndependenceStandards)oftheInternationalEthicsStandardsBoardforAccountants(IESBACode),andwehavefulfilledourotherethicalresponsibilitiesinaccordancewiththeserequirements.Webelievethattheauditevidencewehaveobtainedissufficientandappropriatetoprovideabasisforouropinion.
Our audit approach
OVERVIEW
OverallGroupmateriality:EUR17,000,000
Weconcludedfullscopeauditworkat7whollyownedGroupcompaniesin6countries.Ourauditscopeaddressedover81%oftheGroup'srevenue.
Askeyauditmatterthefollowingareaoffocushasbeenidentified:Recoverability of carrying amount of goodwill
REPORT OF THE STATUTORY AUDITOR
Materiality
Audit scope
Key auditmatters
Annual Report 2020
200Financials Report of the statutory auditor

Materiality
Thescopeofourauditwasinfluencedbyourapplicationofmateriality.Ourauditopinionaimstoprovidereasonableassurancethattheconsolidatedfinancialstatementsarefreefrommaterialmisstatement.Misstatementsmayariseduetofraudorerror.Theyareconsideredmaterialif, individuallyorinaggregate,theycouldreasonablybeexpectedtoinfluencetheeconomicdecisionsofuserstakenonthebasisoftheconsolidatedfinancialstatements.
Based on our professional judgement, we determined certain quantitative thresholds for materiality,includingtheoverallGroupmaterialityfortheconsolidatedfinancialstatementsasawholeassetoutinthetablebelow.These,togetherwithqualitativeconsiderations,helpedustodetermine the scope of our audit and the nature, timing and extent of our audit procedures and toevaluatetheeffectofmisstatements,bothindividuallyandinaggregate,ontheconsolidatedfinancialstatementsasawhole.
Overall Group materiality EUR17,000,000
How we determined it 1%oftotalrevenue
Rationale for the materiality benchmark applied
We chose total revenue as the benchmark as, in our view, it is the most appropriatemeasureconsideringtheGroup’scurrentyear’sresultisimpactedbyeffectsfrompurchasepriceaccounting,impairmentlossesas wellastransactionandrefinancingrelatedcosts.Itisfurthera generallyacceptedbenchmark.
We agreed with the Audit Committee that we would report to them misstatements above EUR 1,700,000 identifiedduringourauditaswellasanymisstatementsbelow thatamountwhich,inourview,warrantedreportingforqualitativereasons.
Audit scope
Wetailoredthescopeofourauditinordertoperformsufficientworktoenableustoprovideanopinionontheconsolidatedfinancialstatementsasawhole,takingintoaccountthestructureoftheGroup,theaccountingprocessesandcontrols,andtheindustryinwhichtheGroupoperates.
Attheendof2020,theGroup’sfinancialstatementsareaconsolidationof48whollyownedsubsidiaries and 3 equity accounted joint ventures comprising the Group's operating businesses andcentralisedfunctionsacross33differentgeographicallocations.
Weidentified7whollyownedGroupcompaniesin6countriesforwhich,inouropinion,afullscopeauditwasnecessarybecauseoftheirsizeorriskcharacteristics.Forafurther6Groupcompaniesin4countries,specifiedproceduresonselectedaccountbalanceswereperformedtoincreaseauditcomfortontheGroup's“Cash&CashEquivalent”and“TradeandOtherPayables”balance. Inaddition,ona rotationalbasis,weanalysed thefinancial statementsof selectedGroupCompaniesforsignificantorunusualdevelopments.NoneoftheGroupCompaniesnotconsideredasafullscopeauditaccountedindividuallyformorethan6%oftheGroup’srevenue.
AllrelevantsubsidiariesoftheGroupareauditedbylocalPwCfirms.Toensuresufficientandappropriate involvement of the Group auditor in the audit of the 6 Group companies audited by our component auditors abroad, we held conference calls with the respective audit teams responsible for theauditduring thedifferentphasesof theauditandalsoperformedonaselectivebasisareviewoftheirwork-papers.Wediscussedrisksidentifiedandchallengedtheauditapproachinresponsetotherisksrelevanttotherespectivecomponents.Furthermore,
Annual Report 2020
201Financials Report of the statutory auditor

we obtained a memorandum of examination from our component auditors and assessed theresultsandimpactontheGroup’sconsolidatedfinancialstatementsandchallengedthecomponentauditor’sconclusion.
Key audit matters
Key audit matters are those matters that, in our professional judgement, were of most significanceinourauditoftheconsolidatedfinancialstatementsofthecurrentperiod.Thesematterswereaddressedinthecontextofourauditoftheconsolidatedfinancialstatementsas a whole, and in forming our opinion thereon, and we do not provide a separate opinion on thesematters.
RECOVERABILITY OF CARRYING AMOUNT OF GOODWILL
Key audit matter How our audit addressed the key audit matter
Asper31December2020,thecarryingamountofGoodwillamountedto€1,567million.
The valuation of Goodwill is a key audit matter based on the magnitude of the balance and inherent judgement involved and assumptions used as part of Management’simpairmentassessment.
SpecificallytheassumptionsrelatedtofuturecashflowsandthedeterminationofthediscountratesrequireasignificantlevelofjudgementbyManagement.
RefertoNote14–IntangibleassetsandNote 5.4 –Critical accounting judgements, estimates andassumptionsintheconsolidatedfinancialstatements.
We audited the proper allocation of Goodwill to the respectivegroupofcash-generatingunits(“CGUs”).
WeassessedwhetherthegroupsofCGUsidentifiedare the appropriate basis to be used for impairment testing.
WiththeinvolvementofPwC’sinternalvaluationexperts,wechallengedandevaluatedManagement’svalueinusecalculationforeachgroupofCGUs.
This included an assessment of the appropriateness of the model used, as well as challenging of the key assumptionsmadebyManagement.
• We evaluated the reasonableness of the discount rates, as determined by Management, by assessing the cost of capital for the Group, as well as consideringterritoryspecificfactors.
• WechallengedManagement’scashflowassumptions and sensitivity analysis applied tosuchcashflowsbasedonotherinternalforward-lookingdocumentationavailableandby bench-markingthemagainstexternalmarketdatafortheindustryandrespectiveregions.
• We further ensured the consistency of Management’scashflowassumptionswiththe Group’scurrent5-yearbusinessplanasapproved by theBoardofDirectors.
We further performed independent sensitivity analyses around the key assumptions to ascertain the extent of change in those assumptions that either individually or collectively would be required forthegoodwilltobeimpaired.
We also assessed whether the market capitalisation oftheGroupcoversthecarryingamountofit’sconsolidatedequity.
As a result of our procedures, we determined that the conclusions reached by Management with regards to the recoverability of the carrying amount ofgoodwillisreasonableandsupportable.
Annual Report 2020
202Financials Report of the statutory auditor

Other information in the annual report
TheBoardofDirectorsisresponsiblefortheotherinformationintheannualreport.Theotherinformation comprises all information included in the annual report, but does not include the consolidatedfinancialstatements,thestand-alonefinancialstatementsandtheremunerationreportofSIGCombiblocGroupAGandourauditor’sreportsthereon.
Ouropinionontheconsolidatedfinancialstatementsdoesnotcovertheotherinformationintheannualreportandwedonotexpressanyformofassuranceconclusionthereon.
In connection with our audit of the consolidated financial statements, our responsibility isto read the other information in the annual report and, in doing so, consider whether the otherinformationismateriallyinconsistentwiththeconsolidatedfinancialstatementsorourknowledgeobtainedintheaudit,orotherwiseappearstobemateriallymisstated.If,basedonthe work we have performed, we conclude that there is a material misstatement of this other information,wearerequiredtoreportthatfact.Wehavenothingtoreportinthisregard.
Responsibilities of the Board of Directors for the consolidated financial statements
The Board of Directors is responsible for the preparation of the consolidated financialstatementsthatgiveatrueandfairviewinaccordancewithIFRSandtheprovisionsofSwisslaw, and for such internal control as the Board of Directors determines is necessary to enable thepreparationofconsolidatedfinancialstatementsthatarefreefrommaterialmisstatement,whetherduetofraudorerror.
Inpreparingtheconsolidatedfinancialstatements, theBoardofDirectors isresponsibleforassessingtheGroup’sabilitytocontinueasagoingconcern,disclosing,asapplicable,mattersrelated to going concern and using the going concern basis of accounting unless the Board of Directors either intends to liquidate the Group or to cease operations, or has no realistic alternativebuttodoso.
Auditor’s responsibilities for the audit of the consolidated financial statements
Ourobjectivesaretoobtainreasonableassuranceaboutwhethertheconsolidatedfinancialstatements as a whole are free from material misstatement, whether due to fraud or error, andtoissueanauditor’sreportthatincludesouropinion.Reasonableassuranceisahighlevelof assurance, but is not a guarantee that an audit conducted in accordance with Swiss law, ISAsandSwissAuditingStandardswillalwaysdetectamaterialmisstatementwhenitexists.Misstatements can arise from fraud or error and are considered material if, individually or in theaggregate,theycouldreasonablybeexpectedtoinfluencetheeconomicdecisionsofuserstakenonthebasisoftheseconsolidatedfinancialstatements.
AspartofanauditinaccordancewithSwisslaw,ISAsandSwissAuditingStandards,weexerciseprofessionaljudgmentandmaintainprofessionalscepticismthroughouttheaudit.Wealso:
• Identify and assess the risks of material misstatement of the consolidated financialstatements, whether due to fraud or error, design and perform audit procedures responsive tothoserisks,andobtainauditevidencethatissufficientandappropriatetoprovideabasisforouropinion.Theriskofnotdetectingamaterialmisstatementresultingfromfraudishigher than for one resulting from error, as fraud may involve collusion, forgery, intentional omissions,misrepresentations,ortheoverrideofinternalcontrol.
Annual Report 2020
203Financials Report of the statutory auditor

• Obtain an understanding of internal control relevant to the audit in order to design audit procedures that are appropriate in the circumstances, but not for the purpose of expressing anopinionontheeffectivenessoftheGroup’sinternalcontrol.
• Evaluate the appropriateness of accounting policies used and the reasonableness of accountingestimatesandrelateddisclosuresmade.
• ConcludeontheappropriatenessoftheBoardofDirectors’useofthegoingconcernbasisof accounting and, based on the audit evidence obtained, whether a material uncertainty existsrelatedtoeventsorconditionsthatmaycastsignificantdoubtontheGroup’sabilitytocontinueasagoingconcern.Ifweconcludethatamaterialuncertaintyexists,wearerequiredtodrawattentioninourauditor’sreporttotherelateddisclosuresintheconsolidatedfinancialstatementsor,ifsuchdisclosuresareinadequate,tomodifyouropinion.Ourconclusionsarebasedontheauditevidenceobtaineduptothedateofourauditor’sreport.However,futureeventsorconditionsmaycausetheGrouptoceasetocontinueasagoingconcern.
• Evaluate the overall presentation, structure and content of the consolidated financialstatements, including thedisclosures,andwhether theconsolidatedfinancial statementsrepresenttheunderlyingtransactionsandeventsinamannerthatachievesfairpresentation.
• Obtain sufficient appropriate audit evidence regarding the financial information of theentities or business activities within the Group to express an opinion on the consolidated financialstatements.Weareresponsibleforthedirection,supervisionandperformanceoftheGroupaudit.Weremainsolelyresponsibleforourauditopinion.
We communicate with the Board of Directors or its relevant committee regarding, among other matters,theplannedscopeandtimingoftheauditandsignificantauditfindings,includinganysignificantdeficienciesininternalcontrolthatweidentifyduringouraudit.
We also provide the Board of Directors or its relevant committee with a statement that we have complied with relevant ethical requirements regarding independence, and communicate with them all relationships and other matters that may reasonably be thought to bear on our independence,andwhereapplicable,actionstakentoeliminatethreatsorsafeguardsapplied.
From the matters communicated with the Board of Directors or its relevant committee, we determinethosemattersthatwereofmostsignificanceintheauditoftheconsolidatedfinancialstatementsofthecurrentperiodandarethereforethekeyauditmatters.Wedescribethesemattersinourauditor’sreportunlesslaworregulationprecludespublicdisclosureaboutthematter or when, in extremely rare circumstances, we determine that a matter should not be communicated in our report because the adverse consequences of doing so would reasonably beexpectedtooutweighthepublicinterestbenefitsofsuchcommunication.
Report on other legal and regulatory requirements
Inaccordancewitharticle728aparagraph1item3COandSwissAuditingStandard890,weconfirmthataninternalcontrolsystemexistswhichhasbeendesignedforthepreparationofconsolidatedfinancialstatementsaccordingtotheinstructionsoftheBoardofDirectors.
Werecommendthattheconsolidatedfinancialstatementssubmittedtoyoubeapproved.
PricewaterhouseCoopers AG
Bruno Rossi Manuela BaldisweilerAudit expert Audit expertAuditor in charge
Basel,18February2021
Annual Report 2020
204Financials Report of the statutory auditor

Financials ► Financial statements 1
Annual Report 2020
Financial statements for the year ended 31 December 2020
SIG Combibloc Group AG
Income statement 206
Balance sheet 207
Notes 208
Proposal of the Board of Directors for the appropriation of the retained earnings 215
Proposal of the Board of Directors for the appropriation of the capital contribution reserve 215
Report of the statutory auditor on the audit of the financial statements 216
Annual Report 2020
Financials Financial statements 205

Financials ► Financial statements 2
Annual Report 2020
Income statement
(in CHF thousand) Note
Year ended 31 Dec.
2020
Year ended 31 Dec.
2019
Income from investments 3.1 116,138.0 125,227.2 Other income 3.2 7,377.9 7,085.3 Total income 123,515.9 132,312.5
Personnel expenses 3.3 (13,225.7) (5,801.7) Other operating expenses 3.2 (7,924.7) (9,583.8) Total operating expenses (21,150.4) (15,385.5)
Profit from operating activities 102,365.5 116,927.0
Finance income
38.1 136.8 Finance expenses (291.5) (1,084.1)
Profit before income tax
102,112.1 115,979.7
Income tax income 0.3 6.5
Profit for the period 102,112.4 115,986.2
Annual Report 2020
Financials Financial statements 206
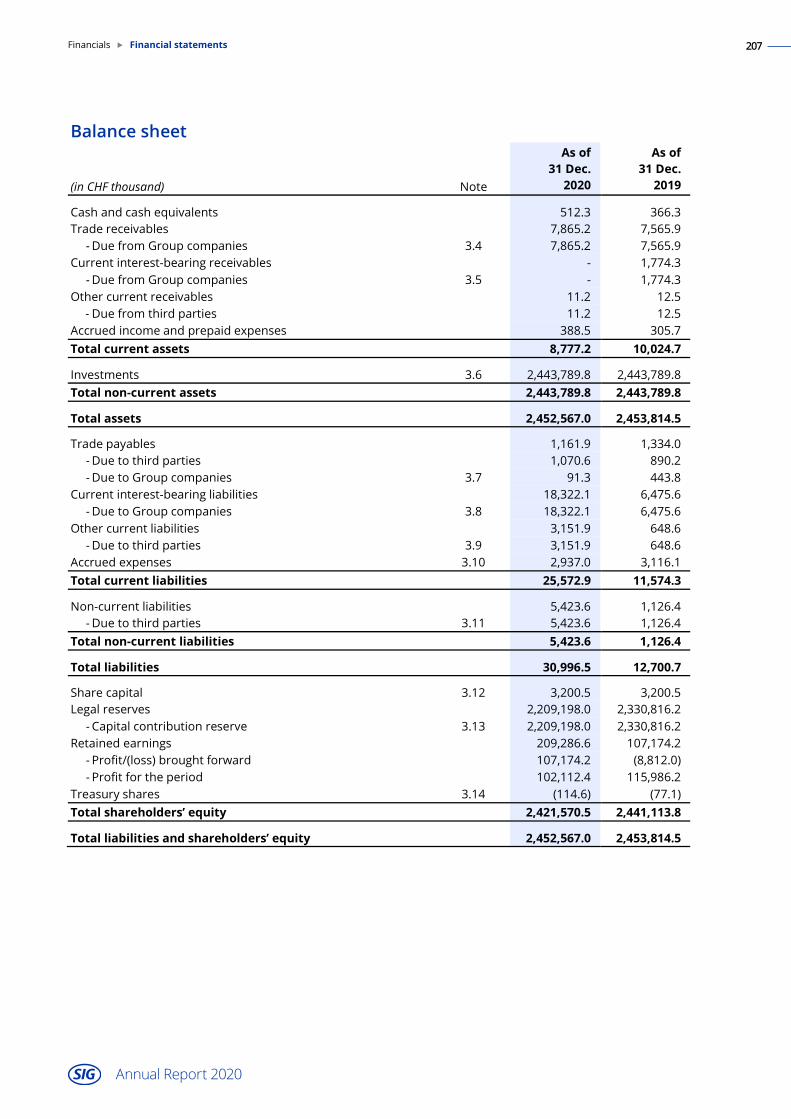
Financials ► Financial statements 3
Annual Report 2020
Balance sheet
(in CHF thousand) Note
As of 31 Dec.
2020
As of 31 Dec.
2019
Cash and cash equivalents
512.3 366.3 Trade receivables 7,865.2 7,565.9
- Due from Group companies 3.4 7,865.2 7,565.9 Current interest-bearing receivables - 1,774.3
- Due from Group companies 3.5 - 1,774.3 Other current receivables 11.2 12.5
- Due from third parties 11.2 12.5 Accrued income and prepaid expenses 388.5 305.7 Total current assets 8,777.2 10,024.7
Investments 3.6 2,443,789.8 2,443,789.8 Total non-current assets 2,443,789.8 2,443,789.8
Total assets
2,452,567.0 2,453,814.5
Trade payables 1,161.9 1,334.0 - Due to third parties 1,070.6 890.2 - Due to Group companies 3.7 91.3 443.8
Current interest-bearing liabilities 18,322.1 6,475.6 - Due to Group companies 3.8 18,322.1 6,475.6
Other current liabilities 3,151.9 648.6 - Due to third parties 3.9 3,151.9 648.6
Accrued expenses 3.10 2,937.0 3,116.1 Total current liabilities 25,572.9 11,574.3
Non-current liabilities 5,423.6 1,126.4 - Due to third parties 3.11 5,423.6 1,126.4
Total non-current liabilities 5,423.6 1,126.4
Total liabilities 30,996.5 12,700.7
Share capital 3.12 3,200.5 3,200.5 Legal reserves 2,209,198.0 2,330,816.2
- Capital contribution reserve 3.13 2,209,198.0 2,330,816.2 Retained earnings 209,286.6 107,174.2
- Profit/(loss) brought forward 107,174.2 (8,812.0) - Profit for the period 102,112.4 115,986.2
Treasury shares 3.14 (114.6) (77.1) Total shareholders’ equity 2,421,570.5 2,441,113.8
Total liabilities and shareholders’ equity 2,452,567.0 2,453,814.5
Annual Report 2020
Financials Financial statements 207

Financials ► Financial statements 4
Annual Report 2020
Notes
1 General information
SIG Combibloc Group AG ("SIG" or the "Company") is domiciled in Neuhausen am Rheinfall, Switzerland and is listed on SIX Swiss Exchange. References to “Group“ are to the Company and its consolidated subsidiaries.
2 Summary of significant accounting policies
The financial statements of the Company for the year ended 31 December 2020 have been prepared in accordance with Swiss law. Where not prescribed by law, the significant accounting and valuation policies applied are described below.
2.1 Exclusion of a cash flow statement and certain note disclosures
SIG Combibloc Group AG prepares its annual consolidated financial statements in line with International Financial Reporting Standards (“IFRS”), a recognised standard. It further includes a management report (Financial review) in its annual report. In accordance with Swiss law (Art. 961d para 1 of the Swiss Code of Obligations, (“CO”)), the Company has therefore elected not to include in its financial statements a cash flow statement and a management report.
2.2 Foreign currency translation
The Company maintains its accounting in Swiss Francs (CHF), which is also its functional currency, and the balance sheet and income statement are also presented in this currency.
The exchange rates used for the balance sheet items are the closing rates as of 31 December 2020 and 31 December 2019. Balances denominated in foreign currencies are translated into CHF as follows:
Investments expressed in a currency other than CHF are translated into CHF at the exchange rate at the date of their acquisition. At the balance sheet date, such investments are maintained at their historical exchange rate. Liabilities which are economically linked to investments and expressed in a currency other than CHF are maintained at their historical exchange rate at the end of the year.
All other monetary assets and liabilities expressed in a currency other than CHF are translated into CHF at the exchange rate prevailing at the year end. All exchange differences resulting from this translation are presented in the income statement. Any unrealised exchange gains included therein are not considered significant.
Income and expenses denominated in foreign currencies are translated into CHF at the rate at the transaction date.
The following significant exchange rate has been applied.
Average rate for the year Spot rate as of
31 Dec.
2020 31 Dec.
2019 31 Dec.
2020 31 Dec.
2019
EUR to CHF 1.07034 1.11282 1.08020 1.08540
Annual Report 2020
Financials Financial statements 208

Financials ► Financial statements 5
Annual Report 2020
2.3 Investments
Investments are initially recognised at cost. Investments are analysed on an annual basis for impairment indicators and are, if needed, adjusted to their recoverable amount.
2.4 Treasury shares
Own shares held by the Company are accounted for as treasury shares. Treasury shares are initially recognised at acquisition cost and deducted from equity with no subsequent remeasurement. If the treasury shares are disposed of, the resulting gain or loss is recognised in the income statement.
3 Information relating to income statement and balance sheet items
3.1 Income from investments
Income from investments consists of a dividend received from SIG Combibloc Holdings S.à r.l. of CHF 116,138.0 thousand (CHF 125,227.2 thousand in the year ended 31 December 2019), which was mainly used to pay a dividend of CHF 121,620.2 thousand to the shareholders in the year ended 31 December 2020 (a dividend of CHF 112,011.6 thousand in the year ended 31 December 2019).
3.2 Other income and other operating expenses
Other operating income primarily consists of management fees charged to direct or indirect subsidiaries. Other operating expenses primarily consist of fees paid to the Board of Directors and consultancy costs.
3.3 Personnel expenses
Personnel expenses in the year ended 31 December 2020 include an amount of CHF 5,664.4 thousand of termination benefits (including non-compete agreements) relating to two former members of the Group Executive Board. The Chief Executive Officer (Rolf Stangl) and the Chief Market Officer (Markus Boehm) both left the Company in 2020 as further described in notes 4 and 29 of the consolidated financial statements of the Company for the year ended 31 December 2020. Their terminations also resulted in the forfeiture of a number of performance share units (“PSUs”) granted under the 2019 and 2020 share-based payments plans, which has been reflected in the measurement of the amount recognised as a share-based payment expense in the year ended 31 December 2020 (as part of personnel expenses). See also notes 3.11 and 4.3.
3.4 Trade receivables
Trade receivables due from Group companies as of 31 December 2020 include management fees charged to direct or indirect subsidiaries for 2020 in the amount of CHF 7,865.2 thousand (CHF 7,565.9 thousand as of 31 December 2019).
Annual Report 2020
Financials Financial statements 209

Financials ► Financial statements 6
Annual Report 2020
3.5 Current interest-bearing receivables
Current interest-bearing receivables due from Group companies for the year ended 31 December 2019 included an interest-bearing inter-company EUR loan granted to SIG Combibloc Services AG, which was repaid in 2020.
3.6 Investments
The following subsidiary is directly held by the Company.
Name and legal form Registered office As of 31 Dec. 2020 As of 31 Dec. 2019 Capital Votes Capital Votes
SIG Combibloc Holdings S.à r.l. 6C. rue Gabriel Lippmann L - 5365 Munsbach 100% 100% 100% 100%
The subsidiaries indirectly held by the Company are listed in note 26 of the consolidated financial statements of the Company for the year ended 31 December 2020.
3.7 Trade payables
Trade payables due to Group companies as of 31 December 2020 and 31 December 2019 mainly relate to intra-group recharges.
3.8 Current interest-bearing liabilities
Current interest-bearing liabilities due to Group companies for the year ended 31 December 2020 include an interest-bearing inter-company CHF loan and an interest-bearing inter-company EUR loan from SIG Combibloc Services AG. Only the EUR loan was included in the balance for the year ended 31 December 2019.
3.9 Other current liabilities
For the year ended 31 December 2020, an amount of CHF 3,010.7 thousand representing the current portion of the termination benefits relating to two former members of the Group Executive Board is included in other current liabilities.
3.10 Accrued expenses
Accrued expenses for the year ended 31 December 2020 primarily consist of employee benefit obligations of CHF 2,365.8 thousand (CHF 2,610.7 thousand as of 31 December 2019). There were no payments outstanding to the pension funds as of 31 December 2020 or 31 December 2019.
3.11 Non-current liabilities
For the year ended 31 December 2020, an amount of CHF 2,326.1 thousand representing the non-current portion of the termination benefits (including non-compete agreements) relating to two former members of the Group Executive Board is included in non-current liabilities (see also note 3.3). The remaining balance primarily consists of liabilities arising due to share-based payment plans and arrangements for certain members of management and Board of Directors as described in note 31 of the consolidated financial statements of the Company for the year ended 31 December 2020.
Annual Report 2020
Financials Financial statements 210

Financials ► Financial statements 7
Annual Report 2020
3.12 Share capital
As of 31 December 2020, the share capital consists of 320,053,240 shares, issued and fully paid, representing CHF 3.2 million of share capital (also as of 31 December 2019).
Authorised share capital and conditional share capital
The Company has authorised share capital and conditional share capital of CHF 640,106.48 each as of 31 December 2020 and 31 December 2019.
The Board of Directors’ authority to increase the share capital out of authorised share capital is limited until 7 April 2022. Capital increases from authorised and conditional share capital are mutually exclusive, i.e. they are subject to a single combined limit, and may not exceed 64,010,648 shares (equalling CHF 640,106.48 or 20% of the existing share capital). However, the shares issued from authorised and conditional share capital under the exclusion of subscription and advance subscription rights, respectively, is limited until 7 April 2022 to a single combined maximum of 32,005,324 shares (equalling CHF 320,053.24 or 10% of existing share capital).
The authorised share capital can be used for various purposes. This creates a flexibility to seek additional capital, if required. The conditional share capital is divided into CHF 160,026.62 for employee benefit plans and CHF 480,079.86 for equity linked financing instruments. See note 4.4 for information about a planned issue of SIG ordinary shares out of the authorised share capital of the Company in the first quarter of 2021.
3.13 Capital contribution reserve
The capital contribution reserve consists of the following:
(In CHF thousand) Balance
Capital contribution reserve as of 1 January 2019 2,442,827.8 Dividend payment of CHF 0.35 per share out of the capital contribution reserve (112,018.6) Dividend not paid on treasury shares held by the Company 7.0 Capital contribution reserve as of 31 December 2019 2,330,816.2
Capital contribution reserve as of 1 January 2020 2,330,816.2 Dividend payment of CHF 0.38 per share out of the capital contribution reserve (121,620.2) Dividend not paid on treasury shares held by the Company 2.0 Capital contribution reserve as of 31 December 2020 2,209,198.0
In the revision to the capital contribution principle that took effect on 1 January 2020, withholding tax exempt distributions from the capital contribution reserve of Swiss listed companies are generally only permissible to the extent that at least the same amount is distributed out of other reserves. These provisions do not apply to repayments of “foreign capital contribution reserves”. The Company has as of 31 December 2020 a capital contribution reserve of CHF 2,209.2 million, which is confirmed by the Swiss Federal Tax Administration. Foreign capital contribution reserves included in the capital contribution reserve amount to CHF 1,184.7 million. The whole dividend paid in 2020 was distributed out of foreign capital contribution reserves. The whole dividend to be proposed to the Annual General Meeting in April 2021 is expected to be distributed out of foreign capital contribution reserves.
Annual Report 2020
Financials Financial statements 211

Financials ► Financial statements 8
Annual Report 2020
3.14 Treasury shares
The movement in treasury shares during the year was as follows:
2020 2019 (Number of treasury shares or in CHF thousand) Number Amount Number Amount
Balance as of 1 January 6,158 (77.1) - - Purchases 40,000 (665.1) 47,000 (532.5) Transfer under share-based payment plans and arrangements (39,884) 627.6 (40,842) 455.4 Balance as of 31 December 6,274 (114.6) 6,158 (77.1)
No treasury shares are held by the Company’s subsidiaries or joint ventures.
4 Other information
4.1 Employees
The number of full-time equivalent employees in 2020 and 2019 did not exceed ten on an annual average basis.
4.2 Significant shareholders
According to the disclosure notifications reported to the Company during 2020 and published by the Company via the electronic publishing platform of SIX Swiss Exchange, the following shareholders had holdings of 3% or more of the voting rights of the Company as of 31 December 2020 and 2019.
Voting rights as of Significant shareholders 31 Dec. 2020 31 Dec. 2019
Onex Corporation1 <3.0% 32.9% Winder Investment Pte Ltd2 6.0% 6.0% Norges Bank (the Central Bank of Norway) 5.9% <3.0% Al Obeikan Printing and Packaging Company CJS3 5.5% <3.0% BlackRock Inc 3.6% <3.0% UBS Fund Management (Switzerland) AG 3.2% <3.0% Ameriprise Financial 3.0% <3.0%
1 Beneficially owned by Mr Gerald Schwartz, Canada.
2 Beneficially owned by Haldor Foundation, Liechtenstein.
3 Reported as beneficially owned by Fahad al Obeikan, Riyadh, Saudi Arabia. However, the shares will not be transferred to Al Obeikan Printing and Packaging Company CJS until the completion of the Group’s planned acquisition of the remaining shares in its two joint ventures in the Middle East. See also notes 3.12 and 4.4.
To the best of the Company's knowledge, no other shareholder held 3% or more of SIG Combibloc Group AG's total share capital and voting rights as of 31 December 2020 and 2019, respectively.
Onex Corporation (“Onex”), which acquired the Group in 2015, has since the Company’s listing in 2018 gradually reduced its shareholding in the Company. As of 31 December 2020, Onex no longer reported any shareholding of 3% or more of the voting rights of the Company.
Annual Report 2020
Financials Financial statements 212

Financials ► Financial statements 9
Annual Report 2020
4.3 Shares held directly or indirectly by the Board of Directors and the Group Executive Board, including any related parties
As of 31 December 2020, the members of the Board of Directors as of that date directly held the following number of shares and restricted share units.
Board of Directors
Number of directly or beneficially held shares1, 2
Unvested restricted share units2
Total shareholdings
Andreas Umbach 81,026 - 81,026 Matthias Währen 26,483 - 26,483 Colleen Goggins 24,826 7,287 32,113 Werner Bauer 51,939 - 51,939 Wah-Hui Chu 37,741 6,949 44,690 Mariel Hoch 12,564 - 12,564 Nigel Wright - - - Total 234,579 14,236 248,815
1 Ordinary registered shares of SIG Combibloc Group AG, including blocked shares.
2 The members of the Board of Directors receive 40% of their total compensation under share-based payment arrangements. The share-based payment compensation is paid out in blocked SIG shares. A three-year blocking period applies to the shares. In the prior year, a smaller part of the share-based payment compensation was paid out in restricted share units (“RSUs”) with a three-year vesting period. Further details about the compensation of the Board of Directors, including terms, number and value of instruments granted, are included in the Compensation Report and in note 31 of the consolidated financial statements included elsewhere in this Annual Report.
As of 31 December 2019, the members of the Board of Directors as of that date directly, or indirectly, held the following number of shares and restricted share units.
Board of Directors
Number of directly or
beneficially held shares1, 4
Number of indirectly
held shares1 Total
shareholdings
Unvested restricted
share units4
Total shareholdings,
including restricted
share units
Andreas Umbach 67,529 - 67,529 - 67,529 Matthias Währen 20,960 - 20,960 - 20,960 Colleen Goggins - 23,8202 23,820 7,287 31,107 Werner Bauer 22,842 23,8202 46,662 - 46,662 Wah-Hui Chu 8,888 23,8202 32,708 6,949 39,657 Mariel Hoch 7,287 - 7,287 - 7,287 Nigel Wright - 106,4223 106,422 - 106,422 Total 127,506 177,882 305,388 14,236 319,624
1 Ordinary registered shares of SIG Combibloc Group AG, including blocked shares.
2 Shares were held indirectly through partnership interests in Wizard Management II GmbH & Co. KG, which held ordinary registered shares of SIG Combibloc Group AG (figures rounded).
3 Indirectly attributable through minority investment in affiliates of Onex Corporation, the former major shareholder (figures rounded).
4 The members of the Board of Directors receive 40% of their total compensation under share-based payment arrangements. The larger part of the Board of Directors’ total share-based payment compensation was paid out in blocked SIG shares while a smaller part was paid out in restricted share units (“RSUs”). A three-year blocking/vesting period applies to the shares/RSUs. Further details about the compensation of the Board of Directors, including terms, number and value of instruments granted, are included in the Compensation Report and in note 31 of the consolidated financial statements included elsewhere in this Annual Report.
Annual Report 2020
Financials Financial statements 213

Financials ► Financial statements 10
Annual Report 2020
As of 31 December 2020 and 31 December 2019, the members of the Group Executive Board as of these dates held the following number of shares and performance share units.
As of 31 Dec. 2020 As of 31 Dec. 2019
Group Executive Board
Number of directly or
beneficially held shares1
Unvested performance share units2
Number of directly,
beneficially or indirectly
held shares1
Unvested performance share units2
Rolf Stangl, Chief Executive Officer - 56,200 665,5443 168,599 Samuel Sigrist 200,063 135,510 290,0633 79,031 Markus Boehm5 n/a n/a 268,6483 52,688 Ian Wood 75,000 92,556 84,2254 52,688 Lawrence Fok 268,572 77,320 359,9553 47,419 Martin Herrenbrück 50,000 15,807 134,6334 47,419 Ricardo Rodriguez 250,002 77,320 263,7023 47,419 Total 843,637 454,713 2,066,770 495,263
1 Ordinary registered shares of SIG Combibloc Group AG.
2 Members of the Group Executive Board participate in a share-based long-term incentive plan under which they were granted performance share units (“PSUs”) in 2019 and 2020. One PSU represents the contingent right to receive one SIG share. Vesting occurs three years after the grant date. The exact number of PSUs that vests depends on the long-term performance of SIG during the vesting period. Further details about the 2020 and 2019 incentive plans, including terms, number and value of instruments granted, are included in the Compensation Report and in note 31 of the consolidated financial statements included elsewhere in this Annual Report.
3 Shares were held indirectly through partnership interests in Wizard Management I GmbH & Co. KG, which held ordinary registered shares of SIG Combibloc Group AG (figures are rounded).
4 Shares were held indirectly through partnership interests in Wizard Management II GmbH & Co. KG, which held ordinary registered shares of SIG Combibloc Group AG (figures are rounded).
5 Markus Boehm was not a member of the Group Executive Board as of 31 December 2020 (see further below).
The Company has during the year ended 31 December 2020 implemented or initiated organisational changes in its Group Executive Board. Samuel Sigrist (Chief Financial Officer until 31 December 2020) was appointed Chief Executive Officer effective 1 January 2021 following the voluntary departure of the former Chief Executive Officer (Rolf Stangl) on 31 December 2020. On 1 January 2021, Frank Herzog was appointed as Chief Financial Officer. The position of Chief Market Officer (formerly held by Markus Boehm) was eliminated in August 2020. Martin Herrenbrück, who held the position of President and General Manager of Europe, voluntarily left the Group as of 31 December 2020. José Matthijsse took over his position as President and General Manager of Europe effective 1 February 2021. See also note 3.3.
4.4 Other
The Company announced on 25 November 2020 that the Group has entered into an agreement to acquire the remaining 50% of the shares in the two joint ventures in the Middle East from the joint venture partner Obeikan Investment Group (“OIG”).
The acquisition is expected to complete before the end of the first quarter of 2021. The completion is subject to customary closing conditions and approvals from regulatory authorities. The consideration for the shares of the joint ventures will be made up of €167 million in cash and around 17.5 million newly issued SIG ordinary shares (to be issued out of authorised share capital of the Company). See note 4 of the consolidated financial statements of the Company for the year ended 31 December 2020 for additional details about the planned acquisition.
Annual Report 2020
Financials Financial statements 214

Financials ► Financial statements 11
Annual Report 2020
Management considers that the business of SIG is well placed to withstand the impacts of the global spread of a novel strain of corona virus (COVID-19) due to its role in the supply chain for essential food and beverages and its broad geographic reach. The Company, and its subsidiaries, is overall currently not significantly impacted by the COVID-19 pandemic.
There have been no events subsequent to 31 December 2020 that would require an adjustment to or disclosure in these financial statements except for the disclosures given in note 4.3 regarding organisational changes in the Group Executive Board.
There are no further items to disclose according to Art. 959c of Swiss Code of Obligations.
Proposal of the Board of Directors for the appropriation of the retained earnings
(In CHF thousand)
As of 31 Dec.
2020
As of 31 Dec.
2019
Profit/(loss) brought forward from previous period 107,174.2 (8,812.0) Profit for the period 102,112.4 115,986.2 Retained earnings at the end of the period 209,286.6 107,174.2 Retained earnings to be carried forward 209,286.6 107,174.2
The Board of Directors proposes to the Annual General Meeting to be held on 21 April 2021 to carry forward retained earnings of CHF 209,286.6 thousand.
Proposal of the Board of Directors for the appropriation of the capital contribution reserve
(In CHF thousand)
As of 31 Dec.
2020
As of 31 Dec.
2019
Capital contribution reserve 2,209,198.0 2,330,816.2 Proposed dividend of CHF 0.42 per share (2019: CHF 0.38 per share) out of the capital contribution reserve
(134,422.4)
(121,620.2)
Dividends not paid on treasury shares held by the Company 2.0 Capital contribution reserve carried forward after cash dividend 2,074,775.6 2,209,198.0
Provided that the proposal of the Board of Directors is approved by the Annual General Meeting to be held on 21 April 2021, the dividend will amount to CHF 0.42 per share and is expected to be paid out of the Company’s foreign capital contribution reserve. The proposed amount of CHF 134,422.4 thousand excludes any additional shares in circulation as a result of the planned acquisition of the remaining shares in the two joint ventures in the Middle East (see notes 3.12 and 4.4). Dividends will not be paid on treasury shares.
Annual Report 2020
Financials Financial statements 215

to the General Meeting of SIG Combibloc Group AG Neuhausen am Rheinfall
Report on the audit of the financial statements
Opinion
WehaveauditedthefinancialstatementsofSIGCombiblocGroupAG,whichcomprisetheincomestatementfortheyearended31December2020,thebalancesheetasat31December 2020,andnotesfortheyearthenended,includingasummaryofsignificantaccountingpolicies.Inouropinion,thefinancialstatements(pages206to215)asat31December2020complywithSwisslawandthecompany’sarticlesofincorporation.
Basis for opinion
We conducted our audit in accordance with Swiss law and Swiss Auditing Standards. Ourresponsibilitiesunderthoseprovisionsandstandardsarefurtherdescribedinthe“Auditor’sresponsibilitiesfortheauditofthefinancialstatements”sectionofourreport.
We are independent of the entity in accordance with the provisions of Swiss law and the requirementsoftheSwissauditprofessionandwehavefulfilledourotherethicalresponsibilitiesinaccordancewiththeserequirements.Webelievethattheauditevidencewehaveobtainedissufficientandappropriatetoprovideabasisforouropinion.
Our audit approach
Materiality
The scopeof our auditwas influencedby our applicationofmateriality.Our audit opinionaims to provide reasonable assurance that the financial statements are free frommaterialmisstatement.Misstatementsmayariseduetofraudorerror.Theyareconsideredmaterialif, individuallyorinaggregate,theycouldreasonablybeexpectedtoinfluencetheeconomicdecisionsofuserstakenonthebasisofthefinancialstatements.
Based on our professional judgement, we determined certain quantitative thresholds for materiality,includingtheoverallmaterialityforthefinancialstatementsasawholeassetoutinthetablebelow.These,togetherwithqualitativeconsiderations,helpedustodeterminethescope of our audit and the nature, timing and extent of our audit procedures and to evaluate theeffectofmisstatements,bothindividuallyandinaggregate,onthefinancialstatementsasawhole.
Overall materiality CHF12,100,000
How we determined it 0.5%oftotalequity
Rationale for the materiality benchmark applied
We chose total equity as the benchmark because it is a relevant and generally accepted measure for materiality considerations relating toaholdingcompany.
REPORT OF THE STATUTORY AUDITOR
Annual Report 2020
216Financials Report of the statutory auditor

Audit scope
We designed our audit by determining materiality and assessing the risks of material misstatement in the financial statements. In particular, we considered where subjectivejudgementsweremade;forexample,inrespectofsignificantaccountingestimatesthatinvolvedmakingassumptionsandconsideringfutureeventsthatareinherentlyuncertain.Asinallofour audits, we also addressed the risk of management override of internal controls, including among other matters consideration of whether there was evidence of bias that represented a riskofmaterialmisstatementduetofraud.
Report on key audit matters based on the circular 1/2015 of the Federal Audit Oversight Authority
Wehavedeterminedthattherearenokeyauditmatterstocommunicateinourreport.
Responsibilities of the Board of Directors for the financial statements
TheBoardofDirectorsisresponsibleforthepreparationofthefinancialstatementsinaccordancewiththeprovisionsofSwisslawandthecompany’sarticlesofincorporation,andforsuchinternalcontrolastheBoardofDirectorsdeterminesisnecessarytoenablethepreparationoffinancialstatementsthatarefreefrommaterialmisstatement,whetherduetofraudorerror.
Inpreparingthefinancialstatements,theBoardofDirectorsisresponsibleforassessingtheentity’sabilitytocontinueasagoingconcern,disclosing,asapplicable,mattersrelatedtogoingconcern and using the going concern basis of accounting unless the Board of Directors either intendstoliquidatetheentityortoceaseoperations,orhasnorealisticalternativebuttodoso.
Auditor’s responsibilities for the audit of the financial statements
Ourobjectivesaretoobtainreasonableassuranceaboutwhetherthefinancialstatementsasa whole are free from material misstatement, whether due to fraud or error, and to issue an auditor’sreportthatincludesouropinion.Reasonableassuranceisahighlevelofassurance,but is not a guarantee that an audit conducted in accordance with Swiss law and Swiss Auditing Standardswillalwaysdetectamaterialmisstatementwhenitexists.Misstatementscanarisefrom fraud or error and are considered material if, individually or in the aggregate, they could reasonablybeexpected to influence theeconomicdecisionsofusers takenon thebasisofthesefinancialstatements.
As part of an audit in accordance with Swiss law and Swiss Auditing Standards, we exercise professionaljudgmentandmaintainprofessionalscepticismthroughouttheaudit.Wealso:
• Identifyandassesstherisksofmaterialmisstatementofthefinancialstatements,whetherdue to fraud or error, design and perform audit procedures responsive to those risks, and obtainauditevidencethatissufficientandappropriatetoprovideabasisforouropinion.The risk of not detecting a material misstatement resulting from fraud is higher than for one resulting from error, as fraud may involve collusion, forgery, intentional omissions, misrepresentations,ortheoverrideofinternalcontrol.
• Obtain an understanding of internal control relevant to the audit in order to design audit procedures that are appropriate in the circumstances, but not for the purpose of expressing anopinionontheeffectivenessoftheentity’sinternalcontrol.
• Evaluate the appropriateness of accounting policies used and the reasonableness of accountingestimatesandrelateddisclosuresmade.
Annual Report 2020
217Financials Report of the statutory auditor

• ConcludeontheappropriatenessoftheBoardofDirectors’useofthegoingconcernbasisof accounting and, based on the audit evidence obtained, whether a material uncertainty existsrelatedtoeventsorconditionsthatmaycastsignificantdoubtontheentity’sabilitytocontinueasagoingconcern. Ifweconclude thatamaterialuncertaintyexists,wearerequiredtodrawattentioninourauditor’sreporttotherelateddisclosuresinthefinancialstatementsor,ifsuchdisclosuresareinadequate,tomodifyouropinion.Ourconclusionsarebasedontheauditevidenceobtaineduptothedateofourauditor’sreport.However,futureeventsorconditionsmaycausetheentitytoceasetocontinueasagoingconcern.
We communicate with the Board of Directors or its relevant committee regarding, among other matters,theplannedscopeandtimingoftheauditandsignificantauditfindings,includinganysignificantdeficienciesininternalcontrolthatweidentifyduringouraudit.
We also provide the Board of Directors or its relevant committee with a statement that we have complied with relevant ethical requirements regarding independence, and communicate with them all relationships and other matters that may reasonably be thought to bear on our independence,andwhereapplicable,actionstakentoeliminatethreatsorsafeguardsapplied.
From the matters communicated with the Board of Directors or its relevant committee, we determinethosemattersthatwereofmostsignificanceintheauditofthefinancialstatementsofthecurrentperiodandarethereforethekeyauditmatters.Wedescribethesemattersinourauditor’sreportunlesslaworregulationprecludespublicdisclosureaboutthematterorwhen,in extremely rare circumstances, we determine that a matter should not be communicated in our report because the adverse consequences of doing so would reasonably be expected to outweighthepublicinterestbenefitsofsuchcommunication.
Report on other legal and regulatory requirements
Inaccordancewitharticle728aparagraph1item3COandSwissAuditingStandard890,weconfirmthataninternalcontrolsystemexistswhichhasbeendesignedforthepreparationoffinancialstatementsaccordingtotheinstructionsoftheBoardofDirectors.
WefurtherconfirmthattheproposedappropriationofavailableearningsandreservescomplieswithSwisslawandthecompany’sarticlesofincorporation.Werecommendthatthefinancialstatementssubmittedtoyoubeapproved.
PricewaterhouseCoopers AG
Bruno Rossi Manuela BaldisweilerAudit expert Audit expertAuditor in charge
Basel,18February2021
Annual Report 2020
218Financials Report of the statutory auditor
Annual Report 2020
DISCLAIMER AND CAUTIONARY STATEMENT
TheAnnualReportcontainscertain“forward-lookingstatements”thatarebasedonourcurrentexpectations,assumptions,estimates and projections about us and our industry. Forward-looking statements include, without limitation, anystatement that may predict, forecast, indicate or imply future results, performance or achievements, and may contain the words “may”, “will”, “should”, “continue”, “believe”, “anticipate”, “expect”, “estimate”, “intend”, “project”, “plan”, “willlikely continue”, “will likely result”, orwords or phraseswith similarmeaning. Undue reliance should not be placed onsuchstatementsbecause,bytheirnature,forward-lookingstatementsinvolverisksanduncertainties,including,withoutlimitation,economic,competitive,governmentalandtechnologicalfactorsoutsideofthecontrolofSIGCombiblocGroupAG(“SIG”,the“Company”orthe“Group”),thatmaycauseSIG’sbusiness,strategyoractualresultstodiffermateriallyfromtheforward-lookingstatements(orfrompastresults).Factorsthatcouldcauseactualresultstodiffermateriallyfromtheforward-lookingstatementsareincludedwithoutlimitationsintoourofferingcircularfortheissueofnotesinJune2020.SIGundertakesnoobligationtopubliclyupdateorreviseanyoftheseforward-lookingstatements,whethertoreflectnewinformation,futureeventsorcircumstancesorotherwise.Itshouldfurtherbenotedthatpastperformanceisnotaguidetofutureperformance.Personsrequiringadviceshouldconsultanindependentadviser.
The declaration and payment by the Company of any future dividends and the amounts of any such dividends will depend uponSIG’sabilitytomaintainitscreditrating,itsinvestments,results,financialcondition,futureprospects,profitsbeingavailable for distribution, consideration of certain covenants under the terms of outstanding indebtedness and any other factorsdeemedbytheDirectorstoberelevantatthetime,subjectalwaystotherequirementsofapplicablelaws.
DefinitionsofthealternativeperformancemeasuresusedbytheSIGandtheirrelatedreconciliationsarepostedunderthefollowing link: https://reports.sig.biz/annual-report-2020/services/chart-generator
SomefinancialinformationinthisAnnualReporthasbeenroundedand,asaresult,thefiguresshownastotalsmayvaryslightlyfromtheexactarithmeticaggregationofthefiguresthatprecedethem.
PleasenotethatcombismileiscurrentlynotavailableinGermany,GreatBritain,France,ItalyorJapan.