Annual press and analysts' conference - Bucher Industries
30
Investor relations presentation 28 October 2015 Roger Baillod, CFO
-
Upload
khangminh22 -
Category
Documents
-
view
0 -
download
0
Transcript of Annual press and analysts' conference - Bucher Industries
Investor relations presentation
28 October 2015
Roger Baillod, CFO
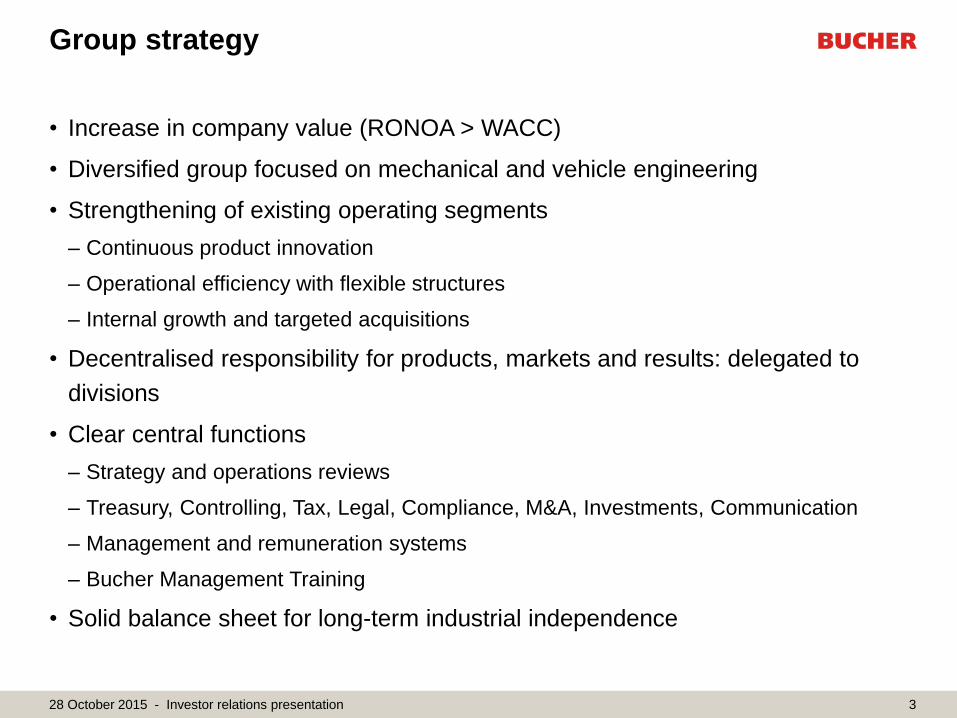
Group strategy
• Increase in company value (RONOA > WACC)
• Diversified group focused on mechanical and vehicle engineering
• Strengthening of existing operating segments
– Continuous product innovation
– Operational efficiency with flexible structures
– Internal growth and targeted acquisitions
• Decentralised responsibility for products, markets and results: delegated to
divisions
• Clear central functions
– Strategy and operations reviews
– Treasury, Controlling, Tax, Legal, Compliance, M&A, Investments, Communication
– Management and remuneration systems
– Bucher Management Training
• Solid balance sheet for long-term industrial independence
3 28 October 2015 - Investor relations presentation

Bucher – since 1807
2014 business year
4
Kuhn Group Agricultural machinery
Bucher Municipal Municipal vehicles
Bucher Hydraulics Hydraulic systems
Bucher Emhart Glass Glass container industry
Bucher Specials Individual businesses
• Tillage
• Seeding
• Fertilisation
• Spraying
• Landscape
maintenance
• Hay and forage
harvesting
• Compact and truck-
mounted sweepers
• Refuse collection
vehicles
• Salt spreaders
• Snow plough
• Mobile and industrial
hydraulics
• Pumps
• Motors
• Valves
• Cylinders
• Elevator drives
• Glass-forming
machinery
• Inspection machinery
• Transport and
handling systems
• Integrated systems
• Equipment for
processing wine, fruit
juice, beer, instant
products, and for
dewatering sewage
sludge
• Swiss distributorship
for agricultural
machinery
• Control and auto-
mation technology
Sales: CHF 1 260 million
Employees: 5 200
Sales: CHF 420 million
Employees: 1 500
Sales: CHF 480 million
Employees: 2 000
Sales: CHF 390 million
Employees: 1 900
Sales: CHF 300 million
Employees: 800
28 October 2015 - Investor relations presentation

Medium-term earnings targets
5
EBIT-Margin 2010 2011 2012 2013 2014 targets
Kuhn Group 9.2 11.3 12.5 14.9 12.1 12
Bucher Municipal 7.3 7.0 9.3 8.6 7.7 8
Bucher Hydraulics 9.9 8.7 9.0 9.4 10.2 11
Bucher Emhart Glass 1.21) 4.5 0.31) 4.8 3.9 9
Bucher Specials 4.6 6.1 8.1 10.0 8.9 10
Bucher Industries 7.4 8.1 8.9 10.7 9.2 10
Group, divisions and independent businesses
RONOA after tax 12.4 17.0 17.0 19.3 15.8 >16
1) After restructuring costs of CHF 9 million in 2012 and CHF 5 million in 2010
28 October 2015 - Investor relations presentation

Order book, order intake
and net sales
6
663
923
795 850
789
2217
2587
2490
2718
2742
2034
2336
2609
2691
2806
0
500
1000
1500
2000
2500
3000
3500
0
200
400
600
800
1000
1200
1400
2010 2011 2012 2013 2014
Order book Order intake Net sales
CHF m net sales
CAGR 8%
CHF m order book
28 October 2015 - Investor relations presentation

2806 2691 2609
2336
2034 2142
2789
2459
2087 1948 350
371
307
260
224
190
342
286
185 166
257 287
232
190 151
26
246 229
124 118
190 196
156 127
98
-24
145
171
96 86
-75
0
75
150
225
300
375
450
-500
0
500
1000
1500
2000
2500
3000
2014201320122011201020092008200720062005
Net sales EBITDA EBIT Profit for the year
Net sales and results
7
CHF m results
CHF m net sales
28 October 2015 - Investor relations presentation

Group
Key figures
CHF million January – September Change in Full Year
2015 2014 % %1) %2) 2014
Order intake 1 783 2 002 - 11.0 - 3.6 - 4.3 2 742
Net sales 1 891 2 116 - 10.6 - 3.8 - 4.4 2 806
Order book 628 737 - 14.8 - 7.5 - 7.5 789
Employees at closing date 11 222 11 767 - 4.6 - 4.6 11 554
8
1) Adjusted for currency effects 2) Adjusted for currency and acquisition effects
CHF million January – June Change in Full Year
2015 2014 % %1) %2) 2014
Operating profit (EBITDA)
as % of net sales
162
12.1%
187
12.7% - 13.1
350
12.5%
Operating profit (EBIT)
as % of net sales
118
8.8%
142
9.6% - 16.7
257
9.2%
Profit for the period
as % of net sales
80
5.9%
97
6.6% - 17.6
190
6.8%
28 October 2015 - Investor relations presentation

Consolidated income statement – first half
9
CHF million 2015 2014 Change in %
Net sales 1 341 1 469 - 8.7
Operating profit (EBITDA)
as % of net sales
162
12.1%
187
12.7% - 13.1
Depreciation - 34 - 35 1.2
Amortisation - 10 - 10 2.9
Operating profit (EBIT)
as % of net sales
118
8.8%
142
9.6% - 16.7
Net financial items - 6 - 4 - 62.5
Income tax expense - 32 - 41 22.4
Profit for the period
as % of net sales
80
5.9%
97
6.6% - 17.6
Earnings per share in CHF 7.9 9.6 - 18.2
28 October 2015 - Investor relations presentation

Net operating assets (NOA)
and RONOA after tax
10
1330 1268
1141 1061
970
828 849 49.6
45.2 41.5
39.4 37.2
35.4
41.8
12.7 15.8 17.4
19.3 17.0 17.0
12.4
0
10
20
30
40
50
60
70
0
200
400
600
800
1000
1200
1400
30.06.2015201430.06.20142013201220112010
Net operating assets (4q-average) as % of net sales RONOA
% CHF m
28 October 2015 - Investor relations presentation

Operating free cash flow and investments
Cash flow from operating activities
11
CHF m
202
55
105 92
-88
54
-63
58
117
95 132
40
109
39
260
172
200 224
-48
163
-24
-150
-100
-50
0
50
100
150
200
250
300
2010 2011 2012 2013 30.06.2014 2014 30.06.2015
Operating free cash flow Investments (net) Cash flow from operating activities
28 October 2015 - Investor relations presentation

Net cash/debt and free cash flow
12
-239
-85
-222
0 -19 -72
19
-133
135
-201
62 62
-75
181
-300
-200
-100
0
100
200
300
1. HY 20152. HY 20141. HY 20142013201220112010
Net cash/debt Free cash flow
CHF m
28 October 2015 - Investor relations presentation

13
748 814
890
1074 1100
1202
1041
12.7 16.3
18.3 20.0 19.0
16.7 16.0
0
10
20
30
40
50
60
70
2010 2011 2012 2013 HY 2014 2014 HY 2015
0
200
400
600
800
1000
1200
1400
% CHF m
Equity Return on equity
Equity and return on equity
28 October 2015 - Investor relations presentation

Equity / Intangible assets
14
748 814
890
1074 1100
1202
1041
135 174 159 181
266 253 215
53 75 73 80 138 133 117
0
200
400
600
800
1000
1200
1400
2010 2011 2012 2013 30.06.2014 2014 30.06.2015
Equity Intangible assets thereof goodwill
CHF m
28 October 2015 - Investor relations presentation

EBIT bridge – first half 2015
Currency and economic effects
15
100% 89% 83%
-8% -1% -6% 4%
-6%
-11% -17%
142 126 118
EBITJune 2014
Translation Pricereduction
One-offeffects
(devaluation,hedging)
Correctiveactions
EBITadjusted
Economicdecline
EBITJune 2015
CHF m Impact on EBIT margin -0.5 percentage points
28 October 2015 - Investor relations presentation
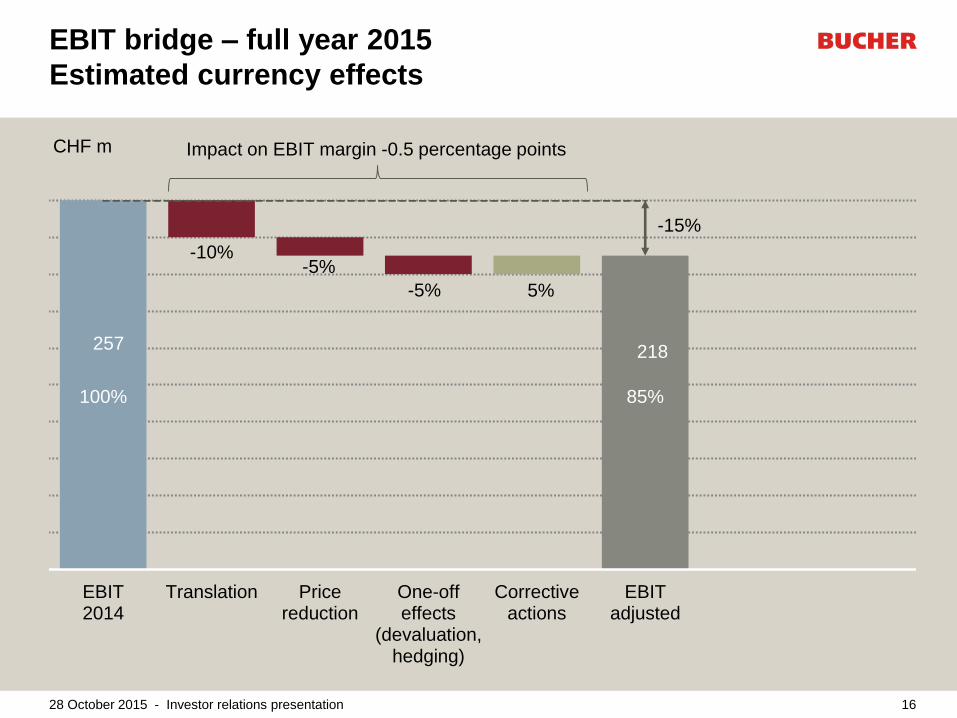
EBIT bridge – full year 2015
Estimated currency effects
16
100% 85%
-10% -5%
-5% 5%
-15%
257 218
EBIT2014
Translation Pricereduction
One-offeffects
(devaluation,hedging)
Correctiveactions
EBITadjusted
CHF m Impact on EBIT margin -0.5 percentage points
28 October 2015 - Investor relations presentation

Selected financial key figures
17
1) Rolling calculation from 1 July to 30 June
30.06.2015 30.06.2014 31.12.2014
Return on net operating assets (RONOA) after tax 12.7% 17.4% 15.8%
Net tangible worth CHF million
(Equity less goodwill) 925 962 1 068
Committed credit lines in CHF million 370 370 370
Thereof drawn in CHF million 100 85 85
Net cash/debt CHF million - 239 - 222 - 85
Debt payback period
(net debt to EBITDA) 0.71) 0.61) 0.2
Interest coverage ratio
(EBITDA to net interest expense) 21.91) 27.81) 23.0
28 October 2015 - Investor relations presentation

Group outlook for 2015
• No significant improvement in the economic environment
• The Group is expecting sales and operating profit in terms of local currencies to
decrease year on year.
– Kuhn Group expects a decline in sales and lower profitability
– Bucher Municipal is reckoning with lower sales and a maintained profitability level
– Bucher Hydraulics anticipates that it will maintain sales and sound profitability
– Bucher Emhart Glass expects a modest increase in sales with significantly improved
profitability
– Bucher Specials is projecting a decrease in sales and operating profit
• The impact of currency effects on sales in CHF is expected to amount to 10%
and on operating profit, including one-off effects, about 15%
• Operating profit margin for the year as a whole is likely to be below the value for
the first half of the year
18 28 October 2015 - Investor relations presentation
Sustainability report 2014
• 4th sustainability report based on the key figures 2013
and 2014 of
– 32 most important production sites worldwide,
– these sites account for about 80% of Group sales,
and more than 90% of all employees.
• Compared to 2013, energy consumption at Group
level fell by about 6%, despite a 4% increase in sales.
• G3 standard of the Global Reporting Initiative (GRI),
Application Level C.
• For Bucher, the concept of sustainability stands for:
– management with a long term perspective
– dynamic development of our businesses
– balanced economic, social and environmental needs
• 2015 sustainability report will be published on
30 June 2016. It is planned to base next year’s report
on the new GRI G4 Guidelines.
19
Platzhalter
28 October 2015 - Investor relations presentation

Kuhn Group
Key figures
CHF million January – September Change in Full Year
2015 2014 % %1) %2) 2014
Order intake 706 870 - 18.9 - 10.6 - 12.2 1 221
Net sales 846 987 - 14.3 - 6.3 - 7.6 1 262
Order book 281 376 - 25.5 - 18.7 - 18.7 454
Employees at closing date 4 876 5 290 - 7.8 - 7.8 5 207
20
1) Adjusted for currency effects 2) Adjusted for currency and acquisition effects
CHF million January – June Change in Full Year
2015 2014 % %1) %2) 2014
Operating profit (EBITDA)
as % of net sales
96
14.9%
118
16.3%
- 18.7 196
15.5%
Operating profit (EBIT)
as % of net sales
75
11.7%
98
13.4%
- 22.7 153
12.1%
28 October 2015 - Investor relations presentation

Price development soybeans, corn, wheat
21
USD / bushel US average prices
Source: USDA, Deere
0
2
4
6
8
10
12
14
16
20
05
20
06
20
07
20
08
20
09
20
10
20
11
20
12
20
13
2014P
2015F
Wheat
Corn
Soybeans
28 October 2015 - Investor relations presentation

Kuhn Group
Outlook for 2015
• Long-term outlook: positive and unchanged
• After several years of strong growth, the agricultural cycle is
weakening
– Arable farming is in sharp decline as a result of falling cereal prices
– Milk and meat producers decline less
• Regional variations in market trends
– Demand in the USA and Western Europe subdued, one of the
reasons being the high volume of investment in recent years
– The Ukraine and Russia are suffering seriously from the
consequences of the political crisis and sanctions
– Brazil is in a cyclical trough, which also affects the agricultural
sector
• Sales in terms of local currencies are likely to fall, with lower
profitability
• Translation into Swiss francs is having a marked effect on
sales and operating profit
22 28 October 2015 - Investor relations presentation

Bucher Municipal
Key figures
CHF million January – September Change in Full Year
2015 2014 % %1) 2014
Order intake 281 311 - 9.7 - 3.0 416
Net sales 269 296 - 9.0 - 2.9 419
Order book 106 119 - 10.5 - 3.3 101
Employees at closing date 1 588 1 601 - 0.8 1 557
23
1) Adjusted for currency effects
CHF million January – June Change in Full Year
2015 2014 % %1) 2014
Operating profit (EBITDA)
as % of net sales
15
8.4%
14
7.3%
10.9 40
9.5%
Operating profit (EBIT)
as % of net sales
12
6.2%
10
5.3%
15.0 32
7.7%
28 October 2015 - Investor relations presentation

Bucher Municipal
Outlook for 2015
• Demand in Europe and Australia continuing to stagnate
– Stable market for sweepers, weakening refuse collection vehicles
– Flat winter maintenance equipment business in Europe
• The new range of products can provide momentum
• Measures to mitigate the currency effect due to the strong
Swiss franc: innovation, increased working hours, greater
emphasis on purchasing in euros and US dollars, transfer of
production and expansion in Latvia and Russia
• Marked decline in sales with a maintained profitability level
expected
24 28 October 2015 - Investor relations presentation

Bucher Hydraulics
Key figures
CHF million January – September Change in Full Year
2015 2014 % %1) 2014
Order intake 351 370 - 5.2 - 0.9 485
Net sales 353 365 - 3.2 1.1 475
Order book 73 74 - 1.9 1.8 78
Employees at closing date 2 036 2 080 - 2.1 2 043
25
1) Adjusted for currency effects
CHF million January – June Change in Full Year
2015 2014 % %1) 2014
Operating profit (EBITDA)
as % of net sales
39
16.1%
38
15.3%
3.2 68
14.4%
Operating profit (EBIT)
as % of net sales
30
12.2%
28
11.3%
6.5 49
10.2%
28 October 2015 - Investor relations presentation
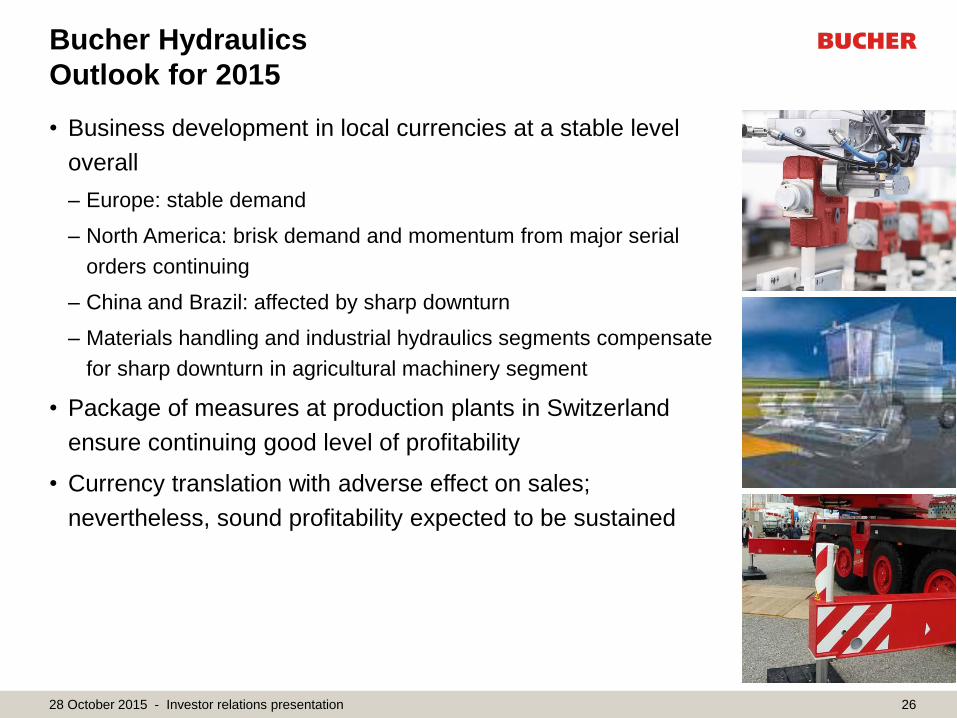
Bucher Hydraulics
Outlook for 2015
• Business development in local currencies at a stable level
overall
– Europe: stable demand
– North America: brisk demand and momentum from major serial
orders continuing
– China and Brazil: affected by sharp downturn
– Materials handling and industrial hydraulics segments compensate
for sharp downturn in agricultural machinery segment
• Package of measures at production plants in Switzerland
ensure continuing good level of profitability
• Currency translation with adverse effect on sales;
nevertheless, sound profitability expected to be sustained
26 28 October 2015 - Investor relations presentation
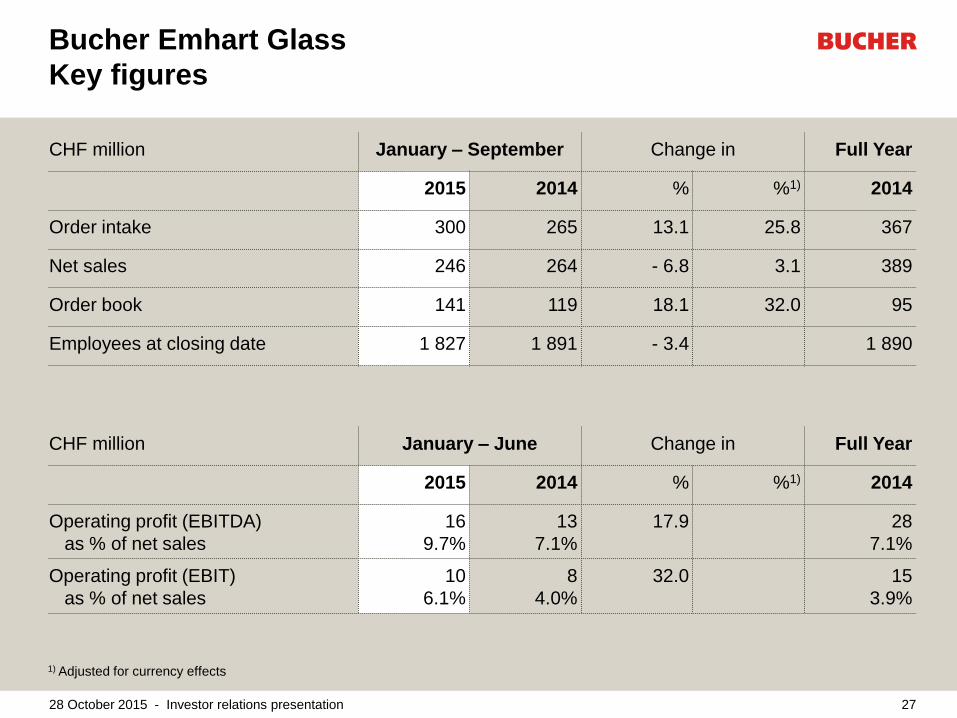
Bucher Emhart Glass
Key figures
CHF million January – September Change in Full Year
2015 2014 % %1) 2014
Order intake 300 265 13.1 25.8 367
Net sales 246 264 - 6.8 3.1 389
Order book 141 119 18.1 32.0 95
Employees at closing date 1 827 1 891 - 3.4 1 890
27
1) Adjusted for currency effects
CHF million January – June Change in Full Year
2015 2014 % %1) 2014
Operating profit (EBITDA)
as % of net sales
16
9.7%
13
7.1%
17.9 28
7.1%
Operating profit (EBIT)
as % of net sales
10
6.1%
8
4.0%
32.0 15
3.9%
28 October 2015 - Investor relations presentation

Bucher Emhart Glass
Outlook for 2015
• Market environment expected to be comparable with that of
last year
– Business with new machinery remains volatile and renders it
difficult to maintain a constant level of capacity utilisation
– Strong parts and service business
– Continuing weakness in Asia; in particular, hardly any momentum
in China
• Control systems, spare parts and new machinery for O-I
support growth
• Concentration on improvement of profitability and
implementation of the agreed measures
• Modest increase in sales in terms of local currencies, with
significantly improved operating profit margin
• Translation into Swiss francs results in marked decrease in
sales, but has little influence on profitability
28 28 October 2015 - Investor relations presentation

Bucher Specials
Key figures
CHF million January – September Change in Full Year
2015 2014 % %1) 2014
Order intake 175 219 - 20.1 - 15.6 299
Net sales 209 239 - 12.3 - 7.8 305
Order book 36 58 - 38.7 - 35.8 73
Employees at closing date 835 842 - 0.8 793
29
1) Adjusted for currency effects
CHF million January – June Change in Full Year
2015 2014 % %1) 2014
Operating profit (EBITDA)
as % of net sales
8
6.1%
14
10.1%
- 43.8 35
11.4%
Operating profit (EBIT)
as % of net sales
5
3.5%
11
7.5%
- 56.1 27
8.9%
28 October 2015 - Investor relations presentation

Bucher Specials
Outlook for 2015
• Market outlook in local currencies:
– Weakening demand for winemaking equipment expected
– Slump in demand for beverage and environmental technology
owing to delays in projects and keen competition
– Positive demand trend at dealership in agricultural machinery in
Switzerland, mainly because of price cuts through euro rebate
– Jetter automation technology in line with expectations
• Operating profit greatly affected by one-off devaluation on
balance sheet items as a result of currency effects and the
slump in sales of beverage technologies
• Bucher Specials expects a drop in sales and operating profit
and a marked, one-off deterioration in operating profit margin
30 28 October 2015 - Investor relations presentation

Your Contacts:
Many thanks.
Roger Baillod, CFO
Tel. +41 43 815 80 50
www.bucherindustries.com
31