ENGLISH FOR BUSINESS ANALYSTS PART 3. BUSINESS ...
179
MINISTRY OF EDUCATION AND SCIENCE OF UKRAINE SIMON KUZNETS KHARKIV NATIONAL UNIVERSITY OF ECONOMICS T. Borova O. Milov ENGLISH FOR BUSINESS ANALYSTS Textbook In 3 parts PART 3. BUSINESS INTELLIGENT TOOLS Kharkiv S. Kuznets KhNUE 2018
-
Upload
khangminh22 -
Category
Documents
-
view
2 -
download
0
Transcript of ENGLISH FOR BUSINESS ANALYSTS PART 3. BUSINESS ...

MINISTRY OF EDUCATION AND SCIENCE OF UKRAINE
SIMON KUZNETS KHARKIV NATIONAL UNIVERSITY OF ECONOMICS
T. Borova
O. Milov
ENGLISH FOR BUSINESS ANALYSTS
Textbook
In 3 parts
PART 3. BUSINESS INTELLIGENT TOOLS
Kharkiv
S. Kuznets KhNUE
2018
UDC 811.111(075.034)
B78
Authors: Doctor of Sciences in Pedagogy, Professor T. Borova – units 1, 3, 5,
glossary; PhD in Engineering, Associate Professor O. Milov – units 2, 4, 6, introduction,
index.
Рецензенти: проректор з науково-дослідної роботи та міжнародної діяльності
Харківської державної академії дизайну і мистецтв, д-р пед. наук, професор О. В. Гончар;
завідувач кафедри загального та прикладного мовознавства Харківського національ-
ного університету імені В. Н. Каразіна, канд. філол. наук, доцент В. О. Гуторов.
Рекомендовано до видання рішенням ученої ради Харківського
національного економічного університету імені Семена Кузнеця.
Протокол № 9 від 25.06.2018 р.
Самостійне електронне текстове мережеве видання
B78
Borova T.
English for Business Analysts : textbook : in 3 parts. Part 3.
Business Intelligent Tools [Electronic resource] / T. Borova, O. Milov. –
Kharkiv : S. Kuznets KhNUE, 2018. – 179 p. (English)
ISBN 978-966-676-743-4
The material for mastering the English language for business analysts is offered.
The third part of the textbook deals with intelligent tools of business analytics which
are the basis of business analysis, namely: data and tools for data mapping, decision
making, knowledge management, computational economics, financial mathematics.
These disciplines provide insight into various economic and mathematical aspects
of business analysis. The textbook can be used both for training in groups and
independent learning.
For students of speciality 051 "Economics", lecturers, as well as those who
learn and use English in the professional activity connected with the application of
mathematical methods in economics.
UDC 811.111(075.034)
© Borova T., Milov O., 2018
© Simon Kuznets Kharkiv National
ISBN 978-966-676-743-4 University of Economics, 2018

3
Introduction
Fluency in English is an indisputable condition for success in all areas
of life, including business. This textbook aims to provide an opportunity for
future specialists in business analytics to master English of the economic and
mathematical area of focus and develop communicative competences (linguistic
and pragmatic) for general and professional purposes to ensure effective
communication in the academic and professional environment. Step by step,
students learn the basics of analytical activities in the area of business in English
while simultaneously improving communicative and language skills.
The third part is focused on the disciplines of business analysis tools
and the application of these tools that are the basis of business analytics and
business intelligence, in particular, the topics related to data and information,
decision making, knowledge management, computational economics, and finance
mathematics. These topics provide insight into different economic and mathe-
matical aspects of business analysis.
This part is addressed to student studying business analysis and business
intelligence, decision making and knowledge management, computational
economics, who are thinking about making a career in business analytics,
or who are already working in system teams. The textbook gives an introductory
overview of words and phrases used in business analytics, decision making,
computational economics, and finance mathematics.
Students specializing in various social and natural sciences, where business
analysis is part of the curriculum, should therefore find this textbook useful. It will
be particularly helpful to students who sometimes feel daunted by mathematical
language and vocabulary.
All units are identical in structure and consist of the basic text with
comprehension exercises, including semantization of new lexical items and
improving the grammatical competence of students, and speaking tasks promoting
more efficient assimilation of new material. The textbook is based on the gradual
complication of professional material.
The content of the authentic texts selected for the textbook meets the
academic and professional purposes. Language skills that are necessary for
performing the communicative tasks are connected with learning economic
and mathematical methods used in business analytics. The vocabulary selected
according to the requirements to the educational level of graduates is topically
4
introduced and drilled in various tasks. Communicative integrated skills promote
the efficiency of study of English. The textbook materials aim to develop
students' professional communicative competence, particularly involving videos
and cases.
The structure of the textbook meets the modern requirements of learning
English, the syllabus of English for professional purposes and the Common
European Framework of Reference for Languages.
The publication contains different materials for self-study and development
of language and communicative skills.
The textbook can be recommended to students studying economics with
the focus on economic and mathematical methods, lecturers, postgraduate
students, and all English language learners who use it for business and
analytics purposes.
5
Unit 1. Business Analytics and Business Intelligence
Task 1. Answer the questions.
1. What is business analytics? Give five associations with this notion.
2. What do you know about business intelligence?
3. What is a business analytics model?
Task 2. Read the text and compare your answers with the information
in the text "Why the term business analytics".
Why the Term Business Analytics
Today most business processes are linked together via electronic systems
that allow them to run smoothly and in a coordinated way. The very same
information systems generate electronic traces that we systematically collect
and store all primarily for simple reporting purposes.
Business analytics allows business to go beyond traditional BA report-
ing. We are entering the analytical age, a window in time where competitive
advantages will be gained from companies making increasingly more advanced
use of information. It will also be a period when other companies will fail and
falter as infosaurs, with only muscles and armor and not the brainpower
needed to survive in changing market conditions.
So to make it clear: Analytics is an advanced discipline within business
intelligence. However, today business intelligence as a term is heavily associated
with large software vendors that offer only simple technical reporting solutions
for the end users. We will use the term business analytics in order to put
extra focus on this missing element of the business intelligence equation, and
which is by now the most exciting one. If mastered, this element will be what
drives your company into a prosperous future.
(Adapted from [5])
Task 3. Match the words with the definitions and then find and underline
them in the text (Task 4).
1) deduce a) lose vigour
2) immense b) a dishonest artifice or trick
3) desperate c) to reach (a conclusion about something) by reasoning;
conclude (that)
6
4) stellar d) risky
5) conduct e) unusually large; huge; vast
6) flag f) outstanding or immense
7) fraud g) the way of managing a business
Task 4. Read the text and answer the questions.
1. What is data mining for a company?
2. Why is the collection and analysis of data important not only on the
Internet?
3. What do credit card issuers often experience? (Give examples.)
4. What did Capital One create? (Explain the main idea of it.)
5. What do Harrah's Casinos use data analytics for?
Analytics and Business
The practice of business is changing. More and more companies are
amassing larger and larger amounts of data, storing them in bigger and bigger
databases.
Data mining is particularly important for companies that only operate
online (such as Amazon or Netflix). The reason is that these companies never
meet their customers in person and thus do not have the ability to observe
their behavior or directly ask them about their needs. Thus, the ability to deduce
customers' preferences from their browsing behavior is key for online retailers.
Indeed, Amazon carefully analyzes a user's past transactions (together with
transactions from other users) in order to make recommendations about new
products. For instance, it may recommend to us a new book (based on other
books we have purchased in the past) or a product accessory (based on the
accessories other customers have bought). If these recommendations match
a user's preferences and needs, then there is a higher chance of a new
transaction – and increased sales for Amazon. Automated and data-driven
recommendations (also known as recommendation engines) have become
the Holy Grail for many Internet retailers. The immense value of recommendation
engines can be seen particularly in the example of Netflix, which paid 1 million
dollars to a team of scientists who improved their in-house recommendation
engine by 10 %.
The collection and analysis of data is important not only on the Internet
because it is equally important for more traditional (e.g. brick-and-mortar)
7
businesses. Take the example of the credit card industry (or other credit-granting
industries, such as mortgage and banking or the insurance industry). Credit card
issuers often experience adverse selection in the sense that those consumers
who want their products most eagerly are often the ones who also carry the
highest risk. Indeed, the reason that a person is desperate for a new credit
card may be that he has an extremely bad credit score and no other company
is willing to issue him a credit card. On the other hand, people who already
own two or three credit cards (and have a stellar credit score) may be rather
unlikely to respond to a new credit card offer. So, do we want that person
who responds to our offer in a rather eager and desperate fashion as our new
customer? This is exactly the situation that Capital One faced several years
ago when it entered the credit card market. As a new company, it wanted to gain
market share quickly. However, there was also a danger that those customers
who were willing to switch most quickly were also the most risky ones. In order
to respond to these challenges, Capital One created a new (and innovative,
at that time) information-based strategy in which they conducted thousands of
laboratory like experiments in order to better understand what characteristics
distinguish good customers from bad. Moreover, they also carefully mined
customers' behavior, such as the way in which a customer responded to a credit
card offer. For instance, a customer responding via phone would be flagged
as a little more risky than one who assembled a written response sent via
regular mail.
Successful applications of data-driven decision making in business are
plentiful and are increasing on a daily basis. Harrah's Casinos use data analytics
not only to record their customers' past activities but especially to predict
future behavior. In fact, Harrah's can predict a customer's potential net worth
(i.e. how much money they would be gambling per visit and how often they
would be visiting over their lifetime) based on data mining techniques. Using
that net worth analysis, they create custom advertising messages and special
offer packages for each customer. Data mining can also help tap into the
"pulse" of the nation (or the consumer). By analyzing sentiments (e.g. positive
vs. negative opinions) over thousands of blogs, companies can obtain real-
time information about their brand image. This could be particularly important
when products face problems (e.g. car recalls) or for identifying new product
opportunities (e.g. sleeper movies at the box office).
The list of successful data mining stories goes on. AT&T uses social
network analysis (i.e. mining the links and nodes in a network) to identify fraud
8
in their telephone network. Automated and data-driven fraud detection is also
popular with credit card companies such as Visa and Mastercard. Large
accounting companies (such as PriceWaterhouse) develop data-driven methods
to unearth inconsistencies in accounting statements. Other companies (such
as IBM) use internal as well as external data in order to predict a customer's
"wallet" (i.e. their potential for purchasing additional services). And the list goes on.
More curious examples include human resource management at successful
sports teams. For instance, both the Boston Red Sox (baseball) and the New
England Patriots (football) are famous for using data analytics to make decisions
about the composition of their teams. All of this shows that data can play
a key role and can provide a competitive edge across many different sectors
and in many different business processes (both internal and external).
(Adapted from [3])
Task 5. Describe the main idea of the text (Task 4).
Focus on Reading
Task 6. Translate these phrases into your native language.
1) business analytics
2) cross-organizational activity
3) business-driven environment
4) information strategy
5) technically oriented environment
6) functional managers
7) business process owners
8) development environment
Task 7. Some of the key terms given above are used in the text (Task 9).
Look through the text and underline them.
Task 8. Read the text below (Task 9) and choose the best heading
to each of its parts.
A Business Processes and Information Use
B Overview of the Business Analytics Model
9
C Types of Reporting and Analytical Processes
D Strategy Creation
Task 9. Read the text carefully. Say whether the statements below are
true or false.
1. The purpose of the model is to provide the organization with an
only common frame of reference for an overall organization in the creation
of successful BA.
2. The model does not explain the roles of the individual contributors
and the interaction in the information generation and information consumption
process.
3. The model never gives clues about why most BA projects fail.
4. Business-driven environment moves from the information requirements
down to the technically oriented environment.
5. In the top layer of the model, in the business-driven environment, the
management specifies or develops an information strategy.
6. In the second layer, the operational decision makers' need for information
and knowledge is determined in a way that supports the stakeholder's chosen
strategy.
7. In the middle layer of the model, analysts, controllers, and report
developers create the information and knowledge to be used by the company's
operational decision makers for the purpose of innovating and optimizing their
day-to-day activities.
8. In the second layer from the bottom, in the technically oriented environ-
ment in the data warehouse, the database specialist or the ETL developer
merges and enriches data, and makes it accessible to the business user.
9. The objective of BA initiatives is to change technically oriented environ-
ment and actions so that they are targeted toward achieving the organization's
strategic objectives.
10. The analysis and reporting development environment is placed in the
business-driven and technically oriented environment, and the team in this
area usually has competencies in both areas.
The Business Analytics Model
This text focuses on the business analytics (BA) model, which provides
an outline for understanding – and creating – successful business analytics
10
in any type of organization. The purpose of the model is to give the organization
a single common frame of reference for an overall structure in the creation
of successful BA, and it clarifies the roles of the individual contributors and the
interaction in the information generation and information consumption process,
which is what BA is, too.
If your job is to make an information strategy, for example, as a CIO,
the model comprises all the stakeholders and processes you should focus on.
The model also gives clues about why most BA projects fail, which is simply
because it is a large cross-organizational activity. You can compare it to a chain
that is only as strong as its weakest link and if one of the departments involved
is incompetent or if the knowledge handover between departments fails, your
project will fail.
1. …
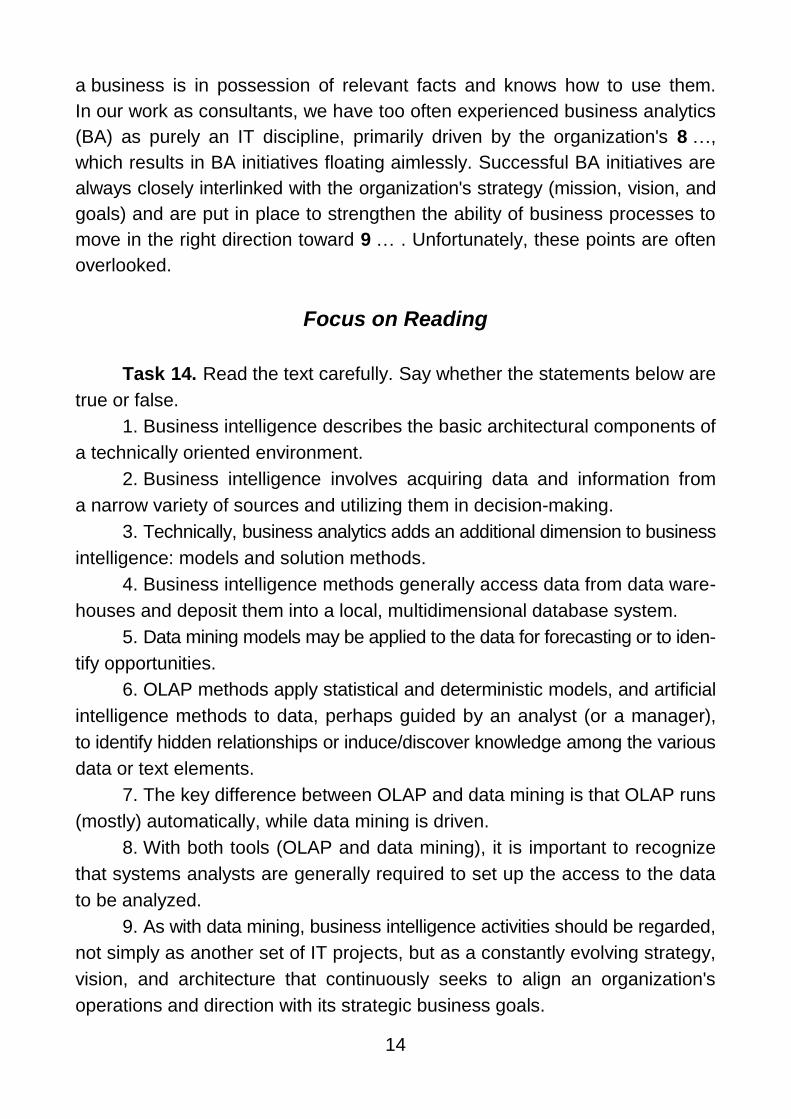
The BA model in Fig. 1.1 illustrates how business analytics is a layered
and hierarchical discipline. Arrows show the underlying layers that are subject
to layers above. Information requirements move from the business-driven
environment down to the technically oriented environment. The subsequent
information flow moves upward from the technically oriented environment toward
the business-driven environment.
As illustrated by the BA model in Fig. 1.1, there are many competencies,
people, and processes involved in the creation of BA. In the top layer of the model,
in the business-driven environment, the management specifies or develops
an information strategy based on the company's or the business area's overall
business strategy. In the second layer, the operational decision makers' need
for information and knowledge is determined in a way that supports the company's
chosen strategy. In the middle layer of the model, analysts, controllers, and
report developers create the information and knowledge to be used by the
company's operational decision makers for the purpose of innovating and
optimizing their day-to-day activities. In the second layer from the bottom,
in the technically oriented environment in the data warehouse, the database
specialist or the ETL (extract, transformation, load) developer merges and
enriches data, and makes it accessible to the business user. In the bottom
layer, in the technically oriented environment, the business's primary data
generating source systems are run and developed by IT professionals from IT
operations and development. Successful BA processes should have a fixed

11
structure, which always begins with the specification of the information strategy,
which is derived from the objectives of the business strategy.
Fig. 1.1. The Business Analytics Model
2. …
All underlying contributions and activities must submit to the chosen
information strategy, as specified in the business-driven environment at the
top. The information strategy is decided at this level based on the organization's
or the business area's overall business strategy (vision, mission, and objectives).
Normally, these strategies will result in a number of key performance indicators
(KPIs) for the purpose of measuring the degree of progress and success. The
contents of the KPIs will depend on which underlying business process we want
to control. The KPIs could, for instance, relate to profitability, return on equity
(ROE), or different types of sales targets. The information strategy is often
specified by the top management of the organization, by functional managers
or business process owners. Large organizations may have an actual business
Competencies, people, and processes to create successful business intelligence and analytics
Business-driven environment
Technically-oriented environment
Technically oriented environment
(Top) Management
Strategy creation. Choosing an information strategy
Operational decision makers
Business processes. Using information and knowledge
Analysts, controllers, and
report developers
Reporting and analytics. Creating information and knowledge
ETL developers and database
specialists
Data warehouse. Gathering data, making them
accessible and usable
IT professionals Data sources and IT infrastructure. Data creation
Info
rma
tio
n r
eq
uirem
en
ts
Info
rma
tio
n s
up
ply
12
development function, which is responsible for the formulation of the strategy
for the entire group.
3. …
Once the strategy, along with the overall strategic KPIs, is in place,
a framework, focus, and objectives are established for the operational business
processes and initiatives. The information and analyses shown in the underlying
layers of the model must be directed at changing and managing business
processes toward the strategic objectives made visible by the KPIs. The
operational decision makers' desired behavior and the subsequent information
and knowledge requirements to bring about this behavior are specified and
outlined in this layer.
As mentioned above, the objective of BA initiatives is to change busi-
ness processes and actions so that they are targeted toward achieving the
organization's strategic objectives. For example, operational decision makers
from sales, marketing, production, general management, HR, and finance can
use information and knowledge to optimize their daily activities.
4. …
In the analysis and reporting development environment in the middle of
the model, analysts specify which information and data are necessary to achieve
the desired behavior of operational managers in the business environment.
This is where information and knowledge are generated about the deploy-
ment of analytical and statistical models which are based on data from the
data warehouse. The requirements for front-end applications, reporting, and
functionality are also specified in detail here, all for the purpose of meeting
the demands from the higher layers and levels of the model. Note that the
analysis and reporting development environment is placed in the bordering
area between the business-driven and technically oriented environment, and
that the team in this area usually has competencies in both areas.
(Adapted from [5])
Task 10. Read the text (Task 9) again and answer the questions.
1. What is the purpose of the BA model?
2. What should successful BA processes have? Why?
3. What are the advantages of the BA model?
4. What are the disadvantages of the BA model? (Give your reasons.)
13
Task 11. Describe the Business Analytics Model.
Focus on Vocabulary
Task 12. Find synonyms for the words in the table below.
1) provide
2) contributor
3) interaction
4) clue
5) focus on
6) specify
7) determine
8) generate
9) target
Task 13. Complete the text with the following words and phrases:
business objectives, situation, analysts, control, improving, decision support,
algorithms, technical environment, business processes.
Business Analytics
Delivering the right decision support to the right people at the right time.
In our definition, we have chosen the term 1 …, because business analytics
gives you, the business user, data, information, or knowledge, which you can
choose to act upon or not. This definition seeks to get to the same point
as the saying ''people don't buy drills; they buy holes'' and points out that
''people don't buy servers, pivot tables, and 2 …; they buy the ability to monitor
and 3 … their business processes along with insights about how to improve
them".
Regardless of whether it is predictive models or forecasting, it's the
historical information that can give you a status on the 4 … you are in right
now. Maybe your 5 … and their scenario models can present you with dif-
ferent alternatives, but ultimately it's the responsibility of the decision makers
to choose which 6 … they want to alter or initiate based on the decision
support. Business analytics is about 7 … the business's basis for decision
making, its operational processes, and the competitiveness obtained when
14
a business is in possession of relevant facts and knows how to use them.
In our work as consultants, we have too often experienced business analytics
(BA) as purely an IT discipline, primarily driven by the organization's 8 …,
which results in BA initiatives floating aimlessly. Successful BA initiatives are
always closely interlinked with the organization's strategy (mission, vision, and
goals) and are put in place to strengthen the ability of business processes to
move in the right direction toward 9 … . Unfortunately, these points are often
overlooked.
Focus on Reading
Task 14. Read the text carefully. Say whether the statements below are
true or false.
1. Business intelligence describes the basic architectural components of
a technically oriented environment.
2. Business intelligence involves acquiring data and information from
a narrow variety of sources and utilizing them in decision-making.
3. Technically, business analytics adds an additional dimension to business
intelligence: models and solution methods.
4. Business intelligence methods generally access data from data ware-
houses and deposit them into a local, multidimensional database system.
5. Data mining models may be applied to the data for forecasting or to iden-
tify opportunities.
6. OLAP methods apply statistical and deterministic models, and artificial
intelligence methods to data, perhaps guided by an analyst (or a manager),
to identify hidden relationships or induce/discover knowledge among the various
data or text elements.
7. The key difference between OLAP and data mining is that OLAP runs
(mostly) automatically, while data mining is driven.
8. With both tools (OLAP and data mining), it is important to recognize
that systems analysts are generally required to set up the access to the data
to be analyzed.
9. As with data mining, business intelligence activities should be regarded,
not simply as another set of IT projects, but as a constantly evolving strategy,
vision, and architecture that continuously seeks to align an organization's
operations and direction with its strategic business goals.
15
10. Performance management systems (PMS) are one of the oldest
forms.
Business Intelligence / Business Analytics
Business intelligence describes the basic architectural components of
a business intelligence environment, ranging from traditional topics, such as
business process modeling and data modeling, to more modern topics, such
as business rule systems, data profiling, information compliance and data quality,
data warehousing, and data mining.
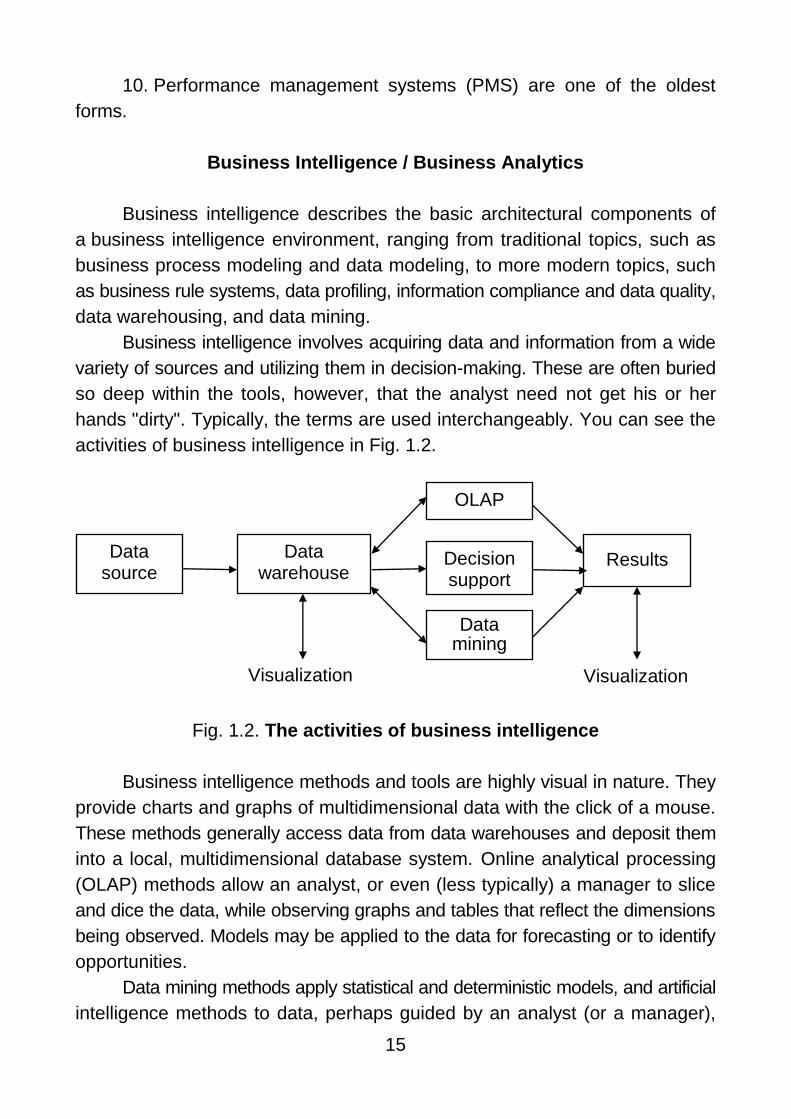
Business intelligence involves acquiring data and information from a wide
variety of sources and utilizing them in decision-making. These are often buried
so deep within the tools, however, that the analyst need not get his or her
hands "dirty". Typically, the terms are used interchangeably. You can see the
activities of business intelligence in Fig. 1.2.
Fig. 1.2. The activities of business intelligence
Business intelligence methods and tools are highly visual in nature. They
provide charts and graphs of multidimensional data with the click of a mouse.
These methods generally access data from data warehouses and deposit them
into a local, multidimensional database system. Online analytical processing
(OLAP) methods allow an analyst, or even (less typically) a manager to slice
and dice the data, while observing graphs and tables that reflect the dimensions
being observed. Models may be applied to the data for forecasting or to identify
opportunities.
Data mining methods apply statistical and deterministic models, and artificial
intelligence methods to data, perhaps guided by an analyst (or a manager),
Data source
Data warehouse
Results
Data mining
Decision support
OLAP
Visualization Visualization
16
to identify hidden relationships or induce/discover knowledge among the various
data or text elements. Data mining is also highly visual in the way results are
displayed. Graphs and charts typically display results. Thus, the key difference
between OLAP and data mining is that data mining runs (mostly) automatically,
while OLAP is driven. As tools improve in ease of use, more and more
managers utilize them, resulting in a trend to move business intelligence from
the analyst to the user (manager). This introduces a new problem: managers
sometimes do not fully understand business intelligence/business analytics
methods. In consequence, their focus may be on visualization rather than
application of appropriate and accurate analysis tools. With both tools, it is
important to recognize that systems analysts are generally required to set up
the access to the data to be analyzed. This involves dealing with data cleansing
and integration, a task best left to IS specialists.
According to an IDC report issued in the fall of 2002, organizations that
have successfully implemented and used analytic applications have realized
returns ranging from 17 percent to more than 2000 percent, with a median
ROI of 122 percent. Even so, more than half of all business intelligence
projects fail. As with data warehousing, business intelligence activities should
be regarded, not simply as another set of IT projects, but as a constantly
evolving strategy, vision, and architecture that continuously seeks to align
anorganization's operations and direction with its strategic business goals.
They continue to evolve. Companies achieve success when they do the fol-
lowing:
Make better decisions with greater speed and confidence.
Streamline operations.
Shorten product development cycles.
Maximize value from existing product lines and anticipate new
opportunities.
Create better, more focused marketing as well as improved relationships
with customers and suppliers.
New forms of business intelligence continue to emerge. Performance
management systems (PMS) are one of the new forms. These are business
intelligence tools that provide scorecards and other relevant information with
which decision-makers can determine their level of success in reaching their
goals.
(Adapted from [11])

17
Task 15. Read the text (Task 14) again and answer the questions.
1. What components does business intelligence consist of?
2. What does OLAP allow an analyst to do?
3. What do data mining methods apply?
4. What is the difference between OLAP and data mining methods?
5. What should the companies do to achieve success?
Task 16. Discuss with your partner what business intelligence describes.
Focus on Vocabulary
Task 17. Complete the text with the following words and phrases:
feedback, dashboards, corporate performance, multidimensional, visual,
graphs, strategy, health, geographical information, performance, business
performance.
Business Performance Management
1 … management (BPM), which is also referred to as 2 … management
(CPM), is an emerging portfolio of applications and methodology that contains
evolving BI architecture and tools in its core. BPM extends the monitoring,
measuring, and comparing of sales, profit, cost, profitability, and other 3 …
indicators by introducing the concept of management and 4 … . BPM provides
a top-down enforcement of corporate-wide 5 … . BPM is usually combined
with the balanced scorecard methodology and 6 … .
Dashboards (which resemble automobile dashboards) provide a com-
prehensive 7 … view of corporate performance measures (also known as key
performance indicators), trends, and exceptions. They integrate information from
multiple business areas. Dashboards present 8 … that show actual performance
compared to desired metrics; thus, a dashboard presents an at-a-glance view
of the 9 … of the organization. In addition to dashboards, other tools that
broadcast information are corporate portals, digital cockpits, and other visualization
tools. Many visualization tools, ranging from 10 … cube presentation to virtual
reality, are integral parts of BI systems. Recall that BI emerged from EIS, so
many visual aids for executives were transformed to BI software. Also,
technologies such as 11 … systems (GIS) play an increasing role in decision
support.
18
Focus on Listening
Task 18. Discuss with your partner what a business analyst does and
describe his/her professional activities (responsibilities).
Task 19. Watch Video 1 "Who is a Business Analyst? – Minds Mapped
Consulting" and compare your answers. Do they have the same ideas?
[https://www.youtube.com/watch?v=WiLFAM0Aagg]
Task 20. Complete the sentences then watch Video 1 (Task 19) again
and check them.
1. A business analyst is someone who …, and systems assessing the
business model and its integration with technology.
2. Business analysis is the practice of enabling change in an organizational
context by … that deliver value to stakeholders.
3. Business analysts develop … to improve efficiency, regain a competitive
edge, increase productivity, reduce expenses or improve efficiency.
4. A business analyst consults with companies to … that enhance the
company's financial success.
5. The business analyst skills in a broad perspective comprise the person's
being … .
6. Business analysts of software firms act as the liaison between business
users and development teams by serving as … .
Task 21. Give a list of the main responsibilities of a business analyst
(Task 19).
Focus on Speaking
Task 22. Work in pairs and complete each sentence.
1. Today most business processes are linked together via electronic
systems that allow them … .
2. Business analytics allows business … .
3. Data mining is particularly important for companies … .
4. The collection and analysis of data is important not only on the Internet
because … .
19
5. The business analytics (BA) model which provides … .
6. The BA model illustrates … .
7. Business intelligence describes the basic … .
8. Business intelligence involves acquiring data and … .
9. Business intelligence methods and tools provide charts and graphs
of … . These methods generally access data from … .
10. Online analytical processing (OLAP) methods allow an analyst to … .
Models may be applied to the data for … .
11. Data mining methods apply statistical and deterministic models, and
artificial intelligence methods to data to identify … .
12. The key difference between OLAP and data mining is that … .
13. Business analysis is the practice of enabling change in an organizational
context by … .
14. Business analysis is the process of understanding … .
15. The business analyst skills in a broad perspective comprise the
person's being … .
Task 23. Work in pairs and discuss the main purpose of business
analytic / business intelligence.
Focus on Problems and Questions
Task 24. Read the text and tasks and answer the questions below.
1. How did Harrah's end up with a major problem on its hands?
2. Why was it important to collect data on customers?
3. How do information technologies (data mining, data warehouse, customer
resource management, etc.) help managers identify customer profiles and their
profitability?
4. What was the impact of the Harrah's customer loyalty program?
5. How could a retail store effectively develop methods and systems like
those used by Harrah's to boost profitability and market share?
Harrah's Makes a Great Beti
The Problem
Gaming is highly competitive and profitable. Many people want to gamble,
and every casino wants to attract their business. In the early 1990s, gambling
on riverboats and Native American reservations was legalized. Major operators

20
moved into these new markets. Between 1990 and 1997, Harrah's tripled its
number of casinos. As the new markets grew more competitive, the business
reached the point of diminishing returns. Harrah's early arrival was often
usurped by newer, grander, more extravagant casinos nearby. Each Harrah's
casino operated and marketed itself independently from the others. The managers
of each property felt that they owned certain customers, and customers were
treated differently at other Harrah's properties.
Customer service had not changed much since the 1970s. Casino
managers had long recognized the importance of building relationships with
their most profitable clientele. They reserved star treatment for the high-rollers,
but only gave an occasional free drink to the folks playing machines. However,
by the end of the 1980s, slot machines surpassed table games as the major
casinos' largest source of income. In 1997, executives at Harrah's recognized
that devising a means to keep their 25 million slot players loyal to Harrah's
was the key to profitability.
The Solution
Harrah's approaches each new customer as a long-term acquaintance.
The company analyzed gigabytes of customer data collected by player-tracking
systems during the previous five years with data mining techniques. Executives
found that the 30 percent of their customers who spent between $100 and
$500 per visit accounted for 80 percent of company revenue – and almost
100 percent of profits. These gamblers were typically locals who visited regional
Harrah's properties frequently.
Harrah's developed a Total Rewards Program. It distributes Harrah's
Total Rewards Cards to its customers, which they use to pay for slots, food,
and rooms operated by the Harrah's, Players, Rio, and Showboat brands.
The company uses magnetic strips on the cards to capture gaming information
on every customer, and offers comps (free drinks, meals, hotel rooms, etc.)
and other incentives based on the amount of money inserted into machines,
not the amount won. The card tracks how long customers play, how much
they bet, what games they prefer, and whether they win or lose. It creates
a "profitability profile" that estimates a customer's value to the company. Harrah's
publishes clear criteria for comping players free rooms and upgrades, and
makes them accessible and redeemable.
Harrah's electronically linked all of its players clubs so that when gamblers
at one location go to another, they can redeem their Reward points for free
meals, rooms, or shows. Harrah's can actively market its casino "family"
21
to Total Rewards Customers. The airlines have been doing this for years. Now
Harrah's could establish close relationships with its most profitable customers
and develop brand loyalty.
Harrah's system works as follows:
Magnetic card readers on all its gaming machines read a customer ID
number from each card and flash a personalized greeting with the customer's
current tally of Reward points.
Electronic gaming machines are computerized and networked. Each
machine captures transaction data and relays it to Harrah's mainframe servers.
Onsite transaction systems at each casino property store all casino,
hotel, and dining transaction data.
A national data warehouse links the casinos' computer systems and
customer data to a single server that tallies customer history and Reward
points.
Predictive analysis software programs produce nearly instantaneous
customer profiles. The company can design and track marketing initiatives and
their results.
A Web site keeps customers informed, connected, and entertained.
The data warehouse, a large, specialized database, maintains demographic
and spending-pattern data on all customers. Data mining techniques, also
called business intelligence (business analytics, or analytical methods), are
used to analyze the data and identify classes of profitable customers to target
for future business at all properties. Together, these methods are combined
into a customer relationship management (CRM) system, a decision support
system (DSS) that helps managers make sales and marketing decisions. The
Harrah's Web site links customer information, the brand-loyalty program, the
properties, specials, and other relevant data.
Data are collected at each property by transaction processing systems
(TPS) and moved to a centralized data warehouse, where they are analyzed.
Age and distance from the casino are critical predictors of frequency, coupled
with the kind of game played and how many coins are played per game.
For example, the perfect player is a 62-year-old woman who lives within
30 minutes of Kansas City, Missouri, and plays dollar video poker. Such customers
typically have substantial disposable cash, plenty of time on their hands, and
easy access to a Harrah's riverboat casino.
The system identifies high-value customers and places them in cor-
responding demographic segments (all told there are 90). Customers who

22
live far away typically receive direct-mail discounts or comps on hotel rooms
or transportation, while drive-in customers get food, entertainment, or cash
incentives. Most offers have tight expiration dates to encourage visitors to
either return sooner or switch from a competitor. For each direct-marketing
pitch, the company tracks response rates and returns on investment, and
adjusts its future campaigns according to the results.
The Results
Slots and other electronic gaming machines account for most of Harrah's
$3.7 billion in revenue and more than 80 percent of its operating profit.
Largely on the strength of its new tracking and data mining system for slot
players, Harrah's has recently emerged as the second-largest operator in the
United States, with the highest three-year investment return in the industry.
The Total Rewards program has generated $20 million in annual cost reductions
by identifying unprofitable customers and treating them as such. In 2001, the
Harrah's network linked more than 40,000 gaming machines in twelve states
and created brand loyalty. In just the first two years of the Total Rewards
program, revenue increased by $100 million from customers who gambled at
more than one Harrah's casino. Since 1998, each percentage-point increase
in Harrah's share of its customers' overall gambling budgets has coincided
with an additional $125 million in shareholder value. The company's record
earnings of $3.7 billion in 2001 were up 11 percent from 2000. More than half
of the revenue at Harrah's three Las Vegas casinos now comes from players
the company already knows from its casinos outside of Nevada.
(Adapted from [11])
Focus on Self-Assessment
Task 1.1. Read the texts below. Match choices (A – C) to (1 – 3).
Business Intelligence Assessment
A business intelligence assessment is a low-cost, actionable examination
of the three areas critical to the implementation of any business intelligence
initiative:
1. … . Analyze the underlying strategic and tactical business goals and
objectives that are driving the development of the BI solution, including whether
executive sponsorship and funding are available.

23
2. … . Analyze the existing business and technical organizational structures,
including the level of IT/business partnering in place, the organization's culture
and leadership style, its understanding of BI concepts, whether roles and
responsibilities have been established, and whether people with the appropriate
amount of time and skills are in places.
3. … . Analyze whether the appropriate technical infrastructure and
development methodologies are in place, including all related hardware and
software, the quality and quantity of the source data, and the methodology
and change-control process.
The assessment forces an organization to examine strengths and
weaknesses within these three areas and makes recommendations about
how to fix potential problem areas. Ideally perform such an analysis before
developing a costly set of systems, including data warehouses, OLAP, and
data mining. The assessment itself helps build awareness and support for the
initiative.
(Adapted from [3])
A Technical/methodology analysis
B Organizational analysis
C Business needs analysis
Task 1.2. Read the text below. Match choices (A – H) to (4 – 10). There
are two choices you do not need to use.
A Framework for Business Intelligence (BI)
The decision support concepts have been implemented incrementally,
under different names, by many vendors that have created tools and
methodologies for decision support. As the enterprise-wide systems grew,
4 … that enabled them to make decisions quickly. These systems, which
were generally called executive information systems (EIS), then began to
5 …, and performance measurement capabilities. By 2006, the major com-
mercial products and services appeared under the umbrella term business
intelligence (BI).
Business intelligence (BI) is an umbrella term that 6 …, and methodologies.
It is, like decision support system (DSS), 7 …, so it means different things to
different people. Part of the confusion about BI lies in the flurry of acronyms
and buzzwords that are associated with it. BI's major objective is to enable
interactive access (sometimes in real time) to data, to enable manipulation
24
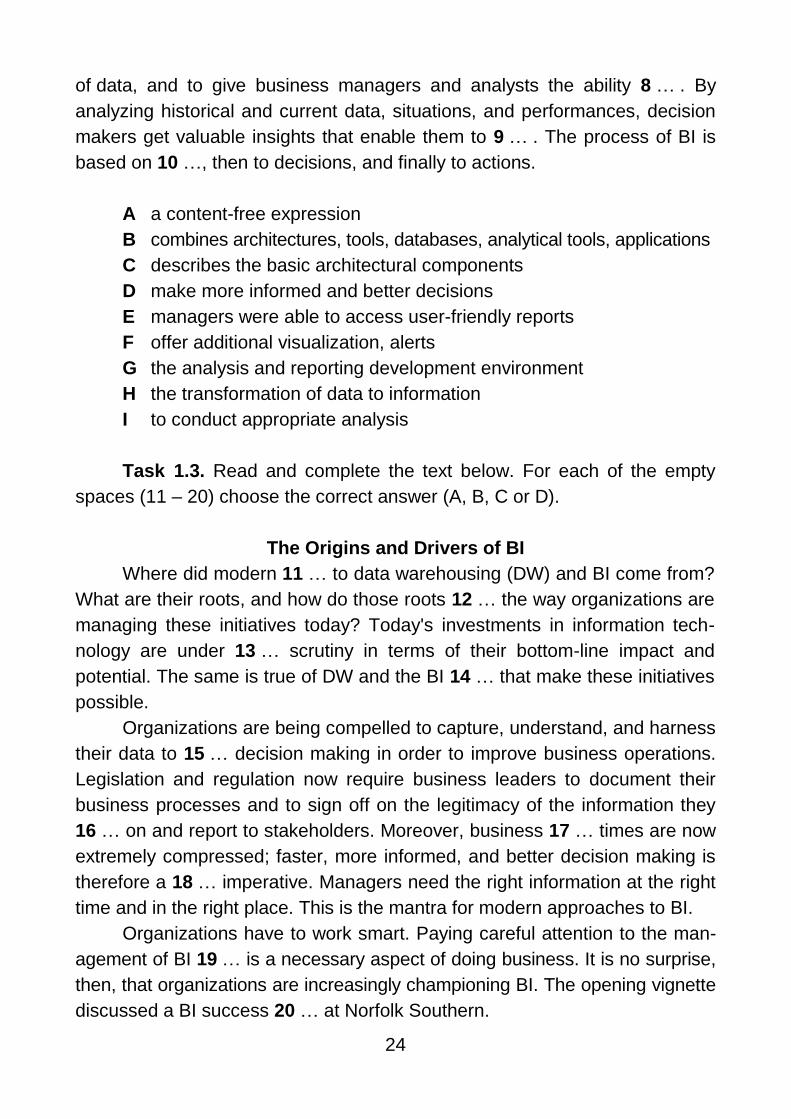
of data, and to give business managers and analysts the ability 8 … . By
analyzing historical and current data, situations, and performances, decision
makers get valuable insights that enable them to 9 … . The process of BI is
based on 10 …, then to decisions, and finally to actions.
A a content-free expression
B combines architectures, tools, databases, analytical tools, applications
C describes the basic architectural components
D make more informed and better decisions
E managers were able to access user-friendly reports
F offer additional visualization, alerts
G the analysis and reporting development environment
H the transformation of data to information
I to conduct appropriate analysis
Task 1.3. Read and complete the text below. For each of the empty
spaces (11 – 20) choose the correct answer (A, B, C or D).
The Origins and Drivers of BI
Where did modern 11 … to data warehousing (DW) and BI come from?
What are their roots, and how do those roots 12 … the way organizations are
managing these initiatives today? Today's investments in information tech-
nology are under 13 … scrutiny in terms of their bottom-line impact and
potential. The same is true of DW and the BI 14 … that make these initiatives
possible.
Organizations are being compelled to capture, understand, and harness
their data to 15 … decision making in order to improve business operations.
Legislation and regulation now require business leaders to document their
business processes and to sign off on the legitimacy of the information they
16 … on and report to stakeholders. Moreover, business 17 … times are now
extremely compressed; faster, more informed, and better decision making is
therefore a 18 … imperative. Managers need the right information at the right
time and in the right place. This is the mantra for modern approaches to BI.
Organizations have to work smart. Paying careful attention to the man-
agement of BI 19 … is a necessary aspect of doing business. It is no surprise,
then, that organizations are increasingly championing BI. The opening vignette
discussed a BI success 20 … at Norfolk Southern.
25
11 A aspects B approaches C effects D treatment
12 A effect B influence C affecting D affect
13 A increase B increased C access D upgrade
14 A applications B operations C relevance D function
15 A guide B base C support D bear
16 A calculate B delegate C charge D rely
17 A chain B cycle C series D loop
18 A competitive B ambitious C bargain D contrary
19 A desire B push C initiatives D drive
20 A story B news C adventure D novel
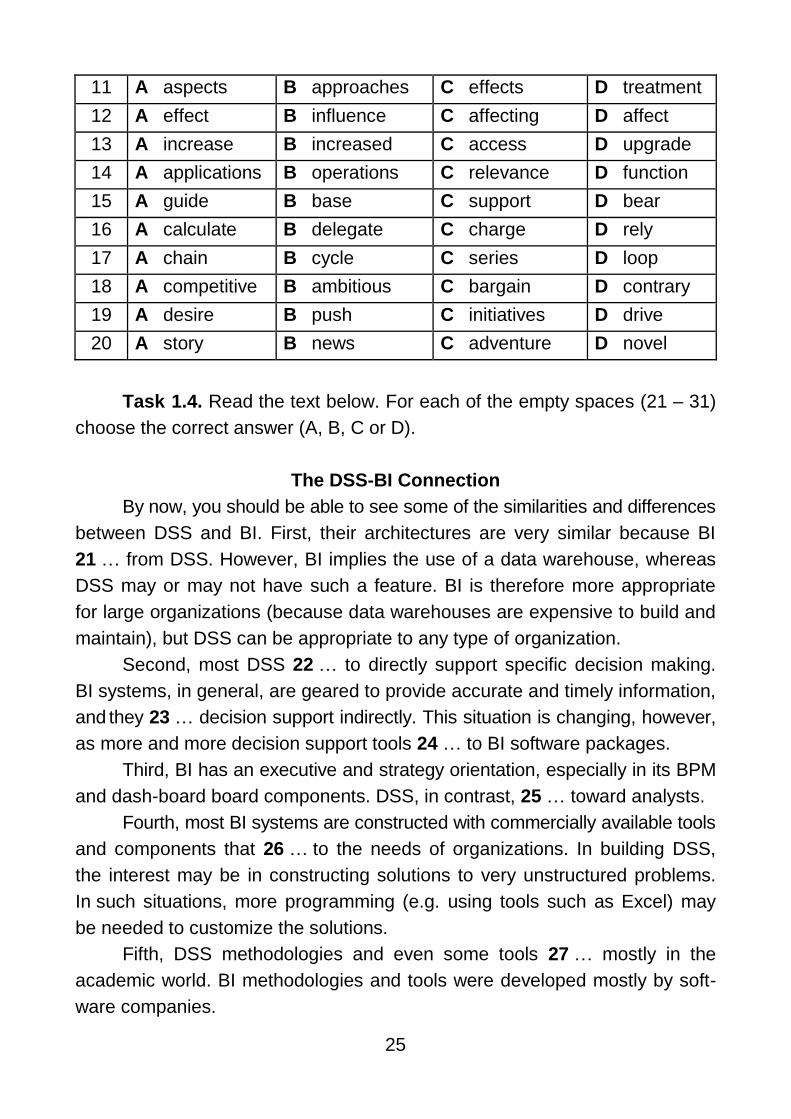
Task 1.4. Read the text below. For each of the empty spaces (21 – 31)
choose the correct answer (A, B, C or D).
The DSS-BI Connection
By now, you should be able to see some of the similarities and differences
between DSS and BI. First, their architectures are very similar because BI
21 … from DSS. However, BI implies the use of a data warehouse, whereas
DSS may or may not have such a feature. BI is therefore more appropriate
for large organizations (because data warehouses are expensive to build and
maintain), but DSS can be appropriate to any type of organization.
Second, most DSS 22 … to directly support specific decision making.
BI systems, in general, are geared to provide accurate and timely information,
and they 23 … decision support indirectly. This situation is changing, however,
as more and more decision support tools 24 … to BI software packages.
Third, BI has an executive and strategy orientation, especially in its BPM
and dash-board board components. DSS, in contrast, 25 … toward analysts.
Fourth, most BI systems are constructed with commercially available tools
and components that 26 … to the needs of organizations. In building DSS,
the interest may be in constructing solutions to very unstructured problems.
In such situations, more programming (e.g. using tools such as Excel) may
be needed to customize the solutions.
Fifth, DSS methodologies and even some tools 27 … mostly in the
academic world. BI methodologies and tools were developed mostly by soft-
ware companies.

26
Sixth, many of the tools that BI uses 28 … DSS tools. For example,
data mining and predictive analysis are core tools in both areas.
Although some people equate DSS with BI, these systems are not, at
present, the same. It is interesting to note that some people 29 … that DSS is
a part of BI – one of its analytical tools. Others think that BI is a special case
of DSS that 30 … mostly with reporting, communication, and collaboration
(a form of data-oriented DSS). Another explanations that BI is a result of
a continuous revolution and, as such, DSS is one of BI's original elements.
In this book, we separate DSS from BI. However, we point to the DSS-BI
connection frequently.
21 A evolved B evolve C are evolved D has evolved
22 A constructs B constructing C are constructed D have con-
structed
23 A supporting B supported C support D is supported
24 A are being
added
B added C are added D add
25 A oriented B is oriented C has oriented D orient
26 A fitting B fit C fitted D are fitted
27 A were devel-
oped
B develop C is developed D developing
28 A has consid-
ered
B is also con-
sidered
C are also consid-
ered
D considered
29 A believed B believe C believes D believing
30 A deal B deals C is delt D delt
Task 1.5. Review questions. Give your answers to the questions or
explain the statements.
1. Define BI.
2. List and describe the major components of BI.
3. List and describe the major tangible and intangible benefits of BI.
4. What are the major similarities and differences of DSS and BI?
5. Define DSS.
Score: Tasks 1.1 – 1.4: 1 point per 1 answer (30 points).
Task 1.5: 2 points per 1 answer (correct answers make 10 points).
Total: 40 points.
27
Unit 2. Data and Information
Task 1. Answer the questions.
1. What is data? Give five associations with this notion.
2. What is information? Give five associations with this notion.
3. What is the difference between data and information? Give examples.
Task 2. Read the text and compare your answers with the information
in the text "Data and Information".
Data and Information
Consider what happens at a travel agency.
Some of the decisions that must be made are: how many seats on a charter
flight to book for this holiday next year; who to send the latest brochure to;
which holidays to promote.
Information that will inform these decisions includes: number of people
booked on a holiday; number of unbooked places; comparative demand for
the holiday over the past three years; profitability of the package holiday;
number of holidays taken by a particular family.
This information comes from data that is collected regularly as part of
the business: details of package holidays (price, location, duration); details of
package holiday bookings (number of people, date of departure, holiday selected,
amount paid).
Although the terms "data and information" are commonly used inter-
changeably, technically the terms have distinct meanings.
Data are raw facts, unorganized and frequently unrelated to one another.
Data are frequently numerical (quantitative) but are not necessarily so. Data
can be nonnumeric (qualitative). Examples of data: a certain machine broke
down 4 times last week; there are 13 employees in the Accounts Department;
last year's budget for the HR Department was £157,000; employee satisfaction
with working conditions in the factory; in December, 1500 wheelbarrows were
produced; last month 385 expense claims were submitted.
These are examples of internal data, generated within an organization.
External data are generated outside the organization. For example: the infla-
tion rate rose last month to 4 %; Parliament has just passed new legislation
on pollution controls; the imports of Japanese cars rose last year by 5 %;
28
correspondence from a customer praising the wheelbarrow he purchased.
We will consider sources of external data in more detail later.
Information is obtained by processing data in some way. Information is
a collection of related pieces of data. For example: the machine that broke down
4 times last week had a major overhaul only 3 weeks ago; the 13 employees
in the Accounts Department represent 10 % of the employees of the company;
last year's budget of £157,000 for the HR Department was up by 12 % on the
year before.
The drawing together of relevant pieces of data provides managers with
some important information. Information adds context to the data and provides
meaning.
Data can be processed into information by: bringing together related
pieces of data and tabulating, aggregating, filtering or simply rearranging them;
summarizing; tabulation and the use of diagrams; statistical analysis; financial
analysis.
(Adapted from [10])
Task 3. Read the text below (Task 4) and choose the best heading to
each of its parts.
A The Problems of Using Secondary Data
B External Sources of Data
C Sources of Secondary Data
D Internal Sources of Data
Task 4. Read the text and answer the questions.
1. What is the problem faced by the organization?
2. What are internal sources of data?
3. What are external sources of data?
4. Why is it preferable to use primary data?
5. What are the problems of using secondary data?
6. What are the sources of secondary data?
Sources of Data
Organizations of every kind constantly generate large quantities of data,
which require organizing and processing in a variety of ways in order to
satisfy the information needs of each function in the organization. In addition,

29
the "home grown" data are supplemented by vast quantities of data, which
are generated externally, but nevertheless may form the basis of useful informa-
tion for the organization.
The problem faced by the organization is the management of these data
so that the necessary information can be acquired at the right time and in the
correct format.
1. …
We have already seen that organizations hold significant amounts of
transactional data in their databases. Suitably processed, this can provide
information for making operational, tactical and strategic decisions.
2. …
Organizations frequently use data obtained outside the organization itself.
For example: a market research survey to determine customer satisfaction
with a particular product; information, from official publications, on the size
and characteristics of the population is useful when estimating the number of
potential customers for a new product; information, from company reports, on
the activities (sales, investments, take-overs, etc.) of competitors is important
if a company is to remain competitive.
Data, which are used solely for the purpose for which they were collected
are said to be primary data.
Data, which are used for a different purpose to that for which they were
originally collected, are called secondary data.
The terms "primary" and "secondary" refer to the purpose for which the
data are used.
3. …
In most cases it is preferable to use primary data since data collected
for the specific purpose is likely to be better, i.e. more accurate and more
reliable. However, it is not always possible to use primary data and therefore
we need to be aware of the problems of using secondary data. Some of the
problems are listed below:
a) The data have been collected by someone else. We have no control
over how it was done. If a survey was used, was:
a suitable questionnaire used?
a large enough sample taken?
a reputable organization employed to carry out the data collection?
the data recorded to the required accuracy?

30
b) Is the data up-to-date? Data quickly becomes out-of-date since, for
example, consumer tastes change. Price increases may drastically alter the
market.
c) The data may be incomplete. Certain groups are sometimes omitted
from the published figures, for example, unemployment figures do not include
everyone who does not have a job. (Which groups are left out?) Particular
statistics published by the Motor Traders Association, for example, may exclude
three-wheeled cars, vans and motor-caravans. We must know which categories
are included in the data.
d) Is the information actual, seasonally adjusted, estimated or a pro-
jection?
e) The figures may not be published to a sufficient accuracy and we
may not have access to the raw data. For example, population figures may
be published to the nearest thousand, but we may want to know the exact
number.
The reason for collecting the data in the first place may be unknown, hence
it may be difficult to judge whether the published figures are appropriate for
the current use.
If we are to make use of secondary data, we must have answers to
these questions. Sometimes the answers will be published with the data itself
or sometimes we may be able to contact the people who carried out the data
collection. If not, we must be aware of the limitations of making decisions based
on information produced from the secondary data.
4. …
There are numerous sources of secondary data. They can be broadly
categorized into two groups:
1) Those produced by individual companies, local authorities, trade unions,
pressure groups etc. Some examples are:
Bank of England Quarterly Bulletin – reports on financial and economic
matters.
Company Reports (usually annual) – information on the performance
and accounts of individual companies.
Labour Research (monthly) – articles on industry, employment, trade
unions and political parties.
Financial Times (daily) – share prices and information on business.
31
2) Those produced by Government departments. This is an extensive
source of data and it includes general digests, such as the Monthly Digest of
Statistics, as well as more specific material, such as the New Earnings Survey.
Government Statistics – a brief guide to sources which lists all of the
main publications and departmental contact points.
Guide to Official Statistics is a more comprehensive list.
(Adapted from [10])
Task 5. Describe the main idea of the text (Task 4).
Focus on Reading
Task 6. Translate these phrases into your native language.
1) routine data
2) nonroutine methods of collecting data
3) direct observation
4) direct inspection
5) abstraction from records
Task 7. Some of the key terms given above are used in the text (Task 9).
Look through the text and underline them.
Task 8. Read the text below (Task 9) Match choices (A – I) to (1 – 7).
There are two choices you do not need to use.
A Abstraction from records or published statistics
B Direct inspection
C Direct observation
D Information procedure
E Non-routine methods of collecting data
F Organizational functions
G Personal interviewing
H Routine data
I Written questionnaire
32
Task 9. Read the text carefully. Say whether the statements below are
true or false.
1. Routine data include records about staff, customers, invoices, sales,
industrial accidents, stock in hand, stock on order, etc.
2. Each organization will devise some system for the collection and storage
of this type of data until it is required.
3. Direct observation is a cheap way to collect data.
4. Direct observation is used primarily for scientific surveys, road traffic
surveys and investigations such as the determining of customer service patterns.
5. The questionnaire should comprise the type of questions which require
a difficult response.
6. A survey using a questionnaire is relatively expensive to do.
7. The cost of personal interviewing is low.
Collecting Data
Every organization collects what may be called routine data. 1 … include
records about staff, customers, invoices, sales, industrial accidents, stock in
hand, stock on order, etc. Each organization will devise some system for the
collection and storage of this type of data until it is required. In addition there
will be occasions when the organization requires data to be collected for some
special purpose. For example:
1) a survey of consumer reaction to a recently launched product;
2) an assessment of the company's production line efficiency;
3) an investigation into the type of faults which have occurred in a particular
product;
4) a survey of employee reaction to proposed changes in the staff canteen.
2 … must be employed. The most commonly used methods are:
a) direct observation or direct inspection (example 2 above);
b) written questionnaire (includes postal and online) (example 4 above);
c) personal interview (includes telephone) (example 1 above);
d) abstraction from records or published statistics (example 3 above).
3 … means that the situation under investigation is monitored unobtrusively.
This is an ideal method from the point of view of the investigator, since the
likelihood of incorrect data being recorded is small. It is, however, an expensive
way to collect data.
It is essential that the act of observation does not influence the pattern
of behaviour of the observed. For example, if the behaviour of shoppers in
33
a supermarket is being observed, then, many will change their pattern of
behaviour if they become aware of the observation. They may even leave the
store altogether!
The method is used primarily for scientific surveys, road traffic surveys
and investigations such as the determining of customer service patterns.
4 … uses standardized procedures to determine some property or quality
of objects or materials. For example, a sample of 5 loaves is taken, from
a batch in a bakery, and cut open to test the consistency of the mixture.
5 … is one of the most useful ways of collecting data if the matter under
investigation is straightforward so that short, simple questions can be asked.
The questionnaire should comprise the type of questions which require a simple
response e.g. YES/NO, tick in a box, ring a preferred choice, etc.
A survey using a questionnaire is relatively cheap to do – the time required
(and, hence the cost) is much less for the mailing of 500 questionnaires than
it would be if 500 personal interviews were conducted. The main problem is
that the response rate for postal/online questionnaires is typically very small,
perhaps 10 %.
The design of the questionnaire is very important and is by no means
as simple as it sounds.
6 … may be used in surveys about people's attitudes to a particular
issue e.g. public opinion poll. It is necessary to have a trained interviewer
who remains impartial throughout the interview. The type of question which
is asked can be more complicated than that used in a questionnaire since
the interviewer is present to help promote understanding of the questions and
to record the more complex responses. Tape recording is sometimes used.
Clearly, the cost of personal interviewing is high. The use of the telephone
reduces the cost but increases the bias in the sample, since not every member
of the population can be accessed by phone.
7 … is an extremely cheap and convenient method of obtaining data.
However, the data used will usually have been collected for a different purpose
and may not be in the format required. All of the problems of using secondary
data then arise.
(Adapted from [10])
Task 10. Read the text (Task 9) again and answer the questions.
1. What does routine data include?
2. What is the special purpose of collecting data?
34
3. What are the most commonly used methods of direct observation?
(Give examples).
4. What method uses standardized procedures to determine some property
or quality of objects or materials?
5. How does the method "a written questionnaire" work?
6. What is important in the method "a written questionnaire"?
7. What is the main idea if the method "personal interviewing"?
8. What is the purpose of the method "abstraction from records or published
statistics"?
Task 11. Describe the methods of collecting data.
Focus on Vocabulary
Task 12. Find synonyms for the words in the table below.
1) summarize
2) influence
3) alter
4) produce
5) performance
6) investigation
Task 13. Complete the text with the following words and phrases then watch
Video 2.1 "Data, Information, Knowledge, Wisdom" [https://www.youtube.com/
watch?v=DGTRcWmnDCY] to check your answers:
build, data, wisdom, knowledge, relationships, see, patterns, principles,
connectedness, directly, connected, take, information, understanding.
Let's talk more about the relationship between 1 …, 2 … and 3 … . Now
on this side we are going to have increasing 4 …, so as we go up things are
more connected. And down here is increasing 5 …, no, understanding. We
have data down here, which requires understanding and is not connected to
anything. We have information which has a little 6 … and is connected. And
what we understand between data and information are the relationships.
35
What we understand between information and knowledge are 7 … . And
between knowledge and wisdom, we understand 8 … .
These do not build upon each other. Information does builds 9 … from
data, but to get from information to knowledge is not a direct relationship and
to get from knowledge to 10 … is definitely not related. So, I hope that this
helps you understand how data, information and knowledge are 11 … and
that you can now 12 … this data to 13 … information and then 14 … the
patterns and relationships, so you can build knowledge.
Focus on Reading
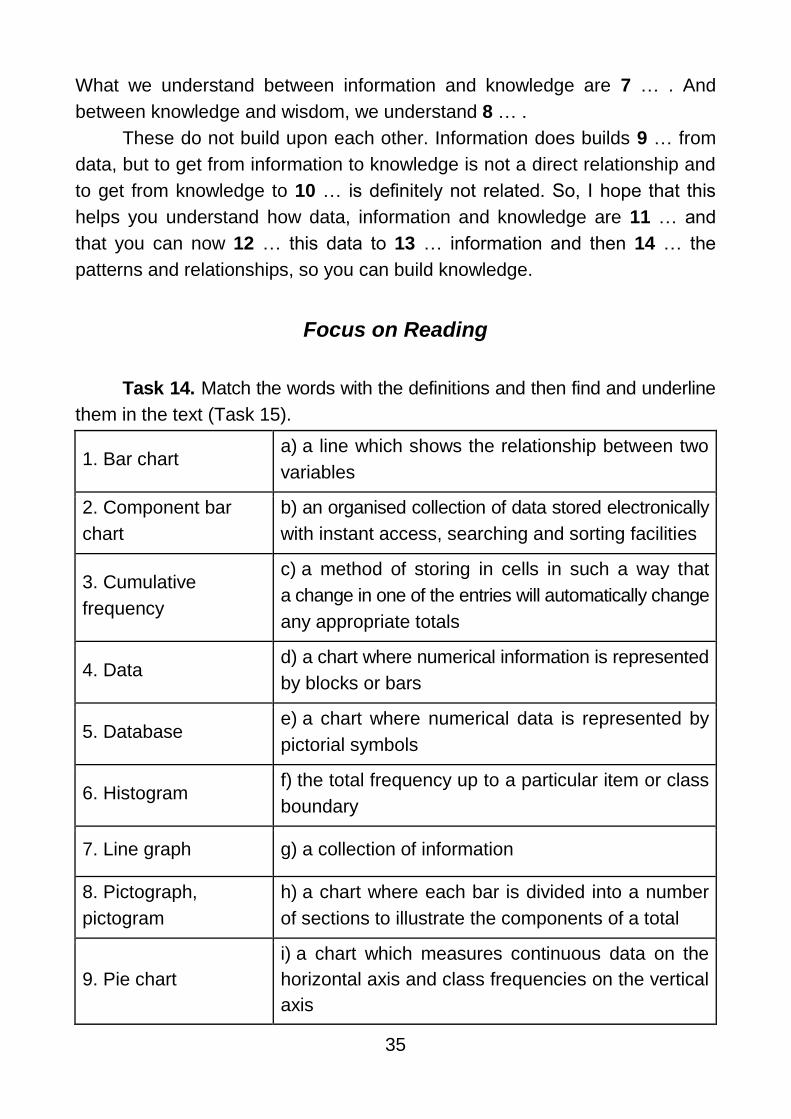
Task 14. Match the words with the definitions and then find and underline
them in the text (Task 15).
1. Bar chart a) a line which shows the relationship between two
variables
2. Component bar
chart
b) an organised collection of data stored electronically
with instant access, searching and sorting facilities
3. Cumulative
frequency
c) a method of storing in cells in such a way that
a change in one of the entries will automatically change
any appropriate totals
4. Data d) a chart where numerical information is represented
by blocks or bars
5. Database e) a chart where numerical data is represented by
pictorial symbols
6. Histogram f) the total frequency up to a particular item or class
boundary
7. Line graph g) a collection of information
8. Pictograph,
pictogram
h) a chart where each bar is divided into a number
of sections to illustrate the components of a total
9. Pie chart
i) a chart which measures continuous data on the
horizontal axis and class frequencies on the vertical
axis

36
10. Spreadsheet j) a chart which consists of a circle where the data
components are represented by the segments
Task 15. Read the text. Say which methods presented in column 2 are
discussed in the parts presented in column 1.
Part 1
Pictographs or pictograms
Bar charts
Component bar charts
Cumulative frequency curves
Databases
Histograms
Line graphs
Pie charts
Spreadsheets
Tables
Part 2
Part 3
Presenting Data
Part 1
Why do businesses present data? Information is a valuable resource.
Knowing whether a profit is likely to be made, how a product is selling, whether
stocks are running low and how much cash is available are all vital for run-
ning a business. Firms will need access to a variety of information or data,
including: weekly or monthly sales figures; financial information at the end of
the year; productivity rates of workers and capital; market research finding;
the costs of production.
The data must be stored, retrieved and then presented in the most
accessible and straightforward way. In some cases data is required imme-
diately. A business can then analyze the data and use it to make decisions.
Information technology means that large amounts of data can now be stored
on computer disk. The data can be easily "called up" on a computer screen
and presented in a form businesses can use.
A bar chart is one of the simplest and most common means of presenting
data. Numerical information is represented by "bars" or "blocks" which can be
drawn horizontally or vertically. The length of the bars shows the relative
importance of the data. Table 2.1 shows data on the profit made by Ragwear
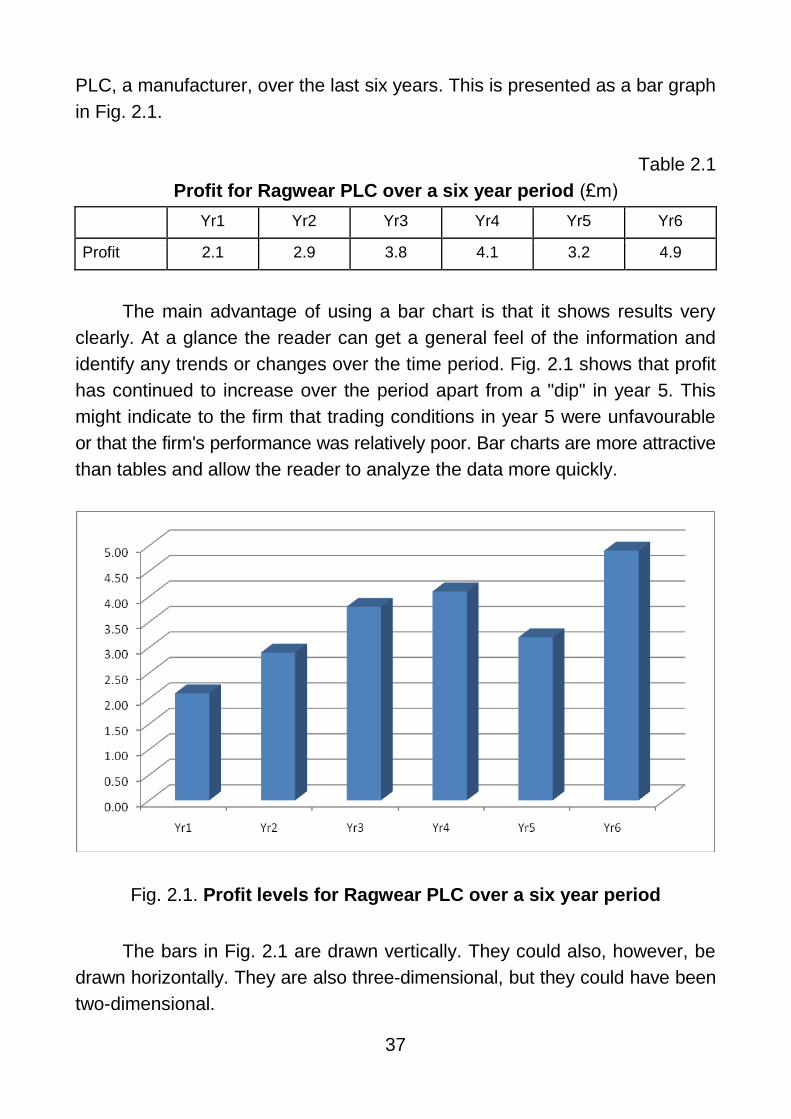
37
PLC, a manufacturer, over the last six years. This is presented as a bar graph
in Fig. 2.1.
Table 2.1
Profit for Ragwear PLC over a six year period (£m)
Yr1 Yr2 Yr3 Yr4 Yr5 Yr6
Profit 2.1 2.9 3.8 4.1 3.2 4.9
The main advantage of using a bar chart is that it shows results very
clearly. At a glance the reader can get a general feel of the information and
identify any trends or changes over the time period. Fig. 2.1 shows that profit
has continued to increase over the period apart from a "dip" in year 5. This
might indicate to the firm that trading conditions in year 5 were unfavourable
or that the firm's performance was relatively poor. Bar charts are more attractive
than tables and allow the reader to analyze the data more quickly.
Fig. 2.1. Profit levels for Ragwear PLC over a six year period
The bars in Fig. 2.1 are drawn vertically. They could also, however, be
drawn horizontally. They are also three-dimensional, but they could have been
two-dimensional.
38
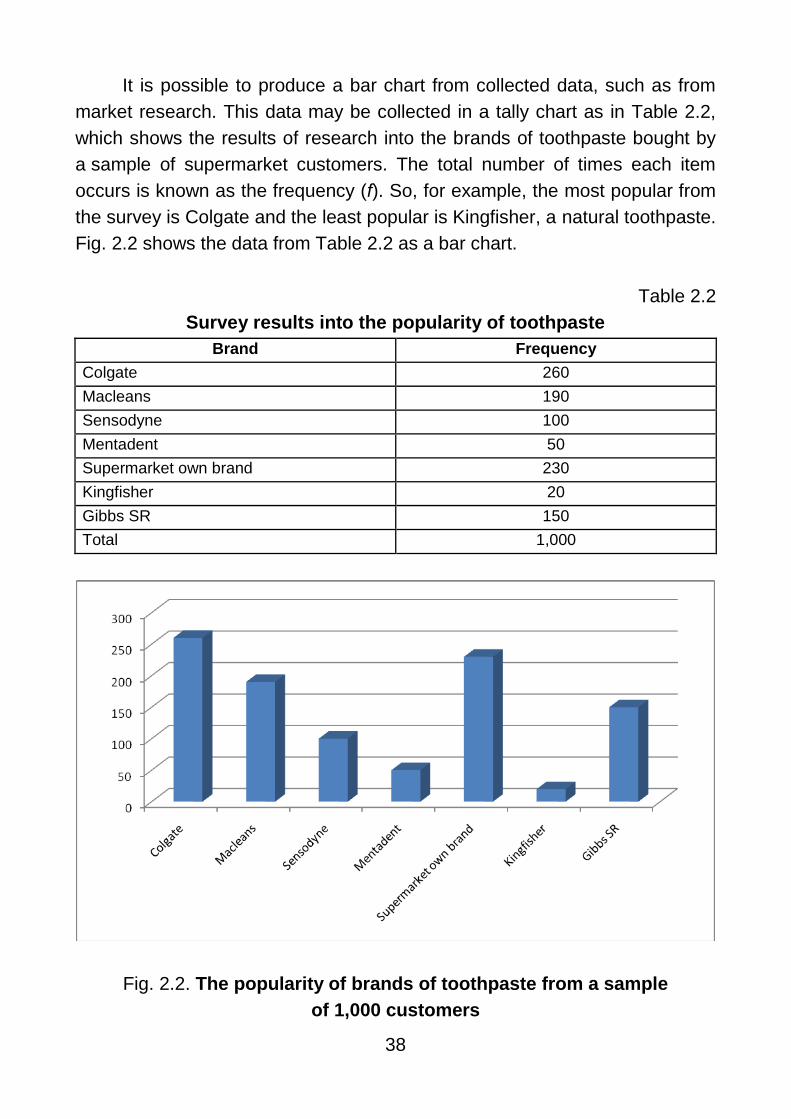
It is possible to produce a bar chart from collected data, such as from
market research. This data may be collected in a tally chart as in Table 2.2,
which shows the results of research into the brands of toothpaste bought by
a sample of supermarket customers. The total number of times each item
occurs is known as the frequency (f). So, for example, the most popular from
the survey is Colgate and the least popular is Kingfisher, a natural toothpaste.
Fig. 2.2 shows the data from Table 2.2 as a bar chart.
Table 2.2
Survey results into the popularity of toothpaste
Brand Frequency
Colgate 260
Macleans 190
Sensodyne 100
Mentadent 50
Supermarket own brand 230
Kingfisher 20
Gibbs SR 150
Total 1,000
Fig. 2.2. The popularity of brands of toothpaste from a sample
of 1,000 customers
39
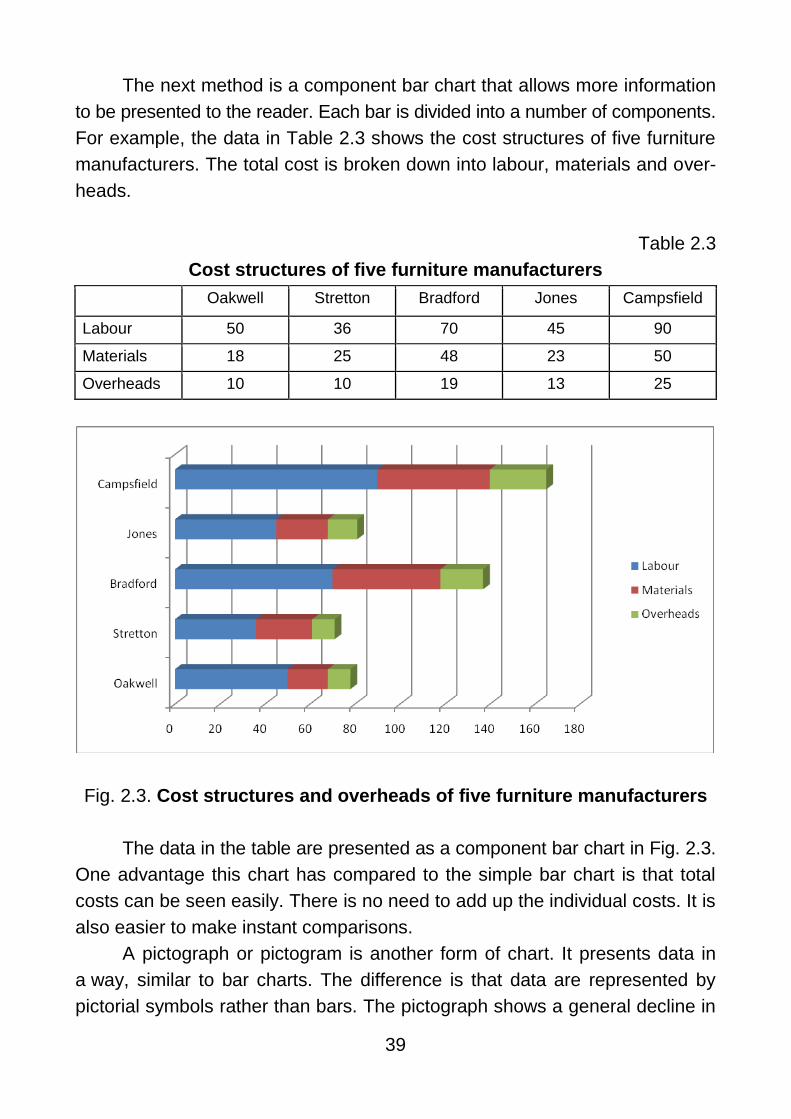
The next method is a component bar chart that allows more information
to be presented to the reader. Each bar is divided into a number of components.
For example, the data in Table 2.3 shows the cost structures of five furniture
manufacturers. The total cost is broken down into labour, materials and over-
heads.
Table 2.3
Cost structures of five furniture manufacturers
Oakwell Stretton Bradford Jones Campsfield
Labour 50 36 70 45 90
Materials 18 25 48 23 50
Overheads 10 10 19 13 25
Fig. 2.3. Cost structures and overheads of five furniture manufacturers
The data in the table are presented as a component bar chart in Fig. 2.3.
One advantage this chart has compared to the simple bar chart is that total
costs can be seen easily. There is no need to add up the individual costs. It is
also easier to make instant comparisons.
A pictograph or pictogram is another form of chart. It presents data in
a way, similar to bar charts. The difference is that data are represented by
pictorial symbols rather than bars. The pictograph shows a general decline in
40
orders. This might indicate that there is a general decline in the market or that
customers are delaying future orders. One problem with a pictograph is that it
is not always easy to "divide" the symbols exactly. This makes it difficult to
read precise quantities from the graph. The main advantage of this method is
that the graphs tend to be more eyecatching. Such a method might be used
in business presentations to attract clients or in reports to the public.
Part 2
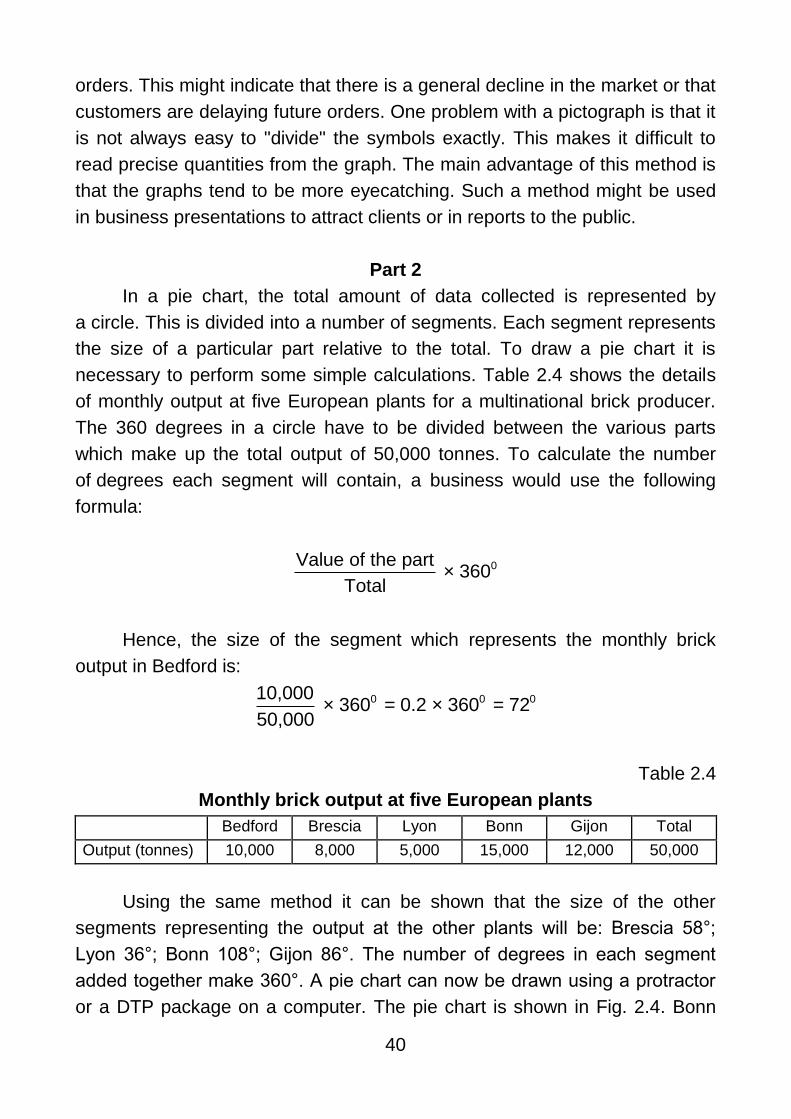
In a pie chart, the total amount of data collected is represented by
a circle. This is divided into a number of segments. Each segment represents
the size of a particular part relative to the total. To draw a pie chart it is
necessary to perform some simple calculations. Table 2.4 shows the details
of monthly output at five European plants for a multinational brick producer.
The 360 degrees in a circle have to be divided between the various parts
which make up the total output of 50,000 tonnes. To calculate the number
of degrees each segment will contain, a business would use the following
formula:
0Value of the part × 360
Total
Hence, the size of the segment which represents the monthly brick
output in Bedford is:
0 0 010,000 × 360 = 0.2 × 360 = 72
50,000
Table 2.4
Monthly brick output at five European plants
Bedford Brescia Lyon Bonn Gijon Total
Output (tonnes) 10,000 8,000 5,000 15,000 12,000 50,000
Using the same method it can be shown that the size of the other
segments representing the output at the other plants will be: Brescia 58°;
Lyon 36°; Bonn 108°; Gijon 86°. The number of degrees in each segment
added together make 360°. A pie chart can now be drawn using a protractor
or a DTP package on a computer. The pie chart is shown in Fig. 2.4. Bonn

41
makes the largest contribution to the monthly output with Gijon second. The
company might use this information to compare with monthly production targets.
Pie charts are useful because readers get an immediate impression of
the relative importance of the various parts. They can also be used to make
comparisons over different time periods. There are however, drawbacks with
pie charts.
They do not always allow precise comparisons to be made between the
segments.
If a total consists of a very large number of components, it may be
difficult to identify the relative importance of each segment.
It is difficult to show changes in the size of the total pie. For example, if
the total rises over time, it is possible to make the "pie" bigger. However, the
exact size of the increase is often difficult to determine because it involves
comparing the areas of circles.
Fig. 2.4. A pie chart illustrating the monthly output (tonnes) at five
European plants for a multinational company producing bricks
Table 2.5 illustrates some data collected by market researchers on behalf
of a football club. It concerns the age profile of a spectator sample at a Saturday
afternoon Premier League fixture. The chart shows the number of spectators
Bedford 10 000
Brescia 8 000
Lyon 5 000
Bonn 15 000
Gijon 12 000
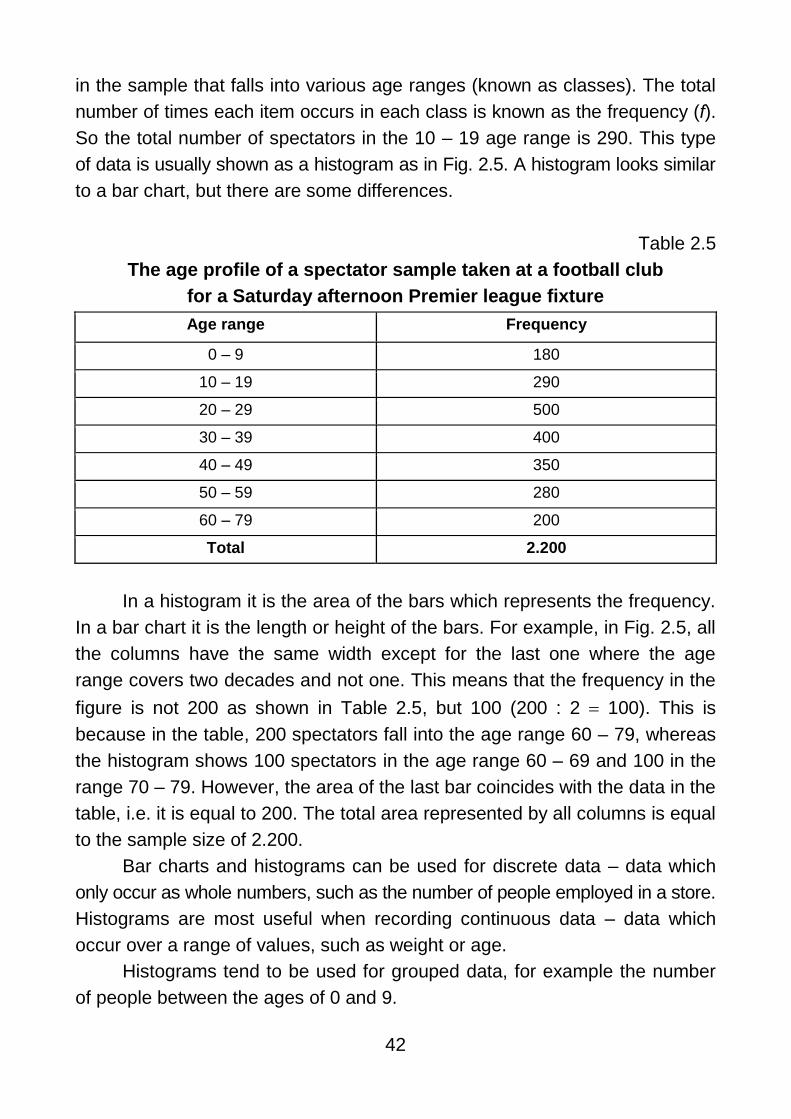
42
in the sample that falls into various age ranges (known as classes). The total
number of times each item occurs in each class is known as the frequency (f).
So the total number of spectators in the 10 – 19 age range is 290. This type
of data is usually shown as a histogram as in Fig. 2.5. A histogram looks similar
to a bar chart, but there are some differences.
Table 2.5
The age profile of a spectator sample taken at a football club
for a Saturday afternoon Premier league fixture
Age range Frequency
0 – 9 180
10 – 19 290
20 – 29 500
30 – 39 400
40 – 49 350
50 – 59 280
60 – 79 200
Total 2.200
In a histogram it is the area of the bars which represents the frequency.
In a bar chart it is the length or height of the bars. For example, in Fig. 2.5, all
the columns have the same width except for the last one where the age
range covers two decades and not one. This means that the frequency in the
figure is not 200 as shown in Table 2.5, but 100 (200 : 2 100). This is
because in the table, 200 spectators fall into the age range 60 – 79, whereas
the histogram shows 100 spectators in the age range 60 – 69 and 100 in the
range 70 – 79. However, the area of the last bar coincides with the data in the
table, i.e. it is equal to 200. The total area represented by all columns is equal
to the sample size of 2.200.
Bar charts and histograms can be used for discrete data – data which
only occur as whole numbers, such as the number of people employed in a store.
Histograms are most useful when recording continuous data – data which
occur over a range of values, such as weight or age.
Histograms tend to be used for grouped data, for example the number
of people between the ages of 0 and 9.
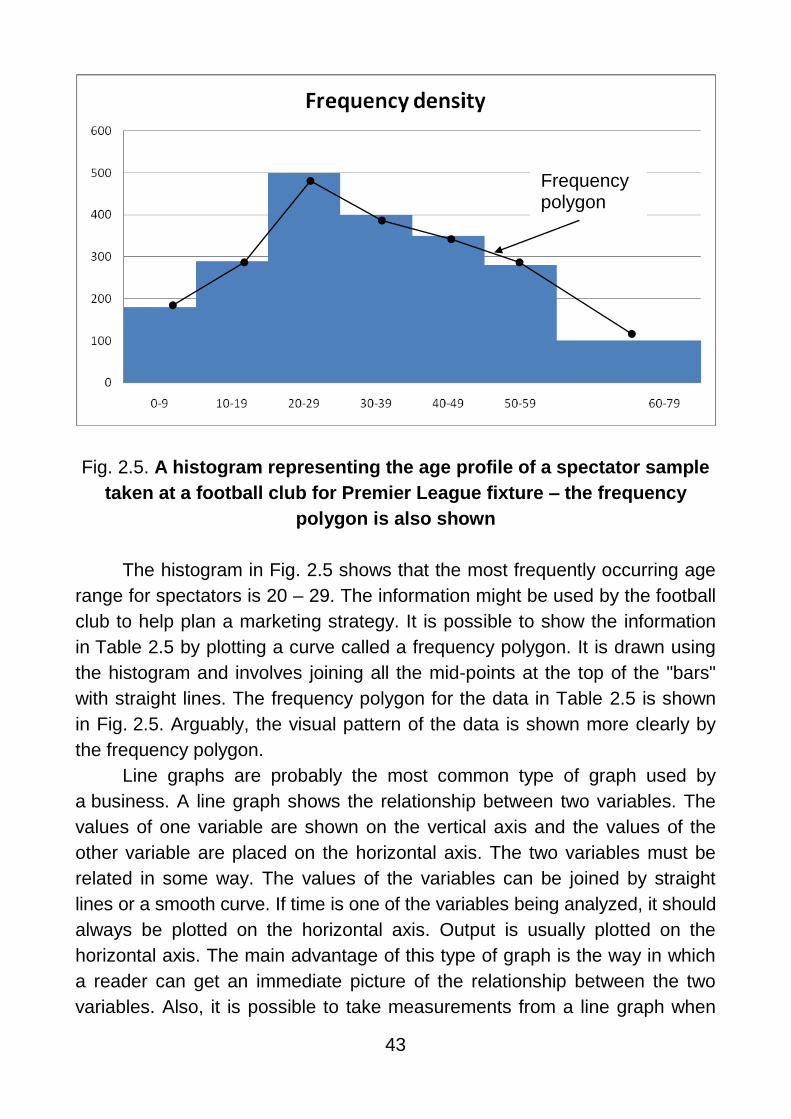
43
Fig. 2.5. A histogram representing the age profile of a spectator sample
taken at a football club for Premier League fixture – the frequency
polygon is also shown
The histogram in Fig. 2.5 shows that the most frequently occurring age
range for spectators is 20 – 29. The information might be used by the football
club to help plan a marketing strategy. It is possible to show the information
in Table 2.5 by plotting a curve called a frequency polygon. It is drawn using
the histogram and involves joining all the mid-points at the top of the "bars"
with straight lines. The frequency polygon for the data in Table 2.5 is shown
in Fig. 2.5. Arguably, the visual pattern of the data is shown more clearly by
the frequency polygon.
Line graphs are probably the most common type of graph used by
a business. A line graph shows the relationship between two variables. The
values of one variable are shown on the vertical axis and the values of the
other variable are placed on the horizontal axis. The two variables must be
related in some way. The values of the variables can be joined by straight
lines or a smooth curve. If time is one of the variables being analyzed, it should
always be plotted on the horizontal axis. Output is usually plotted on the
horizontal axis. The main advantage of this type of graph is the way in which
a reader can get an immediate picture of the relationship between the two
variables. Also, it is possible to take measurements from a line graph when
Frequency polygon

44
analyzing data. It is much more difficult to do this when reading figures from
a table. Quite often more than one line is shown on a line graph so that
comparisons can be made.
Part 3
Tables are used to present many forms of data. They may be used: if
data are qualitative rather than quantitative; where a wide range of variables
needs to be expressed at the same time; where the numbers themselves are
at the centre of attention; when it is necessary to perform calculations on the
basis of the information.
Some would argue that the use of tables should be avoided if possible.
However, a poorly or inaccurately drawn graph would be less effective than
a neatly presented table. Table 2.6 shows information about the number of
outlets various DIY businesses have. The parent company of each business
is also listed. This data could not be shown effectively using a graph or chart.
The data are largely qualitative and there is quite a large number of entries.
The table shows that Magnet have the largest number of outlets with 306.
Homebase, owned by J. Sainsbury / GB-Inno BM, have the smallest number
with just 50 outlets.
Table 2.6
Lading DIY retailers, early 2000s
Trading name Company/parent Number of
outlets
1 2 3
B&Q Kingfisher 243
Homobase J. Sainsbury / GB-Inno BM 50
Texas Homecare
Ladbroka Group 251 Sandford
Texas Bulk DIY
Menders Paint & Wallpaper Mandara (Holdings) 64
Great Mills RMC 61
Do-it-All WH Smith Group 114
Feds, Décor 8, Home Charm & Homestyle Boots (formerly Ward While) 106
Payless DlY
Wickes Builder Mate Wickes 150
Magnet Magnet 306
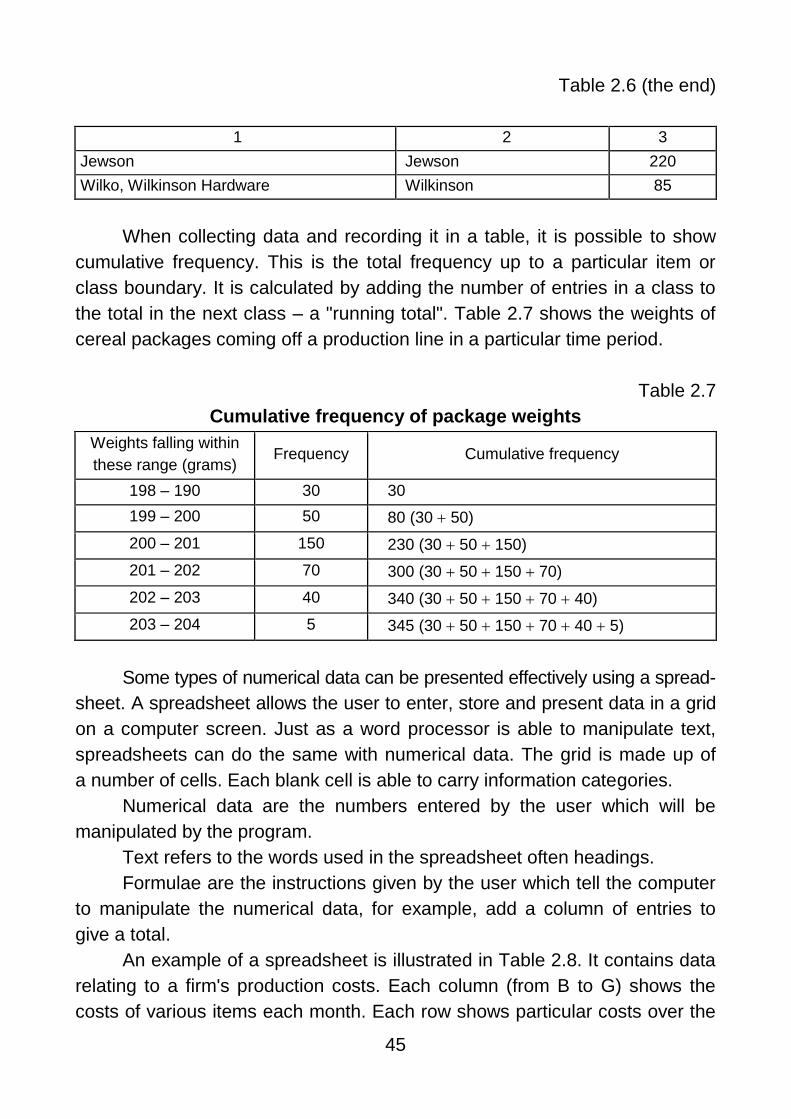
45
Table 2.6 (the end)
1 2 3
Jewson Jewson 220
Wilko, Wilkinson Hardware Wilkinson 85
When collecting data and recording it in a table, it is possible to show
cumulative frequency. This is the total frequency up to a particular item or
class boundary. It is calculated by adding the number of entries in a class to
the total in the next class – a "running total". Table 2.7 shows the weights of
cereal packages coming off a production line in a particular time period.
Table 2.7
Cumulative frequency of package weights
Weights falling within
these range (grams) Frequency Cumulative frequency
198 – 190 30 30
199 – 200 50 80 (30 50)
200 – 201 150 230 (30 50 150)
201 – 202 70 300 (30 50 150 70)
202 – 203 40 340 (30 50 150 70 40)
203 – 204 5 345 (30 50 150 70 40 5)
Some types of numerical data can be presented effectively using a spread-
sheet. A spreadsheet allows the user to enter, store and present data in a grid
on a computer screen. Just as a word processor is able to manipulate text,
spreadsheets can do the same with numerical data. The grid is made up of
a number of cells. Each blank cell is able to carry information categories.
Numerical data are the numbers entered by the user which will be
manipulated by the program.
Text refers to the words used in the spreadsheet often headings.
Formulae are the instructions given by the user which tell the computer
to manipulate the numerical data, for example, add a column of entries to
give a total.
An example of a spreadsheet is illustrated in Table 2.8. It contains data
relating to a firm's production costs. Each column (from B to G) shows the
costs of various items each month. Each row shows particular costs over the
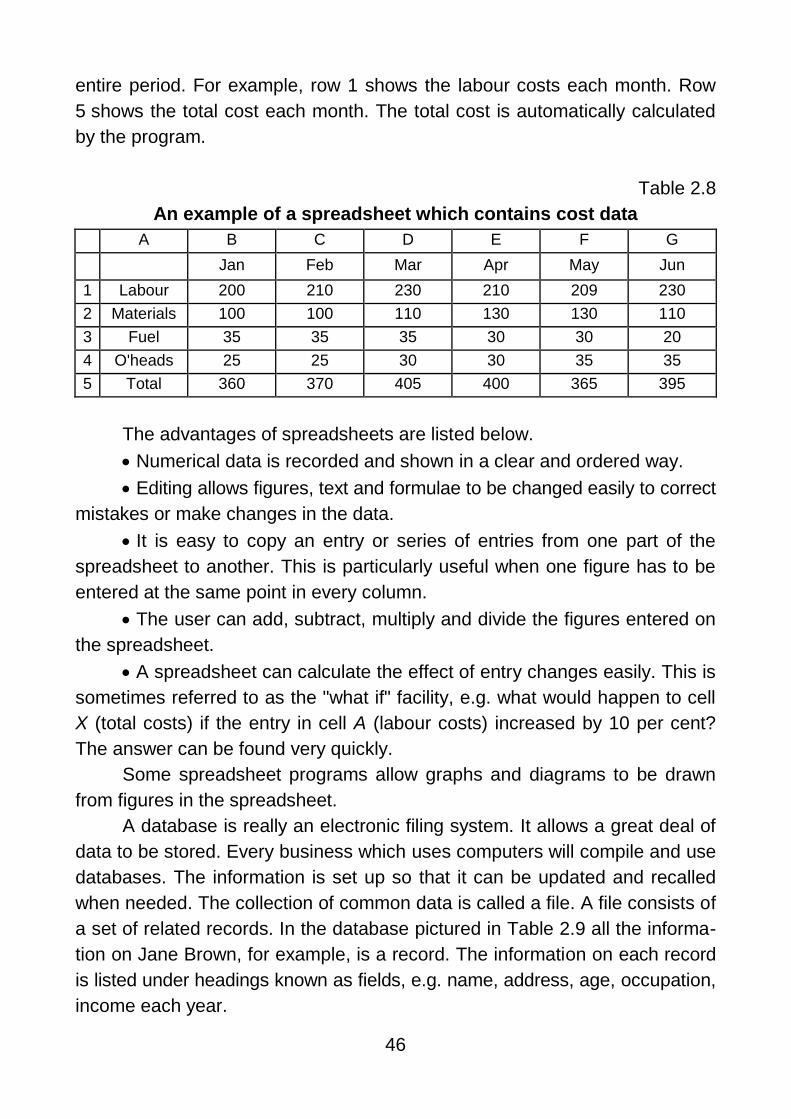
46
entire period. For example, row 1 shows the labour costs each month. Row
5 shows the total cost each month. The total cost is automatically calculated
by the program.
Table 2.8
An example of a spreadsheet which contains cost data
A B C D E F G
Jan Feb Mar Apr May Jun
1 Labour 200 210 230 210 209 230
2 Materials 100 100 110 130 130 110
3 Fuel 35 35 35 30 30 20
4 O'heads 25 25 30 30 35 35
5 Total 360 370 405 400 365 395
The advantages of spreadsheets are listed below.
Numerical data is recorded and shown in a clear and ordered way.
Editing allows figures, text and formulae to be changed easily to correct
mistakes or make changes in the data.
It is easy to copy an entry or series of entries from one part of the
spreadsheet to another. This is particularly useful when one figure has to be
entered at the same point in every column.
The user can add, subtract, multiply and divide the figures entered on
the spreadsheet.
A spreadsheet can calculate the effect of entry changes easily. This is
sometimes referred to as the "what if" facility, e.g. what would happen to cell
X (total costs) if the entry in cell A (labour costs) increased by 10 per cent?
The answer can be found very quickly.
Some spreadsheet programs allow graphs and diagrams to be drawn
from figures in the spreadsheet.
A database is really an electronic filing system. It allows a great deal of
data to be stored. Every business which uses computers will compile and use
databases. The information is set up so that it can be updated and recalled
when needed. The collection of common data is called a file. A file consists of
a set of related records. In the database pictured in Table 2.9 all the informa-
tion on Jane Brown, for example, is a record. The information on each record
is listed under headings known as fields, e.g. name, address, age, occupation,
income each year.

47
Table 2.9
An extract from a simple database
Name Address Age Occupation Income p.a.
Adams John 14 Stanley St. Bristol 39 Bricklayer £15,000
Appaswamy Krishen 2 Virginia St. Cardiff 23 Welder £25,000
Atkins Robert 25 Liverpool Rd. Cardiff 42 Teacher £21,000
Biddle Ron 34 Bedford Rd. Bath 58 Civil servant £40,000
Brown Jane 111 Bold St. Newport 25 Solicitor £22,000
A good database will have the following facilities.
"User-definable" record format, allowing the user to enter any chosen
field on the record.
File searching facility for finding specified information from a file, e.g.
identifying all clients with an income over £24,000 in the above file. It is
usually possible to search on more than one criterion, e.g. all females with an
income over £24,000. File sorting facility for rearranging data in another order, e.g. arranging
the file in Table 2.9 in ascending order of income.
In the world of business and commerce there is actually a market for
information held on databases. It is possible to buy banks of information from
market researchers who have compiled databases over the years. Names
and addresses of potential customers would be information well worth pur-
chasing if it were legally available. The storage of personal data on computer
is subject to the Data Protection Act. Any company or institution wishing to store
personal data on a computer system must register with the Data Protection
Office. Individuals have a right under the Act to request details of information
held on them.
Just as bias can affect the collection of data it can also affect its pre-
sentation. When presenting profit figures to shareholders or sales figures to
customers, managers will want to show the business in the best light. There
is a danger that figures may be distorted in the way they are presented, in
order to make performance look better than it was.
(Adapted from [2])
Task 16. Read the text (Task 14) again and answer the questions.
1. Why is it important for a business to present data clearly, accurately
and attractively?
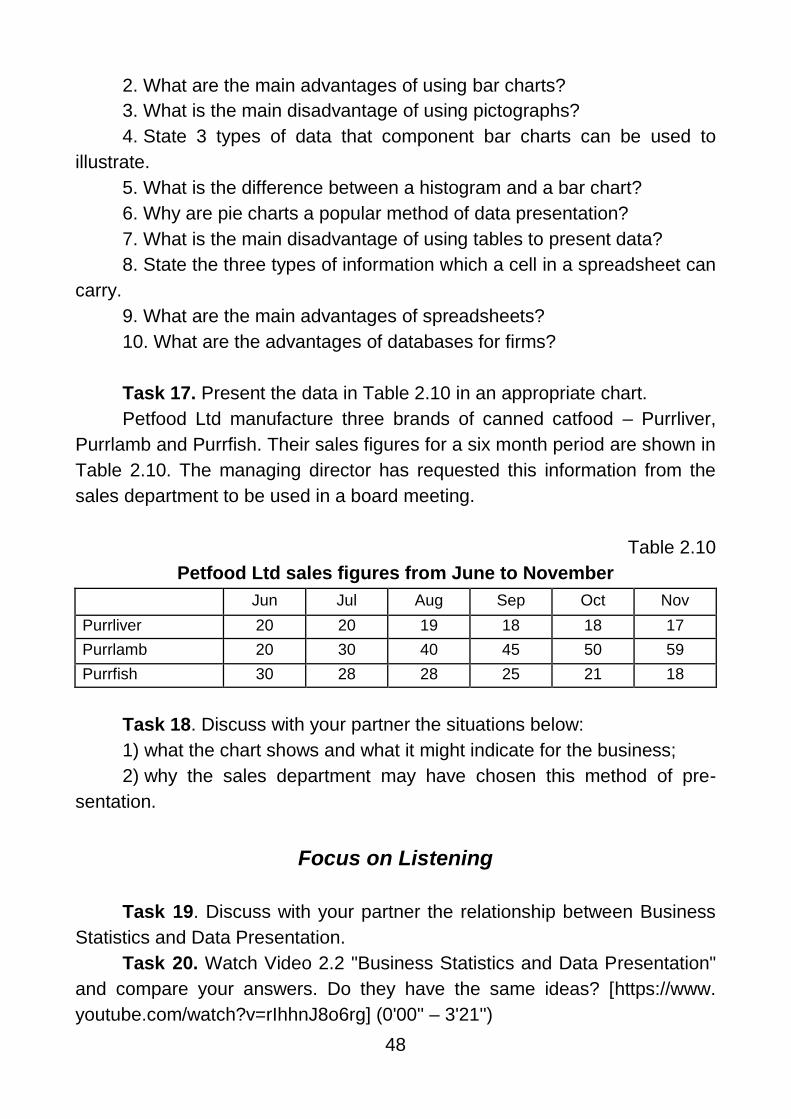
48
2. What are the main advantages of using bar charts?
3. What is the main disadvantage of using pictographs?
4. State 3 types of data that component bar charts can be used to
illustrate.
5. What is the difference between a histogram and a bar chart?
6. Why are pie charts a popular method of data presentation?
7. What is the main disadvantage of using tables to present data?
8. State the three types of information which a cell in a spreadsheet can
carry.
9. What are the main advantages of spreadsheets?
10. What are the advantages of databases for firms?
Task 17. Present the data in Table 2.10 in an appropriate chart.
Petfood Ltd manufacture three brands of canned catfood – Purrliver,
Purrlamb and Purrfish. Their sales figures for a six month period are shown in
Table 2.10. The managing director has requested this information from the
sales department to be used in a board meeting.
Table 2.10
Petfood Ltd sales figures from June to November
Jun Jul Aug Sep Oct Nov
Purrliver 20 20 19 18 18 17
Purrlamb 20 30 40 45 50 59
Purrfish 30 28 28 25 21 18
Task 18. Discuss with your partner the situations below:
1) what the chart shows and what it might indicate for the business;
2) why the sales department may have chosen this method of pre-
sentation.
Focus on Listening
Task 19. Discuss with your partner the relationship between Business
Statistics and Data Presentation.
Task 20. Watch Video 2.2 "Business Statistics and Data Presentation"
and compare your answers. Do they have the same ideas? [https://www.
youtube.com/watch?v=rIhhnJ8o6rg] (0'00'' – 3'21'')
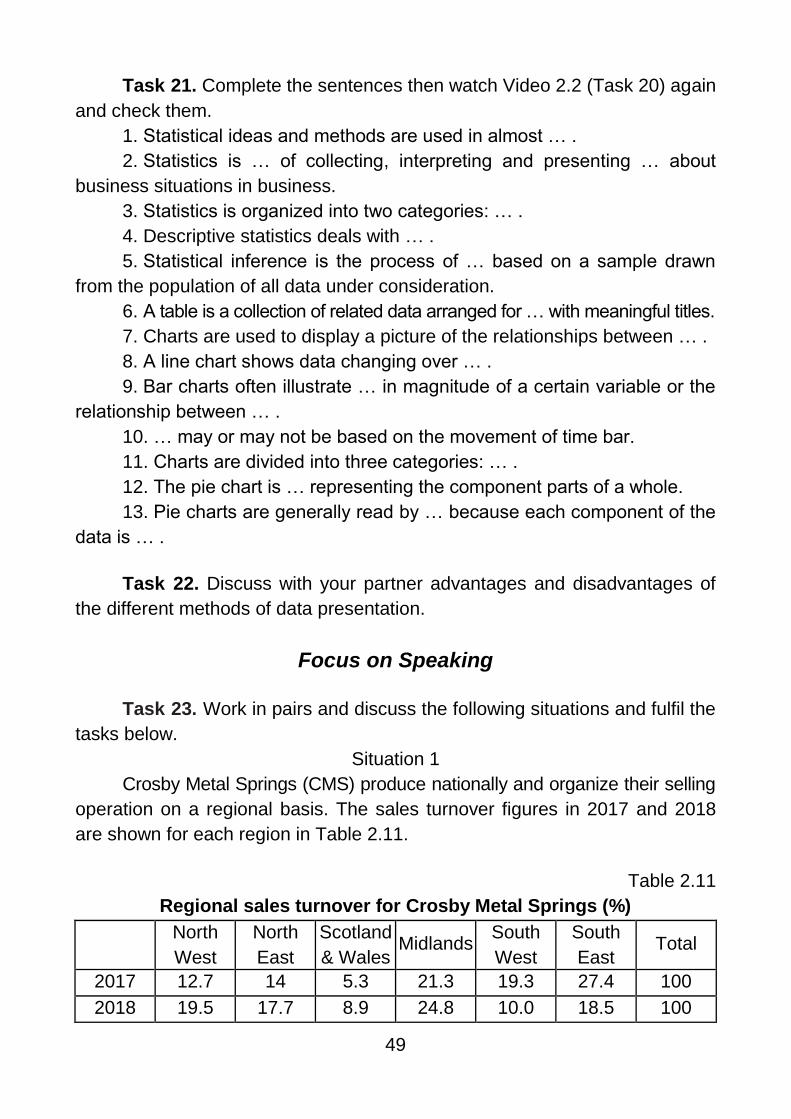
49
Task 21. Complete the sentences then watch Video 2.2 (Task 20) again
and check them.
1. Statistical ideas and methods are used in almost … .
2. Statistics is … of collecting, interpreting and presenting … about
business situations in business.
3. Statistics is organized into two categories: … .
4. Descriptive statistics deals with … .
5. Statistical inference is the process of … based on a sample drawn
from the population of all data under consideration.
6. A table is a collection of related data arranged for … with meaningful titles.
7. Charts are used to display a picture of the relationships between … .
8. A line chart shows data changing over … .
9. Bar charts often illustrate … in magnitude of a certain variable or the
relationship between … .
10. … may or may not be based on the movement of time bar.
11. Charts are divided into three categories: … .
12. The pie chart is … representing the component parts of a whole.
13. Pie charts are generally read by … because each component of the
data is … .
Task 22. Discuss with your partner advantages and disadvantages of
the different methods of data presentation.
Focus on Speaking
Task 23. Work in pairs and discuss the following situations and fulfil the
tasks below.
Situation 1
Crosby Metal Springs (CMS) produce nationally and organize their selling
operation on a regional basis. The sales turnover figures in 2017 and 2018
are shown for each region in Table 2.11.
Table 2.11
Regional sales turnover for Crosby Metal Springs (%)
North
West
North
East
Scotland
& Wales Midlands
South
West
South
East Total
2017 12.7 14 5.3 21.3 19.3 27.4 100
2018 19.5 17.7 8.9 24.8 10.0 18.5 100
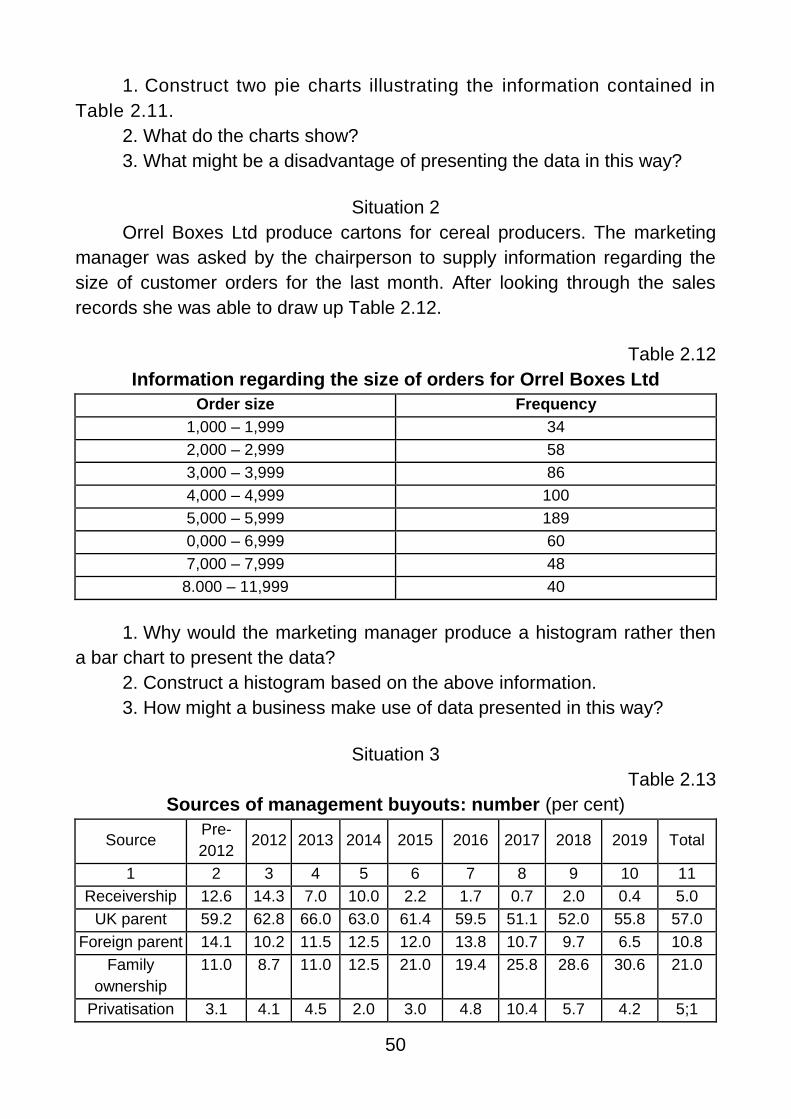
50
1. Construct two pie charts illustrating the information contained in
Table 2.11.
2. What do the charts show?
3. What might be a disadvantage of presenting the data in this way?
Situation 2
Orrel Boxes Ltd produce cartons for cereal producers. The marketing
manager was asked by the chairperson to supply information regarding the
size of customer orders for the last month. After looking through the sales
records she was able to draw up Table 2.12.
Table 2.12
Information regarding the size of orders for Orrel Boxes Ltd Order size Frequency
1,000 – 1,999 34
2,000 – 2,999 58
3,000 – 3,999 86
4,000 – 4,999 100
5,000 – 5,999 189
0,000 – 6,999 60
7,000 – 7,999 48
8.000 – 11,999 40
1. Why would the marketing manager produce a histogram rather then
a bar chart to present the data?
2. Construct a histogram based on the above information.
3. How might a business make use of data presented in this way?
Situation 3
Table 2.13
Sources of management buyouts: number (per cent)
Source Pre-
2012 2012 2013 2014 2015 2016 2017 2018 2019 Total
1 2 3 4 5 6 7 8 9 10 11
Receivership 12.6 14.3 7.0 10.0 2.2 1.7 0.7 2.0 0.4 5.0
UK parent 59.2 62.8 66.0 63.0 61.4 59.5 51.1 52.0 55.8 57.0
Foreign parent 14.1 10.2 11.5 12.5 12.0 13.8 10.7 9.7 6.5 10.8
Family
ownership
11.0 8.7 11.0 12.5 21.0 19.4 25.8 28.6 30.6 21.0
Privatisation 3.1 4.1 4.5 2.0 3.0 4.8 10.4 5.7 4.2 5;1
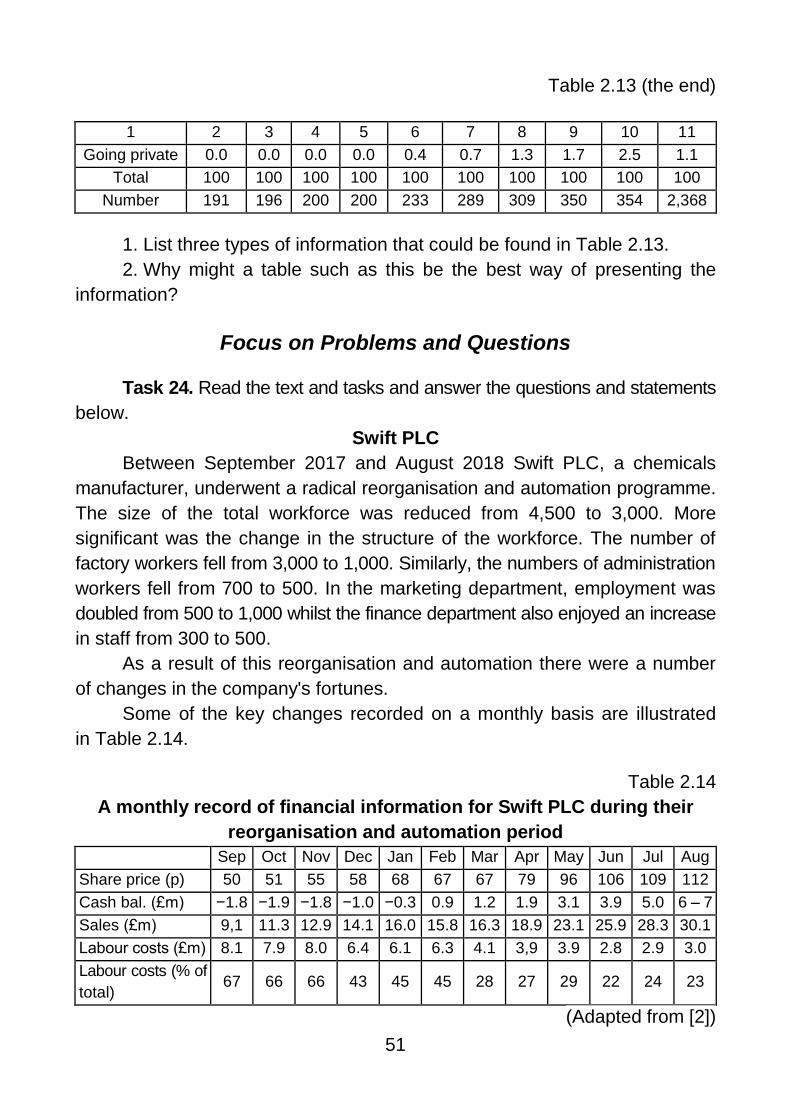
51
Table 2.13 (the end)
1 2 3 4 5 6 7 8 9 10 11
Going private 0.0 0.0 0.0 0.0 0.4 0.7 1.3 1.7 2.5 1.1
Total 100 100 100 100 100 100 100 100 100 100
Number 191 196 200 200 233 289 309 350 354 2,368
1. List three types of information that could be found in Table 2.13.
2. Why might a table such as this be the best way of presenting the
information?
Focus on Problems and Questions
Task 24. Read the text and tasks and answer the questions and statements
below.
Swift PLC
Between September 2017 and August 2018 Swift PLC, a chemicals
manufacturer, underwent a radical reorganisation and automation programme.
The size of the total workforce was reduced from 4,500 to 3,000. More
significant was the change in the structure of the workforce. The number of
factory workers fell from 3,000 to 1,000. Similarly, the numbers of administration
workers fell from 700 to 500. In the marketing department, employment was
doubled from 500 to 1,000 whilst the finance department also enjoyed an increase
in staff from 300 to 500.
As a result of this reorganisation and automation there were a number
of changes in the company's fortunes.
Some of the key changes recorded on a monthly basis are illustrated
in Table 2.14.
Table 2.14
A monthly record of financial information for Swift PLC during their
reorganisation and automation period
Sep Oct Nov Dec Jan Feb Mar Apr May Jun Jul Aug
Share price (p) 50 51 55 58 68 67 67 79 96 106 109 112
Cash bal. (£m) −1.8 −1.9 −1.8 −1.0 −0.3 0.9 1.2 1.9 3.1 3.9 5.0 6 – 7
Sales (£m) 9,1 11.3 12.9 14.1 16.0 15.8 16.3 18.9 23.1 25.9 28.3 30.1
Labour costs (£m) 8.1 7.9 8.0 6.4 6.1 6.3 4.1 3,9 3.9 2.8 2.9 3.0
Labour costs (% of
total) 67 66 66 43 45 45 28 27 29 22 24 23
(Adapted from [2])

52
1. Choose appropriate charts or graphs and illustrate the changes in each
of the categories of data.
2. State the reasons for your choice of the presentation method in each
case.
3. Using the method you have chosen, explain the changes taking place
and the implications for the company in the future.
4. What possible problem might there be in accurately reflecting the
changes taking place in the methods of presentation?
Focus on Self-Assessment
Task 2.1. Read the text below. Match choices (A – C) to (1 – 3). There
are two choices you do not need to use.
Information Requirements for Effective Decision Making
In order to make effective decisions about actions and strategies, the
manager is required to know where the company is now and where it wants
to be in the future. For example (Table 2.15):
Table 2.15
Examples of decisions at various levels
Where you are Where you want to be
1. …
Location of orders within a manufacturing
process Achieve the delivery date for the order
Location of service engineers out on call Make the next service call which is
required
2. …
The department's expenditure to date Work within the department's budget
Which orders have been delivered so far this
month
Calculate the delivery performance
this month
3. …
Annual demand for each product Determine overall capacity
Utilisation figures for each factory Set target utilisation figures
53
Information has a hierarchical structure in that higher level requirements
can be built up from lower levels. For example, annual total demand is an
aggregation of product demands which is an aggregation of individual orders.
(Adapted from [10])
A Tactical level
B Strategic level
C Operational level
Task 2.2. Read the text below. Match choices (A – I) to (4 – 10). There
are two choices you do not need to use.
Primary means first or firsthand. So think of primary sources as 4 … .
They're connected to 5 … or because they involve someone who participated
firsthand. For example, if you're researching the civil rights movement in
Minnesota, you 6 … related to Matthew Little, a Minneapolis civil rights activist
who went to the March on Washington in 1963. Little listened to Dr. Martin
Luther King, Jr., deliver his famous "I Have a Dream" speech. Little wrote
notes and letters about that day and someone took photos of Little at the
march.
Notes, letters, photos: these are all primary sources because they document
Little's firsthand experiences with the civil rights movement. In your research,
you might also 7 … Nellie Stone Johnson, which is also a primary source.
These organizations all got together and formed a coalition. Even though
the interview was recorded after the civil rights movement, it's still a primary
source because Johnson was involved, firsthand, in the movement. Other
examples of primary sources include as long as the item is from the time
you're researching or documents someone's firsthand experience, it's a primary
source. Something else to remember: it doesn't matter if you're 8 … . They
are both primary sources.
Secondary, of course, means after first. So secondary sources are 9 … .
Let's say you're still researching the civil rights movement and you're looking
for information about Lena Olive Smith, Minnesota's first female African American
lawyer. This article about Smith was written by a law professor in 2001, well
after the civil rights movement, so it's a secondary source. Here's a web page
about Smith. It was created in 2014, so it's also a secondary source. Secondary
sources include publications as long as they were written about a person or
historical event at a later time. Many secondary sources 10 … . Just look

54
at the footnotes or bibliography at the end of the secondary source to see
what primary sources were used.
(Adapted from [10])
A get their information from primary sources
B recorded after the civil rights movement
C a historical event because they were created during the time of the
event
D materials created after a historical event
E find this oral history interview with civil rights activist
F looking at the original primary source or a copy of the primary source
G materials that are first hand
H might find primary sources
I written about a person or historical event
Task 2.3. Read and complete the text below. For each of the empty
spaces (11 – 20) choose the correct answer (A, B, C or D).
Quality of Information
For decisions to be robust, the information needs to be as described
in Table 2.16.
Table 2.16
Useful characteristics of information
relevant 11 … knowledge, 12 … uncertainty,
usable for the intended purpose
e.g. ages of passengers, die-
tary preferences for package
holiday guests
accurate 13 … counting is correct weights are accurate, error
specified for estimates
complete 14 … all of the relevant key aspects nothing missing from a record
reliable
data collected by 15 … and consistent
means, based on 16 …, amenable to
cross-checking
e.g. in customer satisfaction
surveys
timely 17 … in time for the 18 … to be
effective hourly, daily, weekly, etc.
communicated
to the right person
in the hierarchy of decision making
19 …
goes to the most appropriate
person
55
Overall the information must be 20 … for the purpose for which it is
intended. In this way it can assist in informing the best possible decision at
the correct level within the organization.
11 A increases B access C hike D merger
12 A bankrupt B expand C reduces D ruin
13 A appraisal B length C measurement D range
14 A comprehend B seat C embrace D contains
15 A appropriate B belonging C convenient D good
16 A affirmation B evidence C declaration D cue
17 A do B organize C originated D produced
18 A decision B agreement C accord D selection
19 A plain B levels C floor D surface
20 A match B combined C fit D meet
Task 2.4. Read the text below. For each of the empty spaces (21 – 31)
choose the correct answer (A, B, C or D).
Let's 21 … your knowledge. Here's a photocopy of the Minneapolis
Spokesman newspaper from April 1968, soon after the assassination of
Dr. Martin Luther King, Jr. Is this a primary or secondary source? It's a primary
source because the newspaper 22 … from the time of the assassination.
Even though it's a photocopy and not the original paper itself, it's still a primary
source. Here's a book about the civil rights movement, written by a history
professor and published in 1990. Is it a primary or secondary source? It's
a secondary source, because it 23 … after the civil rights movement by
someone who 24 … not a firsthand participant. This is a book of letters
written by Jackie Robinson, who 25 … the color barrier in Major League
Baseball. It 26 … in 2007. Is it a primary or secondary source? It's a primary
source. Even though it was published in 2007, it 27 … copies of letters written
by Robinson, a firsthand participant in the civil rights movement. Now that
you know what primary and secondary sources are, 28 … fun researching.
And remember if you need help, 29 … a librarian. You can call, email or
ask questions in person. Visit www.mnhs.org/library for more information.
A content-free expression 30 … architectures, tools, databases, analytical tools,
applications, describes the basic architectural components.
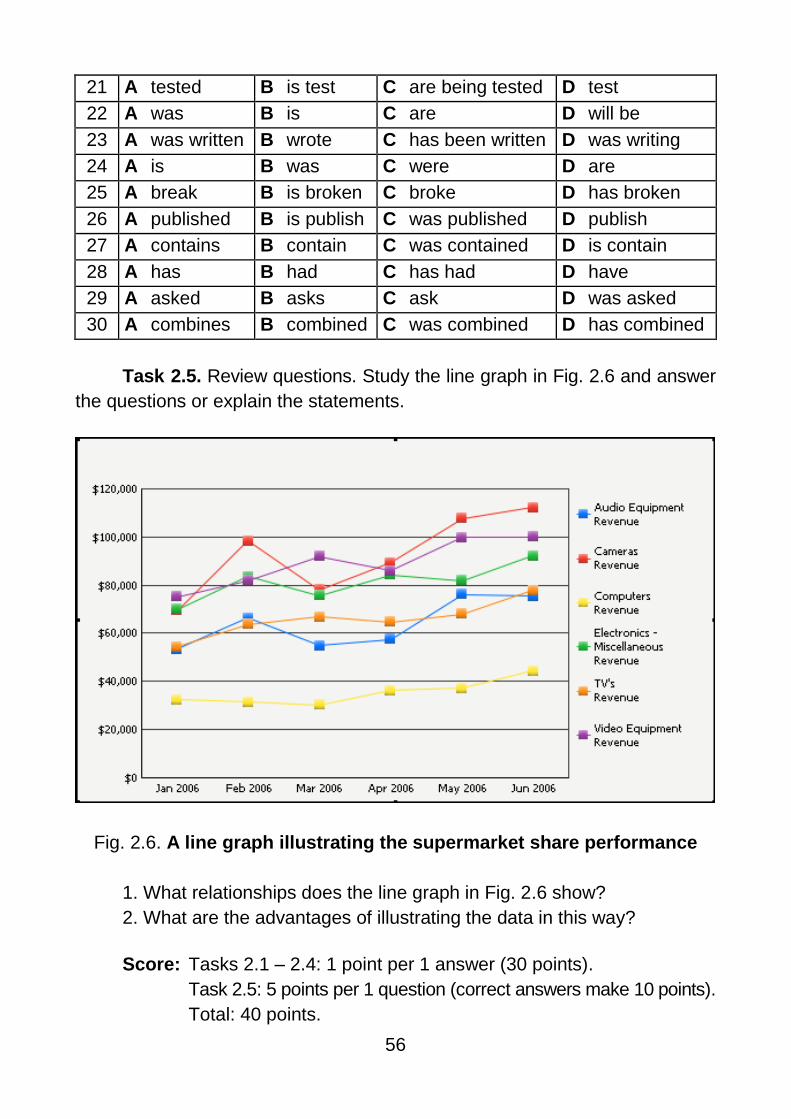
56
21 A tested B is test C are being tested D test
22 A was B is C are D will be
23 A was written B wrote C has been written D was writing
24 A is B was C were D are
25 A break B is broken C broke D has broken
26 A published B is publish C was published D publish
27 A contains B contain C was contained D is contain
28 A has B had C has had D have
29 A asked B asks C ask D was asked
30 A combines B combined C was combined D has combined
Task 2.5. Review questions. Study the line graph in Fig. 2.6 and answer
the questions or explain the statements.
Fig. 2.6. A line graph illustrating the supermarket share performance
1. What relationships does the line graph in Fig. 2.6 show?
2. What are the advantages of illustrating the data in this way?
Score: Tasks 2.1 – 2.4: 1 point per 1 answer (30 points).
Task 2.5: 5 points per 1 question (correct answers make 10 points).
Total: 40 points.

57
Unit 3. Decision Making
Task 1. Answer the questions.
1. What is decision making? Give five associations with this notion.
2. What functions of management do you know? Explain the main idea
of them.
3. How to make a choice?
Task 2. Read the text and compare your answers with the information
in the text below.
Running a business or any complex organization involves making choices.
Every day and every minute of the day, someone will be making a decision
that will affect some aspect of the business and its customers, suppliers, staff
or shareholders. Managers within businesses are charged with undertaking
a number of roles, many of which involve making decisions.
In general, decision making involves making a choice between a set of
optional courses of action according to a set of criteria or decision rules.
Functions of management are very important in businesses. The functions
of management can be grouped into specific areas: planning; organizing and
coordinating; leading and motivating; controlling processes.
Planning is the process of deciding in advance what is to be done and
how it is to be done. The process results in plans (predetermined courses of
action) that reflect organizational objectives and goals. This clearly involves
decision making.
Organizing and coordinating people, resources, materials in order to
implement the plan to get things done, will sometimes involve choosing
between different courses of action, different people or other resources to do
the job.
Leading and motivating people may involve making choices between
different styles of management and working to different timeframes.
Controlling the process ensures that things proceed according to the plan.
This is often achieved by comparing actual performance with a target and using
any difference to guide the adjustment of the operation and thus, to bring
about the desired performance. Where there is a choice of actions that can
be taken, then decisions will have to be made.

58
Task 3. Match the words with the definitions and then find and underline
them in the text (Task 4).
1) explore a) the process or an instance of spending or using up
2) recur b) in force, effect, or operation
3) inventory c) successful completion; accomplishment
4) expenditure d) to examine or investigate, esp. systematically
5) achievement e) to place or spread something over so as to protect
or conceal
6) operative f) characterized by or given to unnecessary repetition;
boring
7) cover g) a detailed list of articles, goods, property, etc.
8) repetitive h) to happen again, esp. at regular intervals
Task 4. Read the text and answer the questions.
1. What are many decisions based on?
2. At what levels are decisions made within the organization? (Give
examples.)
3. What kind of decisions are made by different levels of management?
(Give examples.)
4. What is a programmed decision?
5. What is a nonprogrammed decision?
Decision Making within the Organisation
Making the right (or at least a good) choice requires judgment but also
requires a basis on which to make the choice. Many decisions are based
on information which relates to the decision and which informs the decision.
A decision on how many items to order this week may well depend on how
many of the items were sold last week or the same week last year. The
choice of a person applying for a job will depend on their prior performance
and achievements. The information requirements for making decisions will be
explored in more detail later on.
Decisions are made at different levels within the organization: operational
or transactional decisions, made by junior managers or operatives, affect the
immediate running of the organization (or section).
Here problems of a recurring nature are dealt with. For example: weekly
staff schedule for a particular production line; weekly machine maintenance
schedule; daily raw material inventory check.
59
The information required is precise, usually not financial and usually related
to a policy prescribed by a higher level of management.
There are several categories of decisions made by different levels of man-
agement. Tactical decisions made by middle managers affect the medium-term
running of the organization (or department). This middle level of management
is concerned with decisions, which are made on a regular or periodic basis
(annually, quarterly, monthly). Tactical decisions will usually be short-range,
covering planning cycles of a year or so. These decisions primarily require
information of a historical (i.e. company records) or financial nature which is
generated within the organization. For example: the budget for personnel
recruitment in the next financial year; expenditure on advertising in the next
quarter; monthly sales targets for the next quarter.
Strategic decisions made by senior managers affect the longer-term
development of the organization. This is the executive or top level of man-
agement, which is concerned largely with issues of long-range planning. For
example: how large the organization should be in 10 years' time; how many
production lines there should be in 5 years' time; what kind of research and
development policy should be adopted; how the product range should be
developed over the next 20 years. For this type of decision making, man-
agement will require access to all internal information, as well as all relevant
external information. The information is used irregularly i.e. the decisions made
are not routine.
In addition to the information requirements of these management categories,
there will be other groups, concerned with an organization, which have yet
other information requirements. For example: employees in general require
information about wages, the firm's progress, developments in the provision
of staff facilities, etc.; shareholders require information about the company's
current and expected performance.
Some decisions are made routinely and others are more novel. Pro-
grammed decisions are routine and repetitive, with clear options and known
decision rules. This type of decision tends to be made at the more operational
levels within the organization.
Nonprogrammed decisions are more novel and unstructured, with complex
options and unclear decision rules (e.g. what to do when a machine develops
an unusual fault, how to deal best with a new competitor in the market place).
This type of decision tends to be made at a more tactical or strategic level.
(Adapted from [10])

60
Task 5. Describe the main idea of the text (Task 4).
Focus on Reading
Task 6. Translate these phrases into your native language.
1) rapid decline
2) solve a problem
3) growth direction
4) launch a new product
5) sales levels
6) consumer reactions
7) costs of production
8) dismiss an employee
9) submit ideas
10) investment project
11) commit themselves
12) obtain more information
13) commercial success
14) evaluate the outcome of their decisions
15) modify the course of action
Task 7. Some of the key terms given above are used in the text (Task 9).
Look through the text and underline them.
Task 8. Read the text below (Task 9) and choose the best heading to
each of its parts.
A Communication
B Evaluate the Results
C Evaluation of Ideas
D Gathering Information and Ideas
E Identifying Objectives
F Making a Decision
G Outcome
61
Task 9. Read the text carefully. Say whether the statements below are
true or false.
1. Decisions are made at all levels in a business and it is useful to have
a flexible process which can be followed by all involved.
2. The objective decision is quite simple and may be taken by the board
of directors.
3. Quite seldom the objective is to solve a problem.
4. People do not need information and ideas to make decisions.
5. Analysis can range from a guess on the basis of the information to
the use of complex decision making techniques.
6. One unpopular method of analysis is SWOT analysis. Decision makers
could list the strengths, weaknesses, opportunities and threats of each location
and then make a comparison.
7. Decision makers have to commit themselves to one course of action.
8. Instructions may be passed by the decision makers to someone else,
probably a manager, explaining what action should be taken.
9. Once a decision has been carried out, it will not take time before the
results are known.
10. Decision makers don't always need to evaluate the outcome of their
decisions.
The Decision Making Process
A business makes decisions in order to achieve objectives. For example,
it might decide to launch a new product in order to diversify. Decisions are
made at all levels in a business and it is useful to have a flexible process
which can be followed by all involved. Fig. 3.1 shows the stages in the decision
making process.
1. … . The objective of a business might be to halt a rapid decline in sales.
This decision is quite complex and may be taken by the board of directors.
Quite often the objective is to solve a problem. This might be planning for the
future or deciding on a growth direction for the company. Lower level decisions,
made by junior managers perhaps, often involve choosing between different
courses of action, such as the selection of 5 new skilled workers from a possible
125 applicants.
2. … . People need information and ideas to make decisions. The amount
and nature of the information needed will depend on the decision. For example,
the decision on whether or not to launch a new product might require some
information about possible sales levels and consumer reactions, costs of pro-
duction and reactions of competitors. It could take several months to collect
62
all this information. Other decisions could perhaps be based on the information
which the business already has. A decision on whether or not to dismiss
an employee might be made on the basis of information received from the
personnel department.
Where does the business get its ideas? It might set up a working party
to collect information and ideas from within the firm. The working party would
then produce a report or make a presentation to the decision makers. Alter-
natively, individuals or departments might submit ideas and information. Another
way of obtaining information and ideas is to hold discussions amongst staff
in the firm.
3. … . The next stage is to analyze these ideas on alternative courses
of action. Analysis can range from a guess on the basis of the information to
the use of complex decision making techniques.
For example, there are a number of techniques which can be used to
assess which investment project a firm should choose.
One popular method of analysis is SWOT analysis. For example, a firm
could use this analysis if it was deciding between two possible locations for
a plant. Decision makers could list the strengths, weaknesses, opportunities
and threats of each location and then make a comparison.
4. … . Next, the decision has to be made. This is the most important
stage in the process. Decision makers have to commit themselves to one
course of action. It is difficult to change the decision, so getting it right is vital!
For example, once production begins following the decision to launch a new
product, it is difficult for the firm to change its mind. If the product does not
sell, this can lead to a loss of money. Some decisions can be reversed. For
example, if the owner of a shop decides to close on Tuesday afternoons, but
then finds that the loss of sales is intolerable, the owner can easily reopen
again. Sometimes the decision makers feel that they cannot reach a decision.
They may have to obtain more information and complete the previous two
stages in the process again.
5. … . Once a decision has been made, personnel are informed and the
decision is carried out. Quite often the people making the decisions are not
those that carry them out. Instructions may be passed by the decision makers
to someone else, probably a manager, explaining what action should be taken.
For example, if the directors decide to begin selling their products in a new
country, instructions must be sent to the marketing manager. In smaller firms
decision makers are more likely to carry out their own decisions.
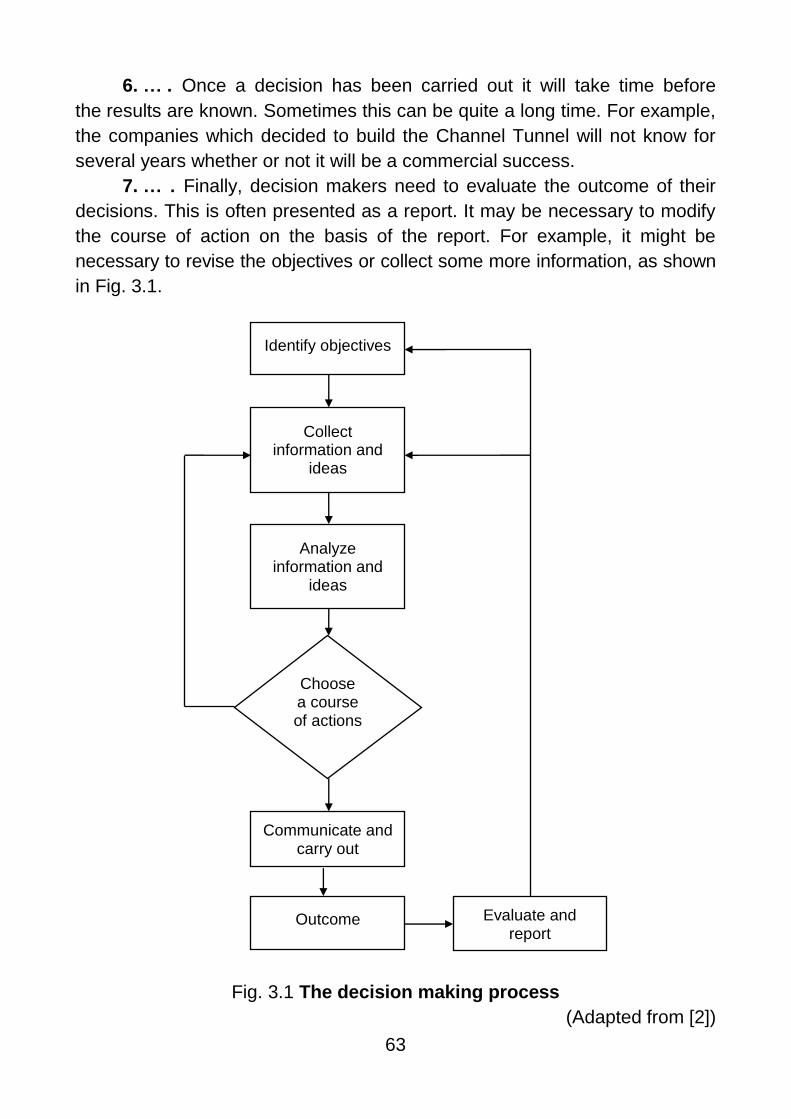
63
6. … . Once a decision has been carried out it will take time before
the results are known. Sometimes this can be quite a long time. For example,
the companies which decided to build the Channel Tunnel will not know for
several years whether or not it will be a commercial success.
7. … . Finally, decision makers need to evaluate the outcome of their
decisions. This is often presented as a report. It may be necessary to modify
the course of action on the basis of the report. For example, it might be
necessary to revise the objectives or collect some more information, as shown
in Fig. 3.1.
Fig. 3.1 The decision making process
(Adapted from [2])
Identify objectives
Collect information and
ideas
Analyze information and
ideas
Communicate and carry out
Outcome Evaluate and report
Choose a course of actions
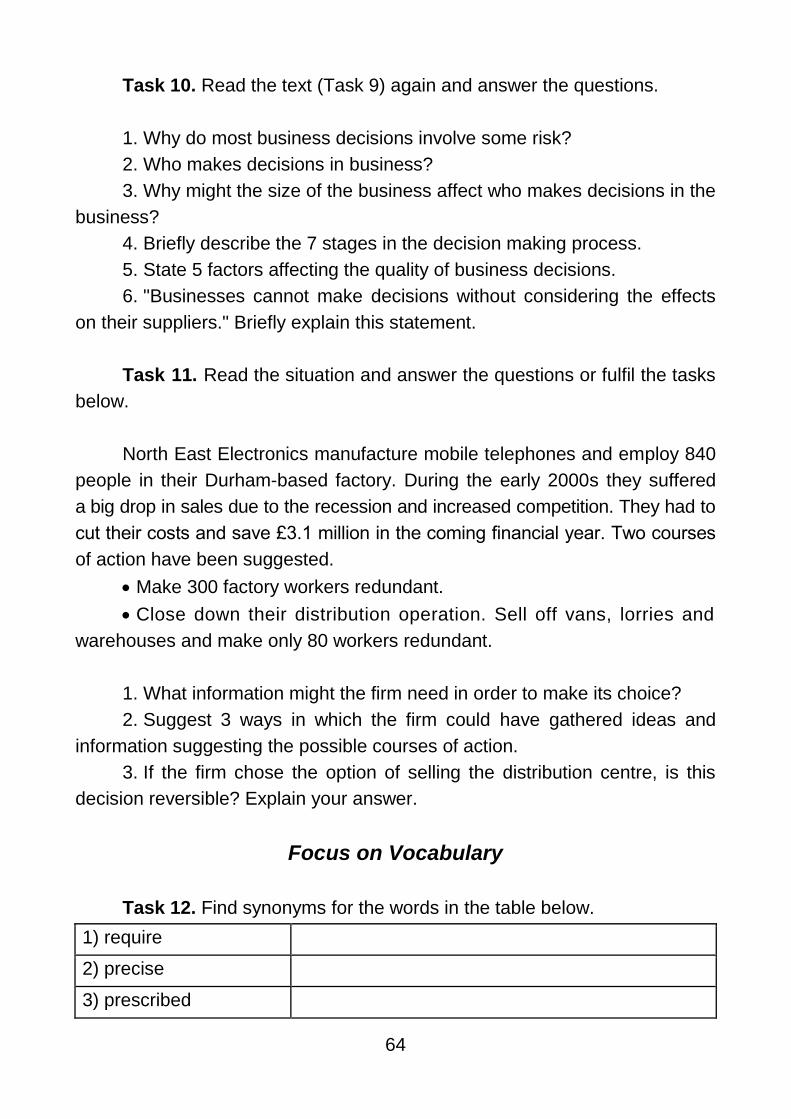
64
Task 10. Read the text (Task 9) again and answer the questions.
1. Why do most business decisions involve some risk?
2. Who makes decisions in business?
3. Why might the size of the business affect who makes decisions in the
business?
4. Briefly describe the 7 stages in the decision making process.
5. State 5 factors affecting the quality of business decisions.
6. "Businesses cannot make decisions without considering the effects
on their suppliers." Briefly explain this statement.
Task 11. Read the situation and answer the questions or fulfil the tasks
below.
North East Electronics manufacture mobile telephones and employ 840
people in their Durham-based factory. During the early 2000s they suffered
a big drop in sales due to the recession and increased competition. They had to
cut their costs and save £3.1 million in the coming financial year. Two courses
of action have been suggested.
Make 300 factory workers redundant.
Close down their distribution operation. Sell off vans, lorries and
warehouses and make only 80 workers redundant.
1. What information might the firm need in order to make its choice?
2. Suggest 3 ways in which the firm could have gathered ideas and
information suggesting the possible courses of action.
3. If the firm chose the option of selling the distribution centre, is this
decision reversible? Explain your answer.
Focus on Vocabulary
Task 12. Find synonyms for the words in the table below.
1) require
2) precise
3) prescribed
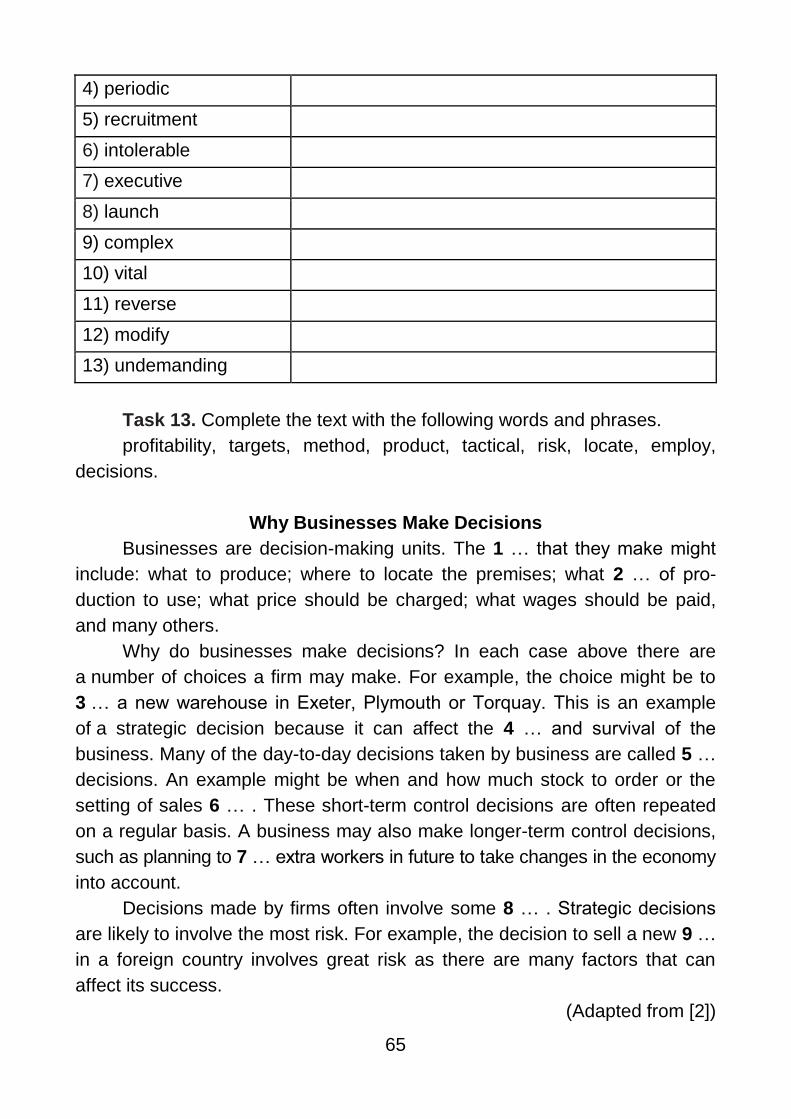
65
4) periodic
5) recruitment
6) intolerable
7) executive
8) launch
9) complex
10) vital
11) reverse
12) modify
13) undemanding
Task 13. Complete the text with the following words and phrases.
profitability, targets, method, product, tactical, risk, locate, employ,
decisions.
Why Businesses Make Decisions
Businesses are decision-making units. The 1 … that they make might
include: what to produce; where to locate the premises; what 2 … of pro-
duction to use; what price should be charged; what wages should be paid,
and many others.
Why do businesses make decisions? In each case above there are
a number of choices a firm may make. For example, the choice might be to
3 … a new warehouse in Exeter, Plymouth or Torquay. This is an example
of a strategic decision because it can affect the 4 … and survival of the
business. Many of the day-to-day decisions taken by business are called 5 …
decisions. An example might be when and how much stock to order or the
setting of sales 6 … . These short-term control decisions are often repeated
on a regular basis. A business may also make longer-term control decisions,
such as planning to 7 … extra workers in future to take changes in the economy
into account.
Decisions made by firms often involve some 8 … . Strategic decisions
are likely to involve the most risk. For example, the decision to sell a new 9 …
in a foreign country involves great risk as there are many factors that can
affect its success.
(Adapted from [2])
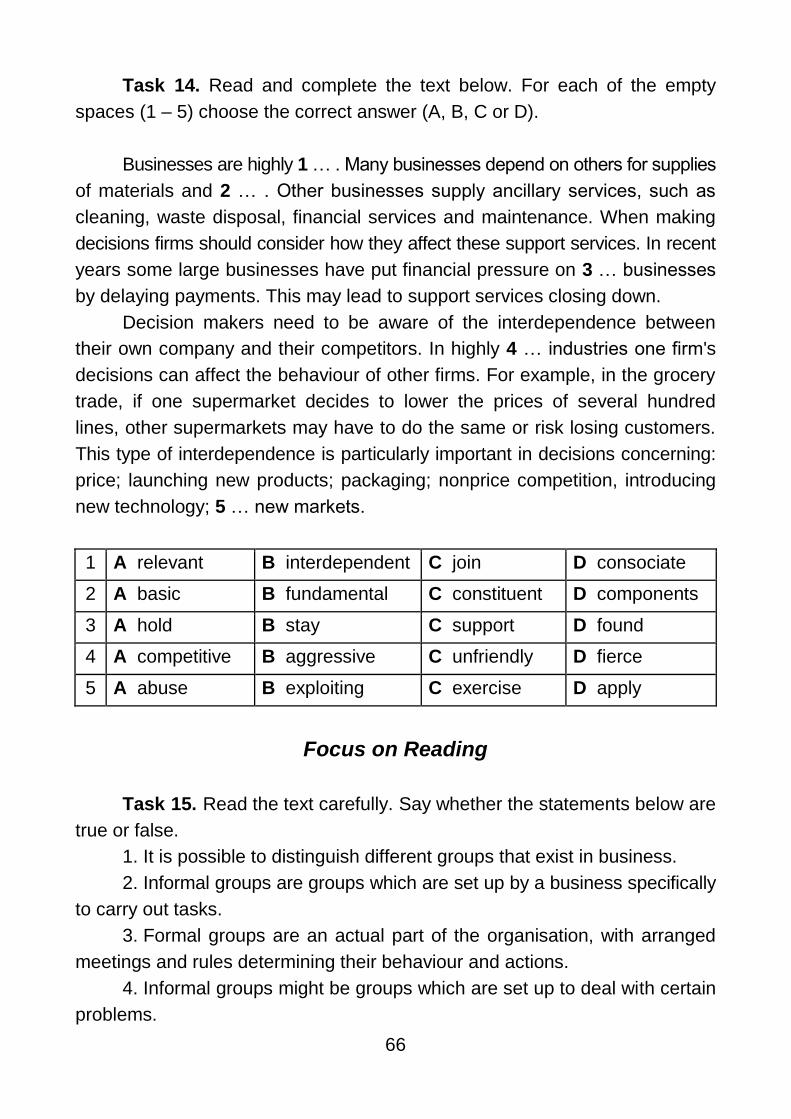
66
Task 14. Read and complete the text below. For each of the empty
spaces (1 – 5) choose the correct answer (A, B, C or D).
Businesses are highly 1 … . Many businesses depend on others for supplies
of materials and 2 … . Other businesses supply ancillary services, such as
cleaning, waste disposal, financial services and maintenance. When making
decisions firms should consider how they affect these support services. In recent
years some large businesses have put financial pressure on 3 … businesses
by delaying payments. This may lead to support services closing down.
Decision makers need to be aware of the interdependence between
their own company and their competitors. In highly 4 … industries one firm's
decisions can affect the behaviour of other firms. For example, in the grocery
trade, if one supermarket decides to lower the prices of several hundred
lines, other supermarkets may have to do the same or risk losing customers.
This type of interdependence is particularly important in decisions concerning:
price; launching new products; packaging; nonprice competition, introducing
new technology; 5 … new markets.
1 A relevant B interdependent C join D consociate
2 A basic B fundamental C constituent D components
3 A hold B stay C support D found
4 A competitive B aggressive C unfriendly D fierce
5 A abuse B exploiting C exercise D apply
Focus on Reading
Task 15. Read the text carefully. Say whether the statements below are
true or false.
1. It is possible to distinguish different groups that exist in business.
2. Informal groups are groups which are set up by a business specifically
to carry out tasks.
3. Formal groups are an actual part of the organisation, with arranged
meetings and rules determining their behaviour and actions.
4. Informal groups might be groups which are set up to deal with certain
problems.
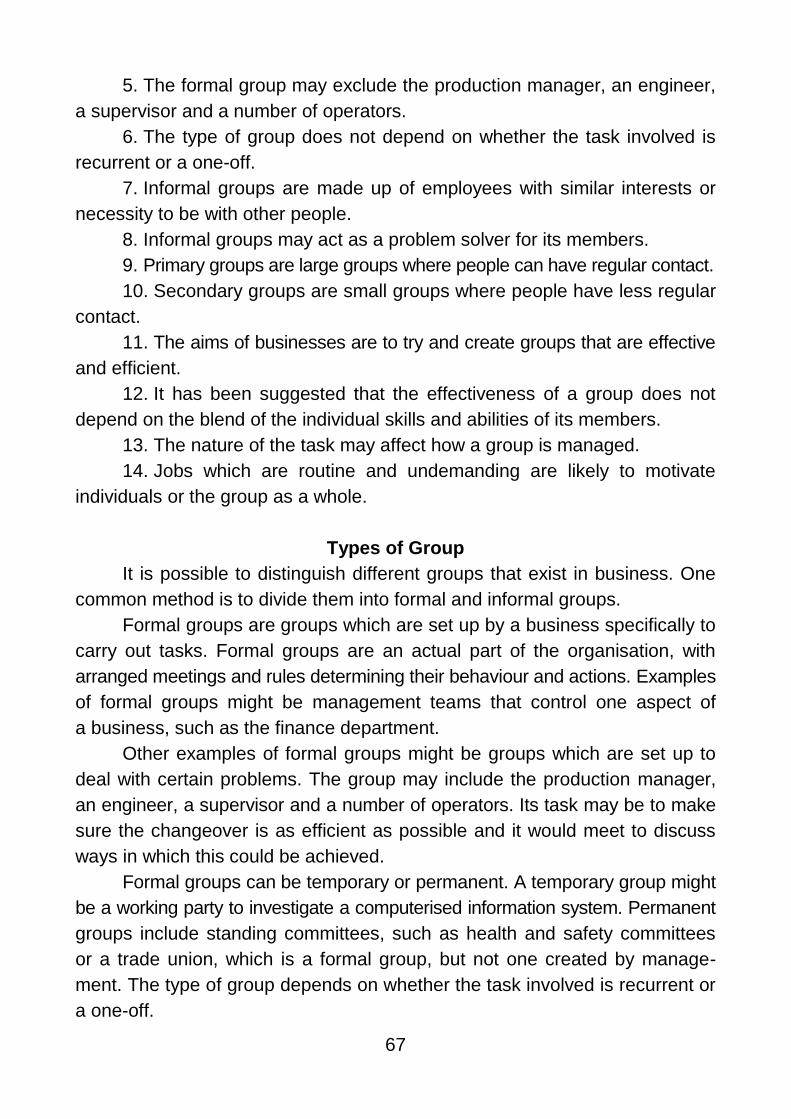
67
5. The formal group may exclude the production manager, an engineer,
a supervisor and a number of operators.
6. The type of group does not depend on whether the task involved is
recurrent or a one-off.
7. Informal groups are made up of employees with similar interests or
necessity to be with other people.
8. Informal groups may act as a problem solver for its members.
9. Primary groups are large groups where people can have regular contact.
10. Secondary groups are small groups where people have less regular
contact.
11. The aims of businesses are to try and create groups that are effective
and efficient.
12. It has been suggested that the effectiveness of a group does not
depend on the blend of the individual skills and abilities of its members.
13. The nature of the task may affect how a group is managed.
14. Jobs which are routine and undemanding are likely to motivate
individuals or the group as a whole.
Types of Group
It is possible to distinguish different groups that exist in business. One
common method is to divide them into formal and informal groups.
Formal groups are groups which are set up by a business specifically to
carry out tasks. Formal groups are an actual part of the organisation, with
arranged meetings and rules determining their behaviour and actions. Examples
of formal groups might be management teams that control one aspect of
a business, such as the finance department.
Other examples of formal groups might be groups which are set up to
deal with certain problems. The group may include the production manager,
an engineer, a supervisor and a number of operators. Its task may be to make
sure the changeover is as efficient as possible and it would meet to discuss
ways in which this could be achieved.
Formal groups can be temporary or permanent. A temporary group might
be a working party to investigate a computerised information system. Permanent
groups include standing committees, such as health and safety committees
or a trade union, which is a formal group, but not one created by manage-
ment. The type of group depends on whether the task involved is recurrent or
a one-off.
68
Informal groups are made up of employees with similar interests. They
are not a formal part of the business itself. They do not have any formal
"rules", although there are often unofficial norms which influence members'
behaviour. There are a number of reasons why informal groups exists. It is
argued that these groups meet the psychological needs of employees. The
need to be with other people. Status is determined by membership of various
groups. This will also influence the view people have of their personal value
and self-esteem. Groups offer a feeling of security and mutual support. The
group may act as a problem solver for its members.
The informal groups that develop will be determined, to a large extent,
by the physical layout required for work. Distance has a powerful influence on
who will interact with whom. Informal groups can have considerable influence
on group members and the norms and values that a group develops may
or may not support those of the organisation. It may appear that formal and
informal groups are separate. This is not the case. Groups that start off as
formal often develop powerful informal relations.
It is also possible to divide groups into primary and secondary groups.
Primary groups are small groups where people can have regular contact,
e.g. a small department or office, or a youth club. Secondary groups are large
groups where people have less regular contact, e.g. a large open-plan office
or a large meeting.
The aims of businesses are to try and create groups that are effective
and efficient. If the business can motivate the group to work harder in order
to achieve goals, the sense of pride in the group's own competence might
create job satisfaction. There are a number of factors that can help group
organisation and decision making.
The characteristics and goals of the individual members of the group
will help to determine the group's characteristics and goals. An individual is
likely to be influenced more strongly by a small group than by a large group.
In a large group the person may feel overwhelmed and, therefore, unable to
participate effectively in team decisions.
It has been suggested that the effectiveness of a group depends on the
blend of the individual skills and abilities of its members. A group might be
most effective if it contains: a person of originality and ideas; a "get-up-and-
go" person with considerable energy, enthusiasm and drive; a quiet, logical
thinker, who ponders carefully and criticises the ideas of others.
69
This is why groups set up to consider new products often draw members
from a number of different departments in the business. This means the group
will have a wide range of skills and abilities.
So a business might select people to ensure that they fill one or more of
the roles which a group lacks. This is not always possible. Most formal groups
within business are predetermined by who has the technical expertise to carry
out the task.
For a group to work efficiently the business must be aware of the roles
people prefer. These may become apparent through observation. People should
be given tasks which allow them to operate in their preferred roles. There should
be an understanding of which roles are missing that may cause inefficiency.
The nature of the task may affect how a group is managed. If a job must
be done urgently, it is often necessary to dictate how things should be done,
rather than to encourage participation in decision making. Jobs which are
routine and undemanding are unlikely to motivate individuals or the group as
a whole. If individuals want authoritarian leadership, they are also likely to
want clearly defined targets.
(Adapted from [2])
Task 16. Read the text (Task 15) again and answer the questions.
1. What is the difference between formal and informal groups?
2. How can one identify the formal and informal groups that the successful
candidate might belong to using information in the advertisement?
3. How might belonging to informal groups help the new employee when
settling into the job?
4. How might belonging to informal groups help the business in its relations
with the new employee?
5. What is the aim of primary and secondary groops?
Task 17. Read the text and make a list of advantages and disadvantages
of group decisions. Then discuss it with your partner.
To what extent are groups more effective in making decisions than
individuals? There are a number of advantages in groups making decisions
for a business and for the members themselves.
Groups can pool ideas and draw on a variety of expertise. This makes
them particularly good at finding mistakes. For example, in the design and
70
construction of nuclear reactors, a whole variety of groups working on safety
aspects are more likely to ensure that all safety measures are thought of and
solutions found to safety problems.
Groups can handle a great deal of information and involved tasks in
a shorter period of time than an individual would take. An example might be
the design and writing of a computerised information program.
Group members may support, motivate and help other members when
making decisions.
Groups provide a basis for accountability within a firm. They can also be
used as the basis for a bonus system to increase productivity.
Despite these advantages, there are sometimes problems in group
decision making.
Group decisions may take time. When a decision needs to be made
quickly, such as an investment decision on the Stock Exchange, an individual
may be more effective from a business point of view. There will be no debate,
which will delay any decision that is made.
Where one person is an obvious expert in the field, that person may
make a more accurate and effective decision, for example, a personnel man-
ager in deciding how best to train certain employees.
There could be conflicting views and personalities within groups. This
can lead to a lack of cohesion, with no shared aims or objectives. The result
is that the group becomes inefficient in carrying out a task.
There may be a possibility of "risky-shift" decision. Groups may make
riskier decisions than individuals would, due to too much group cohesion. For
example, a board of directors might decide as a group to take over a potentially
profitable, but inefficient, firm. An individual entrepreneur might have considered
this decision too risky to take.
(Adapted from [2])
Task 18. Answer the questions and fulfil the tasks. Then discuss the
answers with your partner.
1. Group behaviour is different from individual behaviour. To what extent
is this statement likely to be true in business?
2. State four common features that groups in business organisations have.
3. Why might a business set up a temporary formal group rather than
making it permanent?
4. Give four advantages for employees of informal group membership.
71
5. Give six characteristics of effective groups.
6. Briefly explain why optimal group size may be between 3 – 7 members.
7. What is likely to influence the size of a group?
8. Explain the difference between centralised and decentralised group
decision making.
9. What are the advantages to the business of group decision making?
10. In what circumstances might individual decision making be more
beneficial to a business?
11. What factors within a business might lead to intergroup conflict?
Focus on Vocabulary
Task 19. Complete the text with the following words and phrases:
earn, employee, differently, rules, pressure, norm, essential, behavior,
common, marketing consultancy, changes, individual.
Individuals in Groups at Work
Working with other people in groups is something that many employees
do in business. An employee in a 1 … business may be part of a team
developing TV adverts for a client, part of a group set up to think of ideas to
improve working methods and may meet with friends for lunch. Only in a small
number of cases will 2 … employees work on their own, as in the case of
a freelance journalist. Even an 3 … delivering goods on his own from a van
will interact with staff and management when he returns to the office or
factory.
Individuals may behave 4 … when working in a group than if they were
working on their own. For example, an employee on a building site might
want to work at a leisurely pace or find ways to avoid carrying out a task
immediately. Group 5 … could persuade or embarrass the employee into
working harder than he would have wished. The group may want to finish the
job early or 6 … any bonus that is available. In this case the employee's
behaviour has changed as a result of being a group member. He is behaving
in a way that conforms to the group 7 … . In other words, he is behaving in
a way that is "normal" for that group.
There is a certain amount of evidence to support the idea that individual
8 … is influenced by the group. The behaviour of the group influences all
members, e.g. if a decision is made to take industrial action.

72
Members of the group have some 9 … interests and objectives, e.g.
a production team may want to increase its level of overtime payments.
Members meet and discuss common interests, e.g. assembly line workers
might discuss the latest 10 … to working conditions.
There are 11 … or norms influencing members' behaviour, e.g. members
of the finance committee of a business are expected to report back to the
managing director after each meeting.
It could be argued that, given the emphasis on team work in many
modern organisations, it is 12 … for businesses to understand how people
work in groups. If employees in a group do not work "well" together, this may
reduce productivity and make decision making more difficult.
(Adapted from [2])
Task 20. Read the text (Task 19) and make a list of advantages and
disadvantages of individual work. Then discuss it with your partner.
Task 21. Read the text below. Match choices (A – I) to (1 – 7). There
are two choices you do not need to use.
Leadership
It is likely that a group will have a "leader" to control or guide it. Leader-
ship may be informal, in the sense that one person dominates a group because
of their personality, position or access to 8 … . Leaders can also be elected
or nominated by the group, such as chairperson.
Types of leaders can be classified as follows.
1. … . This involves one-way 9 … between the leader and others in the
group. The leader makes all the decisions and gives out 10 … , expecting
them to be obeyed by other group members without question. An example
might be a powerful head of a large business.
2. … . The leader makes all the decisions, but believes that other group
members need to be motivated to 11 … them before they do what she wants
them to. She therefore tries to explain her decisions in order to convince them
of her point of view, as a teacher or lecturer in a class might.
3. … . This involves discussion between the leader and the other group
members involved in making a decision, but the leader retains the right to
make the decision herself. By consulting with her group members before
73
making any decision, the leader will take into account their advice and feelings.
A council leader might have to 12 … in this way.
4. … . This is an approach where the leader makes a decision based on
13 … and agreement within the group. Group members with the greatest
knowledge of a problem will have greater influence over the decision. A trade
union representative is likely to adopt this style. Skills used in groups. For
individuals to work well in groups, they need to have a variety of skills. These
skills can be categorised into three general areas.
5. … . Individuals need to communicate their 14 … effectively, informing
group members of their thoughts, views and motives. They also need to be
able to initiate ideas and evaluate both their own contribution and those of
others.
6. … . Individuals need to support other group members so that every-
one is 15 … . This is more likely if individuals share their ideas and listen to
others. They should also be able to 16 … and consult, so that everyone feels
part of the group's activities.
7. … . Group members need to gather information, materials and ideas,
and share them with other group members. They need to show the skills of
perseverance and reliability especially if the group is 17 … with a problem.
(Adapted from [2])
A Consultative
B Production
C Optimal
D Co-operation
E Autocratic
F Individual
G Democratic
H Contribution
I Persuasive
Task 22. Read and complete the text 21. For each of the empty spaces
(8 – 17) choose the correct answer (A, B, C or D).
8 A information B advice C materials D instructions
9 A announcing B contact C communication D connection
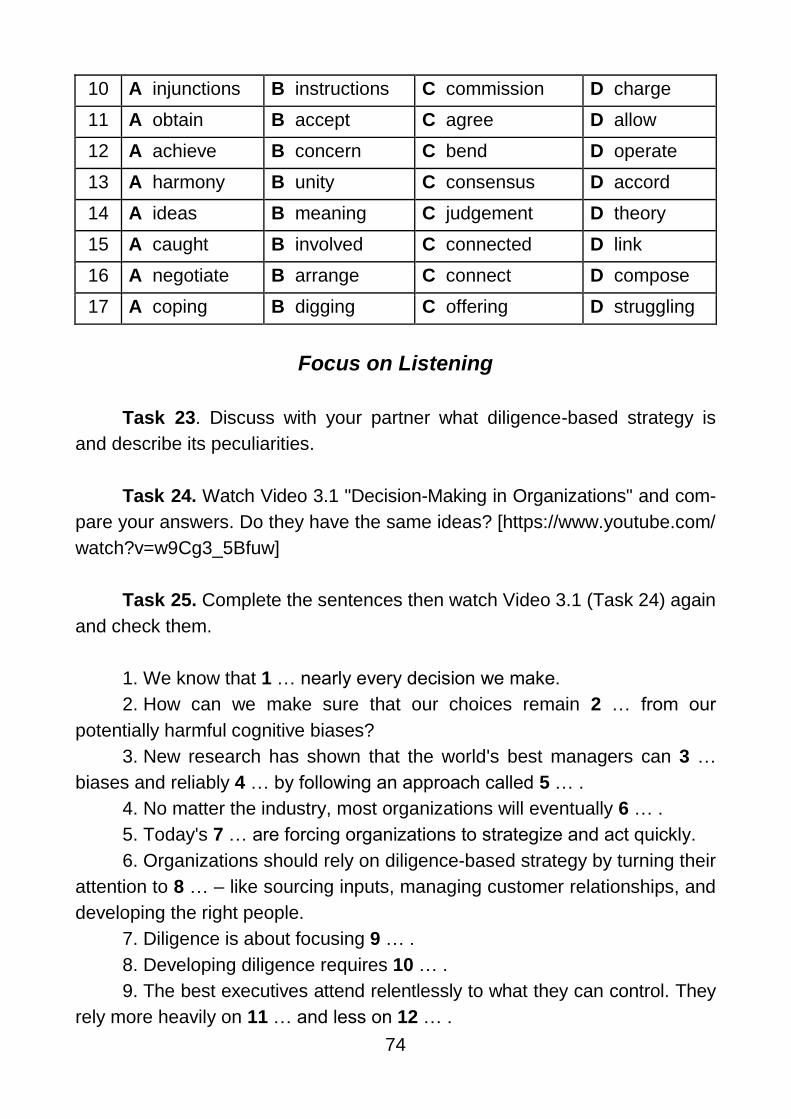
74
10 A injunctions B instructions C commission D charge
11 A obtain B accept C agree D allow
12 A achieve B concern C bend D operate
13 A harmony B unity C consensus D accord
14 A ideas B meaning C judgement D theory
15 A caught B involved C connected D link
16 A negotiate B arrange C connect D compose
17 A coping B digging C offering D struggling
Focus on Listening
Task 23. Discuss with your partner what diligence-based strategy is
and describe its peculiarities.
Task 24. Watch Video 3.1 "Decision-Making in Organizations" and com-
pare your answers. Do they have the same ideas? [https://www.youtube.com/
watch?v=w9Cg3_5Bfuw]
Task 25. Complete the sentences then watch Video 3.1 (Task 24) again
and check them.
1. We know that 1 … nearly every decision we make.
2. How can we make sure that our choices remain 2 … from our
potentially harmful cognitive biases?
3. New research has shown that the world's best managers can 3 …
biases and reliably 4 … by following an approach called 5 … .
4. No matter the industry, most organizations will eventually 6 … .
5. Today's 7 … are forcing organizations to strategize and act quickly.
6. Organizations should rely on diligence-based strategy by turning their
attention to 8 … – like sourcing inputs, managing customer relationships, and
developing the right people.
7. Diligence is about focusing 9 … .
8. Developing diligence requires 10 … .
9. The best executives attend relentlessly to what they can control. They
rely more heavily on 11 … and less on 12 … .
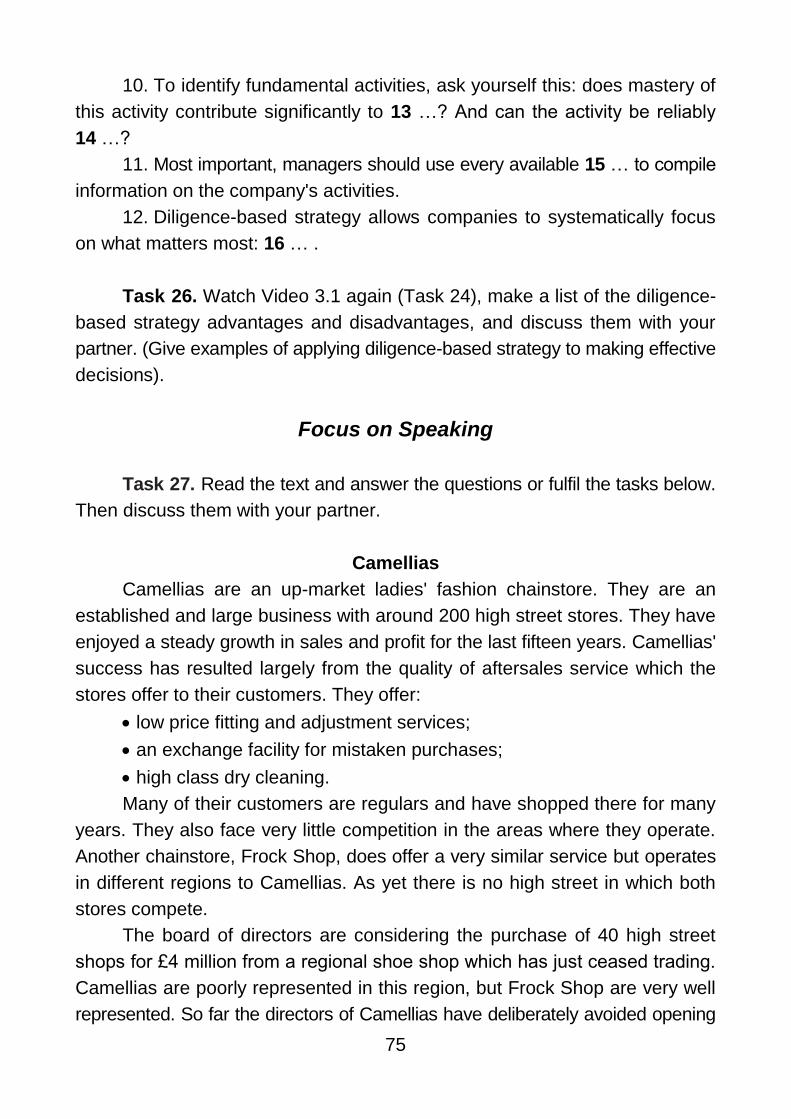
75
10. To identify fundamental activities, ask yourself this: does mastery of
this activity contribute significantly to 13 …? And can the activity be reliably
14 …?
11. Most important, managers should use every available 15 … to compile
information on the company's activities.
12. Diligence-based strategy allows companies to systematically focus
on what matters most: 16 … .
Task 26. Watch Video 3.1 again (Task 24), make a list of the diligence-
based strategy advantages and disadvantages, and discuss them with your
partner. (Give examples of applying diligence-based strategy to making effective
decisions).
Focus on Speaking
Task 27. Read the text and answer the questions or fulfil the tasks below.
Then discuss them with your partner.
Camellias
Camellias are an up-market ladies' fashion chainstore. They are an
established and large business with around 200 high street stores. They have
enjoyed a steady growth in sales and profit for the last fifteen years. Camellias'
success has resulted largely from the quality of aftersales service which the
stores offer to their customers. They offer:
low price fitting and adjustment services;
an exchange facility for mistaken purchases;
high class dry cleaning.
Many of their customers are regulars and have shopped there for many
years. They also face very little competition in the areas where they operate.
Another chainstore, Frock Shop, does offer a very similar service but operates
in different regions to Camellias. As yet there is no high street in which both
stores compete.
The board of directors are considering the purchase of 40 high street
shops for £4 million from a regional shoe shop which has just ceased trading.
Camellias are poorly represented in this region, but Frock Shop are very well
represented. So far the directors of Camellias have deliberately avoided opening
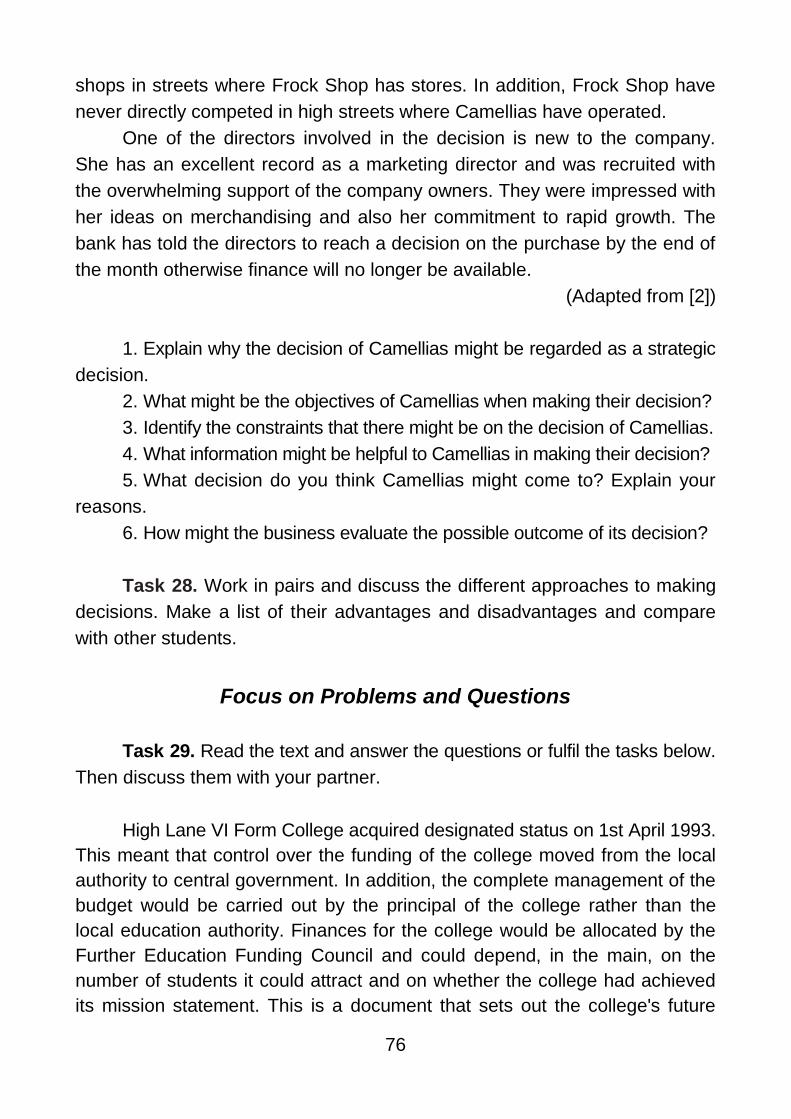
76
shops in streets where Frock Shop has stores. In addition, Frock Shop have
never directly competed in high streets where Camellias have operated.
One of the directors involved in the decision is new to the company.
She has an excellent record as a marketing director and was recruited with
the overwhelming support of the company owners. They were impressed with
her ideas on merchandising and also her commitment to rapid growth. The
bank has told the directors to reach a decision on the purchase by the end of
the month otherwise finance will no longer be available.
(Adapted from [2])
1. Explain why the decision of Camellias might be regarded as a strategic
decision.
2. What might be the objectives of Camellias when making their decision?
3. Identify the constraints that there might be on the decision of Camellias.
4. What information might be helpful to Camellias in making their decision?
5. What decision do you think Camellias might come to? Explain your
reasons.
6. How might the business evaluate the possible outcome of its decision?
Task 28. Work in pairs and discuss the different approaches to making
decisions. Make a list of their advantages and disadvantages and compare
with other students.
Focus on Problems and Questions
Task 29. Read the text and answer the questions or fulfil the tasks below.
Then discuss them with your partner.
High Lane VI Form College acquired designated status on 1st April 1993.
This meant that control over the funding of the college moved from the local
authority to central government. In addition, the complete management of the
budget would be carried out by the principal of the college rather than the
local education authority. Finances for the college would be allocated by the
Further Education Funding Council and could depend, in the main, on the
number of students it could attract and on whether the college had achieved
its mission statement. This is a document that sets out the college's future

77
goals and objectives in terms of curriculum development and delivery and the
pastoral programme for student guidance and support.
The principal and governors of the college decided to restructure in order
to meet the challenge of the future. In the past the structure had four levels –
the senior management team (the principal and two vice-principals), senior
tutors (responsible for the pastoral programme), heads of departments and
main scale teachers. It was recognised that the senior management team
needed to be expanded. Senior tutors were given extra responsibilities and made
part of the senior management team. In addition a new team of curriculum
leaders (CLs) was created. The team was made up of heads of departments
in the different curriculum areas, such as the social sciences and sciences
etc. and was responsible for curriculum development and delivery. Much of the
success of the college would depend on how well this group worked together.
The group certainly had a variety of personalities in it – from those
with new, innovative ideas to those more concerned with administration and
day-to-day problems. The group met formally once a fortnight to discuss issues
concerning a quality curriculum. It became apparent, however, that the meetings
rarely achieved concrete suggestions for future action. The meetings seemed
to be used as "talking shops" for curriculum leaders to air grievances about
the happenings of the week.
Some of the curriculum leaders were also part of an informal group of
friends who would socialise at lunch times and after college. It was often at
these informal gatherings/meetings that the real issues were raised and ideas
discussed. Other curriculum leaders who were not at such gatherings would
usually have any important issues raised communicated to them through the
"grapevine".
The informal meetings became a focal point for CLs to attack the lack of
focus in the official meetings and also the fact that their ideas were very rarely
accepted by senior management. They felt that senior management was made
up of individuals who had caused a decline in the number of students by their
inaction over the last five years. Their main complaint, however, was that
although they had been assured by the principal that they would be the ones
who would make decisions on curriculum matters, the senior management
team would often intervene and veto their proposals. For example, CLs
suggested that GNVQs (general national vocational qualifications) should be
more fully developed in the college to attract students that had normally gone
to the local FE colleges.

78
This idea was rejected by the senior management team as not fitting
into the academic tradition of the college. Joan, the CL for Economics and
Business, felt exasperated by this decision. She said: "CLs were meant to be
part of the management of the college with responsibilities for curriculum
development and delivery. We meet formally and informally, communicating
in a variety of ways to each other, trying to advance a common view on cur-
riculum development. But at times we just don't seem to have the authority to
make things happen. I just don't know what we can do."
(Adapted from [2])
1. What new formal groups did the Principal and Governors set up in
April 1993?
2. How did communication take place in formal and informal groups at
High Lane?
3. Comment on the likely effectiveness of formal groups, informal groups
at High Lane.
4. What problems might High Lane face as a result of the way group
decision making is organised?
5. Suggest two methods High Lane management could have used to
solve the problems suggested in your answer to question 4.
Focus on Self-Assessment
Task 3.1. Read the texts below. Match choices (A – G) to (1 – 5). There
are two choices you do not need to use.
The Quality of Decisions
If the right decisions are made, the business will benefit. The quality of
decisions depends on a number of factors.
1. … . If people are trained, their performance is likely to be better.
The people making important decisions in a business should receive training.
Courses are offered by business schools and other educational institutions
which concentrate on decision making.
2. … . Decision making will be improved if there is access to information.
For example, if a firm is thinking of a price increase, the more information it
has on the reactions of customers, the more likely it is to decide whether this
79
is the right course of action. Information technology in business has helped
decision makers a great deal. They are able to store more information, retrieve
it instantly and change it into a form which is more useful to them.
Inadequate and inaccurate information can lead to the wrong decision
being made and may cause serious problems. For example, when an insurance
company is setting premiums for motor insurance, if the estimate of the cost
of repairing cars is too low, then premiums will be set too low.
3. … . The ability to use decision making techniques will help accurate
decisions to be made. For example, one technique used to evaluate the likely
returns from choosing a particular course of action is the use of decision trees.
4. … . Some decisions involve considerable risk, such as the launching
of a new product. It is argued that UK managers are too cautious in their
approach to decision making. This is because they prefer to choose courses
of action which carry the lowest risk, and avoid taking riskier courses of action
which might result in higher profits.
5. … . Most decisions are made by people. Different people are likely to
make different decisions. How do people differ?
The level of experience might be different. More experienced decision
makers will often, but not always, make more accurate decisions.
The attitude to risk may differ. Cautious decision makers will choose dif-
ferent courses of action to risk takers'.
People have different capabilities. Those who are skilled at decision
making will enjoy better results than those whose judgements are poor.
Self-interest may affect the course of action chosen. For example, man-
agement and trade unions are likely to reach different conclusions when setting
wage levels for the workforce.
People often have different perceptions. This may influence the decisions
they make. For example, two people on an interview panel for a new recruit
may have different views of an interviewee's performance.
(Adapted from [2])
A Leaderships
B Human Element
C Decision Making
D Training
E Quantity and Quality of Information
F Ability to Use Decision-Making Techniques
G Risk
80
Task 3.2. Read the text below. Match choices (A – I) to (6 – 12). There
are two choices you do not need to use.
Communication
Communication in groups can influence how group decisions are made.
A distinction is often made between two types of group.
Centralized groups are groups where 6 … via a central member.
Decentralized groups are groups where every member can 7 … .
Communication in groups can take place in a number of ways. The wheel. This is where 8 … can communicate with all the other members,
they, on the other hand, can only communicate with him or her. If they wish to
communicate to other members they can only do so through the same central
person. This might be the case in a formal meeting.
The chain. Information is 9 … reaches the last person in the group. Any
individual only ever communicates with one other person. This might be the
case in a police operation, for example.
The circle. Communication is circular, in other words, messages pass
between certain people, who 10 … , such as in a large office.
The all-channel. Every member of the group can communicate directly
with every other member, as in an open discussion on where an "awards"
evening should be held.
The degree of centrality is highest in the wheel and is less 11 … . The
all-channel has no centre; decisions are made by reaching an agreement. The
degree of centralization can 12 … , but this also depends on the complexity of
the task. When the task is simple, e.g. deciding on the recruitment policy for
a particular job, centralized groups like the wheel are faster and make fewer errors.
When the task is more complicated, e.g. organizing and putting into practice
a recruitment policy for a particular job, decentralized groups maybe more suitable.
(Adapted from [2])
A a person at the centre of the group
B individuals can only communicate with other group members
C pass it on to others
D an open discussion
E passed from one individual to the next before it
F communicate directly with every other member
G communicate to other members
H in the chain and circle
I affect the group's efficiency
81
Task 3.3. Read and complete the text below. For each of the empty
spaces (13 – 22) choose the correct answer (A, B, C or D).
Constraints on Decision Making
Businesses cannot make decisions with complete freedom. In many
situations there are factors which hinder, limit or restrict particular courses of
action. These 13 … may make the decision easier because they eliminate
some courses of action. For example, what if a business is deciding to buy
a new computer, has £900 available, and is faced with a choice of: Amstrad
£600, Nimbus £1,000, Texas £900, IBM £1,200?
The firm can only buy the Amstrad or the Texas given the money it has
available. It is left with a simpler choice and fewer 14 … to choose from.
However, although the money constraint has made the decision easier, it may
also have prevented the business from buying the most suitable computer
(perhaps the IBM) for its needs.
Internal constraints. These may result from the 15 … of the business
itself.
Availability of finance. Decision makers are often 16 … from choosing
certain courses of action because the business cannot afford them.
Existing company policy. For example, to control the wage bill, a firm's
policy may be to restrict overtime to a maximum of 10 hours per week.
The production manager may want to 17 … workers more overtime to reach
a production target. However, she is not able to do so because of the firm's
overtime policy.
People's behaviour. Decisions may be limited by people's ability. For
example, a manual worker is unlikely to be able to run a department if the
manager is absent. People are also 18 … by their attitudes. For example,
a company may wish to move three people into one office who work in separate
offices at the moment, but this could meet with resistance.
External constraints. These are limits from outside and are usually beyond
the control of the business.
Government and EC legislation. Businesses must operate within the law.
For example, a manager may require a driver to deliver some goods urgently
to a customer 600 miles away, which would require a 17 hour drive. The law
19 … the amount of time a person can drive a commercial vehicle to about
10 hours per day.
Competitors' behaviour. Say a firm is deciding to introduce a new product.
If Mars are enjoying some success with a new product, Cadbury's might copy
82
Mars and decide to 20 … their own version of the product. Because competition
has become greater in recent years, this constraint has affected more firms.
Lack of technology. There are many examples of operations in business
that in the past were slow or physically demanding. Today tasks as varied as
21 … cargo onto ships to computer aided design can be carried on effectively
with the use of modern technology.
The economic environment. It is argued that business activity moves
through booms, where demand rises, and 22 … . This can affect investment
decisions. For example, if a company is deciding whether to build a larger plant,
the decision makers may postpone the plan if the economy is in a lump and
demand is low. During the recession of the early 1990s a large number of
businesses cancelled investment projects.
(Adapted from [2])
13 A duty B coercion C constraints D damper
14 A claim B options C right D alternative
15 A plan B design C policy D attitude
16 A prevented B ruined C limited D congest
17 A administer B adduce C appeal D offer
18 A limited B cut C stop D excepted
19 A hampers B restricts C shorten D diminish
20 A cast B pitch C toss D launch
21 A arranging B glutting C loading D topping
22 A slumps B bottom C reduction D swoop
Task 3.4. Read the text below. For each of the empty spaces (23 – 30)
choose the correct answer (A, B, C or D).
Factors Influencing Group Decision Making
There are a number of factors which determine how effective groups
are when making decisions.
Size of the group. Research 23 … out into the effect of group size on
decision making. It 24 … that groups become ineffective once they have 21
members. Other researchers 25 … to measure an optimum size for groups.
It is felt, in many cases, that the best size is between 3 – 7 members, with 5
often 26 … as an ideal number.
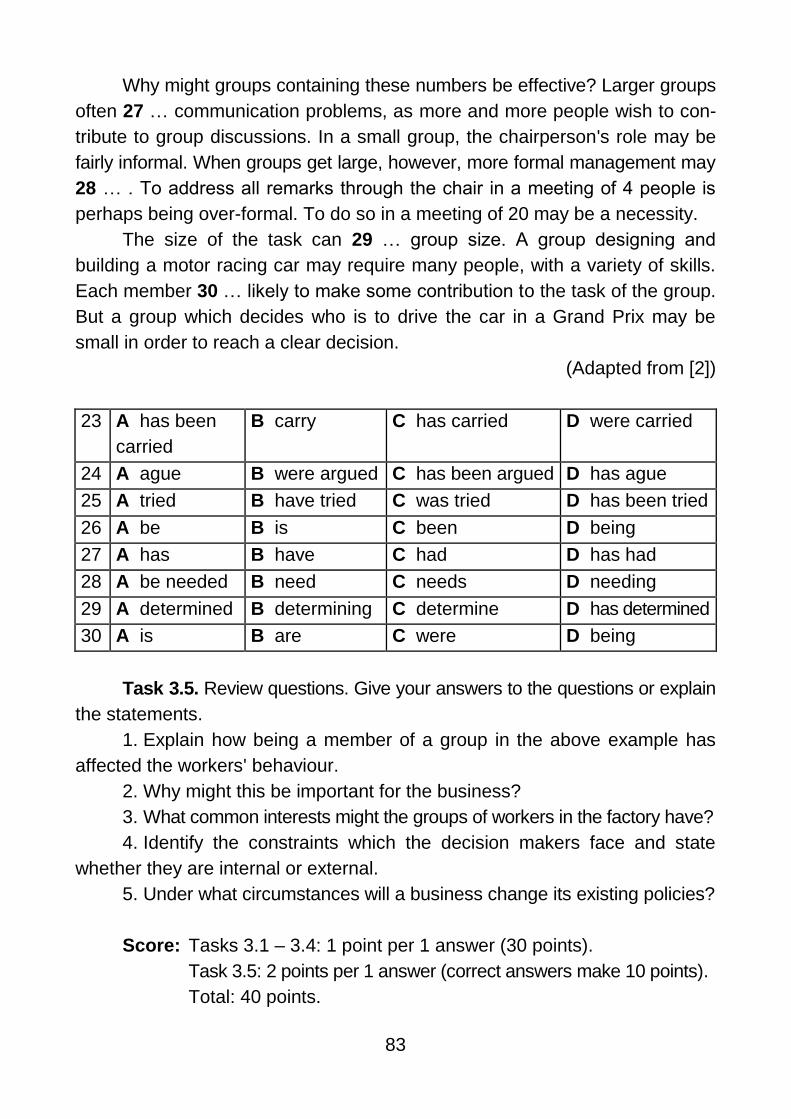
83
Why might groups containing these numbers be effective? Larger groups
often 27 … communication problems, as more and more people wish to con-
tribute to group discussions. In a small group, the chairperson's role may be
fairly informal. When groups get large, however, more formal management may
28 … . To address all remarks through the chair in a meeting of 4 people is
perhaps being over-formal. To do so in a meeting of 20 may be a necessity.
The size of the task can 29 … group size. A group designing and
building a motor racing car may require many people, with a variety of skills.
Each member 30 … likely to make some contribution to the task of the group.
But a group which decides who is to drive the car in a Grand Prix may be
small in order to reach a clear decision.
(Adapted from [2])
23 A has been
carried
B carry C has carried D were carried
24 A ague B were argued C has been argued D has ague
25 A tried B have tried C was tried D has been tried
26 A be B is C been D being
27 A has B have C had D has had
28 A be needed B need C needs D needing
29 A determined B determining C determine D has determined
30 A is B are C were D being
Task 3.5. Review questions. Give your answers to the questions or explain
the statements.
1. Explain how being a member of a group in the above example has
affected the workers' behaviour.
2. Why might this be important for the business?
3. What common interests might the groups of workers in the factory have?
4. Identify the constraints which the decision makers face and state
whether they are internal or external.
5. Under what circumstances will a business change its existing policies?
Score: Tasks 3.1 – 3.4: 1 point per 1 answer (30 points).
Task 3.5: 2 points per 1 answer (correct answers make 10 points).
Total: 40 points.
84
Unit 4. Knowledge Management
Task 1. Answer the questions.
1. What is knowledge management? Give five associations with this notion.
2. What knowledge management concepts do you know?
3. What is the main idea of knowledge management?
Task 2. Translate these words into your native language. vignette
fierce
foster
uncodifiable
reside
explicate
leverage
Task 3. Read the text and compare your answers with the information
in the text below.
Knowledge Management Concepts and Definitions
Many cases illustrate the importance and value of identifying an
organization's knowledge assets and sharing them throughout the organiza-
tion. In a series of initiatives, MITRE developed knowledge management (KM)
systems to leverage its intellectual assets, or intellectual capital – the valuable
knowledge of its employees. MITRE's culture was transformed through the
deployment of KM systems, leading to significantly lower operating costs, higher
efficiency, and more collaboration throughout the organization. Although their
worth is difficult to measure, organizations recognize the value of their intel-
lectual assets. Fierce global competition drives companies to better use their
intellectual assets by transforming themselves into organizations that foster
the development and sharing of knowledge.
With roots in organizational learning and innovation, the idea of KM is not
new. However, the application of IT tools to facilitate the creation, storage,
transfer, and application of previously uncodifiable organizational knowledge
is a new and major initiative in many organizations. Successful managers
have long used intellectual assets and recognized their value. But these efforts
were not systematic, nor did they ensure that knowledge gained was shared
and dispersed appropriately for maximum organizational benefit. Knowledge
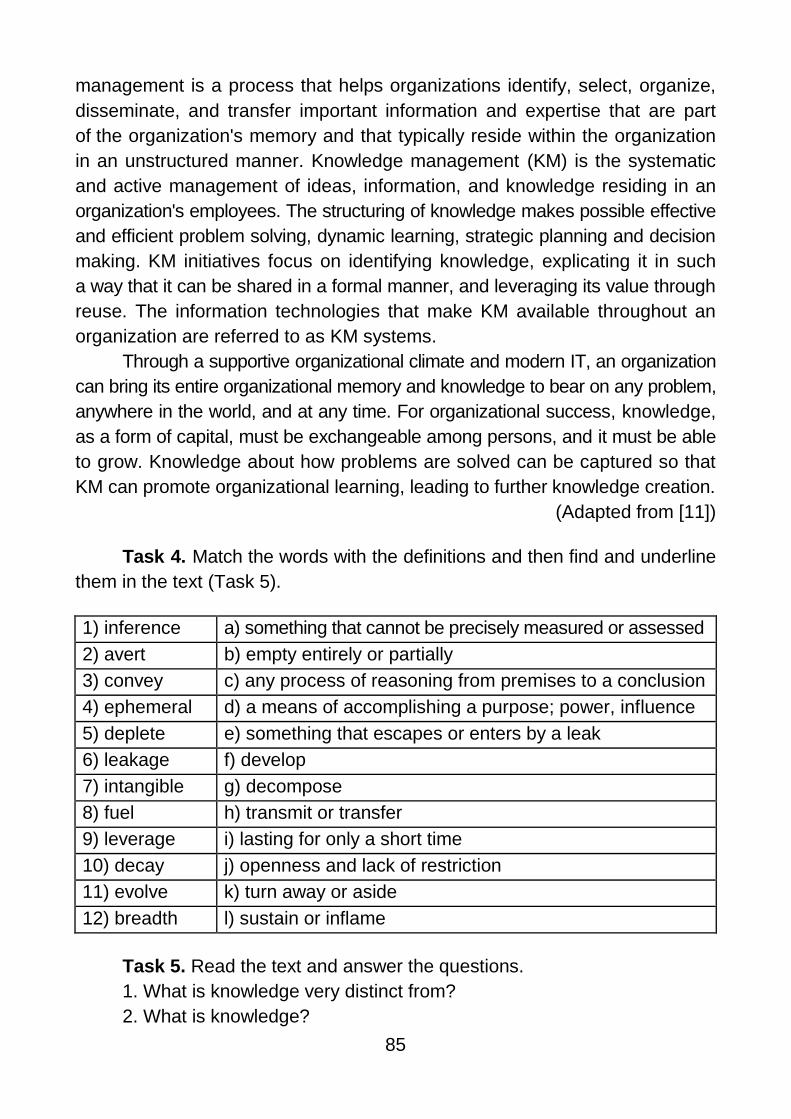
85
management is a process that helps organizations identify, select, organize,
disseminate, and transfer important information and expertise that are part
of the organization's memory and that typically reside within the organization
in an unstructured manner. Knowledge management (KM) is the systematic
and active management of ideas, information, and knowledge residing in an
organization's employees. The structuring of knowledge makes possible effective
and efficient problem solving, dynamic learning, strategic planning and decision
making. KM initiatives focus on identifying knowledge, explicating it in such
a way that it can be shared in a formal manner, and leveraging its value through
reuse. The information technologies that make KM available throughout an
organization are referred to as KM systems.
Through a supportive organizational climate and modern IT, an organization
can bring its entire organizational memory and knowledge to bear on any problem,
anywhere in the world, and at any time. For organizational success, knowledge,
as a form of capital, must be exchangeable among persons, and it must be able
to grow. Knowledge about how problems are solved can be captured so that
KM can promote organizational learning, leading to further knowledge creation.
(Adapted from [11])
Task 4. Match the words with the definitions and then find and underline
them in the text (Task 5).
1) inference a) something that cannot be precisely measured or assessed
2) avert b) empty entirely or partially
3) convey c) any process of reasoning from premises to a conclusion
4) ephemeral d) a means of accomplishing a purpose; power, influence
5) deplete e) something that escapes or enters by a leak
6) leakage f) develop
7) intangible g) decompose
8) fuel h) transmit or transfer
9) leverage i) lasting for only a short time
10) decay j) openness and lack of restriction
11) evolve k) turn away or aside
12) breadth l) sustain or inflame
Task 5. Read the text and answer the questions.
1. What is knowledge very distinct from?
2. What is knowledge?

86
3. What is information?
4. What is the difference between knowledge and information? (Give
examples).
5. What is intellectual capital?
Knowledge
Knowledge is very distinct from data and information (Fig. 4.1). Data are
facts, measurements, and statistics; information is organized or processed data
that is timely (i.e., inferences from the data are drawn within the time frame of
applicability) and accurate (i.e., with regard to the original data). Knowledge is
information that is contextual, relevant, and actionable. However, having the
current conditions as information is useful only if you have knowledge that
enables you to avert the construction zone. The implication is that knowledge
has strong experiential and reflective elements that distinguish it from information
in a given context.
Having knowledge implies that it can be exercised to solve a problem,
whereas having information does not carry the same connotation. An ability
to act is an integral part of being knowledgeable. For example, two people
in the same context with the same information may not have the same ability
to use the information to the same degree of success. Hence, there is a dif-
ference in the human capability to add value. The differences in ability may
be due to different experiences, different training, different perspectives, and
other factors. Whereas data, information, and knowledge may all be viewed
as assets of an organization, knowledge provides a higher level of meaning
about data and information. It conveys meaning and so tends to be much
more valuable, yet more ephemeral.
Fig. 4.1. The data – information – knowledge chain

87
Unlike other organizational assets, knowledge has the following
characteristics:
Extraordinary leverage and increasing returns. Knowledge is not subject
to diminishing returns. When it is used, it is not decreased (or depleted), rather
it is increased (or improved). Its consumers can add to it, thus increasing its
value.
Fragmentation, leakage, and the need to refresh. As knowledge grows,
it branches and fragments. Knowledge is dynamic; it is information in action.
Thus, an organization must continually refresh its knowledge base to maintain
it as a source of competitive advantage.
Uncertain value. It is difficult to estimate the impact of an investment
in knowledge. There are too many intangible aspects that cannot be easily
quantified.
Value of sharing. It is difficult to estimate the value of sharing one's know-
ledge or even who will benefit most from it.
Over the past few decades, the industrialized economy has been going
through a transformation from being based on natural resources to being
based on intellectual assets. The knowledge-based economy is a reality. Rapid
changes in the business environment cannot be handled in traditional ways.
Firms are much larger today than they used to be, and, in some areas, turnover
is extremely high, fueling the need for better tools for collaboration, commu-
nication, and knowledge sharing. Firms must develop strategies to sustain
competitive advantage by leveraging their intellectual assets for optimal per-
formance. Competing in the globalized economy and markets requires quick
response to customer needs and problems. To provide service, managing know-
ledge is critical for consulting firms spread out over wide geographical areas
and for virtual organizations.
There is a vast amount of literature about what knowledge and knowing
mean in epistemology (i.e., the study of the nature of knowledge), the social
sciences, philosophy, and psychology. Although there is no single definition
of what knowledge and KM specifically mean, the business perspective on
them is fairly pragmatic. Information as a resource is not always valuable
(i.e., information overload can distract from what is important); knowledge
as a resource is valuable because it focuses attention back toward what is
important. Knowledge implies an implicit understanding and experience that can
discriminate between its use and misuse. Over time, information accumulates
and decays, whereas knowledge evolves. Knowledge is dynamic in nature. This

88
implies, though, that today's knowledge may well become tomorrow's ignorance
if an individual or organization fails to update knowledge as environmental
conditions change.
The term "intellectual capital", often used as a synonym for knowledge,
implies that there is a financial value to knowledge. Not all intellectual capital
can be classified as knowledge. Brand and customer are aspects of intellectual
capital, but in today's marketplace the most significant and valuable aspect of
intellectual capital is indeed knowledge in all its forms. Although intellectual
capital is difficult to measure, some industries have tried. Knowledge evolves
over time with experience, which puts connections among new situations and
events in context. Given the breadth of the types and applications of know-
ledge, we adopt the simple and elegant definition that knowledge is information
in action.
(Adapted from [11])
Task 6. Describe the main idea of the text (Task 5).
Focus on Reading
Task 7. Translate these words into your native language.
inherent
explicit
dichotomous
embed
hunch
gut
expedite
Task 8. Some of the key terms given above are used in the text (Task 10).
Look through the text and underline them.
Task 9. Find the knowledge types from the box and match them with
their definitions.
Cognitive tacit, causal, relational, tacit, explicit, pragmatic, conditional,
individual, declarative, social, procedural, technical tacit.
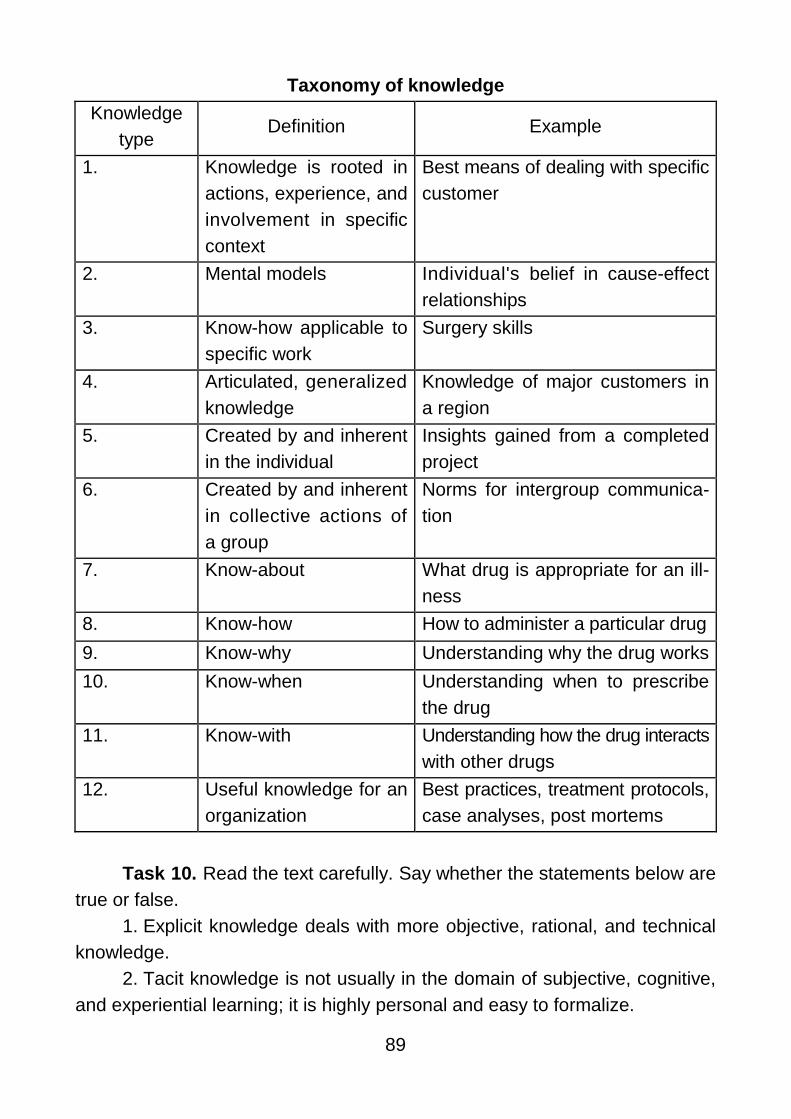
89
Taxonomy of knowledge
Knowledge
type Definition Example
1. Knowledge is rooted in
actions, experience, and
involvement in specific
context
Best means of dealing with specific
customer
2. Mental models Individual's belief in cause-effect
relationships
3. Know-how applicable to
specific work
Surgery skills
4. Articulated, generalized
knowledge
Knowledge of major customers in
a region
5. Created by and inherent
in the individual
Insights gained from a completed
project
6. Created by and inherent
in collective actions of
a group
Norms for intergroup communica-
tion
7. Know-about What drug is appropriate for an ill-
ness
8. Know-how How to administer a particular drug
9. Know-why Understanding why the drug works
10. Know-when Understanding when to prescribe
the drug
11. Know-with Understanding how the drug interacts
with other drugs
12. Useful knowledge for an
organization
Best practices, treatment protocols,
case analyses, post mortems
Task 10. Read the text carefully. Say whether the statements below are
true or false.
1. Explicit knowledge deals with more objective, rational, and technical
knowledge.
2. Tacit knowledge is not usually in the domain of subjective, cognitive,
and experiential learning; it is highly personal and easy to formalize.
90
3. Explicit knowledge has been codified in a form that can be distributed
to others or transformed into a process or strategy requiring interpersonal
interaction.
4. Tacit knowledge has also been called leaky knowledge.
5. Explicit knowledge is the cumulative store of the experiences, mental
maps, insights, acumen, expertise, knowhow, trade secrets, skill sets, under-
standing, and learning that an organization has.
6. Tacit knowledge is usually either localized within the brain of an indi-
vidual or embedded in the group interactions within a department or a branch
office.
7. Tacit knowledge does not involve expertise or high skill levels.
8. Successful transfer or sharing of tacit knowledge usually takes place
only through associations or simulations.
9. Management information systems departments have focused on
capturing, storing, managing, and reporting explicit knowledge.
10. Knowledge management systems (KMS) refer to the use of modern IT.
Explicit and Tacit Knowledge
Explicit knowledge deals with more objective, rational, and technical know-
ledge (e.g. data, policies, procedures, software, documents). Tacit knowledge
is usually in the domain of subjective, cognitive, and experiential learning; it is
highly personal and difficult to formalize. Alavi and Leidner (2001) provided
a taxonomy, where they defined a spectrum of different types of knowledge,
going beyond the simple binary classification of explicit versus tacit (Task 9).
However, most KM research has been (and still is) debating over the dichotomous
classification of knowledge.
Explicit knowledge comprises the policies, procedural guides, written papers,
reports, designs, products, strategies, goals, mission, and core competencies
of an enterprise and its IT infrastructure. It is the knowledge that has been
codified (i.e., documented) in a form that can be distributed to others or trans-
formed into a process or strategy without requiring interpersonal interaction.
For example, a description of how to process a job application would be
documented in a firm's human resources policy manual. Explicit knowledge
has also been called leaky knowledge because of the ease with which it can
leave an individual, a document, or an organization due to the fact that it can
be readily and accurately documented.
91
Tacit knowledge is the cumulative store of the experiences, mental maps,
insights, acumen, expertise, knowhow, trade secrets, skill sets, understanding,
and learning that an organization has, as well as the organizational culture
that has embedded in it the past and present experiences of the organization's
people, processes, and values. Tacit knowledge, also referred to as embedded
knowledge, is usually either localized within the brain of an individual or embedded
in the group interactions within a department or a branch office. Tacit know-
ledge typically involves expertise or high skill levels.
Sometimes tacit knowledge could easily be documented but has remained
tacit simply because the individual housing the knowledge does not recognize
its potential value to other individuals. Other times, tacit knowledge is unstruc-
tured, without tangible form, and therefore difficult to codify. It is difficult to put
some tacit knowledge into words. For example, an explanation of how to ride
a bicycle would be difficult to document explicitly and thus is tacit. Successful
transfer or sharing of tacit knowledge usually takes place through associations,
internships, apprenticeship, conversations, other means of social and inter-
personal interactions, or even simulations. Nonaka and Takeuchi claimed that
intangibles such as insights, intuitions, hunches, gut feelings, values, images,
metaphors, and analogies are the often-overlooked assets of organizations.
Harvesting these intangible assets can be critical to a firm's bottom line and
its ability to meet its goals. Tacit knowledge sharing requires a certain context
or situation in order to be facilitated because it is less commonly shared under
normal circumstances.
Historically, management information systems (MIS) departments have
focused on capturing, storing, managing, and reporting explicit knowledge.
Organizations now recognize the need to integrate both types of knowledge
in formal information systems. For centuries, the mentor-apprentice relation-
ship, because of its experiential nature, has been a slow but reliable means
of transferring tacit knowledge from individual to individual. When people
leave an organization, they take their knowledge with them. One critical goal
of knowledge management is to retain the valuable knowhow that can so
easily and quickly leave an organization. Knowledge management systems
(KMS) refer to the use of modern IT (e.g. the Internet, intranets, extranets,
Lotus Notes, software filters, agents, data warehouses, Web 2.0) to systematize,
enhance, and expedite intra- and interfirm KM.
KM systems are intended to help an organization cope with turnover,
rapid change, and downsizing by making the expertise of the organization's
92
human capital widely accessible. They are being built, in part, because of the
increasing pressure to maintain a well-informed, productive workforce. Moreover,
they are built to help large organizations provide a consistent level of customer
service.
(Adapted from [11])
Task 11. Read the text (Task 10) again and answer the questions.
1. What is explicit knowledge?
2. What does explicit knowledge comprise ?
3. How has explicit knowledge been called and why?
4. What is tacit knowledge?
5. How is tacit knowledge referred to?
6. What does tacit knowledge typically involve?
7. What have management information systems (MIS) departments focused
on historically?
8. What are KM systems intended to?
Task 12. Do the tasks below.
1. Define knowledge management and describe its purposes.
2. Distinguish between knowledge and data.
3. Describe the knowledge-based economy.
4. Define tacit knowledge and explicit knowledge.
5. Define KMS and describe the capabilities of KMS.
Focus on Vocabulary
Task 13. Find synonyms to the words in the table below.
1) classification
2) distribute
3) ease
4) involve
5) remain
6) claim
93
7) reliable
8) transfer
Task 14. Complete the text with the following words and phrases:
condition, rules, representation, implements, modified, simulation, behavior,
synergistically, interdependent, require, individual.
Production Rules
Production 1 … are the most popular form of knowledge 2 … for expert
systems. Knowledge is represented in the form of condition-action pairs: IF
this 3 … (or premise or antecedent) occurs, THEN some action (or result or
conclusion or consequence) will (or should) occur.
Each production rule in a knowledge base 4 … an autonomous chunk
of expertise that can be developed and 5 … independently of other rules.
When combined and fed to the inference engine, the set of rules behaves
6 …, yielding better results than the sum of the results of the 7 … rules. In
reality, knowledge-based rules are not independent. They quickly become
highly 8 … . For example, adding a new rule may conflict with an existing
rule, or it may 9 … a revision of attributes or rules.
Rules can be viewed, in some sense, as a 10 … of the cognitive
behavior of human experts. According to this view, rules are not just a neat
formalism to represent knowledge in a computer, rather, they represent a model
of actual human 11 … .
Task 15. Read and complete the text below. For each of the empty
spaces (1 – 6) choose the correct answer (A, B, C or D).
Rules can 1 … in different forms. Some examples follow:
IF 2 …, THEN conclusion. IF your income is high, THEN your chance of
being audited by the IRS is high.
3 …, IF premise. Your chance of being audited is high, IF your income
is high.
Inclusion of ELSE. If your income is high OR your 4 … are unusual,
THEN your chance of being audited by the IRS is high, OR ELSE your
chance of being audited is low.
94
More complex rules. IF the credit rating is high AND the salary is more
than $30,000 OR assets are more than $75,000 AND pay history is not
"poor", THEN approve a loan up to $10,000 and list the loan in category B.
The action part may include additional information: THEN 5 … the loan and
refer the applicant to an agent.
The IF side of a rule can 6 … dozens of IFs. The THEN side can
include several parts as well.
1 A begin B appear C access D proceed
2 A assert B estimate C premise D proposal
3 A conclusion B period C windup D issue
4 A acceptance B decrease C decay D deductions
5 A favor B approve C support D defend
6 A include B count C increase D compass
Focus on Reading
Task 16. Read the text carefully. Say whether the statements below are
true or false.
1. Semantic networks focus on the relationships between two concepts.
2. Semantic networks are graphical depictions of knowledge composed
of nodes and links that show hierarchical relationships between nodes.
3. A simple semantic network is made up of a number of circles, or nodes,
that represent objects and descriptive information about the links.
4. A semantic network can show inheritance.
5. A semantic network is basically a hierarchy, so the various characteristics
of some arcs actually inherit the characteristics of others.
6. Semantic nets are used basically as a visual representation of
relationships and cannot be combined with other representation methods.
Semantic Networks
Semantic networks focus on the relationships between different concepts.
They are graphical depictions of knowledge composed of nodes and links that
show hierarchical relationships between objects.
95
A simple semantic network is shown in Fig. 4.2. It is made up of a number
of circles, or nodes, that represent objects and descriptive information about
the objects. Objects can be any physical item, such as a book, a car, a desk,
or even a person. Nodes can also be concepts, events, or actions. A concept
might be the relationship between supply and demand in economics, an event
such as a picnic or an election, or an action such as building a house or writing
a book. Attributes of an object can also be used as nodes. These might
represent size, color, class, age, origin, or other characteristics. In this way,
detailed information about objects can be presented.
Nodes are interconnected by links, or arcs, that show the relationships
between the various objects and descriptive factors. Some of the most com-
mon arcs are of the is-a or has-a type. Is-a is used to show a class relation-
ship, that is, that an object belongs to a larger class or category of objects.
Has-a links are used to identify characteristics or attributes of object nodes.
Other arcs are used for definitional purposes.
Now refer to the example in Fig. 4.2. As you can see, the central figure
in the domain of knowledge is a person called Sam. One link shows that Sam
is a man, and that a man is a human being, or is part of a class called
humans. Another arc from Sam shows that he is married to Kay. Additional
arcs show that Kay is a woman, and that a woman is in turn a human being.
Other links show that Sam and Kay have a child, Joe, who is a boy and goes
to school.
Some nodes and arcs show other characteristics about Sam. For example,
he is a vice president of Acme, a company that is a subsidiary of Ajax.
We also see that Sam plays golf, which is a sport. Furthermore, Sam owns
a Mercedes-Benz whose color is silver. We also see that Mercedes-Benz is
a type of car that is made in Germany.
One of the most interesting and useful facts about a semantic network
is that it can show inheritance. Because a semantic network is basically
a hierarchy, the various characteristics of some nodes actually inherit the
characteristics of others. As an example, consider the links showing that Sam
is a man and that a man is in turn a human being. Here, Sam inherits all the
properties of human beings. We can ask the question, "Does Sam need food?"
Because of the inheritance links, we can say that he needs food if human
beings need food.
Semantic nets are used basically as a visual representation of relationships
and can be combined with other representation methods.
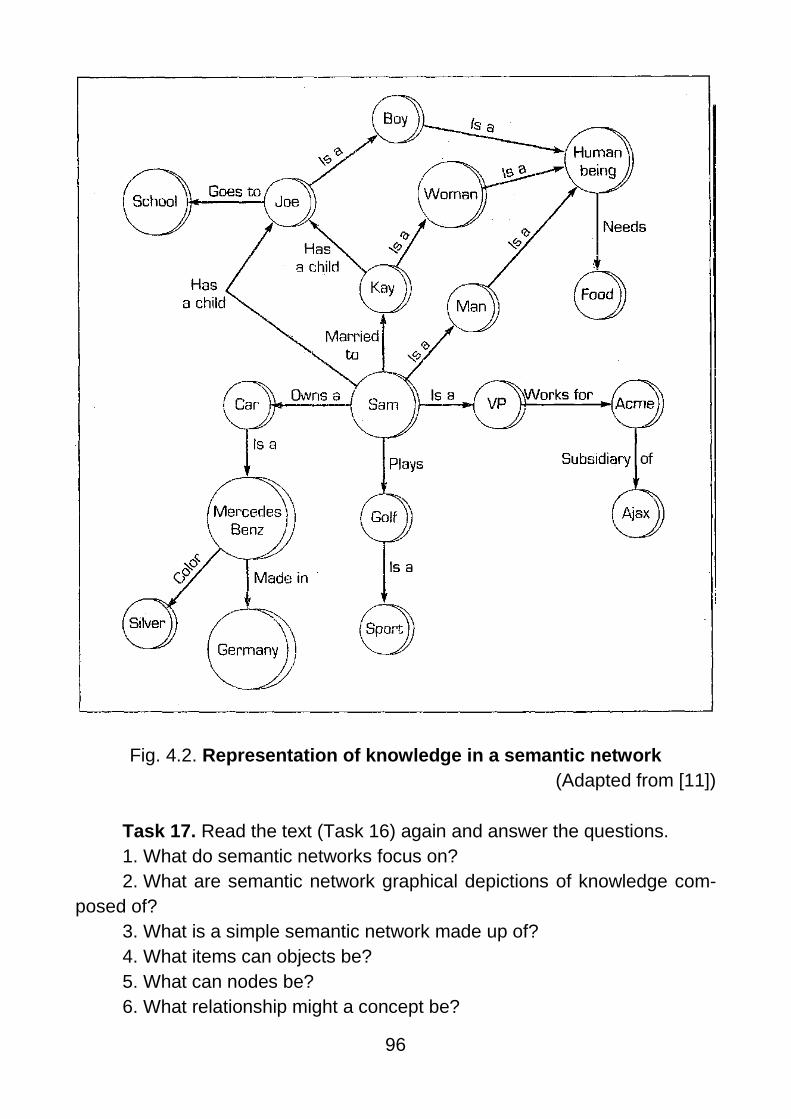
96
Fig. 4.2. Representation of knowledge in a semantic network
(Adapted from [11])
Task 17. Read the text (Task 16) again and answer the questions.
1. What do semantic networks focus on?
2. What are semantic network graphical depictions of knowledge com-
posed of?
3. What is a simple semantic network made up of?
4. What items can objects be?
5. What can nodes be?
6. What relationship might a concept be?
97
7. How can attributes of an object be used?
8. What might nodes represent?
9. What do nodes show?
10. What can a semantic network show and why?
Task 18. Read the text and make a list of your examples according to
the rules. Then discuss them with your partner.
Knowledge and Inference Rules
Two types of rules are common in Al: knowledge and inference. Know-
ledge rules, or declarative rules, state all the facts and relationships about
a problem. Inference rules, or procedural rules, on the other hand, advise on
how to solve a problem given that certain facts are known. The knowledge
engineer separates the two types of rules: knowledge rules go to the know-
ledge base, whereas inference rules become part of the inference engine.
For example, assume you are in the business of buying and selling gold.
The knowledge rules might look like the following:
RULE 1: IF an international conflict begins, THEN the price of gold goes up.
RULE 2: IF the inflation rate declines, THEN the price of gold goes down.
RULE 3: IF the international conflict lasts more than seven days and IF
it is in the Middle East, THEN buy gold.
Inference rules contain rules about rules and thus are also called metarules.
They pertain to other rules (or even to themselves). Inference (procedural) rules
may look like the following:
RULE 1: IF the data needed are not in the system, THEN request them
from the user.
RULE 2: IF more than one rule apply, THEN deactivate any rules that
add no new data.
Task 19. Read the text and make a list of advantages and disadvantages
of using knowledge rules. Then discuss the answers with your partner.
Advantages and Limitations of Rules
Rule representation is especially applicable when there is a need to
recommend a course of action based on observable events. It has several
major advantages:
Rules are easy to understand. They are communicable because they
are a natural form of knowledge. Inference and explanations are easily derived.
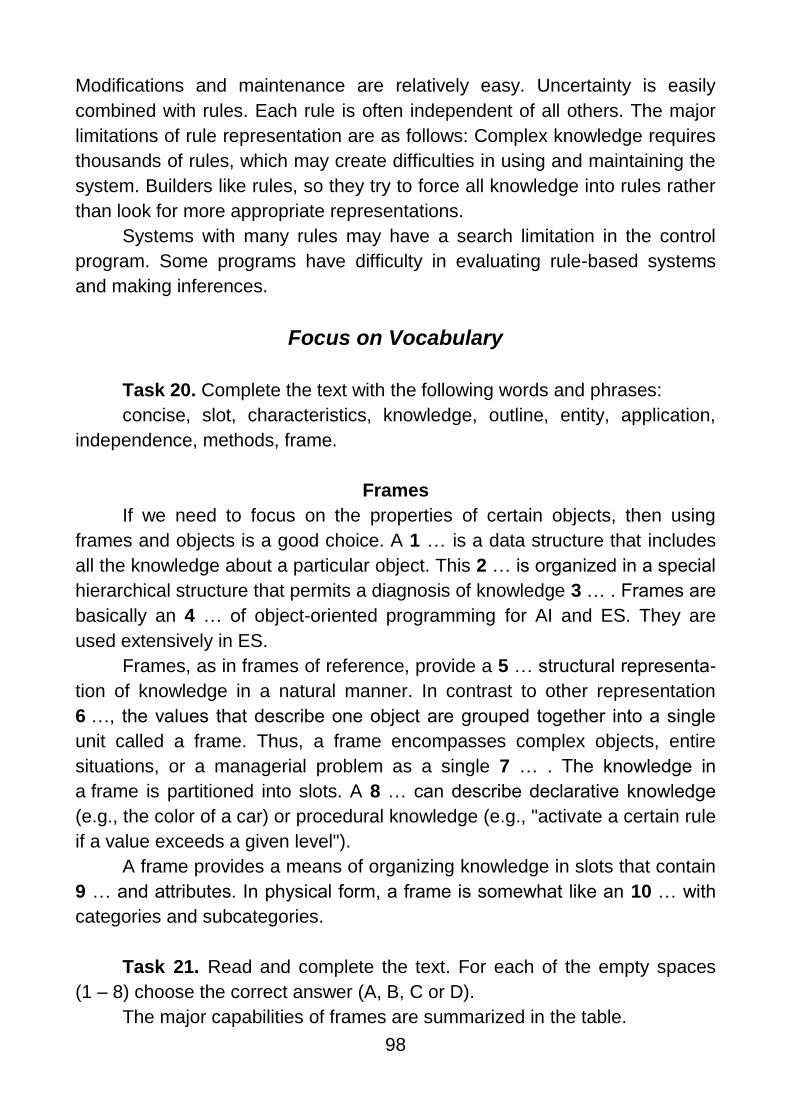
98
Modifications and maintenance are relatively easy. Uncertainty is easily
combined with rules. Each rule is often independent of all others. The major
limitations of rule representation are as follows: Complex knowledge requires
thousands of rules, which may create difficulties in using and maintaining the
system. Builders like rules, so they try to force all knowledge into rules rather
than look for more appropriate representations.
Systems with many rules may have a search limitation in the control
program. Some programs have difficulty in evaluating rule-based systems
and making inferences.
Focus on Vocabulary
Task 20. Complete the text with the following words and phrases:
concise, slot, characteristics, knowledge, outline, entity, application,
independence, methods, frame.
Frames
If we need to focus on the properties of certain objects, then using
frames and objects is a good choice. A 1 … is a data structure that includes
all the knowledge about a particular object. This 2 … is organized in a special
hierarchical structure that permits a diagnosis of knowledge 3 … . Frames are
basically an 4 … of object-oriented programming for AI and ES. They are
used extensively in ES.
Frames, as in frames of reference, provide a 5 … structural representa-
tion of knowledge in a natural manner. In contrast to other representation
6 …, the values that describe one object are grouped together into a single
unit called a frame. Thus, a frame encompasses complex objects, entire
situations, or a managerial problem as a single 7 … . The knowledge in
a frame is partitioned into slots. A 8 … can describe declarative knowledge
(e.g., the color of a car) or procedural knowledge (e.g., "activate a certain rule
if a value exceeds a given level").
A frame provides a means of organizing knowledge in slots that contain
9 … and attributes. In physical form, a frame is somewhat like an 10 … with
categories and subcategories.
Task 21. Read and complete the text. For each of the empty spaces
(1 – 8) choose the correct answer (A, B, C or D).
The major capabilities of frames are summarized in the table.
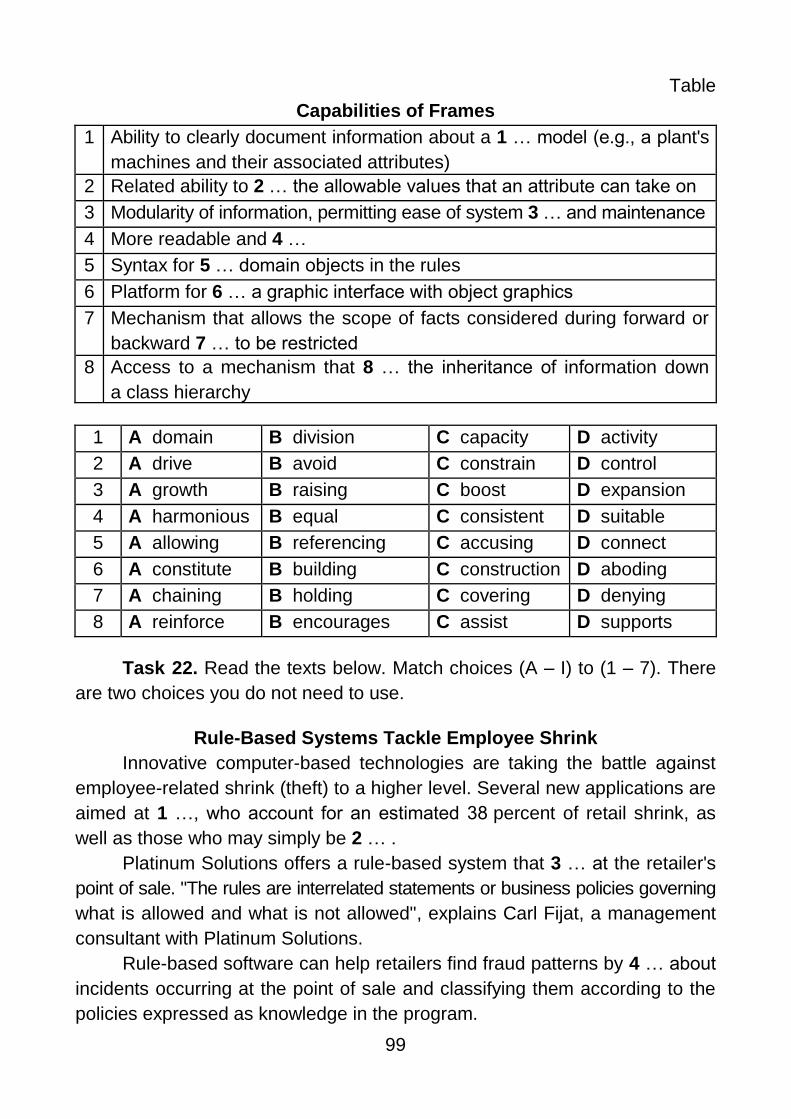
99
Table
Capabilities of Frames
1 Ability to clearly document information about a 1 … model (e.g., a plant's
machines and their associated attributes)
2 Related ability to 2 … the allowable values that an attribute can take on
3 Modularity of information, permitting ease of system 3 … and maintenance
4 More readable and 4 …
5 Syntax for 5 … domain objects in the rules
6 Platform for 6 … a graphic interface with object graphics
7 Mechanism that allows the scope of facts considered during forward or
backward 7 … to be restricted
8 Access to a mechanism that 8 … the inheritance of information down
a class hierarchy
1 A domain B division C capacity D activity
2 A drive B avoid C constrain D control
3 A growth B raising C boost D expansion
4 A harmonious B equal C consistent D suitable
5 A allowing B referencing C accusing D connect
6 A constitute B building C construction D aboding
7 A chaining B holding C covering D denying
8 A reinforce B encourages C assist D supports
Task 22. Read the texts below. Match choices (A – I) to (1 – 7). There
are two choices you do not need to use.
Rule-Based Systems Tackle Employee Shrink
Innovative computer-based technologies are taking the battle against
employee-related shrink (theft) to a higher level. Several new applications are
aimed at 1 …, who account for an estimated 38 percent of retail shrink, as
well as those who may simply be 2 … .
Platinum Solutions offers a rule-based system that 3 … at the retailer's
point of sale. "The rules are interrelated statements or business policies governing
what is allowed and what is not allowed", explains Carl Fijat, a management
consultant with Platinum Solutions.
Rule-based software can help retailers find fraud patterns by 4 … about
incidents occurring at the point of sale and classifying them according to the
policies expressed as knowledge in the program.
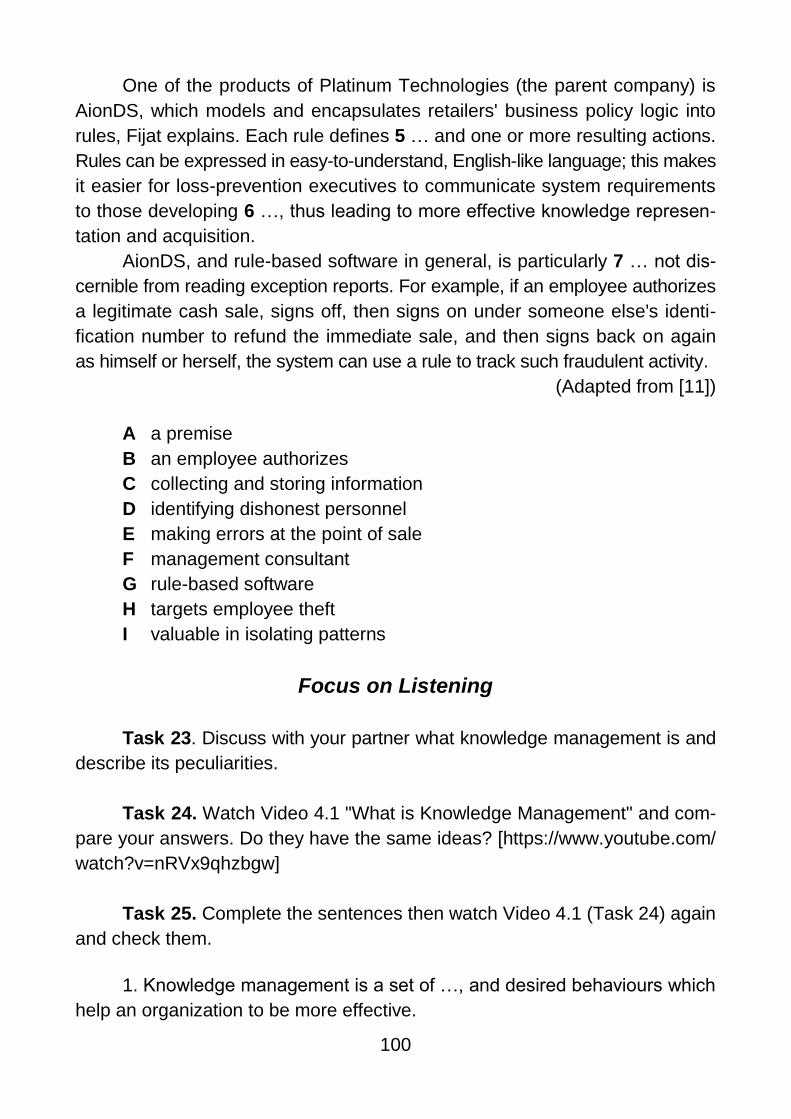
100
One of the products of Platinum Technologies (the parent company) is
AionDS, which models and encapsulates retailers' business policy logic into
rules, Fijat explains. Each rule defines 5 … and one or more resulting actions.
Rules can be expressed in easy-to-understand, English-like language; this makes
it easier for loss-prevention executives to communicate system requirements
to those developing 6 …, thus leading to more effective knowledge represen-
tation and acquisition.
AionDS, and rule-based software in general, is particularly 7 … not dis-
cernible from reading exception reports. For example, if an employee authorizes
a legitimate cash sale, signs off, then signs on under someone else's identi-
fication number to refund the immediate sale, and then signs back on again
as himself or herself, the system can use a rule to track such fraudulent activity.
(Adapted from [11])
A a premise
B an employee authorizes
C collecting and storing information
D identifying dishonest personnel
E making errors at the point of sale
F management consultant
G rule-based software
H targets employee theft
I valuable in isolating patterns
Focus on Listening
Task 23. Discuss with your partner what knowledge management is and
describe its peculiarities.
Task 24. Watch Video 4.1 "What is Knowledge Management" and com-
pare your answers. Do they have the same ideas? [https://www.youtube.com/
watch?v=nRVx9qhzbgw]
Task 25. Complete the sentences then watch Video 4.1 (Task 24) again
and check them.
1. Knowledge management is a set of …, and desired behaviours which
help an organization to be more effective.

101
2. It is different from other improvement toolkits and management
movements like Six Sigma or LEAN Manufacturing because it … .
3. This is why Knowledge Management is quite a "broad church" of … –
and is getting broader every year.
4. You could find yourself exploring tools to identify and support the
networks in an organization; … .
5. You could look at how good an organization is at … .
6. You may need to encourage teams to learn continuously, during activities
rather than waiting until the end of a major project before … .
7. This will involve …, much more use of connections to some of the
social media so that you're only one click away from a conversation.
8. Finally it has a lot to do with the way that … or come against, as
leaders in an organisation.
9. Knowledge management encompasses all of these areas: … .
Task 26. Watch Video 4.1 again (Task 24), make a list of elements that
knowledge management includes, and discuss them with your partner.
Focus on Speaking
Task 27. Read the beginning of the statements and finish them. Then
discuss them with your partner.
1. Knowledge management is a process that helps organizations … .
2. Knowledge management (KM) is the systematic and active manage-
ment of … .
3. The structuring of knowledge makes possible effective and efficient … .
4. Knowledge is very distinct from … .
5. Data are … ; information is … .
6. Knowledge is information … .
7. The term "intellectual capital" … .
8. Explicit knowledge deals with … .
9. Tacit knowledge is usually in … .
10. Management information systems (MIS) departments have focused
on … .
11. KM systems are intended to … .
12. Semantic networks focus on … .
13. Knowledge management is a set of …. .
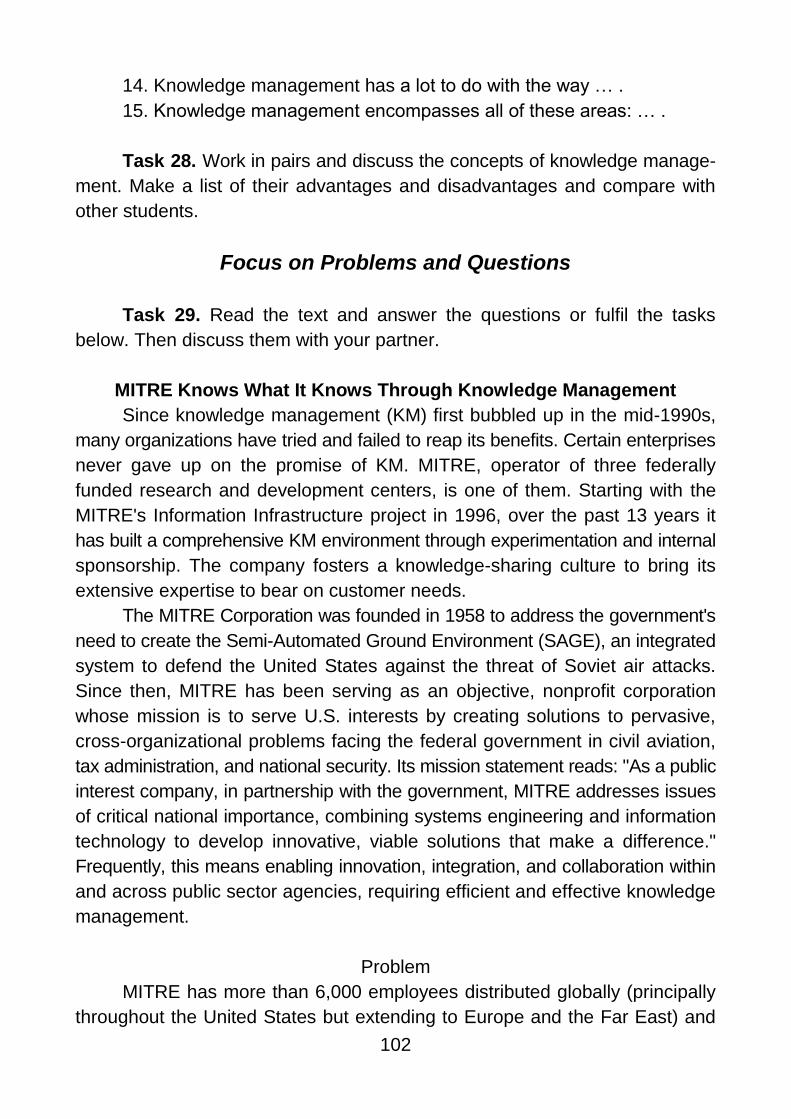
102
14. Knowledge management has a lot to do with the way … .
15. Knowledge management encompasses all of these areas: … .
Task 28. Work in pairs and discuss the concepts of knowledge manage-
ment. Make a list of their advantages and disadvantages and compare with
other students.
Focus on Problems and Questions
Task 29. Read the text and answer the questions or fulfil the tasks
below. Then discuss them with your partner.
MITRE Knows What It Knows Through Knowledge Management
Since knowledge management (KM) first bubbled up in the mid-1990s,
many organizations have tried and failed to reap its benefits. Certain enterprises
never gave up on the promise of KM. MITRE, operator of three federally
funded research and development centers, is one of them. Starting with the
MITRE's Information Infrastructure project in 1996, over the past 13 years it
has built a comprehensive KM environment through experimentation and internal
sponsorship. The company fosters a knowledge-sharing culture to bring its
extensive expertise to bear on customer needs.
The MITRE Corporation was founded in 1958 to address the government's
need to create the Semi-Automated Ground Environment (SAGE), an integrated
system to defend the United States against the threat of Soviet air attacks.
Since then, MITRE has been serving as an objective, nonprofit corporation
whose mission is to serve U.S. interests by creating solutions to pervasive,
cross-organizational problems facing the federal government in civil aviation,
tax administration, and national security. Its mission statement reads: "As a public
interest company, in partnership with the government, MITRE addresses issues
of critical national importance, combining systems engineering and information
technology to develop innovative, viable solutions that make a difference."
Frequently, this means enabling innovation, integration, and collaboration within
and across public sector agencies, requiring efficient and effective knowledge
management.
Problem
MITRE has more than 6,000 employees distributed globally (principally
throughout the United States but extending to Europe and the Far East) and
103
includes both technical and mission or operational experts. With 60 percent of
its employees having more than 20 years of experience and approximately
two-thirds having advanced degrees, leveraging expertise is imperative. MITRE
has extensive human assets who often are in positions as trusted advisors to
the U.S. government. Regular interaction among technical and domain experts
distributed throughout headquarters and sponsor-collocated units enables rapid
and high-quality creation of "solutions that make a difference."
It is common for large knowledge-intensive corporations to develop
a culture of silos, each with its own pocket of knowledge. Over time, these
silos start to function like rivals, compromising an organization's abilities. This
is what MITRE was experiencing that led to the Mil initiative in 1996. The
main challenge for MITRE was to create an environment so that staff could
tap each others' experience to address the requirements of a large number of
complex research projects. In addition, demand for MITRE's services continued
to increase in size and complexity, while its budget stayed relatively the same.
MITRE had to find a way to eliminate the barriers between the knowledge
pockets and leverage its knowledge assets to the fullest. MITRE had to develop
into a culture of sharing.
Solution
As an early attempt at knowledge management, Mil was implemented
and released to the corporation in 1996. The central element of the system
was the knowledge locator (a phonebook-like functionality that pulls together
extensive information about the knowledge-workers and makes them available
in a single Web page). Since then, MITRE has been experimenting with a number
of knowledge management initiatives.
Fig. 4.3 illustrates a comprehensive approach to knowledge management
(similar to the one adopted at MITRE), which can be viewed as integrating
strategies, processes, and technologies that enable the enterprise to acquire,
create, share, and make actionable knowledge needed to achieve its mission.
As Fig. 4.3 illustrates, core knowledge management processes such as the
creation, sharing, and application of knowledge are performed within the context
of corporate processes, practices, and culture. They are supported by a number
of enabling technologies, such as intranets, information push/pull, data mining,
expert finding, expert practice databases, knowledge mapping, and so on.
MITRE's knowledge management strategy aims to enhance its operations
by leveraging internal and external expertise and assets, supporting exchange

104
of knowledge among individuals and groups (e.g., via technical exchange
meetings), facilitating knowledge reuse through capturing and sharing know-
ledge assets (e.g., lessons, learned databases), and transferring knowledge
captured explicitly in knowledge assets back to people (knowledge internal-
ization). It also includes capture of knowledge from people to create tangible
knowledge assets and internalization of knowledge within staff. MITRE's director
of knowledge management serves as a corporate steward of the strategy,
which is shared among the supporting and line organizations. This extends to
business unit knowledge management champions, who help stimulate KM
initiatives.
Fig. 4.3. MITRE's holistic approach to knowledge management
Results
Although MITRE's size and budget are restricted by the government,
KM enables it to deliver more work faster to its customers. Since 1995, MITRE
has invested millions of dollars in a variety of KM systems; in return, it has
reaped an order-of-magnitude ROI in reduced operations cost and improved
productivity. According to corporate executives, before the KM initiatives
MITRE was successful at what it was doing, but now, with KM, they are very
successful, because they can leverage the collective knowledge of the company

105
for every project. KM systems embody MITRE's mission statement – "solutions
that make a difference" which has become "the way of life" for them. Recog-
nizing the value of KM, MITRE is constantly looking for ways to improve its
culture of sharing by empowering people, streamlining processes, and advanc-
ing technologies.
Questions for the Case
1. What is MITRE, and why is KM critical to its success?
2. What problems led to MITRE's explorations of KM solutions?
3. Describe MITRE's holistic approach to KM. Discuss the value of indi-
vidual layers and concepts. Is there anything in this approach that you do not
agree with?
4. Describe the benefits of MITRE's KM systems. Can you think of other
benefits (tangible or intangible) that are not mentioned in the case?
5. Explain how new Internet technologies (such as Web 2.0) can further
enable the KM system at MITRE.
What We Can Learn from This Case At large corporations like MITRE where knowledge is the core enabling
asset, maximum leverage of intellectual capital is imperative. In its early years,
MITRE was not structured in a way that encouraged knowledge sharing, and
what little sharing there was generally took place in an unsystematic, informal
way. As demand for its services increased, MITRE felt the need to better
utilize its intellectual assets and started to develop KM systems. Over time,
MITRE's organizational culture changed from the "culture of silos" to the
"culture of sharing" as a number of successful KM initiatives and systems
were developed. As the case illustrates, knowledge management is not a single
task or project, but rather a continuous process of many tasks and projects.
Corporate success will increasingly hinge on an organization's ability to turn
knowledge management into its way of life.
(Adapted from [11])
Focus on Self-Assessment
Task 4.1. Read the text below. Match choices (A – H) to (1 – 6). There
are two choices you do not need to use.

106
The Content of a Frame
A frame includes two basic elements: slots and facets. A slot is a set of
attributes that describe the object represented by the frame. For example, in
the automobile frame, there are weight and engine slots. Each slot contains
one or more facets. The facets (sometimes called subslots) describe some
knowledge or procedural information about the attribute in the slot. Facets
can take many forms:
1 … . These describe attributes such as blue, red, and yellow for a color slot.
2 … . This facet is used if the slot is empty, that is, without any
description. For example, in the car frame one default value is that the
number of wheels on the car is 4. It means that we can assume the car has
four wheels unless otherwise indicated.
3 … . Range indicates what kind of information can appear in a slot
(e.g., integer numbers only, two decimal points, 0 to 100).
4 … . This facet contains procedural information or attachments. It specifies
an action to be taken when a value in the slot is added (or modified). Such
procedural attachments are called demons.
5 … . Ibis face t is used in a case when no slot value is given. Much like
the if-added situation, it triggers a procedure that goes out and gets or computes
a value.
6 … . Slots can contain frames, rules, semantic networks, or any type of
information.
Certain procedures can be attached to slots and used to derive slot
values. For example, slot-specific heuristics are procedures for deriving slot
values in a particular context. An important aspect of such procedures is that
they can be used to direct the reasoning process. In addition to filling slots,
they can be triggered when a slot is filled.
(Adapted from [11]]
A If added
B Other
C Frame
D Values
E Range
F If needed
G Slot
H Default

107
Task 4.2. Read the text below. Match choices (A – I) to (7 – 13). There
are two choices you do not need to use.
Cingular Calls on Knowledge
How do you make sure that each of your customer service agents at 22
call centers nationwide can answer virtually any question asked by one of
your 22 million clients? Cingular Wireless turned to KM to 7 … . Cingular
benchmarked KM solutions of technology oriented companies. Cingular's
director of knowledge management, met with several KM software vendors to
learn how their tools operate. "This system would be 8 … throughout all of
our departments."
To ensure successful implementation of the system, Cingular embarked
on a campaign to 9 …, from senior executives to each call center agent who
would use the system. A pilot program was initiated in 10 … at three call
centers.
A major issue in developing the KMS involved 11 … it in the system.
Cingular accomplished this by combining the efforts of its employees and an
external authoring group from Innovative Management Solutions. Cingular
divided the process into phases. This made it possible to 12 … with technical
support information, common topics, information on rate plans, and so on.
Browning estimated that it took about 4 months for the knowledge repository
to be ready for the first group of users.
Cingular realized that 13 … is one of the key factors of the system's
success. To that end, the company has a knowledge management team that
is responsible for monitoring, maintaining, and expanding the system.
(Adapted from [11])
A populate the knowledge base
B technical support departments
C obtain the support of everyone involved
D they can be used to direct the reasoning process
E the foundation for what we use
F utilize its intellectual assets
G accomplish this massive task
H ensuring validity and integrity of the knowledge stored and distributed
by the KMS
I capturing knowledge and storing
108
Task 4.3. Read and complete the text below. For each of the empty
spaces (14 – 23) choose the correct answer (A, B, C or D).
KM at Consultancy Firms
Knowledge has become one of the most highly valued 14 … in the
modern economy, and as a consequence we may be witnessing the emergence
of a knowledge-based economy. In this new economy, knowledge-15 … firms
play a key role. Consultancy firms are typically defined as being knowledge-
intensive because knowledge is considered to 16 … greater importance than
all other forms of input. Their main assets are said to 17 … from the know-
ledge and competence of their personnel, and, like other knowledge-intensive
firms, they tend to produce results based on the 18 … and expertise of their
employees.
For such organizations, the ability to develop and 19 … knowledge
faster than their competitors is a key component of their competitive success.
The management of this crucial resource therefore forms a core 20 … for
consultancies, because such employee/organizational knowledge must be
continuously managed and enhanced in order to 21 … existing advantages
and create new ventures.
Consultancy companies tend to have high employee turnover rates.
Consultants experience 22 … from dealing constantly with challenging
problems; frequently readjusting to different environments, people, and cultures;
and travel demands. Many receive better offers from other companies because
of their invaluable problem-solving skills. Others want a more 23 … lifestyle
where they can spend more time with their families.
14 A commodities B objects C asset D load
15 A complete B deep C intensive D profound
16 A adopt B assume C swipe D approve
17 A control B stem C derive D issue
18 A compass B readiness C capacity D intelligence
19 A adventure B coup C effort D exploit
20 A charge B mark C function D object
21 A retain B enjoy C possess D avert
22 A collapse B burnout C debility D prostration
23 A accepted B plain C familiar D routine
109
Task 4.4. Read the text below. For each of the empty spaces (24 – 30)
choose the correct answer (A, B, C or D).
Donnelly (2008) 24 … a comparative study of the KM practices deployed
by a multinational consultancy firm. He 25 … a case study approach of one of
the "Big Four" consultancy firm's business operations in the United Kingdom
and The Netherlands.
In both the United Kingdom and the Netherlands, the firm 26 … four
principal mechanisms to 27 … employee/organizational knowledge: team-based
interaction (to share partially tacit knowledge); electronic libraries/databases
and intranet-based knowledge forums (to share mostly explicit knowledge);
a coach-apprentice training model (to share pure tacit knowledge); network
relationships (to develop know-who knowledge).
In summary, consultancy firms 28 … not much different than other
knowledge-intensive businesses in that they 29 … to continuously improve
their knowledge management practices by 30 … due attention to people,
processes, and technology-related issues.
24 A conducted B conduct C have conducted D is conducted
25 A utilize B utilized C has utilized D utilizes
26 A were used B use C have used D used
27 A diffused B diffuses C diffuse D is diffused
28 A being B are C is D was
29 A seeked B was seek C seek D has seeked
30 A paying B pay C has paid D is paid
Task 4.5. Review questions. Give your answers to the questions.
1. What is the difference between information, data and knowledge?
2. What is knowledge management?
3. What are the concepts of knowledge management? (Explain the main
idea of them).
4. What are the advantages of using knowledge management in a com-
pany?
5. What areas does knowledge management encompass?
Score: Tasks 4.1 – 4.4: 1 point per 1 answer (30 points).
Task 4.5: 2 points per 1 answer (correct answers make 10 points).
Total: 40 points.
110
Unit 5. Computational Economics
Task 1. Answer the questions.
1. What is mathematical economics? Give five associations with this
notion.
2. How does theorizing influence economics?
3. What is the role of mathematics in economics?
Task 2. Translate these words into your native language. assumption
parsimonious
precise
unequivocally
chicanery
extraneous
inconsistency
appreciate
Task 3. Read the text and compare your answers with the information
in the text below.
Mathematics and Economics
Theorizing in economics as in other sciences starts with a set of
assumptions and proceeds to logically draw conclusions that will explain the
phenomena of interest and make predictions as to future outcomes or the
effects of different interventions. Because this is an exercise in logic and given
our definition of mathematics, it should come as no surprise that mathematics
has become an indispensable tool of economics, nor that we have a specialized
field of mathematical economics. If theory is how we organize our thought
and mathematics is an efficient and parsimonious process of logical thinking,
it seems rational to use mathematics in economics. This is the road that all
sciences have followed and economics hasn't been an exception. Mathematics
forces us to be explicit and precise about our assumptions and conclusions.
The precision allows us and others to see if our ideas offer anything of sub-
stance. It is always easy to talk oneself or others into believing that some-
thing of substance has been said or that a model unequivocally predicts one
111
thing or another. Mathematics takes away the means of such chicanery. In
the meantime, mathematics enables the theorist to dispense with extraneous
assumptions, basing a model on the minimum assumptions required. Further-
more, the theorist is forced to show that the conclusions and predictions of
a model mathematically (logically) follow from its assumptions. Mathematics
enables us to verify the validity of a logical argument and detect inconsistencies
or double-talk. Last but not least, mathematics allows us to formulate models
in such a way that they can be estimated using quantitative data. This, in turn,
allows researchers to statistically test different hypotheses. The importance of
this function will be better appreciated considering the quantitative nature of
economics and the role of computation in the theory and application of
economics. Since World War II, mathematics has occupied an increasingly
prominent place in economic analysis. The use of mathematics in economics,
however, dates back to the early days of this science, and many great economists
were either trained as mathematicians or well versed in the subject. Mathematics
and statistics have been used in the work of almost all economists: Cournotʹs
work in the early nineteenth century employed mathematics in an essential
way, as did Irving Fisher's dissertation published in 1892.
(Adapted from [4])
Task 4. Match the words with the definitions and then find and under-
line them in the text (Task 5).
1) comprise a) auxiliary; supplementary
2) computation b) diverse in character
3) ancillary c) include; contain
4) emerge d) essentially different in kind; without comparison
or relation
5) disparate e) a calculation involving numbers or quantities
6) heterogeneous f) become apparent
Task 5. Read the text and answer the questions.
1. What is computational economics?
2. Where does the perspective of computational intelligence arise from?
3. What is Herbert Simon's idea of economics?
112
4. What is the idea behind computational intelligence?
5. Where does modeling intelligence observed from natural behavior
often lead to?
Computational Economics: Legacy of Herbert Simon
We do not treat computational economics as only a collection of numerical
recipes. Instead, for us, computational economics comprises the economic
models built and solved computationally. The role that computation plays is
not just to solve or optimize something already established, but, what is more
important, to define and model what the problem itself is. Therefore, it is not
just ancillary to economic models, but can be the core itself. To distinguish our
vision from the old style, we call this approach to computational economics
a perspective from computational intelligence. We shall elaborate on the reason
why the term "computational intelligence" (CI) is preferred here.
The idea of looking at computational economics from the perspective of
computational intelligence arises essentially from acknowledging the legacy
of Herbert Simon to economics. Herbert Simon, the only person to win the
Nobel Memorial Prize in Economics, the Turing Award of the ACM and the
ORSA/TIMS von Neumann Prize, initiated the interdisciplinary research field
and broke down the conventional distinctions between economics, computer
science and cognitive psychology. The latter two played almost no role in the
early days of Herbert Simon, but have now proved to be an indispensable
part of computational economics, in particular, when agent-based computa-
tional economics emerges as an integration of the originally disparate research
on experimental economics, behavioral finance and economics with hetero-
geneous interacting agents. The increasingly enlarged interdisciplinary frame-
work really leads us to an even richer environment than in the days of Herbert
Simon. The idea behind computational intelligence is basically to model the
intelligent behavior observed from linguistic behavior, biology, insects (swarm
intelligence), neural sciences, and immune systems, just as it is said "natural
does it all". This is different from the classical AI, which was mainly motivated
by and built upon mathematical logic. It is also different from the conventional
models of learning which are mainly based upon probability and statistics.
However, modeling intelligence observed from natural behavior often leads
us to computationally intensive models because the subjects that we are
trying to model are by no means simple as in the classical dynamic systems.
113
It is our anticipation that if we can model this observed behavior successfully,
we can then have a better chance of understanding the operation of the
economic system as a complex adaptive system, which is already a research
target of many well-known research institutes.
Another focus is on the application of CI to modeling the autonomous
agents In fact, the most striking example is the approach coming from
Econphysics.
(Adapted from [9])
Task 6. Describe the main idea of the text (Task 5).
Focus on Reading
Task 7. Translate these words into your native language.
thrive
exceedingly
utmost
precision
fetch
renown
designate
attainment
disincentive
plaudit
Task 8. Some of the key terms given above are used in the text (Task 10).
Look through the text and underline them.
Task 9. Scan the text (Task 10) and give a title to the text.
Task 10. Read the text carefully. Say whether the statements below are
true or false.
1. Two quotes insist on the fact that one should begin by focusing on
simple phenomena even if at first sight they have little practical implications.

114
2. Many scientists in their answer never emphasize that what matters is
more the method of investigation than the phenomena by themselves.
3. Two quotes stress that applying to the social sciences the experimental
methodology invented by physicists and chemists would not mark a great
progress.
4. Over the past century, several of the most renowned economists and
sociologists were in fact econophysicists.
5. In the twentieth century, the only way to get a decent mathematical
training was to study astronomy, engineering, mathematics or physics.
6. When such people entered the social sciences, this led to two kinds
of approaches which we may designate as econophysics and economathematics.
7. V. Leontief and A. Schwartz point out that the representative agent
assumption which is supposed to provide a connection between micro- and
macroeconomics is fundamentally flawed because it neglects both social
variability and stochastic fluctuations.
8. In recent years, a greater emphasis has been put on the issue of
heterogeneity.
"No science thrives in the atmosphere of direct practical aim. We should
still be without most of the conveniences of modern life if physicists had been
as eager for immediate applications as most economists are and always have
been".
"The free fall is a very trivial physical phenomenon, but it was the study
of this exceedingly simple fact and its comparison with the astronomical
material which brought forth mechanics. The sound procedure (in every science)
is to obtain first utmost precision and mastery in a limited field, and then to
proceed to another, somewhat wider one and so on".
These two quotes define fairly well the path that econophysics tries to
follow. They both insist on the fact that one should begin by focusing on
simple phenomena even if at first sight they have little practical implications.
Many scientists in their answer usually emphasize that what matters is more
the method of investigation than the phenomena by themselves. They stress
that the experimental methodology invented by physicists and chemists when
applied to the social sciences would mark a great progress. However, with
the benefit of insight, they realize that these answers may have appeared far
fetched and unconvincing. A better and more factual claim is to observe that
115
over the past century several of the most renowned economists and sociologists
were in fact econophysicists. Indeed, back in the nineteenth century, the only
way to get a decent mathematical training was to study astronomy, engineering,
mathematics or physics. When such people entered the social sciences, this
led to two kinds of approaches which we may designate as econophysics and
economathematics. Of course, if the economic discipline had been highly
successful, there would be little need for an alternative approach. However,
great doubts have been expressed by some of the most renowned economists
about the attainments of their discipline.
V. Leontief and A. Schwartz emphasized that the present organization
of economic research discourages observational research. In A. Schwartz's
words: "The main disincentive to improve the handling and use of data is that
the profession withholds recognition to those who devote their energies to
measurement. Someone who introduces an innovation in econometrics, by
contrast, will win plauditsʺ.
The assessment made by L. Summers in a paper published in 1991 is well
summarized by its title: "The scientific illusion of empirical macroeconomics".
M. Aoki and H. Yoshikawa point out that the representative agent as-
sumption which is supposed to provide a connection between micro- and
macroeconomics is fundamentally flawed because it neglects both social vari-
ability and stochastic fluctuations. It may be true that in recent years a greater
emphasis has been put on the issue of heterogeneity. Yet, is this the right
way to tackle the problem? A model is a simplification of reality anyway, so if
it is not tenable to use loosely defined representative agents, an alternative
solution may be to focus on sharply defined agent's attitudes. For instance,
whereas without further specification home buyers may not be well defined as
a useful category, the behavior of investors during the final phases of specu-
lative price peaks may be sufficiently recurrent to make up for a well defined
category.
(Adapted from [11])
Task 11. Read the text (Task 10) again and answer the questions.
1. What are the main emphases of two quotes?
2. What did the most renowned economists and sociologists do over the
past century?

116
3. What way was to study astronomy, engineering, mathematics or physics
in the nineteenth century?
4. What do M. Aoki and H. Yoshikawa point out?
5. How is M. Aoki and H. Yoshikawa's model referred to?
Task 12. Describe the main idea of the text (Task 10).
Focus on Vocabulary
Task 13. Find synonyms for the words in the table below.
1) prediction
2) exception
3) dispense
4) prominent
5) solve
6) establish
7) integration
8) observe
9) intensive
10) fluctuation
Task 14. Complete the text with the following words and phrases:
row, outcomes, filled, sits, continues, strategic, concept, complex, know-
ledge, occasionally, wave, outstanding.
How ABMS Works
So how does ABMS work? Imagine a trip to the sports stadium during
a major event. The seats are 1 … with ten of thousands of fans. As part of the
fun, the fans start to form "waves" in the crowd. To start a 2 …, a row of fans
stands up quickly and then 3 … back down a moment later. The next 4 … of
fans starts to stand up a moment later and then sits down. The fun 5 … as
the following rows each stand up and sit down in turn. The individual people
are each simply standing up and sitting down 6 … . The group as a whole
117
forms a human wave that can sweep the entire stadium. Agent-based modeling
works by applying the 7 … of a wave in a crowd. Each person or agent makes
small, simple movements, but the group as a whole produces 8 … large-scale
results.
Applying this analogy, senior managers' knowledge of consumers,
employees, and business processes is their 9 … of the people forming the
wave in the crowd. The resulting wave represents the large-scale system
10 … that every leader needs to know about ahead of time. Knowing about
these outcomes and being able to relate them to their underlying causes can
lead directly to the discovery of innovative answers to 11 … questions. Thus,
with agent modeling, senior managers can use their knowledge of consumers,
employees, and business processes to discover 12 … solutions for their
enterprises.
(Adapted from [8])
Task 15. Read and complete the text below. For each of the spaces
(1 – 6) choose the correct answer (A, B, C or D).
Forecasting the Weather
Even with very powerful computers we all know that we cannot 1 … the
weather more than a few days in advance. Over just a few days forecasting
the weather still gives us 2 … surprises. This is because the 3 … which
govern the weather are nonlinear – they involve the 4 … multiplied together,
not just the variables themselves.
The theory behind the mathematics of weather forecasting was worked
out 5 … by the French engineer Claude Navier in 1821 and the British
mathematical physicist George Gabriel Stokes in 1845. The Navier – Stokes
equations that resulted are of 6 … interest to scientists. The Clay Mathematics
Institute in Cambridge, Massachusetts has offered a million dollar prize to
whoever makes 7 … progress towards a mathematical theory that unlocks
their secrets. Applied to the problem of fluid 8 …, much is known about the
steady movements of the upper atmosphere. But air flow near the surface
of the Earth creates turbulence and chaos results, with the 9 … behaviour
largely unknown.
While a lot is known about the theory of linear systems of equations, the
Navier – Stokes equations 10 … nonlinear terms which make them intractable.
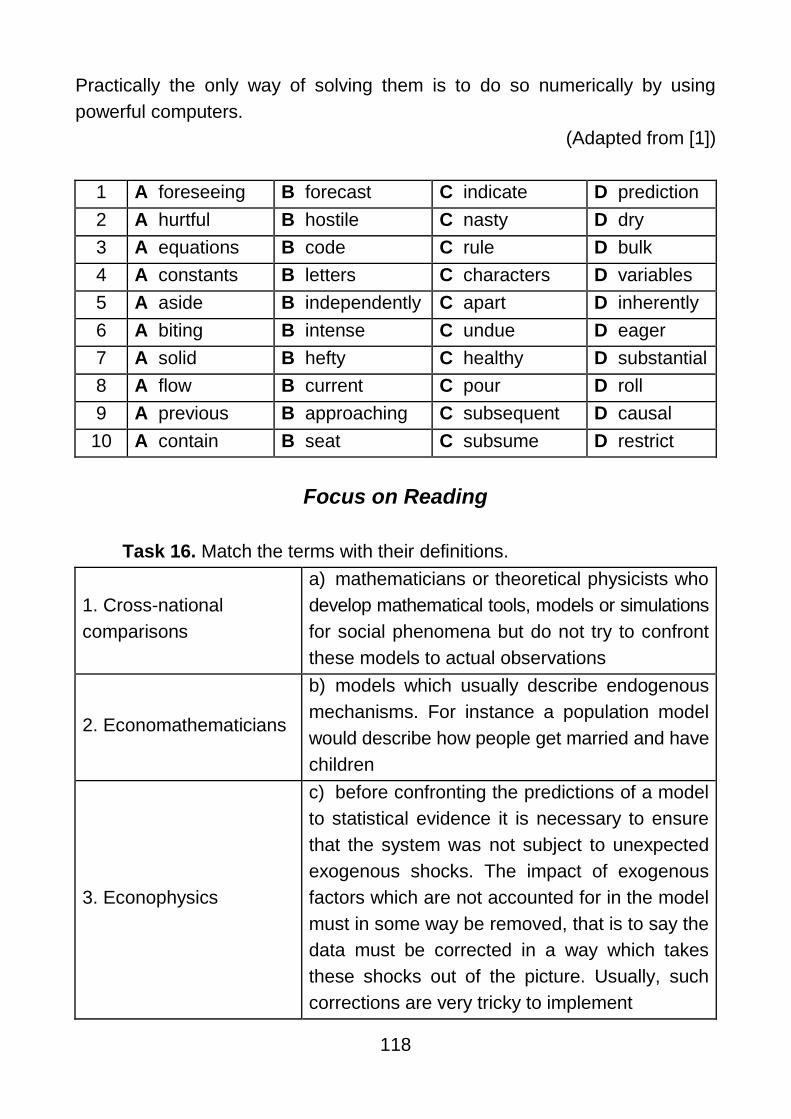
118
Practically the only way of solving them is to do so numerically by using
powerful computers.
(Adapted from [1])
1 A foreseeing B forecast C indicate D prediction
2 A hurtful B hostile C nasty D dry
3 A equations B code C rule D bulk
4 A constants B letters C characters D variables
5 A aside B independently C apart D inherently
6 A biting B intense C undue D eager
7 A solid B hefty C healthy D substantial
8 A flow B current C pour D roll
9 A previous B approaching C subsequent D causal
10 A contain B seat C subsume D restrict
Focus on Reading
Task 16. Match the terms with their definitions.
1. Cross-national
comparisons
a) mathematicians or theoretical physicists who
develop mathematical tools, models or simulations
for social phenomena but do not try to confront
these models to actual observations
2. Economathematicians
b) models which usually describe endogenous
mechanisms. For instance a population model
would describe how people get married and have
children
3. Econophysics
c) before confronting the predictions of a model
to statistical evidence it is necessary to ensure
that the system was not subject to unexpected
exogenous shocks. The impact of exogenous
factors which are not accounted for in the model
must in some way be removed, that is to say the
data must be corrected in a way which takes
these shocks out of the picture. Usually, such
corrections are very tricky to implement
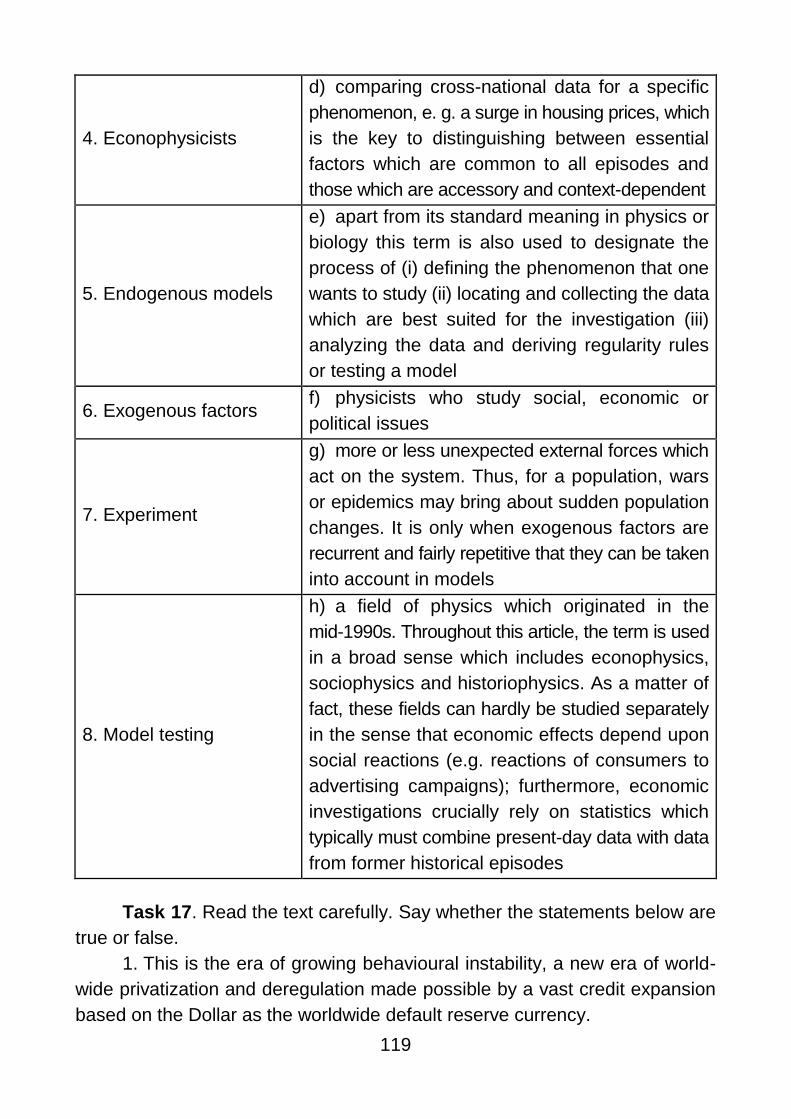
119
4. Econophysicists
d) comparing cross-national data for a specific
phenomenon, e. g. a surge in housing prices, which
is the key to distinguishing between essential
factors which are common to all episodes and
those which are accessory and context-dependent
5. Endogenous models
e) apart from its standard meaning in physics or
biology this term is also used to designate the
process of (i) defining the phenomenon that one
wants to study (ii) locating and collecting the data
which are best suited for the investigation (iii)
analyzing the data and deriving regularity rules
or testing a model
6. Exogenous factors f) physicists who study social, economic or
political issues
7. Experiment
g) more or less unexpected external forces which
act on the system. Thus, for a population, wars
or epidemics may bring about sudden population
changes. It is only when exogenous factors are
recurrent and fairly repetitive that they can be taken
into account in models
8. Model testing
h) a field of physics which originated in the
mid-1990s. Throughout this article, the term is used
in a broad sense which includes econophysics,
sociophysics and historiophysics. As a matter of
fact, these fields can hardly be studied separately
in the sense that economic effects depend upon
social reactions (e.g. reactions of consumers to
advertising campaigns); furthermore, economic
investigations crucially rely on statistics which
typically must combine present-day data with data
from former historical episodes
Task 17. Read the text carefully. Say whether the statements below are
true or false.
1. This is the era of growing behavioural instability, a new era of world-
wide privatization and deregulation made possible by a vast credit expansion
based on the Dollar as the worldwide default reserve currency.
120
2. Standard economic theory completely includes the possibility of such
instability.
3. On the gold standard, hedging foreign currency bets apparently was
necessary.
4. Standard microeconomic theory is based on a deterministic equilibrium
model, called neo-classical economics.
5. Standard macroeconomics is based on the assumption of changing
and therefore unstable economic variables.
6. Regression analysis is based on the assumption of stationary noise,
but there is solid empirical evidence for stationarity of any kind in any known
market.
7. Neo-classical economists try to model human preferences using a priori
models of behavior that have been falsified.
8. More recent work in both econophysics and economics uses agent-based
modeling, which is like trying to replace thinking, hopeful, and fearful agents
with unfixed rules obeyed by spins on a lattice.
9. Wigner has explained the basis for the discovery of mathematical
laws of motion in local invariance principles.
10. "Stylized facts" are supposed to be certain features of the data.
11. Falsifiable models have free parameters to tweak that would make
a wrong model fit adequate data.
Why Econophysics?
This is the era of growing financial instability, a new era of worldwide
privatization and deregulation made possible by a vast credit expansion based
on the Dollar as the worldwide default reserve currency. Derivatives are un-
regulated and are used as a form of money creation totally beyond the control
of any central bank. Standard economic theory completely rules out the pos-
sibility of such instability.
Before WWII, the expansion of a currency and consequent inflation was
not possible with the Dollar regulated by gold at $35/oz. The gold standard
was finally and completely abandoned by the USA in 1971 after "Eurodollars"
became on the order of magnitude of the US gold supply. On the gold stan-
dard, hedging foreign currency bets apparently was not necessary. We can
date our present era of inflation, credit, and high level of consumption with
increasing finance market instability from the deregulation of the Dollar in 1971,
121
and it's not accidental that both the Black – Scholes derivatives model and
the legalization of large-scale options trading both date from 1973.
Standard microeconomic theory is based on a deterministic equilibrium
model, called neo-classical economics, where perfect knowledge of the infi-
nite future is assumed on the part of all players. That an equilibrium exists
mathematically under totally unrealistic conditions has been proven, but that
the hypothetical equilibrium is stable (or computable) or has anything at all
to do with reality was never demonstrated. The generalization of the neo-
classical model to uncertain but still hypothetically stable markets assumes
a stationary stochastic process, and is called ʺrational expectationsʺ. Standard
macroeconomics is based on the assumption of stationary and therefore
stable economic variables. Rational expectations emerged as the dominant
economic philosophy parallel to deregulation in the 1970s and 1980s, with
regression analysis as the tool of choice for modeling. Regression analysis is
based on the assumption of stationary noise, but there is no solid empirical
evidence for stationarity of any kind in any known market. The only scientific
alternative is to approach markets as a physicist, and ask the market data
what are the underlying unstable dynamics.
Neo-classical economists try to model human preferences using a priori
models of behavior (utility maximization) that have been falsified. More recent
work in both econophysics and economics uses agent-based modeling, which
is like trying to replace thinking, hopeful, and fearful agents with fixed rules
obeyed by spins on a lattice.
The history of physics shows that mathematical law cannot be discovered
from empirical data unless something is repeated systematically. Wigner has
explained the basis for the discovery of mathematical laws of motion in local
invariance principles. But the method of the natural sciences cannot be found
in standard economic theorizing and data analysis. In financial economics,
where no correct dynamical model has been discovered, the term ʺstylized
factsʺ appears. ʺStylized factsʺ are supposed to be certain statistical features
of the data. But even there, certain hidden assumptions in statistical analysis
have implicitly and unquestionably been taken for granted without checking
for their validity.
Science consists of falsifiable propositions and theories. Falsifiable models
have no free parameters to tweak that would make a wrong model fit ade-
quate data (data with enough points for "good statistics"). A falsifiable model
is specified completely by empirically measurable parameters so that, if the

122
model is wrong, then it can be proven wrong via measurement. The basis for
the statistical ensemble is an observed repetitiveness in traders' behavior on
a daily time scale.
(Adapted from [8])
Task 17. Read the text (Task 16) again and answer the questions.
1. What kind of era is this?
2. What was not possible before WWII?
3. What happened to the gold standard in 1971?
4. What is standard microeconomic theory based on?
5. What is standard macroeconomics based on?
6. What do neo-classical economists try to do?
Task 18. Read the text (Task 16) and make a list of economic changes
over the last centuries. Then discuss them with your partner.
Task 19. Read the text and make a list of advantages and disadvantages
of using statistical analysis in economics. Then discuss the answers with your
partner.
Focus on Vocabulary
Task 20. Read and complete the text. For each of the empty spaces
(1 – 8) choose the correct answer (A, B, C or D).
Origins of Econophysics
Clearly, econophysics should not try to imitate academic economic
theory, nor should econophysics 1 … on standard econometric methods. We
are not trying to make incremental improvements in theory, we are trying
instead to replace the standard models and methods with entirely new results.
Econophysics began in this spirit in 1958 with M. F. M. Osborne's 2 … of
Gaussian stock market returns (the lognormal pricing model), Mandelbrot's
emphasis on Martingales for describing hard-to-beat markets, and then Osborne's
falsification in 1977 of the supply-demand curves. From the practical side,
a supply-demand mismatch of physics PhDs to academic jobs, and new 3 …
opportunities in practical finance, drew many physicists to "Wall Street".

123
Physics 4 … had exploded in America after Sputnik was launched by the
USSR in October, 1957, but had tapered off by 1971, when academic jobs in
physics began to dry up. In 1973 the Black – Scholes theory of option pricing
was finally published after a struggle of several years against editors who
5 … that finance wasn't economics, and large-scale options trading was
legalized at the same time. The advent of deregulation as a 6 … government
philosophy in the 1980s, the collapse of the USSR in 1989 – 1991, and the
explosion of computing technology in the 1980s all played 7 … roles in the
globalization of capital. With computerization, finance data became more
accurate and more reliable than fluid turbulence data, inviting physicists to
build falsifiable finance models. All of these developments opened the door to
the globalization of trade and capital and led to a 8 … on modeling and data
analysis in finance that many physicists have found to be either interesting or
lucrative.
(Adapted from [6])
1 A rely B allocate C desire D believe
2 A feeling B luck C discovery D gear
3 A quest B research C explore D view
4 A stake B income C funding D funds
5 A repeat B hold C insisted D advised
6 A dominant B overbalancing C chief D private
7 A accurate B modify C ruling D determining
8 A claim B demand C prayer D liking
Task 21. Read and complete the text (Task 20). For each of the empty
spaces (9 – 18) choose the correct answer from the following words:
globalization, explosion, improvements, struggle, legalized, curves,
physicists, returns, reliable, econometric.
Task 22. Read the texts below. Match choices (A – I) to (1 – 7). There
are two choices you do not need to use.
A New Direction in Econophysics
Since the word was coined by Gene Stanley in 1995, the term
"econophysics" 1 … by three main directions, not necessarily mutually exclusive.
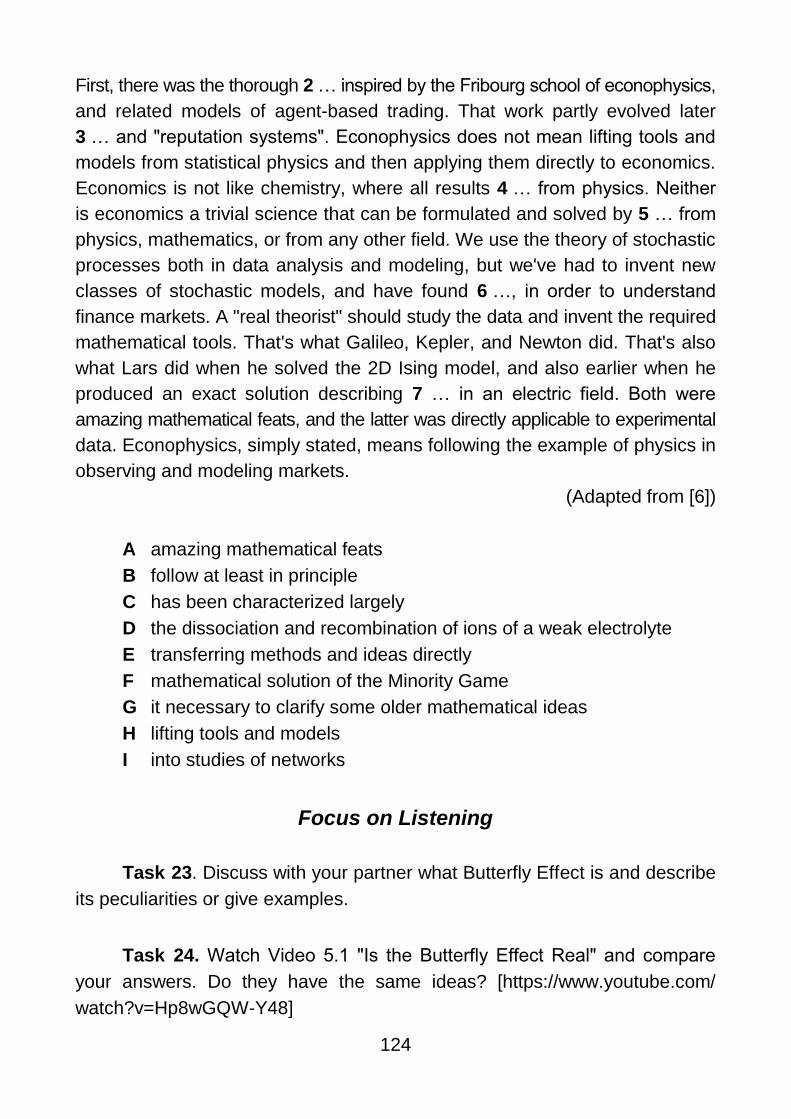
124
First, there was the thorough 2 … inspired by the Fribourg school of econophysics,
and related models of agent-based trading. That work partly evolved later
3 … and "reputation systems". Econophysics does not mean lifting tools and
models from statistical physics and then applying them directly to economics.
Economics is not like chemistry, where all results 4 … from physics. Neither
is economics a trivial science that can be formulated and solved by 5 … from
physics, mathematics, or from any other field. We use the theory of stochastic
processes both in data analysis and modeling, but we've had to invent new
classes of stochastic models, and have found 6 …, in order to understand
finance markets. A "real theorist" should study the data and invent the required
mathematical tools. That's what Galileo, Kepler, and Newton did. That's also
what Lars did when he solved the 2D Ising model, and also earlier when he
produced an exact solution describing 7 … in an electric field. Both were
amazing mathematical feats, and the latter was directly applicable to experimental
data. Econophysics, simply stated, means following the example of physics in
observing and modeling markets.
(Adapted from [6])
A amazing mathematical feats
B follow at least in principle
C has been characterized largely
D the dissociation and recombination of ions of a weak electrolyte
E transferring methods and ideas directly
F mathematical solution of the Minority Game
G it necessary to clarify some older mathematical ideas
H lifting tools and models
I into studies of networks
Focus on Listening
Task 23. Discuss with your partner what Butterfly Effect is and describe
its peculiarities or give examples.
Task 24. Watch Video 5.1 ʺIs the Butterfly Effect Realʺ and compare
your answers. Do they have the same ideas? [https://www.youtube.com/
watch?v=Hp8wGQW-Y48]

125
Task 25. Complete the sentences, then watch Video 5.1 (Task 24) again
and check them.
1. That's the butterfly effect which does have a scientific name: ʺ…ʺ.
2. At the time mathematicians thought, …, it would only change a little
at the end.
3. It was logical, but these ʺsystemsʺ don't behave that way, and we
needed … to understand why! In walks: Chaos Theory.
4. Chaos Theory, by definition, deals with ʺ… whose behavior is highly
sensitive to slight changes in conditionsʺ.
5. Chaos Theory was groundbreaking when it was discovered, because
it …!
6. Basically, if we …, we should understand everything in the universe
too, right?
7. Wrong. Because even a tiny change in something with as many
moving parts as … .
8. The universe is not random, …, rules which mathematicians have
worked on understanding for centuries.
9. The …, the better handle we will have to predict how a complex
system will react to tiny changes.
10. When you think of the butterfly effect, what should you think of? … .
Task 26. Discuss with your partner the main idea of the Butterfly Effect
and how Chaos Theory refers to it.
Focus on Speaking
Task 27. Read the beginning of the statements and finish them. Then
discuss them with your partner.
1. Theorizing in economics as in other sciences starts with … .
2. The theorist is forced to show that the conclusions and … .
3. The use of mathematics in economics … .
4. The idea behind computational intelligence is basically to model … .
5. Modeling intelligence observed from natural behavior often leads us
to … .
6. M. Aoki and H. Yoshikawa point out that the representative agent
assumption which is supposed to provide … .
126
7. Standard microeconomic theory is based on … .
8. Standard macroeconomics is based on … .
9. Neo-classical economists try to model human preferences using … .
10. Science consists of falsifiable … .
11. Chaos Theory, by definition, deals with … .
Task 28. Work in pairs and discuss the concepts and theories of
mathematical economics. Make a list of their advantages and disadvantages
and compare with other students.
Focus on Problems and Questions
Task 29. Read the text and answer the questions below. Then discuss
them with your partner.
Margie Smith likes to have all of her ducks in a row. She believes that
good order indicates good leadership. Her office is clean and orderly, and her
life is highly structured. Margie hates when people clutter up their lives and
are unable to think logically or act rationally. She works hard to make sure
that her staff know what she expects and do everything as she thinks it
should be done. Recently, though, the pace of change has picked up, and
new programs and technologies are being implemented faster than Margie
can handle. She has become less orderly, less comfortable, and, at times, short
with staff. She occasionally speaks negatively about some of the changes,
she has asked her supervisor whether the rate of change could be decreased,
and she has even begun to think about looking for another job, one that
would give her more control.
1. What does Margie need to do to cope better?
2. What changes should she make in her role as leader?
3. What is the chaos she is experiencing trying to tell her?
4. Is changing jobs going to be an effective solution to her current dis-
comfort?
Focus on Self-Assessment
Task 5.1. Read the texts below. Match choices (A – D) to (1 – 3). There
are two choices you do not need to use.

127
1. …
The free pendulum is one of the simplest mechanical systems to analyze.
As the pendulum swings back and forth, it gradually loses energy. This is not
the case for the double pendulum in which the bob is at the end of a jointed
pair of rods. If the displacement is small, the motion of the double pendulum
is similar to the simple pendulum, but if the displacement is large, the bob
swings, rotates, and lurches about and the displacement about the intermediate
joint is seemingly random. If the motion is not forced, the bob will also come
to rest but the curve that describes its motion is far from the well- behaved
spiral of the single pendulum.
2. …
Dynamic systems can be thought of possessing ʺattractorsʺ in their phase
diagrams. In the case of the simple pendulum, the attractor is the single point
at the origin that the motion is directed towards. With the double pendulum it's
more complicated, but even here the phase portrait will display some regularity
and be attracted to a set of points in the phase diagram. For systems like this
the set of points may form a fractal which is called a ʺstrangeʺ attractor that
will have a definite mathematical structure. So all is not lost. In the new chaos
theory, it is not so much ʺchaoticʺ chaos that results as "regular" chaos.
3. …
The discovery of the butterfly effect happened by chance around 1961.
When meteorologist Edward Lorenz at MIT went to have a cup of coffee and
left his ancient computer plotting away, he came back to something unexpected.
He had been aiming to recapture some interesting weather plots but found
the new graph unrecognizable. This was strange for he had entered in the
same initial values and the same picture should have been drawn out. Was it
time to trade in his old computer and get something more reliable?
After some thought he did spot a difference in the way he had entered
the initial values: before he had used six decimal places but on the rerun he
only bothered with three. To explain the disparity he coined the term ʺbutterfly
effectʺ. After this discovery his intellectual interests migrated to mathematics.
(Adapted from [1])
A Standard microeconomic
B Strange attractors
C From meteorology to mathematics
128
D A simple pendulum
E Modeling intelligence
Task 5.2. Read the text below. Match choices (A – I) to (4 – 10). There
are two choices you do not need to use.
Fractals
In March 1980, the state-of-the-art mainframe computer at the IBM
research centre at Yorktown Heights, New York State, was 4 … Tektronix
printing device. It dutifully struck dots in curious places on a white page, and
when it had stopped its clatter the result looked like a handful of dust smudged
across the sheet. Benoit Mandelbrot rubbed his eyes in disbelief. He saw it
was important, but what was it? The image that slowly appeared before him
was like 5 … from a photographic developing bath. It was a first glimpse of
that icon in the world of fractals – the Mandelbrot set.
This was experimental mathematics par excellence, an approach to the
subject in which 6 … just like the physicists and chemists. They too could
now do experiments. New vistas opened up – literally. It was a liberation from
the arid climes of "definition, theorem, proof", though a return to 7 … would
have to come albeit later.
The downside of this experimental approach was that 8 … preceded
a theoretical underpinning. Experimentalists were navigating without a map.
Although Mandelbrot coined the word ʺfractalsʺ, what were they? Could there
be 9 … in the usual way of mathematics? In the beginning, Mandelbrot didn't
want to do this. He didn't want to 10 … by honing a sharp definition which
might be inadequate and limiting. He felt the notion of a fractal, ʺlike a good
wine – demanded a bit of aging before being "bottledʺ.
(Adapted from [1])
A the visual images
B issuing its instructions to an ancient
C the rigours of rational argument
D a first glimpse of that icon in the world of fractals
E the black and white print emerging
F felt the notion of a fractal
G mathematicians had their laboratory benches
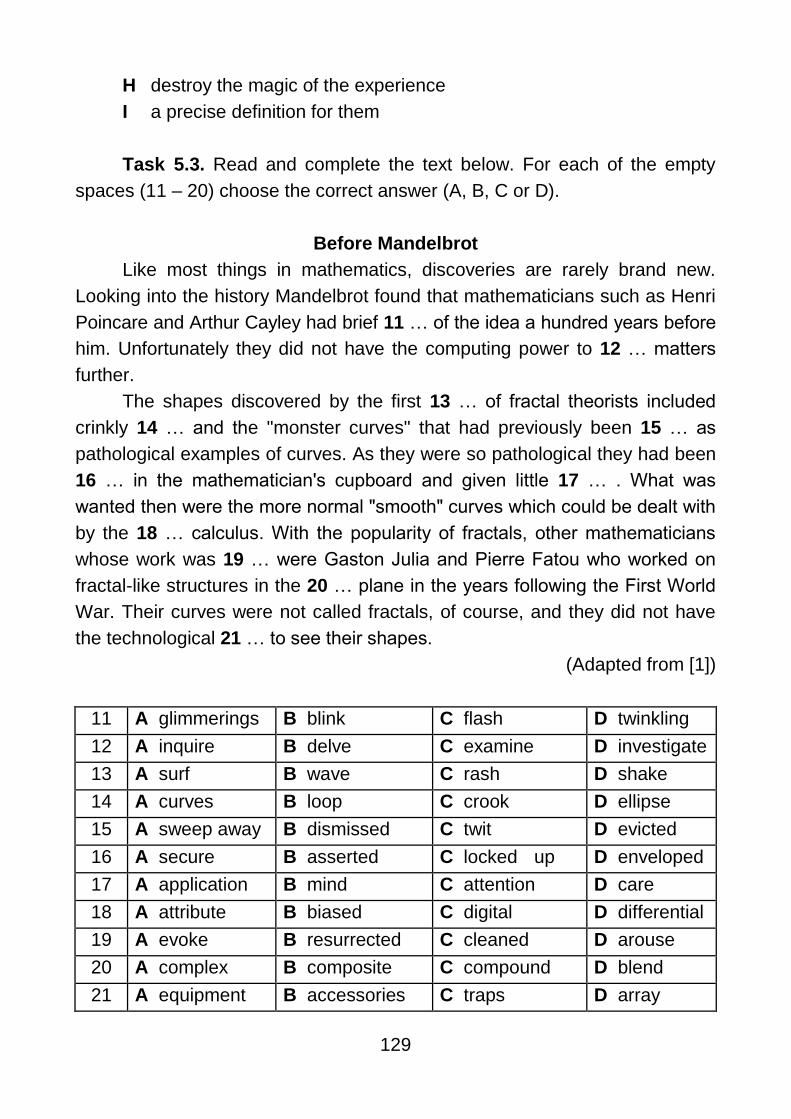
129
H destroy the magic of the experience
I a precise definition for them
Task 5.3. Read and complete the text below. For each of the empty
spaces (11 – 20) choose the correct answer (A, B, C or D).
Before Mandelbrot
Like most things in mathematics, discoveries are rarely brand new.
Looking into the history Mandelbrot found that mathematicians such as Henri
Poincare and Arthur Cayley had brief 11 … of the idea a hundred years before
him. Unfortunately they did not have the computing power to 12 … matters
further.
The shapes discovered by the first 13 … of fractal theorists included
crinkly 14 … and the "monster curves" that had previously been 15 … as
pathological examples of curves. As they were so pathological they had been
16 … in the mathematician's cupboard and given little 17 … . What was
wanted then were the more normal ʺsmoothʺ curves which could be dealt with
by the 18 … calculus. With the popularity of fractals, other mathematicians
whose work was 19 … were Gaston Julia and Pierre Fatou who worked on
fractal-like structures in the 20 … plane in the years following the First World
War. Their curves were not called fractals, of course, and they did not have
the technological 21 … to see their shapes.
(Adapted from [1])
11 A glimmerings B blink C flash D twinkling
12 A inquire B delve C examine D investigate
13 A surf B wave C rash D shake
14 A curves B loop C crook D ellipse
15 A sweep away B dismissed C twit D evicted
16 A secure B asserted C locked up D enveloped
17 A application B mind C attention D care
18 A attribute B biased C digital D differential
19 A evoke B resurrected C cleaned D arouse
20 A complex B composite C compound D blend
21 A equipment B accessories C traps D array

130
Task 5.4. Read the text below. For each of the empty spaces (22 – 30)
choose the correct answer (A, B, C or D).
The Applications of Fractals
The potential for the applications of fractals 22 … wide. Fractals could
well 23 … the mathematical medium 24 … models such natural objects as
plant growth, or cloud formation.
Fractals 25 … to the growth of marine organisms such as corals and
sponges. The spread of modern cities 26 … to have a similarity with fractal
growth. In medicine they 27 … application in the modelling of brain activity.
And the fractal nature of movements of stocks and shares and the foreign
exchange markets 28 … . Mandelbrot's work 29 … a new vista and there is
much still to 30 … .
(Adapted from [1])
22 A is B are C were D being
23 A was B is C are D be
24 A where B which C what D when
25 A has applied B have already
been applied
C had applied D applied
26 A has show B have shown C has been shown D shows
27 A have finded B founds C is founding D have found
28 A had investi-
gated
B has also been
investigated
C have investi-
gated
D investigate
29 A opening up B have open up C opened up D open up
30 A be discovered B is discovered C was discovered D discovered
Task 5.5. Review questions. Give your answers to the questions. Then
check your answers with the information from the texts of this unit.
1. What is the role of mathematics in economics?
2. What is computational economics?
3. What way was to study astronomy, engineering, mathematics or physics
in the nineteenth century?
4. What is standard microeconomic theory based on?
5. What is standard macroeconomics based on?
Score: Tasks 5.1 – 5.4: 1 point per 1 question (30 points).
Task 5.5: 2 points per 1 question (correct answers make 10 points).
Total: 40 points.

131
Unit 6. Finance Mathematics
Task 1. Answer the questions.
1. What is the relation between money and mathematics? Give examples.
2. Does money depend on time? Explain your answer.
Task 2. Read the text and compare your answers with the information
in the text below.
Money Mathematics
Norman is a super salesperson when it comes to bikes. He also sees it
as his duty to get everyone on a bike, so he is delighted when a customer
comes into his shop and without any hesitation buys a bike for £99. The
customer pays for it with a cheque for £150, and as the banks are closed,
Norman asks his neighbour to cash it. He returns, gives his customer the
change of £51 who then rides off at speed. Calamity follows. The cheque
bounces, the neighbour demands his money back, and Norman has to go to
a friend to borrow the money. The bike originally cost him £79, but how much
did Norman lose altogether?
The concept of this little conundrum was proposed by the great puzzles-
mith Henry Dudeney. It is money mathematics of a sort, but more accurately
a puzzle connected with money. It shows how money depends on time and
that inflation is alive and well. Writing in the 1920s, Dudeney's bike actually
cost the customer £15. A way to combat inflation is through the interest on
money. This is the stuff of serious mathematics and the modern financial market
place.
(Adapted from [1])
Task 3. Match the words with the definitions and then find and underline
them in the text (Tasks 2).
1) calamity a) be returned by a bank when there are insufficient
funds to meet it
2) bounce b) a fight, conflict, or struggle
3) conundrum c) a disaster or misfortune, esp. one causing extreme
havoc, distress, or misery
4) combat d) a puzzling question or problem
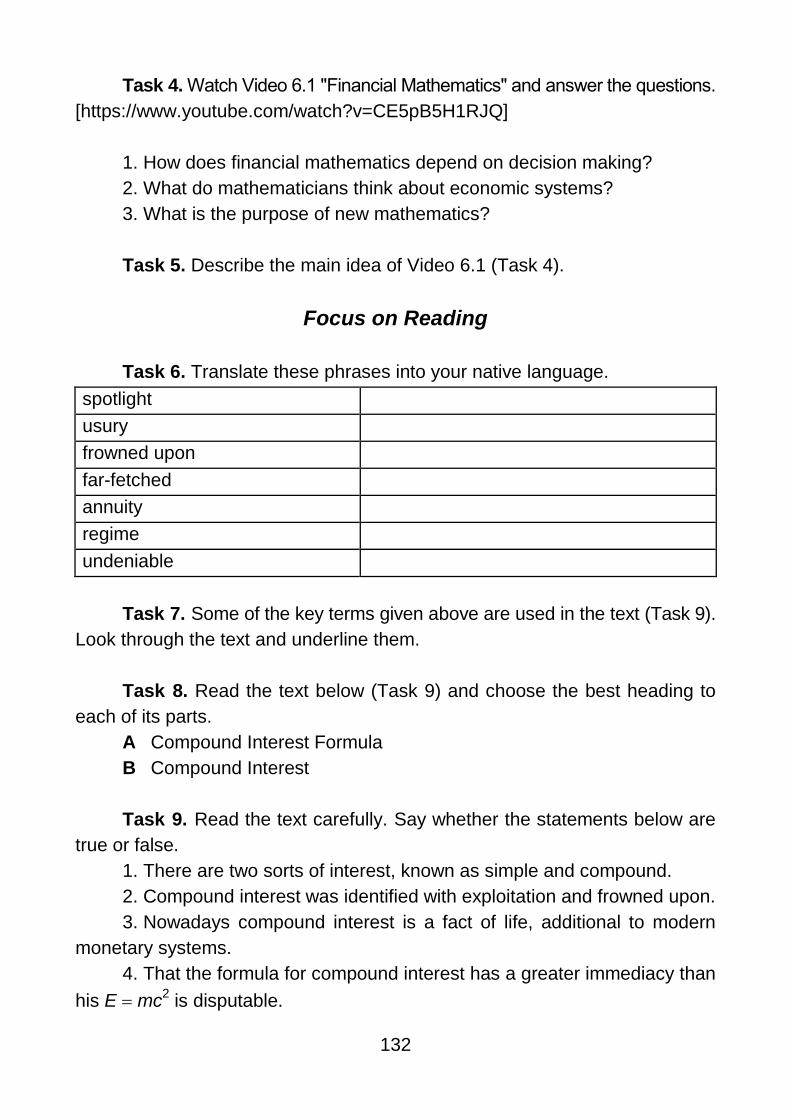
132
Task 4. Watch Video 6.1 ʺFinancial Mathematicsʺ and answer the questions.
[https://www.youtube.com/watch?v=CE5pB5H1RJQ]
1. How does financial mathematics depend on decision making?
2. What do mathematicians think about economic systems?
3. What is the purpose of new mathematics?
Task 5. Describe the main idea of Video 6.1 (Task 4).
Focus on Reading
Task 6. Translate these phrases into your native language.
spotlight
usury
frowned upon
far-fetched
annuity
regime
undeniable
Task 7. Some of the key terms given above are used in the text (Task 9).
Look through the text and underline them.
Task 8. Read the text below (Task 9) and choose the best heading to
each of its parts.
A Compound Interest Formula
B Compound Interest
Task 9. Read the text carefully. Say whether the statements below are
true or false.
1. There are two sorts of interest, known as simple and compound.
2. Compound interest was identified with exploitation and frowned upon.
3. Nowadays compound interest is a fact of life, additional to modern
monetary systems.
4. That the formula for compound interest has a greater immediacy than
his E mc2 is disputable.

133
5. The term P stands for principal (the money you save or borrow), i is
the percentage interest rate divided by 100 and n is the number of temporal
length of event.
6. Simon is not impressed but his money is already in the bank under
the simple interest regime.
7. To show the superiority of compound interest Simon starts to calculate
his own doubling period.
1. …
There are two sorts of interest, known as simple and compound. Let's
turn our mathematical spotlight onto two brothers, Compound Charlie and
Simple Simon. Their father gives them each £1000, which they both place in
a bank. Compound Charlie always chooses an account that applies compound
interest but Simple Simon is more traditional and prefers accounts that use
simple interest. Historically, compound interest was identified with usury and
frowned upon. Nowadays compound interest is a fact of life, central to modern
monetary systems. Compound interest is interest compounded on interest,
and that is why Charlie likes it. Simple interest does not have this feature and
is calculated on a set amount known as the "principal". Simon can understand
it easily, as the principal earns the same amount of interest each year.
niPA )( 1
2. …
When talking about mathematics, it is always good to have Albert Einstein
on side – but the widespread claim that he said compound interest is the
greatest discovery of all time is too far-fetched. That the formula for compound
interest has a greater immediacy than Einstein's E mc2 is undeniable. If you
save money, borrow money, use a credit card, take out a mortgage or buy
an annuity, the compound interest formula is in the background working for
(or against) you. What do the symbols stand for? The term P stands for principal
(the money you save or borrow), i is the percentage interest rate divided by
100 and n is the number of time periods.
Charlie places his £1000 in an account paying 7 % interest annually.
How much will accrue in three years? Here P 1000, i 0.07 and n 3.
The symbol A represents the accrued amount and by the compound interest
formula A £1225.04.
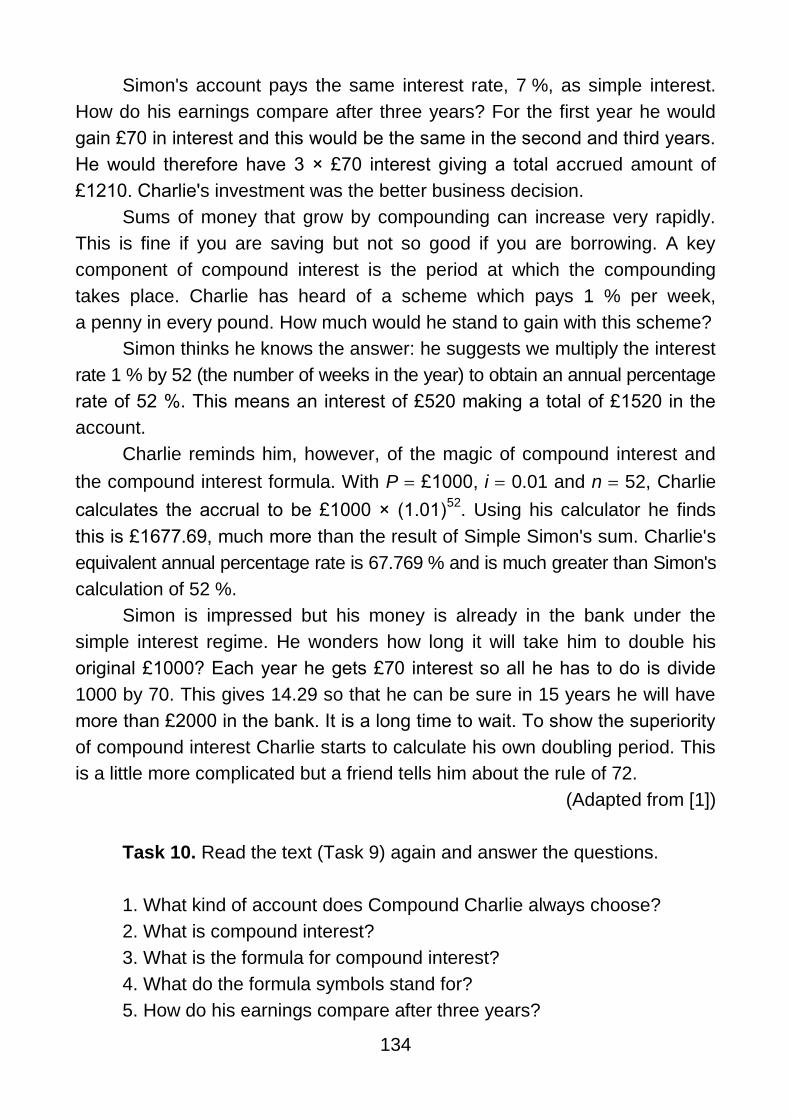
134
Simon's account pays the same interest rate, 7 %, as simple interest.
How do his earnings compare after three years? For the first year he would
gain £70 in interest and this would be the same in the second and third years.
He would therefore have 3 × £70 interest giving a total accrued amount of
£1210. Charlie's investment was the better business decision.
Sums of money that grow by compounding can increase very rapidly.
This is fine if you are saving but not so good if you are borrowing. A key
component of compound interest is the period at which the compounding
takes place. Charlie has heard of a scheme which pays 1 % per week,
a penny in every pound. How much would he stand to gain with this scheme?
Simon thinks he knows the answer: he suggests we multiply the interest
rate 1 % by 52 (the number of weeks in the year) to obtain an annual percentage
rate of 52 %. This means an interest of £520 making a total of £1520 in the
account.
Charlie reminds him, however, of the magic of compound interest and
the compound interest formula. With P £1000, i 0.01 and n 52, Charlie
calculates the accrual to be £1000 × (1.01)52
. Using his calculator he finds
this is £1677.69, much more than the result of Simple Simon's sum. Charlie's
equivalent annual percentage rate is 67.769 % and is much greater than Simon's
calculation of 52 %.
Simon is impressed but his money is already in the bank under the
simple interest regime. He wonders how long it will take him to double his
original £1000? Each year he gets £70 interest so all he has to do is divide
1000 by 70. This gives 14.29 so that he can be sure in 15 years he will have
more than £2000 in the bank. It is a long time to wait. To show the superiority
of compound interest Charlie starts to calculate his own doubling period. This
is a little more complicated but a friend tells him about the rule of 72.
(Adapted from [1])
Task 10. Read the text (Task 9) again and answer the questions.
1. What kind of account does Compound Charlie always choose?
2. What is compound interest?
3. What is the formula for compound interest?
4. What do the formula symbols stand for?
5. How do his earnings compare after three years?
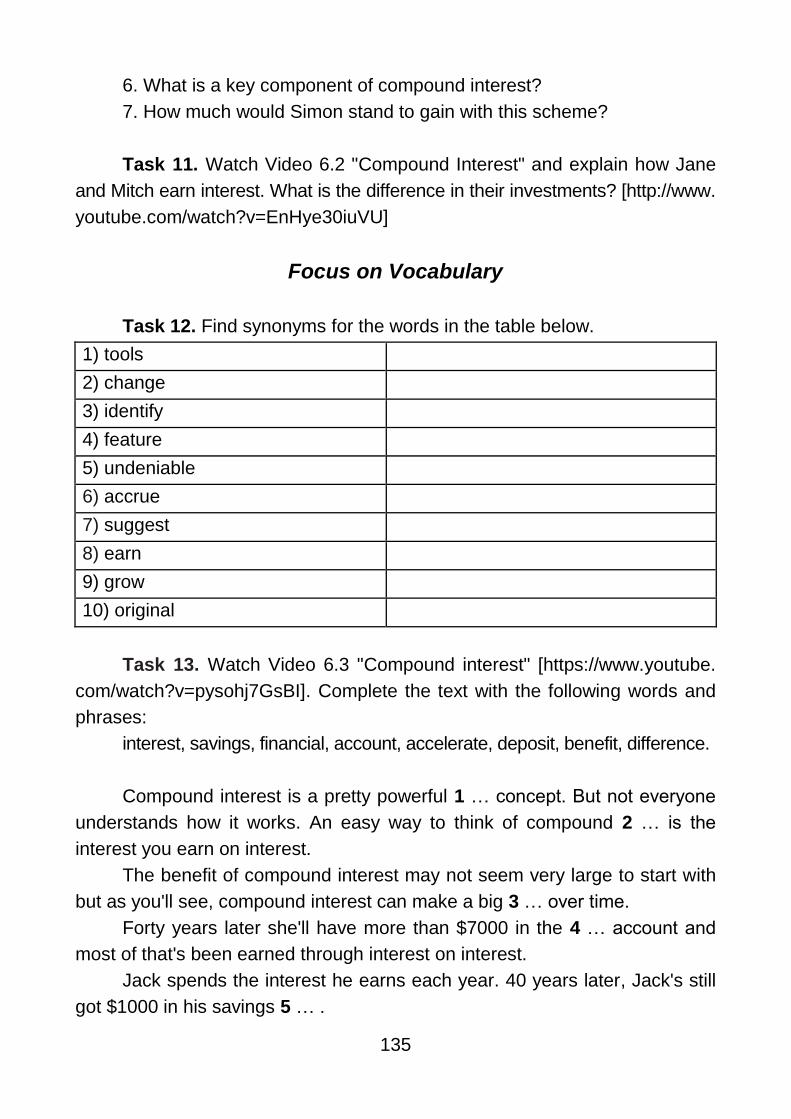
135
6. What is a key component of compound interest?
7. How much would Simon stand to gain with this scheme?
Task 11. Watch Video 6.2 "Compound Interest" and explain how Jane
and Mitch earn interest. What is the difference in their investments? [http://www.
youtube.com/watch?v=EnHye30iuVU]
Focus on Vocabulary
Task 12. Find synonyms for the words in the table below.
1) tools
2) change
3) identify
4) feature
5) undeniable
6) accrue
7) suggest
8) earn
9) grow
10) original
Task 13. Watch Video 6.3 "Compound interest" [https://www.youtube.
com/watch?v=pysohj7GsBI]. Complete the text with the following words and
phrases:
interest, savings, financial, account, accelerate, deposit, benefit, difference.
Compound interest is a pretty powerful 1 … concept. But not everyone
understands how it works. An easy way to think of compound 2 … is the
interest you earn on interest.
The benefit of compound interest may not seem very large to start with
but as you'll see, compound interest can make a big 3 … over time.
Forty years later she'll have more than $7000 in the 4 … account and
most of that's been earned through interest on interest.
Jack spends the interest he earns each year. 40 years later, Jack's still
got $1000 in his savings 5 … .

136
His initial 6 … has earned interest in that time, but unlike Kiri, he hasn't
benefitted from that interest compounding each year. That's the 7 … of compound
interest – the longer you save without spending the interest, the more you
benefit. And the benefits 8 … the longer you save.
Task 14. Read and complete the text below. For each of the empty
spaces (1 – 5) choose the correct answer (A, B, C or D). Then watch Video
6.3 "Compound interest" to check your answers.
Of course, if Jack and Kiri were able to regularly squirrel away more
1 … into their accounts an even larger sum of money would 2 … from
Compound interest. And don't forget, Compound 3 … also applies to debt
too, and certainly not in a good way. The longer you leave debt without 4 …
interest, the more interest it 5 …, and the bigger the debt burden becomes.
So to recap, Compound interest is a bit like supercharging your savings
because not only do you earn interest on the money you 6 …, but you also
earn interest on the interest you earn too. And the longer you save, the more
you benefit from compound interest.
1 Aprovisional B preservation C retaining D savings
2 Abenefit B help C worth D afford
3 Adiversion B benefit C interest D transform
4 Aproviding B paying C rewarding D summing
5 Aaccumulates B acquire C cash D profit
6 Astake B grounds C deposit D stash
Focus on Reading
Task 15. Read the text carefully. Say whether the statements below are
true or false.
1. For a given percentage rate, the rule of 72 is a rule of thumb for
estimating the number of periods required for money to halve.
2. To find the doubling period, all Charlie has to do is to multiply 72 by
the interest rate.
3. The calculation is 72 / 7 10.3, so Charlie can report to his brother
that his investment will double in 10 years, much quicker than Simon's 12.
137
4. Compound Charlie's father is so impressed by his son's good sense
that he takes him aside and says ʺI propose to give you £100,000ʺ. Charlie is
very sad.
5. The bank responds that time is money and £100,000 in ten years'
time is not the same as £100,000 now.
6. The bank believes that a growth rate of 12 % would give them a small
profit.
7. The compound interest formula cannot be applied to this problem
either.
8. Charlie is quite excited about this small figure, but he will still be able
to buy that new Porsche.
The Rule of 72
For a given percentage rate, the rule of 72 is a rule of thumb for
estimating the number of periods required for money to double. Though Charlie
is interested in years, the rule of 72 applies to days or month as well. To find
the doubling period, all Charlie has to do is to divide 72 by the interest rate.
The calculation is 72/7 10.3, so Charlie can report to his brother that his
investment will double in 11 years, much quicker than Simon's 15. The rule is
an approximation but it is useful where quick decisions have to be made.
Present value
Compound Charlie's father is so impressed by his son's good sense
that he takes him aside and says "I propose to give you £100,000". Charlie is
very excited. Then his father adds the condition that he will only give him the
£100,000 when he is 45 and that won't be for another ten years. Charlie is not
so happy.
Charlie wants to spend the money now but obviously he cannot. He
goes to his bank and promises them the £100,000 in ten years' time. The
bank responds that time is money and £100,000 in ten years' time is not the
same as £100,000 now. The bank has to estimate the size of investment now
that would realize £100,000 in ten years. This will be the amount they will
loan to Charlie. The bank believes that a growth rate of 12 % would give them
a healthy profit. What would be the amount now that would grow to £100,000
in ten years, at 12 % interest? The compound interest formula can be used
for this problem as well. This time we are given A £100,000 and have to
calculate P, the present value of A. With n 10 and i 0.12, the bank will be
prepared to advance Charlie the amount 100,000/1.1210 £32,197.32.
138
Charlie is quite shocked by this small figure, but he will still be able to buy
that new Porsche.
(Adapted from [1])
Task 16. Read the text (Task 15) again and answer the questions.
1. How does the rule of 72 work?
2. When is the rule 72 useful?
3. What is the condition of Charlie's father?
4. Why can Charlie not spend the money?
5. What would the amount be now to grow to £100,000 in ten years, at
12 % interest?
Task 17. Read the text (Task 15) and make a list of advantages and
disadvantages of the rule of 72. Then discuss it with your partner.
Focus on Vocabulary
Task 18. Complete the text with the following words and phrases:
compound interest, saving, pay off, annual, period, interest, money up,
calculated, hand over, payments.
How Can Regular Payments Be Handled
Now that Charlie' father has promised to give £100,000 to his son in ten
years' time, he has to save the 1 … . This he plans to do with a stream of
equal 2 … account payments made at the end of each year for ten years. By
the end of this 3 … he will then be able to 4 … the money to Charlie on the
day he has promised, and Charlie can hand the money to the bank to 5 …
the loan.
Regular payments formula:
i
iRS
n1
1
Charlie's father manages to find an account that allows him to do this,
an account that pays an 6 … interest rate of 8 % for the whole ten year term.
He gives Charlie the task of working out the annual payments. With the 7 …
formula Charlie was concerned with one payment (the original principal) but
139
now he is concerned with ten payments made at different times. If regular
8 … R are made at the end of each year in an environment where the 9 …
rate is i, the amount saved after n years can be 10 … by the regular
payments formula.
Charlie knows that S £100,000, n 10 and i 0.08 and calculates
that R £6902.95.
Task 19. Read the texts below. Match choices (A – I) to (1 – 7). There
are two choices you do not need to use.
Now that Charlie has his brand new Porsche, 1 …, he needs a garage
to put it in. He decides to 2 … for £300,000 to buy a house, a sum of money
he will pay back in a stream of 3 … over 25 years. He recognizes this as
a problem in which the £300,000 is the present value of 4 … to be made and
he calculates his annual payments with ease. His father is impressed and
5 … of Charlie's prowess. He has just been given a retirement lump sum of
£150,000 and wants to 6 … . "That's OK", says Charlie, "we can use the same
formula, as the mathematics is the same. Instead of the mortgage company
advancing me money that I 7 …, you are giving them the money and they are
making the regular payments to you".
A a stream of payments
B courtesy of the bank
C spend the money
D equal annual payments
E makes further use
F payments made at different times
G purchase an annuity
H repay in regular instalments
I take out a mortgage
Focus on Listening
Task 20. Discuss with your partner the ideas of investing myths.
Task 21. Watch Video 6.4 "Investing Myths" and compare your answers.
Do they have the same ideas? [https://www.youtube.com/watch?v=7fBJbXaGjQ0]

140
Task 22. Complete the sentences then watch Video 6.4 (Task 21) again
and check them.
1. Technology has completely changed the way information is 1 …, and
has allowed the average investor to instantly know more 2 … than at any
other time in history.
2. An educated investor must be able to 3 … information to make smarter
decisions.
3. The art of investing is primarily concerned with 4 … .
4. With skillful investing, one can 5 … when it comes to trends, patterns,
and laws of supply and demand.
5. They (money manager) cannot move your money as quickly as you
can, meaning they may be 6 … when the market changes.
6. With the tools and education available to the average retail investor,
you can learn to 7 … even more efficiently than professionals.
7. Investing without the right education is truly risky because in order to
balance risk and opportunity, you must be able to 8 … .
8. With proper training, investors can 9 … and lock in their gains.
9. Even if you manage to buy the stock at the right time, it is often more
important to know 10 … .
10. There's a theory that suggests it's possible to make money in the
stock market even when choosing stocks randomly if 11 … .
11. There is no correlation between high IQ and investment performance,
but it is true that 12 … can improve investors' chances.
12. Anyone can achieve their goals with the right plan. The key to over-
coming the fear of these myths is 13 … .
Task 23. Watch Video 6.4 again (Task 21), make a list of 6 myths and
disprove them according to the information from video 6.4. Give your examples
to prove your ideas.
Focus on Speaking
Task 24. Read the sentences and complete them. Then discuss the
answers with your partner.
141
1. The concept of this little conundrum shows how money depends
on … .
2. A way to combat inflation is through … .
3. The mathematics to describe what … .
4. There are two sorts of interest, known as … .
5. Compound interest is … .
6. If you save money, borrow money, use a credit card, take out a mortgage
or buy an annuity, the compound interest formula is … .
7. Compound interest is a bit like supercharging your savings because
not only you do earn interest on the money you deposit, but you also …. .
8. Technology has completely changed the way information is transmitted,
and has allowed the average investor to … .
9. With skillful investing, one can reliably predict outcomes when it comes
to … .
10. With the tools and education available to the average retail investor,
you can learn to … .
11. Even if you manage to buy the stock at the right time, it is often
more important to … .
12. The rewards of learning a skill that you can use for … .
Task 25. Make a list of advantages and disadvantages of applying
mathematics to finance and then compare it with other students' lists.
Focus on Problems and Questions
Task 26. Read the text and answer the questions or fulfil the tasks
below. Then discuss them with your partner.
Thomas Lennon, Actor and Entrepreneur
Although comedy may look like all fun and games, making movies in
Hollywood is serious business. Few people understand this as well as
Thomas Lennon. Although best known for his starring role in the Comedy
Central series Reno 911, Lennon does his most lucrative work off-screen.
He and his writing partner, Robert Ben Garant, have penned the screenplays
to a number of blockbuster movies, including the Night at the Museum series.

142
Staying successful in the writing business is a tough task. There's lots
of competition, and few writers ever sell enough work to make a living. Some
movie and TV writers work on teams for big studios. For instance, late night
talk show hosts like Jimmy Fallon have writing staffs to pen jokes and sketches
for each episode. While these writers receive a steady paycheck, there are
also limitations to their work. After all, if one writer comes up with something
especially brilliant, she doesn't receive anything more than her standard salary.
The most successful players in entertainment take control of their work
so that they can reap the most benefit from their efforts. Lennon set off on
this particular path at a young age. While a student at New York University,
he joined a comedy troupe that quickly gathered a dedicated following. Within
a few years the team had struck a deal with MTV to create their own show.
Called The State, this short-lived but critically acclaimed series taught Lennon
the value of creating his own projects.
This entrepreneurial outlook allows Lennon almost total freedom in his
work, but it presents a number of risks as well. He launched a few failed TV
projects before he managed to find the right formula with Reno 911. Movie-
making presents even more challenges than TV. In fact, Lennon had to shut
down production on a film for nearly two years due to the writers' union strike
of 2007 – 2008. As a result, that movie has never been released. Being an
entrepreneur means not only taking risks, but enduring setbacks as well.
For those who work in Hollywood, creators must also be able to respond
to changing tastes, technological advances, and drastic budget cuts. They
must also know how to appeal to global audiences. Writers like Lennon have
to be mindful not to focus jokes or characters on very limited cultural ideas.
Instead, making characters broad and themes universal makes their film ac-
cessible to a wider audience. And that makes it more profitable to a studio.
Lennon proved he could do that. In fact, the original Night at the Museum played
in over 70 countries, earning huge box office numbers from the Americas to
Australia, from Europe to Southeast Asia.
The film was so successful that it spawned a sequel, Night at the
Museum: Battle of the Smithsonian, which did even more business. The two
films combined brought in nearly $1 billion at the box office, to say nothing of
DVD sales and merchandising revenue. In fact, a third film is likely to push
Tom's career box office haul to more than $2 billion, making him only the
sixth writer to achieve that feat. With his relentlessly creative mind and
143
entrepreneurial drive, Lennon stands to be a major force in the entertainment
industry for some time to come.
(Adapted from [7])
1. What are the risks and benefits of becoming an entrepreneur as
opposed to working for others?
2. Why is the writing profession especially risky for entrepreneurs like
Tom Lennon?
3. Does the entertainment industry seem like a stable option for aspiring
entrepreneurs to pursue?
Focus on Self-Assessment
Task 6.1. Read the jumbled text below and arrange the extracts in the
correct order. Match choices (A – E) to (1 – 5).
1. …
2. …
3. …
4. …
5. …
A. That's usually not the case in a real bank; you would probably com-
pound continuously, but I'm just going to keep it a simple example, compounding
annually. There are other videos on compounding continuously. This makes
the math a little simpler.
B. That was, you can imagine, your deposit entering your second year,
then you get plus 10 % on that, not 10 % on your initial deposit. That's why
we say it compounds. You get interest on the interest from previous years. So
110 plus now $11. Every year the amount of interest we're getting, if we don't
withdraw anything, goes up.
C. What I want to do in this video is talk a little bit about compounding
interest and then have a little bit of a discussion of a way to quickly, kind of an
approximate way, to figure out how quickly something compounds. Then we'll
actually see how good of an approximation this really is. Just as a review,
let's say I'm running some type of a bank and I tell you that I am offering 10 %
interest that compounds annually.

144
D. Now we have $121. I could just keep doing that. The general way to
figure out how much you have after, let's say n years is to multiply it. I'll use
a little bit of algebra here. Let's say this is my original deposit, or my principle,
however you want to view it. After x years, so after one year you would just
multiply it ...
E. All that means is that let's say today you deposit $100 in that bank
account. If we wait one year, and you just keep that in the bank account, then
you'll have your $100 plus 10 % on your $100 deposit. 10 % of 100 is going
to be another $10. After a year you're going to have $110. You can just say
I added 10 % to the 100. After two years, or a year after that first year, after
two years, you're going to get 10 % not just on the $100, you're going to get
10 % on the $110. 10 % on 110 is you're going to get another $11, so 10 %
on 110 is $11, so you're going to get 110 ...
Task 6.2. Read the text below. Match choices (A – I) to (6 – 12). There
are two choices you do not need to use.
Even more, let's say I were to ask you how long does it 6 …? If you
were to just use this math right here, you'd have to say, gee, to double my
money I would have to start with $100. I'm going to 7 …, let's say whatever,
let's say it's a 10 % interest, 1.1 or 1.10 8 …, to the x is equal to ... .
Well, I'm going to double my money so it's going to have to equal $200.
Now I'm going to have to solve for x and I'm going to 9 … here. You can
divide both sides by 100. You get 1.1 to the x is equal to 2. I just 10 … 100.
Then you could take the logarithm of both sides base 1.1, and you get x.
I'm showing you that this is 11 … .
You get x is equal to log base 1.1 of 2. Most of us cannot do this in our
heads. Although the idea's simple, how long will it take for me to double my
money, to actually solve it to get the exact answer, is not an easy thing to do.
You can just keep, if you have a simple calculator, you can 12 … until you get
a number that's close, but no straightforward way to do it. This is with 10 %.
If we're doing it with 9.3 %, it just becomes even more difficult.
A keep incrementing the number of years
B divided both sides by
C take to double your money
145
D have to do some logarithms
E figure out how quickly something compounds
F complicated on purpose
G multiply that times
H a year after that first year
I depending on how you want to view it
P.S. You can watch Video 6.5 "Compound Interest. Introduction. Interest
and debt. Finance & Capital Markets Khan Academy" [http://www.youtube.com/
watch?v=Rm6UdfRs3gw] to check your answers.
Task 6.3. Read and complete the text below. For each of the empty
spaces (13 – 22) choose the correct answer (A, B, C or D).
To see how to use it, consider a common situation like this. Suppose
that I know that I can earn interest on any of three 13 … investments. One
earns interest at 4 % per year, another earns at 6 % per year, and another
earns it at 9 % a year. Well, I know that 9 % is higher than 6 or higher than 4,
but to really make 14 … of the numbers, I need to make the 15 … of rates
more relatable in real world. And one way for me to do that is to ask just how
long would it take me to double my money under any of the either three
16 … . Now, without turning on Excel or opening up a calculator app, I could
tell you right away that my money will double in 18 years if I 17 … at 4 %.
It'll double in 12 years if I invest at 6 %. And it will double in 8 years if invest
at 9 %. Now, right away I can see that the 6 % rate doubles my money a full
6 years earlier than the 4 % rate. And that really helps me get a feel for the
difference of the options. And that feel is really, really important.
What's more, I can handle just about any other 18 … of 19 … quickly
and compare them to any other options I have. I'll give you another example.
Suppose I had an option to invest in a 20 … investment and earn 3 % interest
per year or 4 % interest per year. That's a pretty low rate for both of them.
And you might think that small difference doesn't matter. But let's go 21 …
and ask our doubling question again. I can immediately do the math and tell
you right away that my money will double in 18 years at the 4 % rate and it
will double in 24 years at the 3 % rate. It's a small difference in rates. But it
takes a full 6 years more to double my money at 3 % than it does at 4 %. And
146
that really helps make it clear that over a 22 … time horizon, like saving for
college or saving for your retirement, paying attention to a 1 % difference in
rates really, really matters.
13 A potential B possibility C probable D reachable
14 A feel B sense C wisdom D matter
15 A balancing B comparison C analogy D correspondence
16 A dilemma B vote C options D desires
17 A lend B provide C supply D invest
18 A proportion B tab C rate D amount
19 A return B come back C form D reply
20 A immune B secure C set D grasp
21 A onward B leading C along D ahead
22 A reasonable B objective C discreet D fair
Task 6.4. Read the text below. For each of the empty spaces (23 – 30)
choose the correct answer (A, B, C or D).
So how do I do these quick calculations? It 23 … the rule of 72. And it's
a very easy way to approximate how long it 24 … to double something, like
the amount of money 25 … in a savings account under various rates of growth.
To use it, all you do is you take the number 72 and you divide it by the rate
of growth. The number you get is how many periods it takes to double your
initial value.
So let's try another simple example. Consider an investment that earns
8 % per year. And ask yourself, how long will it take to double my money
at that rate? Easy, just divide 72 by 8 and you get 9. And that 26 … it'll take
9 years to double my money. How about a rate like 12 % per year? Easy
again. Just divide 72 by 12 and you get the number 6, which means it will
take 6 years to double my money at a 12 % annual rate of return. Once you
get a feel for it, you can use the rule of 72 in a whole host of ways.
Be creative. For example, you can 27 … the rule in reverse and ask
at what rate would something have to 28 … in order for it to double in value
in a 29 … period of time. So suppose someone said, hey, it would be great

147
if we could double our business's Twitter followers in 18 months. Easy again.
72 30 … by 18 is 4. And instantly I know that if I grew my Twitter followers
at 4 % per month, my number of Twitter followers would double in 18 months.
23 A call B just calls C just called D is just called
24 A takes B take C taking D taken
25 A invest B invested C invests D is invest
26 A means B mean C was meant D meant
27 A uses B using C use D is used
28 A grew B grow C had grown D growing
29 A fix B fixed C being fix D fixing
30 A divide B dividing C has dividing D divided
P.S. You can watch Video 6.6 "BizBasics. The Rule of 72 with Peter
Rodriguez" [http://www.youtube.com/watch?v=12FsjiVzTMA] to check your
answers.
Task 6.5. Review questions. Give your answers to the questions or explain
the statements.
1. What is the purpose of new mathematics?
2. What is compound interest?
3. What is a key component of compound interest?
4. What is the formula for compound interest?
5. How does the rule of 72 work?
Score: Tasks 6.1 – 6.4: 1 point per 1 question (30 points).
Task 6.5: 2 points per 1 question (correct answers make 10 points).
Total: 40 points.

148
Key
Unit 1
Task 3. 1 – c; 2 – e; 3 – d; 4 – f; 5 – g; 6 – a; 7 – b.
Task 8. 1 – B; 2 – D; 3 – A; 4 – C.
Task 9. 1 – true; 2 – false; 3 – false; 4 – false; 5 – true; 6 – false; 7 – true;
8 – true; 9 – false; 10 – false.
Task 13. 1 – decision support; 2 – algorithms; 3 – control; 4 – situation;
5 – analysts; 6 – business processes; 7 – improving; 8 – technical environment;
9 – business objectives.
Task 14. 1 – false; 2 – false; 3 – true; 4 – true; 5 – false; 6 – false; 7 – false;
8 – true; 9 – false; 10 – false.
Task 17. 1 – business performance; 2 – corporate performance;
3 – performance; 4 – feedback; 5 – strategy; 6 – dashboards; 7 – visual;
8 – graphs; 9 – health; 10 – multidimensional; 11 – geographical information.
Task 1.1. 1 – C; 2 – B; 3 – A.
Task 1.2. 4 – E; 5 – F; 6 – B; 7 – A; 8 – I; 9 – D; 10 – H.
Task 1.3. 11 – B; 12 – D; 13 – B; 14 – A; 15 – C; 16 – D; 17 – B; 18 – A;
19 – C; 20 – A.
Task 1.4. 21 – A; 22 – C; 23 – C; 24 – A; 25 – B; 26 – D; 27 – A; 28 – C;
29 – B; 30 – B.
Unit 2
Task 3. 1 – D; 2 – B; 3 – A; 4 – C.
Task 8. 1 – Routine data; 2 – Nonroutine methods of collecting data;
3 – Direct observation; 4 – Direct inspection; 5 – Written questionnaire;
6 – Personal interviewing; 7 – Abstraction from records or published statistics.
Task 9. 1 – T; 2 – T; 3 – F; 4 – T; 5 – F; 6 – F; 7 – F.
Task 13. 1 – data; 2 – information; 3 – knowledge; 4 – connectedness;
5 – relationships; 6 – understanding; 7 – patterns; 8 – principles; 9 – directly;
10 – wisdom; 11 – connected; 12 – take; 13 – build; 14 – see.
Task 14. 1 – d; 2 – h; 3 – f; 4 – g; 5 – b; 6 – i; 7 – a; 8 – e; 9 – j; 10 – c.
Task 2.1. 1 – C; 2 – A; 3 – B.

149
Task 2.2. 4 – G; 5 – C; 6 – H; 7 – E; 8 – F; 9 – D; 10 – A.
Task 2.3. 11 – A; 12 – C; 13 – C; 14 – D; 15 – A; 16 – B; 17 – D; 18 – A;
19 – B; 20 – C.
Task 2.4. 21 – D; 22 – B; 23 – A; 24 – B; 25 – C; 26 – C; 27 – A; 28 – D;
29 – C; 30 – A.
Unit 3
Task 3. 1 – d; 2 – h; 3 – g; 4 – a; 5 – c; 6 – b; 7 – e; 8 – f.
Task 8. 1 – E; 2 – D; 3 – C; 4 – F; 5 – A; 6 – G; 7 – B.
Task 9. 1 – T; 2 – F; 3 – F; 4 – F; 5 – T; 6 – F; 7 – T; 8 – T; 9 – F; 10 – F.
Task 13. 1 – decisions; 2 – method; 3 – locate; 4 – profitability; 5 – tactical;
6 – targets; 7 – employ; 8 – risk; 9 – product.
Task 14. 1 – B; 2 – D; 3 – C; 4 – A; 5 – B.
Task 15. 1 – T; 2 – F; 3 – T; 4 – F; 5 – F; 6 – F; 7 – T; 8 – T; 9 – F; 10 – F;
11 – T; 12 – F; 13 – T; 14 – F.
Task 19. 1 – marketing consultancy; 2 – individual; 3 – employee;
4 – differently; 5 – pressure; 6 – earn; 7 – norm; 8 – behaviour; 9 – common;
10 – changes; 11 – rules; 12 – essential.
Task 21. 1 – E; 2 – I; 3 – A; 4 – G; 5 – H; 6 – D; 7 – B.
Task 22. 8 – A; 9 – C; 10 – B; 11 – B; 12 – D; 13 – C; 14 – A; 15 – B;
16 – A; 17 – D.
Task 25. 1 – cognitive biases affect; 2 – rational and objective and free;
3 – overcome; 4 – make effective decisions; 5 – diligence-based strategy;
6 – face a crisis; 7 – competitive conditions; 8 – a small number of ordinary
business activities; 9 – on the fundamentals; 10 – a different type of thinking;
11 – measurement and empirical evidence; 12 – opinions or persuasion;
13 – the performance of the company; 14 – measured and monitored;
15 – technology and data source; 16 – improving the fundamental operations
that lead to success.
Task 3.1. 1 – D; 2 – E; 3 – F; 4 – G; 5 – B.
Task 3.2. 6 – B; 7 – F; 8 – A; 9 – E; 10 – C; 11 – H; 12 – I.
Task 3.3. 13 – C; 14 – B; 15 – C; 16 – A; 17 – D; 18 – A; 19 – B; 20 – D;
21 – C; 22 – A.
Task 3.4. 23 – A; 24 – C; 25 – B; 26 – D; 27 – B; 28 – A; 29 – C; 30 – A.
150
Unit 4
Task 4. 1 – c; 2 – k; 3 – h; 4 – i; 5 – b; 6 – e; 7 – a; 8 – l; 9 – d; 10 – g;
11 – f; 12 – j.
Task 9. 1 – Tacit; 2 – Cognitive tacit; 3 – Technical tacit; 4 – Explicit;
5 – Individual; 6 – Social; 7 – Declarative; 8 – Procedural; 9 – Causal;
10 – Conditional; 11 – Relational; 12 – Pragmatic.
Task 10. 1 – T; 2 – F; 3 – F; 4 – F; 5 – F; 6 – T; 7 – F; 8 – F; 9 – T; 10 – T.
Task 14. 1 – rules; 2 – representation; 3 – condition; 4 – implements;
5 – modified; 6 – synergistically; 7 – individual; 8 – interdependent; 9 – require;
10 – simulation; 11 – behavior.
Task 15. 1 – B; 2 – C; 3 – A; 4 – D; 5 – B; 6 – A.
Task 16. 1 – F; 2 – F; 3 – F; 4 – T; 5 – F; 6 – F.
Task 20. 1 – frame; 2 – knowledge; 3 – independence; 4 – application;
5 – concise; 6 – methods; 7 – entity; 8 – slot; 9 – characteristics; 10 – outline.
Task 21. 1 – A; 2 – C; 3 – D; 4 – C; 5 – B; 6 – B; 7 – A; 8 – D.
Task 22. 1 – D; 2 – E; 3 – H; 4 – C; 5 – A; 6 – G; 7 – I.
Task 25. 1 – tools, techniques, methods, ways of working; 2 – focuses
much more on "know howʺ and the ʺknow whoʺ; 3 – techniques and approaches;
4 – networks or communities of practice, ways of mapping how people are
connected, ways of improving these connections, looking for who talks to who,
who trusts who and how you can optimize that; 5 – learning before activities,
learning after activities; 6 – they take the time to pause and reflect and learn;
7 – the increased use of multimedia; 8 – we behave, the way that we work,
the culture which we establish and support and nurture; 9 – behaviours,
processes, technologies, learning and networks.
Task 4.1. 1 – D; 2 – H; 3 – E; 4 – A; 5 – F; 6 – B.
Task 4.2. 7 – G; 8 – E; 9 – C; 10 – B; 11 – I; 12 – A; 13 – H.
Task 4.3. 14 – A; 15 – C; 16 – B; 17 – B; 18 – C; 19 – D; 20 – C; 21 – A;
22 – B; 23 – D.
Task 4.4. 24 – A; 25 – B; 26 – D; 27 – C; 28 – B; 29 – C; 30 – A.
Unit 5
Task 4. 1 – c; 2 – e; 3 – a; 4 – f; 5 – d; 6 – b.
Task 9. Suggested answer: Definition of the Subject.

151
Task 10. 1 – T; 2 – F; 3 – F; 4 – T; 5 – F; 6 – T; 7 – F; 8 – T.
Task 14. 1 – filled; 2 – wave; 3 – sits; 4 – row; 5 – continues;
6 – occasionally; 7 – concept; 8 – complex; 9 – knowledge; 10 – outcomes;
11 – outstanding; 12 – strategic.
Task 15. 1 – B; 2 – C; 3 – A; 4 – D; 5 – B; 6 – B; 7 – D; 8 – A; 9 – C; 10 – A.
Task 16. 1 – d; 2 – a; 3 – h; 4 – f; 5 – b; 6 – g; 7 – e; 8 – c.
Task 17. 1 – F; 2 – F; 3 – F; 4 – T; 5 – F; 6 – F; 7 – T; 8 – F; 9 – T; 10 – F;
11 – F.
Task 20. 1 – A; 2 – C; 3 – B; 4 – C; 5 – C; 6 – A; 7 – D; 8 – B.
Task 21. 9 – econometric; 10 – improvements; 11 – returns; 12 – curves;
13 – physicists; 14 – struggle; 15 – legalized; 16 – explosion; 17 – reliable;
18 – globalization.
Task 22. 1 – C; 2 – F; 3 – I; 4 – B; 5 – E; 6 – G; 7 – D.
Task 25. 1 – sensitive dependence on initial conditions; 2 – if you
changed it a little at the start; 3 – new math; 4 – complex systems; 5 – threw off
classical physics; 6 – understood the basic rules of the universe; 7 – the universe
would… wrong; 8 – it's governed by rules; 9 – more we understand the math;
10 – Understanding order from chaos.
Task 5.1. 1 – D; 2 – B; 3 – C.
Task 5.2. 4 – B; 5 – E; 6 – G; 7 – C; 8 – A; 9 – I; 10 – H.
Task 5.3. 11 – A; 12 – D; 13 – B; 14 – A; 15 – B; 16 – C; 17 – C; 18 – D;
19 – B; 20 – A; 21 – A.
Task 5.4. 22 – A; 23 – D; 24 – B; 25 – B; 26 – C; 27 – D; 28 – B; 29 – C;
30 – A.
Unit 6
Task 3. 1 – c; 2 – a; 3 – d; 4 – b.
Task 8. 1 – B (Compound Interest); 2 – A (Compound Interest Formula).
Task 9. 1 – T; 2 – F; 3 – F; 4 – F; 5 – T; 6 – F; 7 – F.
Task 13. 1 – financial; 2 – interest; 3 – difference; 4 – savings; 5 – account;
6 – deposit; 7 – benefit; 8 – accelerate.
Task 14. 1 – D; 2 – A; 3 – C; 4 – B; 5 – A; 6 – C.
Task 15. 1 – F; 2 – F; 3 – F; 4 – F; 5 – T; 6 – F; 7 – F; 8 – F.
Task 18. 1 – money up; 2 – saving; 3 – period; 4 – hand over; 5 – pay off;
6 – annual; 7 – compound interest; 8 – payments; 9 – interest; 10 – calculated.
152
Task 19. 1 – B; 2 – I; 3 – D; 4 – A; 5 – E; 6 – G; 7 – H.
Task 22. 1 – transmitted; 2 – information; 3 – quickly and easily filter;
4 – balancing risk and reward; 5 – reliably predict outcomes; 6 – very slow
to change their model; 7 – follow trends and protect profits; 8 – create and
implement an informed investing plan; 9 – reduce their risk; 10 – when to sell
the stock; 11 – proper money management and exit strategies are applied;
12 – training and education; 13 – education.
Task 6.1. 1 – C; 2 – A; 3 – E; 4 – B; 5 – D.
Task 6.2. 1 – C; 2 – G; 3 – I; 4 – D; 5 – B; 6 – F; 7 – A.
Task 6.3. 13 – A; 14 – B; 15 – B; 16 – C; 17 – D; 18 – C; 19 – A; 20 – B;
21 – D; 22 – A.
Task 6.4. 23 – D; 24 – A; 25 – B; 26 – A; 27 – C; 28 – B; 29 – B; 30 – D.
153
Scripts
Video 1.1
Who is a business analyst? A business analyst is someone who analyzes
an organization and designs its processes, and systems assessing the business
model and its integration with technology. Business analysis is the practice of
enabling change in an organizational context by defining needs and recom-
mending solutions that deliver value to stakeholders. Business analysis is the
process of understanding business change needs assessing the impact of
those changes capturing, analyzing and documenting requirements and then
supporting the communication and delivery of those requirements with relevant
parties. Business analysts can switch between domains business analysts work
in different industries such as finance, banking, insurance, telecom, software
services and other fields often working as a bridge between management and
IT. Business analysts develop strategies to improve efficiency, regain a com-
petitive edge, increase productivity, reduce expenses or improve efficiency.
What are the roles and responsibilities of a business analyst? Business
analysts do not have a predefined and fixed role. The role as a liaison among
stakeholders in order to understand the structure policies and operations of
an organization and to recommend solutions that enable the organization to
achieve its goals. A business analyst consults with companies to initiate changes
that enhance the company's financial success. Once hired, a business analyst
gathers information about a company's processes and procedures by observing
the day-to-day routines of the employees and reading organizational manuals.
A business analyst is a role that can mean different things to different people.
In some companies the BA plays a technical role with very little business
knowledge while they're companies. The BA has a full understanding of the
business with very little knowledge of the IT systems and architecture. The
business analyst skills in a broad perspective comprise the person's being
a business planner, systems analyst, project manager, subject area expert,
organization analyst, financial analyst, technology architect, data analyst, ap-
plication analyst, application designer and process analyst. The role of a busi-
ness analyst in software projects. Business analysts of software firms act as
the liaison between business users and development teams by serving as
business problem solvers. They provide the process questions and techniques
to efficiently extract the information needed from the business users for suc-
cessful application of development projects. Who can be a business analyst?

154
Becoming a business analyst means launching a career full of opportunity on
the leading edge of innovation. Business analyst certification and training will
give you a competitive advantage along with the in-demand skills you'll need
to lend your first business analyst job in this role.
You will leverage your IT analytical and problem-solving skills to create
real-world technical solutions that organizations increasingly need in a com-
plex business environment. As a business analyst your career options are
almost limitless. Contact us for a free career counselling session and kick-
start your career in the direction of success.
Video 2.1
Let's talk about the relationship between data, information and know-
ledge. And we are going to do that by talking about this box. And as I give
you data, I want you to recognize the point at which we know what this box
really is. This box is in many people's homes, but not everybody has one. It
comes in a variety of shapes and sizes, and it comes in a lot of colours. The
colour is usually to match the decor of the room it is kept in, which is the
kitchen. It has some controls that may be on the top or the sides. There is
a door on the front and when you open the door, a light comes on. In this
door, there is usually a window, so you can see what is inside. And the
reason you want to see what is in here, is because we cook things in here.
And the most frequent things we cook are beverages and popcorn. So, at this
point almost everybody recognizes that this is a microwave oven. So, let's
talk about how we got to this point. We have all this data, but the important
pieces of data are that it is usually in the kitchen, which rules out the dressers
in your bedroom, console TVs and things like that. An important piece was
that a light comes on when you open the door, which says it may be your
refrigerator, your microwave or your oven.
Some people have lights that come on in their cabinets, but not too
many. Another important piece was that we heat things in it and specifically
that we heat beverages and popcorn. So, that told you what this really was.
Now let's talk more about the relationship between data, information and know-
ledge. Now on this side we are going to have increasing connectedness, so as
we go up, things are more connected. And down here is increasing relationships,
no, understanding. We have data down here, which requires understanding
and is not connected to anything. We have information which has a little
understanding and is connected. And what we understand between data and

155
information are the relationships. What we understand between information
and knowledge are patterns. And between knowledge and wisdom, we under-
stand principles. These do not build upon each other. Information does builds
directly from data, but to get from information to knowledge is not a direct
relationship and to get from knowledge to wisdom is definitely not related. So,
I hope that this helps you understand how data, information and knowledge
are connected and that you can now take this data to build information and
then see the patterns and relationships, so you can build knowledge.
Video 2.2
Statistical ideas and methods are used in almost every aspect of human
activity. Statistics has special applications in such areas as medicine, psychology,
education, engineering and agriculture. In business, statistical methods are
applied extensively in production, marketing, finance and accounting business.
Statistics is the systematic process of collecting, interpreting and presenting
numerical data about business situations in business. Statistics is organized
into two categories: descriptive and statistical inference. Descriptive statistics
deals with tabular, graphical or numerical methods for organizing and sum-
marizing information, whereas statistical inference is the process of arriving at
conclusions, predictions, forecasts, or estimates based on a sample drawn from
the population of all data under consideration. For example, a company may
contact a randomly selected sample of 250 customers and ask their opinion
about a possible new product from the sample. The company will try to infer
information about the opinions of the entire population of prospective customers
for this presentation.
We will concentrate on various types of descriptive statistical methods
starting with tables.
A table is a collection of related data arranged for ease of reference or
comparison usually in parallel columns with meaningful titles. Tables are very
useful in summarizing statistical data and are found almost everywhere in
business. Once the data has been obtained from the table. They can be
compared with other table data by arithmetic or percentage analysis.
Charts are used to display a picture of the relationships among selected
data. A line chart shows data changing over a period of time. A single glance
at a line, chart gives the viewer a general idea of the direction or trend of the
data up down or up and down. The horizontal axis or x-axis is used to measure
units of time such as: days, weeks, months, years, whereas the vertical axis
156
or the y-axis depicts the magnitude such as: dollars or production and units.
Frequently, the y-axis is used to measure the percentage of something.
Bar charts represent quantities as percentage by length of horizontal or
vertical bars as with line charts. Bar charts often illustrate increases or decreases
in magnitude of a certain variable or the relationship between similar variables.
Bar charts may or may not be based on the movement of time bar. Charts are
divided into three categories: standard, comparative and component.
The pie chart is a circle divided into sections representing the component
parts of a whole. The whole 100 % is the circle. The parts are the wedge-
shaped sections of the circle. When this type of chart is used, the data are
usually converted to percentages. The size of each section of the circle is
determined by the portion or percentage. Each component is part of the
whole. Pie charts are generally read by inspection because each component
of the data is clearly labelled by category and percent.
Video 3.1
We know that cognitive biases affect nearly every decision we make,
and in the world of business, people need to make important choices every day.
Often these choices must be made without delay and have broad, far-reaching
consequences. How can we make sure that our choices remain rational and
objective and free from our potentially harmful cognitive biases? As it turns
out, there is a system, but it's a lot more like a process or a habit than a magic
bullet.
New research has shown that the world's best managers can overcome
biases and reliably make effective decisions by following an approach called
diligence-based strategy. Doing business in the 21st century is not easy.
No matter the industry, most organizations will eventually face a crisis:
maybe new competitors will appear out of nowhere or an existing brand will
try to carve a slice out of your customer base. Today's competitive conditions
are forcing organizations to strategize and act quickly. Thus, it is easy to see
why many companies scramble to create a revolutionary new strategy to cope
with crisis-conducting market research, analyzing trends, and evolving the
core business model. But this is the wrong approach. Following the traditional
"big strategy" approach leaves room for more errors in judgment, particularly
during a crisis. Instead, organizations should rely on diligence-based strategy
by turning their attention to a small number of ordinary business activities –
like sourcing inputs, managing customer relationships, and developing the
right people.

157
Diligence is about focusing on the fundamentals. By optimizing their
operations, organizations can promote the conditions that allow for better,
more thoughtful, long-range strategies to emerge inductively. Developing diligence
requires a different type of thinking.
The best executives attend relentlessly to what they can control. They rely
more heavily on measurement and empirical evidence and less on opinions
or persuasion. Think of baseball executive Billy Beane, who set a famous
precedent by using advanced statistical analysis, overthrowing the more tra-
ditional methods of evaluating baseball talent. The "money ball phenomenon"
has motivated a new surge of interest in optimization – many companies now
find that big data can reliably inform their decision-making.
As an executive, your primary task is to know the levers that drive busi-
ness performance, and to pull those levers. To identify fundamental activities,
ask yourself this: does mastery of this activity contributes significantly to the
performance of the company? And can the activity be reliably measured and
monitored?
Companies should only have a handful of fundamental activities like
"sourcing inputs", "managing the supply chain", or "serving customers". It is
only after isolating the company's fundamental activities that the work of
optimization can occur.
Most importantly, managers should use every available technology and
data source to compile information on the company's activities. It's easy to go
astray when decisions are made based on emotional responses or incom-
plete information which are a natural occurrence during a competitive crisis.
Diligence-based strategy allows companies to systematically focus on what
matters most: improving the fundamental operations that lead to success. To
find out more about diligence-based strategy, decision-making in organizations,
and cognitive biases, please read California Management Review's special
issue on Behavioral Strategy, volume 59, issue 3.
Video 4.1
What is knowledge management? Knowledge management is a set of
tools, techniques, methods, ways of working, and desired behaviours which help
an organization to be more effective. It is different from other improvement
toolkits and management movements like Six Sigma or LEAN Manufacturing
because it focuses much more on "know how" and the "know who". How do
158
you put that to work more effectively in an organization? How do you share
the key points, nuggets and "rules of thumb"? How do you ensure that the
right contacts are made such that people have the right conversations they
need to have at the beginning of the project, before everyone gets into
action? This is why Knowledge Management is quite a "broad church" of
techniques and approaches – and is getting broader every year. So what kind
of activities might I become involved with if I'm a knowledge manager? You
could find yourself exploring tools to identify and support the networks in an
organization; networks or communities of practice; ways of mapping how people
are connected, ways of improving these connections, looking for who talks to
who, who trusts who and how you can optimize that. You could look at how
good an organization is at learning before activities, learning after activities. How
do you ensure that the lessons you capture after the projects are meaningful,
are full of recommendations, useful action points for somebody? You may
need to encourage teams to learn continuously, during activities rather than
waiting until the end of a major project before they take the time to pause and
reflect and learn. It could equally well be about how to capture knowledge.
Thus the value can be multiplied. How do you take a "nugget" or insight and
capture it in such a way the people are intrigued, interested and want to get in
touch with the person who wrote it? How do you package in a way it doesn't
destroy all of the emotion, all of the context, but seems to carry it with it? This
will involve the increased use of multimedia, much more use of connections
to some of the social media so that you're only one click away from a con-
versation. Finally it has a lot to do with the way that we behave, the way that
we work, the culture which we establish and support and nurture – or come
against, as leaders in an organisation. You may need to confront a "not
invented here" culture, to support and make it safe for people to share their
experiences (failures as well as successes) and desirable to learn from those
of others. Knowledge management encompasses all of these areas: behaviours,
processes, technologies, learning and networks. This is what makes it an exciting
and constantly evolving discipline.
Video 5.1
Hello there, future internet users, I've been Trace and I will hopefully still
be him, and this is probably still DNews. We'll see.
You've probably heard about the Butterfly Effect – usually explained by
the idea that a butterfly flaps its wings in Brazil and causes a hurricane in Texas.

159
Premise ridiculous! Of course they can't. There are millions of butterflies, if
every one caused the beginnings of a storm, Earth would be in chaos. The
thing is, that's not what the Butterfly Effect is about. It's about how tiny changes
in big systems can have complex results. Systems, in this case, could be
anything from weather patterns, to how big groups of asteroids move, or how
lots of people interact.
For an example of a system: picture a Tilt-a-Whirl ride at a carnival. If
you don't know what that is: it's a rotating and shifting platform, with shell-like
cars, each rotating on a smaller circle, with people inside. It has rules, and
follows those rules rigidly: the platform rotates the same every time, and the
carts can only rotate around specific points… By analyzing this, you can see
the butterfly effect in action. If I sit alone in one of the tilt-a-whirl carts, it would
spin completely differently than if you sat in there with me, right? Together
we'd be heavier and so our cart would have a completely different ride! Every
spin would be completely different from taking the ride alone. Now, imagine
all the carts as part of a system. With tiny changes to each: someone being
a little lighter or heavier in one cart, someone sitting forward on the seat or
with their back on the wall...
These tiny variations affect the whole Tilt-a-Whirl system! That's the
butterfly effect which does have a scientific name: "sensitive dependence on
initial conditions". This was originally discovered by an MIT mathematician and
meteorologist Edward Lorenz, who was using an old computer to calculate
weather patterns. He ran a simulation, and wanted to see it again. The first time,
he put in the data to six decimal places, but figured the second time those tiny
fractions of a degree wouldn't matter, so he only used three decimal places.
In the end, because he cut out a few fractions of a fraction, the whole simulation
completely changed. It was unrecognizable! And that's when the crap hit the
counter. At the time mathematicians thought, if you changed it a little at the
start, it would only change a little at the end. It was logical, but these systems
don't behave that way, and we needed new math to understand why! In walks:
Chaos Theory.
Chaos Theory, by definition, deals with "complex systems whose behavior
is highly sensitive to slight changes in conditions". It appears to be chaos, but
it's actually governed by the same rules as everything else in nature, physics,
and the universe. But because there are so many moving parts; it's impos-
sible for us to comprehend them all. Imagine watching all the people get on
a Tilt-a-Whirl and then guessing how every cart is going to move…

160
Chaos Theory was groundbreaking when it was discovered, because it
threw off classical physics! Isaac Newton's laws of nature – equal and opposite
reactions and such, were imagined in a clockwork universe, not one filled with
apparent chaos. Basically, if we understood the basic rules of the universe,
we should understand everything in the universe too, right? Wrong. Because
even a tiny change in something with as many moving parts as the universe
would... wrong. And that's super scary. We went from grasping a good chunk
of our universe, to who knows where. But, the universe is not random, it's
governed by rules. Rules which mathematicians have worked on understanding
for centuries.
Take nature for example, it might seem random, but it's governed by
rules, and that's why it makes shapes like this. These are called fractals, and
they show us how chaos is really order. [pause] It's an infinitely complex,
repeating pattern that appears chaotic at times, but is actually ordered! Chaos
theory is an attempt to approximate and understand all the people getting on
the Tilt-a-Whirl, and how the Tilt-a-Whirl will react to their actions; thus finding
order in the chaos. The more we understand the math, the better handle we
will have to predict how a complex system will react to tiny changes.
The practical applications are huge from understanding the brain, to social
interaction, to how gas moves in our atmosphere. A study in the Journal of
Family Psychology followed 95 couples, attempting to predict divorce rates using
chaos theory math. They were correct 87 percent of the time. Turbulence and
weather slash climate change models keep getting better with as we gather
more data, because we can harness that chaos math. The rules that govern
fluid dynamics are pretty well understood. We get temperature, pressure,
volume, and mass, we get solar energy and gaseous emissions, and so on.
But, if somehow, a tiny bit of moisture, dust, heat or cold causes a cloud to
form somewhere we didn't expect… the whole system can be thrown off. It's
maddening. Which is why the National Weather Service runs the same weather
models again and again: tweaking it each time – eventually they are getting
an inkling of the true result.
So, when you think of the butterfly effect, what should you think of?
Understanding order from chaos. The original model Lorenz was working on
appeared to spit out chaos, until it was graphed… and then it looked like this:
[show picture?] It looks like a butterfly. It didn't get its name from an actual
butterfly, but from the graph of chaos becoming order. Which is pretty. And
insane. It's pretty insane. To see how the butterfly effect could wreak havoc
on a female police detective in 2016 after she discovers she can reach her

161
estranged father over the airwaves and through the decades in 1996 via ham
radio. Don't miss the Series Premiere of Frequency, Wednesday October 5th,
at 9/8c only on the CW. If chaos is really just order, is anything in the universe
truly random?! Jules looked at it here. Math was not my strong suit, but I find
it super fascinating. What about you guys? Let us know down in the comments.
Video 6.1
Okay. So, my name's Kim Johnson and I do research into financial
mathematics. What that means in practice is I work on building tools that help
people understand how to make good decisions when they don't know what's
going to happen in the future.
One of the main areas that I work in is economics. And economics is
very different from say physics or biology or chemistry because everything's
changing all the time. So for about 5,000 years mathematicians have been
working on trying to understand nature and the laws of nature don't change.
But now we're starting to think about economic systems which are basically
social systems and they're governed by laws of human behavior. Human
behavior is constantly changing. So we're never dealing with a static, a stable
system and this makes understanding these sort of social systems. Economic
systems much harder what's very important in developing our mathematics is
that we think about what actually happens. What actually happens out there
in the economy. The mathematics to describe what actually happens. Doesn't
actually exist when we have to create the mathematics to enable us to
understand the real-life economy. So our understanding of science is based
on mathematics on being able to use mathematics to represent the world
around us. Now that we're moving from understanding simple deterministic
systems to complex and random systems. New mathematics will have to be
developed. So the hope is by using examples from the climate, from biological
systems and financial markets we're going to be able to develop new mathematics.
Mathematics is going to help us understand whole new areas of science,
areas that we haven't even thought about yet.
Video 6.2
Meet Jane. On her 25th birthday she invested $15,000 earning about
5.5 % annually. After ten years, Jane has over $25,000. That's because not
only did her initial $15,000 earn interest, but her earnings also earned interest
over those 10 years. That's how the concept of compounding – usually called

162
compound interest – works. And by investing early, Jane has time on her
side. Now, meet Mitch. He also invested $15,000, but not until his 45th birthday.
Mitch's investments also earned about 5.5 % interest each year, compounding
annually. By the time Jane turns 50, her original investment of $15,000 at that
average 5.5 % rate compounding annually, has now grown to more than
$57,000 – without one extra cent of savings. That's quite some birthday present,
Jane. But don't worry, Mitch, even a little time helps. Your $15,000 investment
has grown to about $19,600.
Video 6.3
Kia Ora and welcome to the Reserve Bank's podcast explaining compound
interest.
Compound interest is a pretty powerful financial concept. But not every-
one understands how it works. An easy way to think of compound interest is
the interest you earn on interest.
Here's an example... Jack and Kiri are thinking about saving for a rainy
day. They might save for their first house, head off on an exotic overseas
holiday, or put money away for their retirement. Kiri is the organised one. She
decides to put $1000 into a savings account, which will earn 5 percent interest
each year. Look at what happens to Kiri's savings balance. In the first year,
Kiri's $1000 deposit earns 50 dollars in interest. So by the end of the year,
she's got $1050. Kiri also earns interest in the second year too but this time
she's started with $1050 in the account – so she earns interest on the full
$1050. That means the initial interest is compounded and she earns $52.50
in interest in the second year. The benefit of compound interest may not seem
very large to start with but as you'll see, compound interest can make a big
difference over time. Kiri continues to leave her money in the bank each year,
and it continues to earn interest. Forty years later she'll have more than $7000
in the savings account and most of that's been earned through interest on
interest. Jack isn't as disciplined as Kiri, and he has his mind on other things.
He starts saving with by depositing $1000 into an account and, just like Kiri, it
also earns 5 percent interest a year. But unlike Kiri, Jack spends the interest
he earns each year. 40 years later, Jack's still got $1000 in his savings account.
His initial deposit has earned interest in that time, but unlike Kiri, he hasn't
benefitted from that interest compounding each year. That's the benefit of
compound interest – the longer you save without spending the interest, the
more you benefit. And the benefits accelerate the longer you save.

163
Of course, if Jack and Kiri were able to regularly squirrel away more
savings into their accounts an even larger sum of money would benefit from
compound interest. And don't forget, compound interest also applies to debt
too, and certainly not in a good way. The longer you leave debt without pay-
ing interest, the more interest it accumulates, and the bigger the debt burden
becomes. So to recap, compound interest is a bit like supercharging your
savings because not only do you earn interest on the money you deposit, but
you also earn interest on the interest you earn too. And the longer you save,
the more you benefit from compound interest.
Video 6.4
Hello and welcome to this video on investing myths.
You may have thought about investing on your own, but hesitate because
of common misconceptions heard through friends, family, or the media. Take
control of your financial future by first overcoming the most common barriers.
In this video, we will dispel the six most common investing myths.
And myth number one – investing on your own takes too much time. Never
before has the world of investing been so accessible to everyone. The first
sophisticated investors once relied on carrier pigeons to relay information and
quotes. Technology has completely changed the way information is transmitted,
and has allowed the average investor to instantly know more information than
at any other time in history. Of course, there is no shortage of misinformation,
so an educated investor must be able to quickly and easily filter information to
make smarter decisions.
Myth number two – investing in the stock market is like gambling. People
connect the concepts of investing and gambling because both involve money
and both appear to deal with the element of chance. And although it's true
that blindly investing is similar to closing your eyes and rolling the dice,
successful investing is never a game of chance. The art of investing is
primarily concerned with balancing risk and reward. Gambling does not allow
for anyone to change the probabilities of the game. However, with skillful
investing, one can reliably predict outcomes when it comes to trends, patterns,
and laws of supply and demand. Of course, no one knows what will happen
from one day to the next, but investors have been able to put the odds in their
favor, which is impossible to do with gambling. Investors believe that with
proper training, you can learn to manage risks and determine your potential
rewards.
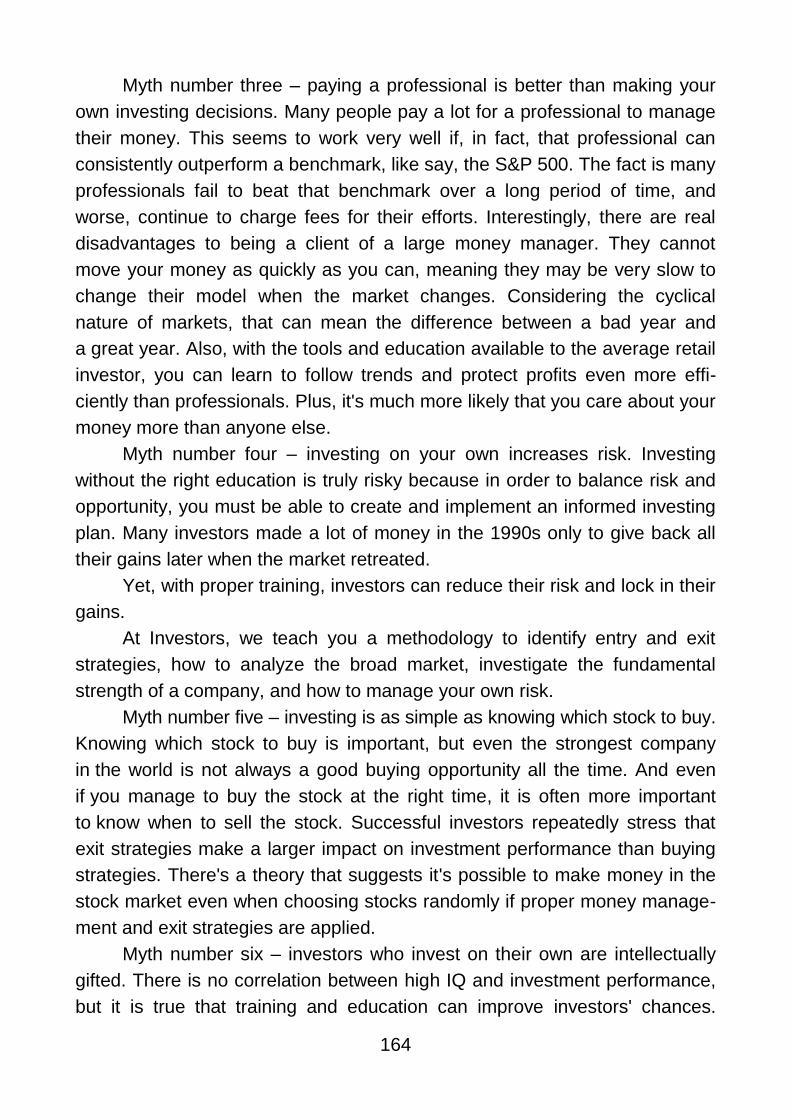
164
Myth number three – paying a professional is better than making your
own investing decisions. Many people pay a lot for a professional to manage
their money. This seems to work very well if, in fact, that professional can
consistently outperform a benchmark, like say, the S&P 500. The fact is many
professionals fail to beat that benchmark over a long period of time, and
worse, continue to charge fees for their efforts. Interestingly, there are real
disadvantages to being a client of a large money manager. They cannot
move your money as quickly as you can, meaning they may be very slow to
change their model when the market changes. Considering the cyclical
nature of markets, that can mean the difference between a bad year and
a great year. Also, with the tools and education available to the average retail
investor, you can learn to follow trends and protect profits even more effi-
ciently than professionals. Plus, it's much more likely that you care about your
money more than anyone else.
Myth number four – investing on your own increases risk. Investing
without the right education is truly risky because in order to balance risk and
opportunity, you must be able to create and implement an informed investing
plan. Many investors made a lot of money in the 1990s only to give back all
their gains later when the market retreated.
Yet, with proper training, investors can reduce their risk and lock in their
gains.
At Investors, we teach you a methodology to identify entry and exit
strategies, how to analyze the broad market, investigate the fundamental
strength of a company, and how to manage your own risk.
Myth number five – investing is as simple as knowing which stock to buy.
Knowing which stock to buy is important, but even the strongest company
in the world is not always a good buying opportunity all the time. And even
if you manage to buy the stock at the right time, it is often more important
to know when to sell the stock. Successful investors repeatedly stress that
exit strategies make a larger impact on investment performance than buying
strategies. There's a theory that suggests it's possible to make money in the
stock market even when choosing stocks randomly if proper money manage-
ment and exit strategies are applied.
Myth number six – investors who invest on their own are intellectually
gifted. There is no correlation between high IQ and investment performance,
but it is true that training and education can improve investors' chances.
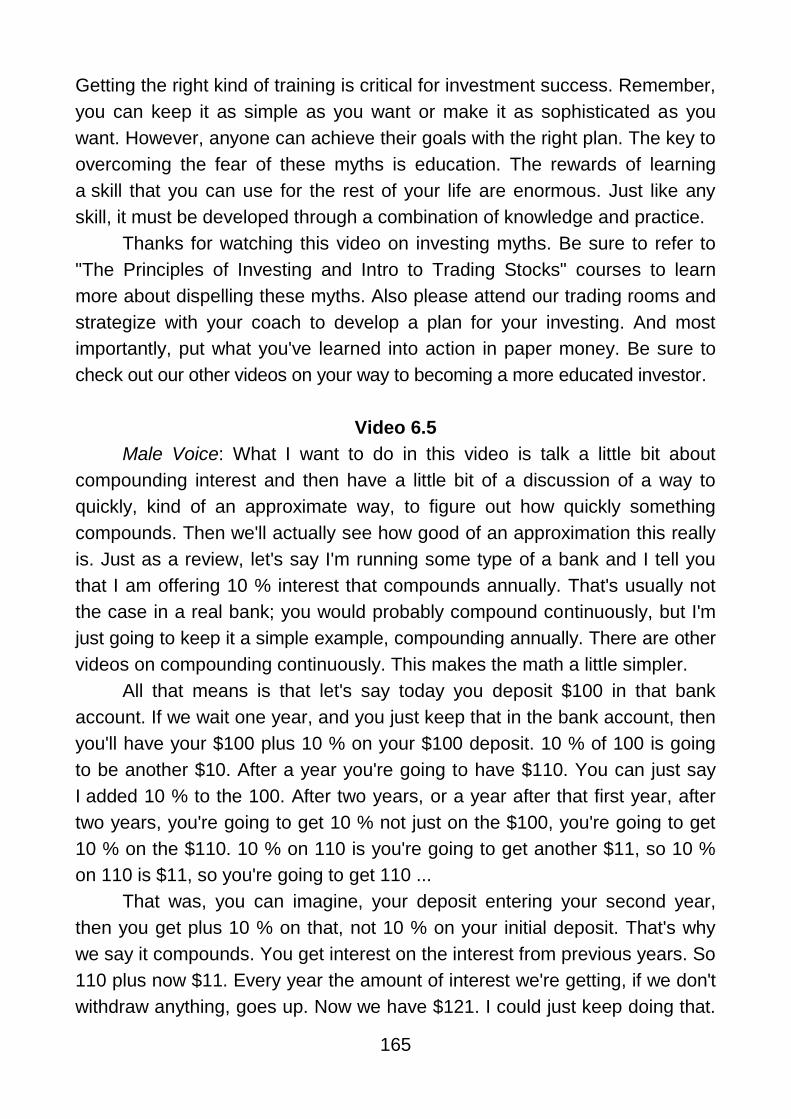
165
Getting the right kind of training is critical for investment success. Remember,
you can keep it as simple as you want or make it as sophisticated as you
want. However, anyone can achieve their goals with the right plan. The key to
overcoming the fear of these myths is education. The rewards of learning
a skill that you can use for the rest of your life are enormous. Just like any
skill, it must be developed through a combination of knowledge and practice.
Thanks for watching this video on investing myths. Be sure to refer to
"The Principles of Investing and Intro to Trading Stocks" courses to learn
more about dispelling these myths. Also please attend our trading rooms and
strategize with your coach to develop a plan for your investing. And most
importantly, put what you've learned into action in paper money. Be sure to
check out our other videos on your way to becoming a more educated investor.
Video 6.5
Male Voice: What I want to do in this video is talk a little bit about
compounding interest and then have a little bit of a discussion of a way to
quickly, kind of an approximate way, to figure out how quickly something
compounds. Then we'll actually see how good of an approximation this really
is. Just as a review, let's say I'm running some type of a bank and I tell you
that I am offering 10 % interest that compounds annually. That's usually not
the case in a real bank; you would probably compound continuously, but I'm
just going to keep it a simple example, compounding annually. There are other
videos on compounding continuously. This makes the math a little simpler.
All that means is that let's say today you deposit $100 in that bank
account. If we wait one year, and you just keep that in the bank account, then
you'll have your $100 plus 10 % on your $100 deposit. 10 % of 100 is going
to be another $10. After a year you're going to have $110. You can just say
I added 10 % to the 100. After two years, or a year after that first year, after
two years, you're going to get 10 % not just on the $100, you're going to get
10 % on the $110. 10 % on 110 is you're going to get another $11, so 10 %
on 110 is $11, so you're going to get 110 ...
That was, you can imagine, your deposit entering your second year,
then you get plus 10 % on that, not 10 % on your initial deposit. That's why
we say it compounds. You get interest on the interest from previous years. So
110 plus now $11. Every year the amount of interest we're getting, if we don't
withdraw anything, goes up. Now we have $121. I could just keep doing that.

166
The general way to figure out how much you have after let's say n years is
you multiply it. I'll use a little bit of algebra here. Let's say this is my original
deposit, or my principle, however you want to view it. After x years, so after
one year you would just multiply it ...
To get to this number right here you multiply it by 1.1. Actually, let me
do it this way. I don't want to be too abstract. Just to get the math here, to get
to this number right here, we just multiplied that number right there is 100 times
1 plus 10 %, or you could say 1.1. This number right here is going to be, this
110 times 1.1 again. It's this, it's the 100 times 1.1 which was this number
right there. Now we're going to multiply that times 1.1 again. Remember, where
does the 1.1 come from? 1.1 is the same thing as 100 % plus another 10 %.
That's what we're getting. We have 100 % of our original deposit plus another
10 %, so we're multiplying by 1.1. Here, we're doing that twice. We multiply
it by 1.1 twice. After three years, how much money do we have? It's going
to be, after three years, we're going to have 100 times 1.1 to the 3rd power,
after n years. We're getting a little abstract here. We're going to have 100 times
1.1 to the nth power. You can imagine this is not easy to calculate. This was
all the situation where we're dealing with 10 %. If we were dealing in a world
with let's say it's 7 %.
Let's say this is a different reality here. We have 7 % compounding
annual interest. Then after one year we would have 100 times, instead of 1.1,
it would be 100 % plus 7 %, or 1.07. Let's go to 3 years. After 3 years, I could
do 2 in between, it would be 100 times 1.07 to the 3rd power, or 1.07 times
itself 3 times. After n years it would be 1.07 to the nth power. I think you get
the sense here that although the idea's reasonably simple, to actually calculate
compounding interest is actually pretty difficult.
Even more, let's say I were to ask you, "How long does it take to double
your money?" If you were to just use this math right here, you'd have to say,
"Gee, to double my money I would have to start with $100." I'm going to
multiply that times, let's say whatever, let's say it's a 10 % interest, 1.1 or 1.10
depending on how you want to view it, to the x is equal to ...
Well, I'm going to double my money so it's going to have to equal $200.
Now I'm going to have to solve for x and I'm going to have to do some
logarithms here. You can divide both sides by 100. You get 1.1 to the x is
equal to 2. I just divided both sides by 100. Then you could take the logarithm
of both sides base 1.1, and you get x. I'm showing you that this is complicated
on purpose.
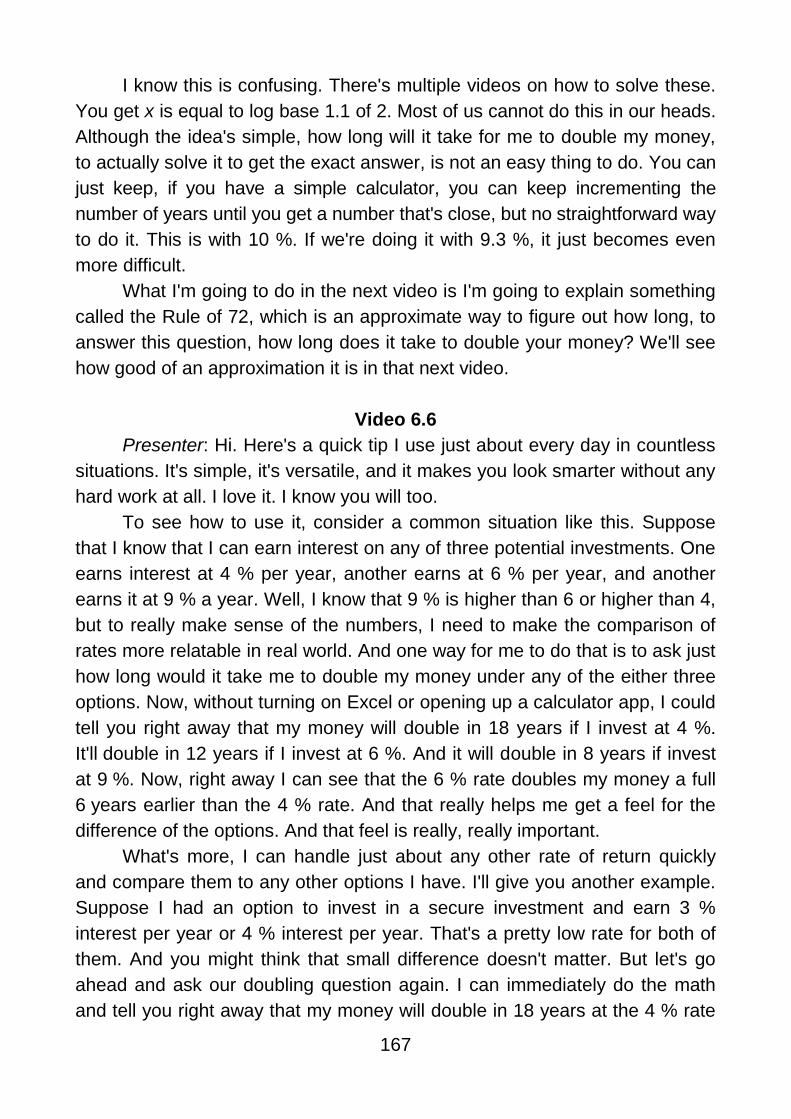
167
I know this is confusing. There's multiple videos on how to solve these.
You get x is equal to log base 1.1 of 2. Most of us cannot do this in our heads.
Although the idea's simple, how long will it take for me to double my money,
to actually solve it to get the exact answer, is not an easy thing to do. You can
just keep, if you have a simple calculator, you can keep incrementing the
number of years until you get a number that's close, but no straightforward way
to do it. This is with 10 %. If we're doing it with 9.3 %, it just becomes even
more difficult.
What I'm going to do in the next video is I'm going to explain something
called the Rule of 72, which is an approximate way to figure out how long, to
answer this question, how long does it take to double your money? We'll see
how good of an approximation it is in that next video.
Video 6.6
Presenter: Hi. Here's a quick tip I use just about every day in countless
situations. It's simple, it's versatile, and it makes you look smarter without any
hard work at all. I love it. I know you will too.
To see how to use it, consider a common situation like this. Suppose
that I know that I can earn interest on any of three potential investments. One
earns interest at 4 % per year, another earns at 6 % per year, and another
earns it at 9 % a year. Well, I know that 9 % is higher than 6 or higher than 4,
but to really make sense of the numbers, I need to make the comparison of
rates more relatable in real world. And one way for me to do that is to ask just
how long would it take me to double my money under any of the either three
options. Now, without turning on Excel or opening up a calculator app, I could
tell you right away that my money will double in 18 years if I invest at 4 %.
It'll double in 12 years if I invest at 6 %. And it will double in 8 years if invest
at 9 %. Now, right away I can see that the 6 % rate doubles my money a full
6 years earlier than the 4 % rate. And that really helps me get a feel for the
difference of the options. And that feel is really, really important.
What's more, I can handle just about any other rate of return quickly
and compare them to any other options I have. I'll give you another example.
Suppose I had an option to invest in a secure investment and earn 3 %
interest per year or 4 % interest per year. That's a pretty low rate for both of
them. And you might think that small difference doesn't matter. But let's go
ahead and ask our doubling question again. I can immediately do the math
and tell you right away that my money will double in 18 years at the 4 % rate

168
and it will double in 24 years at the 3 % rate. It's a small difference in rates.
But it takes a full 6 years more to double my money at 3 % than it does at
4 %. And that really helps make it clear that over a reasonable time horizon,
like saving for college or saving for your retirement, paying attention to a 1 %
difference in rates really, really matters.
So how do I do these quick calculations? Well, you're in luck. It couldn't
be simpler. It's just called the rule of 72. And it's a very easy way to approximate
how long it takes to double something, like the amount of money invested in
a savings account under various rates of growth. To use it, all you do is you
take the number 72 and you divide it by the rate of growth. The number you
get is how many periods it takes to double your initial value.
So let's try another simple example. Consider an investment that earns
8 % per year. And ask yourself, "How long will it take to double my money
at that rate?" Easy, just divide 72 by 8 and you get 9. And that means it'll take
9 years to double my money. How about a rate like 12 % per year? Easy
again. Just divide 72 by 12 and you get the number 6, which means it will
take 6 years to double my money at a 12 % annual rate of return. Once you
get a feel for it, you can use the rule of 72 in a whole host of ways.
Be creative. For example, you can use the rule in reverse and ask at what
rate would something have to grow in order for it to double in value in a fixed
period of time. So suppose someone said, hey, it would be great if we could
double our business's Twitter followers in 18 months. Easy again. 72 divided
by 18 is 4. And instantly I know that if I grew my Twitter followers at 4 % per
month, my number of Twitter followers would double in 18 months. Or how
about this. I have a child born today and I want to save money for them to go
to college in 18 years. I know that if I invest $10,000 today and earn 4 % as
a rate of return, I'll have $20,000 when they turn 18 and get ready to go to
college. And if I could get a rate of return like 8 % per year, I know that if
I invest $10,000 today, I'll have $20,000 in 9 years, and $20,000 more 9 years
after that, or $40,000 when they go to college. 72 is great because almost
everything divides into in an intuitive way, 2, 3, 4, 6, 8, 9, 12, makes it very
easy to use. You can even do a little more work and see that a number like
5 divides into 72 14.4 times. And 7 divides into 72 10.3 times. And you've got
just about every number under the sun you'd ever work.
The rule of 72 offers a quick, useful, and a very close approximation. So
don't delay. Get started now. Use the rule of 72 in all the ways you can think
of. And I promise, it will make you think faster, think better, and look smarter
every time you use it.
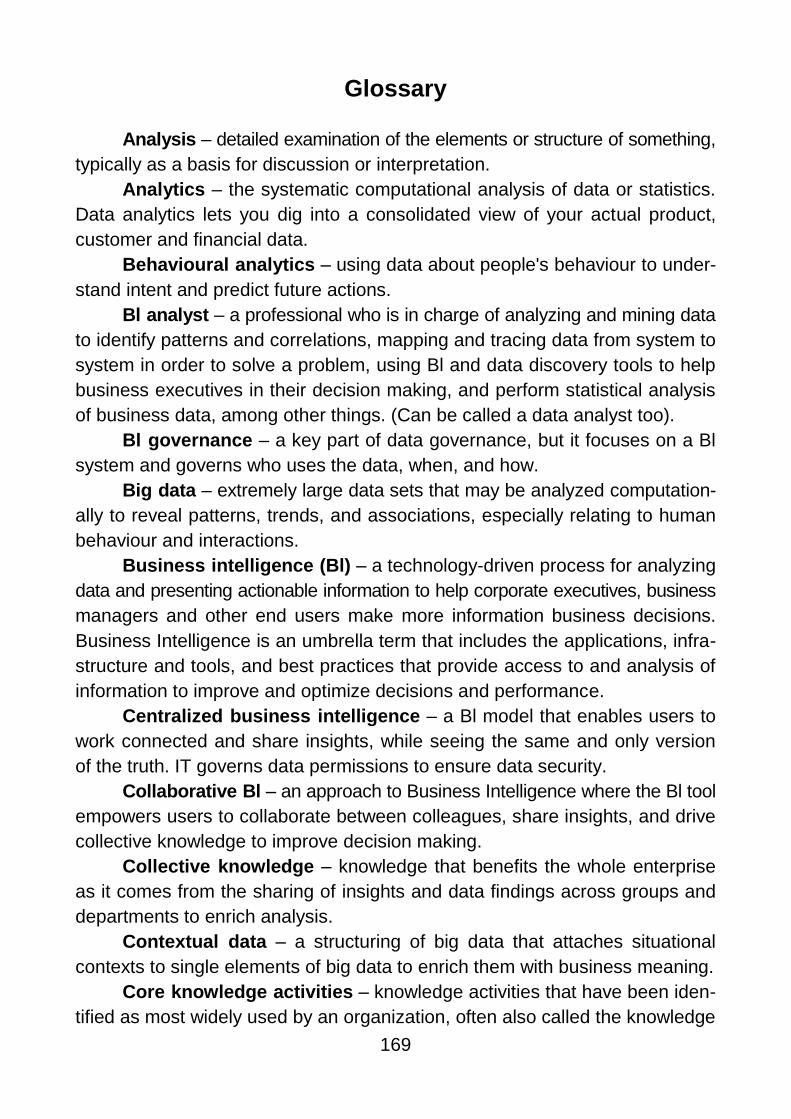
169
Glossary
Analysis – detailed examination of the elements or structure of something,
typically as a basis for discussion or interpretation.
Analytics – the systematic computational analysis of data or statistics.
Data analytics lets you dig into a consolidated view of your actual product,
customer and financial data.
Behavioural analytics – using data about people's behaviour to under-
stand intent and predict future actions.
Bl analyst – a professional who is in charge of analyzing and mining data
to identify patterns and correlations, mapping and tracing data from system to
system in order to solve a problem, using Bl and data discovery tools to help
business executives in their decision making, and perform statistical analysis
of business data, among other things. (Can be called a data analyst too).
Bl governance – a key part of data governance, but it focuses on a Bl
system and governs who uses the data, when, and how.
Big data – extremely large data sets that may be analyzed computation-
ally to reveal patterns, trends, and associations, especially relating to human
behaviour and interactions.
Business intelligence (Bl) – a technology-driven process for analyzing
data and presenting actionable information to help corporate executives, business
managers and other end users make more information business decisions.
Business Intelligence is an umbrella term that includes the applications, infra-
structure and tools, and best practices that provide access to and analysis of
information to improve and optimize decisions and performance.
Centralized business intelligence – a Bl model that enables users to
work connected and share insights, while seeing the same and only version
of the truth. IT governs data permissions to ensure data security.
Collaborative Bl – an approach to Business Intelligence where the Bl tool
empowers users to collaborate between colleagues, share insights, and drive
collective knowledge to improve decision making.
Collective knowledge – knowledge that benefits the whole enterprise
as it comes from the sharing of insights and data findings across groups and
departments to enrich analysis.
Contextual data – a structuring of big data that attaches situational
contexts to single elements of big data to enrich them with business meaning.
Core knowledge activities – knowledge activities that have been iden-
tified as most widely used by an organization, often also called the knowledge
170
life cycle or the knowledge value chain. They are to identify, create, store, share,
and use knowledge, often in a two-way exchange. Two important requirements
have to be fulfilled to achieve improvements from these activities: (i) the activities
should be aligned or integrated into business processes; and (ii) the activities
should be balanced in accordance with the specificities of each process and
organization. A knowledge management solution should not focus only on one
or two activities in isolation.
Data – facts and statistics collected together for reference or analysis,
discrete and objective facts, measurements, or observations that can be analyzed
to generate information.
Data analyst – a professional who is in charge of analyzing and mining
data to identify patterns and correlations, mapping and tracing data from sys-
tem to system in order to solve a problem, using Bl and data discovery tools
to help business executives in their decision making, and perform statistical
analysis of business data, among other things.
Data analytics – the process of examining data sets in order to draw
conclusions about the information they contain, increasingly with the aid of
specialized systems and software.
Data governance – data governance deals with the entire spectrum
(creation, transformation, ownership, etc.) of people, processes, policies, and
technologies that manage and govern an enterprise's use of its data assets
(such as data governance stewardship applications, master data management,
metadata management, and data quality).
Data source – the source where the data to be analyzed comes from.
It can be a file, a database, a dataset, etc. Modern Bl solutions like Necto can
mashup data from multiple data sources.
Data visualization – the graphic visualization of data. Can include tra-
ditional forms like graphs and charts, and modern forms like infographics.
Data warehouse – a relational database that integrates data from multiple
sources within a company.
Database – structured set of data held in a computer, especially one that
is accessible in various ways.
Data model – the result of collaborative effort between end business
users and IT database analysts.
Dark data – information assets that organizations collect, process and
store in the course of their regular business activity, but generally fail to use
for other purposes.

171
Embedded analytics – the integration of reporting and data analytic
capabilities in a Bl solution. Users can access full data analysis capabilities
without having to leave their Bl platform.
Explicit knowledge – knowledge that can be codified in formal, systematic
language and shared in discussion or writing. Examples include a telephone
directory, an instruction manual, or a report of research findings.
Federated business intelligence – a Bl model where users work in
separate desktops, creating data silos and unnecessary copies of data, lead-
ing to multiple versions of the truth.
Gap analysis – a study of whether the data that a company has can
meet the business expectations that the company has set for its reporting and
Bl, and where possible data gaps or missing data might exist.
Hierarchy – an arrangement or classification of things according to relative
importance or inclusiveness.
Information – data that have been categorized, analyzed, summarized,
and placed in context in a form that has structure and meaning.
Information management – the management of an organization's in-
formation resources to improve performance. Information management underpins
knowledge management, as people derive knowledge from information.
Information technology – a term encompassing the physical elements
of computing – including servers, networks, and desktop computing – that enable
digital information to be identified, created, stored, shared, and used.
Intellectual capital – the value, or potential value, of an organization's
intangible assets. Attempts to place a financial value on organized knowledge
often define intellectual capital as the combination of human, relational, and
structural capital.
Interactive visualization – technology providing the exploration of data
via the manipulation of chart images, with the color, brightness, size, shape
and motion of visual objects representing aspects of the dataset being analyzed.
These products provide an array of visualization options that go beyond those
of pie, bar and line charts, including heat and tree maps, geographic maps,
scatter plats and other special-purpose visuals.
Know-how – skill or capability derived from knowledge and experience.
Knowledge – a combination of data and information, to which expert
opinion, skills, and experience are added, resulting in a valuable asset that
aids decision making. In organizational terms, knowledge is generally thought
of as being know-how, applied information, information with judgment, or the

172
capacity for effective action. Knowledge may be tacit, explicit, individual, and/or
collective. It is intrinsically linked to people.
Knowledge assets – the parts of an organization's intangible assets
that relate specifically to knowledge such as know-how, good practices, and
intellectual property. Knowledge assets (or products and services) are categorized
as human (people, teams, networks, and communities), structural (the codified
knowledge that can be found in business processes), and technological (the
technologies that support knowledge sharing such as databases and intranets).
By understanding the knowledge assets it possesses, an organization can use
them to better effect and identify what gaps may exist.
Knowledge audit – systematic identification and analysis of an
organization's knowledge needs, resources, flows, gaps, uses, and users.
A knowledge audit usually includes a review of people-based knowledge, capa-
bility, and skills as well as information. It also examines critically an organization's
values, vision, culture, and skills from the perspective of its knowledge needs.
Knowledge base – an organized structure that facilitates the storage
of data, information, and knowledge to be retrieved in support of a knowledge
management process.
Knowledge economy – an economy in which knowledge plays a domi-
nant part in the creation of wealth. The four pillars of a knowledge economy
framework are: (i) an economic incentive and institutional regime that provides
good economic policies and institutions that permit efficient mobilization and
allocation of resources and stimulate creativity and incentives for the efficient
creation, dissemination, and use of existing knowledge; (ii) educated and skilled
workers who can continuously upgrade and adapt their skills to efficiently create
and use knowledge; (iii) an effective innovation system of firms, research centers,
universities, consultants, and other organizations that can keep up with the
knowledge revolution and tap into the growing stock of global knowledge and
assimilate and adapt it to local needs; and (iv) a modern and adequate informa-
tion infrastructure that can facilitate the effective communication, dissemination,
and processing of information and knowledge.
Knowledge flows – ways in which knowledge moves around, and into
and out of, an organization.
Knowledge harvesting – a set of methods and techniques for making
tacit knowledge more explicit so that it can be shared more easily.
Knowledge management – the explicit and systematic management of
processes enabling vital individual and collective knowledge resources to be
173
identified, created, stored, shared, and used for benefit. Its practical expression
is the fusion of information management and organizational learning.
Knowledge management tools – methods and techniques that are used
to support or deliver practical knowledge management. These can be either
information technology systems, e.g., databases, intranets, extranets, and portals;
methodologies; or human networks, e.g., communities of practice.
Knowledge management strategy – a detailed plan that outlines how
an organization intends to implement knowledge management principles and
practices to achieve organizational objectives.
Knowledge manager – a role with operational and developmental re-
sponsibility for implementing and reinforcing knowledge management principles
and practices; often acts as central owner of taxonomies and content standards
and knowledge processes; works to promote access to information, intelligence
support, expertise, and good practices.
Knowledge worker – a staff member whose role relies on his or her
ability to find, synthesize, communicate, and apply knowledge.
Learning organization – an organization skilled at identifying, creating,
storing, sharing, and using knowledge, and then modifying its behavior to reflect
new knowledge.
Management Information System (MIS) – a computerized information-
processing system designed to support the activities of company or organiza-
tional management.
Metadata – a set of data that describes and gives information about
other data.
Online Analytical Processing (OLAP) – computer processing that
enables a user to easily and selectively extract and view data from different
points of view.
Online Transaction Processing (OLTP) – a class of software programs
capable of supporting transaction-oriented applications on the Internet.
Tacit knowledge – the personalized knowledge that people carry in
their heads. Tacit knowledge is more difficult to formalize and communicate
than explicit knowledge. It can be shared through discussion, storytelling, and
personal interactions. There are two dimensions to tacit knowledge: (i) a technical
dimension, which encompasses the kind of informal personal skills or crafts
often referred to as know-how; and (ii) a cognitive dimension, which consists
of beliefs, ideals, values, schemata, and mental models that are ingrained in
individuals and often taken for granted.
174
Index
(The figures indicate the number of the task)
Unit 1
analysis 4, 9, 13, 20, 22, 24, 1.1,
1.2
analyst 9, 13, 14, 18 – 20, 22, 1.2,
1.4
analytics 1, 2, 4, 6, 8, 9, 11, 13, 14,
22, 24
business analyst 18 – 22
business intelligence 1, 2, 14 – 16,
22, 24, 1.1, 1.2
company 2, 4, 9, 20, 24
credit 4
custom 4. 10, 24
data 4, 9, 14, 15, 22, 24, 1.1 – 1.4
decision 1, 9, 13, 14, 17, 24, 1.2 –
1.4
environment 6, 9, 13, 14, 1.2
information 2, 4, 6, 8, 9, 14, 17, 24,
1.2 – 1.4
intelligence 1, 2, 14 – 16, 22, 24,
1.1, 1.2
model 1, 8 – 11, 13, 14, 20, 22
organization 6, 9, 13, 14, 17, 20,
22, 1.1, 1.3, 1.4
process 2, 4, 6, 8 – 10, 13, 20 – 22,
24, 1.2, 1.4
strategy 4, 6, 8, 9, 13, 14, 17, 1.4
Unit 2
business 2, 4, 15, 16, 18 – 21, 23
database 4, 14 – 16, 2.4
decision 2, 24, 2.3
information 1, 2, 4, 8, 13 – 17, 23,
24, 2.3, 2.4
knowledge 13, 2.3, 2.4
market 4, 2.5
order 4, 15, 23
process 2, 4, 2.1
product 4, 9, 2.1
report 4, 9, 15
system 9, 15
Unit 3
business 2, 9, 10, 13, 15 – 19, 21,
27, 29, 3.1, 3.3
computer 15, 17, 3.3
cost 6, 9, 11, 3.1
information 2 – 4, 6, 8, 9, 11, 15 –
17, 21, 22, 25, 26, 3.1, 3.2
knowledge 21
line 4, 14, 19, 29
method 9, 13, 15, 29
number 2, 9, 13, 15, 17, 19, 29
organization 2, 4, 24, 25
product 4, 6, 9, 13 – 15, 17, 19, 21,
3.3
range 4, 9, 15
size 10, 18, 3.4
type 4, 14, 15
175
Unit 4
capital 3, 5, 19, 27, 29
culture 3, 29
data 5, 9, 12, 18, 20, 28, 29, 4.4
expertise 3, 10, 14, 29, 4.3
frame 5, 20, 21, 4.1
inference 4, 5, 14, 18, 19
information 3, 5, 10, 11, 15, 16, 21,
22, 27, 29, 4.1, 4.4
knowledge 3, 5, 9 – 12, 14, 16 – 20,
22, 29, 4.1, 4.2, 4.4
knowledge management 1, 3, 5, 10,
12, 23 – 27, 29, 4.2
object 10, 17, 20, 21, 29, 4.1, 4.2
organization 3, 5, 9, 10, 25, 26, 29,
4.4
rule 14, 15, 18 – 22, 4.1
semantic network 16, 17, 27, 4.1
system 3, 10, 11, 14, 18, 19, 21,
22, 27, 29, 4.2
value 3, 5, 10, 20, 21, 29, 4.1, 4.3
Unit 5
agent 5, 10, 14, 16, 22, 27
analysis 3, 16, 19, 20, 22
approach 5, 10, 15, 16
butterfly effect 23 – 26, 5.1
chaos 15, 25 – 27, 29, 5.1
chaos theory 15, 25 – 27
computational economics 5, 5.5
data 9, 10, 16, 17, 20, 22
economics 1, 3, 5, 10, 16, 17, 19,
20, 28, 5.5
econophysics 10, 16, 17, 22
effect 3, 16, 23 – 26, 29, 5.1
field 3, 16, 22
finance 5, 20, 22
intelligence 5, 27, 5.1
mathematics 1, 3, 10, 11, 15, 22,
5.1 – 5.3, 5.5
model 3, 5, 10, 11, 14, 16, 17, 20,
22, 27, 5.1, 5.4
order 16, 22, 29
scale 14, 16, 20
science 3, 5, 10, 16, 22, 27
standard 16, 17, 20, 27, 5.1, 5.5
system 5, 14 – 16, 22, 25, 5.1
theory 3, 15 – 17, 20, 22, 25 – 27,
5.1, 5.5
Unit 6
account 9, 10, 13, 14, 18, 6.1, 6.4
amount 9, 15, 16, 18, 6.1, 6.3, 6.4
approximation 15, 6.1
business 9, 6.4
compound 9, 10, 13 – 15, 6.1, 6.2
compound interest 8 – 11, 13, 14,
18, 24, 6.1, 6.4
debt 14, 6.2
deposit 15, 24, 6.1
difference 11, 13
fact 9, 26
formula 8, 9, 20, 15, 18, 19, 24, 25,
6.5
investment 9, 11, 15, 22, 6.3
market 2, 22, 6.2
mathematics 1, 2, 4, 9, 19, 24, 6.5

176
money 1, 2, 9, 14 – 16, 19, 22, 24,
6.2
number 9, 15, 26, 6.2 – 6.4
period 9, 15, 18, 6.4
rate 9, 15, 18, 6.3, 6.4
rule 9, 15 – 17, 6.4, 6.5
stock 22, 24
value 15, 19, 26, 6.4
177
References
1. Crilly T. 50 Mathematical Ideas You Really Need to Know / T. Crilly. –
London : Quercus Publishing, 2007. – 2008 p.
2. Hall D. Business Studies / D. Hall. – Lancaster : Causeway Press,
1995. – 554 p.
3. Jank Wolfgang. Business Analytics for Managers / W. Jank. – New
York : Springer, 2011. – 189 p.
4. Kamran Dadkhah. Foundations of Mathematical and Computational
Economics / Dadkhah Kamran. – New York : Springer, 2007. – 560 p.
5. Laursen Gert H. N. Business analytics for managers: taking business
intelligence beyond reporting / Gert H. N. Laursen, Jesper Thorlund. – Hoboken,
New Jersey : John Wiley & Sons, Inc. 2010. – 248 p.
6. McCauley J. L. Dynamics of markets. The New Financial Economics
/ Joseph L. McCauley. – New York : Cambridge University Press, 2009. –
288 p.
7. Nickels William G. Understanding business / William G. Nickels,
James M. McHugh. – New York : McGraw-Hill Education, 2016. – 840 p.
8. North M. J. Managing business complexity: discovering strategic solutions
with agent-based modeling and simulation / M. J. North, Ch. M. Macal. –
New York : Oxford University Press, 2006. – 326 p.
9. Shu-Heng Chen. Computational economics : a perspective from
computational intelligence / Shu-Heng Chen and Lakhmi Jain. – London :
Idea Group Publishing, 2006. – 340 p.
10. Turban E. Decision support systems and intelligent systems / E. Turban,
J. Aronson, Ting-Peng Liang. – New Delhi : Prentice Hall, 2007. – 955 p.
11. Sukumar A. Applied Business Analysis [Electronic resource]
/ A. Sukumar, L. Tipi, J. Revill. – 2016. – 224 p. – Access mode : bookboon.com.
178
Content
Introduction .................................................................................................... 3
Unit 1. Business Analytics and Business Intelligence .................................... 5
Unit 2. Data and Information ........................................................................ 27
Unit 3. Decision Making ............................................................................... 57
Unit 4. Knowledge Management .................................................................. 84
Unit 5. Computational Economics .............................................................. 110
Unit 6. Finance Mathematics ..................................................................... 131
Key ............................................................................................................ 148
Scripts ....................................................................................................... 153
Glossary .................................................................................................... 169
Index .......................................................................................................... 174
References ................................................................................................ 177

НАВЧАЛЬНЕ ВИДАННЯ
Борова Тетяна Анатоліївна
Мілов Олександр Володимирович
АНГЛІЙСЬКА МОВА ДЛЯ БІЗНЕС-АНАЛІТИКІВ
Навчальний посібник
У трьох частинах
ЧАСТИНА 3. ІНТЕЛЕКТУАЛЬНІ ЗАСОБИ У БІЗНЕСІ (англ. мовою)
Самостійне електронне текстове мережеве видання
Відповідальний за видання Т. А. Борова
Відповідальний редактор М. М. Оленич
Редактор З. В. Зобова
Коректор З. В. Зобова
Запропоновано матеріал щодо оволодіння англійською мовою для бізнес-аналі-
тиків. Третя частина посібника присвячена інтелектуальним засобам бізнес-аналітики,
які є основою бізнес-аналізу, а саме: даним і засобам їх відображення, прийняттю рі-
шень, управлінню знаннями, обчислювальній економіці, фінансовій математиці. Зазна-
чені дисципліни забезпечують розуміння різних економічних і математичних аспектів
бізнес-аналізу. Посібник може бути використаний як для навчання у групах, так і для
самостійного вивчення.
Рекомендовано для студентів спеціальності 051 "Економіка", викладачів, а та-
кож усіх, хто вивчає та використовує англійську мову у своїй професійній діяльності,
що пов'язана з використанням математичних методів в економіці.
План 2018 р. Поз. № 33-ЕНП. Обсяг 179 с.
Видавець і виготовлювач – ХНЕУ ім. С. Кузнеця, 61166, м. Харків, просп. Науки, 9-А
Свідоцтво про внесення суб'єкта видавничої справи до Державного реєстру
ДК № 4853 від 20.02.2015 р.