Shifting of Localization Planes in Optical Testing: Application to a Shearing Interferometer

To cite this paper: Int. J. Rock Mech. & Min. Sci. 34:3-4, paper No. 094. Copyright © 1997 Elsevier Science Ltd
Copyright © 1997 Elsevier Science Ltd
Int. J. Rock Mech. & Min. Sci. Vol. 34, No. 3-4, 1997 ISSN 0148-9062
To cite this paper: Int. J. RockMech. &Min. Sci. 34:3-4, Paper No. 094
A N I S O T R O P Y OF F L O W IN A F R A C T U R E U N D E R G O I N G S H E A R AND ITS R E L A T I O N S H I P TO THE D I R E C T I O N OF
S H E A R I N G AND I N J E C T I O N P R E S S U R E
S. G e n t i e r l ; E. L a m o n t a g n e Z ; C~ A r c h a m b a u l t z; j . Riss 3
1 Research Division, BRGM, B. P. 6009, 45060 Orl6ans cedex 2, France
z CERM, UQAC, Bd de l'Universit6, Chicoutimi, G7H2B 1, Quebec, Canada
3 CDGA, Universit6 Bordeaux 1 Avenue des facult6s, 33405 Talence cedex, France
A B S T R A C T
The work presented deal with the effects of shear direction and injection flow rate on the directional anisotropy of the flow for a given normal stress. Also, is related to these effects the evolution of the intrinsic transmissivity of the fracture in relation to the shear direction and tangential displacements, particularly for small displacements. Tests are performed on mortar replicas of a natural fracture so that the fracture roughness and void space geometry are the same for each test. Three shear directions are defined. These tests results show that the evolution of the intrinsic transmissivity of a fracture depends on the shear direction particularly for small displacements (less than 0.5 mm), and that shearing induces noticeable modifications in flow direction.
Copyright © 1997 Elsevier Science Ltd
K E Y W O R D S
Anisotropy • F low pattern • Fluid flow • Injection pressure • Joints • Laboratory tests • Permeabil i ty • Shear behavior
I N T R O D U C T I O N
In rock masses with low porosity, the flow is mainly located in the system of fractures that criss-crosses the rock mass. For a given stress state, the connectivity of fractures in the network and the permeability of each fracture, are the two important parameters characterizing the global hydraulic behavior of the rock mass. The permeability of each fracture is a function of the void geometry between the two fracture surfaces. Modification in the state of stress leads to a modification of the void geometry that results in a change in the permeability of the fracture. While the evolution of fractures permeability with the normal stress has been the subject of many studies, little research has been dedicated to the study of the evolution of the permeability of fractures under shear stress, even though this topic has been identified as an important problem in understanding flow in relation with several field conditions. It is a particularly exceptional situation when a fracture in its natural setting is subject only to normal stress variation. In most of field configurations, the stress state includes a shear component. The prediction of the permeability of fractures under shear stresses, and understanding the effects of perturbations of the stress field inducing small shear displacements, are of the highest importance in engineering works
ISSN 0148-9062
To cite this paper: Int. J. Rock Mech. & Min. Sci. 34:3-4, paper No. 094. Copyright © 1997 Elsevier Science Ltd
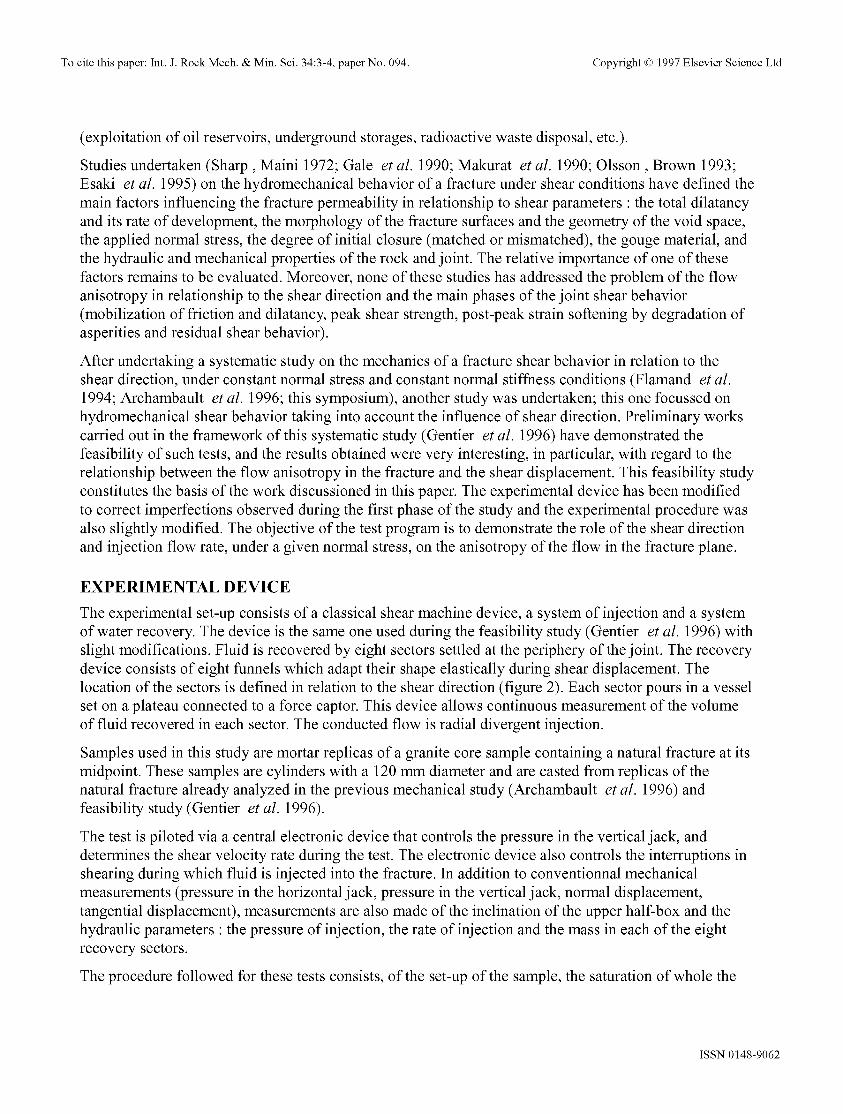
(exploitation of oil reservoirs, underground storages, radioactive waste disposal, etc.).
Studies undertaken (Sharp, Maini 1972; Gale et al. 1990; Makurat et al. 1990; Olsson, Brown 1993; Esaki et al. 1995) on the hydromechanical behavior of a fracture under shear conditions have defined the main factors influencing the fracture permeability in relationship to shear parameters : the total dilatancy and its rate of development, the morphology of the fracture surfaces and the geometry of the void space, the applied normal stress, the degree of initial closure (matched or mismatched), the gouge material, and the hydraulic and mechanical properties of the rock and joint. The relative importance of one of these factors remains to be evaluated. Moreover, none of these studies has addressed the problem of the flow anisotropy in relationship to the shear direction and the main phases of the joint shear behavior (mobilization of friction and dilatancy, peak shear strength, post-peak strain softening by degradation of asperities and residual shear behavior).
After undertaking a systematic study on the mechanics of a fracture shear behavior in relation to the shear direction, under constant normal stress and constant normal stiffness conditions (Flamand et al.
1994; Archambault et al. 1996; this symposium), another study was undertaken; this one focussed on hydromechanical shear behavior taking into account the influence of shear direction. Preliminary works carried out in the framework of this systematic study (Gentier et al. 1996) have demonstrated the feasibility of such tests, and the results obtained were very interesting, in particular, with regard to the relationship between the flow anisotropy in the fracture and the shear displacement. This feasibility study constitutes the basis of the work discussioned in this paper. The experimental device has been modified to correct imperfections observed during the first phase of the study and the experimental procedure was also slightly modified. The objective of the test program is to demonstrate the role of the shear direction and injection flow rate, under a given normal stress, on the anisotropy of the flow in the fracture plane.
EXPERIMENTAL DEVICE
The experimental set-up consists of a classical shear machine device, a system of injection and a system of water recovery. The device is the same one used during the feasibility study (Gentier et al. 1996) with slight modifications. Fluid is recovered by eight sectors settled at the periphery of the joint. The recovery device consists of eight funnels which adapt their shape elastically during shear displacement. The location of the sectors is defined in relation to the shear direction (figure 2). Each sector pours in a vessel set on a plateau connected to a force captor. This device allows continuous measurement of the volume of fluid recovered in each sector. The conducted flow is radial divergent injection.
Samples used in this study are mortar replicas of a granite core sample containing a natural fracture at its midpoint. These samples are cylinders with a 120 mm diameter and are casted from replicas of the natural fracture already analyzed in the previous mechanical study (Archambault et al. 1996) and feasibility study (Gentier et al. 1996).
The test is piloted via a central electronic device that controls the pressure in the vertical jack, and determines the shear velocity rate during the test. The electronic device also controls the interruptions in shearing during which fluid is injected into the fracture. In addition to conventionnal mechanical measurements (pressure in the horizontal jack, pressure in the vertical jack, normal displacement, tangential displacement), measurements are also made of the inclination of the upper half-box and the hydraulic parameters : the pressure of injection, the rate of injection and the mass in each of the eight recovery sectors.
The procedure followed for these tests consists, of the set-up of the sample, the saturation of whole the
ISSN 0148-9062
To cite this paper: Int. J. Rock Mech. & Min. Sci. 34:3-4, paper No. 094. Copyright © 1997 Elsevier Science Ltd
entire system, and settlement of the fracture by means of several loading-unloading cycles. The application of the normal stress is followed by several injections of fluid under a constant flow rate. Then, for each defined shear displacement, several injections of fluid are made under a constant flow rate. The results presented here are for three shear directions (test 3 : 90 °, test 4 : 180 ° and test 5 : 270°),(figure 2). The applied normal stress was 7 MPa for the all three tests. The shear velocity was 0.5 mm/mn. For each of the shear steps imposed, injections were made at three rates : 200 cm3/h, 500 cm3/h and 1630 cm3/h.
M E C H A N I C A L BEHAVIOR
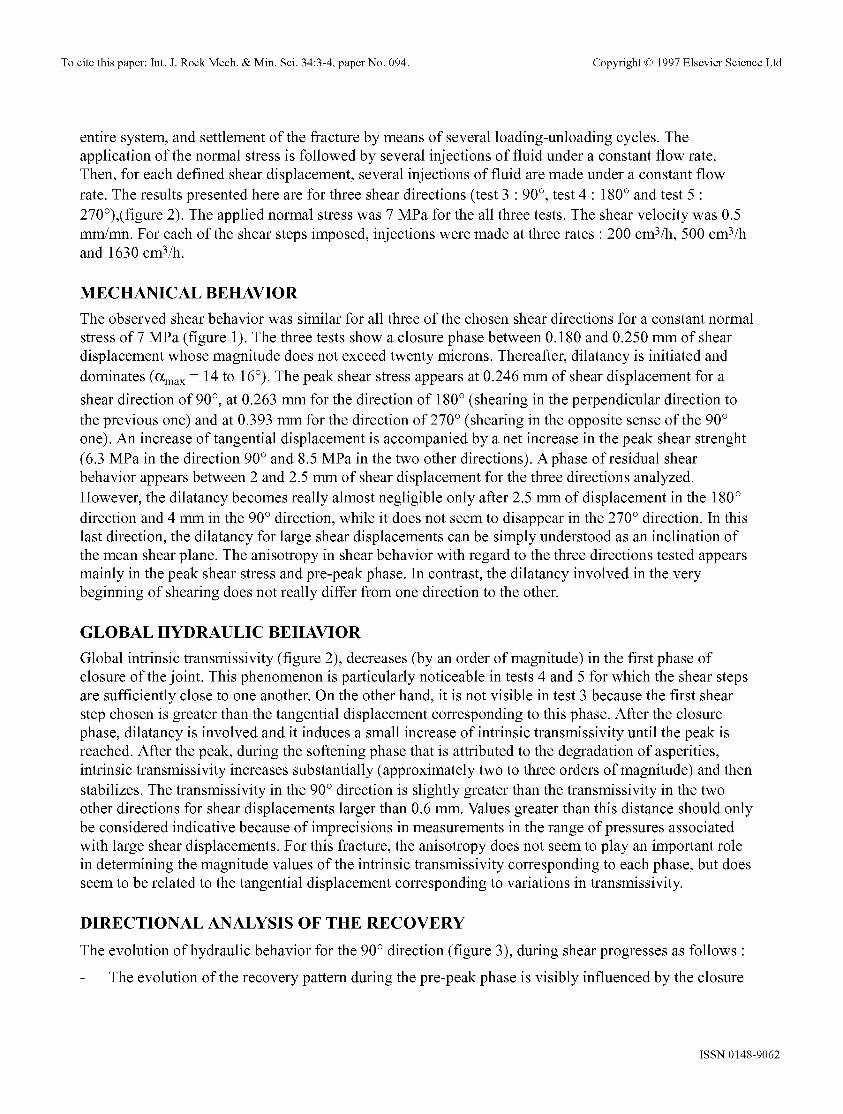
The observed shear behavior was similar for all three of the chosen shear directions for a constant normal stress of 7 MPa (figure 1). The three tests show a closure phase between 0.180 and 0.250 mm of shear displacement whose magnitude does not exceed twenty microns. Thereafter, dilatancy is initiated and dominates (t~ma x = 14 to 16°). The peak shear stress appears at 0.246 mm of shear displacement for a
shear direction of 90 °, at 0.263 mm for the direction of 180 ° (shearing in the perpendicular direction to the previous one) and at 0.393 mm for the direction of 270 ° (shearing in the opposite sense of the 90 ° one). An increase of tangential displacement is accompanied by a net increase in the peak shear strenght (6.3 MPa in the direction 90 ° and 8.5 MPa in the two other directions). Aphase of residual shear behavior appears between 2 and 2.5 mm of shear displacement for the three directions analyzed. However, the dilatancy becomes really almost negligible only after 2.5 mm of displacement in the 180 ° direction and 4 mm in the 90 ° direction, while it does not seem to disappear in the 270 ° direction. In this last direction, the dilatancy for large shear displacements can be simply understood as an inclination of the mean shear plane. The anisotropy in shear behavior with regard to the three directions tested appears mainly in the peak shear stress and pre-peak phase. In contrast, the dilatancy involved in the very beginning of shearing does not really differ from one direction to the other.
GLOBAL H Y D R A U L I C BEHAVIOR
Global intrinsic transmissivity (figure 2), decreases (by an order of magnitude) in the first phase of closure of the joint. This phenomenon is particularly noticeable in tests 4 and 5 for which the shear steps are sufficiently close to one another. On the other hand, it is not visible in test 3 because the first shear step chosen is greater than the tangential displacement corresponding to this phase. After the closure phase, dilatancy is involved and it induces a small increase of intrinsic transmissivity until the peak is reached. After the peak, during the softening phase that is attributed to the degradation of asperities, intrinsic transmissivity increases substantially (approximately two to three orders of magnitude) and then stabilizes. The transmissivity in the 90 ° direction is slightly greater than the transmissivity in the two other directions for shear displacements larger than 0.6 mm. Values greater than this distance should only be considered indicative because of imprecisions in measurements in the range of pressures associated with large shear displacements. ]=or this fracture, the anisotropy does not seem to play an important role in determining the magnitude values of the intrinsic transmissivity corresponding to each phase, but does seem to be related to the tangential displacement corresponding to variations in transmissivity.
DIRECTIONAL ANALYSIS OF THE R E C O V E R Y
The evolution of hydraulic behavior for the 90 ° direction (figure 3), during shear progresses as follows •
- The evolution of the recovery pattern during the pre-peak phase is visibly influenced by the closure
ISSN 0148-9062
To cite this paper: Int. J. Rock Mech. & Min. Sci. 34:3-4, paper No. 094. Copyright © 1997 Elsevier Science Ltd
of the fracture which produces an increase in fluid recovery in some sectors and a decrease in others. The effects of dilatancy and closure as such, are difficult to identify due to the fact that the only hydraulic measurements are taken just at the transition point for both. During this phase, the recovery pattern shows a trend towards reorientation in a direction perpendicular to the shear direction.
- The recovery pattern is modified when passing through the peak shear stress for the three flow rates considered. After peak, the recovery pattern shows that the main recovery is in a direction subperpendicular to the shear direction.
After peak, the evolution of the recovery patterns is more complex and depends on the flow rate :
- The reduction in dilatancy (15 ° ~ 8 °) for 1 mm of shear displacement causes a modification in the recovery pattern for the rates of 500 and 1630 cm3/h. This pattern is maintained until 1.5 mm of shear displacement and is likely related to with the beginning of residual shear behavior. The orientation of the main recovery remains in the same direction. For larger displacements, the hydraulic information is not considered valid because of leakages observed in the device.
- For the rate of 200 cm3/h, a modification in the recovery pattern occurs from 0.772 mm of shear displacement and shows a second change at 1.5 mm.
The evolution of the hydraulic behavior for the 180 ° direction (figure 4), during shear progresses as follows:
- The evolution of the recovery pattern during the pre-peak phase is visibly influenced by the closure phase similarly to the previous test, as evidenced by an increase in fluid recovery in certains sectors and a decrease in others. The effect of dilatancy is more difficult to identify as such due to its very short duration.
- The recovery pattern is modified when passing through peak shear stress for the three flow rates considered. This modification occurs from 0.227 mm for a rate of 200 cm3/h while it occurs only from 0.321 mm for the two other rates. For the rate of 500 cm3/h, the transition is more progressive with the appearance of an intermediate recovery pattern at 0.321 mm. After peak, the main recovery direction tends to be oriented subperpendicularly to the shear direction. However, the recovery direction parallel to shear direction remains a direction of recovery in particular for the rate of 200 c m 3 / h .
After peak, the evolution of the recovery patterns is more complex and depends of the flow rate considered:
- The reduction in dilatancy rate (16 ° ~ 10 °) does not cause any modification of the recovery pattern for rates of 200 and 1630 cm3/h. However, it can be associated with the intermediate pattern for the rate of 500 cm3/h pointed out previously.
- The reduction in dilatancy rate at 1.3 mm of tangential displacement (10 ° ~ 5 °) causes a noticeable modification of the recovery pattern for rates of 200 cm3/h and 500 cm3/h. On the other hand, the modification is far lower than for the rate of 1630 cm3/h with a trend to isotropy. This last change is in relationship with the appearance of residual shear behavior.
- The last reduction in dilatancy rate larger than 2.5 mm of tangential displacement (5 ° ~ 1 °) does not modify the recovery pattern for a rate of 200 cm3/h that remains strongly anisotropic. On the other hand, this reduction modifies the recovery pattern for the rate of 500 cm3/h by changing the main
ISSN 0148-9062

To cite this paper: Int. J. Rock Mech. & Min. Sci. 34:3-4, paper No. 094. Copyright © 1997 Elsevier Science Ltd
recovery direction. For the rate of 1630 cm3/h, the recovery pattern becomes strongly isotropic.
The evolution of the hydraulic behavior for the 270 ° direction (figure 5), during shear progresses as follows:
- The evolution of the recovery pattern during the pre-peak phase is visibly influenced by the closure then dilatancy that results in the increase in fluid recovery in certain sectors and a decrease in others. Going through the closure phase to the dilatancy one does not provoke any modification in the recovery pattern for the rate of 200 cm3/h, but it is clearly marked for rates of 500 cm3/h and 1630 c m 3 / h .
- The recovery pattern is modified when passing through peak for the three rates considered. After peak, the recovery pattern shows a dominant orientation of the recovery in a direction subperpendicular to the shear direction.
After peak, the evolution of recovery patterns is more complex and depends of the rate considered :
- For the rate of 200 cm3/h, the reduction in dilatancy rate (14 ° ~ 9 °) provokes a light modification in the recovery pattern for a shear displacement of around 1.4 mm. It is modified again from 2.5 mm with a particular reorientation of the dominant recovery in a direction subparallel to shear direction. This last modification is without doubt in relation with the appearance of the residual behavior.
- For the rate of 500 cm3/h, the reduction in dilatancy (14 ° ~ 9 °) causes a light modification in the recovery pattern too but only from 2 mm of shear displacement. Similarly, the modification in the recovery pattern in connection with the appearance of the residual shear behavior occurs only from 3 mm. Except this small offset, observed trends are the same.
- For the rate of 1630 cm3/h, the reduction in dilatancy rate (14 ° ~ 9 °) does not cause noticeable modification in the recovery pattern. On the other hand, the modification in the recovery pattern in relationship with the appearance of the residual shear behavior is well marked from 2.5 mm with a trend to a greater isotropy.
DISCUSSION
The values of intrinsic transmissivity before shearing for the three common rates (200 cm3/h, 500 cm3/h and 1630 cm3/h) used in the three tests 3, 4 and 5, vary from 7.6 10 -10 to 3.2 10 -9 cm 3. These values are close enough of to each other for the three rates to be considered very similar. However, initial recovery patterns (before shear) show variations from one test to another. Part of this variation may be due to set-up problems : the initial matching of the fracture surfaces and the influence of the recovery device on the initial recovery pattern.
The evolution of the anisotropic behavior in terms of fluid recovery according to direction and tangential displacement is complex in details but a general outline can be postulated. It seems that :
- The pre-peak phase studied in details from two tests (4 and 5) shows fluctuations in the recovery pattern linked to the initial closure phase followed by the beginning of dilatancy. This could be explained by the very small initial volume of voids available for the flow which increases or decreases rapidly for a very small shear displacement. To this volume variation, must be added a rapid modification in the connectivity of flow channels. The flow most likely occurs in many small channels that lie between the numerous points of contact of the fracture. A small tangential displacement, or a change in the flow rate, can change the major direction in the recovery pattern.
ISSN 0148-9062

To cite this paper: Int. J. Rock Mech. & Min. Sci. 34:3-4, paper No. 094. Copyright © 1997 Elsevier Science Ltd
- The recovery pattern is systematically modified as the shear stress passes through the peak as compared to the recovery pattern during the corresponding pre-peak phase.
- The softening phase is characterized by a specific recovery pattern for each direction. The reduction in dilatancy rate occurring during this phase (test 4) is accompanied by a modification in the pattern only for a rate of 500 cm3/h. During this phase, the fracture is more open, and the flow occurs more easily through large channels that bypass contact damaged zones. In this shear displacement range, the recovery pattern corresponding to a low rate can differ from the recovery pattern associated with a higher rate due to gouge particles in the flow. Channels can be open or clogged by these gouge particles in combination with the flow rate.
- The reduction in dilatancy rate associated with the beginning of the residual shear behavior is accompanied systematically by a modification in the recovery pattern for all rates. This modification occurs in only one stage (tests 3 and 4) or in two stages (test 5).
- The reduction in dilatancy rate corresponding to the appearance of the residual shear behavior (particularly clear in test 4), is accompanied by a new modification in the recovery pattern only for rates of 500 and 1630 cm3/h.
Generally, passing through peak shear strength causes a reorientation of the main recovery direction subperpendicularly to the shear direction. This is true for all the rates considered. The gradual passage to residual shear behavior tends to modify recovery patterns more or less progressively to greatest isotropy and this occurs more rapidly with an high flow rate while dominant recovery directions are observed between 30 and 60 ° of the shear direction.
C O N C L U S I O N
This first series of tests shows the improvement of the testing device, compared to tests performed during the feasibility phase. However, other improvements are still necessary for the testing device and the experimental procedure also (matching of the joint).
The series of tests performed to study the hydromechanical behavior of a fracture under shearing show clearly that the recovery pattern evolves not only with shear direction but also with the different phases identified on the shear behavior. Associated with this evolution of recovery patterns are clear variations of the global intrinsic transmissivity of the fracture, particularly for small shear displacements that are typical for engineering applications in fractured rock masses.
The study confirms the feasibility of such tests to determine joint shear hydromechanical behavior, and their importance for the understanding of fluid flow through fractures. However, this work is a preliminar approach and more tests are required to reach a better understanding. Moreover, a part of the analysis is based on recovery patterns. It remains now to determine the relationship between the recovery pattern and the flow pattern in the fracture. To reach this relationship, it will be necessary to ascertain the best possible geometrical knowledge of the void space and its evolution during shear. This will be possible by means of maps of the voids obtained by casting techniques, and through the analysis of damaged areas that occurs with shear displacement (Riss et al. 1996; this symposium). Probable channel networks could then be deduced, along with their evolution in these information in relation to shear displacement, and these data could be used for hydraulic modeling.
Aknowledgements
ISSN 0148-9062
To cite th i s paper : Int. J. R o c k M e c h . & Min . Sci. 34:3-4 , p a p e r N o . 094. C o p y r i g h t © 1997 E l s e v i e r S c i e n c e L td
The works are jointly founded by BRGM (France) and University Quebec at Chicoutimi (Canada).
FIGURES
Paper 094, Figure 1.
7
5
4
"-' 3
~_5 2
}--
{3
,~r~ k
15.
T ~ S t 3 - .90 "=
i 8o I 4"
I r ~ tgen tJa l dLs~l~eemcnt (m ~ }
1 -T ~
, S
z
5
i
P ,".ak
i i
I,,;~ 4=
:," 3 4
es" 3 9(3"
~ m
1 5 ~
T,&~I 4-- 1.~".)"
2 1 " I 0 ' i 5" I +
I '
1an~¢::1 ird di~lllac~:mL:,".l (m ;n )
._ . , ~ .._~"
.,...'.
,_.E
2:
I P e~k .-,--"
1 6 ' .2 :3 ..4
"l'a."...e.,cn[ ial d'..-;#l&~.,:::m.m'~r. ¢,.rnn~)
Ta.$t ~" - " 8u"
9
S
.~ i.':;i (
0 I
67 ~
res l o- 27o"
' ' . i
~' ~ 4- 5
r an?.eal I:LI cLispLaceme=L [mr,1 )
,-.2 ,g .~,_7
Z
"es~5 2 7,"," ¢5 Pu&k
i ~ L I . ~" I ~" @ u I 2 3 4 S
"l'.'~::ge.tJ,d d i= 'qa ;ur rw. t 0:: .I )
Figure 1. Tangential stress and normal displacement versus tangential displacement
I S S N 0 1 4 8 - 9 0 6 2

To cite this paper: Int. J. Rock Mech. & Mm. Sci. 34:3-4, paper No. 094. Copyright © 1997 Elsevier Science Ltd
Paper 094, Figure 2.
? _¢
_5 =
I i i
1 .r.K:L.I.: .r •
1.0~:F.C~ •
1.O/2e..6,~ Y
0 2 :3~ 05; 0.,3 1 • .2_.. _~- ,4- - 1.~
---- ~ - ' " - . - - . - ~
- -
~ 200 cm3
T¢.~ : 3 • 9~; ~
'l',~nge~[ial displ,~ccment (rnm)
• " 5 0 E ~ . . . . . . . . . .
l 0 . 2 0,,1- 0 6 O ~ 1 I ~ I 4
1.r,:::F.r; 7 ~ . ~ . . . . " . . . . ; " ~
1 .£;4"~.-'.e ~ - ; " 0 ¢3 ~111 ~1
. . . . . . 500 cm2
' . . .5: - - 113,3,q .: ;rr~.
• . i •
"]',,.ngenl i r.I d: SpI a o D i 1 1 e n t (111 &l )
1 .~':F.O?
E
~. I .C'2E.O~I
1 r . E * . . @ ~
1 0.'..( - 1 :)
~h0pr c J r e c l i o r l
i
di'e¢:i ~r- ~f d i s p i ~ r n e r t (3: l i ' .E u~"DE"
h a l f ec-~
~ . 2 6 . ~ ~ . ~ O .B I I . ~ 1 4 1 . ~
7. "-- . m . m ' m - - ~
2C0 ern~
5£O cm.~
- - ' . ~ 3 ' 3 era3
".,,s~: 4 -1E;O ~
"l'uagen'ial dis-~lact, rr.~l::
; a l ) '~ 1" 1
2 .q
",,,, . / . /
2 7 0 " ",JD ~. /
r 7 . %" • 9 -
• . / J , • \
6 ' '4' " • " 4
Figure 2. Evolution of global intrinsic transmissivity as a function of tangential displacement and successive locations of the reference mark for the three tests
ISSN 0148-9062

To cite this paper: Int. J. Rock Mech. & Mm. Sci. 34:3-4, paper No. 094. Copyright © 1997 Elsevier Science Ltd
Paper 094, Figure 3.
; O,--
gE
~;
3, 6 2
i , 5_-
9_-
e_
~O.k
\
8, • 4- 1.1-
•
' N ~ I
9 ~ 5 5
S 5
$ 7
. . . - - . ,
, , . - ,
. . , . . ,
i ' : " i ~ f l ~ I ""
1 f -? n .?
F r: ?" ~" '
L r
2 3
'l'aJIgCP.:iN 4i:~?lm'~ln,.'~l Ir:lll~}
I"e5~ 3 .~ [P
I 2 ~ D E~'rlS, 1
IIL
4O
I
S'i $2 33 5;4 85 $6 £7 $5
2 3
/: i,, .:nl~al :'.i~hl,x'~lll I r.n" f,
I' J ~ -
v , i- t
i . 5 ; : ~ - 3 ~ 7 7 I 0 1 Z ' - 1 . 5 0 5 in-ii
T, "i r ?' "4""
u ~/5 ~,,'.
• J-,~ a,
A
5
l b .
Figure 3. Evolution of the recovery percentage per sector and recovery patterns associated - Test 3 -
ISSN 0148-9062

To cite this paper: Int. J. Rock Mech. & Mm. Sci. 34:3-4, paper No. 094. Copyright © 1997 Elsevier Science Ltd
Paper 094, Figure 4.
S.
7 , ; "
' I 3 t~
10 u ~.,.~ ~5..,J, .~=-= ~ . '
O II : : : 1
Jill I I I; :°i' °°
9~" ~l~ -~L 4-190 ~ I rl l l~ 200 ¢m8 h
cA SS I ~ .b/
I '
/__i I'--.....
lll~.'l~4.~t[i,tL ~i;li;,3~J'llL'~ t CJ11111)
~ _ _ l l l l' I i I l l ~
5 I ~ ; 111
~. r.' ~'.r, 32 " ~ 1
t y -l, I r " t ~ , , " ~ , l l !
, , , , , , . , , ,
1 ~ : 3 : ,L s
• i ~ m l r im ¢1i sRl~.{¢lI11¢-DL .. (11m I : ,
I ] ~ I~ I I ~I I~ I I ~ )
~ ~ i ~ I ~ I i ] ~ ~ Irr I I
T 1
~ 1 ~ ~ I II
] ~ l ~ ~ll ~ 231 - ~ £ ~
~ ' , e a r
Figure 4. Evolution of the recovery percentage per sector and recovery patterns associated - Test 4 -
ISSN 0148-9062

TO cite this paper: Int. J. Rock Mech. & Mm. Sci. 34:3-4, paper No. 094. Copyright © 1997 Elsevier Science Ltd
Paper 094, Figure 5.
:4 "
I~1) - l ~ . k
L' 7"0" h ~ [ ; i ) "
i 5 0 -
'u
~ ,, ', ', ,, j
. . . . . ,, ,, ,,,
, 1
g f i n - r)~ n'v
I
; ~ : . :
. &.
,
" "1 t.agcnli~ dl~l!la:cnlcnt (~J'y.)
, , , 1
n ,6 ,~ ? q ~ 2 • :?
S& - - S ~
S 4
,35
3 6
$ 7
,$8
T ~ t 5 - 2 7 ( V
2 0 D cm,~{ h
/~ i ~.~
5
a,; " 4 •
/q F ~ k
S" ,~7 ~ e, .NT_
r~ idu~ l l:,~h~.~ic" "
$5 $6 ~7
~ : : : : ] ~ : ,~ 4
i '.~" '~ , , i . . . . j' "(. ~ '
• i ,_~ 6. .~ 3L . .? 7 D "1 ~ ~ "3 i I..'~ - ?
"4 ~ :, • 4 5' q
i
.... i . . . . . . ~,~
I l L
i
~, . .1
b ~gl3m~
F i g u r e 5. Evolut ion of the recovery p e r c e n t a g e per sector and recovery pat terns assoc ia ted - Test 5 -
References
References
Archambault G., Gender S., Riss J., F lamand R., Sirieix C. 1996. Joint shear behav iour revised on the basis o f m o r p h o l o g y 3D mode l l ing and shear d isplacement - Proceedings of the 2nd North American Rock
ISSN 0148-9062

To cite this paper: Int. J. Rock Mech. & Min. Sci. 34:3-4, paper No. 094. Copyright © 1997 Elsevier Science Ltd
Mechanics Symposium, Balkema, Ed. M. Aubertin, F. Hassani and H. Mitri, Montreal (Canada), 19-21 June 1996, Vol. 2, pp 1223-1230.
Esaki T., Nakahara K., Jiang Y., Mitani Y. 1995 - Effects of preceding shear history on shear-flow coupling properties of rock joints. Proceedings of the International Symposium on Jointed and faulted rock, Balkema, Vienne (Austria), 10-14 April 1995, pp 501 -506.
Flamand R., Archambault G., Gentier S., Riss J., Rouleau A. 1994 - An experimental study of the shear behavior of irregular joints based on angularities and progressive degradation of the surfaces. 47~me Conf6rence Canadienne de G6otechnique - Halifax (23-25 septembre 1994).
Gale J. E., MacLeod R., Le Messurier P. 1990. Site characterization and validation. Measurement of flowrate, solute velocities and aperture variation in natural fractures as function of normal and shear stress, stage 3. Technical Report Stripa Project 90-11.
Gentier S., Petitjean C., Riss J., Archambault G. 1996.14ydromechanical behaviour of a natural joint under shearing. Proceedings of the 2nd North American Rock Mechanic's Symposium, Balkema, Ed. M. Aubertin, F. 14assani and 14. Mitri, Montreal (Canada), 19-21 June 1996, Vol. 2, pp 1201-1208.
Makurat A., Barton N., Rad N. S., Bandis S. 1990. Joint conductivity variation due to normal and shear deformation. Proceedings of the International Symposium on Rock Joints, Balkema, Loen (Norway), 4-6 June 1990, pp 535 -540.
Olsson W. A., Brown S. R. 1993.14ydromechanical response of a fracture undergoing compression and shear. Int. J. Rock Mech. Min. Sci. & Geomech. Abst~, 30: 845-851.
Riss J, Gentier S., Sirieix C., Archambault G, Flamand R. 1996. Degradation characterization of sheared joint wall surface morphology. Proceedings of the 2nd North American Rock Mechanics Symposium, Balkema, Ed. M. Aubertin, F. 14assani and 14. Mitri, Montreal (Canada), 19-21 June 1996, Vol. 2, pp 1343-1349.
Sharp J. C., Maini Y.N.T. 1972. Fundamental considerations on the hydraulic characteristics of joints in rock. Proceedings of the symposium : Percolation through fissured rock, Stuttgart (Germany), 1972, T1-F.
ISSN 0148-9062
Copyright © 2022 FDOKUMEN