Anatomical specificity of functional amygdala imaging of responses to stimuli with positive and...
14
Journal of Neuroscience Methods 180 (2009) 57–70 Contents lists available at ScienceDirect Journal of Neuroscience Methods journal homepage: www.elsevier.com/locate/jneumeth Anatomical specificity of functional amygdala imaging of responses to stimuli with positive and negative emotional valence Tonio Ball a,b,∗ , Johanna Derix a,c , Johanna Wentlandt a,c , Birgit Wieckhorst d,e , Oliver Speck f , Andreas Schulze-Bonhage a,b , Isabella Mutschler a,d,e a Epilepsy Center, University Hospital Freiburg, Germany b Bernstein Center for Computational Neuroscience, Freiburg, Germany c Institute of Biology III Neurobiology and Biophysics, University of Freiburg, Germany d Department of Psychiatry, University of Basel, Switzerland e Department of Psychology, University of Basel, Basel, Switzerland f Dept. of Biomedical Magnetic Resonance, Institute for Experimental Physics, Faculty of Natural Sciences, Otto-von-Guericke-University Magdeburg, Germany article info Article history: Received 21 January 2009 Received in revised form 25 February 2009 Accepted 26 February 2009 Keywords: Amygdala Functional MRI Probabilistic map Human Emotional valence abstract Non-invasive neuroimaging is increasingly used for investigating the human amygdala. Accurate func- tional localization in the amygdala region is, however, challenging and quantitative data on the anatomical specificity of functional amygdala imaging is lacking. We have therefore retrospectively investigated 114 recently published human functional imaging studies concerned with the amygdala. We determined the anatomical assignment probabilities of a total of 339 reported activation sites to the amygdala defined using a cytoarchitectonically verified probabilistic atlas system. We find that approximately 50% of reported responses were located in the region with high probability (≥80%) of belonging to the amyg- dala. This group included responses related both to stimuli of positive and negative emotional valence. Approximately 10% of reported response sites were assigned to the hippocampus, with up to 100% assign- ment probability. The remaining peaks were either located in the border regions of the amygdala and/or hippocampus or outside of both of these structures. Within the amygdala, the majority of peaks (96.3%) were found in the laterobasal (LB) and superficial (SF) subregions. Only 3.7% of peaks were found in the centromedial group (CM), possibly because anatomically delineating the CM region of the amygdala is particularly difficult and hence its extent might have been underestimated. Moreover, these results show that a core region of the amygdala is responsive to stimuli both of positive and negative emotional valence. The current findings highlight the usefulness of probabilistic amygdala maps and also point to a need for the development of accurate in vivo delineation and parcellation of the amygdala. © 2009 Elsevier B.V. All rights reserved. 1. Introduction Over the last years, there is increasing functional neuroimag- ing research on the human amygdala, a brain structure in the anterior medial temporal lobe (Zald, 2003; LeDoux, 2007). A moti- vation behind many of these studies is to understand the role of the amygdala in neuro-psychiatric diseases, such as depression and anxiety disorders (Birbaumer et al., 1998; Phillips et al., 2003). The amygdala is involved in the emotional processing of stimuli from multiple sensory modalities including chemosensory information (Winston et al., 2005), visual stimuli such as facial expression (Kim et al., 2003), and auditory stimuli including communication sounds ∗ Corresponding author at: Epilepsy-Center, Neurocenter, Breisacherstrasse 64, 79106 Freiburg, Germany. Tel.: +49 761 270 9316. E-mail address: [email protected] (T. Ball). (Sander and Scheich, 2005) and music (Köelsch et al., 2006; Ball et al., 2007). Furthermore, the amygdala might play an important role in evaluating stimulus salience and initiating behavioral responses based on the assessment of a given stimulus (Sander et al., 2003). For successful functional amygdala imaging, anatomical speci- ficity is crucial. Some of the anatomical borders of the amygdala such as to adjacent white matter can be delineated on current structural brain scans. Other anatomical borders of the amyg- dala, such as to the hippocampus, to the caudate nucleus, to the nucleus basalis, or to the adjacent neocortex can not as easily be determined (Amunts et al., 2005). This difficulty may compromise the anatomical specificity of functional imaging of the amygdala because responses of neighboring brain structures might be mis- taken to originate in the amygdala. Conversely, true amygdala responses might be erroneously assigned to neighboring structures. The situation is further complicated because in many current func- tional imaging studies the anatomical criteria used for delineating 0165-0270/$ – see front matter © 2009 Elsevier B.V. All rights reserved. doi:10.1016/j.jneumeth.2009.02.022
-
Upload
independent -
Category
Documents
-
view
2 -
download
0
Transcript of Anatomical specificity of functional amygdala imaging of responses to stimuli with positive and...

Journal of Neuroscience Methods 180 (2009) 57–70
Contents lists available at ScienceDirect
Journal of Neuroscience Methods
journa l homepage: www.e lsev ier .com/ locate / jneumeth
Anatomical specificity of functional amygdala imaging of responses to stimuli
with positive and negative emotional valence
Tonio Ball a,b,∗, Johanna Derixa,c, Johanna Wentlandta,c, Birgit Wieckhorstd,e,Oliver Speckf, Andreas Schulze-Bonhagea,b, Isabella Mutschlera,d,e
a Epilepsy Center, University Hospital Freiburg, Germanyb Bernstein Center for Computational Neuroscience, Freiburg, Germanyc Institute of Biology III Neurobiology and Biophysics, University of Freiburg, Germanyd Department of Psychiatry, University of Basel, Switzerlande Department of Psychology, University of Basel, Basel, Switzerlandf Dept. of Biomedical Magnetic Resonance, Institute for Experimental Physics, Faculty of Natural Sciences,
Otto-von-Guericke-University Magdeburg, Germany
a r t i c l e i n f o
Article history:
Received 21 January 2009
Received in revised form 25 February 2009
Accepted 26 February 2009
Keywords:
Amygdala
Functional MRI
Probabilistic map
Human
Emotional valence
a b s t r a c t
Non-invasive neuroimaging is increasingly used for investigating the human amygdala. Accurate func-
tional localization in the amygdala region is, however, challenging and quantitative data on the anatomical
specificity of functional amygdala imaging is lacking. We have therefore retrospectively investigated 114
recently published human functional imaging studies concerned with the amygdala. We determined
the anatomical assignment probabilities of a total of 339 reported activation sites to the amygdala
defined using a cytoarchitectonically verified probabilistic atlas system. We find that approximately 50%
of reported responses were located in the region with high probability (≥80%) of belonging to the amyg-
dala. This group included responses related both to stimuli of positive and negative emotional valence.
Approximately 10% of reported response sites were assigned to the hippocampus, with up to 100% assign-
ment probability. The remaining peaks were either located in the border regions of the amygdala and/or
hippocampus or outside of both of these structures. Within the amygdala, the majority of peaks (96.3%)
were found in the laterobasal (LB) and superficial (SF) subregions. Only 3.7% of peaks were found in the
centromedial group (CM), possibly because anatomically delineating the CM region of the amygdala is
particularly difficult and hence its extent might have been underestimated. Moreover, these results show
that a core region of the amygdala is responsive to stimuli both of positive and negative emotional valence.
The current findings highlight the usefulness of probabilistic amygdala maps and also point to a need for
the development of accurate in vivo delineation and parcellation of the amygdala.
© 2009 Elsevier B.V. All rights reserved.
1. Introduction
Over the last years, there is increasing functional neuroimag-
ing research on the human amygdala, a brain structure in the
anterior medial temporal lobe (Zald, 2003; LeDoux, 2007). A moti-
vation behind many of these studies is to understand the role of
the amygdala in neuro-psychiatric diseases, such as depression and
anxiety disorders (Birbaumer et al., 1998; Phillips et al., 2003). The
amygdala is involved in the emotional processing of stimuli from
multiple sensory modalities including chemosensory information
(Winston et al., 2005), visual stimuli such as facial expression (Kim
et al., 2003), and auditory stimuli including communication sounds
∗ Corresponding author at: Epilepsy-Center, Neurocenter, Breisacherstrasse 64,
79106 Freiburg, Germany. Tel.: +49 761 270 9316.
E-mail address: [email protected] (T. Ball).
(Sander and Scheich, 2005) and music (Köelsch et al., 2006; Ball et
al., 2007). Furthermore, the amygdala might play an important role
in evaluating stimulus salience and initiating behavioral responses
based on the assessment of a given stimulus (Sander et al., 2003).
For successful functional amygdala imaging, anatomical speci-
ficity is crucial. Some of the anatomical borders of the amygdala
such as to adjacent white matter can be delineated on current
structural brain scans. Other anatomical borders of the amyg-
dala, such as to the hippocampus, to the caudate nucleus, to the
nucleus basalis, or to the adjacent neocortex can not as easily be
determined (Amunts et al., 2005). This difficulty may compromise
the anatomical specificity of functional imaging of the amygdala
because responses of neighboring brain structures might be mis-
taken to originate in the amygdala. Conversely, true amygdala
responses might be erroneously assigned to neighboring structures.
The situation is further complicated because in many current func-
tional imaging studies the anatomical criteria used for delineating
0165-0270/$ – see front matter © 2009 Elsevier B.V. All rights reserved.
doi:10.1016/j.jneumeth.2009.02.022

58 T. Ball et al. / Journal of Neuroscience Methods 180 (2009) 57–70
the amygdala are neither clearly reported nor discussed in terms
of their limitations to reliably delineate the complete anatomical
extent of the amygdala.
Recently, a cytoarchitectonic map of the amygdala and of the
hippocampus has become available which is based on histolog-
ical analysis of ten human post-mortem brains (Amunts et al.,
2005). The advantage of probabilistic anatomical maps is that
they provide information about location and inter-individual vari-
ability of brain areas in standard reference space. This approach
allows assignment of activation sites to histologically defined brain
regions in a probabilistic fashion, even if these brain regions are
not discernible in structural brain images. In the great majority of
previous functional imaging studies reporting amygdala responses,
anatomical assignments were, however, made without taking into
account information from probabilistic anatomical maps but were
based on information from structural brain scans or on other,
conventional atlas systems. It is therefore not clear which anatom-
ical probabilities can be assigned to reported amygdala peaks if
they are re-assessed using the now available probabilistic map.
Furthermore, it is not clear whether all major anatomical subre-
gions of amygdala, i.e. the laterobasal group (LB), the superficial
group (SF), and the centromedial group (CM), are equally rep-
resented in the reported amygdala responses. The aim of the
present study was therefore to provide data on these issues by
conducting a meta-analysis of a large sample of recent functional
imaging studies of the human amygdala published between the
years 2000 and 2008. Using the probabilistic anatomical maps
of the amygdala and the hippocampus as described in the work
by Amunts et al. (2005), the probabilities with which reported
peaks belong to the amygdala or to the hippocampus as a whole,
and to the amygdala subregions LB, SF, and CM, were deter-
mined.
Furthermore, we have also addressed anatomical specificity of
responses to stimuli of positive and negative emotional valence,
respectively. On the background of a large field of animal research
on the role of amygdala in fear conditioning, many imaging stud-
ies have focused on emotions of negative valence and have used
experimental paradigms such as presentation of faces with fear-
ful expression to evoke amygdala responses (Morris et al., 1996;
Vuilleumier et al., 2001; Etkin et al., 2004; Whalen et al., 2004; Das
et al., 2005; L.M. Williams et al., 2005). Indeed, there is evidence for
a strong link of fear and the amygdala: in a recent meta-analysis,
60% of studies that examined fear activated the amygdala (Phan et
al., 2002). However, an increasing number of neuroimaging stud-
ies also report the involvement of the amygdala in processing of
positively valenced stimuli (Sergerie et al., 2008; Zald, 2003; Ball
et al., 2007). A further aim of the present study was therefore to
determine the anatomical specificity of responses to positive and
negative stimuli and to test whether responses to negative stim-
uli are more likely to originate in the amygdala than those from
positive ones.
2. Materials and methods
Using the National Center for Biotechnology Information (NCBI)
database ‘PubMed’ (http://www.ncbi.nlm.nih.gov/sites/entrez/)
and ‘Google Scholar’ (http://scholar.google.com) we searched for
studies reporting amygdala activation. The following inclusion
criteria were applied in order to select studies for the present
meta-analysis: (1) Studies had to investigate healthy adults
(healthy controls from clinical studies were also included). (2)
Acquisition techniques had to be functional MRI (fMRI) or positron
emission tomography (PET). (3) At least one peak of ‘amygdala’
activation had to be clearly reported. Ambiguously labeled peaks
were excluded. Examples of such excluded labels are: ‘periamyg-
daloid complex’, ‘peri-amygdala’, or ‘amygdala region’. Also peaks
assigned to a border region of the amygdala were not included (e.g.
‘parahippocampal gyrus/amygdala’). (4) In order to select studies
thematically concerned with the amygdala, the term amygdala had
to occur in the title or in the abstract. (5) We only included results
from data sets that were pre-processed by any version of SPM later
than SPM95 to ensure that the original analysis was in standard
MNI space (SPM versions used were SPM96, SPM97, SPM99,
SPM2, SPM2b, and SPM5). This point is important because the
probabilistic maps used for further analysis of the response peaks
are also in (anatomical) MNI space. (6) Some studies do not report
the original MNI coordinates from SPM but coordinates trans-
formed to Talairach space. For those studies reporting Talairach
coordinates derived from the original MNI coordinates, either the
transformation algorithm had to be apparent from the article (in
all such studies included in the present meta-analysis this was
the ‘mni2tal’ MATLAB script publicly available from http://eeg.
sourceforge.net/doc m2htmlbioelectromagnetism/mni2tal.html)
and the reported co-ordinates were thus re-transformed to MNI
space using the ‘tal2mni’ script based on the same algorithm (from
http://eeg.sourceforge.net/doc m2html/bioelectromagnetism/
tal2mni.html). Otherwise, if the transformation could not be
reversed in this way, the authors of the paper in question were
asked by e-mail to provide us with software that could be used
for accurate re-transformation of the reported coordinates to MNI
space or to provide us with the original MNI coordinates of the
reported amygdala responses. If the MNI coordinates could also
not be obtained in this last way, the study was not included. (7)
Studies had to be published between the years 2000 and 2008
(inclusively).
For all included peaks, assignment probabilities to the amygdala
subregions LB, SF, and CM, and to the hippocampus were deter-
mined using the probabilistic maps of Amunts et al. (2005). In these
maps, LB comprises the lateral, basolateral, basomedial, and par-
alaminar nuclei, CM the central and medial nuclei, and SF includes
the anterior amygdaloid area, the ventral and posterior cortical
nuclei. The probabilistic anatomical maps can be freely accessed
through http://www.fz-juelich.de/ime/spm anatomy toolbox. In
this way, for each coordinate the ‘raw’ anatomical probabilities were
obtained (such as, for instance, 60% probability for amygdala LB, 30%
for amygdala SF, and 20% for hippocampus/cornu ammonis (CA),
etc.). Based on these raw probabilities an assignment to one of the
candidate regions was made.
An anatomical assignment algorithm that has been proposed
for this aim is the maximum probability map (MPM) approach of
Eickhoff et al. (2006). MPMs are based on the idea of assigning
each voxel to the most likely cytoarchtectonic area at this position.
If several areas have the same probability, information from the
neighboring voxels and from smoothed probability maps is also
used. A feature of the maps obtained is that they are continuous
without any gaps between the single areas. However, there are also
alternative assignment procedures conceivable, as illustrated by the
following examples. For instance, the voxel at MNI coordinates −30,
−8, −30 has 40% probability for LB, 40% for hippocampus/cornu
ammonis, 10% for entorhinal cortex, 10% for hippocampus/FD, and
40% for hippocampus/subiculum (SUB). In this case, the summed
probability of the hippocampus is 100%, but for the amygdala only
40% (note that through effects possibly including partial volume
effects occurring during image normalization the summed raw
anatomical probabilities at some voxels may surpass 100%). Based
on the much higher summed probability for the hippocampus, it
seems intuitive to assign this voxel to the hippocampus rather than
to the amygdala. The MPM algorithm as described by Eickhoff et al.
(2006), however, disregards anatomical hierarchies and treats each
subregion separately. In the present example, three regions (LB, CA,
SUB) have the same probability of 40%. In this case, the MPM algo-
rithm of Eickhoff and colleagues uses probabilities of neighboring
T. Ball et al. / Journal of Neuroscience Methods 180 (2009) 57–70 59
Fig. 1. Anatomical assignment to the amygdala. The probabilistically defined amyg-
dala volume is shown superimposed on a coronal anatomical slice. The dark blue
region corresponds to the core region of the amygdala with ≥80% assignment prob-
ability determined through a hierarchical assignment algorithm (see Section 2 for
further details). The volume of this core region with high assignment probability
was close to the mean total volume of the amygdala as has been recently determined
micro-anatomically (3042 mm3) (Amunts et al., 2005). The light blue region corre-
sponds to the anatomical border region of the amygdala (see Section 2 for further
details). Voxels in this outer border region had lower amygdala probability than the
core region (down to 20%). The main conclusions of our study are based on assign-
ments to the core area. (For interpretation of the references to color in this figure
legend, the reader is referred to the web version of the article.)
voxels and sometimes also of a smoothed probability map to arrive
at an anatomical assignment, which in this case favors LB over any
of the hippocampus subareas, although the summed hippocampus
probability is in this example higher than the summed amygdala
probability. Another property of the MPM algorithm of Eickhoff
and colleagues is that voxels with only 10% or 20% probability for a
certain area can already be assigned to this area. For instance, the
position at MNI coordinates −13, −11, −18 is assigned to SF using
the MPM algorithm, although the raw probability for SF at these
coordinates is only 20%.
We have therefore analyzed our data using a hierarchical assign-
ment algorithm (Fig. 1), which makes use of anatomical hierarchies
and was restricted to the anatomical core regions of the amygdala
and hippocampus with high anatomical probability. To this end, the
probabilities for the amygdala and hippocampus subregions were
first summed up and an assignment to the amygdala as a whole or
the hippocampus as a whole was then made based on the probabil-
ity sum. As we were interested in the region with high anatomical
specificity, the probability limit for assignment was set to ≥80%.
Using this approach, the voxel at MNI coordinates−30,−8,−30 with
summed amygdala probability of 40% and summed hippocampus
probability of 100% (see above), was now assigned to the hippocam-
pus. The voxel at MNI coordinates −13, −11, −18 with only 20%
probability to belong to SF was neither assigned to the amygdala
nor to the hippocampus but remained unassigned. As the second
step in our hierarchical assignment procedure, we made an assign-
ment to the subregions of the amygdala and hippocampus based
on the maximal probability for any of the subregions. Furthermore,
we defined a border region of the amygdala as the region that was
assigned to the amygdala by the MPM algorithm by Eickhoff and
colleagues, but was outside of the ≥80% anatomical core region.
We required a relatively high (≥80%) probability as a prereq-
uisite for an anatomical assignment. We have previously used a
similar assignment based on high (≥80%) anatomical probabilities
for investigating fMRI responses in the amygdala subregions LB,
SF, and CM during auditory processing, arguing for restricting the
assigned volume to the core areas with high probability in order
to increase the robustness against localization errors, which are
Fig. 2. 3D positions of the 339 amygdala response peaks included in the present
study are shown in relation to the probabilistically defined right and left amygdala.
Anterior is to the right. The core region of the amygdala with high (≥80%) probabil-
ity is shown in dark blue. Peaks assigned to this region with high probability (48.4%
of all peaks) are indicated by black squares, peaks assigned to the core area of the
hippocampus by red squares. The border region of the amygdala is shown in light
blue (see Section 2 for further details). Peaks assigned to the border region of the
amygdala area are indicated by black dots. For the border region of the hippocam-
pus, peaks are marked by red dots. Unassigned peaks are shown in yellow. These
unassigned peaks had down to 0% probability to be located either in the amygdala
or in the hippocampus. (For interpretation of the references to color in this figure
legend, the reader is referred to the web version of the article.)
especially important to consider in the amygdala region (Ball et
al., 2007).
Few peaks were found in CM (i.e. only six peaks, see Section 3).
We therefore tested, using a permutation test assigning all peaks to
randomly selected positions within the amygdala (10,000 permuta-
tions), whether the observed number of peaks assigned to CM was
compatible with the assumption of an equal random distribution
of peaks throughout the whole amygdala volume.
Finally, the same analyses that were carried out for all peaks
were also separately repeated for peaks from studies using stimuli
with either clearly positive or negative valence. Stimuli of ques-
tionable of rather neutral valence were excluded from this analysis.
For instance erotic stimuli (if no explicit valence ratings are given)
might either be conceived as pleasant or possibly also as embar-
rassing and were hence excluded. Differences in the anatomical
probabilities for belonging to either the amygdala or the hippocam-
pus between the group of peaks related to positive and negative
stimuli was assessed using a Wilcoxon rank sum test.
3. Results
A total of 106 fMRI and 8 PET studies were included, resulting
in 335 amygdala response peaks. A complete reference list of all
included studies is given in Table 1 . The 3D distribution of all peaks
in relation to the probabilistically defined amygdala is shown in
Fig. 2. Using the hierarchical assignment to the core regions of the
amygdala and the hippocampus (with ≥80% anatomical assignment
60 T. Ball et al. / Journal of Neuroscience Methods 180 (2009) 57–70
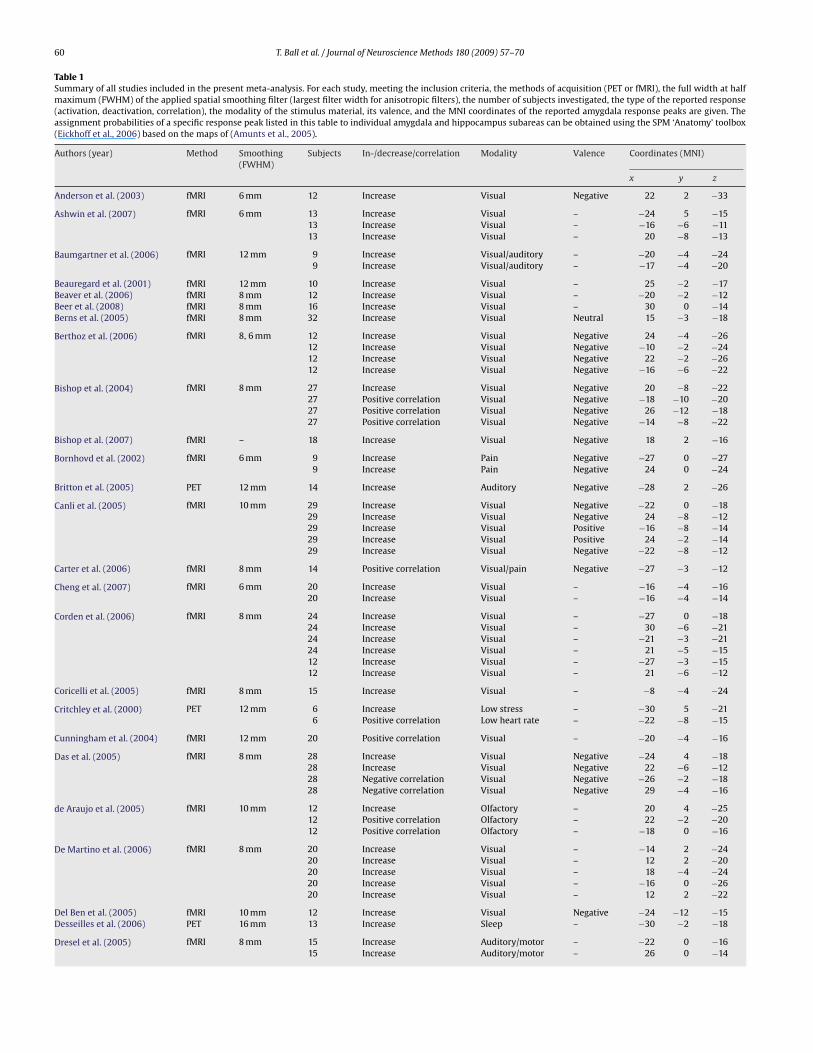
Table 1Summary of all studies included in the present meta-analysis. For each study, meeting the inclusion criteria, the methods of acquisition (PET or fMRI), the full width at half
maximum (FWHM) of the applied spatial smoothing filter (largest filter width for anisotropic filters), the number of subjects investigated, the type of the reported response
(activation, deactivation, correlation), the modality of the stimulus material, its valence, and the MNI coordinates of the reported amygdala response peaks are given. The
assignment probabilities of a specific response peak listed in this table to individual amygdala and hippocampus subareas can be obtained using the SPM ‘Anatomy’ toolbox
(Eickhoff et al., 2006) based on the maps of (Amunts et al., 2005).
Authors (year) Method Smoothing
(FWHM)
Subjects In-/decrease/correlation Modality Valence Coordinates (MNI)
x y z
Anderson et al. (2003) fMRI 6 mm 12 Increase Visual Negative 22 2 −33
Ashwin et al. (2007) fMRI 6 mm 13 Increase Visual – −24 5 −15
13 Increase Visual – −16 −6 −11
13 Increase Visual – 20 −8 −13
Baumgartner et al. (2006) fMRI 12 mm 9 Increase Visual/auditory – −20 −4 −24
9 Increase Visual/auditory – −17 −4 −20
Beauregard et al. (2001) fMRI 12 mm 10 Increase Visual – 25 −2 −17
Beaver et al. (2006) fMRI 8 mm 12 Increase Visual – −20 −2 −12
Beer et al. (2008) fMRI 8 mm 16 Increase Visual – 30 0 −14
Berns et al. (2005) fMRI 8 mm 32 Increase Visual Neutral 15 −3 −18
Berthoz et al. (2006) fMRI 8, 6 mm 12 Increase Visual Negative 24 −4 −26
12 Increase Visual Negative −10 −2 −24
12 Increase Visual Negative 22 −2 −26
12 Increase Visual Negative −16 −6 −22
Bishop et al. (2004) fMRI 8 mm 27 Increase Visual Negative 20 −8 −22
27 Positive correlation Visual Negative −18 −10 −20
27 Positive correlation Visual Negative 26 −12 −18
27 Positive correlation Visual Negative −14 −8 −22
Bishop et al. (2007) fMRI – 18 Increase Visual Negative 18 2 −16
Bornhovd et al. (2002) fMRI 6 mm 9 Increase Pain Negative −27 0 −27
9 Increase Pain Negative 24 0 −24
Britton et al. (2005) PET 12 mm 14 Increase Auditory Negative −28 2 −26
Canli et al. (2005) fMRI 10 mm 29 Increase Visual Negative −22 0 −18
29 Increase Visual Negative 24 −8 −12
29 Increase Visual Positive −16 −8 −14
29 Increase Visual Positive 24 −2 −14
29 Increase Visual Negative −22 −8 −12
Carter et al. (2006) fMRI 8 mm 14 Positive correlation Visual/pain Negative −27 −3 −12
Cheng et al. (2007) fMRI 6 mm 20 Increase Visual – −16 −4 −16
20 Increase Visual – −16 −4 −14
Corden et al. (2006) fMRI 8 mm 24 Increase Visual – −27 0 −18
24 Increase Visual – 30 −6 −21
24 Increase Visual – −21 −3 −21
24 Increase Visual – 21 −5 −15
12 Increase Visual – −27 −3 −15
12 Increase Visual – 21 −6 −12
Coricelli et al. (2005) fMRI 8 mm 15 Increase Visual – −8 −4 −24
Critchley et al. (2000) PET 12 mm 6 Increase Low stress – −30 5 −21
6 Positive correlation Low heart rate – −22 −8 −15
Cunningham et al. (2004) fMRI 12 mm 20 Positive correlation Visual – −20 −4 −16
Das et al. (2005) fMRI 8 mm 28 Increase Visual Negative −24 4 −18
28 Increase Visual Negative 22 −6 −12
28 Negative correlation Visual Negative −26 −2 −18
28 Negative correlation Visual Negative 29 −4 −16
de Araujo et al. (2005) fMRI 10 mm 12 Increase Olfactory – 20 4 −25
12 Positive correlation Olfactory – 22 −2 −20
12 Positive correlation Olfactory – −18 0 −16
De Martino et al. (2006) fMRI 8 mm 20 Increase Visual – −14 2 −24
20 Increase Visual – 12 2 −20
20 Increase Visual – 18 −4 −24
20 Increase Visual – −16 0 −26
20 Increase Visual – 12 2 −22
Del Ben et al. (2005) fMRI 10 mm 12 Increase Visual Negative −24 −12 −15
Desseilles et al. (2006) PET 16 mm 13 Increase Sleep – −30 −2 −18
Dresel et al. (2005) fMRI 8 mm 15 Increase Auditory/motor – −22 0 −16
15 Increase Auditory/motor – 26 0 −14

T. Ball et al. / Journal of Neuroscience Methods 180 (2009) 57–70 61
Table 1 (Continued)
Authors (year) Method Smoothing
(FWHM)
Subjects In-/decrease/correlation Modality Valence Coordinates (MNI)
x y z
Eippert et al. (2007) fMRI 12 mm 24 Increase Visual Negative −24 −3 −12
24 Increase Visual Negative 30 −3 −12
24 Increase Visual – −27 −3 −21
24 Increase Visual – 21 3 −18
24 Increase Visual – −18 0 −12
24 Increase Visual – 24 0 −21
24 Increase Visual – −24 −9 −12
24 Positive correlation Visual – −18 −3 −21
24 Positive correlation Visual – 18 −3 −15
Elliott et al. (2003) fMRI 10 mm 12 Increase Visual Positive 24 −6 −18
Ernst et al. (2002) PET 10 mm 20 Increase Visual – −28 2 −26
Etkin et al. (2004) fMRI 8 mm 17 Positive correlation Visual Negative 28 −10 −22
17 Increase Visual Negative 16 −8 −12
Etkin et al. (2006) fMRI 8 mm 19 Increase Visual – 18 2 −16
19 Negative correlation Visual – 16 0 −16
Eugene et al. (2003) fMRI 12 mm 10 Increase Visual Negative −30 0 −18
Evans et al. (2002) fMRI 6 mm 6 Increase Air hunger Negative −20 2 −14
6 Increase Air hunger Negative 24 4 −14
Fischer et al. (2004) fMRI 12 mm 24 Increase Visual – −20 −2 −24
Fitzgerald et al. (2006) fMRI 8 mm 20 Increase Visual – −24 −2 −24
20 Increase Visual Negative −22 −8 −24
20 Increase Visual Negative −20 2 −22
20 Increase Visual Negative −20 −4 −22
20 Increase Visual Negative −26 −6 −24
20 Increase Visual Neutral −20 −8 −18
20 Increase Visual Positive −20 −4 −22
Garrett and Maddock
(2006)
fMRI 4 mm 9 Increase Visual Negative −22 4 −20
9 Increase Visual Negative 20 −2 −12
George et al. (2001) fMRI 10 mm 7 Positive correlation Visual Neutral −18 6 −24
7 Positive correlation Visual Neutral 18 3 −21
Glascher et al. (2004) fMRI 11 mm 11 Increase Visual – 18 0 −18
11 Increase Visual – −15 0 −15
Goldstein et al. (2005) fMRI 8 mm 12 Increase Visual Negative −24 −9 −12
12 Increase Visual Negative 24 0 −21
12 Increase Visual Negative −21 −3 −21
12 Positive correlation Visual Negative −21 −9 −12
Gottfried et al. (2002) fMRI 8 mm 15 Increase Olfactory/visual – −14 −10 −18
15 Increase Olfactory/visual – 24 −8 −18
15 Increase Olfactory/visual Negative 24 −12 −16
15 Increase Olfactory/visual Negative 18 −6 −16
Gottfried and Dolan (2003) fMRI 8 mm 15 Increase Olfactory/visual – −21 −6 −24
Gottfried et al. (2003) fMRI 6 mm 13 Increase Olfactory/visual – −24 −12 −12
13 Increase Olfactory/visual – −15 −6 −18
13 Increase Olfactory/visual – −15 −6 −18
13 Increase Olfactory/visual – −24 −12 −12
Gottfried and Dolan (2004) fMRI 6 mm 16 Increase Olfactory/visual – 12 −6 −15
16 Increase Olfactory/visual – −15 −9 −21
16 Increase Olfactory/visual – 33 −3 −27
16 Increase Olfactory/visual – −27 −9 −24
16 Increase Olfactory/visual – 18 3 −27
16 Increase Olfactory/visual – −27 −9 −15
16 Increase Olfactory/visual – −9 −9 −21
Hamann and Mao (2002) fMRI 8 mm 14 Increase Visual Positive −24 −7 −24
14 Increase Visual Negative −24 −7 −19
Hamann et al. (2004) fMRI 8 mm 28 Increase Visual Positive −16 0 −20
28 Increase Visual Positive 16 0 −16
14 Increase Visual Positive −16 0 −24
14 Increase Visual Positive 20 0 −20
28 Increase Visual Positive −20 −4 −20
28 Increase Visual Positive −16 0 −16
28 Increase Visual Positive 24 −4 −24
28 Increase Visual Positive 16 0 −16

62 T. Ball et al. / Journal of Neuroscience Methods 180 (2009) 57–70
Table 1 (Continued)
Authors (year) Method Smoothing
(FWHM)
Subjects In-/decrease/correlation Modality Valence Coordinates (MNI)
x y z
Hardee et al. (2008) fMRI 8 mm 13 Increase Visual Negative 26 −6 −18
13 Increase Visual Negative −22 −4 −18
13 Increase Visual – 24 −6 −20
13 Increase Visual – −22 −6 −18
13 Increase Visual Positive 24 −6 −18
13 Increase Visual Positive −24 −6 −18
13 Increase Visual – 24 −6 −18
13 Increase Visual – −22 −6 −18
13 Increase Visual Negative 22 2 −12
13 Increase Visual Negative −20 4 −14
13 Increase Visual Negative 28 −4 −22
13 Increase Visual Negative −20 4 −14
13 Increase Visual Negative 22 2 −12
13 Increase Visual Negative −20 4 −14
Hariri et al. (2000) fMRI 6 mm 16 Increase Visual – −24 −9 −27
16 Increase Visual – 24 −1 −26
16 Increase Visual – −22 −7 −29
16 Increase Visual – 34 −18 −20
16 Positive correlation Visual – 36 −7 −29
Hariri et al. (2002) fMRI 8 mm 12 Increase Visual Negative −22 −5 −19
12 Increase Visual Negative 16 −3 −19
Hariri et al. (2003) fMRI 8 mm 11 Increase Visual Negative −22 −5 −15
11 Increase Visual Negative 26 −5 −15
11 Increase Visual Negative −26 −8 −15
11 Increase Visual Negative 26 −8 −15
11 Positive correlation Visual Negative 24 −5 −19
Holstege et al. (2003) PET 10 mm 11 Decrease Ejaculation Positive −18 2 −24
Hooker et al. (2006) fMRI 8 mm 12 Increase Visual – 22 0 −18
Keightley et al. (2003) fMRI 10 mm 6 Increase Visual – −28 −4 −15
6 Increase Visual – 16 −3 −24
Killgore et al. (2000) fMRI 15 mm 7 Increase Visual – −27 −7 −11
7 Increase Visual – −23 −2 −23
7 Increase Visual – 24 −10 −35
7 Increase Visual – −19 −6 −23
7 Increase Visual – 32 −10 −29
Killgore et al. (2003) fMRI 10 mm 13 Increase Visual – 22 −4 −21
13 Increase Visual – −20 0 −24
Killgore and Yurgelun-Todd
(2004)
fMRI 10 mm 12 Increase Visual Positive −20 −6 −18
12 Increase Visual Positive 22 0 −20
12 Increase Visual Positive 24 0 −24
12 Increase Visual – −28 −6 −18
Kilpatrick and Cahill (2003) PET 8 mm 11 Increase Visual/auditory Negative 20 −4 −24
Kim and Hamann (2007) fMRI 6 mm 10 Increase Visual Positive 18 3 −18
10 Increase Visual – −27 0 −21
Koch et al. (2007) fMRI 10 mm 40 Positive correlation Olfactory/visual Negative −22 −2 −12
Labar et al. (2001) fMRI 7 mm 17 Increase Visual – −21 −3 −27
17 Increase Visual – −33 6 −30
17 Increase Visual – −15 −12 24
Labar et al. (2003) fMRI 8 mm 10 Increase Visual Negative −19 −8 −23
10 Increase Visual Negative 26 −4 −23
10 Increase Visual Negative 11 −11 −19
10 Increase Visual Negative −15 −15 −11
10 Increase Visual Negative 26 −4 −26
10 Increase Visual Neutral −15 −8 −19
Lenzi et al. (2008) fMRI 8 mm 16 Increase Visual – 26 2 −17
16 Increase Visual – −28 4 −8
16 Increase Visual – 18 −2 −8
16 Increase Visual – −20 −4 −9
Levesque et al. (2003) fMRI 12 mm 20 Increase Visual Negative −24 −3 −18
Lewis et al. (2007) fMRI 8 mm 19 Positive correlation Visual Negative −24 −2 −12
19 Positive correlation Visual – −20 −8 −14

T. Ball et al. / Journal of Neuroscience Methods 180 (2009) 57–70 63
Table 1 (Continued)
Authors (year) Method Smoothing
(FWHM)
Subjects In-/decrease/correlation Modality Valence Coordinates (MNI)
x y z
Liddell et al. (2005) fMRI 8 mm 22 Increase Visual Negative −18 2 −20
22 Increase Visual Negative 28 −4 −12
Lotze et al. (2006) fMRI 9 mm 20 Increase Visual – −21 −6 −18
20 Increase Visual – 21 −6 −18
McClure et al. (2004) fMRI 8 mm 17 Increase Visual Negative 34 −6 −12
17 Increase Visual Negative 36 −2 −20
17 Increase Visual Negative 36 0 −14
17 Increase Visual Negative 38 2 −18
17 Increase Visual Negative −28 2 −20
8 Increase Visual Negative −20 −8 −6
9 Increase Visual Neutral −22 −10 −8
Ochsner et al. (2002) fMRI 6 mm 15 Increase Visual Negative 16 −12 −20
Ochsner et al. (2004) fMRI 6 mm 24 Increase Visual Negative −30 −2 −20
24 Increase Visual Negative −28 −4 −14
24 Increase Visual Negative 20 0 −24
O’Doherty et al. (2002) fMRI 10 mm 8 Increase Taste/visual Positive 28 −8 −14
O’Doherty et al. (2003) fMRI 8 mm 15 Increase Visual Neutral −27 −3 −27
15 Increase Visual Neutral −27 −3 −30
Ogino et al. (2007) fMRI 10 mm 10 Increase Visual Negative −20 4 −16
Onoda et al. (2008) fMRI 8 mm 18 Increase Visual – −24 0 −22
Phan et al. (2003) fMRI 8 mm 8 Increase Visual Negative −21 −6 −15
8 Increase Visual Negative −18 −3 −15
Phan et al. (2004) fMRI 6 mm 12 Positive correlation Visual – 33 −6 −12
12 Positive correlation Visual – −27 0 −15
12 Increase Visual – −21 −6 −12
Phan et al. (2005) fMRI 6 mm 14 Increase Visual Negative −32 −4 −24
14 Increase Visual Negative 26 2 −24
14 Increase Visual Negative −28 0 −28
14 Increase Visual Negative 16 0 −28
14 Increase Visual Negative −26 6 −26
14 Increase Visual Negative −18 −4 −20
Plailly et al. (2005) fMRI 10 mm 14 Increase Olfactory – −24 −6 −12
14 Increase Olfactory – 20 −16 −10
Protopopescu et al. (2005) fMRI – 21 Decrease Visual – −21 0 −24
21 Increase Visual – −27 −3 −24
21 Increase Visual – 18 −3 −24
21 Increase Visual – −21 −6 −12
21 Increase Visual – −27 −3 −27
Royet et al. (2000) PET 16 mm 12 Increase Olfactory – −22 0 −12
Royet et al. (2003) fMRI 10 mm 28 Increase Olfactory – −22 −2 −12
28 Increase Olfactory – −14 −8 −22
Ruby and Decety (2004) PET 10 mm 10 Increase Visual – −26 14 −32
10 Increase Visual – 26 −2 −24
Sato et al. (2004) fMRI 6 mm 10 Positive correlation Visual – −20 −6 −10
10 Increase Visual Negative −22 −11 −16
10 Increase Visual Negative −22 −9 −16
Schendan et al. (2003) fMRI – 15 Increase Visual – 21 6 −21
Schienle et al. (2005) fMRI 9 mm 63 Increase Visual Negative −18 −6 −18
63 Increase Visual Negative 24 0 −24
63 Positive correlation Visual Negative 21 −6 −12
63 Positive correlation Visual Negative 21 −6 −12
63 Positive correlation Visual Negative 18 −3 −15
63 Positive correlation Visual Negative 24 −9 −15
Sergerie et al. (2006) fMRI 8 mm 18 Increase Visual Negative −24 −8 −20
18 Increase Visual Negative 30 2 −34
18 Increase Visual Negative −20 −4 −12
18 Increase Visual Negative −14 −8 −24
18 Increase Visual Negative 30 0 −34
18 Increase Visual Negative −28 −4 −18

64 T. Ball et al. / Journal of Neuroscience Methods 180 (2009) 57–70
Table 1 (Continued)
Authors (year) Method Smoothing
(FWHM)
Subjects In-/decrease/correlation Modality Valence Coordinates (MNI)
x y z
Sergerie et al. (2007) fMRI 8 mm 20 Positive correlation Visual Negative 22 −8 −28
20 Positive correlation Visual Positive −26 2 −26
20 Positive correlation Visual Positive −24 0 −24
20 Positive correlation Visual Positive 22 −2 −24
20 Positive correlation Visual – 22 −6 −26
Seymour et al. (2005) fMRI 6 mm 19 Increase Pain/temperature – −20 2 −26
Singer et al. (2004) fMRI 10 mm 11 Increase Visual – −21 0 −18
11 Increase Visual – −21 0 −21
Small et al. (2003) fMRI 7 mm 9 Increase Gustatory – 15 −10 −15
9 Increase Gustatory Positive −24 −6 −21
9 Increase Gustatory Positive −12 −12 −21
9 Increase Gustatory Negative 27 −9 −12
Small et al. (2005) fMRI 7 mm 11 Increase Olfactory Positive −27 0 −21
Smith et al. (2006) fMRI 8 mm 16 Increase Visual Negative −24 −3 −18
16 Increase Visual – −24 −6 −15
Smith et al. (2009) fMRI 6 mm 25 Increase Visual – 22 −4 −18
Somerville et al. (2006) fMRI 6 mm 16 Increase Visual – −21 −4 −15
16 Increase Visual – 18 −7 −15
16 Increase Visual – 15 −9 −12
Stark et al. (2004) fMRI 9 mm 24 Increase Visual Negative −18 −3 −27
24 Increase Visual Negative 21 −6 −18
24 Increase Visual Negative 18 −9 −18
24 Increase Visual Negative 18 6 −24
Stark et al. (2005) fMRI 6 mm 24 Increase Visual Negative −21 −3 −15
24 Increase Visual – 24 6 −18
24 Increase Visual – −21 −3 −18
24 Increase Visual – 30 −3 −15
24 Increase Visual – −18 −6 −18
24 Increase Visual – 27 −3 −27
Stark et al. (2007) fMRI 9 mm 66 Increase Visual Negative 33 0 −24
66 Increase Visual Negative −30 −3 −21
66 Increase Visual Negative 36 0 −27
66 Increase Visual Negative 30 3 −21
66 Increase Visual Negative −24 −6 −15
66 Increase Visual Negative 33 0 −24
66 Increase Visual Negative 33 0 −24
66 Increase Visual Negative −24 −3 −24
66 Increase Visual Negative 30 0 −27
66 Increase Visual Negative −21 −3 −27
66 Increase Visual Negative 24 −3 −18
66 Increase Visual Negative −24 −6 −18
Sterpenich et al. (2006) fMRI 8 mm 30 Positive correlation Visual Neutral 8 −6 −24
Tabbert et al. (2006) fMRI 9 mm 33 Increase Sensory/visual Negative 27 3 −18
17 Increase Sensory/visual Negative 27 3 −18
16 Increase Sensory/visual Negative −30 0 −27
16 Increase Sensory/visual Negative 27 3 −21
17 Increase Sensory/visual Negative −30 0 −27
17 Increase Sensory/visual Negative 33 3 −21
33 Increase Sensory/visual Negative 21 0 −15
Takahashi et al. (2006) fMRI 8 mm 22 Increase Visual Negative 22 2 −14
22 Increase Visual Negative 22 2 −14
Taylor et al. (2006) fMRI 8 mm 30 Negative correlation Visual Negative −20 −8 −18
30 Increase Visual Negative −24 0 −24
30 Increase Visual Negative −26 2 −22
Tessitore et al. (2005) fMRI 10 mm 12 Increase Visual Negative −17 −8 13
12 Increase Visual Negative 17 −2 −19
15 Increase Visual Negative −21 −11 −13
15 Increase Visual Negative 21 −8 −15
27 Increase Visual Negative 29 1 −19
van der Veen et al. (2007) fMRI 8 mm 11 Increase Visual – 28 −5 −27
Vuilleumier et al. (2001) fMRI 8 mm 12 Increase Visual Negative −20 −2 −18
12 Increase Visual Negative 16 −10 −18
12 Increase Visual Negative −26 −2 −20
12 Increase Visual Negative −26 0 −20

T. Ball et al. / Journal of Neuroscience Methods 180 (2009) 57–70 65
Table 1 (Continued)
Authors (year) Method Smoothing
(FWHM)
Subjects In-/decrease/correlation Modality Valence Coordinates (MNI)
x y z
Vuilleumier et al. (2003) fMRI 8 mm 13 Increase Visual Negative −20 −10 −28
13 Increase Visual Negative 20 −10 −30
13 Positive correlation Visual – −22 4 −18
13 Positive correlation Visual – −16 −8 −18
13 Positive correlation Visual – 18 2 −20
13 Positive correlation Visual – 22 0 −30
Vuilleumier et al. (2004) fMRI 8 mm 13 Increase Visual Negative −15 −3 −21
13 Increase Visual Negative 24 −3 −21
Walter et al. (2008) fMRI 8 mm 21 Increase Visual – 18 −3 −15
21 Increase Visual – −15 3 −18
21 Increase Visual – 18 0 −18
Wang et al. (2006) fMRI 8 mm 20 Increase Visual Negative −22 −8 −15
20 Increase Visual Negative 26 −8 −18
20 Increase Visual Negative −19 −8 −15
20 Increase Visual Negative 22 −8 −15
Wild et al. (2003) fMRI 9 mm 10 Increase Visual/motor – 30 −9 −9
L.M. Williams et al. (2005) fMRI 6 mm 20 Increase Visual Negative −28 −2 −24
20 Increase Visual Negative 26 −2 −24
19 Increase Visual Negative 26 −6 −10
Williams et al. (2006) fMRI 8 mm 15 Increase Visual Negative −16 2 −16
15 Increase Visual Negative 18 2 −16
M.A. Williams et al. (2005) fMRI 8 mm 13 Increase Visual – 32 −12 −22
13 Decrease Visual – −20 −8 −16
13 Decrease Visual – 28 −4 −22
Winston et al. (2002) fMRI 8 mm 14 Increase Visual Negative 18 0 −24
14 Increase Visual Negative −16 −4 −20
Winston et al. (2003) fMRI 8 mm 11 Increase Visual – 34 0 −26
11 Increase Visual – −24 −6 −18
11 Increase Visual – 30 −4 −22
11 Increase Visual – −24 −2 −24
Winston et al. (2007) fMRI 8 mm 26 Increase Visual – −24 0 −24
26 Positive correlation Visual – 27 0 −24
26 Positive correlation Visual – 27 0 −21
26 Positive correlation Visual – −15 −9 −27
26 Positive correlation Visual – −21 −3 −33
Wood et al. (2005) fMRI 12 mm 23 Increase Visual – 28 −8 −31
Zink et al. (2008) fMRI 8 mm 24 Increase Visual – 24 −3 −21
probability), 48.4% of all peaks could be assigned to the amygdala.
11.8% of peaks were assigned to the core region of the hippocampus.
The anatomical probabilities of belonging to the amygdala and
to the hippocampus are given in Fig. 3 for all peaks included in
the study. The assignment probability to the amygdala was in
most cases high, often 100%. There were, however, also a con-
siderable number of reported amygdala peaks with low or very
low amygdala assignment probabilities. 50 peaks had 0% amyg-
dala probability according to the currently available probabilistic
anatomical maps used in the present study. Hippocampus assign-
ment probability was typically low. There were, however, 56 peaks
with ≥80% assignment probability to the hippocampus. 34 peaks
had 100% probability to be located in the hippocampus.
157 peaks were related to stimuli of clearly negative and 27
peaks were related to stimuli of clearly positive emotional valence.
The remaining peaks were either (rather) neutral in emotional
valence or could not clearly be judged in respect to their valence.
3D distributions of all peaks related to positive and negative stim-
uli are shown in Fig. 4. From the 157 peaks related to stimuli of
clearly negative emotional valence 76 peaks could be assigned to
the core area of the amygdala (48.4% of all peaks related to negative
stimuli). From 27 peaks related to clearly positive stimuli 16 were
assigned to the amygdala core region (59% of all peaks related to
positive stimuli). There was no difference in the anatomical prob-
abilities for belonging to either the amygdala or the hippocampus
between the group of peaks related to positive and negative stimuli
(Wilcoxon rank sum test, p > 0.5).
Of the peaks assigned to the core region of the amygdala, 102
(62.2%) were assigned to LB, 56 (34.2%) to SF, and 6 (3.7%) to CM
(Fig. 4). The observed number of 6 peaks was significantly smaller
than expected assuming an equal random distribution of peaks
throughout the amygdala (permutation test, p < 0.01) (Fig. 5).
4. Discussion
The aim of the present study was to assess the anatomical
specificity of current functional imaging studies reporting amyg-
dala activation and to test whether responses related to stimuli
both of positive and negative emotional valence are located in a
region with high probability to belong to the amygdala. Our study
is based on 339 amygdala response peaks reported in 114 neu-
roimaging studies (8 using PET and 106 applying fMRI) published
from 2000 to 2008. The findings of the present meta-analysis indi-
cate a high variability of the anatomical specificity of functional
amygdala imaging, ranging from studies reporting peaks with very
high probability to be located in the amygdala to other studies

66 T. Ball et al. / Journal of Neuroscience Methods 180 (2009) 57–70
Fig. 3. Anatomical assignment probabilities for all analyzed peaks to the amygdala (left) and to the hippocampus (right). For each probability, the corresponding number of
response peaks is given. While in most cases assignment probability to the amygdala was high and assignment probability to the hippocampus was low, there were also a
considerable number of exceptions with low amygdala and high hippocampus assignment probabilities (down to 0% and up to 100%, respectively).
reporting peaks that were highly likely to be located outside of
the amygdala, based on retrospective anatomical assignment of
reported responses using a recently published cytoarchitectoni-
cally verified probabilistic anatomical map (Amunts et al., 2005).
Such probabilistic maps provide information about the location
and inter-individual variability of micro-anatomically defined brain
areas in standard reference space, allowing anatomical assignment
even if these brain regions are not discernible in structural brain
images (Roland and Zilles, 1994; Toga et al., 2006).
In many cases, the anatomical probability of the reported
responses to belong to the amygdala was high (e.g. 80% and above).
There were, however, also a considerable number of counterex-
amples where anatomical probability for the amygdala was low
(down to 0%) and probability for the hippocampus was high (up
to 100%). Therefore, already these ‘raw’ anatomical probabilities
support the main conclusion that, on the one side, the anatomi-
cal specificity of results reported in many amygdala studies is very
good, but on the other side there are also many examples where
the anatomical specificity requires further improvement in order
to avoid wrong labeling of response peaks as belonging to the
amygdala. Such improvements may be achieved by application of
probabilistic anatomical maps of the amygdala (Amunts et al., 2005)
as they allow to avoid anatomically unlikely assignments. The find-
ings of the present study also point to an urgent need for accurate
in vivo delineation and parcellation of the amygdala using MRI.
The raw anatomical probabilities obtained at a given coordi-
nate can be combined in a summary map that assigns each voxel
to one cytoarchitectonic area. To this aim we used a hierarchical
assignment algorithm that first determines the assignment to major
anatomical regions, such as the amygdala or the hippocampus,
and then to the respective subregions. Particularly we were inter-
ested in the number of peaks that can be assigned to the core area
Fig. 4. (a) 3D positions of all reported amygdala responses (157 peaks) related to stimuli of clearly negative emotional valence. 76 of these peaks could be assigned to the
core area with at least 80% anatomical probability to belong to the amygdala (black squares). All conventions are as in Fig. 2. (b) 3D distribution of all responses related to
stimuli of clearly positive emotional valence (27 peaks). 16 of these peaks were assigned to the core area with at least 80% anatomical probability to belong to the amygdala
(black squares).

T. Ball et al. / Journal of Neuroscience Methods 180 (2009) 57–70 67
Fig. 5. Subregional assignment within the amygdala. This figure shows the result
of the second step of the hierarchical assignment procedure that was used in the
present study: after assigning peaks to the ‘core’ region of the amygdala with
high anatomical probability (dark blue volume, cf. Figs. 1 and 2), these peaks were
assigned to the amygdala subregions LB (blue squares), SF (green squares), and CM
(magenta squares). Peaks outside of the amygdala core area are indicated by grey
dots. Only 6 peaks (3.7% of all peaks assigned to the core region of the amygdala)
were found in CM. All of them were located in the left CM region. Note that not all
of these peaks can be easily seen, some of the CM peaks are (mostly) obscured by
other peaks. These results from subregional assignment indicate that in particular
the right CM region is, judging from the available evidence in this study, a ‘white
spot’ in the functional map of the human amygdala. (For interpretation of the refer-
ences to color in this figure legend, the reader is referred to the web version of the
article.)
of the amygdala with high anatomical probability. As probability
threshold we used ≥80% as in a previous fMRI study on subregional
responses in the amygdala (Ball et al., 2007). In the present study,
only 48.4% of all peaks could be assigned to the core area of the
amygdala. 11.8% of peaks were assigned to the core region of the
hippocampus, indicating that some of the functional responses that
were previously reported and thought to originate from the amyg-
dala might rather have originated in the hippocampus. An issue for
further investigations would be the question whether, conversely,
also some reported hippocampus responses might have had a high
probability of being located in the amygdala.
Many response peaks included in our study were related to
clearly negative stimuli (46.3%). Overall, there were much fewer
peaks related to stimuli of clearly positive emotional valence (8%).
Within the core region of the amygdala with high anatomical proba-
bility, responses to both clearly positive and clearly negative stimuli
were found. There was no significant difference in the anatomical
specificity of responses to stimuli of positive and negative emo-
tional valence to belong to the amygdala. This finding provides
further support for the assumption that the amygdala is not only
involved in the processing of stimuli of negative but also of positive
emotional valence.
Within the amygdala, the majority of peaks were located in LB
and SF (62.2% and 34.2% of all peaks assigned to the amygdala,
respectively). In contrast, only six peaks (3.7%) were assigned to
CM. CM is the smallest of the three amygdala subregions comprising
only 10.3% of the total volume that is assigned to the ≥80% prob-
ability core region of the amygdala. The observed number of only
six peaks assigned to CM was, however, highly unlikely to result
from an equal random distribution of peaks throughout the whole
amygdala (p < 0.01) and can therefore not be readily explained by
the relatively small size of CM. The few CM peaks that we found in
the literature were reported in three studies investigating responses
to faces (Das et al., 2005), social independence (Berns et al., 2005),
and pain evoked by laser stimulation (Bornhovd et al., 2002). Thus,
there was no obvious commonality regarding the stimuli used in the
studies reporting CM responses. Nevertheless, the small number of
CM peaks might at least to some degree be related to the experi-
mental paradigms currently used in amygdala studies, which might
more often result in differential effects in LB and SF than in CM. On
the other hand, delineation from the neighboring structures is par-
ticularly difficult in the region of the amygdala that constitutes CM.
If the true extent of the amygdala was underestimated in the CM
region in previous studies, this might have biased response reports
towards LB and SF. In this respect, usage of probabilistic maps
might facilitate identification of CM responses by providing objec-
tive criteria for delineating CM from the surrounding structures. CM
receives information from the basolateral amygdala (LeDoux, 2007)
and is thought to mediate behavioral responses to emotional stim-
uli through connections to the hypothalamus, brainstem (Barbas et
al., 2003), and anterior insula (Shelley and Trimble, 2004). Accord-
ing to this view, CM is the main output region of the amygdala. A
better identification of CM responses might hence contribute to a
more comprehensive picture of amygdala function, in particular of
the regulation of its output to other brain structures.
It is important to emphasize that assignments underlying the
present retrospective study are probability based. For instance, a
reported peak with 70% probability to belong to the hippocampus
and 30% probability to belong to the amygdala was in the present
study assigned to the hippocampus as the most probable choice.
The possibility that this peak may still belong to the amygdala could,
however, not be ruled out and could only be described as ‘less likely’.
It was therefore the aim of the present study to investigate and
characterize a large sample of reported amygdala responses, rather
than labeling results of individual studies as ‘correct’ or ‘incorrect’.
Furthermore, amygdala responses must not necessarily result in
a response peak within the amygdala. Specifically, in the case of
a large area of activation, there might be strong evidence of amyg-
dalar activation, even though the peak falls outside of the amygdala.
Therefore, we have also not included the assignments of the individ-
ual studies to either the amygdala or hippocampus, etc. in Table 1.
The assignment probabilities of a specific response peak can be con-
veniently obtained using the SPM ‘Anatomy’ toolbox (Eickhoff et al.,
2006) based on the maps of Amunts et al. (2005).
A further important issue is that in the present retrospec-
tive analysis, we could not include any quantitative data on the
magnitude of the localization error of the reported peaks. Such
localization errors are, however, practically inevitable. They con-
stitute a fundamentally different class of errors as compared to the
assignment errors that were the subject of the present study. In
case of fMRI – as used in the majority of studies included in our
meta-analysis – sources of localization errors include image distor-
tions (Merboldt et al., 2001), draining vein effects (Turner, 2002),
and inaccuracies arising from spatial data pre-processing (Krishnan
et al., 2006). Image distortions are more severe in the amygdala
region as compared with other commonly examined brain regions,
while it can be argued that the draining vein problem is probably
less pronounced in the amygdala (for a discussion of this issue see
Ball et al., 2007). It would be an important step for further research
to include an estimate of the localization errors in the anatomical
assignment algorithms. Assignments to the amygdala core region
68 T. Ball et al. / Journal of Neuroscience Methods 180 (2009) 57–70
with high anatomical probability as in the present study are use-
ful because they provide increased robustness against localization
errors.
In summary, there are many examples of studies that have
reported peaks as belonging to the amygdala at coordinates
where anatomical amygdala probability is, based on the currently
available evidence, only very low. On the other side, there are
also many studies which report peaks which fall into the core
region of the amygdala with high assignment probability, includ-
ing peaks from responses to stimuli both of positive and negative
emotional valence. Application of probabilistic anatomical assign-
ment procedures such as the hierarchical assignment methods we
have described in the present study are most likely a useful tool to
improve the anatomical specificity of future functional amygdala
imaging, at least until in vivo imaging of the complete anatom-
ical amygdala borders and of the amygdala subregions becomes
feasible.
Acknowledgements
This research was supported by the University of Freiburg,
Germany, the German Federal Ministry of Education and Research
(BMBF), the Volkswagenstiftung, Germany, and the Swiss National
Science Foundation (SNF). We thank Katrin Amunts for her valuable
comments on the manuscript.
References
Amunts K, Kedo O, Kindler M, Pieperhoff P, Mohlberg H, Shah NJ, et al. Cytoarchi-tectonic mapping of the human amygdala, hippocampal region and entorhinalcortex: intersubject variability and probability maps. Anat Embryol (Berl)2005;210:343–52.
Anderson AK, Christoff K, Panitz D, De Rosa E, Gabrieli JD. Neural correlates of theautomatic processing of threat facial signals. J Neurosci 2003;23:5627–33.
Ashwin C, Baron-Cohen S, Wheelwright S, O’Riordan M, Bullmore ET. Differentialactivation of the amygdala and the ‘social brain’ during fearful face-processingin Asperger syndrome. Neuropsychologia 2007;45:2–14.
Ball T, Rahm B, Eickhoff SB, Schulze-Bonhage A, Speck O, Mutschler I. Responseproperties of human amygdala subregions: evidence based on functional MRIcombined with probabilistic anatomical maps. PLoS ONE 2007;2:e307.
Barbas H, Saha S, Rempel-Clower N, Ghashghaei T. Serial pathways from primateprefrontal cortex to autonomic areas may influence emotional expression. BMCNeurosci 2003;4:25.
Baumgartner T, Lutz K, Schmidt CF, Jancke L. The emotional power of music: howmusic enhances the feeling of affective pictures. Brain Res 2006;1075:151–64.
Beauregard M, Levesque J, Bourgouin P. Neural correlates of conscious self-regulationof emotion. J Neurosci 2001;21:RC165.
Beaver JD, Lawrence AD, van Ditzhuijzen J, Davis MH, Woods A, Calder AJ. Individualdifferences in reward drive predict neural responses to images of food. J Neurosci2006;26:5160–6.
Beer JS, Stallen M, Lombardo MV, Gonsalkorale K, Cunningham WA, Sherman JW.The quadruple process model approach to examining the neural underpinningsof prejudice. Neuroimage 2008;43:775–83.
Berns GS, Chappelow J, Zink CF, Pagnoni G, Martin-Skurski ME, Richards J. Neurobio-logical correlates of social conformity and independence during mental rotation.Biol Psychiatry 2005;58:245–53.
Berthoz S, Grezes J, Armony JL, Passingham RE, Dolan RJ. Affective response to one’sown moral violations. Neuroimage 2006;31:945–50.
Birbaumer N, Grodd W, Diedrich O, Klose U, Erb M, Lotze M, et al. fMRI reveals amyg-dala activation to human faces in social phobics. Neuroreport 1998;9:1223–6.
Bishop SJ, Duncan J, Lawrence AD. State anxiety modulation of the amygdalaresponse to unattended threat-related stimuli. J Neurosci 2004;24:10364–8.
Bishop SJ, Jenkins R, Lawrence AD. Neural processing of fearful faces: effectsof anxiety are gated by perceptual capacity limitations. Cereb Cortex2007;17:1595–603.
Bornhovd K, Quante M, Glauche V, Bromm B, Weiller C, Buchel C. Painful stimulievoke different stimulus–response functions in the amygdala, prefrontal, insulaand somatosensory cortex: a single-trial fMRI study. Brain 2002;125:1326–36.
Britton JC, Phan KL, Taylor SF, Fig LM, Liberzon I. Corticolimbic blood flow inposttraumatic stress disorder during script-driven imagery. Biol Psychiatry2005;57:832–40.
Canli T, Congdon E, Gutknecht L, Constable RT, Lesch KP. Amygdala responsive-ness is modulated by tryptophan hydroxylase-2 gene variation. J Neural Transm2005;112:1479–85.
Carter RM, O’Doherty JP, Seymour B, Koch C, Dolan RJ. Contingency awareness inhuman aversive conditioning involves the middle frontal gyrus. Neuroimage2006;29:1007–12.
Cheng Y, Meltzoff AN, Decety J. Motivation modulates the activity of the humanmirror-neuron system. Cereb Cortex 2007;17:1979–86.
Corden B, Critchley HD, Skuse D, Dolan RJ. Fear recognition ability predicts dif-ferences in social cognitive and neural functioning in men. J Cogn Neurosci2006;18:889–97.
Coricelli G, Critchley HD, Joffily M, O’Doherty JP, Sirigu A, Dolan RJ. Regretand its avoidance: a neuroimaging study of choice behavior. Nat Neurosci2005;8:1255–62.
Critchley HD, Corfield DR, Chandler MP, Mathias CJ, Dolan RJ. Cerebral correlates ofautonomic cardiovascular arousal: a functional neuroimaging investigation inhumans. J Physiol 2000;523(Pt 1):259–70.
Cunningham WA, Raye CL, Johnson MK. Implicit and explicit evaluation: FMRI corre-lates of valence, emotional intensity, and control in the processing of attitudes.J Cogn Neurosci 2004;16:1717–29.
Das P, Kemp AH, Liddell BJ, Brown KJ, Olivieri G, Peduto A, et al. Pathways for fearperception: modulation of amygdala activity by thalamo-cortical systems. Neu-roimage 2005;26:141–8.
de Araujo IE, Rolls ET, Velazco MI, Margot C, Cayeux I. Cognitive modulation ofolfactory processing. Neuron 2005;46:671–9.
De Martino B, Kumaran D, Seymour B, Dolan RJ. Frames, biases, and rational decision-making in the human brain. Science 2006;313:684–7.
Del Ben CM, Deakin JF, McKie S, Delvai NA, Williams SR, Elliott R, et al. Theeffect of citalopram pretreatment on neuronal responses to neuropsycholog-ical tasks in normal volunteers: an FMRI study. Neuropsychopharmacology2005;30:1724–34.
Desseilles M, Vu TD, Laureys S, Peigneux P, Degueldre C, Phillips C, et al. A promi-nent role for amygdaloid complexes in the Variability in Heart Rate (VHR)during Rapid Eye Movement (REM) sleep relative to wakefulness. Neuroimage2006;32:1008–15.
Dresel C, Castrop F, Haslinger B, Wohlschlaeger AM, Hennenlotter A, Ceballos-Baumann AO. The functional neuroanatomy of coordinated orofacial move-ments: sparse sampling fMRI of whistling. Neuroimage 2005;28:588–97.
Eickhoff SB, Heim S, Zilles K, Amunts K. Testing anatomically specified hypothesesin functional imaging using cytoarchitectonic maps. Neuroimage 2006;32:570–82.
Eippert F, Veit R, Weiskopf N, Erb M, Birbaumer N, Anders S. Regulation of emotionalresponses elicited by threat-related stimuli. Hum Brain Mapp 2007;28:409–23.
Elliott R, Newman JL, Longe OA, Deakin JF. Differential response patterns in thestriatum and orbitofrontal cortex to financial reward in humans: a parametricfunctional magnetic resonance imaging study. J Neurosci 2003;23:303–7.
Ernst M, Bolla K, Mouratidis M, Contoreggi C, Matochik JA, Kurian V, et al.Decision-making in a risk-taking task: a PET study. Neuropsychopharmacology2002;26:682–91.
Etkin A, Egner T, Peraza DM, Kandel ER, Hirsch J. Resolving emotional conflict: a rolefor the rostral anterior cingulate cortex in modulating activity in the amygdala.Neuron 2006;51:871–82.
Etkin A, Klemenhagen KC, Dudman JT, Rogan MT, Hen R, Kandel ER, et al. Individualdifferences in trait anxiety predict the response of the basolateral amygdala tounconsciously processed fearful faces. Neuron 2004;44:1043–55.
Eugene F, Levesque J, Mensour B, Leroux JM, Beaudoin G, Bourgouin P, et al. Theimpact of individual differences on the neural circuitry underlying sadness.Neuroimage 2003;19:354–64.
Evans KC, Banzett RB, Adams L, McKay L, Frackowiak RS, Corfield DR. BOLD fMRIidentifies limbic, paralimbic, and cerebellar activation during air hunger. J Neu-rophysiol 2002;88:1500–11.
Fischer H, Sandblom J, Herlitz A, Fransson P, Wright CI, Backman L. Sex-differentialbrain activation during exposure to female and male faces. Neuroreport2004;15:235–8.
Fitzgerald DA, Angstadt M, Jelsone LM, Nathan PJ, Phan KL. Beyond threat:amygdala reactivity across multiple expressions of facial affect. Neuroimage2006;30:1441–8.
Garrett AS, Maddock RJ. Separating subjective emotion from the perception ofemotion-inducing stimuli: an fMRI study. Neuroimage 2006;33:263–74.
George N, Driver J, Dolan RJ. Seen gaze-direction modulates fusiform activityand its coupling with other brain areas during face processing. Neuroimage2001;13:1102–12.
Glascher J, Tuscher O, Weiller C, Buchel C. Elevated responses to constant facial emo-tions in different faces in the human amygdala: an fMRI study of facial identityand expression. BMC Neurosci 2004;5:45.
Goldstein JM, Jerram M, Poldrack R, Ahern T, Kennedy DN, Seidman LJ, et al. Hor-monal cycle modulates arousal circuitry in women using functional magneticresonance imaging. J Neurosci 2005;25:9309–16.
Gottfried JA, Deichmann R, Winston JS, Dolan RJ. Functional heterogeneity in humanolfactory cortex: an event-related functional magnetic resonance imaging study.J Neurosci 2002;22:10819–28.
Gottfried JA, Dolan RJ. The nose smells what the eye sees: crossmodal visual facili-tation of human olfactory perception. Neuron 2003;39:375–86.
Gottfried JA, Dolan RJ. Human orbitofrontal cortex mediates extinction learn-ing while accessing conditioned representations of value. Nat Neurosci2004;7:1144–52.
Gottfried JA, O’Doherty J, Dolan RJ. Encoding predictive reward value in humanamygdala and orbitofrontal cortex. Science 2003;301:1104–7.
Hamann S, Herman RA, Nolan CL, Wallen K. Men and women differ in amygdalaresponse to visual sexual stimuli. Nat Neurosci 2004;7:411–6.
Hamann S, Mao H. Positive and negative emotional verbal stimuli elicit activity inthe left amygdala. Neuroreport 2002;13:15–9.

T. Ball et al. / Journal of Neuroscience Methods 180 (2009) 57–70 69
Hardee JE, Thompson JC, Puce A. The left amygdala knows fear: laterality in theamygdala response to fearful eyes. Soc Cogn Affect Neurosci 2008;3:47–54.
Hariri AR, Bookheimer SY, Mazziotta JC. Modulating emotional responses: effects ofa neocortical network on the limbic system. Neuroreport 2000;11:43–8.
Hariri AR, Mattay VS, Tessitore A, Fera F, Smith WG, Weinberger DR. Dextroam-phetamine modulates the response of the human amygdala. Neuropsychophar-macology 2002;27:1036–40.
Hariri AR, Mattay VS, Tessitore A, Fera F, Weinberger DR. Neocortical modulation ofthe amygdala response to fearful stimuli. Biol Psychiatry 2003;53:494–501.
Holstege G, Georgiadis JR, Paans AM, Meiners LC, van der Graaf FH, Reinders AA.Brain activation during human male ejaculation. J Neurosci 2003;23:9185–93.
Hooker CI, Germine LT, Knight RT, D’Esposito M. Amygdala response to facial expres-sions reflects emotional learning. J Neurosci 2006;26:8915–22.
Keightley ML, Winocur G, Graham SJ, Mayberg HS, Hevenor SJ, Grady CL. An fMRIstudy investigating cognitive modulation of brain regions associated with emo-tional processing of visual stimuli. Neuropsychologia 2003;41:585–96.
Killgore WD, Casasanto DJ, Yurgelun-Todd DA, Maldjian JA, Detre JA. Functionalactivation of the left amygdala and hippocampus during associative encoding.Neuroreport 2000;11:2259–63.
Killgore WD, Young AD, Femia LA, Bogorodzki P, Rogowska J, Yurgelun-Todd DA.Cortical and limbic activation during viewing of high- versus low-calorie foods.Neuroimage 2003;19:1381–94.
Killgore WD, Yurgelun-Todd DA. Activation of the amygdala and anterior cingu-late during nonconscious processing of sad versus happy faces. Neuroimage2004;21:1215–23.
Kilpatrick L, Cahill L. Amygdala modulation of parahippocampal and frontalregions during emotionally influenced memory storage. Neuroimage 2003;20:2091–9.
Kim H, Somerville LH, Johnstone T, Alexander AL, Whalen PJ. Inverse amyg-dala and medial prefrontal cortex responses to surprised faces. Neuroreport2003;14:2317–22.
Kim SH, Hamann S. Neural correlates of positive and negative emotion regulation. JCogn Neurosci 2007;19:776–98.
Koch K, Pauly K, Kellermann T, Seiferth NY, Reske M, Backes V, et al. Gender dif-ferences in the cognitive control of emotion: an fMRI study. Neuropsychologia2007;45:2744–54.
Kölsch S, Fritz T, v Cramon DY, Müller K, Friederici AD. Investigating emotion withmusic: an fMRI study. Hum Brain Mapp 2006;27:239–50.
Krishnan S, Slavin MJ, Tran TT, Doraiswamy PM, Petrella JR. Accuracy of spatialnormalization of the hippocampus: implications for fMRI research in memorydisorders. Neuroimage 2006;31:560–71.
Labar KS, Crupain MJ, Voyvodic JT, McCarthy G. Dynamic perception of facial affectand identity in the human brain. Cereb Cortex 2003;13:1023–33.
Labar KS, Gitelman DR, Parrish TB, Kim YH, Nobre AC, Mesulam MM. Hunger selec-tively modulates corticolimbic activation to food stimuli in humans. BehavNeurosci 2001;115:493–500.
LeDoux J. The amygdala. Curr Biol 2007;17:R868–74.Lenzi D, Trentini C, Pantano P, Macaluso E, Iacoboni M, Lenzi GL, et al. Neural basis
of maternal communication and emotional expression processing during infantpreverbal stage. Cereb Cortex 2008;10 [Epub ahead of print].
Levesque J, Eugene F, Joanette Y, Paquette V, Mensour B, Beaudoin G, et al.Neural circuitry underlying voluntary suppression of sadness. Biol Psychiatry2003;53:502–10.
Lewis PA, Critchley HD, Rotshtein P, Dolan RJ. Neural correlates of processing valenceand arousal in affective words. Cereb Cortex 2007;17:742–8.
Liddell BJ, Brown KJ, Kemp AH, Barton MJ, Das P, Peduto A, et al. A directbrainstem–amygdala–cortical ‘alarm’ system for subliminal signals of fear. Neu-roimage 2005;24:235–43.
Lotze M, Heymans U, Birbaumer N, Veit R, Erb M, Flor H, et al. Differential cerebralactivation during observation of expressive gestures and motor acts. Neuropsy-chologia 2006;44:1787–95.
McClure EB, Monk CS, Nelson EE, Zarahn E, Leibenluft E, Bilder RM, et al. Adevelopmental examination of gender differences in brain engagement duringevaluation of threat. Biol Psychiatry 2004;55:1047–55.
Merboldt KD, Fransson P, Bruhn H, Frahm J. Functional MRI of the human amygdala?Neuroimage 2001;14:253–7.
Morris JS, Frith CD, Perrett DI, Rowland D, Young AW, Calder AJ, et al. A differentialneural response in the human amygdala to fearful and happy facial expressions.Nature 1996;383:812–5.
O’Doherty J, Critchley H, Deichmann R, Dolan RJ. Dissociating valence of outcomefrom behavioral control in human orbital and ventral prefrontal cortices. J Neu-rosci 2003;23:7931–9.
O’Doherty JP, Deichmann R, Critchley HD, Dolan RJ. Neural responses during antici-pation of a primary taste reward. Neuron 2002;33:815–26.
Ochsner KN, Bunge SA, Gross JJ, Gabrieli JD. Rethinking feelings: an FMRI study ofthe cognitive regulation of emotion. J Cogn Neurosci 2002;14:1215–29.
Ochsner KN, Ray RD, Cooper JC, Robertson ER, Chopra S, Gabrieli JD, et al. For betteror for worse: neural systems supporting the cognitive down- and up-regulationof negative emotion. Neuroimage 2004;23:483–99.
Ogino Y, Nemoto H, Inui K, Saito S, Kakigi R, Goto F. Inner experience of pain: imag-ination of pain while viewing images showing painful events forms subjectivepain representation in human brain. Cereb Cortex 2007;17:1139–46.
Onoda K, Okamoto Y, Toki S, Ueda K, Shishida K, Kinoshita A, et al. Anterior cingulatecortex modulates preparatory activation during certain anticipation of negativepicture. Neuropsychologia 2008;46:102–10.
Phan KL, Fitzgerald DA, Nathan PJ, Moore GJ, Uhde TW, Tancer ME. Neural substratesfor voluntary suppression of negative affect: a functional magnetic resonanceimaging study. Biol Psychiatry 2005;57:210–9.
Phan KL, Liberzon I, Welsh RC, Britton JC, Taylor SF. Habituation of rostral anteriorcingulate cortex to repeated emotionally salient pictures. Neuropsychopharma-cology 2003;28:1344–50.
Phan KL, Taylor SF, Welsh RC, Ho SH, Britton JC, Liberzon I. Neural correlates ofindividual ratings of emotional salience: a trial-related fMRI study. Neuroimage2004;21:768–80.
Phan KL, Wager T, Taylor SF, Liberzon I. Functional neuroanatomy of emotion:a meta-analysis of emotion activation studies in PET and fMRI. Neuroimage2002;16:331–48.
Phillips ML, Drevets WC, Rauch SL, Lane R. Neurobiology of emotion perception.II. Implications for major psychiatric disorders. Biol Psychiatry 2003;54:515–28.
Plailly J, Bensafi M, Pachot-Clouard M, Delon-Martin C, Kareken DA, Rouby C, et al.Involvement of right piriform cortex in olfactory familiarity judgments. Neu-roimage 2005;24:1032–41.
Protopopescu X, Pan H, Tuescher O, Cloitre M, Goldstein M, Engelien W, et al. Differ-ential time courses and specificity of amygdala activity in posttraumatic stressdisorder subjects and normal control subjects. Biol Psychiatry 2005;57:464–73.
Roland PE, Zilles K. Brain atlases—a new research tool. Trends Neurosci1994;17:458–67.
Royet JP, Plailly J, Delon-Martin C, Kareken DA, Segebarth C. fMRI of emotionalresponses to odors: influence of hedonic valence and judgment, handedness,and gender. Neuroimage 2003;20:713–28.
Royet JP, Zald D, Versace R, Costes N, Lavenne F, Koenig O, et al. Emotional responsesto pleasant and unpleasant olfactory, visual, and auditory stimuli: a positronemission tomography study. J Neurosci 2000;20:7752–9.
Ruby P, Decety J. How would you feel versus how do you think she would feel? Aneuroimaging study of perspective-taking with social emotions. J Cogn Neurosci2004;16:988–99.
Sander D, Grafman J, Zalla T. The human amygdala: an evolved system for relevancedetection. Rev Neurosci 2003;14:303–16.
Sander K, Scheich H. Left auditory cortex and amygdala, but right insula dominancefor human laughing and crying. J Cogn Neurosci 2005;17:1519–31.
Sato W, Yoshikawa S, Kochiyama T, Matsumura M. The amygdala processesthe emotional significance of facial expressions: an fMRI investigationusing the interaction between expression and face direction. Neuroimage2004;22:1006–13.
Schendan HE, Searl MM, Melrose RJ, Stern CE. An FMRI study of the role ofthe medial temporal lobe in implicit and explicit sequence learning. Neuron2003;37:1013–25.
Schienle A, Schafer A, Stark R, Walter B, Vaitl D. Relationship between disgustsensitivity, trait anxiety and brain activity during disgust induction. Neuropsy-chobiology 2005;51:86–92.
Sergerie K, Chochol C, Armony JL. The role of the amygdala in emotional process-ing: a quantitative meta-analysis of functional neuroimaging studies. NeurosciBiobehav Rev 2008;32:811–30.
Sergerie K, Lepage M, Armony JL. Influence of emotional expression on memoryrecognition bias: a functional magnetic resonance imaging study. Biol Psychiatry2007;15:1126–33.
Sergerie K, Lepage M, Armony JL. A process-specific functional dissociation of theamygdala in emotional memory. J Cogn Neurosci 2006;18:1359–67.
Seymour B, O’Doherty JP, Koltzenburg M, Wiech K, Frackowiak R, Friston K, et al.Opponent appetitive–aversive neural processes underlie predictive learning ofpain relief. Nat Neurosci 2005;8:1234–40.
Shelley BP, Trimble MR. The insular lobe of Reil – its anatamico-functional,behavioural and neuropsychiatric attributes in humans – a review. World J BiolPsychiatry 2004;5:176–200.
Singer T, Kiebel SJ, Winston JS, Dolan RJ, Frith CD. Brain responses to the acquiredmoral status of faces. Neuron 2004;41:653–62.
Small DM, Gerber JC, Mak YE, Hummel T. Differential neural responses evokedby orthonasal versus retronasal odorant perception in humans. Neuron2005;47:593–605.
Small DM, Gregory MD, Mak YE, Gitelman D, Mesulam MM, Parrish T. Dissociationof neural representation of intensity and affective valuation in human gustation.Neuron 2003;39:701–11.
Smith AP, Stephan KE, Rugg MD, Dolan RJ. Task and content modulateamygdala–hippocampal connectivity in emotional retrieval. Neuron2006;49:631–8.
Smith BW, Mitchell DG, Hardin MG, Jazbec S, Fridberg D, Blair RJ, et al. Neural sub-strates of reward magnitude, probability, and risk during a wheel of fortunedecision-making task. Neuroimage 2009;44:600–9.
Somerville LH, Wig GS, Whalen PJ, Kelley WM. Dissociable medial temporal lobecontributions to social memory. J Cogn Neurosci 2006;18:1253–65.
Stark R, Schienle A, Girod C, Walter B, Kirsch P, Blecker C, et al. Erotic and disgust-inducing pictures—differences in the hemodynamic responses of the brain. BiolPsychol 2005;70:19–29.
Stark R, Schienle A, Walter B, Kirsch P, Blecker C, Ott U, et al. Hemodynamiceffects of negative emotional pictures—a test–retest analysis. Neuropsychobi-ology 2004;50:108–18.
Stark R, Zimmermann M, Kagerer S, Schienle A, Walter B, Weygandt M, et al. Hemo-dynamic brain correlates of disgust and fear ratings. Neuroimage 2007;37:663–73.

70 T. Ball et al. / Journal of Neuroscience Methods 180 (2009) 57–70
Sterpenich V, D’Argembeau A, Desseilles M, Balteau E, Albouy G, Vandewalle G, et al.The locus ceruleus is involved in the successful retrieval of emotional memoriesin humans. J Neurosci 2006;26:7416–23.
Tabbert K, Stark R, Kirsch P, Vaitl D. Dissociation of neural responses and skin conduc-tance reactions during fear conditioning with and without awareness of stimuluscontingencies. Neuroimage 2006;32:761–70.
Takahashi H, Matsuura M, Yahata N, Koeda M, Suhara T, Okubo Y. Men and womenshow distinct brain activations during imagery of sexual and emotional infi-delity. Neuroimage 2006;32:1299–307.
Taylor SE, Eisenberger NI, Saxbe D, Lehman BJ, Lieberman MD. Neural responses toemotional stimuli are associated with childhood family stress. Biol Psychiatry2006;60:296–301.
Tessitore A, Hariri AR, Fera F, Smith WG, Das S, Weinberger DR, et al. Functionalchanges in the activity of brain regions underlying emotion processing in theelderly. Psychiatry Res 2005;139:9–18.
Toga AW, Thompson PM, Mori S, Amunts K, Zilles K. Towards multimodal atlases ofthe human brain. Nat Rev Neurosci 2006;7:952–66.
Turner R. How much cortex can a vein drain? Downstream dilution of activation-related cerebral blood oxygenation changes. Neuroimage 2002;16:1062–7.
van der Veen FM, Evers EA, Deutz NE, Schmitt JA. Effects of acute tryptophandepletion on mood and facial emotion perception related brain activation andperformance in healthy women with and without a family history of depression.Neuropsychopharmacology 2007;32:216–24.
Vuilleumier P, Armony JL, Driver J, Dolan RJ. Effects of attention and emotionon face processing in the human brain: an event-related fMRI study. Neuron2001;30:829–41.
Vuilleumier P, Armony JL, Driver J, Dolan RJ. Distinct spatial frequency sensitivitiesfor processing faces and emotional expressions. Nat Neurosci 2003;6:624–31.
Vuilleumier P, Richardson MP, Armony JL, Driver J, Dolan RJ. Distant influences ofamygdala lesion on visual cortical activation during emotional face processing.Nat Neurosci 2004;7:1271–8.
Walter M, Bermpohl F, Mouras H, Schiltz K, Tempelmann C, Rotte M, et al. Distin-guishing specific sexual and general emotional effects in fMRI-subcortical andcortical arousal during erotic picture viewing. Neuroimage 2008;40:1482–94.
Wang L, Labar KS, McCarthy G. Mood alters amygdala activation to sad distractorsduring an attentional task. Biol Psychiatry 2006;60:1139–46.
Whalen PJ, Kagan J, Cook RG, Davis FC, Kim H, Polis S, et al. Human amygdala respon-sivity to masked fearful eye whites. Science 2004;306:2061.
Wild B, Erb M, Eyb M, Bartels M, Grodd W. Why are smiles contagious? An fMRI studyof the interaction between perception of facial affect and facial movements.Psychiatry Res 2003;123:17–36.
Williams LM, Barton MJ, Kemp AH, Liddell BJ, Peduto A, Gordon E, et al. Distinctamygdala–autonomic arousal profiles in response to fear signals in healthy malesand females. Neuroimage 2005;28:618–26.
Williams LM, Das P, Liddell BJ, Kemp AH, Rennie CJ, Gordon E. Mode of functionalconnectivity in amygdala pathways dissociates level of awareness for signals offear. J Neurosci 2006;26:9264–71.
Williams MA, McGlone F, Abbott DF, Mattingley JB. Differential amygdala responsesto happy and fearful facial expressions depend on selective attention. Neuroim-age 2005;24:417–25.
Winston JS, Gottfried JA, Kilner JM, Dolan RJ. Integrated neural representa-tions of odor intensity and affective valence in human amygdala. J Neurosci2005;25:8903–7.
Winston JS, O’Doherty J, Dolan RJ. Common and distinct neural responses dur-ing direct and incidental processing of multiple facial emotions. Neuroimage2003;20:84–97.
Winston JS, O’Doherty J, Kilner JM, Perrett DI, Dolan RJ. Brain systems for assessingfacial attractiveness. Neuropsychologia 2007;45:195–206.
Winston JS, Strange BA, O’Doherty J, Dolan RJ. Automatic and intentionalbrain responses during evaluation of trustworthiness of faces. Nat Neurosci2002;5:277–83.
Wood JN, Romero SG, Knutson KM, Grafman J. Representation of attitudinalknowledge: role of prefrontal cortex, amygdala and parahippocampal gyrus.Neuropsychologia 2005;43:249–59.
Zald DH. The human amygdala and the emotional evaluation of sensory stimuli.Brain Res Brain Res Rev 2003;41:88–123.
Zink CF, Tong Y, Chen Q, Bassett DS, Stein JL, Meyer-Lindenberg A. Know your place:neural processing of social hierarchy in humans. Neuron 2008;58:273–83.