Analytical modelling of plastic behaviour of uniformly FRP confined concrete members
10
Analytical modelling of plastic behaviour of uniformly FRP confined concrete members Theodoros C. Rousakis a, * , Athanasios I. Karabinis a , Panos D. Kiousis b , Ralejs Tepfers c a Laboratory of Reinforced Concrete, Department of Civil Engineering, Democritus University of Thrace (DUTh), 67100 Xanthi, Greece b Division of Engineering, Colorado School of Mines, Golden, CO 80401, United States c Department of Civil and Environmental Engineering, Structural Engineering, Concrete Structures, Chalmers University of Technology, SE-412 96 Göteborg, Sweden article info Article history: Received 31 January 2007 Received in revised form 29 April 2008 Accepted 12 May 2008 Available online 6 June 2008 Keywords: A. Fibres B. Plastic deformation C. Analytical modelling Confinement abstract A method is presented for the assessment and calibration of the elastoplastic behaviour of FRP confined concrete. The method is based on the evaluation of permanent deformations from observed experimental deformations and theoretical elastic response of confined concrete. The inelastic response of concrete and the parameters of its mathematical modelling are investigated. Closed form expressions are produced to relate the model parameters to the mechanical properties of the material. A strain-hardening Drucker– Prager model is developed which simulates both the hardening and softening material response with rea- sonable agreement to the experimental observations. The predictive ability of the model is verified through comparisons to numerous published experimental data and analytical models. Ó 2008 Elsevier Ltd. All rights reserved. 1. Introduction The response of plain concrete subjected to increasing compres- sive load–unload cycles is non-linear with a descending branch fol- lowing the peak load [1]. A significant decrease of the axial rigidity of concrete is observed from cycle to cycle which becomes more in- tense during softening. However, subjecting FRP confined concrete cylinders to similar loading history results in a different response. During the initial stages of inelastic concrete response, the slope of unloading curve is equal to the modulus of elasticity of concrete E c . This observation makes possible the calculation of the permanent (plastic) strains (axial and transverse) from monotonic loading experiments. The elastic strain rates {De e } may be estimated from the elastic relations of concrete {De e }=[E] 1 {Dr}, where [E] is the elastic constitutive matrix and {Dr} is the stress rate. The perma- nent strain rates are then calculated by subtracting the elastic strains from total strains which are obtained experimentally [2]. Thus, a complete recording of the plastic deformations of confined concrete specimens can be developed which can provide the nec- essary information to model FRP confined concrete behaviour. Such data are very significant in elastoplastic modelling due to the difficulties associated with accurate load–unload test cycles especially at the exact failure point of FRP confined concrete [2]. Reliable recording of the plastic strain variation through the use of adequately close cycles is also very difficult to achieve without creating significant fatigue effects presence. The recognized benefits of FRP confinement to the response of compression concrete elements have led to a large number of re- lated modelling efforts [2–9]. Unfortunately, most analytical mod- els of FRP confined concrete show only moderate success in predicting published experimental data. The largest deviations have been observed in the prediction of axial strain [3]. The models by Samaan et al. [4], Saafi et al. [5], and Spolestra and Monti [6] demonstrated reasonable success in predicting the compressive strength of FRP confined cylinders, with average absolute errors of 13.4%, 13.8% and 15.2%, respectively. These models, however, failed to predict with equal accuracy the axial strains (average absolute error higher that 120%). Differences between experimen- tal data and predictions of most of existing models were also examined [7], and were found to vary with respect to their refer- ence experimental database, the degree of empiricism or the use of iterative procedures. De Lorenzis and Tepfers [3] proposed two empirical relations to predict the axial strain for confinement by FRP sheets or FRP tubes respectively and take into account path dependent deformational behaviour of concrete, through an expression of confinement modulus E l (average absolute error of 19.7%). Fujikake et al. [8] modelled FRP confined concrete behaviour by modifying an orthotropic non-linear elastic model that was ini- tially developed for concrete under constant confining pressure (steel confinement). The model prediction of axial and lateral strain is in good agreement with most of experimental results used 1359-8368/$ - see front matter Ó 2008 Elsevier Ltd. All rights reserved. doi:10.1016/j.compositesb.2008.05.001 * Corresponding author. Tel.: +30 2541079645; fax: +30 2541079638. E-mail address: [email protected] (T.C. Rousakis). Composites: Part B 39 (2008) 1104–1113 Contents lists available at ScienceDirect Composites: Part B journal homepage: www.elsevier.com/locate/compositesb
Transcript of Analytical modelling of plastic behaviour of uniformly FRP confined concrete members

Composites: Part B 39 (2008) 1104–1113
Contents lists available at ScienceDirect
Composites: Part B
journal homepage: www.elsevier .com/locate /composi tesb
Analytical modelling of plastic behaviour of uniformly FRP confinedconcrete members
Theodoros C. Rousakis a,*, Athanasios I. Karabinis a, Panos D. Kiousis b, Ralejs Tepfers c
a Laboratory of Reinforced Concrete, Department of Civil Engineering, Democritus University of Thrace (DUTh), 67100 Xanthi, Greeceb Division of Engineering, Colorado School of Mines, Golden, CO 80401, United Statesc Department of Civil and Environmental Engineering, Structural Engineering, Concrete Structures, Chalmers University of Technology, SE-412 96 Göteborg, Sweden
a r t i c l e i n f o a b s t r a c t
Article history:Received 31 January 2007Received in revised form 29 April 2008Accepted 12 May 2008Available online 6 June 2008
Keywords:A. FibresB. Plastic deformationC. Analytical modellingConfinement
1359-8368/$ - see front matter � 2008 Elsevier Ltd. Adoi:10.1016/j.compositesb.2008.05.001
* Corresponding author. Tel.: +30 2541079645; faxE-mail address: [email protected] (T.C. Rousak
A method is presented for the assessment and calibration of the elastoplastic behaviour of FRP confinedconcrete. The method is based on the evaluation of permanent deformations from observed experimentaldeformations and theoretical elastic response of confined concrete. The inelastic response of concrete andthe parameters of its mathematical modelling are investigated. Closed form expressions are produced torelate the model parameters to the mechanical properties of the material. A strain-hardening Drucker–Prager model is developed which simulates both the hardening and softening material response with rea-sonable agreement to the experimental observations. The predictive ability of the model is verifiedthrough comparisons to numerous published experimental data and analytical models.
� 2008 Elsevier Ltd. All rights reserved.
1. Introduction
The response of plain concrete subjected to increasing compres-sive load–unload cycles is non-linear with a descending branch fol-lowing the peak load [1]. A significant decrease of the axial rigidityof concrete is observed from cycle to cycle which becomes more in-tense during softening. However, subjecting FRP confined concretecylinders to similar loading history results in a different response.During the initial stages of inelastic concrete response, the slope ofunloading curve is equal to the modulus of elasticity of concrete Ec.This observation makes possible the calculation of the permanent(plastic) strains (axial and transverse) from monotonic loadingexperiments. The elastic strain rates {Dee} may be estimated fromthe elastic relations of concrete {Dee} = [E]�1{Dr}, where [E] is theelastic constitutive matrix and {Dr} is the stress rate. The perma-nent strain rates are then calculated by subtracting the elasticstrains from total strains which are obtained experimentally [2].Thus, a complete recording of the plastic deformations of confinedconcrete specimens can be developed which can provide the nec-essary information to model FRP confined concrete behaviour.Such data are very significant in elastoplastic modelling due tothe difficulties associated with accurate load–unload test cyclesespecially at the exact failure point of FRP confined concrete [2].Reliable recording of the plastic strain variation through the use
ll rights reserved.
: +30 2541079638.is).
of adequately close cycles is also very difficult to achieve withoutcreating significant fatigue effects presence.
The recognized benefits of FRP confinement to the response ofcompression concrete elements have led to a large number of re-lated modelling efforts [2–9]. Unfortunately, most analytical mod-els of FRP confined concrete show only moderate success inpredicting published experimental data. The largest deviationshave been observed in the prediction of axial strain [3]. The modelsby Samaan et al. [4], Saafi et al. [5], and Spolestra and Monti [6]demonstrated reasonable success in predicting the compressivestrength of FRP confined cylinders, with average absolute errorsof 13.4%, 13.8% and 15.2%, respectively. These models, however,failed to predict with equal accuracy the axial strains (averageabsolute error higher that 120%). Differences between experimen-tal data and predictions of most of existing models were alsoexamined [7], and were found to vary with respect to their refer-ence experimental database, the degree of empiricism or the useof iterative procedures. De Lorenzis and Tepfers [3] proposed twoempirical relations to predict the axial strain for confinement byFRP sheets or FRP tubes respectively and take into account pathdependent deformational behaviour of concrete, through anexpression of confinement modulus El (average absolute error of19.7%).
Fujikake et al. [8] modelled FRP confined concrete behaviour bymodifying an orthotropic non-linear elastic model that was ini-tially developed for concrete under constant confining pressure(steel confinement). The model prediction of axial and lateralstrain is in good agreement with most of experimental results used

Nomenclature
fco compressive strength of unconfined specimenfcu compressive ultimate stress of specimen (confined or
not)fcy elastic limit of unconfined concrete strengtheje effective strain at failure of FRP jacketEc modulus of elasticity of concreted diameter of sectiontj structural thickness of FRP sheetEj modulus of elasticity of FRP sheetEl confinement modulus 2Ejtj/dfl lateral confinement pressurek1 confinement effectiveness ratio (strength enhancement/
confining stress)r stress tensorE elastic constitutive matrixu angle of internal frictionee strain tensor for elastic deformationsep strain tensor for plastic deformations
J2D second invariant of deviatoric stressJ1 first invariant of stressIp1 first invariant of plastic strain
Ip2D second invariant of plastic strain deviator tensor
F loading function of plasticity theoryj hardening function of plasticity theoryG potential function of plasticity theorya plastic dilatation parameter of concreteh frictional parameter of plasticity theorye plastic strain trajectoryK1 initial plastic modulus of the unconfined compression
stress–strain curveK2 ultimate plastic modulus. Post-peak slope of the uncon-
fined compression stress–strain curvev damage parameter of concreteR damage function of plasticity theoryfcmo, Efo, Eco parameters for equivalence of units
Fig. 1. Concrete behaviour under cyclic loading [1].
T.C. Rousakis et al. / Composites: Part B 39 (2008) 1104–1113 1105
in comparisons, especially where axial stress loading of confinedconcrete is monotonically increasing. The limit failure surface ofthe model considered for steel confinement was restricted forapplication to FRP confined concrete. It was considered that afterthe first intersection of the stress path with the limit failure sur-face, the failure surface becomes linear and its slope is definedby a parameter k that restricts additional strength increase ob-tained according to initial failure surface. The parameter k was cal-ibrated to value 0.5 using experimental data by Karabinis andRousakis [9]. These experimental data are only a part of a widerange experimental program of concrete cylinders with strengthfrom 25.2 MPa up to 82.1 MPa, confined by FRP sheets in differentaxial rigidity levels and by pre-stressed carbon filament [9–11,2].The response of specimens to monotonic as well as to progressivelyincreasing compressive load–unload cycles has been studied. Cor-relation of the confinement effectiveness with the main designparameters, the mechanical properties of materials and the levelof filament pre-stress, has produced empirical relations for the pre-diction of strength and deformability of confined concrete. In theserelations, the FRP jacket strain at failure eje was exclusively relatedto the elastic modulus of the FRP material and the confinementeffectiveness ratio, k1 [2]. Analytical predictions that do not requirethe estimation of the effective strain at failure of the jacket com-pared with several experimental data have been shown to be moreaccurate than models proposed by several design guidelines.
In this study, the experimental results and observations reportedin [2] under monotonic as well as progressively increasing compres-sive load–unload cycles are utilized to identify the elastic and plasticresponses of confined concrete using permanent strain measure-ments. The plastic volumetric behaviour and the accumulated dam-age rate in concrete (softening response) are also investigated. Amethodology is developed for the calibration of the concrete mate-rial parameters for a strain-hardening–softening Drucker–Pragerconstitutive model [12,13]. The inelastic parameters are expressedwith closed-form analytical relations. Directly measured experi-mental plastic strain values [2] as well as available published results[9–11,22] are used for the evaluation of proposed model.
2. Analytical interrelation of plastic parameters of confinedconcrete using indirect plastic strain results
Under inelastic loading, concrete elements exhibit a gradualdegradation of their elastic modulus due to internal damage. This
degradation is fairly small in the pre-peak response, but becomessignificant in post-peak loading (see Fig. 1).
FRP confinement delays significantly the damage developmentwithin concrete elements and thus extends the region in whichthe elastic parameters can be considered practically constant. Inthis case, the plastic strains can be estimated in specimens undermonotonic loading with no significant loss of accuracy as {Dep} ={De} � {Dee} and {Dee} = [E]�1{Dr}, where {Dee} and {Dep} are theelastic and plastic components of the experimentally measuredstrain increment {De}. Values of the plastic strain tensor basedon monotonic loading experimental measurements of total strainsand these equations, will be referred to in the rest of this paper asindirect. The plastic strain tensor can be measured directly in load–unload tests based on the irrecoverable deformation. Plastic strainsmeasured from load–unload experiments will be referred to in thispaper as direct. Relations between the indirect plastic strains andthe constitutive model parameters can be developed to describethe material response up to failure. The CEB-FIP Model Code 90[14] relation for modulus of elasticity of concrete is chosen in thisstudy as a reasonable approximation of experimentally reportedvalues. The magnitude of Poisson’s ratio is taken equal to 0.2.The elastic limit of concrete fcy (‘yield stress’) is taken at 30% ofplain concrete strength (0.3fco).
2.1. Stress–plastic strain diagrams
The stress versus indirect elastic and plastic strains of cylindri-cal concrete specimens (fco = 25.2 MPa) confined by one, two or

1106 T.C. Rousakis et al. / Composites: Part B 39 (2008) 1104–1113
three layers of carbon FRP sheets are presented in Figs. 2 and 3. La-bels of specimens provide information concerning the concretebatch (i.e., 20, 60 or 100 is for 25.2, 51.8 or 82.1 MPa concretestrength, correspondingly), the number of layers (i.e., L1, L2 or L3is for 1, 2 or 3 layers, correspondingly), the mode of loading (i.e.,C is for cyclic and blank for monotonic), specification of identicalspecimens (i.e., 1, 2 or 3) and finally use of Teflon sheets betweenloading platens and columns bases (i.e., t for Teflon or blank). Asmentioned above, the indirect measurements are produced frommonotonic compression tests and are represented with solid lines.The relation between stress and direct plastic strains is alsopresented for comparison for a specimen confined by one layerof carbon FRP sheet, subjected to repeated load–unload cycles(20L1C-1t) and is represented with marked line (X marks). A satis-factory matching is observed for both the axial and transversestress–plastic strain response of concrete. The stress–plastic strainbehaviour of low strength concrete presented here for differentFRP confinement levels is characterized by the typical three-stagesresponse observed in stress–total strain investigations. The first-
0
10
20
30
40
50
60
70
0 0.004 0.008 0.012 0.016 0.02 0.024
Stre
ss (
MPa
)
1 - εe1
K2
1
Ec
1
K1
1
fcy
1 - εp1
Plastic axial strain ε p1 and e1
1 - εp
1
20L1-2t
1 - p1
20L2-2t
R(σ3)*K2
1
1 - p
1
20L3-1t
20-3t
20L1C-1t1 -
p1
σ
σ
σ
σ
ε
εσ
ε
σ ε
Fig. 2. Behaviour of stress–axial strain elastic ðee1Þ and plastic ðep
1Þ of 25.2 MPaconcrete strength specimens confined by carbon sheet in 1, 2 and 3 layers.
0
10
20
30
40
50
60
70
0 0.001 0.002 0.003 0.004 0.005 0.006 0.007
fcy
Plastic lateral strain p2 and e
2
1 - p
2
1 - p
2
20L1-2t
1 - p
2
20L2-2t
1 - p
2
20L3-1t
20-3t
1 - e2
20L1C-1t
Stre
ss (
MPa
)
1 - p
2
σ ε
ε ε
σ εσσ εε
σ ε
σ ε
σ ε
Fig. 3. Behaviour of stress–lateral strain elastic ðee2Þ and plastic ðep
2Þ of 25.2 MPaconcrete strength specimens confined by carbon sheet in 1, 2 and 3 layers.
stage response is governed primarily by concrete behaviour. Inthe second stage, the FRP jacket is fully activated due to significantcracking of concrete core and results in a continuous decrease ofsystem’s axial rigidity controlled by interaction between ‘dilatedconcrete’ and ‘restrictive action of jacket’. If the confinement pro-vided by the FRP jacket is adequate, as in the case of Fig. 2, the deg-radation of the system’s axial rigidity is stabilized leading to alinear stress–strain relation. In the case of inadequate confinement,a softening response is observed with unstable expansion of con-fined concrete up to failure.
2.2. Estimation of the plastic dilatation of concrete
The relation of plastic volumetric and shear strains is of greatsignificance in the mathematical modelling of pressure-sensitivematerials such as concrete. The plastic volumetric strain is equalto the first invariant Ip
1 of the plastic strain tensor. The square rootof the second invariant of the plastic strain deviator
ffiffiffiffiffiffiIp2D
qis a com-
monly used expression of the generalized plastic shear strain.This relation of indirect values of Ip
1 andffiffiffiffiffiffiIp
2D
qfor the specimens
considered in Figs. 2 and 3, is presented in Fig. 4. The relation of di-rect values of Ip
1 andffiffiffiffiffiffiIp
2D
qfor a specimen confined by one layer of
carbon FRP sheet (20L1C,2,3-t) is presented as well. The compari-son of indirect and direct stress–strain relation indicates the pre-dictive ability of the indirect measurements. The Ip
1 �ffiffiffiffiffiffiIp2D
qrelations lead to the observations that follow. For unconfined con-crete, the initial plastic volume contraction is followed by signifi-cant plastic expansion (although a significant degradation ofunloading modulus takes place and indirect approach is not reli-able they are presented for qualitative comparison). For concretespecimens with one layer of FRP sheet (Fig. 4), the provided elasticrestriction controls the plastic expansion, which remains small andbecomes almost constant at the latter stages of loading. The rate ofplastic strains of concrete is one of almost pure shear. It appearsthat the contraction that is observed at failure for the total strain[6] is mostly elastic (Fig. 5). For the specimens that are confinedby two and three FRP layers, a continuous plastic contraction takesplace and a rather linear relation between plastic volume changeðIp
1Þ and plastic distortion ðffiffiffiffiffiffiIp
2D
qÞ of concrete exists. For increasing
confinement, both plastic contraction and plastic distortion capac-ity of concrete become higher.
The slope of the Ip1 �
ffiffiffiffiffiffiIp
2D
qdiagrams is the plastic dilatation
(or contraction in general) parameter ða ¼ dIp1=d
ffiffiffiffiffiffiIp
2D
qÞ. The relation
of the plastic dilatation parameter a versus the plastic stain
-0.0150
-0.0100
-0.0050
0.0000
0.0050
0 0.004 0.008 0.012 0.016
Second invariant of plastic strain deviator tensor p
DI2
20-3t1
20L1-2t
20L2-2t
1
20L1C-1t
20L2C-1t
20L3C-1t
Fir
st in
vari
ant o
f pl
astic
str
ain
tens
or
Ip 1
20L3-1t
α
α
Fig. 4. First invariant of plastic strain tensor ðIp1Þ versus square root of second
invariant of plastic strain deviator tensor ðffiffiffiffiffiffiIp2D
qÞ of 25.2 MPa concrete strength
specimens confined by carbon sheet in 1, 2 and 3 layers.

-2.5
-2.0
-1.5
-1.0
-0.5
0.0
0.5
1.0
1.5
2.0
0 0.005 0.01 0.015 0.02 0.025
Plsa
stic
dila
tatio
n pa
ram
eter
∈
20-3t
20L1-2t
20L2-2t
20L3-1t
20L1C-1t
20L2C-1t
20L3C-1t
α
Fig. 6. Plastic dilatation parameter (a) versus plastic strain trajectorye_ ¼
R ffiffiffiffiffiffiffiffiffiffiffiffiffiffiffiffidepT depp
of 25.2 MPa concrete strength specimens confined by carbon sheetin 1, 2 and 3 layers.
-1.5
-1
-0.5
0
0.5
1
1.5
2
0 0.001 0.002 0.003 0.004 0.005
Plastic dilatation values
Tendency line
Plas
tic d
ilata
tion
para
met
er
Confinement modulus l (10-6 MPa)
fco = 82.1 MPa
fco = 51.8
fco = 25.2 MPa
α
Fig. 7. Diagram of plastic dilatation parameter (a) versus confinement modulus (El)for concrete strength of 25.2 MPa, 51.8 MPa and 82.1 MPa.
0
5
10
15
20
25
30
35
40
45
-0.0015 -0.0005 0.0005 0.0015 0.0025
20L1-2t
1 - εpv
1 -ε ev
1 -ε v
Volumetric strains v, εp
v and εev
Stre
ss (
MPa
)
ε
σ
σ
σ
Fig. 5. Behaviour of stress–volumetric strain total (ev), elastic ðeevÞ and plastic ðep
v Þ of25.2 MPa concrete strength specimen confined by 1 layer of carbon sheet.
T.C. Rousakis et al. / Composites: Part B 39 (2008) 1104–1113 1107
trajectory e_ ¼
R ffiffiffiffiffiffiffiffiffiffiffiffiffiffiffiffidepT depp
is presented in Fig. 6. It is observed thatas the axial rigidity of FRP jacket increases, the rate of increase ofparameter a decreases before it is stabilized to a final value thatalso depends on the level of confinement. Thus, in plain concrete,inadequate restriction of dilatation rate leads from initial plasticcontraction to unstable expansion. For concrete confined by threelayers of FRP sheet the potential rate of expansion of concrete is re-stricted and the initial plastic contraction is stabilized to lower lev-els leading to a continuous negative dilatation of the concretespecimens. For lower confinement (specimen confined by 1 layerof carbon sheet) a turnover is observed during loading, from initialtendency for expansion to high contractive tendency. Thus, initialplastic contraction of concrete is followed by temporary expansionthat is turned again to contraction by the restriction of jacket (Figs.5 and 6).
The plastic dilatation parameter a is strongly associated to themodulus of confinement El, and to the concrete strength fco. It issuggested that the dilatation parameter a could be considered con-stant for each different concrete strength fco when expressed ver-sus plastic strain trajectory while it varies with the modulus ofconfinement El (see dashed lines in Fig. 6). Calibration of the dila-tation parameter a resulted in the relations presented in Fig. 7. Itwas found that the plastic dilatation parameter decreases as the
modulus of rigidity El increases. The relation of a and El can be ex-pressed as a = A � ln(El) + B for constant concrete strength. Increas-ing modulus of confinement El results in higher volumetric andshear strain capacity of the confined concrete. The following rela-tion of the plastic dilatation parameter a with the modulus of con-finement El and the concrete strength fco is produced byinterrelating the three tendency lines for different concretestrengths of Fig. 7:
a ¼ ð�80:481ðfco=ð100f cmoÞÞ2 þ 6:64448ðfco=ð100f cmoÞÞ � 1:0373Þ
� lnðEl=ð100;000EfoÞÞ � 646:27ðfco=ð100f cmoÞÞ2
þ 78:251ðfco=ð100f cmoÞÞ � 7:9847; ð1Þ
where a 6 1.5, fcmo ¼ 10 MPa and Efo ¼ 10 MPa (unit parameters).Eq. (1) may be used for concrete strength ranging between 25
and 82 MPa and for modulus of confinement up to 2600 MPa. Forconcrete strength of 51.8 MPa the plastic dilatation parameterwas calibrated for rigidity (2tjEj/D) up to 4300 MPa). For modulusof confinement values that are less than 854 MPa (one carbonsheet) and concretes of higher strength (more than 82 MPa) the as-sumed linear relation between Ip
1 andffiffiffiffiffiffiIp
2D
qis not accurate, and as a
result, the restriction provided by the confining FRP may be under-estimated. This leads to a safe underestimation of bearing load.
2.3. Indirect estimation of accumulated damage in concrete
The unconfined uniaxial load response of concrete is modelledby a general curve defined by two asymptotes as shown for speci-men 20-3t in Fig. 2. The initial slope is defined as the initial plasticmodulus, while the final slope is defined as the post-peak ultimateplastic modulus. To estimate the accumulated damage in concrete,the determination of ultimate plastic modulus of concrete is neces-sary. The rate of softening of plain concrete, or ultimate plasticmodulus K2, is not easily estimated with good accuracy becauseit is strongly influenced by the friction developed at the loadingsurfaces of the specimen, as well as by its size. Due to the difficul-ties associated to performing reliable compressive load–unload cy-cles in plane concrete and especially in the softening branch, theultimate plastic modulus K2 is calculated using the standard curvesfrom CEB-FIP Model Code 90 [14] that is proposed for stress–strainbehaviour of plain concrete with strength between 20 and 88 MPa.This approach, apart from its practical convenience, is consistentwith the method of evaluation of the elastic modulus of concrete.
Initial and ultimate plastic moduli K1 and K2 are estimated fromthe slope of the r–ep relation evaluated at 0.3fco (pre-peak) and

-18
-16
-14
-12
-10
-8
-6
-4
-2
0
0 0.005 0.01 0.015 0.02 0.025
(1/M
Pa
)
∈20-3t
20L1-2t
20L2-2t
20L3-1t20L1C-1t
20L2C-1t
20L3C-1t
χ
Fig. 9. Damage parameter (v) versus plastic strain trajectory e of 25.2 MPa concretestrength confined specimens.
-2-10123456789
101112
0 0.005 0.01 0.015 0.02 0.025
R
20L1-2t 20L2-2t
20L3-1t
20-3t∈
Fig. 10. Damage function R versus plastic strain trajectory e of 25.2 MPa concretestrength confined specimens for constant value of v = 0.045 MPa�1.
1108 T.C. Rousakis et al. / Composites: Part B 39 (2008) 1104–1113
0.8fco (post-peak), respectively. The plastic moduli K1 and K2 are re-lated to concrete strength fco as follows (Fig. 8):
K1 ¼ 0:3814Ecoe0:498f co=fcmo6 208;752 MPa; ð2Þ
and K2fco=fcmo ¼ 0:05134Ecoðfco=fcmoÞ1:63976 23;760 MPa; ð3Þ
where Eco = 21,500 MPa and fcmo = 10 MPa.Limit values of K1 and K2 correspond to concrete strength of
65 MPa so as to restrict initial and ultimate plastic modulus of con-crete to values consistent with experimental findings. These valuesare reliable for studied concretes with compressive strength up to82 MPa.
The plastic accumulated damage in concrete is investigatedthrough a parameter v as defined by Karabinis and Kiousis [13]:
v ¼ lnðRðr3ÞÞ=r3; ð4Þ
where R(r3) is a function that expresses the variation of ultimateplastic modulus of concrete (multiplied by K2) during loading andr3 is the provided confining stress by the jacket. Parameter v takesinto account (a) the fundamental degrading behaviour of plain con-crete during loading that results in damage accumulation and (b)the resisting action of confinement that decreases and finally stabi-lizes the rate of damage. The variation of v parameter as a functionof the plastic strain trajectory e throughout the loading history isshown in Fig. 9 and it converges after activation of confinement,no matter its rigidity. Initially, a significant increase of accumulateddamage is observed from high negative values (high damage accu-mulation when slope changes) to positive while after plastic straintrajectory level around 0.002 and 0.005 there is a convergence of re-sponse irrespectively of the amount of confinement. The use of FRPsheet layers resulted in all cases in very low levels of accumulateddamage in concrete at failure. The rate of accumulation of damage isminimized around zero value. This is in accordance with experi-mental findings, where a continuously increasing linear stress–axialstrain response of FRP confined specimens is observed and the fail-ure point is controlled exclusively by the deformability of the jacketto the point of its fracture, while no further disintegration of theconfined concrete axial compressive modulus (its initial value iselastic modulus Ec) takes place (evidenced in Figs. 2 or 3 also forplastic deformations). The plastic damage function R(r3) convergesalso for variation of FRP confinement (Fig. 10) presenting for differ-ent loading histories (as expressed by plastic strain trajectory val-ues) a rapid decrease at the beginning of loading followed bystabilized values. During the initial inelastic axial compression ofconcrete and up to a stress equal to the plain concrete strength fco
y = 25.305x1.6397
R2 = 0.9999
y = 8200.1e0.0498x
R2 = 0.9947
0
50000
100000
150000
200000
250000
300000
350000
400000
0 20 40 60 80
K1 (MPa)
fco (MPa)
0
10000
20000
30000
40000
50000
60000
limit value65 MPa
K2 fco /10
(MPa)
Fig. 8. Diagram of initial (K1) and ultimate (K2) plastic modulus versus concretestrength.
the damage function of concrete shows intense variation. At a plas-tic strain trajectory of approximately 0.005 (when the transverserestriction is fully activated), the plastic damage of concrete isdiminished even for low confinement. Through the approach ofKarabinis and Kiousis [13], the significant variables of accumulateddamage appear to be taken into account resulting in practically con-stant magnitude of plastic damage parameter v with the plasticstrain trajectory and thus only one variable dependent on concretestrength has to be estimated. For example, for concrete strength of25.2 MPa, during second and third stage of response (full activationof jacket) v becomes approximately equal to 0.045 MPa�1 (see Fig. 9for variation of v as well as the dashed lines in Fig. 10 that representR variation for constant v). It should be mentioned that the value ofplastic damage parameter v is strongly dependent on relations con-sidered for the calculation of the ultimate plastic modulus and theelastic modulus of plain or confined concrete (see Fig. 2).
This procedure is applied to high strength concrete (51.8 MPaand 82.1 MPa) as well. The plastic damage parameter v is in gen-eral lower for higher concrete strength but no clear relation canbe identified. Nevertheless, concrete strength is expected to bethe dominant factor that affects the variation of v, while their looserelation is mainly due to the inherent non-linearity of the adoptedrelations for the elastic and plastic moduli that are interdependentin calculation procedure. As shown earlier (Fig. 9) there is nodependence of v to the modulus of confinement El.

0
5
10
15
20
25
30
35
40
45
50
-100 -90 -80 -70 -60 -50 -40 -30 -20 -10 0 10 20 30 40 50
J1
dir G
direct experimental failure surface of20c1L3C-3t
dir dεp
2DJ
indir F
indir G
indir G
indirect experimental failure surface of 20c1L3-1t
indir dεp
indir F
indir dεp
Fig. 11. Diagram of square root of second invariant of stress deviator tensor versus first invariant of stress tensor. Direct and indirect experimental failure surfaces F andplastic potential G of specimen of 25.2 MPa concrete strength confined by three layers of carbon sheet.
T.C. Rousakis et al. / Composites: Part B 39 (2008) 1104–1113 1109
Through experimental observations it is concluded that the re-sponse of concrete to loading can be best modelled by non-associa-tive plasticity with a loading/failure function F and a potentialfunction G. Comparison of the failure surfaces for specimens20L3 based on direct and indirect evaluations of the plastic strainsshows a reasonable agreement between the two evaluations (Fig.11). Similar conclusions can be drawn from comparisons of the po-tential functions G based on direct and indirect plastic strain calcu-lations. The clear differences in the gradients of functions F and G,indicates the necessity to implement a non-associative flow rule.
In most finite element applications, FRP confined concrete isconsidered an ideally plastic material with an associated flow rulefor plastic strain evolution [15,16]. The above discussion is ex-pected to favour a rational estimation of the necessary plasticparameters and the appropriate loading and potential functionsthat are required in finite element analyses of FRP confined con-crete members. Reliable finite element modelling allows for accu-rate analysis of complex members with geometrical and materialnon-linearities.
3. Plasticity model
The proposed constitutive model is based on an earlier elasto-plastic model proposed in [12,13] for steel confined concrete. Ithas been already shown [9] that plasticity models can reproduceFRP confined concrete behaviour with very reasonable accuracy.In the proposed model, the inelastic parameters of concrete areinterrelated with closed-form relationships with the mechanical
j ¼ 1ffiffiffi3p � h
� � 2 e_
aðfco ;ElÞ�1
18200:1e0:0498f co
þ2 e_
aðfco ;El Þ�1
ðfco�0:3f coÞ 8200:1e0:0498f coffiffiffiffiffiffiffiffiffiffiffiffiffiffiffiffiffiffiffiffiffi8200:1e0:0498f cop
�
ffiffiffiffiffiffiffiffiffiffiffiffiffiffiffiffiffiffiffiffi10
25:305f 1:6397co
fco
q� �2
� evr3
0BBBBBBBB@
properties of concrete and the confining FRP sheets leading to anadvanced hardening–softening function. The model can be gener-alized to applications of confined concrete by calibrating exclu-sively the inelastic damage parameter v for different concretestrengths and extending the interrelation of plastic dilatationparameter with concrete strength and confinement modulus.
3.1. Analytical relationships of plasticity theory
3.1.1. Concrete responseThe elastic response of concrete is considered linear following
Hooke’s law:
frg ¼ ½E�feeg; ð5Þ
where {r} is the strain tensor, [E] is the constitutive matrix of elas-ticity, {e} is the strain tensor and the superscript ‘e’ indicates elasticstrain. The inelastic concrete behaviour is described mathematicallyby a non-associative, hardening plasticity model. The yield/loadingfunction for the purposes of the analysis presented here can be ex-pressed as follows:
F ¼ffiffiffiffiffiffiJ2D
pþ hJ1 � j ¼ 0; ð6Þ
where J2D is the second invariant of the stress tensor deviator, J1 isthe first invariant of the stress and j is a hardening–softening func-tion which is expressed through the plastic strain trajectory e. Themathematical expression of j = f (fco, El, v) is
according to relations (1)–(4).
1025:305f 1:6397
co
fco
2 e_
aðfco; ElÞ � 1þ 0:3f co
1CCCCCCCCA: ð7Þ
1110 T.C. Rousakis et al. / Composites: Part B 39 (2008) 1104–1113
Parameter h is a function of the angle of internal friction u:
h ¼ 2 sinuffiffiffi3pð3� sin uÞ
and u ¼ 36� þ 1�ðfco=ð3:5f cmoÞÞ 6 45�: ð8Þ
A non-associated plastic flow rule is used for the evolution of plasticstrain during successive strain variations:
dep ¼ dkdGdr
; ð9Þ
where plastic potential function G is given by
G ¼ffiffiffiffiffiffiJ2D
pþ aðfco; ElÞJ1=6: ð10Þ
3.1.2. FRP confining reinforcement responseAn FRP jacket or tube exhibits a linear elastic behaviour up to
failure. Depending on the nature of the FRP–concrete core interfacebonding, as well as the cracking mode of concrete, variable axialcompressive strains imposed on the concrete core may be devel-oped in the FRP material. However, due to the practically insignif-icant rigidity of composite material perpendicular to its fibresdirection, the composite jacket is considered subjected to uniaxialtension.
3.1.3. Failure criterionFRP confined cylindrical concrete members are subjected to
fairly uniform transverse confinement. These stresses can be cal-culated through an iterative procedure accounting for the FRPconfinement modulus El and the transverse elastoplastic expan-sion of the concrete core. Continuous strain compatibility is as-sumed between concrete and FRP. Failure in cases of adequateFRP confinement occurs when the lateral strain of concrete (lat-eral strain of concrete is considered equal to its radial strain)equals the circumferential strain at failure (or effective straineje) of the FRP jacket. For a rational correlation between the FRPjacket failure strain and the main variables of confinement design,more targeted tests should be performed to obtain sufficientexperimental data. The effects of the section curvature, the mod-ulus of elasticity of FRP, as well as of its rigidity should be consid-ered. Also, significant is the effect of the resin type. Thecompressive strength of concrete should be examined as an indi-cator of the restriction that is necessary to stabilize unstableexpansion of concrete after severe and inhomogeneous cracking.FRP confined high-strength concrete specimens with softening re-sponse and rather unstable expansion, exhibit a rather ‘prema-ture’ fracture of the FRP jacket compared to lower strengthconcrete. In applications of axial compression, the empiricalexpression for the strain of the FRP jacket at failure proposed in[2] can be used as a more rational approach. The empiricalexpression in [2] correlates manufacturer’s data for FRP withstrength results of carbon FRP confined concrete because theyare considered more reliable than strain measurements. ‘Equiva-lent’ deformations of the jacket can then be evaluated indirectlyby considering the interrelation proposed by Richart et al. [17].Thus, strength enhancement was associated to fibre longitudinalrigidity (manufacturer’s data requiring no tests on cured jacketspecimens) which led to a strong relation between different car-bon fibre materials and their E-modulus. This relation calculatesthe lateral strain at failure eje for a given confinement effective-ness ratio k1 = (fcu � fco)/fl and modulus of elasticity of fibres whenthe bearing stress behaviour of FRP confined concrete is ever-increasing (top relation):
eje ¼ ð�0:4142Ej10�7 þ 0:0248Þ=ð0:5k1Þ or
ejei ¼ ð�0:4142Ej10�7 þ 0:0248Þ=ð0:5ðfcui � fcoÞ=fliÞ: ð11Þ
According to the above approach, the variables that influencethe deformational behaviour of jacket such as curvature of section,thickness of jacket, resin type, compressive modulus of concrete,etc. are taken into account indirectly through k1. Also, the above ef-fects are considered fixed for each type of fibre according to theirE-modulus. The axial and lateral stresses fcui and fli, respectively,generated by the plasticity model at each step, could be insertedin the empirical relation ((11) – right expression) together withE-modulus of the fibres, so as to produce the correspondingstress–effective strain curve. The intersection of the axial stress–lateral strain curve generated by the plasticity model and the lat-eral strain at failure curve generated by the empirical relation(11) for the member under compression, provides the effective lat-eral strain. Relation (11) has been derived by experimental resultsof strength. As a result, it is expected to be as accurate as the cor-responding expression for concrete strength prediction which hasan absolute error of 9.81% based on a database of 170 sheet con-fined specimens. Of course a more rational multi-parametric equa-tion is necessary to account for all effects involved. Other availableapproaches by Matthys [18] and De Lorenzis and Tepfers [19] havealready identified qualitatively the strong dependence of the jacketdeformation at failure to its axial rigidity as well as to the curva-ture of the section (two main effects with opposite tendencies dis-cussed by the latter). However, the divergence in effective lateralstrain prediction was high with both approaches.
Confined concrete members (columns or beams) are commonlysubjected to a combination of compressive and shear actions. Toprevent the loss of aggregate interlock of the concrete as foundby Priestley et al. [20] the effective lateral strain has to be limitedto 0.004 and less than 75% of jacket’s deformation capacity underdirect tension [21]. Consequently, stress and strain at that lateralstrain level also have to be accurately predicted to estimate themaximum usable compressive strain for further curvature ductilitycalculations on confined members. On the other hand, structuralinstability concerns of compressed members necessitate the accu-rate estimation of – third stage – inelastic axial rigidity of confinedconcrete and axial strain at failure. Consequently, it is establishedthat accurate knowledge of the stress and strain at failure is notsufficient for design, and the entire stress–strain response pre-dicted by a model must be reliable.
3.2. Evaluation of model predictions
The predictions of the proposed model are compared to exper-imental results for concretes with a wide range of compressivestrengths (fco = 25.2 MPa, 32 MPa, 38.5 MPa, 51.8 MPa and82.1 MPa) confined by usual [9] and high E-modulus carbon FRPsheets [10,11] or encased in glass FRP tubes [22]. The proposedmodel is also compared with three well-known analytical modelsby Samaan et al. [4], Saafi et al. [5] and Spoelstra and Monti [6].The stress–lateral strain response is crucial as it determines theaccuracy in strength prediction according to the failure criteriondue to the fracture of the FRP jacket. Moreover, it carries any addi-tional error to the produced stress–axial strain response used toestimate the corresponding axial strain at failure.
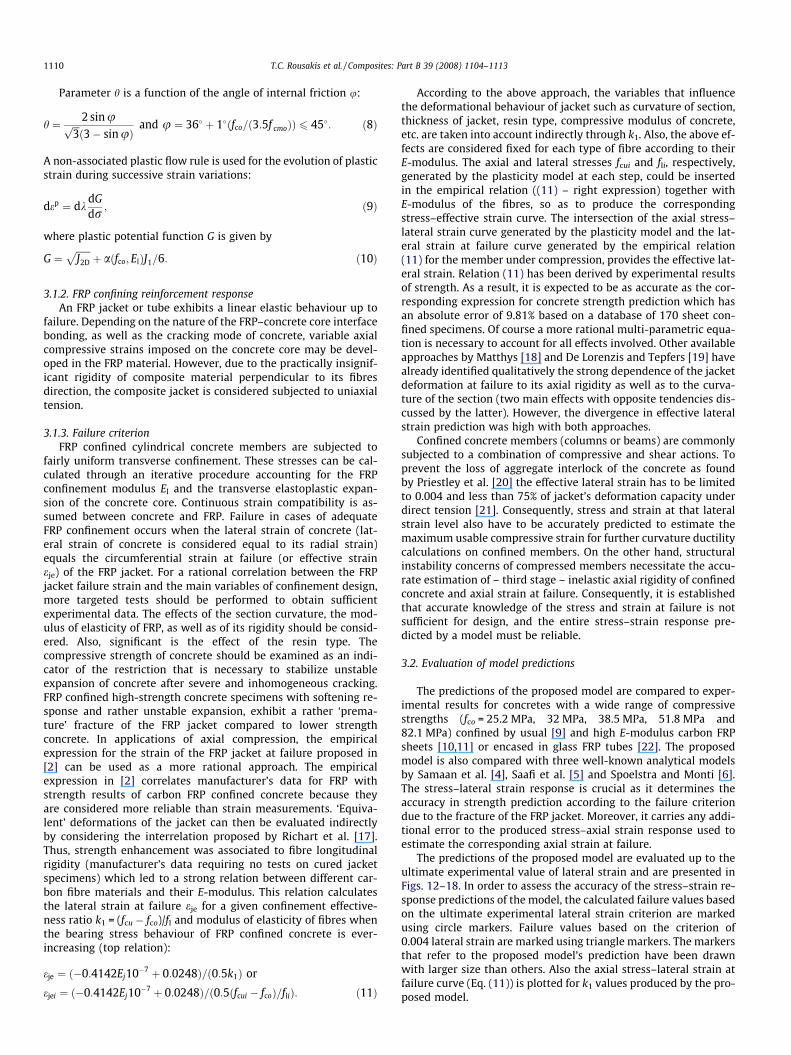
The predictions of the proposed model are evaluated up to theultimate experimental value of lateral strain and are presented inFigs. 12–18. In order to assess the accuracy of the stress–strain re-sponse predictions of the model, the calculated failure values basedon the ultimate experimental lateral strain criterion are markedusing circle markers. Failure values based on the criterion of0.004 lateral strain are marked using triangle markers. The markersthat refer to the proposed model’s prediction have been drawnwith larger size than others. Also the axial stress–lateral strain atfailure curve (Eq. (11)) is plotted for k1 values produced by the pro-posed model.

0
20
40
60
80
100
120
140
-15 -5 5 15 25
Stre
ss (
MPa
)
4 / limit < 0.75 ju
Lateral – Axial strain o/oo
Experimental failure strain
Eq (11)
Samaan . ., 1998
Saafi . ., 1999
Spoelstra & Monti, 1999
Proposed model
Experimental values
Samaan et al, 1998
Saafi et al, 1999
ε
ε
Fig. 13. Comparison of experimental r–e curves with analytical predictions forspecimen 60aL3-2t from [10] (three layers of carbon FRP sheet).
0
20
40
60
80
100
120
140
160
-15 -5 5 15 25 35 45
St
ress
(M
Pa)
4 / limit < 0.75 ju
Lateral – Axial strain o/oo
Experimental failure strain
Eq (11)
Samaan . ., 1998
Saafi . ., 1999
Spoelstra & Monti, 1999
Proposed model
Experimental values
Samaan et al, 1998
Saafi et al, 1999
ε
ε
Fig. 14. Comparison of experimental r–e curves with analytical predictions forspecimen 60aL5-2t from [10] (five layers of carbon FRP sheet).
0
10
20
30
40
50
60
70
80
-13 -3 7 17 27 37 47
Str
ess
(MPa
)
4 / limit < 0.75 ju
Lateral – Axial strain o/oo
Experimental failure strain
Eq (11)
Samaan . ., 1998
Saafi . ., 1999
Spoelstra & Monti, 1999
Proposed model
Experimental values
Samaan et al, 1998
Saafi et al, 1999
ε
ε
Fig. 15. Comparison of experimental r–e curves with analytical predictions forspecimen 20L2-2t from [10] (two layers of carbon FRP sheet).
0
10
20
30
40
50
60
-20 -15 -10 -5 0 5 10 15 20 25
Stre
ss (
MPa
)
Lateral - Axial strain ε o/oo
4 / limit < 0.75 ju
Samaan . ., 1998
Saafi et al, 1999aafi . ., 1999
Spoelstra & Monti, 1999
Proposed model
Experimental values
Samaan et al, 1998
Saafi et al, 1999
ε
Fig. 12. Comparison of experimental r–e curves with analytical predictions forspecimen C2 from [9] (one layer of carbon FRP sheet).
T.C. Rousakis et al. / Composites: Part B 39 (2008) 1104–1113 1111
3.2.1. Results and discussionIn the case of the 38.5 MPa concrete confined by one layer of
carbon FRP sheet, the ability of the model to describe softeningbehaviour of FRP confined concrete is presented in Fig. 12. Forthe design limit of 0.004 strain (as there were no lateral strain re-corded) the proposed model predicts accurately the strength, butslightly overestimates the axial strain (see large triangle marker).All other models fail to predict softening, presenting a continu-ously hardening compressive stress response. The differences inthe prediction of strength and strain of the compared models in0.004 lateral strain level, are highlighted with the triangle markers.
For high strength concrete of 51.8 MPa with confinement bythree layers of high E-modulus carbon sheet (Fig. 13) there is anexcellent convergence on the stress–lateral strain response ofexperimental data and the proposed model. The axial strain re-sponse is also quite accurate. As the experimental strain at failureand the 0.004 strain level coincide, the triangle and circle markersindicating the axial stress–axial strain failure points coincide also.The prediction of the proposed model at failure is very good. Thelateral failure strain curve, based on Eq. (11) underestimates theexperimental failure point with an approximate error of 19%. It
corresponds to approximately 15% error in strength and 9% errorin axial strain prediction of the model. Other models fail to capturethe lateral strain response (the prediction by Spoelstra and Montimodel is relatively better) and underestimate [5,6] or overestimate[4] the strength and strain at failure (indicated by the markers).
For high strength concrete of 51.8 MPa with heavy confinementby five layers of high E-modulus carbon sheet (Fig. 14) there is anexcellent convergence on overall stress–strain response of experi-mental data and the proposed model. The plotted lateral failurestrain curve by relation (11) meets the experimental failure point.The crucial role of accurate stress–lateral strain response is demon-strated in the predictions of the Spoelstra and Monti model. De-spite the accurate prediction of the axial stress–axial strainresponse, slight overestimation of lateral strain leads to underesti-mation of strength and strain failure values (the two lateral strainsthat are considered in the study coincide, see the respective trian-gle and circle markers). On the other hand the Saafi et al. and Sam-aan et al. models present differences in lateral strain predictionleading to unreliable strength and axial strain prediction.
In the low strength concrete of 25.2 MPa specimen confined bytwo layers of high E-modulus carbon sheet (Fig. 15) there is an

0
30
60
90
120
150
180
-15 -10 -5 0 5 10 15 20 25
4 / limit < 0.75 ju
Lateral – Axial strain o/oo
Eq (11)
Experimental failure strain
S . ., 1998
Saafi . ., 1999
Spoelstra & Monti, 1999
Proposed model
Experimental values
Samaan et al , 1998
Saafi et al,1999
Stre
ss (
MP
a)
ε
ε
Fig. 16. Comparison of experimental r–e curves with analytical predictions forspecimen 100L3-3t from [11] (three layers of carbon FRP sheet).
0
10
20
30
40
50
60
70
80
90
-20 -10 0 10 20 30 40 50
Stre
ss (
MP
a)
4 / limit < 0.75 ju
Lateral – Axial strain o/oo
Experimental failure strain
Eq (11)
Samaan . ., 1998
Saafi et al, 1999aafi . ., 1999
Spoelstra & Monti, 1999
Proposed model
Experimental values
Samaanet al ,1998
Saafi et al, 1999
ε
ε
Fig. 17. Comparison of experimental r–e curves with analytical predictions forspecimen of batch C from [22] confined by 10 layers of E-glass FRP sheet tube.
0
10
20
30
40
50
60
70
80
90
100
-20 -10 0 10 20 30 40 50 60
4 / limit < 0.75 ju
Lateral – Axial strain o/oo
Experimental failure strain
Eq (11)
Samaan . ., 1998
Saafi . ., 1999
Spoelstra & Monti, 1999
Proposed model
Experimental values
Samaan et al, 1998
Saafi et al, 1999Stre
ss (
MPa
)
ε
ε
Fig. 18. Comparison of experimental r–e curves with analytical predictions forspecimen of batch C from [22] confined by 14 layers of E-glass FRP sheet tube.
1112 T.C. Rousakis et al. / Composites: Part B 39 (2008) 1104–1113
excellent convergence on the lateral strain behaviour. The axialstrain response is slightly underestimated by the proposed model,for strain levels before failure (see triangle marker for 0.004 lateralstrain level) while it coincides with the experimental one at failurelateral strain (see the circle marker). The empirical lateral failurestrain expression (Eq. (11)) predicts well the experimental failurepoint. The small stress–lateral strain prediction divergence of themodel by Saafi et al. results in underestimation of the strengthand deformations of the confined concrete despite the convergenceof stress–axial strain prediction to the experiments (see the trian-gle marker for 0.004 lateral strain level and the circle marker forthe failure experimental lateral strain).
For the higher strength concrete of 82.1 MPa confined by threelayers of carbon sheet (Fig. 16) a fairly accurate prediction is pro-vided by the model. The empirical model prediction of the failurepoint is overestimated with a 30% error. This corresponds to about7% error in strength and 30% error in axial strain prediction. Thestress–strain predictions of the other models generally divergefrom the experimental results while the model by Saafi et al. is rel-atively closer to the experimental stress–axial strain response.
The proposed model compares well with the 32 MPa compres-sive strength concrete encased in 10 layers of E-glass FRP tube (Fig.17). Accurate prediction of the lateral strain response minimizesthe underestimation of failure axial strain prediction. The predic-tion of the failure point by Eq. (11) is fairly accurate consideringthe E-glass fibre properties. The models by Saafi et al. and Samaanet al. present similar stress–axial strain behaviour, while the latteras well that of Spoelstra and Monti model fail to predict lateralstrain response. The model by Spoelstra and Monti gives axialstrain at failure that is closer to the experimental strain, howeverit reveals a pre-mature strength enhancement for lower strain lev-els (see circle marker for failure prediction and triangle marker forstrain level of 0.004, correspondingly).
Finally, in Fig. 18 the models are compared against a concretespecimen encased in 14-layer E-glass tube. Similar remarks are va-lid for the proposed model while lateral strain at failure is overes-timated by Eq. (11) by approximately 10%. This overestimationgenerates a strength prediction with about 17% error and strainat failure 10% underestimated. Concerning other models, the pre-diction by the Saafi et al. model is closer to the experimental re-sponse while Samaan et al. model prediction diverges more thanthat of the 10-layer E-glass tube confinement. The model by Spoel-stra and Monti presents similar divergence to that for lower glasstube confinement.
.
.
.
0
5
10
15
20
25
30
35
40
45
50
-100 -70 -40 -10 20 50
2DJ
indir G
indirect experimental failure surface of 20c1L3-1t
indir dp
indir F
J1
analyt F
analyt G
analytical failure surface of 20c1L3analyt d
p
Fig. 19. Indirect experimental and analytical failure surfaces F and plastic potentialG of specimen of 25.2 MPa concrete strength confined by three layers of carbonsheet.
T.C. Rousakis et al. / Composites: Part B 39 (2008) 1104–1113 1113
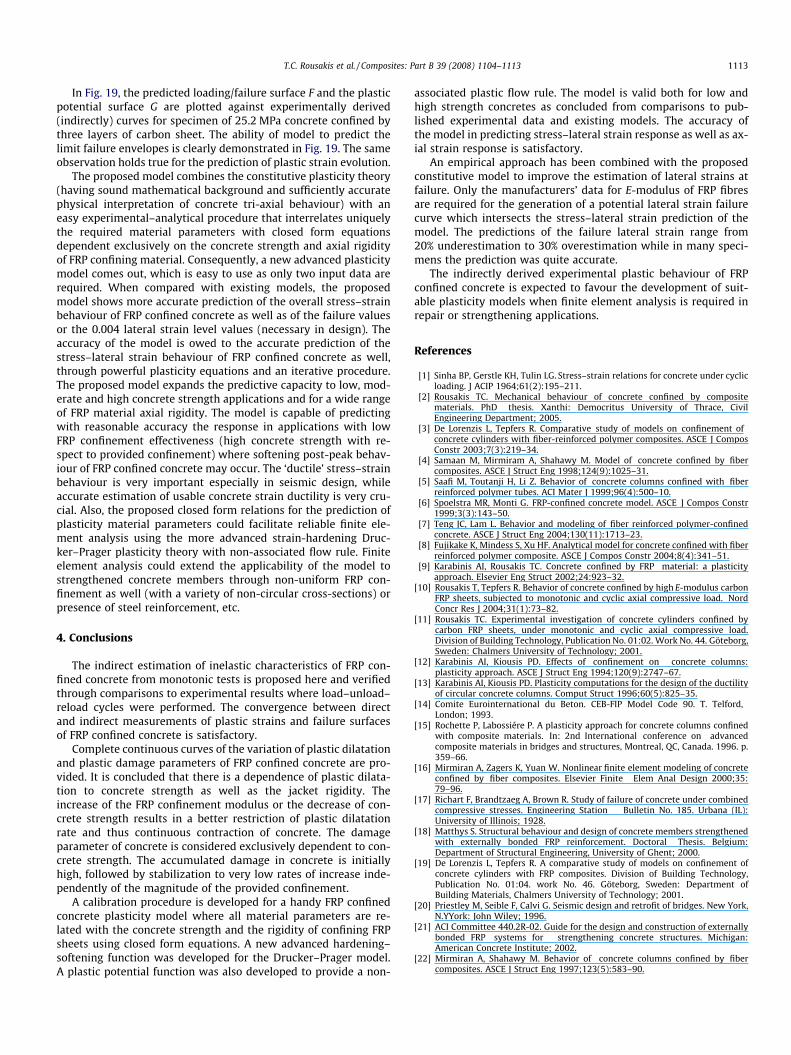
In Fig. 19, the predicted loading/failure surface F and the plasticpotential surface G are plotted against experimentally derived(indirectly) curves for specimen of 25.2 MPa concrete confined bythree layers of carbon sheet. The ability of model to predict thelimit failure envelopes is clearly demonstrated in Fig. 19. The sameobservation holds true for the prediction of plastic strain evolution.
The proposed model combines the constitutive plasticity theory(having sound mathematical background and sufficiently accuratephysical interpretation of concrete tri-axial behaviour) with aneasy experimental–analytical procedure that interrelates uniquelythe required material parameters with closed form equationsdependent exclusively on the concrete strength and axial rigidityof FRP confining material. Consequently, a new advanced plasticitymodel comes out, which is easy to use as only two input data arerequired. When compared with existing models, the proposedmodel shows more accurate prediction of the overall stress–strainbehaviour of FRP confined concrete as well as of the failure valuesor the 0.004 lateral strain level values (necessary in design). Theaccuracy of the model is owed to the accurate prediction of thestress–lateral strain behaviour of FRP confined concrete as well,through powerful plasticity equations and an iterative procedure.The proposed model expands the predictive capacity to low, mod-erate and high concrete strength applications and for a wide rangeof FRP material axial rigidity. The model is capable of predictingwith reasonable accuracy the response in applications with lowFRP confinement effectiveness (high concrete strength with re-spect to provided confinement) where softening post-peak behav-iour of FRP confined concrete may occur. The ‘ductile’ stress–strainbehaviour is very important especially in seismic design, whileaccurate estimation of usable concrete strain ductility is very cru-cial. Also, the proposed closed form relations for the prediction ofplasticity material parameters could facilitate reliable finite ele-ment analysis using the more advanced strain-hardening Druc-ker–Prager plasticity theory with non-associated flow rule. Finiteelement analysis could extend the applicability of the model tostrengthened concrete members through non-uniform FRP con-finement as well (with a variety of non-circular cross-sections) orpresence of steel reinforcement, etc.
4. Conclusions
The indirect estimation of inelastic characteristics of FRP con-fined concrete from monotonic tests is proposed here and verifiedthrough comparisons to experimental results where load–unload–reload cycles were performed. The convergence between directand indirect measurements of plastic strains and failure surfacesof FRP confined concrete is satisfactory.
Complete continuous curves of the variation of plastic dilatationand plastic damage parameters of FRP confined concrete are pro-vided. It is concluded that there is a dependence of plastic dilata-tion to concrete strength as well as the jacket rigidity. Theincrease of the FRP confinement modulus or the decrease of con-crete strength results in a better restriction of plastic dilatationrate and thus continuous contraction of concrete. The damageparameter of concrete is considered exclusively dependent to con-crete strength. The accumulated damage in concrete is initiallyhigh, followed by stabilization to very low rates of increase inde-pendently of the magnitude of the provided confinement.
A calibration procedure is developed for a handy FRP confinedconcrete plasticity model where all material parameters are re-lated with the concrete strength and the rigidity of confining FRPsheets using closed form equations. A new advanced hardening–softening function was developed for the Drucker–Prager model.A plastic potential function was also developed to provide a non-
associated plastic flow rule. The model is valid both for low andhigh strength concretes as concluded from comparisons to pub-lished experimental data and existing models. The accuracy ofthe model in predicting stress–lateral strain response as well as ax-ial strain response is satisfactory.
An empirical approach has been combined with the proposedconstitutive model to improve the estimation of lateral strains atfailure. Only the manufacturers’ data for E-modulus of FRP fibresare required for the generation of a potential lateral strain failurecurve which intersects the stress–lateral strain prediction of themodel. The predictions of the failure lateral strain range from20% underestimation to 30% overestimation while in many speci-mens the prediction was quite accurate.
The indirectly derived experimental plastic behaviour of FRPconfined concrete is expected to favour the development of suit-able plasticity models when finite element analysis is required inrepair or strengthening applications.
References
[1] Sinha BP, Gerstle KH, Tulin LG. Stress–strain relations for concrete under cyclicloading. J ACIP 1964;61(2):195–211.
[2] Rousakis TC. Mechanical behaviour of concrete confined by compositematerials. PhD thesis. Xanthi: Democritus University of Thrace, CivilEngineering Department; 2005.
[3] De Lorenzis L, Tepfers R. Comparative study of models on confinement ofconcrete cylinders with fiber-reinforced polymer composites. ASCE J ComposConstr 2003;7(3):219–34.
[4] Samaan M, Mirmiram A, Shahawy M. Model of concrete confined by fibercomposites. ASCE J Struct Eng 1998;124(9):1025–31.
[5] Saafi M, Toutanji H, Li Z. Behavior of concrete columns confined with fiberreinforced polymer tubes. ACI Mater J 1999;96(4):500–10.
[6] Spoelstra MR, Monti G. FRP-confined concrete model. ASCE J Compos Constr1999;3(3):143–50.
[7] Teng JC, Lam L. Behavior and modeling of fiber reinforced polymer-confinedconcrete. ASCE J Struct Eng 2004;130(11):1713–23.
[8] Fujikake K, Mindess S, Xu HF. Analytical model for concrete confined with fiberreinforced polymer composite. ASCE J Compos Constr 2004;8(4):341–51.
[9] Karabinis AI, Rousakis TC. Concrete confined by FRP material: a plasticityapproach. Elsevier Eng Struct 2002;24:923–32.
[10] Rousakis T, Tepfers R. Behavior of concrete confined by high E-modulus carbonFRP sheets, subjected to monotonic and cyclic axial compressive load. NordConcr Res J 2004;31(1):73–82.
[11] Rousakis TC. Experimental investigation of concrete cylinders confined bycarbon FRP sheets, under monotonic and cyclic axial compressive load.Division of Building Technology, Publication No. 01:02. Work No. 44. Göteborg,Sweden: Chalmers University of Technology; 2001.
[12] Karabinis AI, Kiousis PD. Effects of confinement on concrete columns:plasticity approach. ASCE J Struct Eng 1994;120(9):2747–67.
[13] Karabinis AI, Kiousis PD. Plasticity computations for the design of the ductilityof circular concrete columns. Comput Struct 1996;60(5):825–35.
[14] Comite Eurointernational du Beton. CEB-FIP Model Code 90. T. Telford,London; 1993.
[15] Rochette P, Labossiére P. A plasticity approach for concrete columns confinedwith composite materials. In: 2nd International conference on advancedcomposite materials in bridges and structures, Montreal, QC, Canada. 1996. p.359–66.
[16] Mirmiran A, Zagers K, Yuan W. Nonlinear finite element modeling of concreteconfined by fiber composites. Elsevier Finite Elem Anal Design 2000;35:79–96.
[17] Richart F, Brandtzaeg A, Brown R. Study of failure of concrete under combinedcompressive stresses. Engineering Station Bulletin No. 185. Urbana (IL):University of Illinois; 1928.
[18] Matthys S. Structural behaviour and design of concrete members strengthenedwith externally bonded FRP reinforcement. Doctoral Thesis. Belgium:Department of Structural Engineering, University of Ghent; 2000.
[19] De Lorenzis L, Tepfers R. A comparative study of models on confinement ofconcrete cylinders with FRP composites. Division of Building Technology,Publication No. 01:04. work No. 46. Göteborg, Sweden: Department ofBuilding Materials, Chalmers University of Technology; 2001.
[20] Priestley M, Seible F, Calvi G. Seismic design and retrofit of bridges. New York,N.YYork: John Wiley; 1996.
[21] ACI Committee 440.2R-02. Guide for the design and construction of externallybonded FRP systems for strengthening concrete structures. Michigan:American Concrete Institute; 2002.
[22] Mirmiran A, Shahawy M. Behavior of concrete columns confined by fibercomposites. ASCE J Struct Eng 1997;123(5):583–90.