Analytical modeling of composite manufacturing by vacuum assisted infusion with minimal experimental...
8
Journal of Materials Processing Technology 219 (2015) 173–180 Contents lists available at ScienceDirect Journal of Materials Processing Technology jo ur nal ho me page: www.elsevier.com/locate/jmatprotec Analytical modeling of composite manufacturing by vacuum assisted infusion with minimal experimental characterization of random fabrics Galyna Goncharova, Benoit Cosson, Mylene Deléglise Lagardère ∗ Mines Douai, Department of Polymers and Composites Technology & Mechanical Engineering, ress 941 Rue Charles Bourseul, CS 10838, 59508 Douai Cedex, France a r t i c l e i n f o Article history: Received 26 March 2014 Received in revised form 2 December 2014 Accepted 13 December 2014 Available online 23 December 2014 Keywords: Composite manufacturing Vacuum infusion Analytical modeling Random fabrics a b s t r a c t A new analytical formulation of governing equations for hydro-mechanical coupled problem during single sided molding processes such as vacuum infusion (VI) is presented in this study. The main complexities of VI modeling are the non-linear pressure profile and thickness evolution during filling. The research is focused on the relationship between flow progression, pressure changes and thickness distribution inside the cavity during infusion process. Solution of a moving boundary problem in terms of resin flow front position and pressure distribution is derived without the need for an explicit empirical law for permeability decrease with fiber volume fraction, neither for the fibers preform mechanical compressive behavior. In order to predict the thickness distribution over time, only permeability change with preform thickness is now required. The proposed model is derived and validated with experimental data where random fabric was considered. Better prediction for flow front position, pressure profile along flow length, and thickness distribution over time is obtained compared to other models found in the literature. A new characteristical parameter on fiber reinforcement linking preform thickness, permeability and flow front position is presented and validated with experimental data. An accurate model for infusion process with reduced material data inputs has thus been achieved. © 2014 Elsevier B.V. All rights reserved. 1. Introduction Composite materials become more and more appealing for structural applications due to their light weight and mechanical performances. To manufacture complex parts, liquid composite molding (LCM) processes are widely employed. Existing LCM pro- cesses can be divided into two groups (Williams et al., 1996): matched mold processes and single-sided mold processes. Matched mold methods (such as resin transfer molding) are suitable for medium parts manufacturing with high fiber content and controlled thicknesses (Park et al., 2011). On the other hand, single- sided mold processes (such as VI) are suitable for medium to large parts productions with larger thickness tolerances at a reduced cost (Williams et al., 1996). In such processes the dry fiber preform is placed in the half-mold and compacted with the vacuum applied under a flexible bag (Fig. 1a). Polymer is then injected thanks to the vacuum pressure drop. During resin flow, local modifications ∗ Corresponding author. Tel.: +33 327712176. E-mail address: [email protected] (M. Deléglise Lagardère). of the mechanical equilibrium occur and the fibrous preform is allowed to be decompacted. This step is crucial as it affects the infusion flow (through the change of local fiber volume fraction and permeability) and most importantly the part thickness profile (Fig. 1b). Substantial amount of experimental and modeling work has been carried out within the last decade on thickness change prediction during infusion process. In order to solve both flow front advance and mechanical response during the process, mate- rial characterization is mandatory: the fibrous preform hydraulic permeability and compressive mechanical response to trans- verse compaction and decompaction. Previous studies focusing on such characterization have been conducted on purely numer- ical simulation (using beam-based model, Gantois et al., 2013 or homogenization technique, Andreassen and Andreassen, 2014), coupled experimental context (in order to determined compress- ibility of the preform, Ouagne et al., 2010 or fiber reinforcement permeability in the thickness direction, Ouagne et al., 2013), noncoupled experimental characterization (for the transverse rein- forcement compaction, Nguyen et al., 2013, for the permeability characterization, Naik et al., 2014). For numerical simulation and http://dx.doi.org/10.1016/j.jmatprotec.2014.12.010 0924-0136/© 2014 Elsevier B.V. All rights reserved.
-
Upload
mines-douai -
Category
Documents
-
view
1 -
download
0
Transcript of Analytical modeling of composite manufacturing by vacuum assisted infusion with minimal experimental...

Aio
GM5
a
ARRAA
KCVAR
1
spmcmmfcsp(put
h0
Journal of Materials Processing Technology 219 (2015) 173–180
Contents lists available at ScienceDirect
Journal of Materials Processing Technology
jo ur nal ho me page: www.elsev ier .com/ locate / jmatprotec
nalytical modeling of composite manufacturing by vacuum assistednfusion with minimal experimental characterizationf random fabrics
alyna Goncharova, Benoit Cosson, Mylene Deléglise Lagardère ∗
ines Douai, Department of Polymers and Composites Technology & Mechanical Engineering, ress 941 Rue Charles Bourseul, CS 10838,9508 Douai Cedex, France
r t i c l e i n f o
rticle history:eceived 26 March 2014eceived in revised form 2 December 2014ccepted 13 December 2014vailable online 23 December 2014
eywords:omposite manufacturingacuum infusionnalytical modeling
a b s t r a c t
A new analytical formulation of governing equations for hydro-mechanical coupled problem during singlesided molding processes such as vacuum infusion (VI) is presented in this study. The main complexitiesof VI modeling are the non-linear pressure profile and thickness evolution during filling. The researchis focused on the relationship between flow progression, pressure changes and thickness distributioninside the cavity during infusion process. Solution of a moving boundary problem in terms of resin flowfront position and pressure distribution is derived without the need for an explicit empirical law forpermeability decrease with fiber volume fraction, neither for the fibers preform mechanical compressivebehavior. In order to predict the thickness distribution over time, only permeability change with preformthickness is now required. The proposed model is derived and validated with experimental data where
andom fabrics random fabric was considered. Better prediction for flow front position, pressure profile along flow length,and thickness distribution over time is obtained compared to other models found in the literature. A newcharacteristical parameter on fiber reinforcement linking preform thickness, permeability and flow frontposition is presented and validated with experimental data. An accurate model for infusion process withreduced material data inputs has thus been achieved.
© 2014 Elsevier B.V. All rights reserved.
. Introduction
Composite materials become more and more appealing fortructural applications due to their light weight and mechanicalerformances. To manufacture complex parts, liquid compositeolding (LCM) processes are widely employed. Existing LCM pro-
esses can be divided into two groups (Williams et al., 1996):atched mold processes and single-sided mold processes. Matchedold methods (such as resin transfer molding) are suitable
or medium parts manufacturing with high fiber content andontrolled thicknesses (Park et al., 2011). On the other hand, single-ided mold processes (such as VI) are suitable for medium to largearts productions with larger thickness tolerances at a reduced costWilliams et al., 1996). In such processes the dry fiber preform is
laced in the half-mold and compacted with the vacuum appliednder a flexible bag (Fig. 1a). Polymer is then injected thanks tohe vacuum pressure drop. During resin flow, local modifications∗ Corresponding author. Tel.: +33 327712176.E-mail address: [email protected] (M. Deléglise Lagardère).
ttp://dx.doi.org/10.1016/j.jmatprotec.2014.12.010924-0136/© 2014 Elsevier B.V. All rights reserved.
of the mechanical equilibrium occur and the fibrous preform isallowed to be decompacted. This step is crucial as it affects theinfusion flow (through the change of local fiber volume fractionand permeability) and most importantly the part thickness profile(Fig. 1b).
Substantial amount of experimental and modeling work hasbeen carried out within the last decade on thickness changeprediction during infusion process. In order to solve both flowfront advance and mechanical response during the process, mate-rial characterization is mandatory: the fibrous preform hydraulicpermeability and compressive mechanical response to trans-verse compaction and decompaction. Previous studies focusingon such characterization have been conducted on purely numer-ical simulation (using beam-based model, Gantois et al., 2013 orhomogenization technique, Andreassen and Andreassen, 2014),coupled experimental context (in order to determined compress-ibility of the preform, Ouagne et al., 2010 or fiber reinforcement
permeability in the thickness direction, Ouagne et al., 2013),noncoupled experimental characterization (for the transverse rein-forcement compaction, Nguyen et al., 2013, for the permeabilitycharacterization, Naik et al., 2014). For numerical simulation and
174 G. Goncharova et al. / Journal of Materials Processing Technology 219 (2015) 173–180
tion s
nvmTiiftctrnvtmW
•
•
•
•
2
imappbtnmtfinte2s
•
Fig. 1. Stages of the LRI processes: (a) dry compac
oncoupled characterization, permeability is evaluated on the rele-ant fiber volume fraction range and in parallel, the fibrous preformechanical response is obtained whether in dry or saturated state.
his extensive amount of experimental work can be time consum-ng and costly industrially speaking. The way to overcome thesessue is to develop a mathematical model requiring minimal pre-orm characterization. Thus the objective of the present work iso establish an efficient analytical model for the hydro-mechanicaloupling in infusion process using reduced preforms characteriza-ion and to validate it through the comparison with experimentalesults. In addition, a new parameter linking permeability, thick-ess and flow front position during infusion process is derived andalidated with experimental measurements. This approach allowso achieve material properties directly from the infusion experi-
ent with a stronger focus on the coupling of physical parameters.ithin this context, the following article presents:
state of the art regarding hydro-mechanical coupling involvedduring composite manufacturing;mathematical formulation and derived analytical solution forflow front progression and pressure distribution using minimalcharacterization of the fabrics properties;prediction of the thickness distribution using the characterizeddependence of permeability on preform thickness from RTMexperiments;application of this model to deduce the dependency of perme-ability with thickness using reverse analysis.
. Overview of models for vacuum infusion
The increasing amount of VI process applications for compos-te manufacturing is observed in different areas such as aerospace,
arine or wind energy community. Each of this industry requires high quality in terms of dimensional precision and mechanicalroperties of the produced parts. The final shape of a compositeart produced with VI process depends on the strong couplingetween resin pressure profile and the mechanical behavior ofhe fiber reinforcement during infusion process. Analytical andumerical models were developed to understand the physicalechanisms involved during the entire process. In the literature
he above problem is solved and compared for different types ofber reinforcement: continuous fiber mat (Correia et al., 2005),on-crimp stitch-bonded fabric (using single scale assumption forhe impregnation, Hammami and Gebart, 2000 and dual scale mod-ling, Acheson et al., 2004), plain weave fabric (Bayldon and Daniel,009). The authors followed the same algorithm and used pursuedet of equations:
Momentum equation (Darcy’s law):
→ K
u = −�∇P (1)
where→u is the Darcy’s velocity, K the preform permeability, �
the resin viscosity and P the fluid pressure.
tate and (b) decompaction during resin injection.
• Continuity equation (proposed by Gutowski and Dillon, 1992):
∂h
∂t= − ∂
∂x
(→uh
)(2)
where h is the preform thickness which changes with time t.• Stress equilibrium equation which states the sum of the fluid
pressure P and the fabric pressure Pcomp equivalent to the totalapplied pressure Ptot (Terzaghi’s law, Terzaghi, 1943):
P + Pcomp = Ptot (3)
Due to dynamic change of the thickness during VI, Eqs. (1)–(3)are closed with preform compaction and permeability consti-tutive equations. In this case the set of experimental studythrough mechanical and injection tests are conducted for differ-ent fiber reinforcements. Those experimental works need specialequipment, materials and it is time consuming. In addition, thelaminate compaction behavior depends on reinforcement’s archi-tecture (Williams et al., 1998), compaction speed (Comas-Cardonaet al., 2007) and exhibits relaxation (Dang-Huu et al., 2007) andpermanent deformation (Yenilmez et al., 2009). The laminate per-meability depends on the compaction (or fiber volume fractionchange), fiber arrangement (Van der Westhuizen and Plessis, 1996),fiber radii, degree of fiber saturation (Naik et al., 2014) and typeof permeability measurement (Arbter et al., 2011). Due to thecomplexity of fibrous structures, experimental performance andphysical processes during mechanical and injection tests, experi-mental results can vary significantly.
For example, in order to identify the relationship between pre-form thickness and compaction pressure, Yenilmez et al. (2009)presented experimental study of fiber reinforcement compressivebehavior. Every experiment was repeated ten times and the averagecurve of the preform response for the applied pressure was deter-mined (Fig. 2). The authors studied relaxation effects of dry andwet fabrics. They conclude that fiber relaxation and settling stagesdo not result in a steady thickness value even after 30 min. Experi-mental study of the thickness change during the injection stage ofVI also results in a constant thickness at the flow front (Yenilmezet al., 2009). Note, the variation for the compaction/decompactionthickness profile reaches 15% (Fig. 2). Another issue is the differentmechanical behavior between dry and wetted states, which createsa discontinuity clearly visible in Fig. 2. For the corresponding rangeof preform thickness, the preform permeability was measuredusing conventional unidirectional RTM experiment at a constantflow-rate injection (Yenilmez et al., 2009). Permeability is then cal-culated by reverse analysis of flow front position with time. Everyexperiment for the permeability evaluation was repeated 10 times(Fig. 3). Here the variation for the laminate permeability reaches35% (Fig. 3).
The validity of existing algorithm is conducted through compari-son with experimental data. In reviewed works the good correlation
with flow front position has been presented. Comparisons withpressure evolution and change of thickness are not presented.The model proposed by Correia et al. (2005) is used by Yenilmezet al. (2009) where the comparison with experimental data for
G. Goncharova et al. / Journal of Materials Processing Technology 219 (2015) 173–180 175
Fig. 2. Typical dry/wet compaction experiment data (Yenilmez et al., 2009).
flru2epb8atFseL
lmac
0 0.2 0.4 0.6 0.8 10
0.1
0.2
0.3
0.4
0.5
0.6
0.7
0.8
0.9
1
t / t*
P /
P 1
Model 8cmModel 16cmModel 22cmModel 28cmModel 34cmExp 8cmExp 16cmExp 22cmExp 28cmExp 34cm
Fig. 4. Comparison between experimental data (Yenilmez et al., 2009) and predicteddistribution of fluid pressure using model in Correia et al. (2005).
0 0.2 0.4 0.6 0.8 1
−0.25
−0.2
−0.15
−0.1
−0.05
0
0.05
0.1
0.15
0.2
0.25
t / t*
h −
h0 ,
mm
Model 8cmModel 16cmModel 22cmModel 28cmModel 34cmExp 8cmExp 16cmExp 22cmExp 28cmExp 34cm
∂t+
∂x= 0 0 ≤ x ≤ xf (4)
Fig. 3. Typical permeability experiment data (Yenilmez et al., 2009).
ow front position, pressure profile and change of thickness withespect to time has been conducted. The difference between sim-lated and experimental filling time reaches 66% (Yenilmez et al.,009). Figs. 4 and 5 present the comparison between model andxperimental data (Yenilmez et al., 2009) for fluid pressure andreform thickness distribution at different sensor locations. Sym-ols 1–5 present the distance from the inlet at sensors position –
cm, 16 cm, 22 cm, 28 cm, 34 cm, respectively. Two parameters arenalyzed: filling time at each sensor position (when pressure startso increase) and pressure evolution with time. As we can see fromig. 4, a good prediction of fluid pressure is achieved for the firstensor (8 cm from the inlet). The change of pressure during the flowxtension for the other sensors differs from the analytical solution.arge difference is also obtained for thickness profile (Fig. 5).
The identified source of deviance between experiment and over-ooked models is the difficulty in getting reliable experimental
aterial characterizations (fabrics mechanical and flow properties)
s inputs for the models, as both permeability and mechani-al behavior are sensitive to fiber volume fraction, experimentalFig. 5. Comparison between experimental data (Yenilmez et al., 2009) and predictedthickness distribution using model in Correia et al. (2005).
procedure and wetting state of the fibers. Therefore, the aim of thepresent work is to:
• develop a complete initial-value moving boundary problem withcontinuity approach, based on mass conservation equation;
• reduce experimental characterization requirements for mechan-ical and flow properties of fabrics;
• validate proposed model through comparison with infusionexperiment.
3. Mathematical formulation and analytical solution
With assumptions that the saturation is perfect, fluid is incom-pressible, mass conservation equation for unidirectional fluid flowis (Tucker and Dessenberger, 1994):
∂ϕ ∂ux
where ϕ is fiber reinforcement porosity, ux is flow velocity alonglength x, xf is flow front position.

1 ls Processing Technology 219 (2015) 173–180
s
w
e
Hl
b
•
•
•
•
f2(
P
fi(
d
(s
P
w
x
Etantp(cl
Table 1Material and process parameters for VI of four layers random fabric preform takenfrom experimental data reported at Yenilmez et al. (2009).
Parameter Representation Value Unit
Inlet pressure P1 90 kPaPorosity ϕf 74 %Permeability coefficient Kf 0.76 × 10⁻⁹ m2
Resin viscosity � 0.35 Pa sPreform length L 0.4 m
Fig. 6. Comparison between experimental data (Yenilmez et al., 2009) and predicted
76 G. Goncharova et al. / Journal of Materia
Assuming that preform porosity change depends only on pres-ure change, the first term in Eq. (4) can be written as
∂ϕ
∂t= ∂ϕ
∂P
∂P
∂t(5)
here P is fluid pressure.Substituting Eq. (5) and Terzaghi’s law (Eq. (3)) in the continuity
quation (Eq. (4)):
∂P
∂t= − ∂P
∂ϕ
∂∂x
(− K
�ϕ
∂P
∂x
)0 ≤ x ≤ xf (6)
ere permeability K(x, t) varies along flow length x and time t, asaminate thickness is decompacted during the infusion process.
Second order differential equation (Eq. (6)) with moving-oundary must be closed with initial and boundary conditions.
Initial flow front position at t=0:
xf (t = 0) = 0 (7)
Zero fluid pressure at flow front position:
P(x = xf , t) = 0 (8)
Flow front position is modeled using Darcy’s law:
dxf
dt= − Kf
�ϕf
∂P
∂xx = xf (9)
where Kf and ϕf are permeability and porosity of the material atthe flow front, respectively.Inlet pressure is constant and equal to P1:
P(x = 0, t) = P1 = Const (10)
Moving boundary problem (Eqs. (6)–(10)) is solved in closedorm analytical solution using Goodman’s integral method (Crank,005). In order to satisfy Eq. (6) and boundary conditions (Eqs.7)–(10)), solution is assumed to be a polynomial:
(x, t) = a(x − xf ) + b(x − xf )2 (11)
This assumption is acceptable and suitable to any pressure pro-le already presented in the literature for different LCM processesPark and Saouab, 2009).
Moving boundary position is then the solution of an ordinaryifferential equation with time as the independent variable.
Using Eq. (8) and differentiated form with respect to t of Eq.10) in the pressure profile equation (Eq. (11)), the solution whichatisfies moving-boundary problem (Eq. (6)–(10)) is (Crank, 2005):
(x, t) = P1
[1 −
(x
xf
)2]
(12)
Using the solution for pressure profile in Eq. (9), the solutionhich satisfies initial condition xf(t = 0) = 0 is
f = 2
√Kf P1t
�ϕf(13)
Note, similar to the solution proposed by Correia et al. (2005),q. (12) eliminates the variable ‘time’ in the pressure field solu-ion and presents the dimensionless flow front position x/xf. Withssumption that yarn saturation is perfect, the pressure profile doesot depend on permeability change of the material. With assump-ion that the material porosity changes only due to the change of
ressure (Eq. (5)) and following mass conservation equation (Eq.4)), the solution for pressure profile does not depend on materialompressibility and permeability in an explicit way, only on theaminate properties at the flow front (Eq. (13)).flow front position Eq. (13).
4. Validation of the mathematical model
Validation of the proposed model is conducted at this stage com-paring experimental and analytical pressure profiles and flow frontprogressions for a 1D injection. Experimental data and materialcharacterization are taken from Yenilmez et al. (2009). In this arti-cle, the authors injected four layers of random fabric. The materialand process parameters used for the present mathematical modelare reported in Table 1.
Analytical solution is derived from Eqs. (12) and (13) forpressure and flow front progression profile, respectively. Compar-ison between experimental and analytical profiles is presented inFigs. 6 and 7.
From Fig. 6, the flow front progression shows a good agreementbetween experimental data and analytical solution. Total fillingtime obtained experimentally is 150 s, whereas the analytical solu-tion gives a filling time of 153 s.
In Fig. 7 pressure profiles at locations x = 0.08, 0.16, 0.22, 0.28,0.34 m are presented. Good agreement is also obtained. The overallpressure profile over the flow length at filling time is presented inFig. 8, along with the previous model from the literature (Correiaet al., 2005). Better correlation is obtained with the present model.
The presented model is thus valid when random fabric, thatshows a high potential compaction ration, is considered.
Advantage of this model over the previous one found in litera-ture is that flow front position and pressure profile can be derivedwithout having to characterize the compressive mechanical behav-ior of preform and the relationship between permeability and fibervolume fraction. As have been discussed before, achieved exper-
imental permeability value from RTM process significantly variesfrom experiment to experiment. Together with complex and diffi-cult compaction/decompaction fabrics characterization, the modelproposed by Correia et al. (2005) accumulates the parameters
G. Goncharova et al. / Journal of Materials Processing Technology 219 (2015) 173–180 177
Fig. 7. Comparison between experimental data (Yenilmez et al., 2009) and predictedd
dmdtcfp
5
erPfaRfl
F((
Fig. 9. Comparison between experimental data (Yenilmez et al., 2009) and lin-ear approximation of fabric permeability at different preform thicknesses. Here [1]
istribution of fluid pressure Eq. (12).iscrepancies to the solution. The proposed model uses the infor-ation that the pressure profile is continuous and monotonically
ecreasing. This allows to find a solution with minimal experimen-al characterization of the fabrics. Efficient and simple approachan therefore be easily used in the industry. The following sectionurther describes the model prediction for final preform thicknessrofile after infusion process.
. Permeability
The preform permeability is a key parameter in the flow mod-ling through the fiber reinforcement. Permeability describes theesistance of the media to the flow during impregnation (Eq. (1)).ermeability coefficient strongly depends on preform fiber volumeraction and fibers impregnation degree (saturation level). Perme-bility variation with preform thickness change is evaluated using
TM impregnation set-up with constant pressure or with constantow rate injection strategy. According to Correia et al. (2005), theig. 8. Comparison of fluid pressure at filling time between experimental dataYenilmez et al., 2009), proposed model (Eq. (12)) and model from Correia et al.2005), using “dry/wet compaction data”.
presents the thickness change during VI for the first displacement sensor (8 cm fromthe inlet), [2] presents thickness change for the second sensor (16 cm from the inlet).
preform permeability in VI process KVI and the experimental RTMresults (KRTM) can be linked in the following way:
K = KVI = C˛KRTM (14)
where time dependent function C˛(t) is determined by the pressuregradient ratio for VI and RTM processes. C˛ can be found accordingto Correia et al. (2005):
C˛ =(∂P/∂x)x=xf
�PRTM(15)
where �PRTM is the driving pressure during RTM experiment.Experimental characterization of permeability with respect to
fiber volume fraction and therefore to thickness has been con-ducted by Yenilmez et al. (2009) and presented in Fig. 9. In generalcase, the polynomial approximation of permeability as a function ofthickness requires to conduct permeability measurement experi-ments with various preform thicknesses. As can be seen from Fig. 9,a polynomial first-order approximation of permeability as a func-
tion of thickness for the particular fabrics and for the range ofthickness can be accepted:KRTM = C1h + C2 (16)
Fig. 10. Comparison between experimental data (Yenilmez et al., 2009) and pre-dicted distribution of preform thickness using proposed model (Eq. (20)).
178 G. Goncharova et al. / Journal of Materials Processing Technology 219 (2015) 173–180
Table 2Parameters used for modeling.
Parameter Representation Value Unit
Vacuum pressure P1 86 kPaInitial thickness hf 4.8 × 10⁻³ mPorosity ϕf 76 %Permeability coefficient Kf 1.9 × 10⁻¹⁰ m2
Resin viscosity � 0.29 Pa sPreform length L 0.33 m
Fs
df
(C1
cs
Fl
ig. 11. Comparison between experimental data and predicted flow front progres-ion Eq. (13).
The coefficients C1 = 1.5 × 10⁻⁶ m and C2 = −3.76 × 10⁻⁹ m2 areefined by fitting Eq. (16) to experimental data. For other types ofabrics this assumption should be verified.
In the present case �PRTM = 470 kPa/m and hf = 3 ×10⁻³ mYenilmez et al., 2009), where hf is the thickness at the flow front.omparison between experimental data and approximation (Eq.6) for permeability is presented in Fig. 9.
From this characterization, thickness distribution during VI pro-ess can be evaluated. Methodology is described in the following
ection.ig. 12. Comparison between experimental data and predicted fluid pressure evo-ution at filling the time Eq. (12).
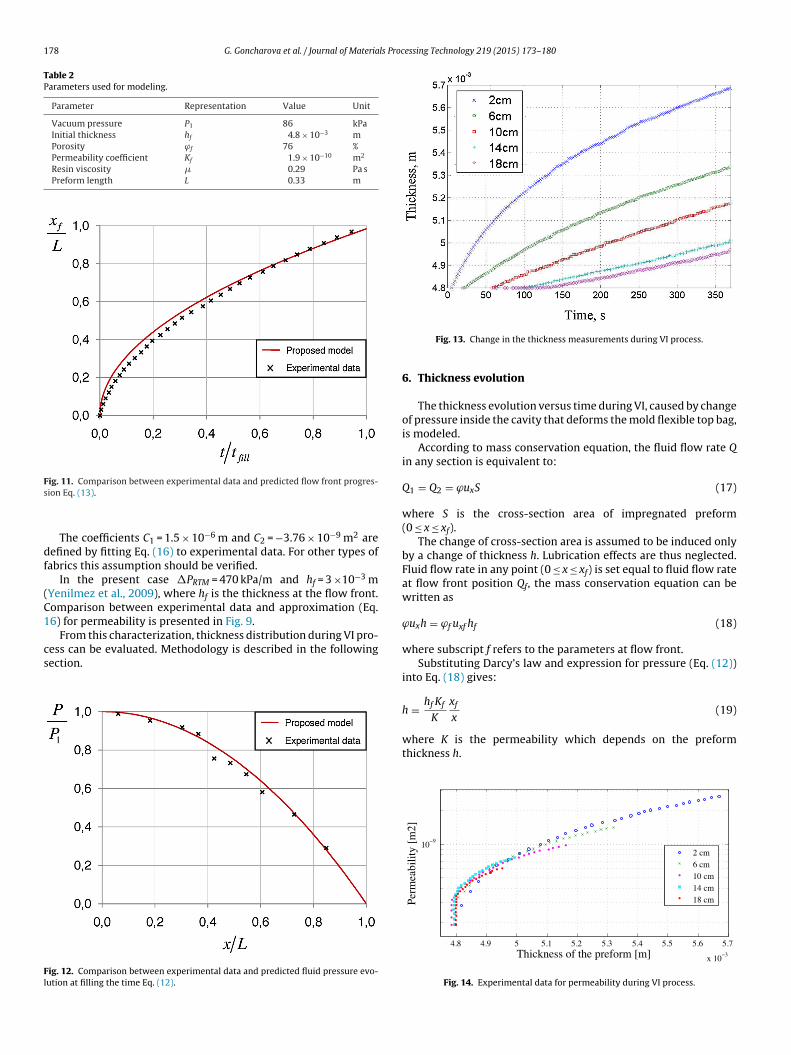
Fig. 13. Change in the thickness measurements during VI process.
6. Thickness evolution
The thickness evolution versus time during VI, caused by changeof pressure inside the cavity that deforms the mold flexible top bag,is modeled.
According to mass conservation equation, the fluid flow rate Qin any section is equivalent to:
Q1 = Q2 = ϕuxS (17)
where S is the cross-section area of impregnated preform(0 ≤ x ≤ xf).
The change of cross-section area is assumed to be induced onlyby a change of thickness h. Lubrication effects are thus neglected.Fluid flow rate in any point (0 ≤ x ≤ xf) is set equal to fluid flow rateat flow front position Qf, the mass conservation equation can bewritten as
ϕuxh = ϕf uxf hf (18)
where subscript f refers to the parameters at flow front.Substituting Darcy’s law and expression for pressure (Eq. (12))
into Eq. (18) gives:
h = hf Kf
K
xf
x(19)
where K is the permeability which depends on the preformthickness h.
4.8 4.9 5 5.1 5.2 5.3 5.4 5.5 5.6 5.7
x 10−3
10−9
Thickness of the preform [m]
Perm
eabi
lity
[m2]
2 cm6 cm10 cm14 cm18 cm
Fig. 14. Experimental data for permeability during VI process.

G. Goncharova et al. / Journal of Materials Processing Technology 219 (2015) 173–180 179
perm
ti
h
V(ea
c(cbOrT
7V
aa
K
tn
ePsmp0ift
Fig. 15. Experimental data for
Substituting Eqs. (14)–(16) into Eq. (19) and taking into accounthat the solution for the thickness profile should be a real and pos-tive definite function, Eq. (19) becomes
= −12
P1C2x −√
P21 C2
2 x2 + 2P1C1xx2fhf Kf �PRTM
P1C1x(20)
In order to validate this approach for thickness evolution duringI process, comparison with experimental data from Yenilmez et al.
2009) is conducted. Fig. 10 shows good agreement for the thicknessvolution between experimental data from Yenilmez et al. (2009)nd simulated solution using proposed model (Eq. (20)).
Fig. 10 presents a good match between proposed analyti-al model (Eq. (20)) and experimental data from the literatureYenilmez et al., 2009). It has been shown that the thickness changean be obtained without explicit knowledge of the relationshipetween fiber volume fraction and compaction pressure (Eq. (20)).nly the permeability evolution with the preform thickness is
equired in order to predict the thickness distribution over time.he proposed model is thus validated for thickness prediction.
. Analysis: new parameter of fabric reinforcement duringI
Taking into account that thickness and permeability at flow frontre constant, it is possible to determine from Eq. (19) a new char-cteristical parameter for the preform during VI process:
hx
xf= Kf hf = const (21)
Eq. (21) presented the fact that for every selected position alonghe preform, there is constant relation between permeability, thick-ess and filling ratio.
In order to validate Eq. (21) for vacuum infusion process anxperimental set up is developed. The bottom plate is made inlexiglas and is equipped with five pressure transducers. A metallictructure support equipped with LVDT sensors for vertical displace-ent monitoring is placed over the mold set-up. The sensors are
laced at different distances from the inlet: 0.02, 0.06, 0.10, 0.14,
.18 m. A perfect alignment of pressure and displacement sensorss insured. Experiment has been done for four layers of randomabric. The applied vacuum is −86 kPa. Material and experimen-al characteristics are presented in Table 2. Initial thickness has
eability according to Eq. (21).
been determined from the compaction test and the permeabilitycoefficient was obtained from appropriate RTM experiment. Exper-iment is repeated three times to show the repeatability of results.Obtained injection time is 356 s ±5%.
Figs. 11 and 12 present the comparison of flow progression andpressure distribution of experimental data and proposed model(Eqs. (13) and (12), respectively). Fig. 13 presents the results ofthickness measurements during VI experiment.
Using Eqs. (9) and (18), permeability is equivalent to:
K = hf Kf
h
(∂P/∂x)x=xf
∂P/∂x(22)
Substituting experimental data for results of pressure, thicknessand flow progression measurements during VI experiment intoEq. (22), the change of permeability due to change of thickness isachieved and presented in Fig. 14. Fig. 14 presents different perme-ability value for different sensors positions. Substituting obtainedpermeability value into Eq. (21) and using experimental data forthickness and flow front progression, obtained permeability withrespect to variable parameters xf/xh is presented in Fig. 15. Fig. 15shows that the permeability coefficient is a linear function withrespect to xf/xh, as it has been deduced (Eq. (21)).
Good match between analytical and experimental results for allfive sensors validates correctness of Eq. (21). Eq. (21) can prop-erly represent the relationship between permeability, thicknessand flow evolution inside the preform during VI process.
Consequently, during unidirectional VI process for every cross-section area perpendicular to flow progression, the product ofpermeability, thickness and ratio between longitudinal position ofcross-section and flow front position (xf/xh) is constant.
The experimental data for flow front progression, pressure andthickness distribution have been presented. The explicit relation-ship between permeability and thickness for VI process has beendeduced and validated. Conservation equation between permeabil-ity and thickness (Eq. (21)) can give new opportunities in order toreduce needed parameters for the modeling of the VI process.
8. Conclusions
In this article, an analytical model and closed form solution for VIprocess using reduced experimental characterization of mechani-cal and flow properties of fabrics are proposed. Flow front position,

1 ls Proc
pfgspkcfittd
dfiacc
necoo
awp
A
RN
R
A
A
A
80 G. Goncharova et al. / Journal of Materia
ressure evolution and thickness change are obtained in closedorm analytical solution. It is shown that proposed solution givesood match with experimental data for flow front position, pres-ure distribution and thickness variation over time. Therefore flowrogression and pressure distribution can be found without explicitnowledge of the relationship between fiber volume fraction andompaction pressure as well as between preform permeability andber volume fraction. Consequently, mass conservation equationogether with additional boundary condition give simple and effec-ive way to find a solution for flow front position and pressureistribution during single sided molding processes.
Also, it has been shown that thickness change can be pre-icted without explicit knowledge of the relationship betweenber volume fraction and compaction pressure. Only the perme-bility change with thickness is required. Reducing experimentalharacterization of mechanical behavior of preform helps to avoidomplicated and time-consuming experimental tests.
The new explicit relationship between permeability and thick-ess for VI process has been deduced and validated with conductedxperimental work. It is shown that during unidirectional VI pro-ess for every cross-section along the flow progression, the productf permeability, thickness and ratio between longitudinal positionf cross-section and flow front position is constant.
This model has been checked with mat preforms, which can bessumed as isotropic material. For other types of preform such asoven, braided, angle-interlock preform structures, the dual-scaleermeability model can be analyzed in future works.
cknowledgments
The authors wish to thank ANR (Agence Nationale de laecherche), France for financing part of this work within theUMTISS project, ANR-09-MAPR-0018 MAPR.
eferences
cheson, J., Simacek, P., Advani, S., 2004. The implications of fiber compaction andsaturation on fully coupled VARTM simulation. Composites A 35, 159–169.
ndreassen, E., Andreassen, C., 2014. How to determine composite material prop-erties using numerical homogenization. Comput. Mater. Sci. 83, 488–495.
rbter, R., Beraud, J., Binetruy, C., Bizet, L., Brard, J., Comas-Cardona, S., Demaria,C., Endruweit, A., Ermanni, P., Gommer, F., Hasanovic, S., Henrat, P., Klunker, F.,Laine, B., Lavanchy, S., Lomov, S., Long, A., Michaud, V., Morren, G., Ruiz, E., Sol, H.,
essing Technology 219 (2015) 173–180
Trochu, F., Verleye, B., Wietgrefe, M., Wu, W., Ziegmann, G., 2011. Experimentaldetermination of the permeability of textiles: a benchmark exercise. CompositesA 42, 1157–1168.
Bayldon, J., Daniel, I.M., 2009. Flow modeling of the vartm process including pro-gressive saturation effects. Polym. Compos. A 40, 1044–1052.
Comas-Cardona, S., Grognec, P.L., Binetruy, C., Krawczak, P., 2007. Unidirecti-onal compression of fibre reinforcements. Part 1: A non-linear elastic–plasticbehaviour. Compos. Sci. Technol. 67, 507–514.
Correia, N., Robitaille, F., Long, A., Rudd, C., Simacek, O., Advani, S., 2005. Analysis ofthe vacuum infusion moulding process: I. Analytical formulation. Composites A36, 1645–1656.
Crank, J., 2005. Free and Moving Boundary Problems. Oxford University Press.Dang-Huu, T., Deleglise, M., Comas-Cardona, S., Binetruy, C., Krawczak, P., 2007.
Experimental and numerical investigation of the elastoplastic behaviour offibrous preform during the infusion process. In: ETDCM8, Eighth Seminar onExperimental Techniques and Design in Composite Materials, Castiadas, Italie,3–6 October.
Gantois, R., Cantarel, A., Cosson, B., Dusserre, G., Felices, J.N., Schmidt, F., 2013. BEM-based models to simulate the resin flow at macroscale and microscale in LCMprocesses. Polym. Compos. 34, 1235–1244.
Gutowski, T., Dillon, G., 1992. The elastic deformation of lubricated carbon fiber bun-dles: comparison of theory and experiments. J. Compos. Mater. 26, 2330–2347.
Hammami, A., Gebart, B., 2000. Analysis of the vacuum infusion molding process.Polym. Compos. 21, 28–40.
Naik, N., Sirisha, M., Inani, A., 2014. Permeability characterization of polymer matrixcomposites by RTM/VARTM. Prog. Aerosp. Sci. 65, 22–40.
Nguyen, Q., Vidal-Sall, E., Boisse, P., Park, C., Saouab, A., Breard, J., Hivet, G., 2013.Mesoscopic scale analyses of textile composite reinforcement compaction. Com-posites B 44, 231–241.
Ouagne, P., Breard, J., Ouahbi, T., Saouab, A., Park, C.H., 2010. Hydro-mechanicalloading and compressibility of fibrous media for resin infusion processes. Int. J.Mater. Form. 3, 1287–1294.
Ouagne, P., Ouahbi, T., Park, C., Breard, J., Saouab, A., 2013. Continuous measurementof fiber reinforcement permeability in the thickness direction: experimentaltechnique and validation. Composites B 1, 609–618.
Park, C., Lebel, A., Saouab, A., Breard, J., Lee, W., 2011. Modeling and simulation ofvoids and saturation in liquid composite molding processes. Composites A 6,658–668.
Park, C., Saouab, A., 2009. Analytical modeling of composite molding by resininfusion with flexible tooling: VARI and RFI processes. J. Compos. Mater. 43,1877–1900.
Terzaghi, K., 1943. Theoretical Soil Mechanics. John Wiley and Sons.Tucker III, C., Dessenberger, B., 1994. Governing Equation for Flow and Heat Transfer
in Stationary Fiber Beds. Elsevier.Van der Westhuizen, J., Plessis, J.D., 1996. An attempt to quantify fiber bed perme-
ability utilizing the phase average Navier–Stokes equation. Composites A 27A,263–269.
Williams, C., Grove, S., Summerscales, J., 1998. The compression response of fibre-reinforced plastic plates during manufacture by the resin infusion under flexible
tooling method. Composites A 29A, 111–114.Williams, C., Summerscales, J., Grove, S., 1996. Resin infusion under flexible tooling(RIFT): a review. Composites A 27, 517–524.
Yenilmez, B., Senan, M., Sozer, E., 2009. Variation of part thickness and compactionpressure in vacuum infusion process. Compos. Sci. Technol. 69, 1710–1719.