Analysis Over the Accuracy of Dynamic Formulas for ...
13
66 American Scientific Research Journal for Engineering, Technology, and Sciences (ASRJETS) ISSN (Print) 2313-4410, ISSN (Online) 2313-4402 http://asrjetsjournal.org/ Analysis Over the Accuracy of Dynamic Formulas for Predicting Ultimate Load Capacity in Deep Foundations Alcineide D. Pessoa a , Gean Carlos L. Sousa b , Gérson J.M. Anjos c , Rodrigo C. Araujo d * a Lecturer, State University of the Tocantina Region of Maranhão (UEMASUL), Imperatriz-MA, Brazil b Assistant Professor, Federal University of Maranhão (UFMA), São Luís-MA, Brazil c Associate Professor, Federal University of Pará (UFPA), Belém-PA, Brazil d Associate Professor, Federal University of Maranhão (UFMA), São Luís-MA, Brazil a Email: [email protected] b Email: [email protected] c Email: [email protected] d Email: [email protected] Abstract In Civil Engineering, particularly in Geotechnics, several empirical methods, commonly referred to as dynamic equations, have been proposed for prediction of ultimate load capacity of driven piles. However, these formulas are admitted inaccurate and, so, there is a need to evaluate the results obtained by them. In this work a comparative analysis of the values obtained by five dynamic equations (Janbu, Danish, Gates, FHWA-Gates and WSDOT) with actual ultimate load capacities (obtained through pile load tests at site) is made. Errors are measured using the root mean squared error and the correlation between the equation´s results and the measured values is verified. The results showed important differences between the ultimate capacities obtained from the analyzed models and the real values verified in field tests. It was also verified a superiority, in terms of lower error and greater correlation, of the WSDOT and Danish formulas. Attempts were made to improve the methods. For this, coefficients were determined that, when multiplied by the results of the formulas, promoted a reduction in error. Once again, WSDOT presented best perform in terms of correlation and error. Keywords: Ultimate Capacity; Dynamic Equations; Deep Foundations; Root Means Squared Error. ------------------------------------------------------------------------ * Corresponding author.
-
Upload
khangminh22 -
Category
Documents
-
view
1 -
download
0
Transcript of Analysis Over the Accuracy of Dynamic Formulas for ...
66
American Scientific Research Journal for Engineering, Technology, and Sciences (ASRJETS)
ISSN (Print) 2313-4410, ISSN (Online) 2313-4402
http://asrjetsjournal.org/
Analysis Over the Accuracy of Dynamic Formulas for
Predicting Ultimate Load Capacity in Deep Foundations
Alcineide D. Pessoaa, Gean Carlos L. Sousa
b, Gérson J.M. Anjos
c , Rodrigo C.
Araujod*
aLecturer, State University of the Tocantina Region of Maranhão (UEMASUL), Imperatriz-MA, Brazil
bAssistant Professor, Federal University of Maranhão (UFMA), São Luís-MA, Brazil
cAssociate Professor, Federal University of Pará (UFPA), Belém-PA, Brazil
dAssociate Professor, Federal University of Maranhão (UFMA), São Luís-MA, Brazil
aEmail: [email protected]
bEmail: [email protected]
cEmail: [email protected]
dEmail: [email protected]
Abstract
In Civil Engineering, particularly in Geotechnics, several empirical methods, commonly referred to as dynamic
equations, have been proposed for prediction of ultimate load capacity of driven piles. However, these formulas
are admitted inaccurate and, so, there is a need to evaluate the results obtained by them. In this work a
comparative analysis of the values obtained by five dynamic equations (Janbu, Danish, Gates, FHWA-Gates and
WSDOT) with actual ultimate load capacities (obtained through pile load tests at site) is made. Errors are
measured using the root mean squared error and the correlation between the equation´s results and the measured
values is verified. The results showed important differences between the ultimate capacities obtained from the
analyzed models and the real values verified in field tests. It was also verified a superiority, in terms of lower
error and greater correlation, of the WSDOT and Danish formulas. Attempts were made to improve the
methods. For this, coefficients were determined that, when multiplied by the results of the formulas, promoted a
reduction in error. Once again, WSDOT presented best perform in terms of correlation and error.
Keywords: Ultimate Capacity; Dynamic Equations; Deep Foundations; Root Means Squared Error.
------------------------------------------------------------------------
* Corresponding author.
American Scientific Research Journal for Engineering, Technology, and Sciences (ASRJETS) (2021) Volume 79, No 1, pp 66-78
67
1. Introduction
In engineering, several models, empirical or not, have been proposed to solve many types of problems. These
models go mainly through physical assumptions and construction of approximations by mathematical models,
which generate a series of uncertainties and approximation errors. An important problem in geotechnics is the
prediction of the ultimate load capacity of deep foundations [1]. It is common to find in the literature several
formulas that try to perform this task. Author in [2] explains that several equations have been developed to
calculate the ultimate capacity of a pile during driving which are widely used in the field to determine whether a
pile has reached a satisfactory bearing value at the predetermined depth. However, the presence of uncertainties
in these estimates is a constant [3]. Because the dynamic formulas originate from different hypotheses, the
results may differ widely, depending on the formula used [4]. Classical methods such as Janbu´s and Danish
formulas are still used as models for calculating ultimate load capacity. On the other hand, more recent models
such as that proposed by the Washington Department of Transportation (WSDOT) have been incorporated into
the literature [4]. However, it is noticeable that comparative analyzes of the efficiency of each formula are
necessary, once these studies are scarce in the literature.Thus, the objective of this work is to evaluate the
accuracy of the ultimate capacity estimated through five dynamic equations presented in the literature. To this
end, the capacity forecasts resulting from such proposals are evaluated by comparing them with actual results
obtained through pile load tests at site. To achieve this goal the work calculates the ultimate capacity using five
pile-driving formulas (Janbu, Danish, Gates, FHWA-Gates and WSDOT) and then compares by means of the
Root Mean Squared Error (RMSE) and correlation the results obtained by the formulas with the capacities
measured in loco.
2. Capacity in Deep Foundations
Foundation can be defined as a system formed by structural foundation elements (EEF) and the various layers of
soil that surround them [5]. Author in [6] explains that all engineered construction resting on the earth must be
carried by some kind of interfacing element called a foundation. Reference [7] states that foundations are
structural elements whose function is to transmit the loads of the structure to the ground on which it rests. In a
similar way, one can say that foundation is the lowest part of a structure generally and its function is to transfer
the load of the structure to the soil on which it is resting [8]. The way this transfer takes place is the parameter
used to classify the foundations as shallow or deep. Shallow foundations are those whose transmission is made
through the base of the structural element of the foundation, considering only the support of the piece on the
ground layer, being neglected any other form of load transfer, while deep foundations are those that transfer the
loads by either skin friction along the shaft or point resistance [5]. A deep foundation is one whose base rupture
mechanism does not appear on the surface of the ground [9, 10]. On the other hand, reference [11] defines that
deep foundation is the foundation element that transmits a load either by the base (tip resistance) or by its lateral
surface (shaft resistance) or by a combination of both, being its tip or base at a depth greater than twice its
smallest dimension in the plant and at least 3.0m [11]. Focusing on deep foundation, it can be said that from the
point of view of soil mechanics, there are two general types: the first type may be represented by a foundation
installed by some process of excavation or drilling which does not induce significant changes in density or
structure of the bearing soil and the second type may be represented by a deep foundation forced into the ground
American Scientific Research Journal for Engineering, Technology, and Sciences (ASRJETS) (2021) Volume 79, No 1, pp 66-78
68
by driving or a similar operation, that induces significant changes in adjacent soil [12]. Considering only pile
foundation cases, imagine any pile of length L installed in the ground. If a compression force P is applied to its
head and progressively increased, resistant tensions will be mobilized. The transfer of superficial load to the
ground may be partially by vertical distribution of the load along the pile shaft and partially by a direct
application of load to a lower stratum through the pile point [6, 12]. This way, the ultimate load capacity is
usually expected to be obtained by load-carrying capacity of the pile point plus the frictional resistance (skin
friction) derived from the soil–pile interface [1, 2]. To determine the ultimate capacity of an isolated pile, three
verification mechanisms can be used: static formulas (theoretical or empirical), dynamic equations, or load tests.
In the last decades, several studies have applied artificial intelligence to improve the accuracy of bearing
capacity predictions specially referring to driven piles [13, 14, 15, 16]. Referring to pile driving formulas its
historical popularity among practicing engineers may be attributed to the fact that it reduces the design of pile
foundations to a quite simple procedure. However, their obvious deficiencies and unreliability makes that the
price one pays for this artificial simplification is remarkably high [17].
2.1. Dynamic equations
Within the context of dynamic equations, these models are based on the permanent penetration of a pile, caused
by the application of a hammer or pylon blow, always related to the driving energy. Given its small size, it is
usually based on the average value obtained from the last few driving blows. Author in [4] highlights that the
fact that these models are based on that permanent penetration corroborates with the requirements in [11], which
requires its verification. Five dynamic equations will be presented below. The choice of these formulas was due
to the variables necessary in each of them and its availability in the database. The list below is a summary of the
notations used in the pile driven formulas:
Qt: Ultimate Load Capacity (kN)
η: Efficiency
W: Hammer´s Weight (kN)
West: Pile´s Weight (kN)
h: Hammer Drop Height (m)
L: Pile Length (m)
s: permanent penetration of a pile, caused by the application of a hammer or pylon blow (m/blow)
A: Pile Cross Section (m²)
Ep: Modulus of Elasticity (kN/m²)
American Scientific Research Journal for Engineering, Technology, and Sciences (ASRJETS) (2021) Volume 79, No 1, pp 66-78
69
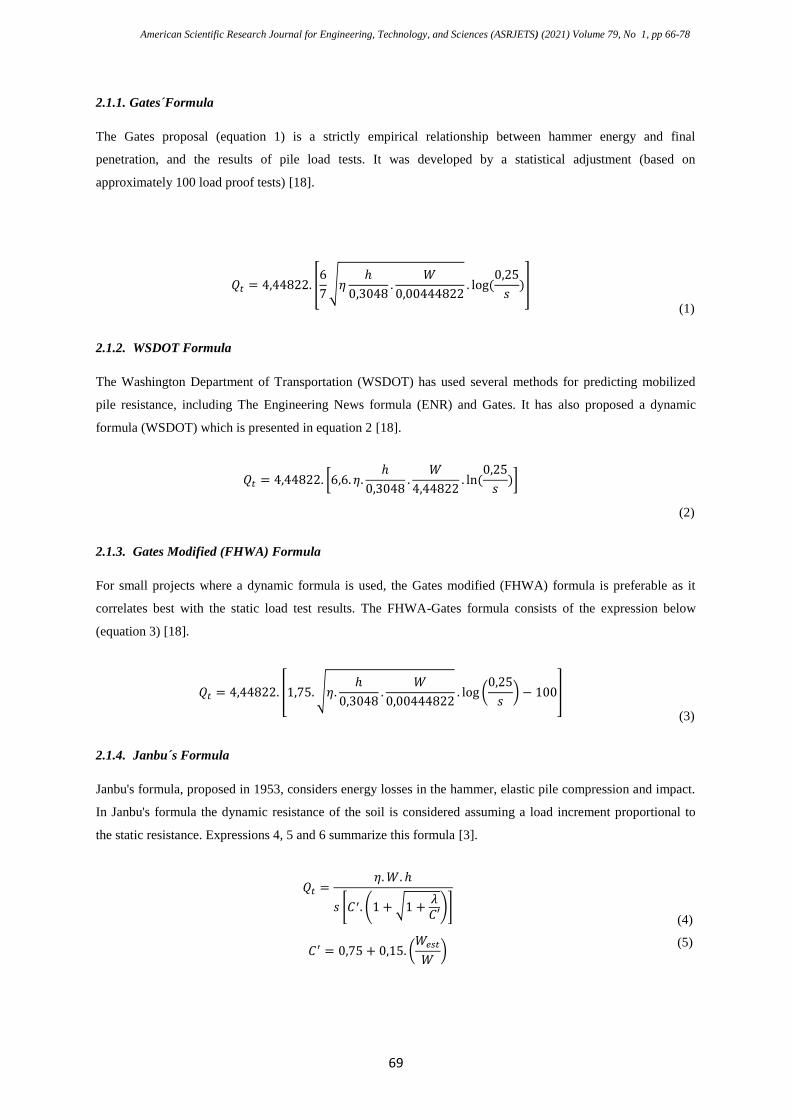
2.1.1. Gates´Formula
The Gates proposal (equation 1) is a strictly empirical relationship between hammer energy and final
penetration, and the results of pile load tests. It was developed by a statistical adjustment (based on
approximately 100 load proof tests) [18].
2.1.2. WSDOT Formula
The Washington Department of Transportation (WSDOT) has used several methods for predicting mobilized
pile resistance, including The Engineering News formula (ENR) and Gates. It has also proposed a dynamic
formula (WSDOT) which is presented in equation 2 [18].
2.1.3. Gates Modified (FHWA) Formula
For small projects where a dynamic formula is used, the Gates modified (FHWA) formula is preferable as it
correlates best with the static load test results. The FHWA-Gates formula consists of the expression below
(equation 3) [18].
2.1.4. Janbu´s Formula
Janbu's formula, proposed in 1953, considers energy losses in the hammer, elastic pile compression and impact.
In Janbu's formula the dynamic resistance of the soil is considered assuming a load increment proportional to
the static resistance. Expressions 4, 5 and 6 summarize this formula [3].
[
√
]
(1)
[
]
(2)
[ √
(
) ]
(3)
* ( √
)+
(4)
(
)
(5)
American Scientific Research Journal for Engineering, Technology, and Sciences (ASRJETS) (2021) Volume 79, No 1, pp 66-78
70
2.1.5. Danish Formula
The Danish formula (equation 7) was developed by authors in [19] who proposed an equation obtained through
a dimensional analysis. The proposal takes into consideration the efficiency of the hammer and the energy loss
due to the elastic deformation of the pile [3].
3. Materials and Methods
As previously stated, to evaluate the quality of ultimate capacity estimates obtained through dynamic equations,
the work compared the capacity predictions resulting from five of these proposals with load capacities obtained
through load tests. The database used to carry out the project was compiled from authors in [20, 21, 22] and
consisted of 233 load tests, carried out in diverse cities and different countries, for which load capacity, hammer
weight, hammer drop height, pile length and pile weight values were available. These values were used to
calculate ultimate capacity using the Gates, WSDOT and FHWA-Gates formulas. Of the 233 tests available, 153
also had information on the modulus of elasticity of the pile. These data allowed the estimates by Janbu´s and
Danish formulas.
Table 1: presents the efficiencies values adopted for each equation, which have been chosen according to the
authors' practical experience.
Equation (Statics load tests – VDV_9%D) (Dynamics load tests – PDA)
Janbu 75% 30%
Danish 40% 20%
Gates (1957) 80% 80%
WSDOT 35% 35%
FHWA-Gates (2006) 55% 65%
Table 1: Efficiency Adopted (η)
To measure and thus compare the equations proposed in the literature with the results of load tests Pearson
Correlation Coefficient and Root Mean Squared Error metrics were used. Correlation identifies two groups of
data with some relationship to each other, that is, if high (low) values of one of the variables implicated in high
(or low) values of another variable. A correlation analysis provides a number that summarizes the degree of
linear relationship between the two variables, which is called the correlation coefficient. Then, the choice of the
correlation coefficient (Equation 8) was due to this metric be widely used to evaluate this type of methodology
(6)
√
(7)

American Scientific Research Journal for Engineering, Technology, and Sciences (ASRJETS) (2021) Volume 79, No 1, pp 66-78
71
[23].
However, the linear correlation coefficient may lead to false conclusions when interpreted as an accuracy index
of predictions or simulations. For example, the analysis of a variable whose simulation and observation are
highly correlated, it can hide the tendency of simulations to overestimate or underestimate the observed. Thus, a
measure often used to verify the accuracy of numerical models is the Root Mean Squared Error (RSME), which
is defined as the mean of the difference between the estimator value and the squared parameter. The root mean
squared error is obtained by the expression presented in Equation 9 [24].
Where is the measured value, ̂ is the value obtained in the analyzed model and is the number of samples.
In other words, the choice of correlation as an evaluation metric was because it is a metric widely used to
evaluate comparisons of this type, while the use of the root mean squared error as an evaluation metric is
extremely important because its evaluation is a better way to verify the accuracy of the methods used to solve
the proposed problem. For a visual evaluation, scatter plots are presented that relate real values and calculated
values. Finally, statistical analysis was also performed to determine adjustment coefficients capable of
improving each method. After obtaining the adjusted results for each method, by multiplying original formulas
by the respective coefficients above mentioned, correlations and RSME were calculated again.
4. Results and Discussion
Using the formulas described in equations 1 to 7, the ultimate load capacities for all samples were calculated.
Comparisons between the calculated values and the values obtained by load tests at site are shown in figures 1 to
5. Two groups of simulations were performed. In the first group, the Janbu´s and Danish formulas were used
because these models need the values of the modulus of elasticity of the pile. For these simulations 153 samples
were used. In Figure 1 the results obtained with Janbu's formula are compared graphically with the load capacity
values obtained in loco.
Graphically, it is possible to verify interesting discrepancies between the results obtained by the Janbu´s
equation and the actual values. It can be noticed an important difference between the actual values and those
obtained byjanbu's formula, highlighting a sample in which the value obtained by the formula (1,708KN) was
extremely lower than the actual value (14,740KN). Figure 2 shows the comparison between Danish Formula´s
results and actual load tests values.
√
(8)
where X and Y are the variables analyzed.
√∑ ̂
(9)

American Scientific Research Journal for Engineering, Technology, and Sciences (ASRJETS) (2021) Volume 79, No 1, pp 66-78
72
Figure 1: Comparison between Janbu´s results and load tests values
Figure 2: Comparison between Danish results and and load tests values
When the Danish formula was used an improvement in the results was noticed, but only through the evaluation
American Scientific Research Journal for Engineering, Technology, and Sciences (ASRJETS) (2021) Volume 79, No 1, pp 66-78
73
metrics will a more appropriate quantitative analysis be possible. However, the discrepancy in the same pile
remains. This fact can be the object of future investigation, that is, to analyze specifically what characteristics in
the pile load capacity provoke the values obtained by the formula to be so discrepant of the originals. The
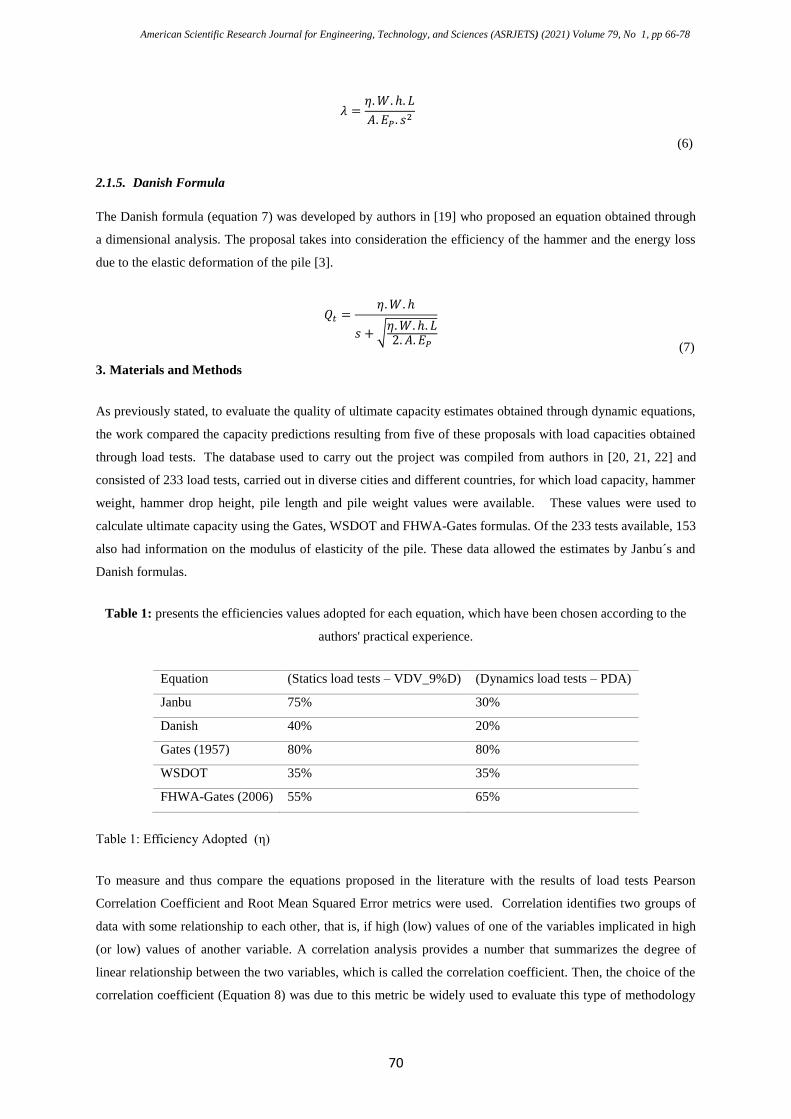
second group of simulations consisted of the application of those formulas that do not use the modulus of
elasticity of the pile: Gates, WSDOT and FHWA-Gates. A comparison between the results obtained by the
FHWA-Gates formula and those tested by load proof is presented in Figure 3.
Figure 3: Comparison between FHWA-GATES results and load tests values
Differently from what was observed in the application of the Janbu and Danish formulas, the FHWA-GATES
formula generally provided underestimated values. Most of the values obtained by the formula were lower than
those measured by load test. In some cases, it is possible to observe in the chart, the difference between the
measured value and that obtained by the formula is remarkably high. These observations show that this model is
composed of important weaknesses and its use seems to require special attention. The results obtained through
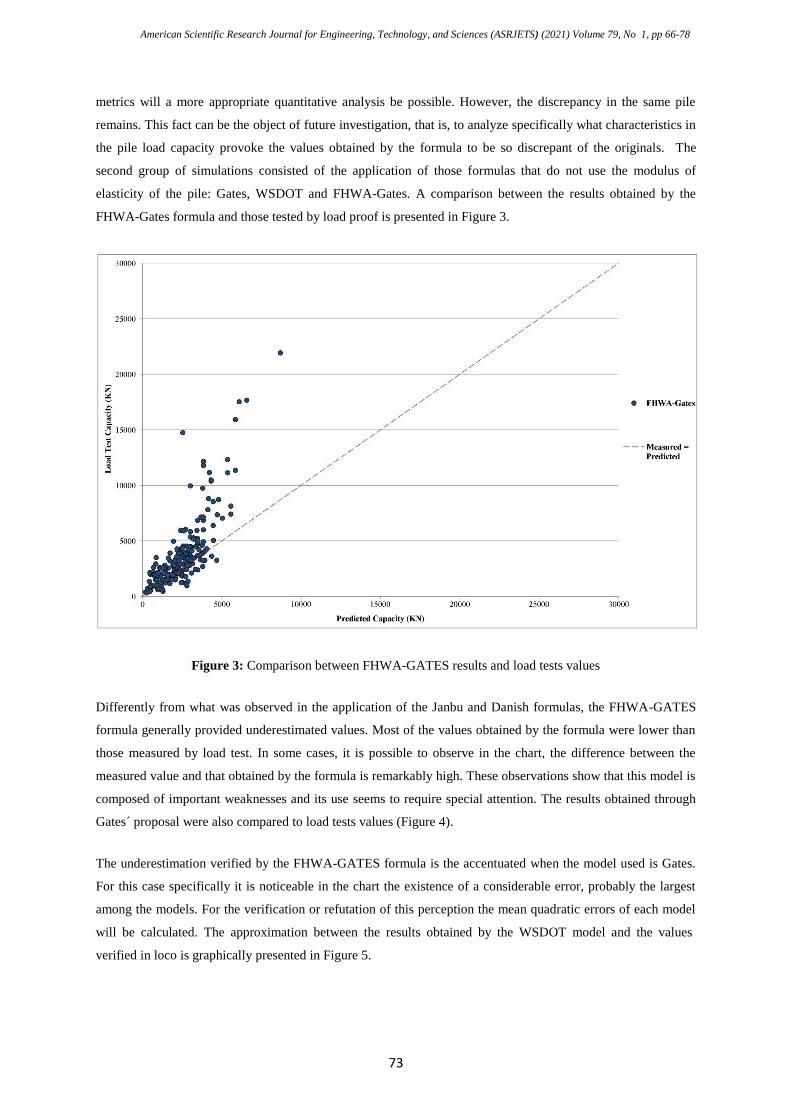
Gates´ proposal were also compared to load tests values (Figure 4).
The underestimation verified by the FHWA-GATES formula is the accentuated when the model used is Gates.
For this case specifically it is noticeable in the chart the existence of a considerable error, probably the largest
among the models. For the verification or refutation of this perception the mean quadratic errors of each model
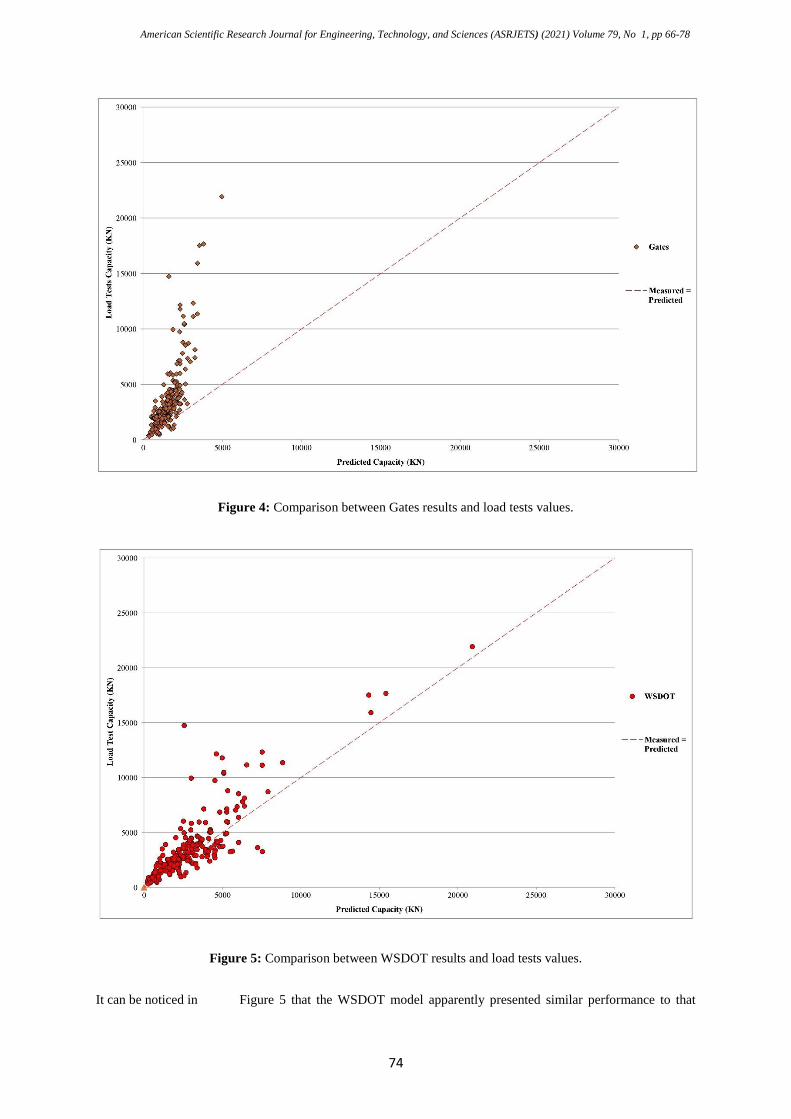
will be calculated. The approximation between the results obtained by the WSDOT model and the values
verified in loco is graphically presented in Figure 5.
American Scientific Research Journal for Engineering, Technology, and Sciences (ASRJETS) (2021) Volume 79, No 1, pp 66-78
74
Figure 4: Comparison between Gates results and load tests values.
Figure 5: Comparison between WSDOT results and load tests values.
It can be noticed in Figure 5 that the WSDOT model apparently presented similar performance to that

American Scientific Research Journal for Engineering, Technology, and Sciences (ASRJETS) (2021) Volume 79, No 1, pp 66-78
75
obtained with the Danish Formula and performed better than Janbu´s (Figure 1), Gates (Figure 2) and FHWA-
Gates (Figure 3). However, to measure these differences an appropriate metric is required. The metric used for
this is root-mean-square error. To quantitatively compare the results of the studied models, the root mean
squared error between the results of each model and values measured in loco, as well as their respective
correlations, were determined. These metrics are presented in table 2.
Table 2: Statistical metrics of comparison between the Equations results and Load Tests Values
Janbu Danish Gates WSDOT FHWA
RMSE 2,879.9 2,094.6 3,328.4 1,792.6 2,540.6
Correlation 0.735 0.837 0.791 0.848 0.791
The RMSE values presented in Table 2 numerically confirm what can be observed in the graphs presented, that
is, the WSDOT formula was the model that presented results closest to the actual values. On the other hand, the
biggest discrepancy was presented by Gates' formula. This fact also confirms the observations made when
analyzing the graphs presented. Considering the results, attempts were made to improve the methods. For this,
coefficients were determined that, when multiplied by the results of the formulas, promoted a reduction in error,
maintaining the correlation. Table 3 presents the new results obtained, also indicating the value of the
coefficient applied to each method.
Table 3: Statistical metrics of comparison between the Improved Equations results and Load Tests Values
Janbu Danish Gates WSDOT FHWA
Coefficient 1.4111 1.1197 2.4797 1.1591 1.5661
RMSE 2,463.9 2,016.2 2,088.8 1,682.1 1,983.6
Correlation 0.735 0.837 0.791 0.848 0.791
It should be noted that the WSDOT method continues to produce the lowest errors, combined with a better
correlation. It is also noteworthy that such a method, even in its original version, still produces better results
than all the other, even in its improved versions. Because it was observed that a pile specifically presented large
discrepancies between predicted values and load test value by any of the methods, it was considered that such a
point may represent an outlier, or even an incorrect input data. Thus, the determinations of RMSE and
correlation were redone, excluding this value from the input data. Results obtained are presented in table 4.
Table 4: Statistical metrics of comparison between the Equations results and Load Tests Values excluding
outlier pile
Janbu Danish Gates WSDOT FHWA
RMSE 2,689.1 1,842.3 3,222.1 1,607.9 2,416.4
Correlation 0.768 0.871 0.813 0.875 0.812
With the elimination of the outlier pile the results improve considerably, to the point of providing Danish and
American Scientific Research Journal for Engineering, Technology, and Sciences (ASRJETS) (2021) Volume 79, No 1, pp 66-78
76
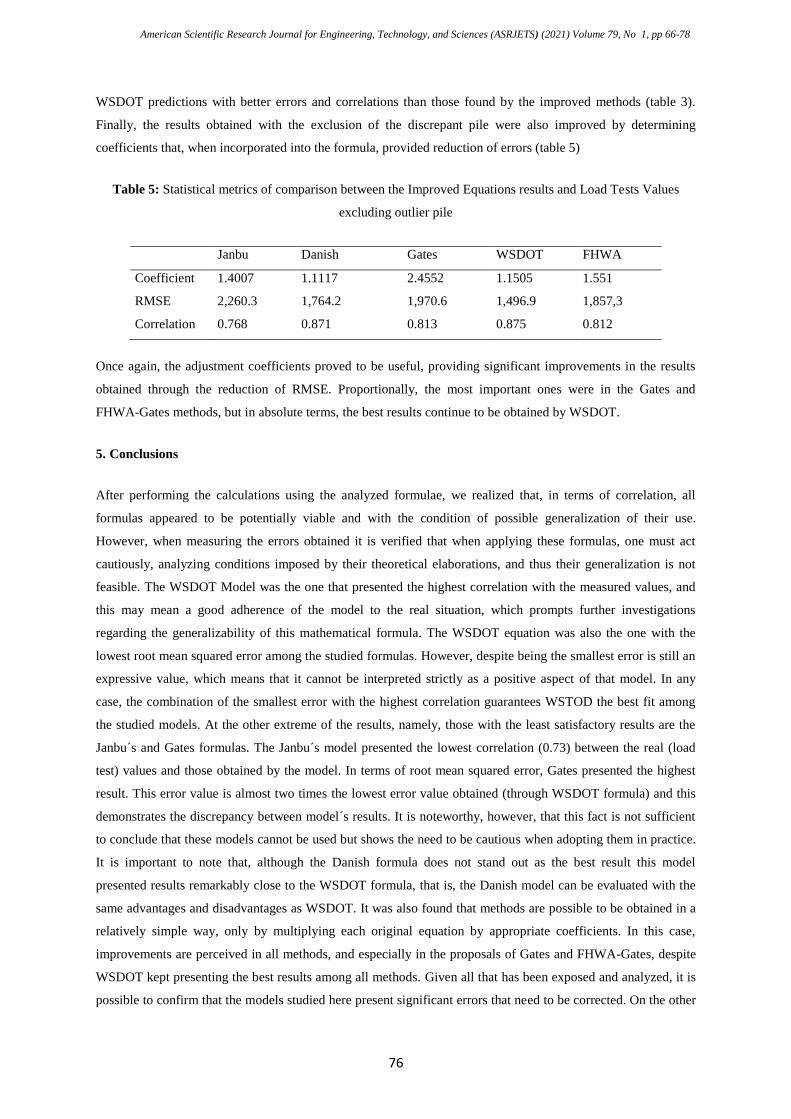
WSDOT predictions with better errors and correlations than those found by the improved methods (table 3).
Finally, the results obtained with the exclusion of the discrepant pile were also improved by determining
coefficients that, when incorporated into the formula, provided reduction of errors (table 5)
Table 5: Statistical metrics of comparison between the Improved Equations results and Load Tests Values
excluding outlier pile
Janbu Danish Gates WSDOT FHWA
Coefficient 1.4007 1.1117 2.4552 1.1505 1.551
RMSE 2,260.3 1,764.2 1,970.6 1,496.9 1,857,3
Correlation 0.768 0.871 0.813 0.875 0.812
Once again, the adjustment coefficients proved to be useful, providing significant improvements in the results
obtained through the reduction of RMSE. Proportionally, the most important ones were in the Gates and
FHWA-Gates methods, but in absolute terms, the best results continue to be obtained by WSDOT.
5. Conclusions
After performing the calculations using the analyzed formulae, we realized that, in terms of correlation, all
formulas appeared to be potentially viable and with the condition of possible generalization of their use.
However, when measuring the errors obtained it is verified that when applying these formulas, one must act
cautiously, analyzing conditions imposed by their theoretical elaborations, and thus their generalization is not
feasible. The WSDOT Model was the one that presented the highest correlation with the measured values, and
this may mean a good adherence of the model to the real situation, which prompts further investigations
regarding the generalizability of this mathematical formula. The WSDOT equation was also the one with the
lowest root mean squared error among the studied formulas. However, despite being the smallest error is still an
expressive value, which means that it cannot be interpreted strictly as a positive aspect of that model. In any
case, the combination of the smallest error with the highest correlation guarantees WSTOD the best fit among
the studied models. At the other extreme of the results, namely, those with the least satisfactory results are the
Janbu´s and Gates formulas. The Janbu´s model presented the lowest correlation (0.73) between the real (load
test) values and those obtained by the model. In terms of root mean squared error, Gates presented the highest
result. This error value is almost two times the lowest error value obtained (through WSDOT formula) and this
demonstrates the discrepancy between model´s results. It is noteworthy, however, that this fact is not sufficient
to conclude that these models cannot be used but shows the need to be cautious when adopting them in practice.
It is important to note that, although the Danish formula does not stand out as the best result this model
presented results remarkably close to the WSDOT formula, that is, the Danish model can be evaluated with the
same advantages and disadvantages as WSDOT. It was also found that methods are possible to be obtained in a
relatively simple way, only by multiplying each original equation by appropriate coefficients. In this case,
improvements are perceived in all methods, and especially in the proposals of Gates and FHWA-Gates, despite
WSDOT kept presenting the best results among all methods. Given all that has been exposed and analyzed, it is
possible to confirm that the models studied here present significant errors that need to be corrected. On the other
American Scientific Research Journal for Engineering, Technology, and Sciences (ASRJETS) (2021) Volume 79, No 1, pp 66-78
77
hand, it is noticeable the need for models that have the possibility of better generalization than those already
existing in the literature. These findings indicate that the problem of estimating ultimate load capacity in a
simplified manner based in known pile´s and driving parameters continues to be a major challenge in
geotechnics. One limitation faced in this is study is that not all the database presented the modulus of elasticity
as a known parameter. Thus, the number of simulations could not be the same for all formulas. This fact
represents two problems: first, for analyzes of this type, it is desirable that the number of samples be as large as
possible and, second, the difference in the number of samples makes the comparison between formulas a
slightly more delicate problem to be analyzed. Suggestions for future studies may include comparisons between
the accuracy of such formulas and those of other methods of predicting ultimate bearing capacity of isolated
piles, especially static formulas (theoretical or empirical) or the development of improved equations, for
example through computational methods such as artificial neural networks.
References
[1]. B.H. Fellenius. Basics of Foundation Design. British Columbia, 2020.
http://www.fellenius.net/papers/401%20The%20Red%20Book,%20Basics%20of%20foundation%20de
sign%202020.pdf
[2]. B.M. Das. Principles of Foundation Engineering. Seventh Edition.Cengage Learning, Stamford, 2011.
[3]. M.A. de L. Alves., F.D.R. Lopes., B.R. Danziger. "Métodos dinâmicos para previsão e controle do
comportamento de estacas cravadas", Teoria e prática na Engenharia Civil; n.4, p. 12-22, 2004.
[4]. J.F. Cabette. "Análise dos métodos semi-empíricos utilizados para estimativa da capacidade de carga
de estacas pré-fabricadas com base em resultados de ensaios de carregamento dinâmico". Dissertation,
University of São Paulo, 2014.
[5]. J.C.A. Cintra., N. Aoki. Fundações por Estacas - Projeto Geotécnico. Oficina dos Texto, São Paulo,
2010.
[6]. J.E. Bowles. Foundation Analysis and Design. 5th Edition, The McGraw-Hill Companies, Inc., New
York, 1996.
[7]. H.A.Azeredo. O Edifício Até Sua Cobertura. 2a Edition. Edgar Blucher, São Paulo, 1977.
[8]. B.M. Das. Principles of the Geotechnical Engineering. 7th ed., Cengage Learning, Stamford, 2010.
[9]. W.C. Hachich., F.F. Falconi., J. Saes., R.G.Q. Frota., C.S. Carvalho., S. Niyama. Fundações – Teoria e
prática. Ed. Pini, ABMS/ABEF, 2ª. ed., São Paulo, 1998.
[10]. D.D.A. Velloso., F.D.R. Lopes. FUNDAÇÕES. Oficina de textos, São Paulo, 2012.
[11]. Associação Brasileira de Normas Técnicas. "NBR 6122: Projeto e execução de fundações". Rio de
Janeiro, 2010.
[12]. A.S. Vesic. "Bearing Capacity of Deep Foundations in Sand.National Academy of Sciences", Highway
Research Board, Report No. 39, Washington D.C.; pp. 112-153,1963.
[13]. W. Chan., Y. Chow., L. Liu. "Neural network: an alternative to pile driving formulas", Computers and
geotechnics; vol. 17, no.2: 135-156, 1995.
[14]. I. M. Lee., J.H. "Prediction of pile bearing capacity using artificial neural networks", Computers and
Geotechnics; vol. 18, no.3: 189-200, 1996.
[15]. T.A. Pham., H-B. Ly., V-Q Tran., L.V. Giap., H-L. T. Vu., H-A. T. Duong. "Prediction of Pile Axial
American Scientific Research Journal for Engineering, Technology, and Sciences (ASRJETS) (2021) Volume 79, No 1, pp 66-78
78
Bearing Capacity Using Artificial Neural Network and Random Forest", Applied Sciences; 10(5):1871,
2020. https://doi.org/10.3390/app10051871
[16]. A.D. Pessoa., G.C. L. Sousa., R.C. Araujo., G.J.M. Anjos. "Artificial Neural Network Model for
Predicting Load Capacity of Driven Piles", Research, Society and Development; 10 (1):e12210111526,
2021. https://doi.org/10.33448/rsd-v10i1.11526.
[17]. K. Terzaghi. Theoretical Soil Mechanics. John Wiley & Sons,, New York, 1943
[18]. R. V. Gallegos. "Aplicabilidade da equação de onda e de fórmulas dinâmicas na estimativa da
capacidade de carga em estacas". Dissertation, Pontifícia Universidade Católica do Rio de Janeiro,
2014.
[19]. T. Sorensen., B. Hansen. "Pile driving formulae—an investigation based on dimensional considerations
and a statistical analysis". In: Proceedings of 4th international conference soil mechanics and
foundation engineering, 1957.
[20]. B. O. Lobo. "Método de previsão de capacidade de carga de estacas : aplicação dos conceitos de
energia do ensaio SPT". . Dissertação (Mestrado).
Programa de Pós-Graduação em Engenharia Civil. UFRGS, Porto Alegre, 2005.
[21]. M.S. R. Jayaweera. "Capacity Estimation of Piles Using Dynamic Methods". Master of Engineering in
Foundation Engineering &
Earth Retaining Systems. University of Moratuwa. Sri-Lanka, 2009.
[22]. SCAC. "Case: conjunto residencial no Rio de Janeiro", 2013.
<https://issuu.com/scacengenharia/docs/scac_case_conj_residencial_rj>
[23]. J. Benesty., J. Chen., Y. Huang., I. Cohen. "Pearson correlation coefficient". In Noise reduction in
speech processing (pp. 1-4). Springer, Berlin, Heidelberg, 2009.
[24]. C.J. Willmott., K. Matsuura. "Advantages of the mean absolute error (MAE) over the root mean square
error (RMSE) in assessing average model performance", Clim Res.; 30(1):79–82, 2005.