Extending drill-down through semantic reasoning on indicator formulas
12
Extending drill-down through semantic reasoning on indicator formulas Claudia Diamantini, Domenico Potena, and Emanuele Storti Dipartimento di Ingegneria dell’Informazione Universit` a Politecnica delle Marche via Brecce Bianche, 60131 Ancona, Italy {c.diamantini,d.potena,e.storti}@univpm.it Abstract. Performance indicators are calculated by composition of more basic pieces of information, and/or aggregated along a number of differ- ent dimensions. The multidimensional model is not able to take into account the compound nature of an indicator. In this work, we propose a semantic multidimensional model in which indicators are formally de- scribed together with the mathematical formulas needed for their compu- tation. By exploiting the formal representation of formulas an extended drill-down operator is defined, which is capable to expand an indicator into its components, enabling a novel mode of data exploration. Effec- tiveness and efficiency are briefly discussed on a prototype introduced as a proof-of concept. 1 Introduction Performance measurement is the subject of extensive interdisciplinary research on information systems, organizational modeling and operation, decision sup- port systems and computer science. Much work is devoted to categorize refer- ence performance measures, or indicators [1, 2]. Strategic support information systems exploit results on data warehouse architectures. The multidimensional model has been introduced to suitably represent Performance Indicators (PI) and to enable flexible analyses by means of OLAP operators, facilitating man- agers in visualization, communication and reporting of PIs. Nevertheless, design and management of PIs are still hard. Among the major obstacles: (1) differ- ences between the business view and the technical view of PIs, (2) information overload syndrome: managers are inclined to ask for more indicators than those actually needed [3], (3) interpretation of the meaning of indicators and their val- ues. To some extent these obstacles relate to the fact that indicators are complex data with an aggregate and/or compound nature, as their values are calculated by applying some formulas defined over other indicators, or by aggregating raw data values, or both. Unawareness of the dependencies among indicators leads people to treat indicators as independent pieces of information, and is a cause of the information overload syndrome. Similarly, many disputes during managerial meetings come from a lack of a common understanding of indicators. To give an example, somebody states that the amount of investment in higher education
Transcript of Extending drill-down through semantic reasoning on indicator formulas

Extending drill-down through semanticreasoning on indicator formulas
Claudia Diamantini, Domenico Potena, and Emanuele Storti
Dipartimento di Ingegneria dell’InformazioneUniversita Politecnica delle Marche
via Brecce Bianche, 60131 Ancona, Italy{c.diamantini,d.potena,e.storti}@univpm.it
Abstract. Performance indicators are calculated by composition of morebasic pieces of information, and/or aggregated along a number of differ-ent dimensions. The multidimensional model is not able to take intoaccount the compound nature of an indicator. In this work, we proposea semantic multidimensional model in which indicators are formally de-scribed together with the mathematical formulas needed for their compu-tation. By exploiting the formal representation of formulas an extendeddrill-down operator is defined, which is capable to expand an indicatorinto its components, enabling a novel mode of data exploration. Effec-tiveness and efficiency are briefly discussed on a prototype introduced asa proof-of concept.
1 Introduction
Performance measurement is the subject of extensive interdisciplinary researchon information systems, organizational modeling and operation, decision sup-port systems and computer science. Much work is devoted to categorize refer-ence performance measures, or indicators [1, 2]. Strategic support informationsystems exploit results on data warehouse architectures. The multidimensionalmodel has been introduced to suitably represent Performance Indicators (PI)and to enable flexible analyses by means of OLAP operators, facilitating man-agers in visualization, communication and reporting of PIs. Nevertheless, designand management of PIs are still hard. Among the major obstacles: (1) differ-ences between the business view and the technical view of PIs, (2) informationoverload syndrome: managers are inclined to ask for more indicators than thoseactually needed [3], (3) interpretation of the meaning of indicators and their val-ues. To some extent these obstacles relate to the fact that indicators are complexdata with an aggregate and/or compound nature, as their values are calculatedby applying some formulas defined over other indicators, or by aggregating rawdata values, or both. Unawareness of the dependencies among indicators leadspeople to treat indicators as independent pieces of information, and is a cause ofthe information overload syndrome. Similarly, many disputes during managerialmeetings come from a lack of a common understanding of indicators. To give anexample, somebody states that the amount of investment in higher education
in Italy is too low (far below the EU average), while somebody else states it istoo high and should be lowered. Digging into this apparent contradiction, onediscovers that both evaluate the amount of investment as the ratio between “to-tal expenditure” and “student population”, but whereas the former defines the“student population” as people officially enrolled in a course, the latter subtractsstudents who do not actually take exams. In order to fully grasp the meaning ofthe indicator an analysis of the way it is calculated is necessary. Furthermore,a correct interpretation of the value and trend of the indicator is unachievablewithout analysing its components.
Although the complex nature of indicators is well-known, it is not fullycaptured in existing models. The multidimensional model takes into accountthe aggregative aspect, defining a data cube as a multi-level, multidimensionaldatabase with aggregate data at multiple granularities [4]. The definition of pow-erful OLAP operators like drill-down directly comes from this model. Semanticrepresentations of the multidimensional model have been recently proposed [4–8]mainly with the aim to reduce the gap between the high-level business view ofindicators and the technical view of data cubes, to simplify and to automatizethe main steps in design and analysis.
The compound nature of indicators is far less explored. Proposals in [2,9–14]include in the representations of indicators’ properties some notion of formulain order to support the automatic generation of customized data marts, thecalculation of indicators [9, 10, 13], or the interoperability of heterogeneous andautonomous data warehouses [12]. In the above proposals, formula representationdoes not rely on logic-based languages, hence reasoning is limited to formula eval-uation by ad-hoc modules. No inference mechanism and formula manipulation isenabled. Formal, logic-based representations of dependencies among indicatorsare proposed in [2,14]. These properties are represented by logical predicates (e.g.isCalculated [14], correlated [2]) and reasoning allows to infer implicit dependen-cies among indicators useful for organization modeling, design, as well as reuse,exchange and alignment of business knowledge. An ontological representation ofindicator’s formulas is proposed in [11] in order to exchange business calculationdefinitions and to infer their availability on a given data mart through semanticreasoning, with strong similarities with our previous work [15].
In the present paper we propose to extend the data cube model with thedescription of the structure of an indicator given in terms of its algebraic for-mula. Relations between the aggregation function and the formula are taken intoaccount. As the traditional multidimensional model leads to the definition of thedrill-down operator, so the novel structure enables the definition of a novel opera-tor we call indicator drill-down. Like the usual drill-down, this indicator increasesthe detail of a measure of the data cube, but instead of disaggregating along thelevels of dimensions, it expands an indicator into its components. The two no-tions of drill-down are integrated thus allowing a novel two-dimensional way ofexploring data cubes. To the best of our knowledge this is the first time that suchan extended drill-down is considered. As a further contribution, we introduce afirst-order logic theory for the representation of indicators’ formulas and manip-

Table 1. An excerpt of the enterprise glossary.
Indicator Description Aggr Formula
AvgCostsExtIdeas Average costs of ideas produced by external usersthrough the crowdsourcing platform
n/aCrowdInv
NumExternalIdeas
CrowdInv Total Investments for crowdsourcing activities:management of the platform, promoting and fa-cilitating the participation,...
SUM
IdeasAcceptedEng The number of ideas accepted for engineering.These ideas are intended for future production
SUM
IdeasProposed Number of (internal/external) ideas proposed SUM NumInternalIdeas+NumExternalIdeas
IdeaYield Ratio of proposed ideas to ideas that have enteredthe engineering phase and will be developed
n/aIdeasAcceptedEng
IdeasProposed
NumExternalIdeas Number of ideas generated from the externalstakeholders
SUM
NumInternalIdeas Number of ideas generated from enterprise’s em-ployees
SUM
ulation based on equation resolution. The set of predicates defines a knowledgebase for reference, domain-independent indicators specification. Other predicatesare introduced to define members’ roll-up along dimensional hierarchies, as wellas to state the set of indicators actually implemented in a given data mart, thusproviding the specification for a certain application domain. The theory enablesformula manipulation thus providing the full drill-down functionalities, allow-ing to expand an indicator into its components even if some are not explicitlystored in the data mart. Besides enabling the definition of a novel operator, theproposed logic representation extends the state of the art in the following ways:(1) we are not limited to the reference indicator specification, since equivalentdefinitions can be inferred, hence the evaluation of the formula can follow sev-eral paths, (2) indicators that are not explicitly stored in the data mart can becalculated by exploiting their relationships with other indicators represented inthe knowledge base, (3) relevant relationships among indicators, like (inverse)dependency, (inverse) correlation, causality, influence can be inferred, while theyhave to be explicitly introduced with other approaches [2, 13,14].
The rest of the paper is organized as follows: Section 2 introduces the casestudy that will be used as an illustrative example through the paper. Section 3presents the proposed model, then Section 4 discusses its application to the defi-nition of the extended drill-down operator. In Section 5 the proposal is evaluated.Finally Section 6 draws some conclusion and discusses future work.
2 Case Study
The present work is conceived within the EU Project BIVEE1. In this Sectionwe present a case study that is based on the data mart (DM) used by one of theend-users of the project, and will be used as an illustrative example through thepaper. In particular, we refer to an enterprise that develops innovative solutions,
1 http://bivee.eu

Fig. 1. The Innovation data mart.
from metrology to robotics domains, to satisfy specific requests of customers. Theenterprise adopts the open innovation paradigm [16], where innovation extendsbeyond the boundaries of the enterprise, involving both partners and customersas sources of innovative ideas. To this end, the enterprise hosts and managesa crowdsourcing platform. Finally, in the enterprise the work is organized on aproject basis. Figure 1 shows the data mart used by the enterprise to analyseinnovation projects. The data mart provides 5 indicators (i.e. measures in datawarehouse terminology) and 3 dimensions, which represent different perspectivesof analysis: time, organization and project. The attribute budget in the projectdimension is not a level, but an informative attribute of a project. The descrip-tion of measures is given in Table 1. In particular note that together with atextual description, the mathematical formula to calculate the indicator is pro-vided for some indicators. When the formula does not exist, the indicator is saidatomic, and is independent on other indicators. Otherwise the indicator is saidcompound, and the operands occurring in its formula are called dependencies.Note that compound indicators can be defined in terms of other compound in-dicators, producing a tree of dependencies, although it cannot be fully graspedin an informal glossary like the one presented. Also, aggregation functions arespecified when applicable. When an aggregation function exists, it means thatit is applied to the result of the formula in order to aggregate over dimensions.According to the case study and for the sake of simplicity, hereafter it is assumedthat the same aggregation function applies to each dimension.
3 Semantic Multidimensional Model
The semantic multidimensional model is based on a first-order logic representa-tion of indicators’ formulas and their properties as well as of a multidimensionalstructure. Hence we first introduce the basic notions related to the multidimen-sional model.

Definition 1. (Cube schema) A cube schema S is a pair ⟨D, I⟩, where I is aset of indicators {ind1, . . . , indm} and D is the set of dimensions for I.
A dimension Di ∈ D is the hierarchy of levels LDi1 ⪯ ... ⪯ LDi
l along whichmeasures are aggregated. The partial order ⪯ is such that if LD
1 ⪯ LD2 then LD
1
rolls up to LD2 (and LD
2 drills down to LD1 ). The domain of a level LDi
j is a set of
members {mj1 , . . . ,mjn} and will be denoted by α(LDij ), e.g. α(Department) =
{RnD, RforI, ElectricDept, MechanicDept, ...}. Referring to the Organizationdimension of the case study, the following hierarchy holds: Person ⪯ Team ⪯Department. In general the definition allows also for multiple hierarchies.
Definition 2. (Cube element) A cube element ce for the cube schema S = ⟨D, I⟩is the tuple ⟨m1, . . . ,mn, v1, . . . , vm⟩ where each member belongs to a level of adimension in D (i.e., ∀mi ∃Lj
Di such that mi ∈ α(LjDi)), and {v1, . . . , vm} are
values for I.
In the following, we will not assume completeness of data cubes, i.e. cubes thatinclude a cube element for any possible combination of members.
Central to our model is the notion of indicator: while in the standard cubeschema definition (1) indicators are just labels, in the proposed model the struc-ture of an indicator is taken into account.
Definition 3. (Indicator) An indicator ind ∈ I is defined by the pair ⟨aggr, f⟩,where:
– aggr ∈ {SUM,MIN,MAX,AVG,VAR,COUNT,NONE, . . .} is an aggrega-tion function that represents how to group values of the indicator;
– f(ind1, . . . , indn) is the formula of the indicator, i.e. a mathematical expres-sion that describes the way ind is computed in terms of other indicators(ind1, . . . , indn) ∈ I.
The label NONE is used to denote the absence of aggregation function, e.g.IdeaY ield = ⟨NONE, IdeasAcceptedEng/IdeasProposed⟩. According to widelyaccepted models (e.g. [17]), aggregation is categorized in distributive, algebraicor holistic. Indicators with a distributive aggregator can be directly computedon the basis of values at the next lower level of granularity (e.g., SUM, MIN,MAX). Algebraic aggregator cannot be computed by means of values at nextlower level unless a set of other indicators are also provided, which transformthe algebraic indicator in a distributive one; a classical example is given by theaverage aggregator (AVG). Indicators described by holistic functions can neverbe computed using values at next lower level (e.g., MEDIAN and MODE).
A formula is said to be additive if it includes only summation and differencesof indicators, e.g. f(indx, indy) = indx + indy. Additivity is a relevant propertysince indicators with additive formulas and distributive aggregation functions(e.g., SUM) define a special subclass of indicators, for which holds that:aggr(f(ind1, . . . , indn)) = f(aggr(ind1), . . . , aggr(indn)). This is not true in thegeneral case, e.g. AV G(x/y) = AV G(x)/AV G(y).

Indicators and their properties are represented by first-order logic predicates.We refer to Horn Logic Programming, and specifically to Prolog, as the repre-sentation language. formula(ind, f) is a fact representing the formula related toan indicator. In the predicate ind is an indicator label, while f is an expressionincluding algebraic operators like sum, difference, product, power, and operandsare indicators’ labels. Additivity is expressed by the predicate isAdditive(ind).The set of formulas and its properties define a reference knowledge base forindicators specification. A further predicate hasInd(c, ind) allows to state thepresence of the indicator ind in the schema of the cube c. For what concernsthe multidimensional structure, similarly to [18], the predicate rollup(X,Y ) isintroduced to assert that a member X is mapped to the member Y of the nexthigher level to perform the roll-up operation.
Given the set of facts, rules are devised to implement reasoning functionali-ties. For instance the following rule implements the transitive closure of roll-up:
partOf(X,Y ) : − rollup(X,Y ).partOf(X,Y ) : − rollup(X,Z), partOf(Z, Y ).
While formulas are represented as facts, manipulation of mathematical ex-pressions is performed by specific predicates from PRESS (PRolog EquationSolving System), which is a formalization of algebra in Logic Programming forsolving equations. Such predicates implement axioms of a first-order mathemat-ical theory, and can manipulate an equation to achieve a specific syntactic effect(e.g., to reduce the number of occurrence of a given variable in an equation)through a set of rewriting rules. PRESS works in the domain of R-elementaryequations, that is on equations involving polynomials, and exponential, loga-rithmic, trigonometric, hyperbolic, inverse trigonometric and inverse hyperbolicfunctions over the real numbers, although all indicators found in the analysis ofreal-world scenarios until now have linear formulas. PRESS is demonstrated toalways find a solution for linear equations.
Due to lack of space, we cannot go into the details of the rule system. Wejust enlighten that the use of PRESS here allows to derive a new formula for anindicator that is not explicitly given. Among all possible inferred formulas, weare able to individuate the subset that can be actually calculated on the givendata cube by the predicate hasInd(c, ). In the following we will refer to thishigh-level reasoning functionality as F(ind, C). Referring to the cube DM of thecase study, the following formulas are derived by PRESS:
IdeasProposed = NumInternalIdeas+NumExternalIdeas;IdeasProposed = NumInternalIdeas+ CrowdInv
AvgCostsExtIdeas ;
IdeasProposed = IdeasAcceptedEngIdeaY ield .
F(IdeasProposed,DM) returns only the last two since, although the first oneis the definition of the indicator provided in the knowledge base, it cannot becalculated in this way on DM due to the lack of NumExternalIdeas.
The formal representation and manipulation of the structure of a formulaenables advanced functionalities like the definition of an extended drill-downoperator, described in the next Section.

4 Extended Drill-Down
The present Section discusses how to exploit reasoning capabilities over indi-cator’s formula by introducing a novel indicator drill-down operator. Like theusual drill-down, it increases the detail of a measure of the data cube, but in-stead of disaggregating along the levels of dimensions, it expands an indicatorinto its components. As the traditional drill-down is enabled by the notion ofdimension’s hierarchies, so the indicator drill-down arises from introducing theindicator’s structure in the model. Furthermore, by reasoning on the logic rep-resentation proposed, the operator is able to extract values even for indicatorsnot explicitly stored in the cube. We hasten to note that the rules defined tothis end must work jointly on the structure of an indicator and on the structureof its dimensions. This integration of the notion of indicator in the multidimen-sional model is what enables the definition of the extended drill-down as thecomposition of the classic drill-down and of the indicator drill-down defined asfollows.
Definition 4. (Indicator drill-down)Given a schema S=⟨D, {ind1, . . . , indi, . . . , indn}⟩ and an indicator indi with aformula findi = f(indi1 , . . . , indik), the indicator drill-down on indi is a functionthat maps a cube with schema S in a cube with schema S′ such that:
– S′ = ⟨D, I ′⟩, I ′ = (I \ {indi}) ∪ {indi1 , . . . , indik};– instances are cube elements ce = ⟨m1, . . . ,mh, v1, . . . , vi1 , . . . , vik , . . . , vn⟩,
such that vj is the value of the j−th indicator, mp is the member of Dimen-sion Dp and vi = f(vi1 , . . . , vik).
Operationally, this means to access the definition of indi, extract the dependen-cies from its formula, and extract values for dependencies in order to build thenew cube. This can be expressed as the rewriting of the multidimensional querygenerating the cube S.
Definition 5. (Multi-dimensional Query) A multi-dimensional query MDQ ona cube C with schema ⟨D, I⟩ is a tuple ⟨δ, {ind1, . . . , indm},W,K, σ⟩, where:
– δ is a boolean value introduced here to make explicit how the query is per-formed. If δ = false then indicator values are materialized in the cube,otherwise they are virtual, hence we assume they are calculated by aggrega-tion of values at the lowest levels of dimensional hierarchies;
– {ind1, . . . , indm} is the set of requested indicators;
– W is the set of levels {LD1 , ..., LDn} on which to aggregate, such that LDi ∈Di and {D1, . . . , Dn} ⊆ D;
– K is the collection of sets Kh = {mh1 , ...,mhk}, h := 1, ..., n, of members on
which to filter, such that each mhj belongs to α(LDh). Kh can be an emptyset. In this case all members of the corresponding level are considered;
– σ is an optional boolean condition on indicators’ values.

{ind1, . . . , indm} are the elements of the target list, W is the desired roll-uplevel (or group-by components) for each dimension, while K allows slice anddice (suitable selections of the cube portion). While K works on members, thefilter σ defines a condition on other elements of the DM: both descriptive at-tributes of dimensional schema (e.g. Budget>50K) and values of indicators (e.g.NumberInternalIdeas<NumberExternalIdeas).
The result of a MDQ is a subset of the original cube where cube elementsare ce = ⟨m1, . . . ,mn, v1, . . . , vm⟩, where ⟨m1, . . . ,mn⟩ ∈ K1 × . . . ×Kn and viis a value of the indicator indi. Given the notion of query, the drill-down canbe seen as a rewriting of the original query MDQ = ⟨δ, I,W,K, σ⟩ as MDQ′ =⟨δ, I ′,W,K, σ⟩. Rewriting an indicator as its direct dependencies produces acorrect query only if the data cube has been designed to store the set of indicators{indi1 , . . . , indik}. The rewriting rules allowing to correctly specify the indicatordrill-down are discussed in the following. They depend on the typology of formulaand aggregation function. For the sake of simplicity we consider multidimensionalqueries with only one indicator in the target list.
Indicator drill-down rule Let MDQ = ⟨δ, {ind},W,K, σ⟩ be a query over thecube C with schema ⟨D, I⟩, where ind = ⟨aggr, f(ind1, . . . , indk)⟩. The indicatordrill-down of MDQ is MDQ′ = ⟨δ, {ind1, . . . , indk},W,K, σ⟩ where ∀indi eitherindi ∈ I or one of the following equivalence rules applies.
Equivalence rules Let MDQ = ⟨false, {ind},W,K, σ⟩ be a query over thecube C with schema ⟨D, I⟩, where ind = ⟨aggr, f⟩
– if (aggr is distributive AND f is additive) OR (aggr = NONE):MDQ = ⟨false, g,W,K, σ⟩, g ∈ F(ind, C)
– else: MDQ = ⟨true, g,W,K, σ⟩, g ∈ F(ind, C)
The equivalence rules make use of the inference mechanism represented byF(ind, C), which defines any formula equivalent to f that can be inferred and iscomputed by indicators of the cube. The rule described in the else case capturesthe fact that for general aggregation functions the correct value of an indicatorat a given level can be only obtained by calculating the formula at the lowestlevel of granularity (given that δ = true), and then applying the aggregationon the resulting values. The first rule accounts for the commutativity propertystated in the previous section that allows to apply the formula directly on therequested aggregation levels. This rule can be easily extended to algebraic aggre-gators given the well-known relation with distributive aggregators. For instance,in the case of the AV G the query becomes MDQ = ⟨δ, { ind′
CountM },W,K, σ⟩,where ind′ = ⟨SUM, f⟩ and CountM is a special function which returns thenumber of members m0 of the lowest level such that partOf(m0,m),m ∈ K.
5 Evaluation
A prototype of the system has been implemented as a proof-of-concept. Thisis part of a system offering additional services developed within the BIVEE
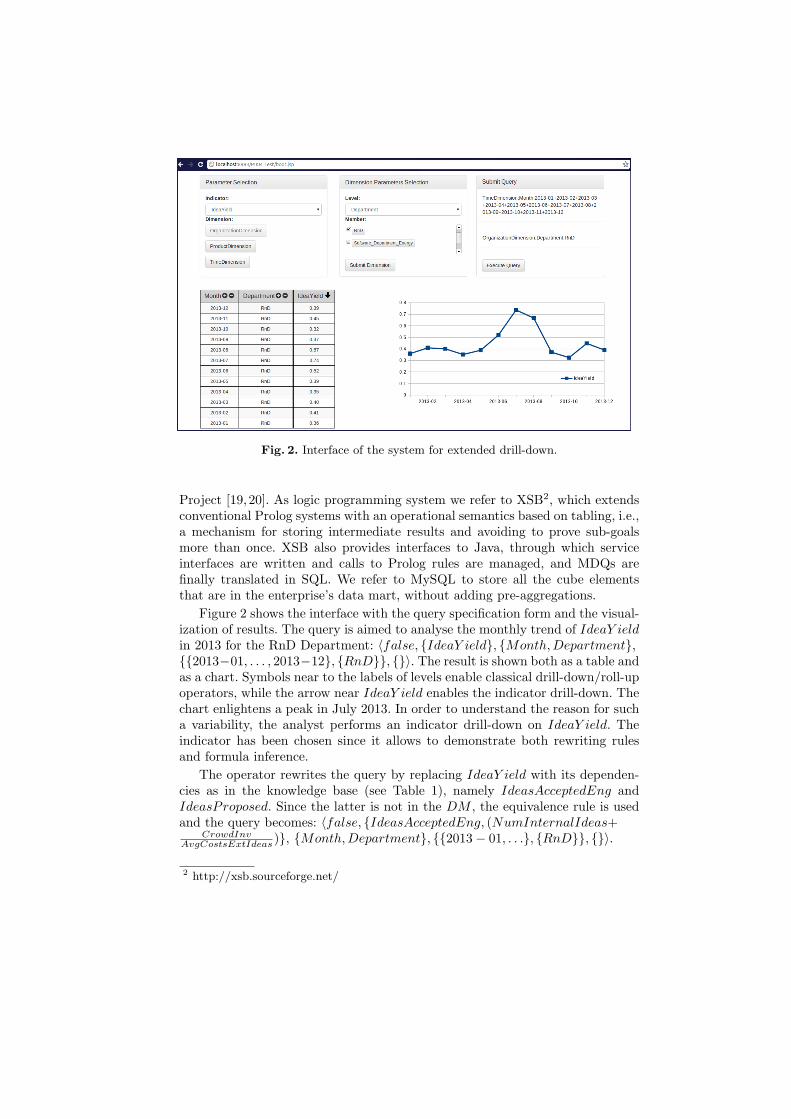
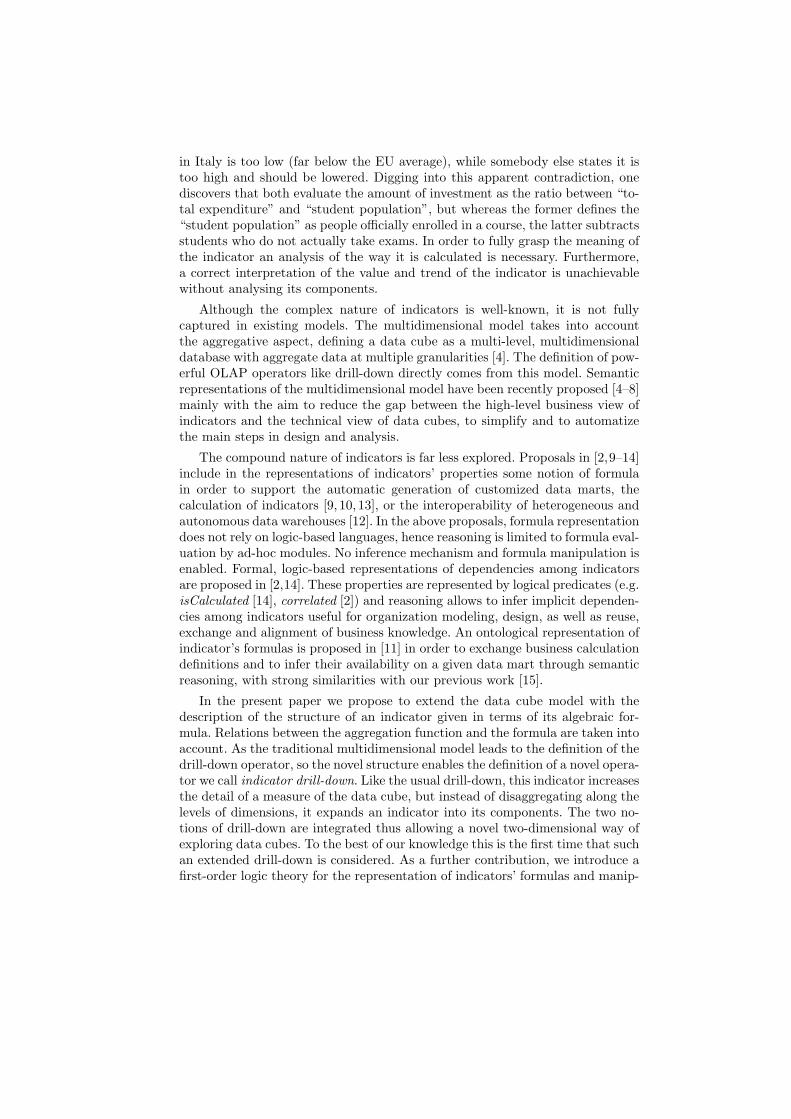
Fig. 2. Interface of the system for extended drill-down.
Project [19, 20]. As logic programming system we refer to XSB2, which extendsconventional Prolog systems with an operational semantics based on tabling, i.e.,a mechanism for storing intermediate results and avoiding to prove sub-goalsmore than once. XSB also provides interfaces to Java, through which serviceinterfaces are written and calls to Prolog rules are managed, and MDQs arefinally translated in SQL. We refer to MySQL to store all the cube elementsthat are in the enterprise’s data mart, without adding pre-aggregations.
Figure 2 shows the interface with the query specification form and the visual-ization of results. The query is aimed to analyse the monthly trend of IdeaY ieldin 2013 for the RnD Department: ⟨false, {IdeaY ield}, {Month,Department},{{2013−01, . . . , 2013−12}, {RnD}}, {}⟩. The result is shown both as a table andas a chart. Symbols near to the labels of levels enable classical drill-down/roll-upoperators, while the arrow near IdeaY ield enables the indicator drill-down. Thechart enlightens a peak in July 2013. In order to understand the reason for sucha variability, the analyst performs an indicator drill-down on IdeaY ield. Theindicator has been chosen since it allows to demonstrate both rewriting rulesand formula inference.
The operator rewrites the query by replacing IdeaY ield with its dependen-cies as in the knowledge base (see Table 1), namely IdeasAcceptedEng andIdeasProposed. Since the latter is not in the DM , the equivalence rule is usedand the query becomes: ⟨false, {IdeasAcceptedEng, (NumInternalIdeas+
CrowdInvAvgCostsExtIdeas )}, {Month,Department}, {{2013− 01, . . .}, {RnD}}, {}⟩.
2 http://xsb.sourceforge.net/
Fig. 3. The result of IdeaY ield drill-down.
The result is shown in Figure 3. The cause of the trend of IdeaY ield is nowclear: it is due to the decreasing trend of IdeasProposed, while IdeasAcceptedEngis almost constant. The analyst can iteratively perform classical OLAP opera-tors and indicator drill-down to refine the result. It is to be noted that, sinceIdeasAcceptedEng is atomic, it is not possible to perform a further indicatordrill-down on it; hence the arrow icon is not shown.
In order to evaluate the cost of the novel operator, we observe that the mainsteps required to perform an indicator drill-down on ind are: (1a) searching theformula of ind in the knowledge base, or (1b) inferring any valid formula forind (i.e. F(ind, C)) and (2) executing the query over the data mart, until arewriting succeeds in data retrieval. Steps (1a) and (1b) concern the rewriting ofthe query, and their costs depend on the number of indicators in the knowledgebase, and on the structure of their formulas. The cost of step (2) depends onthe cardinality of data, their schema and the adopted management system. It isnoteworthy that these parameters do not affect the cost of other steps. Here, wediscuss the costs due to query rewriting, which is the cost added by the proposedoperator to the classical execution of a query.
Since step (1a) has negligible cost compared to (1b), the complexity of thequery rewriting is comparable to that of inferring F(ind, C) that, in the worstcase, corresponds to all possible rewritings of the original formula by traversingall the dependencies’ paths. In order to provide an evaluation of these costs wegive the average execution time of F(ind, C) over each ind in the knowledgebase, for a real and a synthetic scenario3.
In the real-world scenario, the knowledge base representing the business do-mains of the BIVEE project is characterized by 356 indicators. The dependencytree has on average 2.67 operands per indicator, height 5 for the root node(i.e. the number of layers of indicators in the tree) and average height 3.14. Inthis situation, the average execution time of F(ind, C) is 219ms. We recall that100ms is about the limit for making the user feel that the system is reactinginstantaneously.
3 Experiments have been carried on an Intel Xeon CPU 3.60GHz with 3.50GB memory,running Windows Server 2003 SP 2.
A synthetic knowledge base has been generated to perform more extensivetests. In particular, we have generated 10 different random trees with height 5,where each indicator is calculated on the basis of 4 random indicators of thelower layer; the number of operands in the formula is fixed. This kind of tree has1365 different indicators. The average execution time of F(ind, C) mediated overthe 10 trees is 431ms, with 449ms as maximum value. We believe these executiontimes are perfectly in line with the notion of On Line Analytical Processing, alsoin the view of possible optimizations of the system.
6 Conclusions
The paper proposed an extension of the data cube model to take into accountthe structure of an indicator given in terms of a formula. The extension allowsto introduce a novel drill-down operator able to increase the detail of a measureof the data cube along the tree of indicators dependencies. Relations betweenthe aggregation function and the formula are taken into consideration, so thatthe novel and the classic drill-down can be integrated. The logic representationadopted is a powerful way to reason over the tree of indicators’ dependencies tocalculate measures not explicitly provided in a data mart through formula rewrit-ing. This approach can extend existing DB management systems, as queries canbe rewritten either in SQL and executed on relational database, like the proto-type shown, or in MDX queries on traditional OLAP systems. The evaluation ofa prototype on real and synthetic scenarios enlightens the effectiveness and effi-ciency of the approach. For the sake of simplicity, the presentation assumed thatthe data mart schema adopts the knowledge base terminology to define mea-sures, but the model can be simply extended with mapping predicates to relaxthis assumption. Although only indicators with the analytic expressions man-aged by PRESS can be represented, this does not limit the model applicabilitysince other kinds of indicators (e.g. qualitative indicators) can be introducedas atomic. We plan to study extensions of the theory towards more complexexpressions manipulation. Other extensions regard the representation of rela-tional algebra expressions as indicator’s formulas, and of different aggregationfunctions for different indicator’s dimensions.
Acknowledgments
This work has been partly funded by the European Commission through theFoF-ICT Project BIVEE (No. 285746). The authors wish to thank project part-ners for providing data useful for the case study, and Haotian Zhang for theimplementation of the interface.
References
1. Kaplan, R.S., Norton, D.P.: The Balanced Scorecard: Measures that Drive Perfor-mance. Harvard Business Review 70 (1992) 71–79
2. Popova, V., Sharpanskykh, A.: Modeling organizational performance indicators.Information Systems 35 (2010) 505 – 527
3. Ackoff, R.L.: Management misinformation systems. Management Science 14 (1967)4. Lakshmanan, L.V.S., Pei, J., Zhao, Y.: Efficacious data cube exploration by se-
mantic summarization and compression. In: VLDB. (2003) 1125–11285. Neumayr, B., Anderlik, S., Schrefl, M.: Towards Ontology-based OLAP: Datalog-
based Reasoning over Multidimensional Ontologies. In: Proc. of the FifteenthInternational Workshop on Data Warehousing and OLAP. (2012) 41–48
6. Niemi, T., Toivonen, S., Niinimaki, M., Nummenmaa, J.: Ontologies with semanticweb/grid in data integration for olap. Int. J. Sem. Web Inf. Syst. 3 (2007) 25–49
7. Huang, S.M., Chou, T.H., Seng, J.L.: Data warehouse enhancement: A semanticcube model approach. Information Sciences 177 (2007) 2238–2254
8. Priebe, T., and Pernul, G.: Ontology-Based Integration of OLAP and InformationRetrieval. In: Proc. of DEXA Workshops. (2003) 610–614
9. Pedrinaci, C., Domingue, J.: Ontology-based metrics computation for businessprocess analysis. In: Proc. of the 4th International Workshop on Semantic BusinessProcess Management. (2009) 43–50
10. Xie, G., Yang, Y., Liu, S., Qiu, Z., Pan, Y., Zhou, X.: EIAW: Towards a Business-Friendly Data Warehouse Using Semantic Web Technologies. In: The SemanticWeb. Volume 4825 of Lecture Notes in Computer Science. Springer Berlin Heidel-berg (2007) 857–870
11. Kehlenbeck, M., Breitner, M.H.: Ontology-based exchange and immediate applica-tion of business calculation definitions for online analytical processing. In: Proc. ofthe 11th International Conference on Data Warehousing and Knowledge Discovery.DaWaK ’09, Berlin, Heidelberg, Springer-Verlag (2009) 298–311
12. Golfarelli, M., Mandreoli, F., Penzo, W., Rizzi, S., Turricchia, E.: OLAP QueryReformulation in Peer-to-peer Data Warehousing. Inf. Sys. 37 (2012) 393–411
13. Horkoff, J., Barone, D., Jiang, L., Yu, E., Amyot, D., Borgida, A., Mylopoulos, J.:Strategic business modeling: representation and reasoning. Software & SystemsModeling (2012)
14. Del-Rıo-Ortega, A., Resinas, M., Ruiz-Cortes, A.: Defining process performanceindicators: An ontological approach. In: On the Move to Meaningful InternetSystems. Volume 6426 of Lecture Notes in Computer Science. (2010) 555–572
15. Diamantini, C., Potena, D.: Semantic enrichment of strategic datacubes. In:Proc. of the ACM 11th International Workshop on Data Warehousing and OLAP.DOLAP ’08 (2008) 81–88
16. Chesbrough, H.: Open Innovation: The New Imperative for Creating and Profitingfrom Technology. Harvard Business Press, Boston (2003)
17. Gray, J., Chaudhuri, S., Bosworth, A., Layman, A., Reichart, D., Venkatrao, M.,Pellow, F., Pirahesh, H.: Data cube: A relational aggregation operator generalizinggroup-by, cross-tab, and sub-totals. Data Min. Knowl. Discov. 1 (1997) 29–53
18. Neumayr, B., Schrefl, M.: Multi-level conceptual modeling and owl. In: Proc.of the ER 2009 Workshops on Advances in Conceptual Modeling - ChallengingPerspectives, Berlin, Heidelberg, Springer-Verlag (2009) 189–199
19. Diamantini, C., Potena, D., Storti, E.: A logic-based formalization of kpis forvirtual enterprises. In: Advanced Information Systems Engineering Workshops.Volume 148 of Lecture Notes in Business Information Processing. (2013) 274–285
20. Diamantini, C., Potena, D., Proietti, M., Smith, F., Storti, E., Taglino, F.: Asemantic framework for knowledge management in virtual innovation factories.International Journal of Information System Modeling and Design 4 (2013) 70–92