
Analysis of the Feed & Bleed procedure for the Ascó NPP
8
Nuclear Engineering and Design 237 (2007) 2006–2013 Analysis of the Feed & Bleed procedure for the Asc ´ o NPP First approach study for operation support F. Revent´ os a,b,∗ , L. Batet b , C. Pretel a,b , M. R´ ıos b , I. Sol c a Institute of Energy Technologies, Technical University of Catalonia (UPC), Av. Diagonal 647, Barcelona 08028, Spain b Department of Physics and Nuclear Engineering, Technical University of Catalonia (UPC), Spain c Asociaci´ on Nuclear Asc ´ o-Vandell` os (ANAV), Spain Received 2 November 2006; received in revised form 5 February 2007; accepted 6 February 2007 Abstract The Asociaci´ on Nuclear Asc´ o-Vandell` os (ANAV) is the consortium responsible for the Asc´ o and Vandell` os-II reactors. The reactors are Westinghouse-design 3-loop PWRs with an approximate electrical power of 1000 MW. In order to operate the reactors ANAV prepared an Integral Plant Model for each plant. The model is used for supporting plant operation and control from the point of view of safety and competitiveness. The Technical University of Catalonia (UPC) has been working with ANAV in order to establish, qualify and use these Best Estimate (BE) models. This paper develops a specific use of the Asc´ o plant model for operation support and tries to clarify a group of scenarios related to the total loss of feed water (FW) and the corresponding Feed & Bleed (F&B) recovery procedure. The study characterizes the procedure with different calculations and provides results that have become helpful in establishing the impact of partial availability of Power Operated Relief Valves (PORVs) and HPIS trains, the maximum time for starting the procedure and some considerations on heat sink recovery. The use of the BE model provides a consistent overview of the final problem. The results of the analysis are a first approach for operation support. © 2007 Elsevier B.V. All rights reserved. 1. Introduction The Asc ´ o reactors have been in operation since their start up in 1983 (unit 1) and 1985 (unit 2). Both of them are Westinghouse- design 3-loop PWRs with an approximate electrical power of 1000 MW. In order to operate the reactors Asociaci´ on Nuclear Asc´ o-Vandell` os (ANAV) prepared an Integral Plant Model for each plant using Relap5Mmod3.2. The Asc ´ o reactors are almost identical and, apart from some minor differences, the basic Asc´ o nodalization represents both units. The fact that both units have Abbreviations: ANAV, Asociaci´ on Nuclear Asc´ o-Vandell` os; UPC, Tech- nical University of Catalonia; EOP, Emergency Operating Procedures; CSNI, Committee on the Safety of Nuclear Installations; IAEA, International Atomic Energy Agency; BE, Best Estimate; PSA, Probabilistic Safety Assessment; PORV, Power Operated Relief Valves; LOFT, loss-of-fluid test; FW, feed water; NPP, nuclear power plant; PWR, pressurized water reactor; HPIS, high pres- sure injection system; F&B, Feed & Bleed; AFW, Auxiliary Feed Water; RCP, reactor coolant pump; RVLIS, Reactor Vessel Level Instrumentation System ∗ Corresponding author at: Department of Physics and Nuclear Engineering, Technical University of Catalonia (UPC), Spain. Tel.: +34 934017143; fax: +34 934017149. E-mail address: [email protected] (F. Revent´ os). undergone important improvements and design modifications has meant that the nodalization has been continuously updated and re-qualified following a specific procedure (Revent´ os et al., 1990, 2007). The UPC–ANAV coordinated team currently uses the Asc´ o and Vandell` os-II plant models following the objectives established by ANAV technical management. The current appli- cations of the models are devoted to supporting plant operation, while producing results that are helpful for safety, engineering and training (Revent´ os and Llopis, 2000; Revent´ os et al., 2001). This particular study examines the group of safety scenar- ios known as “total loss of feed water”. Different authors have investigated them in the past with different objectives. The anal- ysis described in Pochard et al. (2002) is a complete one. It starts from a deep knowledge of the dynamic behaviour of the French 900 MWe NPP, it uses sensitivity calculations focused on full bleed option in order to establish an optimum alternative and it also gives some information on uncertainty. The study described in Gencheva et al. (2005) investigates the suitability of depressurising the primary circuit before the Feed & Bleed (F&B) procedure. It comes to the conclusion that the procedure can be used successfully and leaves uncertainty evaluation for future development. 0029-5493/$ – see front matter © 2007 Elsevier B.V. All rights reserved. doi:10.1016/j.nucengdes.2007.02.006
-
Upload
independent -
Category
Documents
-
view
2 -
download
0
Transcript of Analysis of the Feed & Bleed procedure for the Ascó NPP

A
WPTTfato©
1
1d1Aein
nCEPNsRS
Tf
0d
Nuclear Engineering and Design 237 (2007) 2006–2013
Analysis of the Feed & Bleed procedure for the Asco NPPFirst approach study for operation support
F. Reventos a,b,∗, L. Batet b, C. Pretel a,b, M. Rıos b, I. Sol c
a Institute of Energy Technologies, Technical University of Catalonia (UPC), Av. Diagonal 647, Barcelona 08028, Spainb Department of Physics and Nuclear Engineering, Technical University of Catalonia (UPC), Spain
c Asociacion Nuclear Asco-Vandellos (ANAV), Spain
Received 2 November 2006; received in revised form 5 February 2007; accepted 6 February 2007
bstract
The Asociacion Nuclear Asco-Vandellos (ANAV) is the consortium responsible for the Asco and Vandellos-II reactors. The reactors areestinghouse-design 3-loop PWRs with an approximate electrical power of 1000 MW. In order to operate the reactors ANAV prepared an Integral
lant Model for each plant. The model is used for supporting plant operation and control from the point of view of safety and competitiveness. The
echnical University of Catalonia (UPC) has been working with ANAV in order to establish, qualify and use these Best Estimate (BE) models.his paper develops a specific use of the Asco plant model for operation support and tries to clarify a group of scenarios related to the total loss ofeed water (FW) and the corresponding Feed & Bleed (F&B) recovery procedure. The study characterizes the procedure with different calculationsnd provides results that have become helpful in establishing the impact of partial availability of Power Operated Relief Valves (PORVs) and HPISrains, the maximum time for starting the procedure and some considerations on heat sink recovery. The use of the BE model provides a consistent
roac
uha1
Ae
verview of the final problem. The results of the analysis are a first app2007 Elsevier B.V. All rights reserved.
. Introduction
The Asco reactors have been in operation since their start up in983 (unit 1) and 1985 (unit 2). Both of them are Westinghouse-esign 3-loop PWRs with an approximate electrical power of000 MW. In order to operate the reactors Asociacion Nuclearsco-Vandellos (ANAV) prepared an Integral Plant Model for
ach plant using Relap5Mmod3.2. The Asco reactors are almostdentical and, apart from some minor differences, the basic Ascoodalization represents both units. The fact that both units have
Abbreviations: ANAV, Asociacion Nuclear Asco-Vandellos; UPC, Tech-ical University of Catalonia; EOP, Emergency Operating Procedures; CSNI,ommittee on the Safety of Nuclear Installations; IAEA, International Atomicnergy Agency; BE, Best Estimate; PSA, Probabilistic Safety Assessment;ORV, Power Operated Relief Valves; LOFT, loss-of-fluid test; FW, feed water;PP, nuclear power plant; PWR, pressurized water reactor; HPIS, high pres-
ure injection system; F&B, Feed & Bleed; AFW, Auxiliary Feed Water;CP, reactor coolant pump; RVLIS, Reactor Vessel Level Instrumentationystem∗ Corresponding author at: Department of Physics and Nuclear Engineering,echnical University of Catalonia (UPC), Spain. Tel.: +34 934017143;ax: +34 934017149.
E-mail address: [email protected] (F. Reventos).
cwa
iiysFoado(cf
029-5493/$ – see front matter © 2007 Elsevier B.V. All rights reserved.oi:10.1016/j.nucengdes.2007.02.006
h for operation support.
ndergone important improvements and design modificationsas meant that the nodalization has been continuously updatednd re-qualified following a specific procedure (Reventos et al.,990, 2007).
The UPC–ANAV coordinated team currently uses thesco and Vandellos-II plant models following the objectives
stablished by ANAV technical management. The current appli-ations of the models are devoted to supporting plant operation,hile producing results that are helpful for safety, engineering
nd training (Reventos and Llopis, 2000; Reventos et al., 2001).This particular study examines the group of safety scenar-
os known as “total loss of feed water”. Different authors havenvestigated them in the past with different objectives. The anal-sis described in Pochard et al. (2002) is a complete one. Ittarts from a deep knowledge of the dynamic behaviour of therench 900 MWe NPP, it uses sensitivity calculations focusedn full bleed option in order to establish an optimum alternativend it also gives some information on uncertainty. The studyescribed in Gencheva et al. (2005) investigates the suitability
f depressurising the primary circuit before the Feed & BleedF&B) procedure. It comes to the conclusion that the procedurean be used successfully and leaves uncertainty evaluation foruture development.
ring a
sdoatwucp
lPAfbiOscdaRPtpn
mlpstNc
2p
c
••
psuptts
isAa
qt1tot
(icbbdt
3
aUdd
t
•
•
•
Af
(
(
ticpdbt6o
F. Reventos et al. / Nuclear Enginee
In the Asco NPP case the analysis aims to be a first approachtudy for operation support. For this purpose it has to be up-to-ate, realistic and helpful for the operation team. Although theperation responsible knows the results of design and licensingnalysis, these are not directly useful for him. The operationeam has to deal with Emergency Operating Procedures (EOP),ith symptoms and with control room displays. Calculationssing conservatisms are suitable for general aims but their resultsan mix the operation responsible who normally needs realisticredictions of emergency scenarios.
The Asco current information related to the scenario “totaloss of feed water” is either part of Emergency Operatingrocedure application exercises or part of Probabilistic Safetyssessment (PSA) related thermal–hydraulic calculations. The
ormer is realistic, but not updated; the latter has been updatedut is not 100% Best Estimate (BE). The following example isntended to clarify the last statement. Mass flow through Powerperated Relief Valves (PORV) has conservatively been con-
idered in PSA related thermal–hydraulic calculations. Thesealculations were adjusted taking the mass flow value as it wasocumented in the original specification (ANAV, 2003), whilemore realistic value is known through the vendor data sheet.elap5 nodalization is adjusted to this more realistic option. SoSA is updated for its own aims but it is not helpful for opera-
ors to get the right picture of the expected behaviour when thisarticular valve is going to be used. A certain harmonisation iseeded.
In order to harmonise and improve the use of available infor-ation, the present study has been done by performing quite a
arge set of calculations by means of the integral model of thelant prepared using Relap5/mod3.2. The harmonisation taskstart by characterizing the procedure with a basic calculationhat establishes what the key parameters of the scenario are.ext two sections illustrate the procedure and present base case
alculation results in order to allow the strategy definition.
. Total loss of feed water (FW) and Feed & Bleedrocedure
A total loss of feed water will occur due to one of two differentauses:
main feed water turbo-pump trip;malfunction of main feed water valves;
rovided that the failure of the Auxiliary Feed Water (AFW)ystem simultaneously takes place and brings the plant to a sit-ation where no water is supplied to the steam generators. Thelant stops being properly cooled. In a very short period of timehe turbine and the reactor trip either directly due to turbo-pumprip or indirectly due to a low narrow-range level in one of theteam generators.
Once the reactor has been tripped, the operators start follow-
ng the EOP “Reactor trip and/or Safety Injection”. The firstteps of this EOP are devoted to verifying the function of theFW and to try to ensure recovery. In the case of Asco NPP,s the EOPs are symptom oriented, the number of such steps is
JqPa
nd Design 237 (2007) 2006–2013 2007
uite large. It is estimated that the minimum time for transfero the specific EOP “loss of heat sink” to take place is about0 min. For all this period of time the level of the steam genera-ors will uniformly decrease. Once the wide-range level of twout of three steam generators becomes less than 6%, it is timeo start the procedure.
The following steps are quite rapid: the reactor coolant pumpsRCP) are tripped, two out of two PORVs are opened and HPISs activated. After this point, the most important concern of theontrol room is to supervise the main parameters of the plant,asically primary pressure and core outlet temperature estimatedy thermocouples. After a period of time, the plant will be cooledown and the final steps of the procedure aim to properly stophe HPIS and to close PORV once the plant has been recovered.
. Base case calculation and strategy
The scenario is simulated using the NPP model (Pretel etl., 2000; UPC, 2000). The model described and validated byPC–ANAV (Reventos et al., 2007) has been widely used inifferent kinds of analysis. Fig. 1 shows the main nodalizationiagram of the Asco plant.
The selected base case has the following features and assump-ions:
the failure of one out of two HPIS trains and the availabilityof only one single PORV;the time to start the procedure was set to the minimum rea-sonable time of 600 s;no recovery actions were assumed.
The loss of FW takes place at time 50 s. Non-availability ofFW and the steam-dump are the malfunctions imposed, apart
rom the mentioned component failure.Manual actions are the following:
1) at time 350 s reactor coolant pumps are stopped and theircoast-down is initiated;
2) 600 s after the wide-range level of two out of three steamgenerators reaches 6%, PORV is opened and HPIS is actu-ated.
Once the total loss of FW takes place, the heat transfer fromhe primary to the secondary side degrades. This degradations not complete because in a first period there is still forcedonvection (pumps are working until 350 s) and in a seconderiod there is circulation induced by the safety injection. Theegradation process can be only followed from the control roomy means of steam generator level surveillance. Fig. 2 shows howhe wide-range levels of three steam generators reach less than% at about 1800 s. At this time the procedure starts by openingne PORV and actuating one HPIS train.
Fig. 3 shows the primary pressure over the whole transient.
ust after the reactor trip, it shows a slight decrease. Subse-uently, it increases until it reaches the opening set-point of theORV. At about 2400 s manual opening of the PORV producessharp decrease down to 100 bar. From this point on, the pro-
2008 F. Reventos et al. / Nuclear Engineering and Design 237 (2007) 2006–2013
n dia
ct
Wprm
t
tt
pthave been properly captured.
Fig. 1. Main nodalizatio
edure results in a slow pressure decrease until the end of theransient.
Primary relief and injection mass flows are shown in Fig. 4.ater injection that comes into the primary system at low tem-
erature is heated by decay power and comes out through theelief valve. The procedure results in a pressure decrease, which
eans that energy produced is completely extracted.Finally, Fig. 5 demonstrates that the base case brings the planto a safe situation without violating design limits. Hot rod clad
Fig. 2. Steam generator wide-range level (base case).
mT
gram of the Asco plant.
emperature shows a general decreasing trend during the wholeransient.
These last four figures have shown the essential phenomenaredicted for the base case and the comments have revealedhat the main relevant thermal–hydraulic features of the scenario
Once the base case has been successfully simulated and theost relevant features have been identified, a strategy is defined.hree questions need to be answered:
Fig. 3. Primary pressure (base case).

F. Reventos et al. / Nuclear Engineering and Design 237 (2007) 2006–2013 2009
•
•
•
tahlcaftt
tt
a
••••
Table 1Chronology of transients analysed in Section 4
Time (s)
Block 3000 s Block 5100 s
Main FW Turbo-pump stop 50 50Turbine and reactor stop 50 50Manual action: RCP stop 350 350Two out of three steam generator
wide-range level reach 6%1782 1782
Manual action: PORV is opened 4782 6882MT
owates
s
4t
ofiotdat
fmtc
Fig. 4. Primary relief and injection mass flow (base case).
impact of PORV and HPIS partial availability (what is theexpected phenomenology and the general timing in differentavailability combinations);maximum time to start (in the base case, the operators startthe procedure 600 s after the level symptom occurs);relevant heat sink recovery phenomena (although recoveryaction are quite fast they involve different components andneed some time).
If the answer to the questions above is obtained, the opera-ion responsible will have better general picture of the scenariond the phenomena related to it. It is clear that each answeras an impact on the others. Hence, the strategy applied is toaunch quite a large number of combined scenarios in order toover the different situations that could potentially occur. Forgiven combination of component availability, a series of dif-
erent procedure starting times have been tried and for each ofhese calculations heat sink recovery is also imposed at differentimes.
Some basic features and boundary conditions such as RCPrip and the rationale of level surveillance will be the same in allhe analysed transients.
In the Asco NPP case, the availability of components gener-tes four essential scenarios:
two PORVs and two HPIS available;one PORV and two HPIS available;two PORVs and one HPIS available;one PORV and one HPIS available.
Fig. 5. Hot rod clad temperature (base case).
sds
anual action: HPIS is actuated 4782 6882ransient end 12000 12000
For each of the above-mentioned cases an average amountf five cases were launched until the maximum time availableas identified. In a similar way for each of the latter cases an
verage of three new calculations were performed according tohe time of heat sink recovery. Heat sink recovery, as it will bexplained, consists in re-starting AFW and following the EOPteps until PORV can be closed and HPIS stopped.
The total number of cases was 61. The following sectionshow the most relevant results of the study.
. Impact of the partial availability of PORVs and HPISrains
In order to simplify the explanation included in this section,nly two blocks of calculations are presented (Table 1). Therst, which starts the procedure 3000 s after the wide-range levelf two out of three steam generators reached 6% (4782 s fromhe beginning of the simulation), will be analysed in greateretail and a second, more critical calculation, starting 5100 sfter the level symptom occurs (6882 s from the beginning ofhe simulation), will be summarized using relevant data.
In the first block, when the procedure starts at 4782 s, the voidraction in the upper part of the core is about 0.20. The total HPISass flow injection its clearly higher in the transients having two
rains available (Fig. 6), while the total relief mass flow is alsolearly higher in those having two valves available (Fig. 7).
As can be seen in Fig. 8, the vessel level decreases due toteam production in a first phase and, later on, recovers at aifferent rate according to the amount of injected liquid. Theame rationale is valid in the case of the pressurizer.
Fig. 6. Total HPIS mass flow (first block of availability cases).

2010 F. Reventos et al. / Nuclear Engineering and Design 237 (2007) 2006–2013
Fig. 7. Total relief mass flow (first block of availability cases).
a
raptithio
p6i
sAd
petabtbsoiiitSpc
5p
l
Fig. 8. Vessel level (first block of availability cases).
Primary pressure is shown in Fig. 9. The cases with twovailable valves depressurize more rapidly.
Fig. 10 is the last related to this block and shows the hotod clad temperature for all cases. In all of them design limitsre kept; nevertheless, it is important to report an interestinghenomenon taking place in transient 2V 1T. In this transienthe depressurization rate is high (two valves) and water supplys low (one train). The high depressurization instantly affects allhe primary circuit, produces a lower saturation temperature andelps steam generation in the core. This can also be observedn the vessel level (Fig. 8) and will be a useful result from theperation standpoint.
For the second block of availability cases, only one figure isresented (Fig. 11). In this block, when the procedure starts at882 s (or 5100 s after level symptom occurs), the void fractionn the upper part of the core is about 0.99. The presented figure
Fig. 9. Primary pressure (first block of availability cases).
osPt
Fig. 10. Hot rod clad temperature (first block of availability cases).
hows the hot rod clad temperature for all the analysed cases.s can be seen, the temperature reaches a value quite close toesign limits.
Two findings have been identified in this section. The stress isut on the word “identified” as this is the purpose of a study ori-nted as a first approach to operation support. The first, relatedo the connection between operation and PSA, is that with thevailability of one PORV and one HPIS train the plant cane recovered. Although this statement is made based on mul-iple calculations sweeping over different ranges of operationoundary conditions, it is still pending on some further analy-is (basically uncertainty evaluation). The second is related toperation and does not seem critical at all, as it only resultsn a small peak of temperature quite far from design limits. Its a helpful result because it explains to the operator a non-ntuitive situation. Following the comments on Figs. 8 and 10,he former shows how the Reactor Vessel Level Instrumentationystem (RVLIS), which is implemented in Asco NPP, can sup-ly a lower level value in a situation with higher availability ofomponents.
. Establishing the maximum time for starting therocedure
Although four blocks of calculations were launched for estab-ishing the maximum time to start the procedure, only one block
f four calculations will be presented. Once again and for theame reason as in the previous section, an availability of oneORV and one HPIS train is assumed. The first calculation ofhe block is the base case and the others use the same boundary
Fig. 11. Hot rod clad temperature (second block of availability cases).

F. Reventos et al. / Nuclear Engineering and Design 237 (2007) 2006–2013 2011
Table 2Chronology of transients analysed in Section 5
Time (s)
Block 600 s Block 3000 s Block 5100 s Block 5700 s
Main FW Turbo-pump stop 50 50 50 50Turbine and reactor stop 50 50 50 50Manual action: RCP stop 350 350 350 350Two out of three steam generator
wide-range level reach 6%1782 1782 1782 1782
Manual action: PORV is opened 2382 4782 6882 7482Manual action: HPIS is actuated 2382 4782 6882 7482Clad maximum temperature is
reached (clad maximumtemperature, K)
48 (622) 4220 (628) 7240 (1460) 7610 (1652)
Transient end 13000 13000 13000 13000
ce
t
saoTtftv
Iss
drrt
Fig. 12. Total HPIS mass flow (starting time analysis).
onditions except for the starting time of the procedure. Table 2xplains the chronology of the four transients.
The total HPIS mass flow injection for all the transients ofhe block is shown in Fig. 12.
The total relief mass flow, for all transients of the block, can beeen in Fig. 13 and some remarks need to be made. Relief valvesre automatic and are regulated by their design set-point until theperators set them to manual operation and the procedure starts.his assumption has been agreed by both PSA coordinator and
he person responsible for operation and is internally called “the
ull BE philosophy”. The result of the assumption is that, inhe period of time prior to the late start of the procedure, thealves may automatically open if pressure reaches the set-point.Fig. 13. Total relief mass flow (starting time analysis).
t
F
Fig. 14. Vessel level (starting time analysis).
n fact, this happens in all the four cases presented. Fig. 13 iself-explanatory, as it also shows the time when the valves areet to manual operation.
Fig. 14 shows the vessel level decreasing due to steam pro-uction in a first phase and subsequent recovery at a differentate according to the amount of injected liquid. The level cor-esponding to top of the core is shown in the figure. A dry-outakes place in two of the four transients. The impact on clademperature is discussed in Fig. 16.
Primary pressure is shown in Fig. 15, which combined withig. 13 helps to understand automatic and manual opening.
Fig. 15. Primary pressure (starting time analysis).

2012 F. Reventos et al. / Nuclear Engineering and Design 237 (2007) 2006–2013
Itdlc
pntfd
6
dt
TC
MTMT
M
M
AO
M
M
C
T
fsglstt
bw
(wt
Fig. 16. Hot rod clad temperature (starting time analysis).
Fig. 16 shows the hot rod clad temperature for all the cases.n two out of four cases design limits are kept and the maximumemperature remains below 1477 K (2200 ◦F). In the case of aelay of 5700 s the clad temperature goes slightly beyond theimit and plant recovery is not successful. In between, there is aase that needs further analysis.
The result of this section is the maximum time for starting therocedure. Again it is the result of a first approach calculationeeded of confirmation after evaluating the associated uncer-ainty. The different sets of calculations have also been usefulor clarification of the general expected phenomenology of theifferent blocks of transients.
. Heat sink recovery
This section shows one calculation simulating the proce-ure actions after recovering the AFW system and compareshe results with the equivalent one without recovery actions. In
able 3hronology of transients analysed in Section 6
Block 2400 s
Without recovering With recovering
ain FW Turbo-pump stop 50 50urbine and reactor stop 50 50anual action: RCP stop 350 350
wo out of three steamgenerator wide-range levelreach 6%
1782 1782
anual action: PORV isopened
4182 4182
anual action: HPIS isactuated
4182 4182
FW is actuated – 4500ne out of three SGwide-range level reaches11%
– 7181
anual action: PORV isclosed
– 7500
anual action: HPIS isclosed
– 8200
lad maximum temperatureis reached (clad maximumtemperature, K)
6990 (801) 4220 (628)
ransient end 15000 15000
tv
(h
aopbhi
Fig. 17. Vessel level (heat sink recovery analysis).
act, more than 20 calculations belong to this group and althoughome differences appear among them all, it is considered that theeneral rationale of the recovery actions can be clarified by fol-owing the selected scenario. Actually, the objective of this finalet of calculations is to establish the relationship between opera-or actions and the trends of the main parameters followed fromhe control room.
The selected case has the same boundary conditions as thease case except for the delay of starting the procedure, whichill be 2400 s in these calculations (Table 3).This case is visibly not far from one of those of Section 5
3000 s). Both of them show a short partial core uncover thatill be interesting to study using the information available from
he control room.Fig. 17 fulfils the main goal of this section because it shows
he correlation between manual recovery actions (Table 3) andessel level time advancement.
Other data available to the control room is hot leg temperatureFig. 18), which shows the smooth cool-down produced aftereat sink recovery.
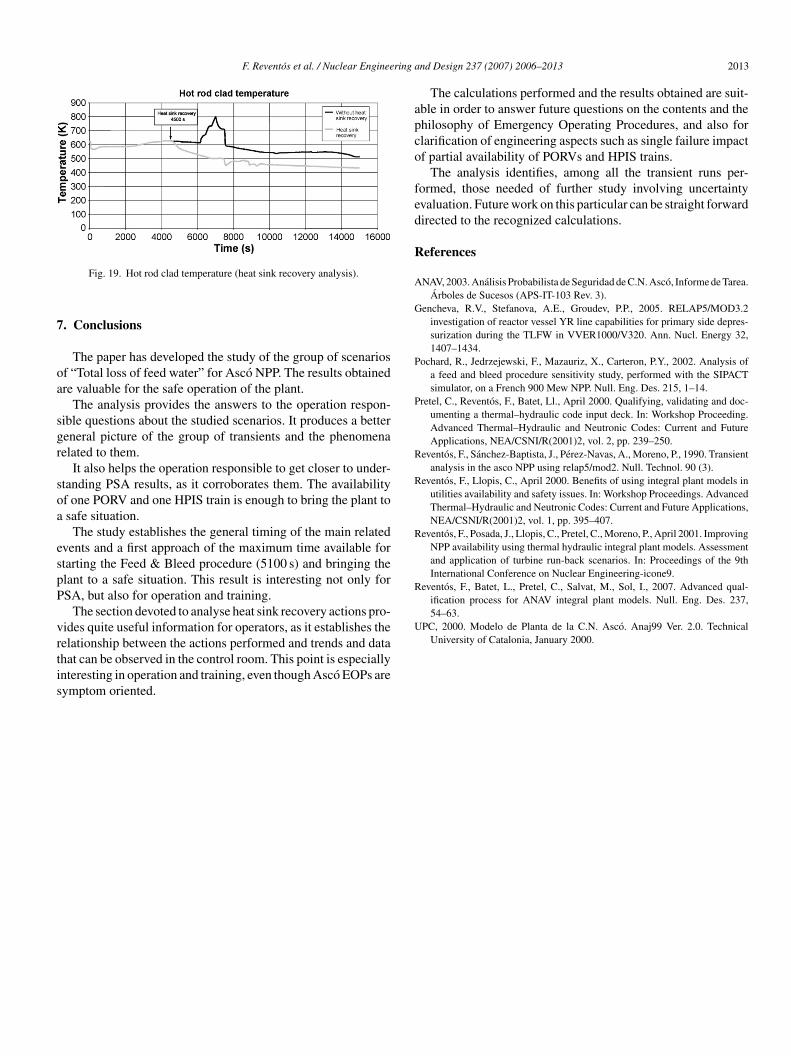
Finally, the clad temperatures of the compared cases (withnd without heat sink recovery) are shown in Fig. 19. On thene hand, the transient without heat sink recovery shows a shortartial core uncover with its corresponding temperature increase,
ut ends in a safe situation. On the other hand, the transient witheat sink recovery at 4500 s completely avoids the mentionedncrease.This section fulfils the objective mentioned previously.
Fig. 18. Hot leg temperature (heat sink recovery analysis).
F. Reventos et al. / Nuclear Engineering a
7
oa
sgr
soa
espP
vrtis
apco
fed
R
A
G
P
P
R
R
R
Reventos, F., Batet, L., Pretel, C., Salvat, M., Sol, I., 2007. Advanced qual-ification process for ANAV integral plant models. Null. Eng. Des. 237,54–63.
UPC, 2000. Modelo de Planta de la C.N. Asco. Anaj99 Ver. 2.0. Technical
Fig. 19. Hot rod clad temperature (heat sink recovery analysis).
. Conclusions
The paper has developed the study of the group of scenariosf “Total loss of feed water” for Asco NPP. The results obtainedre valuable for the safe operation of the plant.
The analysis provides the answers to the operation respon-ible questions about the studied scenarios. It produces a bettereneral picture of the group of transients and the phenomenaelated to them.
It also helps the operation responsible to get closer to under-tanding PSA results, as it corroborates them. The availabilityf one PORV and one HPIS train is enough to bring the plant tosafe situation.
The study establishes the general timing of the main relatedvents and a first approach of the maximum time available fortarting the Feed & Bleed procedure (5100 s) and bringing thelant to a safe situation. This result is interesting not only forSA, but also for operation and training.
The section devoted to analyse heat sink recovery actions pro-ides quite useful information for operators, as it establishes the
elationship between the actions performed and trends and datahat can be observed in the control room. This point is especiallynteresting in operation and training, even though Asco EOPs areymptom oriented.nd Design 237 (2007) 2006–2013 2013
The calculations performed and the results obtained are suit-ble in order to answer future questions on the contents and thehilosophy of Emergency Operating Procedures, and also forlarification of engineering aspects such as single failure impactf partial availability of PORVs and HPIS trains.
The analysis identifies, among all the transient runs per-ormed, those needed of further study involving uncertaintyvaluation. Future work on this particular can be straight forwardirected to the recognized calculations.
eferences
NAV, 2003. Analisis Probabilista de Seguridad de C.N. Asco, Informe de Tarea.Arboles de Sucesos (APS-IT-103 Rev. 3).
encheva, R.V., Stefanova, A.E., Groudev, P.P., 2005. RELAP5/MOD3.2investigation of reactor vessel YR line capabilities for primary side depres-surization during the TLFW in VVER1000/V320. Ann. Nucl. Energy 32,1407–1434.
ochard, R., Jedrzejewski, F., Mazauriz, X., Carteron, P.Y., 2002. Analysis ofa feed and bleed procedure sensitivity study, performed with the SIPACTsimulator, on a French 900 Mew NPP. Null. Eng. Des. 215, 1–14.
retel, C., Reventos, F., Batet, Ll., April 2000. Qualifying, validating and doc-umenting a thermal–hydraulic code input deck. In: Workshop Proceeding.Advanced Thermal–Hydraulic and Neutronic Codes: Current and FutureApplications, NEA/CSNI/R(2001)2, vol. 2, pp. 239–250.
eventos, F., Sanchez-Baptista, J., Perez-Navas, A., Moreno, P., 1990. Transientanalysis in the asco NPP using relap5/mod2. Null. Technol. 90 (3).
eventos, F., Llopis, C., April 2000. Benefits of using integral plant models inutilities availability and safety issues. In: Workshop Proceedings. AdvancedThermal–Hydraulic and Neutronic Codes: Current and Future Applications,NEA/CSNI/R(2001)2, vol. 1, pp. 395–407.
eventos, F., Posada, J., Llopis, C., Pretel, C., Moreno, P., April 2001. ImprovingNPP availability using thermal hydraulic integral plant models. Assessmentand application of turbine run-back scenarios. In: Proceedings of the 9thInternational Conference on Nuclear Engineering-icone9.
University of Catalonia, January 2000.