Considerations regarding the feed-food competition between ...
210
Considerations regarding the feed-food competition between man and chicken Jana Pauwels Thesis submitted in fulfilment of the requirements for the academic degree of doctor in Veterinary Sciences (PhD) 2016 Promotors Prof. dr. ir. Geert P. J. Janssens Department of Nutrition, Genetics and Ethology Faculty of Veterinary Medicine & Prof. dr. dr. Frank O. J. Coopman Department of Applied Biosciences Faculty of Bioscience Engineering
-
Upload
khangminh22 -
Category
Documents
-
view
2 -
download
0
Transcript of Considerations regarding the feed-food competition between ...

Considerations regarding the feed-food
competition between man and chicken
Jana Pauwels
Thesis submitted in fulfilment of the requirements for the academic degree of doctor in
Veterinary Sciences (PhD)
2016
Promotors
Prof. dr. ir. Geert P. J. Janssens
Department of Nutrition, Genetics and Ethology
Faculty of Veterinary Medicine
&
Prof. dr. dr. Frank O. J. Coopman
Department of Applied Biosciences
Faculty of Bioscience Engineering

Considerations regarding the feed-food competition between man and chicken
Jana Pauwels
Vakgroep Voeding, Genetica en Ethologie
Faculteit Diergeneeskunde
Universiteit Gent
Funding: This research was supported by the VLIR-UOS
Printing: University Press, Zelzate

TABLE OF CONTENTS
Table of contents
List of abbreviations ……………………………………………………………………………………………………. p.5
1 Introduction ……………………………………………………………………………………………………. p.7
2 Aims and objectives ……………………………………………………………………………………….. p.31
3 Review on the diet of free-ranging chickens in developing countries …………….. p.35
4 Case report: diet and management of free-range chickens
in Limpopo, South-Africa ………………………………………………………………………………… p.49
5a Cecal drop reflects the chickens’ cecal microbiome, fecal drop does not ………… p.61
5b Domestication of the chickens’ cecal microbiome:
commercial versus scavenger diet …………………………………………………………………… p.81
6 Does chitin create a bias in crude protein analysis? …………………………………………. p.91
7 Selection for growth performance in broiler chickens
associates with less diet flexibility ……………………………………………………………………. p.105
8 General discussion …………………………………………………………………………………………… p.123
References ………………………………………………………………………………………………………………….. p.143
Appendices …………………………………………………………………………………………………………………. p.169
Summary …………………………………………………………………………………………………………………….. p.185
Samenvatting ………………………………………………………………………………………………………………. p.191
Curriculum vitae ………………………………………………………………………………………………………….. p.199
Bibliography ………………………………………………………………………………………………………………… p.203
Dankwoord ………………………………………………………………………………………………………………….. p.207


LIST OF ABBREVIATIONS
List of abbreviations
ADF acid detergent fibre
ADFI average daily feed intake
ADG average daily gain
AIA acid insoluble ash
BSE bovine spongiform
encephalopathy
BW bodyweight
CA crude ash
CF crude fibre
CP crude protein
DM dry matter
EE ether extract = crude fat
FAO Food and agriculture
organization (United Nations)
FCR feed conversion ratio
GIT gastro-intestinal tract
IMF International Monetary Fund
ME metabolizable energy
MJ megajoules
Naa nitrogen calculated on amino
acid content
Nchitin nitrogen in chitin
Ncorr nitrogen corrected for
nitrogen in chitin
NDF neutral detergent fibre
NFE nitrogen-free extract
NKjeldahl nitrogen determined by
Kjeldahl analysis
NMDS nonmetric multidimensional
scaling
Nnpnc non-protein non-chitin
nitrogen
NRC National Research Council
NSP non-starch polysaccharides
OM organic matter
OTU operational taxonomic unit
SAR South-African rand
SCFA short chain fatty acids
Sobs observed species richness
TMT Tarsometatarsus
Definitions
Food All human-edible ingredients, accepted to be eaten by people.
Feed All ingredients that are fed to livestock, both human-edible and
human-inedible.
Alternative ingredients Human-inedible ingredients that can be used in feed.


Chapter 1
Introduction


INTRODUCTION
- 9 -
Introduction
1.1. Feed-food competition
As the global population is growing, the need for food and feed is growing along. Therefore, an increasing
competition for cereals and other human-edible ingredients between livestock feed and human food is
taking place. Overall, the feeding of human edible sources to livestock is seen in intensive systems in
developed countries, whereas the shortage of food is mainly located in developing countries (Erb et al.,
2012). Increasing the use of human-inedible ingredients in the feed of livestock, on the one hand, and
increasing the profit that rural livestock owners make on their animals, on the other hand, are two ways
to temper this competition. Equally so has farming intensification allowed to supply food for over 7
billion people worldwide and, at the same time, the percentage of undernourished people has decreased
from 18.7% in 1991 to 10.8% in 2015. The overall number of undernourished people in the world,
however, is still close to 800 million (based on FAOSTAT, 2015) (Figure 1.1.). Therefore, finding the limit
of decreasing the use of human-edible ingredients in the feed without tackling the production, will be
important.
Figure 1.1. Global number of undernourished people over the years (FAOSTAT, 2015).
One third of the global production of cereal grains (1.3 billion tons a year) ends up in livestock feed and
poultry production occupies about 8% of the world cereal grain production (Hinrichs and Steinfeld, 2007;
Gustavsson et al., 2011). Taking into account that soybeans and cereal grains are human-edible and both

INTRODUCTION
- 10 -
cereals and soybean meal compose more than 80% of the chickens’ diet, it is estimated that 75% of the
broiler diet and 65% of the laying hens’ diet is human-edible (Hendy et al., 1995; Gerber et al., 2007;
Donohue and Cunningham, 2009; Wilkinson, 2011). The chickens’ efficiency, however, to convert
human-edible energy and protein from the feed to human-edible energy and protein in their meat and
eggs, is often low. To estimate how much protein and energy was lost by consumption of animal protein,
van Es (1975) was the first to calculate human-edible energy and protein conversion efficiencies.
Energy efficiency =ME available for humans in animal products
ME available for humans in animal feeds
Protein efficiency =Protein available for humans in animal products
Protein available for humans in animal feeds
This is a complex calculation and many different factors, such as the average age, the number of chickens
dying during the production process, the amount of feed that is spilled and the feed consumed by the
breeder animals, have to be taken into account. Therefore it is understandable that different results are
obtained by different authors in different periods of time (Table 1.1.), the more as the feed conversion
(kg of feed needed to gain one kg of bodyweight) of the chicken breeds improved over time (2.33 in 1975
versus 1.70 in 2010 (ACMF, 2013)) and it is up to the authors to decide whether a particular feed
ingredient is regarded as human-edible or not. Furthermore, these efficiency calculations do not take
the amino acid profile into consideration while plant foods are often limited in lysine (soybeans are an
exception) and the most important amino acids (lysine, threonine, S-amino acids and tryptophan) are
abundant in meat (Millward, 1999).
A human-edible protein efficiency higher than 100% was found for broilers in South-Korea. This means
that during the whole production process, less kg of human-edible protein was available in the chickens’
feed, compared to the eventual human-edible protein in eggs and meat. This is possible because these
chickens are mainly fed human-inedible products. Boonen (2015) also obtained efficiencies higher than
100% as he considered soybean meal to be human-inedible because it is produced as by-product after
oil extraction from soybeans. This is, however, debatable as soybeans get produced explicitly to be used

INTRODUCTION
- 11 -
in feed. One needs 1 kg of soybeans to produce 0.8 kg of soybean meal (Cromwell, 2012). As the diet of
broilers contains 10% to >30% of soybean meal, the assumption that soybean meal has no food-value
influences the efficiency results to a large extent. Overall are most efficiencies in Table 1.1. lower than
one, indicating that human-edible protein and calories are lost by feeding concentrated diets to chickens.
Table 1.1. Human-edible protein and energy efficiencies of chickens converting feed to meat and eggs.
Efficiency on human-
edible energy
Efficiency on human-
edible protein Reference
Broiler 0.29 0.43 (van Es, 1975)
(van Es, 1975) Laying hen 0.23 0.40
Broiler (Belgium) 0.19 1.00 (Boonen, 2015)
(Boonen, 2015) Laying hen (Belgium) 0.30 1.27
Poultry (USA) 0.31 0.75 (Bywater and
Baldwin, 1980)
Broiler (USA) 0.28 0.62 (Gill et al., 2010)
(Gill et al., 2010) Broiler (South-Korea) 0.30 1.04
Still, food as feed for chickens might be beneficial in developed countries because production intensity
is generally high and economic profits are highest for intensive chicken farms (Hinrichs and Steinfeld,
2007). Yet, when putting the feed-food debate in a global context, perspectives change. Different factors
increase the demand for cereal grains globally (reviewed by Rosegrant and Cline, 2014) and meeting
those demands will become challenging in the future as:
1) Human population growth is expected to increase the need for cereal grains for food.
2) Meat consumption per capita will increase, resulting in an increased demand for feed cereals.
3) The production of cereal grain for bio-fuel will increase, especially since fossil fuels are depleting
(Leng, 2005; Donohue and Cunningham, 2009).
4) Climate change will decrease the suitability of agricultural land in some areas for crop production
(Hutagalung, 2000; Pinotti and Dell’Orto, 2011; Rosegrant and Cline, 2014).

INTRODUCTION
- 12 -
Higher grain prices do not only decrease accessibility to food for less affluent people, they increase the
pressure on arable land and forest too (Foley et al., 2011). Currently, one third of all croplands are used
to grow feed-crops (Steinfeld et al., 2006).
1.2. Possibilities for alternatives
Preliminary considerations
Pursuing maximal performances might not always be the best economical decision, nor the most
ecological or socially accepted (Jackson et al., 1982; Wilkinson, 2011). Providing locally produced sources
of feed, which are not useful in the human diet, can therefore be a more beneficial strategy for both
domestic and industrial chicken farmers. Even when these feed alternatives contain a lower level of
protein, a less protein-rich diet might not need to be compensated as protein guidelines for chickens are
sometimes overestimated (Farrell et al., 1999a; Ravindran, 2012). And, when necessary, synthetic amino
acids can be added to the diet (Becker and Wittmann, 2012). A reduction of more than 20% on the global
warming potential of feed could be obtained by replacing soybean meal by peas and synthetic amino
acids, even though the global warming potential of synthetic amino acids is higher than the one of
soybean meal (Leinonen et al., 2013). In addition, broilers manage to regulate their protein intake to
perform maximally when they are allowed to select their own diet from different ingredients. Not only
by maximizing their protein intake, they can also limit their protein intake when the protein content in
feedstuff is too high (Shariatmadari and Forbes, 1993; Gous and Swatsom, 2000; Kim, 2014).
Furthermore, chickens are known to digest different nutrients better with increasing age (Batal and
Parsons, 2002; Jiménez-Moreno et al., 2009), opening the opportunity to broaden the range of possible
ingredients for feed at older ages. In addition, depending on the digestibility of the protein source, less
protein in the chicken feed can reduce the nitrogen excretion and, therefore, be beneficial for the
environment (Follett and Hatfield, 2001). For minerals and vitamins too, studies have shown that
supplementation can be left out during the finisher period without affecting productivity or
immunocompetence of chickens (Skinner et al., 1992; Khajali et al., 2006).
Further, the selection for high productive chickens happened in a certain setup with a concomitant
evolution of feed, disease control and housing. Therefore, other characteristics such as the ability to deal

INTRODUCTION
- 13 -
with chitin or high fibre levels in the diet, feed selection or immunity against infections, might
unconsciously have been lost in these chickens. When feeding alternative ingredients, however,
different characteristics of the chickens might become important again. Slow growing and indigenous
chicken breeds could thus be needed to increase the genetic diversity and to re-introduce certain
features (Castellini et al., 2006; Grashorn, 2006).
Nevertheless, decreasing the use of human-edible ingredients in feed will not automatically make those
ingredients available for human consumption. History shows that milk or grain surpluses in developed
countries are rather destroyed to prevent a drop in prices, than being transported to developing
countries or even distributed among the less fortunates in own country. Equally so, would dumping food
surpluses in developing countries not be a sustainable solution either as it would tackle the local farmers
and make those countries depend on import. In addition, the European legislation strictly distinguishes
between feed-grade and food-grade ingredients to guarantee food safety. Unfertilized eggs from a
chicken hatchery, for example, are not allowed in the food chain, even though eggs are consumable by
people. These eggs can be used in feed but, again, only if certain criteria are fulfilled. When, for example,
embryos are present in the eggs, they are not allowed in feed either (pers. comm. I. Kalmar). One way
to contribute to the food availability in developing countries could be by using less imported ingredients.
Soybean meal, for example, is mainly imported to Europe from South-America and Asia. Decreasing the
use of soybean meal could therefore make local croplands available for food crops and attenuate
deforestation. This argument too can be countered as it will decrease the income of soy farmers in those
regions.
Alternative ingredients
Alternative ingredients in the chicken feed have extensively been reviewed (Ravindran and Blair, 1992;
Farrell, 2005; Makkar et al., 2014) and numerous studies have proven the potential of many of those
ingredients (Appendix 1). Cottonseed meal, for example, contains the metabolite gossypol, which
inhibits digestive enzymes, reduces palatability and can, at high concentrations, be toxic to chickens
(Morgan, 1989). Hence, cottonseed, from which the gossypol has been removed, can be fed up to 200 g
per kg feed in broiler diets (replacing soybean meal and sorghum) without a loss of performance. For

INTRODUCTION
- 14 -
laying hens, a productivity of 90% was reached with the inclusion of 120 g and 200 g cottonseed meal
per kg feed when the chickens were 18 to 57 weeks old (Perez-Maldonado, 2003).
Another example is meat and bone meal, which has already proven its value as a protein source in animal
feed. Before bovine spongiform encephalopathy (BSE) caused an outbreak, meat and bone meal was the
most important protein source in the poultry and livestock industry (Parsons et al., 1997). Although
chickens can probably not transmit BSE from their feed to the consumer, the EU has banned all use of
meat and bone meal in livestock feed to guarantee food safety (EC, 2001; Rodehutscord et al., 2002;
Matthews and Cooke, 2003). Ever since, soybean meal has taken over as the most important protein
source in feed worldwide, accounting for nearly 69% of all proteins used in animal feed (Cromwell, 2012).
Strictly spoken, soybean meal can be considered a by-product, but when the calculations are made, it is
clear that the use of soybean meal does not avoid feed-food competition. It takes 1 kg of human-edible
soybeans to produce 0.8 kg of soybean meal. Using an average FCR of 1.6 and a meat: live bodyweight
ratio of 70%, it is estimated that 2.3 kg of commercial feed is needed to produce 1 kg of broiler meat.
Assuming that a third of the feed is soybean meal, 0.77 kg of soybean meal is needed for 1 kg of broiler
meat. When converting this to human-edible soybeans, the soybean: broiler meat ratio is nearly 1:1. As
soybeans are not the only human-edible ingredient in the broilers’ diet and have a favorable amino acid
composition, the use of soybean meal in feed does not increase the efficiency as calculated in Table 1.1.
For laying hens, the soybean: egg ratio is much lower (0.24:1) but the diet of laying hens contains 50-
60% of cereal grains.
A ton of meat and bone meal delivers the same amount of protein as 1.16 tons of soybean meal.
Considering that it takes 0.44 million hectares to produce 1.16 million ton of soybean meal and meat
and bone meal is a true by-product (Steinfeld et al., 2006; Wilkinson, 2011), it can be assumed that the
reintroduction of meat and bone meal in the feed would, strictly spoken, increase the availability of
soybeans in the human diet. Or, as soybeans are not highly demanded as food, the production of
soybeans could be reduced and other crops or forest could replace soybean plantations.
Proposals of the EU commission to include animal derived protein back in the feed of monogastrics have
been included in the roadmap 2010-2015. Since 2013, a PCR method to detect bovine DNA in samples
was available and ever since animal-derived protein from non-ruminants are allowed in aquaculture. For
poultry and pigs, PCR methods are being developed to identify the species of origin in the animal derived

INTRODUCTION
- 15 -
products. This is important in the context of article 11 of VO 1069/2009 to avoid cannibalism. Although
these analyses are close to being available, two problems have been indicated. The first one is the nearly
inevitable presence of cross contamination of the products and secondly, specifically for poultry, it
appears difficult to find a communal DNA piece for all poultry species that can be used in PCR analyses
(pers. comm. C. Keppens, FAVV).
Fibres
Defining nutritional fibre is not easy and many attempts have been done over time. Currently, dietary
fibre is defined as “the remnants of the plant cells, polysaccharides, lignin and associated substances
resistant to hydrolysis (digestion) by the alimentary enzymes” (DeVries, 2003). Divisions, within the
group of dietary fibre, are made on nutritional and analytical characteristics, leading to entangled
definitions of different fibre fractions (Hall, 2003) (Figure 1.3.). Plant cell walls are composed of non-
starch polysaccharides (NSP) and lignin. Albersheim et al. (1984) classified NSP according to their
solubility as cellulose, hemicellulose and pectin. When calculating or analyzing NSP, however, a part of
resistant starch can be included too. Furthermore, based on the digestion and utilization, Van Soest et
al. (1991) defined neutral detergent fibre (NDF), acid detergent fibre (ADF) and crude fibre (CF). The NDF
includes hemicellulose, cellulose and lignin and ADF includes cellulose and lignin. Crude fibre measures
a share of hemicellulose, cellulose and lignin (Van Soest et al., 1991). Depending on the sample, however,
a part of the pectin, hemicellulose and cellulose might be in- or excluded from the NDF, ADF, CF or NFE
fraction. Some pectins are even seen to appear in the ADF and not in the NDF (pers. comm. Sonja de
Vries). Soluble and insoluble fibres are distinguished, based on their physiological effects (Prosky et al.,
1988). Nitrogen-free extract (NFE), calculated as 100 – (crude ash + crude protein + crude fibre + crude
fat + water), is not considered as a fibre fraction, but contains carbohydrates, sugars, starch and most of
hemicellulose (Lloyd et al., 1978; Detmann and Valadares Filho, 2012).
Chitin is not a plant derived molecule, nevertheless, it can be considered as a polysaccharide as it is a
polymer of N-acetylglucosamine, which is a glucose derivate (Richards, 1958). As chitin and the methods
to analyse it are thoroughly discussed later, chitin is included in Figure 1.3.
INTRODUCTION
- 16 -
Figure 1.3. Overview of different fibre fractions (based on Lloyd et al., 1978; Prosky et al., 1988; Van Soest et al., 1991;
Finke, 2007; McDonald et al., 2011; pers. comm. S. deVries).
Alternative ingredients are often high in fibre and therefore considered of low energetic value to the
chickens’ diet (Jørgensen et al., 1996). However, many beneficial consequences have been shown after
inclusion of extra fibre in the diet.
- Whole triticale or wheat can be used in the diet to slow the growth rate of the chickens down by
increasing the amount of fibre. This resulted in a reduced prevalence of ascites among the
chickens (Jones and Taylor, 2001).
- Inclusion of inulin, high-fibre sunflower cake, oat hulls or soy hulls, improved the nutrient
retention (Alzueta et al., 2010; González-Alvarado et al., 2007; Kalmendal et al., 2011).
- Improved feed conversion ratio was found after inclusion of both 3% oat hulls and 3% soy hulls
(González-Alvarado et al., 2007).

INTRODUCTION
- 17 -
- Oat hulls (mainly insoluble fibres) increased the passage rate in contrast to inulin (soluble fibre)
which delayed it due to increased viscosity (Choct et al., 1999; Hetland and Svihus, 2001; Hetland
et al., 2004; Alzueta et al., 2010).
- Inclusion of fibre in the diet increased the relative weight of the gizzard, the ceca and the overall
digestive tract, whereas the length of the small intestine decreased (González-Alvarado et al.,
2007).
- Equal feed consumption and egg production was shown with inclusion of 10% high-fibre
sunflower meal in the laying hens’ diet (raising the crude fibre level from 2.9% up to 5.3%) (Rezaei
and Hafezian, 2007).
As demonstrated, different fibre fractions cause different effects on the health and production of the
chickens, therefore, “fibre” should not be considered as a whole when studying its value in the chickens’
diet. Yet, one must be aware that the results of the studies listed above are specific for the experimental
setup mentioned. Other fibre inclusions, fibre sources or chicken breeds, for example, might give
different results.
Microbiota
Although many fibre fractions are indigestible to the chickens’ endogenous enzymes, cecal microbiota
can break some of them down by fermentation (Dunkley et al., 2007). During fermentation, short chain
fatty acids (SCFA) are produced which are proven to benefit the overall health and, more specific, the
gut health of the chickens. Butyrate production, for example, is shown to reduce invasion and
colonization of the gut by Salmonella and to stimulate intestinal epithelial growth (Pryde et al., 2002;
Van Immerseel et al., 2005; Kien et al., 2007). Produced SCFA contribute to the nutrition of the chicken
as they are absorbed across the mucosa of the ceca and catabolized, but this only contributes 3-4% to
the overall energy that chickens extract from feed (Jørgensen et al., 1996). Moreover, SCFA lower the
pH in the ceca and therefore protect the chicken against some pathogens and improve mineral
absorption (Apajalahti, 2005; McWorter et al., 2009). Dunkley et al. (2007) incubated ten different high-
fibre feed substrates with cecal content and measured the SCFA that were produced by fermentation of
the substrates. Acetate production was highest, followed by propionate and butyrate. Bjerrum et al.

INTRODUCTION
- 18 -
(2006) found the dominant bacteria in the ceca of both conventional and organic chickens to be related
to Faecalibacterium prausnitzii and to produce butyric acid.
The chickens’ gut microbiota is modulated by many factors, but one of the main factors remains the diet.
A Finnish survey on the cecal microbiome of chickens on different farms reported that the profiles of the
cecal microbiomes clearly clustered when farms were using the same diets, irrespective of the
management used on the farms. The processing of the feed and the ingredients used are suggested to
be equally important (Apajalahti et al., 2001). Especially fibre can influence the cecal microbiota, both in
a beneficial as in a detrimental way. The risk for Clostridium perfringens colonization, which can cause
necrotic enteritis (Van Immerseel et al., 2004), increases with the viscosity of the digesta. Therefore,
diets rich in indigestible, water-soluble NSP, can trigger an C. perfringens infection (Kocher, 2003).
Equally so have prebiotic effects been attributed to, for example, xylo-oligosaccharides in cereals or to
lactose (reviewed by Hajati and Rezaei, 2010). Prebiotics have a positive effects on the gut health as they
stimulate normal intestinal microflora and inhibit pathogens colonization. Bifidobacterium, for example,
can get stimulated and therefore produces more acetate and lactic acid. Lactic acid decreases the pH in
the intestine and prohibits, in that way, E. coli colonization (Patterson and Burkholder, 2003). The
stimulating effect of prebiotics on the gut health of chickens is especially investigated since in-feed use
of antimicrobials are prohibited by the EU in 2006.
Many studies have mapped the cecal microbiome of chickens (Appendix 2). Yet, it remains difficult to
link overall microbiota shifts to changes in digestive capacity, production or gut health. Nevertheless, as
the cecal microbiota is responsible for the fermentation of NSP, resistance against infection and
improved gut health, their importance in chickens fed an alternative diet has to be acknowledged (Nurmi
and Rantala, 1973; Dunkley et al., 2007; Eeckhaut et al., 2008).
So far, in all studies on the cecal microbiota of chickens, chickens were sacrificed in order to obtain
samples. A method to obtain a cecal sample without the need of euthanizing chickens would make
longitudinal studies easier and would reduce the sample size, therefore benefitting the welfare of the
trial animals (Russell and Burch, 1959).

INTRODUCTION
- 19 -
Insects
Insects are natural converters of organic waste streams into protein and fat, and they are part of the
natural diet of chickens (Goromela et al., 2006). Including them as an alternative ingredient in the
chickens’ diet would decrease the feed-food competition for different reasons:
1. When compared to grain, they need less space per kg protein. Resulting in a higher protein yield
per km² (Oonincx and de Boer, 2012).
2. Some insects have a reproduction cycle of a few generations per year.
3. A high variability of edible insects has been reported: more than 1500 species of edible insects in
113 countries (Jongema, 2015).
4. Overall, insects have a good nutritional value for protein, fat, vitamins and minerals (especially
Fe and Zn) (Bukkens, 1997; Finke, 2007; Ramos-Elorduy et al., 2011; Oonincx and Dierenfeld,
2012).
Including insects in the feed, however, also arises some challenges. As huge insect quantities will be
necessary, as pesticides might be present on insects caught from the wild (Banjo et al., 2006) and as
overharvesting will affect the insect population and the whole environment (Yen, 2010; Ramos-Elorduy
et al., 2011), it will be important to breed insects in controlled environments. Hence, research into
breeding protocols and management policies will be necessary. In addition, breeding insects might raise
questions on insect welfare (Eisemann et al., 1984). Furthermore have allergic reactions to insects been
described, mainly caused by chitin (Linares et al., 2008; Verhoeckx et al., 2014) and some insects are
reported to be toxic (Blum, 1994; Adamolekun et al., 1997; Zagrobelny et al., 2009). Other risks such as
disease transmission and bad preservation of the feed (Blum, 1994; Schabel, 2008; Zagrobelny et al.,
2009; Klunder et al., 2012) also need to be studied.
The European legislation on the use of insects in feed and food is unclear. As insects are not explicitly
mentioned as feed or food ingredient in the law, one can speculate which rules apply to them. The two
main questions that need to be answered are: “do insects belong to the group of novel foods”? In other
words: “have they been eaten in Europe to a “significant degree” before May 15, 1997”? And secondly:
“should insects and their products be considered animals and animal-derived products”? The EU

INTRODUCTION
- 20 -
legislation about the use of animal derived products in the feed of production animals is complex.
Whether insects are considered animals or not will affect the criteria that need to be met before being
allowed in feed. Including insects in the group of “novel foods” will complicate and postpone the
approval to use insect products in food (van der Spiegel et al., 2013; Eeckhout and Verbeke, 2015).
Awaiting a clear opinion in the EU, the FAVV has allowed ten insects for human consumption within
Belgium. These ten can be sold as long as the principles of food security are respected and the company
is registered with the FAVV (FAVV, 2014).
As food, insects are consumed in many countries. Therefore, one can wonder whether insects will not
contribute to the feed-food competition. As people in Europe and the USA are overall reluctant towards
the idea of consuming insects (Mitsuhashi, 2010; Megido et al., 2014), it can be expected that the
competition will rather be small in these regions. If insects for feed could be bred on absolute waste
streams such as kitchen leftovers, garden waste or manure, they can be considered as by-products of
waste processing. Moreover, the use of insects as food is ecological more beneficial than the
consumption of meat. When compared to livestock, insects excrete less greenhouse gasses, have a more
optimal feed conversion and their production process needs less water (Figure 1.4.-1.5.). Breeding more
insects because of a competition between feed and food for insects would therefore be more sustainable
compared to an increased consumption of beef, pork and chicken.
Figure 1.4. Greenhouse gas production (global warming potential), energy use and land use due to the production of 1 kg of
protein from mealworms, milk, pork, chicken and beef (adapted from Oonincx and de Boer, 2012)

INTRODUCTION
- 21 -
Figure 1.5. Efficiencies of production of conventional meat and crickets (adapted from van Huis, 2013)
To study the nutritional composition of insects or the digestibility of feeds containing insects, specific
methods will be needed as chitin is present in insects. Chitin is a polysaccharide included in the procuticle
of insects where it is an important part of the exoskeleton (Richards, 1958). Specific methods are needed
as chitin and protein both contain nitrogen and the crude protein analysis is based on the determination
of total nitrogen by the Kjeldahl method. Equally so are the methods to determine chitin (Finke, 2007;
Liu et al., 2012) close to the methods to analyse fibre fractions (Prosky et al., 1985; DeVries, 2003). In
diets composed of both animal and plant derived ingredients, distinguishing between chitin and crude
fibre on the one hand and between chitin and protein on the other hand, proves challenging (Finke,
2007).

INTRODUCTION
- 22 -
1.3. Evolution of the chicken
The origin of chickens
The taxonomy (“science of classifying living things”) and the reconstruction of the origin of domestic
chickens has not been easy (Liu et al., 2006). Today it is accepted that they belong to the order of the
Galliformes, family Phasianidae and genus Gallus which equals the genus of the junglefowl (Crawford,
1990a). Four different species of junglefowl can be distinguished: red junglefowl (Gallus gallus;
previously known as G. bankiva and G. ferrugineus), grey junglefowl, green junglefowl and Ceylon
junglefowl. Based on geographical location, different sub-species exist within the species of red
junglefowl. This species is considered the main ancestor of the domestic chicken (Moreng and Avens,
1985; Crawford, 1990a; Fumihito et al., 1994; Moiseyeva et al., 2003), although some authors suggest
that the grey junglefowl (G. sonneratii) also contributed (Tixier-Boichard et al., 2011).
Today, red junglefowl still occur in the wild in South-Eastern Asia (India, China, Java, Malaysia, Indonesia,
and the Philippines). They are mostly found in undisturbed mixed forests in the tropics and sub-tropics
but can also be found on field edges, groves, plantations and scrubland (Ali and Ripley, 1989; Delhoyo et
al., 2001). The habitat flexibility minimizes the direct negative effect of forest loss on its conservation.
Other threats to the red junglefowl include predation, poaching and egg collection, but the biggest
reason for the decreasing number of pure red junglefowl is the genetic loss through crossbreeding with
domestic and feral chickens (Ali and Ripley, 1989; Peterson and Brisbin, 1998). The original purpose of
domesticating chickens was game and entertainment rather than meat and eggs. West and Zhou (1989)
suggest that chickens were domesticated in Southeast Asia way before 6000 BC and later they were
introduced in Northern China where chicken bones, larger than the ones of the wild red junglefowl, were
found. Proof of domestication of chickens in India only dates from 2000 BC and it is not clear whether
this has been introduced from Southeast Asia too, or was an isolated event. Illustrations of fighting
roosters and little statuettes out of clay were found in the Indus Valley (2500 BC). With the Romans,
keeping poultry was well established and they started using them as a food source, though they were
still used in religion and entertainment (West and Zhou, 1989; Crawford, 1990a).
Thousands of years have passed between the domestication of the chicken and the situation of today
where industrial broilers achieve 2.77 kg of bodyweight in 42 days (Aviagen, 2012) and laying hens

INTRODUCTION
- 23 -
produce 413 eggs in 72 weeks (Genetics, 2014). However, the development of the poultry industry is a
recent phenomenon, happening in approximately hundred years’ time. The current industrial breeds
originate from only a few “old” breeds with extraordinary traits in meat or egg production. Though many
different chicken breeds were used all over the world, domestication and industrialization caused a
decreasing genetic diversity and care must be taken in order not to lose interesting traits and features
seen in less productive breeds (Al-Nasser et al., 2007). Indigenous chickens, mainly kept in developing
countries, Mediterranean egg-type and the true Bantam, have been proven very important breeds in
this matter (Moiseyeva et al., 2003).
Unconscious selection
The first chapter of Darwin’s “Origin of species” addresses “The variation of animals and plants under
domestication”. In this chapter Darwin describes the effect of human selection on different organisms,
including chicken (Darwin, 1859). Ever since chickens have been domesticated, broilers and laying hens
have been selected for different traits. Domestication changed some aspects of phenotype, behavior
and physiology extensively (Zulkifli et al., 1999; Schütz et al., 2001; Kerje et al., 2003), but Darwin
distinguished between conscious and unconscious selection (Darwin, 1859). Broilers, for example, have
been selected for rapid growth, low feed conversions and heavy breast muscles. As these are the desired
traits in order to increase the productivity and therefore the economic benefits, these traits are part of
the conscious selection. However, when these highly selected chickens are compared to their initial
ancestors, the red junglefowl, it appears that they also have smaller brains, lighter bones and smaller
lungs (Vidyadaran et al., 1990; Jackson and Diamond, 1996). These are assumed to be the result of
unconscious selection.
Comparing different traits between commercial chickens and the red junglefowl raises the question
whether, over the years, chickens have not been (unconsciously) selected to high performance on
energy-rich diets, rather than on high performance no matter what the feed is. They might show a
superior feed conversion when fed the commercial diets, but might lose their lead on low energy and
high fibre diets.

INTRODUCTION
- 24 -
1.4. Industrial chickens
Broilers and laying hens
Although different breeds can be kept for both meat (broilers) and egg production (laying hens), most
of the industrial chickens belong to a few breeds only. The heavy, fast-growing broilers originate mainly
from Cornish breed and White Plymouth Rock. Three current breeds represent the biggest part of
broilers in the world: Cobb, Ross and Hubbard (Aviagen; Cobb-Vantress; Groupe Grimaud). Concerning
the laying hens, white eggs mainly come from single comb White Leghorns and brown eggs from
Plymouth Rocks, New Hampshire, Rhode Island Red and Australorp (Crawford, 1990b; Siegel et al., 1992),
illustrating the narrow genetic origin of both types of commercially used chickens.
Diet
It is not easy to determine specific guidelines regarding the required nutrients in a chicken diet because:
1. The required levels of the nutrients vary between laying hens and broilers, between management
policies and evolve during the production process.
2. The optimal composition of a diet is affected by the specific situation. Factors such as climate,
stocking density and chickens’ genetics interact.
3. The quality of the ingredients can differ between different batches.
4. The legislation can forbid the use of certain ingredients (cfr. meat and bone meal).
5. Only minimum requirements for crude protein, amino acids, minerals, vitamins, energy, and
linolenic acid are described in the “nutrient requirements for poultry” (NRC, 1994).
6. There is a lack of specific guidelines for different fibre fractions, carbohydrates and fatty acids
other than linolenic acid, even though the beneficial effects of calculated supplementation of
some of those fragments have clearly been proven (Alzueta et al., 2010; Kalmendal et al., 2011).
7. Commercial diets are composed on cost-benefit analyses and therefore do not necessarily
represent the optimal diet regarding chicken health, welfare or even growth.
8. Feed companies keep the results of their trials secret.

INTRODUCTION
- 25 -
Moreover is the NRC, considered the reference for poultry nutrition, fairly outdated (NRC, 1994). Recent
studies have questioned the guidelines in the NRC and have shown better productions by different amino
acid or micronutrient inclusions. Sakomure et al. (2015), for example, re-determined amino acid
guidelines for broiler breeders and found levels that differed from the NRC guidelines. Leeson (2007) re-
evaluated vitamin requirements and found, for example, that vitamin E levels should exceed NRC
requirements for optimal production and health.
1.5. Rural chickens
Chickens are the number one livestock kept in rural areas (Alders and Pym, 2009), but only few statistics
are available on the productivity and management of chickens in developing countries. Still, based on
the published numbers, some estimates can be made. Indigenous breeds probably represent 70-95% -
with an average of 80% - of the national chicken flock in developing countries (Guèye, 1998; Goodger et
al., 2002). Because of their low productivity, however, the contribution they make to the national
production of eggs and meat is expected to be much lower. Nevertheless, the FAO estimates the rural
human population to count 3.36 billion heads (or 46% of the global population), indicating that rural
chickens should be considered very important (FAOSTAT, 2015).
Production
The number of eggs delivered for consumption by an indigenous hen per year lies between six and
sixteen. Hence, not all of the laid eggs are kept for consumption or sale. This estimation was made by
Pym et al. (2006) based on the production numbers of two to four clutches a year, each containing about
ten to sixteen eggs (Sonaiya et al., 1999; Henning et al., 2007). Over 80% of the eggs are bred by the hen,
delaying the next clutch of eggs and decreasing the number of eggs available for consumption (Sonaiya
et al., 1999; Khalafalla et al., 2002; Njue et al., 2002; Pym et al., 2006; Henning et al., 2007). Hens hatching
their eggs should not necessarily be a disadvantage if it was not that only a low number of chicks survive
(Aini, 1990; Cumming, 1992; Sonaiya et al., 1999). Other causes for the low production number of eggs
can be looked for in the genetics of the indigenous birds, seasonal effects and the low concentration of
some nutrients and minerals in their diet (Tadele, 1996; Goromela et al., 2006). When comparing the

INTRODUCTION
- 26 -
indigenous breeds with hybrid layer hens (6 to 16 versus 250 to 300 eggs per year, respectively), Pym et
al. (2006) estimate that the contribution of indigenous chickens to total egg consumption in developing
countries is only 8%. For meat, the contribution of indigenous chickens is estimated to be higher; 67% of
the chickens slaughtered for meat in developing countries comes from indigenous breeds. When
correcting for the difference in bodyweight (0.8 versus 1.5 kg), this number decreases to 50% (Pym et
al., 2006).
Management
When leaving the industrial systems aside, poultry management in developing countries can be divided
in four systems: the free-range system, the backyard or semi-scavenging system, the semi-intensive
system and the small-scale intensive system (Table 1.2.). The first one is used by most of the rural
families. One to ten indigenous chickens, with a growth rate between 5 and 10 g/ day, are kept around
the house without specific shelter. The input in such a system is low since little to no labor or money is
put into it. In other systems, feed is often the most expensive input (up to 70% of the production costs
(Hinrichs and Steinfeld, 2007; Donohue and Cunningham, 2009; Yegani and Korver, 2013)) but chickens
in a free-range system roam around freely and forage for their own feed. In that way, even poor families
who cannot afford to buy or share their food with the chickens, can benefit from keeping a few chickens.
A downside consequence of this “low-input system” is the high mortality and the low productivity due
to different factors such as predation, infectious diseases and parasites (Kusina et al., 1999; Alexander,
2001; Swai et al., 2013).

INTRODUCTION
- 27 -
Table 1.2. Different chicken management systems in developing countries, with the traditional free-
range management being the most frequently used.
Traditional free-
range
Backyard or
subsistence Semi-intensive Small-scale intensive
Flock size 1-10 birds 10-50 birds 50-200 birds 50-500 birds
Key rearers Majority of rural
families
Moderate number of
rural families Few rural families Urban families
Ownership Mostly women &
children
Mostly women &
family Middlemen Business men
Type of breeds Indigenous breeds Indigenous & few
crossbreds Local/ improved Layers or broilers
Feed resources Scavenging Scavenging &
supplementation Commercial/ local Balanced diets
Health status No vaccination/
medication
Vaccination & little
medication Vaccination Full vaccination
Housing system No specific housing Simple & small
houses Medium & improved Big & improved
Egg production 30-50/(year × hen) 50-150/(year × hen) 80-160/(year × hen) 250-300/(year × hen)
Growth rate 5-10g/ day 10-20g/ day 10-20g/ day 50-55g/ day
Mortality rate High mortality Moderate mortality Low mortality Low mortality
Use of products Home consumption Home consumption
& sale Family income Business income
Profit Small cash income Family income Family income Business income
Socio-economic Social and cultural Social & micro-credit Credit based assets Little social
Based on (Sonaiya et al., 1999; Guèye, 2003; Riise, 2004; Goromela et al., 2006; Sonaiya, 2007).

INTRODUCTION
- 28 -
Scavenger diet
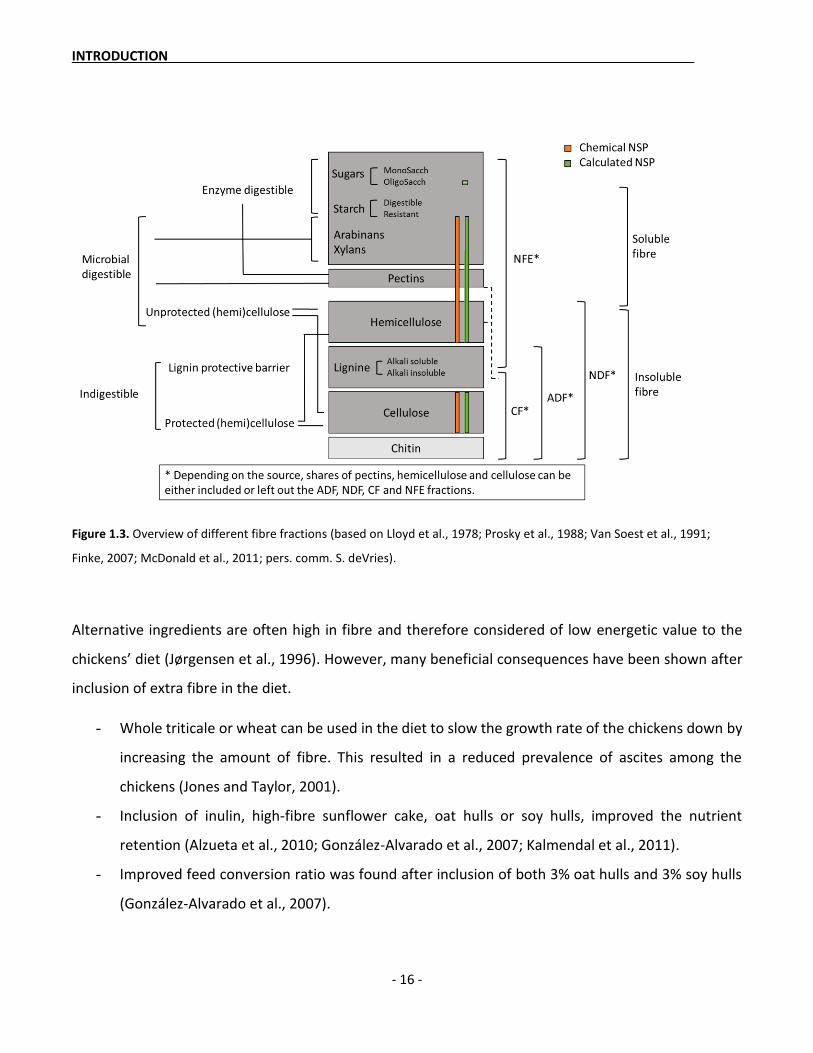
Rural chickens, kept in a completely extensive way, have to find their feed by foraging in the environment
(Figure 1.6.). Many different ingredients were found in the diet of scavenging chickens (Goromela et al.,
2006), both of human and natural origin. Goromela et al. (2006) found an average nutrient composition
of 100 g crude protein/ kg DM, 11.2 MJ/ kg DM, 11.7 g Ca/ kg DM and 5 g P/ kg DM in the crop content
of scavenging chickens. They concluded that these nutrient concentrations were too low to support high
productivity. However, this conclusion was based on the comparison with concentrations needed for
broilers or layers in the industry (NRC, 1994). No information was given about the absolute amount of
feed per day that was ingested by the birds.
Figure 1.6. Indigenous chickens roaming freely (Limpopo, South-Africa and Kabale, Uganda).


Chapter 2
Aims and objectives


AIMS AND OBJECTIVES
- 33 -
Aims and objectives
As the global population is growing, the need for food and feed is growing along. Therefore, an increasing
competition for cereals and other human-edible ingredients between livestock feed and human food is
taking place. Overall, the feeding of human edible sources to livestock is seen in developed countries
whereas the shortage of food is located in developing countries. Increasing the use of human-inedible
ingredients in the feed of livestock, on the one hand, and increasing the profit that rural livestock owners
make on their animals, on the other hand, are two ways to temper this competition.
The general aim of this Ph.D. dissertation is to regard the problem from a helicopter view in order to get
a global idea about the problems that play. In order to contribute to solutions in the future, points of
focus and critical factors for further research were identified.
1) The first objective of this PhD dissertation is to get an idea about alternative ingredients and diet
composition by observing the diet of rural, free-range chickens.
From this first observation, two considerations were selected. The first consideration assumes that many
alternative ingredients will contain a high fibre content. The second one brings up insects, natural
converters of waste into protein and fat, as a promising alternative ingredient in the future. Hence, to
study the chickens’ ability to break fibres down, the cecal microbiome of chickens will be crucial.
Furthermore, the digestibility and nutrient composition of samples that contain insects will need to be
studied. Therefore, two additional objectives of this dissertation are:
2) To develop a method for longitudinal cecal micriobiome studies in chickens.
3) To develop a more accurate method to analyse the protein content in samples that contain insects and
therefore chitin.
To make alternative ingredients applicable in the industry, information about the productivity of
chickens is crucial. Therefore, the last aim is:
4) To investigate the flexibility of chickens to perform on a less concentrated diet


Chapter 3
Review on the diet of free-ranging
chickens in developing countries


CHAPTER 3
- 37 -
Review on the diet of free-ranging chickens in developing countries
J. Pauwels, F. Coopman, J. W. Ng’ambi and G. P. J. Janssens
Submitted at International Journal of Agricultural Sustainability
Abstract
Rural chicken owners can often not afford to feed grains to their chickens. Industrialized chicken
production, moreover, is highly competitive for grain feed that might be used directly for human food.
To increase the production of rural chickens in a sustainable way and to decrease the feed-food
competition, identifying alternative feed resources offers opportunities. Observing the free-choice diet
of free ranging chickens draws attention to new ingredients and explains how these ingredients steer
the nutrient profile. A literature survey was made on free ranging chickens and the overall nutrient
composition of the crop content was compared with an average commercial diet. A wide variety of
ingredients was found in the crops. The average commercial diet was lower in crude fibre, higher in crude
protein, Ca, P and energy and tended to be higher in ether extract compared to the free-range diets. In
the crops of free ranging chickens, cereals and seeds were the most abundant ingredients. The amount
of seeds was positively correlated with the crude fibre content.

CHAPTER 3
- 38 -
Introduction
The competition for cereals between feed, food and fuel is a current issue (Donohue and Cunningham,
2009; Foley et al., 2011). While most of the produced cereals are acceptable for human consumption,
one to two thirds (globally and in developed countries respectively) end up in livestock feed (Erb et al.,
2012). About 75% of the broilers’ diet and 65% of the laying hens’ diet is estimated to be consumable by
mankind as the global average diet of a chicken is estimated to contain more than 60% of cereals (Hendy
et al., 1995; Gerber et al., 2007; Wilkinson, 2011).
For broilers in the USA, it is estimated that converting chicken feed to chicken meat reduces the human-
edible energy and protein with 72% and 38% respectively. In South-Korea, however, the human-edible
protein and energy content in poultry meat is higher than the feed consumed by the chickens due to the
use of human-inedible feed (Gill et al., 2010; Teja Tscharntke et al., 2012). This raises the question why
feed consumption of domesticated animals has shifted to food-grade ingredients. Especially since many
of them descend from animals feeding on a wide variety of ingredients (Arshad et al., 2000).
In low income countries, 70 to 95% of all chickens are slow growing (Huque, 1999; Pym, 2008) and self-
reliant to find feed (Savory et al., 1978). Knowledge about the feed resources of free ranging chickens
and the concomitant dietary nutrient profile will identify potential feed ingredients that do not compete
with the human diet and are available in the environment of the chickens. In addition, information about
how the ingredients in a free-range diet steer the nutrient profile will be achieved and this nutrient
profile will be compared to a standard commercial diet.

CHAPTER 3
- 39 -
Material and methods
Google Scholar was searched for articles evaluating the ingredients and nutritional composition in the
crops of scavenging poultry. Now the keywords included “crop content, gastrointestinal content,
scavenging, scavengeable feed, feeding behavio(u)r, feeding habits, feed resources, free-range or
nutritional status” AND “chickens, poultry, broiler, hen, guinea fowl, junglefowl or jungle fowl”. Only
articles where the entire crop content was analyzed for ingredients and/or nutritional composition and
with free feed-choice for the chickens were taken into account. It was decided to pool the results of
different genotypes and different regions. Datasets in the same study but obtained from different
seasons were considered separate datasets.
Secondly, a database was created based on twenty basal diets described in peer reviewed articles found
on Google Scholar using the keywords “commercial, control, base, industrial and standard” in
combination with “diet, feeding or feed AND poultry, broiler(s), laying hens or chicken”. Broilers and
laying hens were equally represented in the studies. For laying hens, the diets for chickens older than
eighteen weeks were used, based on the ages of the free ranging birds in the reviewed articles. Since
the maturation rate of commercial broilers differs from the rural dual purpose breeds, the industrial
diets for broilers in the grower phase were considered, although the free ranging broilers are estimated
to be older than 35 days.
When crude protein (CP), ether extract (EE), crude fibre (CF) and crude ash (CA) were given, nitrogen-
free extract (NFE) was calculated as: 100 ( )NFE CP EE CF CA (with CP, EE, CF and CA
presented as a percentage of dry matter (DM)).
In order to calculate the correlations with the nutrients, the ingredients found in the crops of the free-
ranging chickens were separated in two groups: supplemented and environmental feed. Supplemented
feed covers: oil seeds and cakes, brew wastes, kitchen wastes, cereal bran and cereals. Environmental
feeds covers: tree, grass and fruit seeds, green forages, invertebrates, and sand and grit. Correlations
between the nutrients and the ingredients in the crop contents were calculated using Spearman
correlation. Nonparametric one-way Kruskal-Wallis rank test and the Dunn post hoc test were used to
find the differences in nutrient composition between the commercial broiler and laying hen diets and
the crop contents of the free ranging chickens (SPSS 22.0, IBM SPSS Statistics Inc., USA).

CHAPTER 3
- 40 -
Results
Twelve studies (representing twenty-six datasets) on the crop content of free ranging chickens were
withheld from the selection (Table 3.1.). Fourteen other studies matching the keywords were found but
did not match our selection criteria (see Appendix 3).
The nutritional comparison of the commercial diets (references listed in Appendix 4) with the crop
contents of free ranging chickens revealed no differences between the three diets for ether extract,
crude ash, phosphorus and NFE concentrations (P > 0.05). The ME level was higher in the broiler diet
compared to the free-range diet (P = 0.010). The Ca concentration was higher in the diet of the laying
hens compared to the free-range diet (P = 0.002). Crude fibre was highest in the free-range diet
compared to the broiler diet (P = 0.012) and tended to be higher than the diet of the laying hens (P =
0.052). The free-range diet had an overall lower CP concentration (P ≤ 0.005) compared to both
commercial diets (Figure 3.1.).
When the nutrient compositions of both commercial diets were put together as one average commercial
diet and compared to the free-range diets, the commercial diet was higher in crude protein (18.6 ± 2.1
versus 11.0 ± 2.7%; P < 0.001), Ca (2.3 ± 1.4 versus 1.1 ± 1.0 %; P = 0.002) and energy (12.6 ± 1.1 versus
11.6 ± 1.6 MJ/ kg; P = 0.031), it tended to be higher in ether extract (4.5 ± 2.3 versus 6.2 ± 2.4%; P =
0.050) and P (0.5 ± 0.2 versus 0.4 ± 0.2%; P = 0.050) and was lower in crude fibre (4.1 ± 1.6 versus 7.5 ±
2.4%; P < 0.001).

CHAPTER 3
- 41 -
Table 3.1. Articles used in the literature review.
Article Country Sample size Age and type of
chickens Period
(Dahouda et al., 2008)
Benin 120 guinea fowls 8-12 months dry and rainy season
(Dessie and Ogle, 2000)
Ethiopia 270 chickens laying birds, 7-8
months dry, short rainy and
main rainy
(Goromela et al., 2008)
Tanzania 648 chickens not indicated dry and rainy season
(Gunaratne et al., 1993)
Sri Lanka 375 chickens Chicks, pullets,
cockerels and laying hens
Not indicated
(Huque, 1999) Bangladesh 500 chickens laying hens dry season (= winter
& summer) and rainy
(Mekonnen et al., 2009)
Ethiopia 208 chickens
104 layers, >1 cycle 104growers, 3-5
months
harvesting and non-harvesting
period
(Minh et al., 2006)
Vietnam 384 chickens
dual purpose 20 weeks (point-of-
lay) dry and rainy season
(Momoh et al., 2010)
Nigeria 158 chickens 54 layers, >26 weeks
104growers, 3-5 months
early rainy, late rainy,
early dry and late dry
(N. a Mwalusanya et al., 2002)
Tanzania
144 chickens
72 hens, >1 laying cycle
72 growers, 2-4 months
short rainy and long rainy
(Peters et al., 2010)
Nigeria
120 chickens
3 genotypes dual purpose11 >1 breeding cycle
dry season
(Pousga et al., 2005)
Burkina Faso
128 chickens
dual purpose, 5-6
months dry and rainy season
(Rashid et al., 2005) Bangladesh 100 chickens 50 layers, >26weeks
50 growers, 3-5 months
harvesting period

CHAPTER 3
- 42 -
Figure 3.1. Nutrient composition of three diets: commercial broiler, commercial laying hen and free-range diet. Crude protein
(CP), ether extract (EE), crude fibre (CF), Ash, Ca, P and NFE (nitrogen-free extract) are presented as percentages (10g/ kg).
Error bars represent standard deviations. a,b Different letters indicate significant differences between groups at P < 0.05. Based
on Table 3.1. and Appendix 4.
Based on the literature review on the crop content of scavenging chickens these ingredients were found
(n is the number of studies out of 26 that reported the ingredient). Grains (median: 34%; n=17) and tree,
grass and fruit seeds (median: 28%; n=8) were predominantly found in the crops of free ranging chickens,
followed by kitchen waste (median: 18%; n=19), cereal bran (median: 14%; n=6) and green forages
(median: 10%; n=22). Oil seeds and cakes (7%; n=2), invertebrates (insects, millipedes and worms)
(median: 6%; n=20), sand and grit (median: 5%, n=6), eggshells (median: 4%; n=2), bones (median: 4%;
n=2), beans (median: 1%; n=3), nuts (median: 1%; n=4) and brew wastes (median: 3%; n=4) were also
reported.
In the literature database, season did not affect the ingredients or any of the nutrients found in the crop
content of free ranging chickens (all of them P > 0.05). Therefore all results were reorganized together
in one large dataset. Correlations between ingredients and nutrients were calculated (Table 3.2.). A
negative correlation was found between the proportion of environmental feed and the concentration of
dry matter (r = - 0.410; P = 0.038; n = 26) in the crops of free ranging chickens.

CHAPTER 3
- 43 -
Table 3.2. Correlations between ingredients and nutrients in the crop content of free ranging chickens.
Ingredient Nutrient P-value of
correlation r N
Supplemented
ingredients Kitchen waste ↑ Ca ↑ 0.010 0.575 19
Environmental
ingredients
Seeds ↑ CF ↑ 0.004 0.881 8
Green forages ↑ DM ↓ 0.007 -0.558 22
Ca ↑ 0.026 0.472 22
Insects, millipedes
and worms ↑
DM ↓ 0.009 -0.567 20
Ca ↑ 0.044 0.454 20
Ash ↓ 0.047 -0.475 18
The nutrients are represented as dry matter (DM), crude fibre (CF), crude ash (Ash) and Ca. Based on (Gunaratne et al., 1993;
Huque, 1999; Dessie and Ogle, 2000; N. a Mwalusanya et al., 2002; Pousga et al., 2005; Rashid et al., 2005; Minh et al., 2006;
Dahouda et al., 2008; Goromela et al., 2008; Mekonnen et al., 2009; Momoh et al., 2010; Peters et al., 2010).
Discussion
Large differences appeared among the crop contents in the different studies. In general, kitchen or
household wastes and grains represented a big part of the reviewed crop contents, suggesting that the
larger share of the free-range diet was provided by humans. Nonetheless, conclusions must be made
carefully as chickens are known, for example, to pick the remaining grains from cattle litter and manure
(Faouzi et al., 2000). The same applies to animal bones, found in the crop content of non-supplemented
red jungle fowls (Arshad et al., 2000). Chickens have been observed to consume birds caught by cats and
even to catch and kill birds themselves (McBride et al., 1969). Another abundant ingredient was seeds.
The amount of seeds was positively correlated with the concentration of CF but this did not stop the
chickens from ingesting them, though, chickens are known to extract only a negligible amount of energy

CHAPTER 3
- 44 -
from NSP (Jørgensen et al., 1996). This is in line with the study where the growth of slow growing
chickens was not hampered by high dietary fibre levels (Pauwels et al., 2015). Insects, millipedes and
worms represented only a smaller share in the crop contents of free ranging chickens, yet four out of
five studies reported their presence. Arshad et al. (2000) indicated that most of the invertebrates found
in the red jungle fowls’ crops could not fly and therefore could easily be caught by the fowls. Olukosi and
Sonaiya (Olukosi and Sonaiya, 2003) only used the number of crawling insects to predict the quantity of
scavengeable feed for poultry. Nevertheless, McBride et al. (1969) observed chickens to chase and catch
flying insects.
Cereals often make up the bulk of the crop content. When comparing the free-range with the
commercial diets, human interference induced a shift from a fibrous, low-protein and low-energy diet
to a low-fibre, high-protein and energy-rich diet. One could assume that this shift is mainly due to the
higher energy and nutrient demands of the high-performance commercial breeds, but the phenomenon
is already seen when people start supplementing rural scavenging chickens. This raises a “chicken or
egg” question: is the actual nutrient and energy profile of feeds for commercial breeds a consequence
of the increased requirements for fast growth or high egg production, or did these breeds develop based
on the diet change that was induced by humans?
No correlation between any of the ingredients and NFE could be found. Although it would have been
interesting to evaluate the differences in starch and sugar versus more fibrous components within NFE
between the commercial and the free-ranging diets. These analyses were not reported in the studies
reviewed. The analysis of NFE should not be considered sufficient to estimate the nutritional value of
this fraction for chickens, because the sub fractions contained in NFE can range from enzymatically
digestible nutrients such as sugars and starch up to more fibrous components such as pectin in plants
(Saura-Calixto et al., 1983; Malathi and Devegowda, 2001; Weurding et al., 2001).
Since CF is accepted to be of low energy value to chickens (Jørgensen et al., 1996), it is kept low in the
commercial diets and enzymes like xylanase are often added to break non-starch polysaccharides down
(Choct, 2006). Both positive and negative effects of CF on the digestibility of other nutrients have been
shown (Jørgensen et al., 1996; Hetland et al., 2004). Apart from digestibility, CF in the diet also decreases
cannibalism, proventricular dilatation and mortality due to ascites (Jones and Taylor, 2001; Hetland et

CHAPTER 3
- 45 -
al., 2004). The idea of keeping chickens away from fibre-rich diets might thus have to be revised. It
appears that scavenging chickens do not avoid fibrous components, hence they might have developed a
way to deal with the intake of high-fibre low-energy diets. A higher fibre digestibility has been found in
slow growing chickens (Label Rouge) compared to fast growing chickens (Cobb) (Kras et al., 2013).
Because of the lack of energy and nutrients in soil and sand, it might be concluded that this should be
avoided when feeding commercial breeds. However, an average of 5.8% sand and grit has been found
in the crop of free ranging chickens, indicating the importance of this ingredient in the diet of chickens.
Gull et al. (2014) linked geophagia – the intended ingestion of soil and sand – to the provision of minerals,
detoxification and other applications. Only six out of twenty-six datasets reported the presence of sand
and grit, but this ingredient is expected to be often included in the fractions “others” or “undefined”.
Rather than absolute numbers, concentrations of nutrients and ingredients in the crop content of free
ranging chickens were reported which might explain that no effect of season on the crop composition
was found. In contrast, farmers in Ethiopia noted that feed was more available in the dry season (Desta
and Wakeyo, 2012) and a study in Burkina Faso stated that supplementing the diet at the end of the
rainy season was not necessary (Kondombo et al., 2003). Several other factors such as age (Savory et al.,
1978), sex (Arshad et al., 2000), genotype (Minh et al., 2006) and supplemented diet (Horsted et al.,
2007) have been mentioned to affect the crop composition of free ranging chickens.
The difference in energy content of the commercial diets and the free-range diet must be interpreted
carefully. Many studies on the crop content of free ranging chickens calculated ME by using the Wiseman
formula (Wiseman, 1987) though this formula uses a constant factor of 3951, based on an average for
commercial diets containing high starch contents. This might induce an overestimation of ME in free-
range diets. Moreover, although the ME level per kg can be similar between both commercial and the
free-range diet, this is still no absolute number as no information about the ingested amount of feed per
day is given. Research on the absolute amount of nutrients ingested should add extra information on
top of the reported nutrient concentrations and can correct comparison between nutrient intake of
industrial and free-range chickens.
Finally, only two studies about the crop content of non-supplemented fowls are available up to now
(Savory et al., 1978; Arshad et al., 2000). Further research into the feed choice and habits of wild

CHAPTER 3
- 46 -
Galliformes can, however, provide important information about their nutrient demand and the
ingredients they select to meet those requirements.
Conclusion
Human interference led to less fibre and more protein and energy in the diet of chickens. Based on
available literature, the NFE fraction seems not affected, but a more detailed fibre and carbohydrate
analysis should evaluate if important differences exist in the contents of enzymatically digestible
carbohydrates such as starch. Insects and other invertebrates are found in the majority of free ranging
chickens. Seeds rich in non-starch polysaccharides are of low value to the human diet but many appear
to be not avoided by chickens, even though correlated with the CF concentration in the diet. The high
diet variety shown by this study is an important feature for further exploration when trying to decrease
the global feed-food competition.


Chapter 4
Case report: diet and management of
free-range chickens in Limpopo,
South-Africa


CHAPTER 4
- 51 -
Case report: diet and management of free-range chickens in Limpopo, South-Africa
J. Pauwels, J.W. Ng’ambi and G.P.J. Janssens
Abstract
Although rural chickens are an important source of income and protein for many people on our planet,
little information about their management and diet is available. In order to identify ways of increasing
the profit for chicken owners, a concrete view about the diet and management of free-ranging chickens
is necessary. This trial was performed as a case study in Limpopo, South-Africa. Fifty seven people were
questioned about the management of their chickens and the crop content of thirty two chickens was
analysed. The results of the questionnaire show that a minimum of money, time and effort is put into
the chickens. Both scavenged and supplemented feed is necessary for the chickens to survive. The main
reasons for death among the chickens, besides slaughter, are predation and disease. In the chickens’
crop, many different and often large ingredients were found. It is estimated, based on numbers both
from the questionnaire and literature, that about SAR170 per month could be made by selling the
chickens and not changing the management. To improve the profit, the chicken owners should focus on
disease prevention and predator protection.

CHAPTER 4
- 52 -
Introduction
Indigenous free-range chickens play an important role in the provision of animal protein, both through
meat and eggs, of rural families in developing countries. As the human rural population is estimated to
count 3.36 billion heads, which equals 46% of the global population, these chickens should be considered
important although their production is low (FAOSTAT, 2015). Exact numbers and accurate information
on the management and production of these indigenous chickens is difficult to obtain (Pym et al., 2006).
In general, these chickens are kept in traditional free-range systems and their management (or the
absence thereof) differs largely from the management that is considered optimal, based on industrial
parameters. Improving the profit for rural chicken owners is often focused on the improvement of
breeds and diet (Mupeta et al., 2000). Indigenous breeds, however, are naturally selected to fit the rural
free-range conditions. As a consequence, they are more resistant to diseases (Minga et al., 2004), care
more for their offspring and their agility increases their chances of surviving predators. In addition, their
meat and eggs are preferred by the local people (Guèye et al., 1997; Guèye, 1998; Sonaiya et al., 1999).
As these rural chickens are from indigenous, slow growing breeds, our study in Chapter 7 suggested that
the quantity of feed, rather than the quality, is the limiting factor for productivity. To determine other
ways to increase the profit for rural chicken owners, without tackling the traditional system, the
chickens’ diet and management was explored. A survey of chicken management was performed among
rural chicken owners in Limpopo, South-Africa and the crop content of 32 of their chickens was analysed.
Limpopo is the poorest province in the country and nearly one out of four people (23.8% in 2010) have
no job (HSRC, 2014). It is therefore suggested that owning chickens can be an important additional
source of income and animal protein.
Material and methods
People were questioned in November 2013 across eleven different villages in Limpopo: Xigalo,
Tsutsumani, Roadhouse, Mafanele, Gandlanani, Jerome, Basani, Nyavani, Hlanganani, Makhasa and
Basopa. The questionnaire was composed in Venda and in English (Appendix 5). One hundred and ten
people were questioned of which fifty-seven owned chickens and therefore answered the complete
questionnaire. Women represented 64% of the chicken owners that were questioned. All hundred and
ten people answered the question “why no (more) chickens were purchased”. The questions were

CHAPTER 4
- 53 -
answered based on a gradual scale. Seven different answers, ranging from “completely disagree” to
“completely agree”, from “nothing” to “whole budget” or from “never” to “constantly”, could be chosen.
Based on this system, the answers could be regarded as continuous and therefore averages and standard
errors could be calculated. Questions on monetary value and time spent were asked to be answered in
South-African Rand (SAR 13.8 to EUR 1 for November 2013 (X-rates, 2013)) or in minutes.
From each of the eleven villages the crops of three female chickens were collected when slaughtered for
consumption. These chickens were raised on a free-range diet. The owners were asked to leave the
chickens outside for scavenging and to not feed them at the day of sampling. The crops were removed
immediately after slaughter and stored at -20°C. Crops were defrosted and their contents were
macroscopically identified and counted. Due to technical limitations in the field, the nutrient
composition of the crop contents was not determined.
Results and discussion
On average, each owner had 8.0 chickens (range 1 to 20) and 11.5 chicks (range 0 to 42). If the
households without chickens were included, the average was 4.1 chickens. This is in accordance to the
average number of 1 to 10 chickens kept in traditional free-range systems in different developing
countries (reviewed by Goromela et al., 2006). More than half of the chicken owners (59%) was
unemployed, which was lower compared to the unemployment rate among all people that answered
the questionnaire (63%). These numbers, however, largely exceed the reported unemployment rate of
Limpopo as reported by HSRC (23.8% in 2010 (HSRC, 2014)) and the overall South-African unemployment
rate as reported by the IMF (24.9% in 2013 (IMF, 2015)). The big differences between these numbers
could be explained by the moment of questioning, which was during the day, and the specific villages
that were questioned.
Within all expenses made on the chickens, feed was indicated to be the most expensive (Figure 4.1.).
This might explain why chickens are mostly fed kitchen leftovers and, to a lesser extent, grains from own
cultivated land. A 1 kg bag of commercial chicken feed was estimated to cost SAR 20 but the owners
indicated to rarely feed this to their chickens (Figure 4.2.). This might explain why the expenses of feed
are not indicated as a reason to limit the flock size (Figure 4.3.). An average of 12 minutes a day was
spent on the chickens (median: 5 min.; range 1 – 120 min/ day).

CHAPTER 4
- 54 -
Figure 4.1. Average indication of how much the rural chicken owners (n = 57) spend on different items for their chickens (±
st. error).
Reducing kitchen waste was the second most important reason for people to keep chickens, the most
important reason was provision of meat for own consumption (Figure 4.3.). Eggs for sale or consumption
seem to be of less importance, which is, in accordance to the literature, because most eggs are bred by
the hens (Pym et al., 2006; Alders and Pym, 2009). Considering that the owners estimate six out of ten
chicks to reach the age of six months, breeding the eggs rather than consuming them might be more
profitable. Especially when those chickens can be reared on kitchen waste and scavenged feed mainly.
The estimated price for an egg was SAR 1.2 and prices for adult hens and roosters were equally estimated
at SAR 37 per chicken. As indigenous free-range chickens produce an average of 40 – 60 eggs per year in
3 – 4 clutches (reviewed by Pym et al., 2006), the chicken owners would only make about SAR 100 a year
by selling the eggs, assuming that the production would increase when the hens do not sit on their eggs.
Based on a an average of six matured hens which produce 40 eggs per year and a survival rate of 60%
for the chicks (which is high compared to the literature (Sonaiya et al., 1999)), a 144 chickens per year
could be sold when leaving the hens to breed their eggs. At a rate of SAR 37 per chicken and an
estimation of 1 kg commercial feed supplementation (SAR 20/ kg) per chicken before they can be sold,
roughly SAR 2000 a year or SAR 167 per month could be earned by selling chickens assuming about SAR
450 per year for unexpected expenses. The food poverty line for South-Africa (amount of money that an
individual will need to consume the required energy intake) is estimated to be SAR 305 per individual
per month.

CHAPTER 4
- 55 -
Figure 4.2. Importance, according to the chicken owners, of different ingredients in the chickens’ diet. Ingredients,
supplemented or from scavenging, are considered (n = 57, ± st. error).
The owners reported that the chickens have access to a lot of space where they scavenge for seeds and
grains, grit, grass and insects. This was confirmed by the huge variety of ingredients that was found in
the crop content of these chickens. In total, nine different ingredients identified as kitchen waste and
nine different invertebrate orders were found (Table 4.1.). Moreover, non-nutritional ingredients, such
as strings and polystyrene foam were also found and were classified as inert material. Ten out of the
thirty-two crops were empty. Only two of the analyzed crops contained corn and no other cereals were
found. This in contradiction to Chapter 3 where cereals are reported to often make up the bulk of the
crop content. Because the owners had been asked not to feed the chickens before sampling, the crop
content might not fully reflect the situation when the chickens were fed, but might reflect better what
the chickens select from real natural feed resources. The owners indicated that both supplemented and
scavenged ingredients are needed by the chickens to survive, but, that chickens nearly never die of
starvation. The main reasons for chickens to die, besides slaughter, were disease and predation. The

CHAPTER 4
- 56 -
most important reason for not keeping (more) chickens was the fact that chicks and chickens often die,
which doubts the estimated survival rates (60%) of chicks. The results indicate that, when trying to
improve the rural chickens’ management, one should focus on animal health and protection against
predators. It is, however, not clear whether larger flocks could still be maintained on scavenged feed and
kitchen waste supplementation only.
Figure 4.3. Reasons to keep chickens and reasons why not to keep (more) chickens (n = 110 and n = 57, ± st. error).

CHAPTER 4
- 57 -
Table 4.1. Different ingredients and the number of crops (n) in which they were present. Results of macroscopic analysis of crop content of scavenging chickens in Limpopo, South-Africa (ntotal = 32, 10 empty crops included).
Ingredient n Ingredient n Ingredient n
Invertebrates
kitchen waste plants Ants 13 pap 18 grass 15 small beetles 6 bone fragments 3 fruits 3 Fly 4 egg shells 2 seeds 1 fly larvae 4 tomato peels 2 undefined 7 fly pupae 1 bread 2 Mosquito 3 fish 2 grains Millipedes 2 white beans 1 corn 2 Ticks 2 spaghetti 1 dung beetle 1 meat 1 sun spider 1 Cockroach 1 Inert material Moth 1 hairs 2 Caterpillar 1 soil 2 Termites 1 grit 1 polystyrene foam 1 string 1
The bodyweight of the average sampled chicken was 1.1 ± 0.3kg. Despite the low bodyweights of some
chickens, large items were found in their crops: an entire dung beetle (3.1 cm) in the crop of a 0.8kg
chicken and an entire sun spider (2.8 cm) in the crop of a 1.1kg chicken (Figure 4.4.). Ticks were found
attached to the crop wall.
Figure 4.4. Complete invertebrates found in the crop content of scavenging chickens

CHAPTER 4
- 58 -
Conclusion
It can be concluded that a minimum of time, money and effort is spent on chickens kept in traditional
free-range system. The chickens mainly have to provide feed for themselves, which they seem capable
of. They, however, need to be supplemented with kitchen waste and grain from own cultivation too. The
regular dying of chickens and chicks was the main reason for chicken owners to not expand their flock.
As the main causes of death were disease and predation, improving the health and the protection of the
chickens should be the focus when trying to improve the management of traditional free-ranging
chickens.
Acknowledgements
Enock Mzamani, David Brown and Caroline Letsoalo, students of the University of Limpopo, are gratefully
acknowledged for their help with collecting the samples. The authors especially thank Dr. John Alabi
Olushola for his contribution to this study.


Chapter 5a
Cecal drop reflects the chickens’ cecal
microbiome, fecal drop does not


CHAPTER 5a
- 63 -
Cecal drop reflects the chickens’ cecal microbiome, fecal drop does not
J. Pauwels, B. Taminiau, GPJ. Janssens, M. De Beenhouwer, L. Delhalle, G. Daube and F. Coopman
Modified from Journal of Microbiological Methods 117 (2015) 164-170
Abstract
Microbiota in the gastro-intestinal tract are closely related to both the intestinal and overall health of
the host. Experimental chickens have always been euthanized in order to identify and quantify the
bacteria in cecal content. In this study, quantification and identification of the microbial populations in
cecal drop, cecal content and fecal drop samples from chickens showed that cecal drop contains a
bacterial community that is very similar (concerning bacterial diversity, richness and species
composition) to cecal content, as opposed to the bacterial community found in fecal drop. Cecal drop
analysis thus allows for longitudinal experiments on chickens’ cecal bacteria. The varying results in the
analysis of fecal samples questions the method’s reliability in reflecting the true cecal microbiota in
chickens.

CHAPTER 5a
- 64 -
Introduction
In the chickens’ gastro intestinal tract (GIT) the number and variety of bacteria is highest in the ceca (1010
– 1011 cells/g) (Barnes et al., 1972; Bjerrum et al., 2006). The cecal microbiome plays an important role
in fermentation processes and production of short chain fatty acids (SCFA) (Patterson and Burkholder,
2003; Rehman et al., 2007). Also, the cecum can host pathogenic and zoonotic bacteria that cause severe
risks to human health (Herman et al., 2003; Zorman et al., 2006).
Chicken ceca are known to have a complex motility. Several times a day the ceca contract, pushing their
content in two directions: towards the ileum and towards the cloaca, excreting a cecal drop (Herrick and
Edgar, 1947; Clench, 1999; Janssen et al., 2009). The ceca fill again by use of peristaltic and antiperistaltic
contractions at their entrances (Fenna and Boag, 1974). Cecal drops have been studied in chickens before
and they were used to detect hazardous bacteria regarding food-safety such as Campylobacter or
Salmonella (Herman et al., 2003; Okamura et al., 2008). An early study (Stern and Robach, 1992)
compared three samples: cecal drop, fecal drop and cloacal swab and found cecal drop to be the most
sensitive sample for the detection of Campylobacter. However, when identifying or quantifying the
complete microbiota of the cecum, cecal drop has, to the best of our knowledge, never been used.
In studies with other animal species, the microbiota in one or more parts of the gastro-intestinal tract
have been investigated through, for example, excreta, fecal or fistula samples (Harmoinen et al., 2001;
De Filippo et al., 2010; Budding et al., 2014). In rabbits, bacteria in the caecotrophes were shown by
denaturing gradient gel electrophoresis to be 71% similar to cecal microbiota (Rodriguez-Romero et al.,
2009). So far, studies on the entire cecal microbiota of chickens have always been based on samples
straight from the cecum, for which chickens had to be euthanized (Bjerrum et al., 2006; Saengkerdsub
et al., 2007; Danzeisen et al., 2011).
From a statistical point of view, the required sample size in longitudinal studies will decrease if cecal
drop is used, this is because the same birds can be re-sampled for every point in time and differences
between individuals will therefore be ruled out. Moreover, from an ethical point of view, the chickens
will not need to be euthanized. The aim of this study is to compare the microbiome of three different
samples: cecal content, cecal drop and fecal drop and to determine whether these samples can be used
as a reference for cecal content and, if so, which of these drops serves as the most effective reference.

CHAPTER 5a
- 65 -
Experimental procedures
Experimental setup
Two hundred and forty male chicks, sixty from each of four different breeds (Cobb 500, Cobb-Sasso 175,
Sasso and Sussex) were placed in pens of fifteen birds each, with breeds randomly designated to pens.
Each pen had a surface of 2 m² and was 75 cm high. The chicks received full vaccinations for Newcastle
disease, infectious bronchitis, coccidiosis, Gumboro disease and Marek’s disease.
Diets
Two groups of each breed were fed a standard commercial diet and the other two groups were fed an
alternate diet containing mealworms (Tenebrio molitor), lucerne and ostrich pellets. Both diets were
analyzed for dry matter, crude ash, ether extract, crude fibre, neutral detergent fibre (NDF), acid
detergent fibre (ADF) and crude protein (Table 5a.1.). Metabolizable energy (ME) was calculated
according to Wiseman (1987). Dry matter and crude ash content were determined by drying the feed to
a constant weight at 103°C and combustion at 550°C, respectively. Diethyl ether extract was analyzed
using the Soxhlet method (ISO, 1973). Crude fibre was determined using the Association of Official
Analytical methods (Association of Official Analytical methods (AOAC), 1995a; Association of official
analytical chemists (AOAC), 1995b). To determine NDF and ADF, the methods of Van Soest et al. (1991)
were used. Crude protein (6.25 × Nitrogen) was determined using the Kjeldahl method (ISO 5983-1,
2005). Water and feed were provided ad libitum. To prevent diarrhea, the chicks fed the alternate diet
received a mix of 1/3 alternate diet and 2/3 commercial diet between day 0 and 5. From day 6 to 10 they
were fed a mix of 2/3 alternate diet and 1/3 commercial diet. From day 11 on, they were fed the alternate
diet only.

CHAPTER 5a
- 66 -
Tabel 5a.1. Nutrient composition of the test diets.
Commercial
diet
Alternate
diet
Dry Matter (g/ kg OM) 902 911
Crude Ash (g/ kg DM) 56 72
Ether Extract (g/ kg DM) 73 43
Crude Fibre (g/ kg DM) 36 130
Acid Detergent Fibre (g/ kg DM) 13 18
Neutral Detergent Fibre (g/ kg DM) 67 68
Crude Protein (g/ kg DM) 215 187
Metabolizable Energy (MJ) 15 10
OM: Organic Matter, DM: Dry Matter. Metabolizable Energy was calculated according to Wiseman (Wiseman, 1987). All other
nutrients were analyzed.
Sampling
Since the chickens were from four different breeds, their growth rates varied. The weekly bodyweight
per pen was used to compose a Gompertz curve (GraphPad Prism 5, GraphPad software, USA). Based on
the inflection point of this curve, a prediction could be made concerning the point in time that the
chickens would achieve their maximum growth rate. In this way chickens were compared at the same
physiological age. At the point of maximal growth for a particular breed-diet combination, the chickens
from that combination were observed closely. The first cecal drop excreted was taken as a sample
immediately after excretion using sterile aliquots and stored in liquid nitrogen. Later (a maximum of 14
minutes), a sample of a freshly excreted fecal drop from the same chicken, was obtained in the same
way. Fecal drop was collected from all but two chickens in the designated timeframe. Directly after the
collection of both excretions, the chicken was euthanized with an intravenous injection of 1ml sodium-
pentobarbital (Release®, 300mg/ml), the GIT was dissected and a sample of cecal content was taken
using a sterile aliquot and stored in liquid nitrogen. At the end of the day, the samples were stored at -
80°C.

CHAPTER 5a
- 67 -
DNA extraction
Bacterial DNA was isolated from each sample using the QIAamp DNA Stool minikit (Qiagen, Venlo, the
Netherlands), following the manufacturer’s recommendations. The DNA was eluted into DNAse/RNAse-
free water and its concentration and purity were evaluated by optical density using the NanoDrop ND-
1000 spectrophotometer (Isogen, St-Pieters-Leeuw, Belgium). DNA samples were stored at -20 °C until
use in 16S rDNA amplicon pyrosequencing analysis.
16S rDNA gene library construction and pyrosequencing
16S PCR libraries were generated with the primers E9-29 and E514-530, specific for bacteria (Wang and
Qian, 2009). The oligonucleotide design included 454 Life Sciences’ A or B sequencing titanium adapters
(Roche Diagnostics, Vilvoorde, Belgium) and multiplex identifiers (MIDs) fused to the 5’ end of each
primer. The amplification mix contained 5 U of FastStart high fidelity polymerase (Roche Diagnostics,
Vilvoorde, Belgium), 1x enzyme reaction buffer, 200 µM dNTPs (Eurogentec, Liège, Belgium), 0.2 µM of
each primer and 100 ng of genomic DNA in a volume of 100 µl. Thermocycling conditions consisted of a
denaturation step at 94 °C for 15 min followed by 25 cycles of 94 °C for 40 s, 56 °C for 40 s, 72 °C for 1
min and a final elongation step of 7 min at 72 °C. These amplifications were performed on an Ep Master
system gradient apparatus (Eppendorf, Hamburg, Germany). The PCR products were run on a 1% agarose
gel electrophoresis and the DNA fragments were extracted and purified using the SV PCR purification kit
(Promega Benelux, Leiden, the Netherlands). The quality and quantity of the products were assessed
using a Picogreen dsDNA quantitation assay (Isogen, St-Pieters-Leeuw, Belgium). All libraries were run in
the same titanium pyrosequencing reaction using Roche MIDs. All amplicons were sequenced using the
Roche GS-Junior Genome Sequencer instrument (Roche, Vilvoorde, Belgium).
16S rDNA data processing
The 16S rDNA sequence reads were processed using the MOTHUR software package (Schloss et al.,
2009). The quality of all the sequence reads was denoised using the Pyronoise algorithm implemented
in MOTHUR and filtered according to the following criteria: minimal length of 425 bp, an exact match to
the barcode and 1 mismatch allowed to the proximal primer. The sequences were checked for the
presence of chimeric amplifications using Uchime (Edgar et al., 2011). The resultant read sets were
compared to a reference dataset of aligned sequences of the corresponding region derived from the

CHAPTER 5a
- 68 -
SILVA database of full-length rDNA sequences (http://www.arb-silva.de/) implemented in MOTHUR
(Pruesse et al., 2007). The final reads were clustered into operational taxonomic units (OTUs) with the
nearest neighbor algorithm using MOTHUR with a 0.03 distance unit cutoff. A taxonomic identity was
attributed to each OTU by comparison with the SILVA database (80% homogeneity cutoff). As MOTHUR
is not dedicated to taxonomic assignment beyond the genus level, all unique sequences for each OTU
were compared to the SILVA dataset, version 111, using the BLASTN algorithm (Altschul et al., 1990). For
each OTU, a consensus detailed taxonomic identification was given based upon the identity (less than
1% of mismatches with the aligned sequence) and the metadata associated with the most frequent hits
(validated bacterial species or not).
Statistical analysis
Subsampled datasets were obtained and used to evaluate the richness and microbial diversity of the
samples using MOTHUR. To capture the multidimensionality of biodiversity, various indices of diversity
and community composition were calculated and compared. Rarefaction curves (Colwell and
Coddington, 1994), microbial biodiversity (Simpson and non-parametric (NP) Shannon diversity index –
(Chao, 2003)), richness estimators (Observed species richness (Sobs) and Chao1 estimator – (Chao and
Bunge, 2002)) and bacterial evenness were calculated for each sample. Simpson and the NP Shannon
index give an estimated index value for diversity. NP Shannon is used when undetected species are
present in a sample. Simpson diversity was calculated to measure the probability that two individuals,
randomly selected from a sample will belong to the same species. The Chao1 estimator is used to
estimate the richness of the detected species (OTUs in this case) in a sample and can be compared to
the actual number of OTUs observed in samples. Sobs was determined as the number of OTUs present
per sample. Evenness was determined to quantify the similarity between samples numerically (Colwell
et al., 2012).
Analysis of molecular variance (AMOVA) was performed to compare the genetic diversity between two
populations with the genetic diversity that would result from pooling both populations. Additionally,
nonmetric multidimensional scaling (NMDS) was used to visualize possible differences in the bacterial
communities. The ordination was run in PC Ord (5.0) using the Sørensen distance measure, with six
starting dimensions, 40 iterations and an instability criterion of 10-5 (McCune and Mefford, 2006). Also

CHAPTER 5a
- 69 -
UniFrac was used to calculate distance measures in bacterial communities between sample origins using
phylogenetic information (Lozupone and Knight, 2005).
Because three samples were taken from each chicken, we included ‘chicken’ as a random factor in all
models to account for pseudoreplication. Moreover, diet and breed could be expected to affect the
bacteria in the cecum (Shakouri et al., 2009; Stanley et al., 2012). To analyze the effect of variation by
both factors on the difference between the microbiota in cecal content and cecal drop on the one hand
and cecal content and fecal drop on the other hand, different mixed models were run. In the first one,
cecal content and cecal drop were considered whereas in the second one, only cecal content and fecal
drop were taken into account. All first order and two-way interactions between the different variables
were tested in a full model. For the final models, the F and P-values of the explanatory variables were
reported in accordance with Murtaugh (Murtaugh, 2014).
Biosample accession numbers
All the biosample sequences were deposited at NCBI (http://www.ncbi.nlm.nih.gov) and are available
under the BioProject ID: PRJNA287778.
Results
The day of maximal growth, and therefore the day of sampling, was different for each breed-diet
combination (Table 5a.2.).
Table 5a.2. Day of maximal growth rate for four chicken breeds fed a commercial or alternate diet
Breed Cobb CobbSasso Sasso Sussex
Diet C A C A C A C A
Age of sampling 43d 49d 45d 50d 53d 54d 57d 60d
C: commercial diet; A: alternate diet
Across all samples analyzed, a total number of 6667 OTU’s were found, belonging to ten different phyla.
Firmicutes appeared to be the most abundant phylum in the three samples with a higher level (P < 0.01)
in fecal drop compared to both cecal content and drop. The second most abundant phylum was the one
of the Bacteroidetes in cecal content and cecal drop and Proteobacteria in fecal drop. Bacteroidetes were
less abundant (P < 0.001) in fecal drop compared to the other two samples. No differences in levels of

CHAPTER 5a
- 70 -
Proteobacteria could be found between the three samples. Actinobacteria were low in abundance, but
still their level was higher (P < 0.001) in the fecal samples compared to the cecal samples (Figure 5a.1.).
Figure 5a.1. Abundance of the phyla Actinobacteria, Bacteroidetes, Firmicutes and Proteobacteria in the three samples: cecal
drop, cecal content and fecal drop (with **: P < 0.01 and ***: P < 0.001). Overall results for the four chicken breeds and both
diets, commercial and alternate (n = 14 for cecal drop and cecal content, n = 12 for fecal drop).
Four of the most abundant genera (Alistipes, Bacteroides, Lachnospiraceae and Ruminococcaceae
unclassified genera) were more abundant (P < 0.001; P < 0.01; P < 0.001 and P < 0.001 respectively) for
both cecal content and cecal drop compared to fecal drop. In contrast to four other abundant genera
(Enterococcus, Gallibacterium, Peptostreptococcaceae unclassified genus and Lactobacillus) where the
level was higher (P < 0.01; P < 0.05; P < 0.001 and P < 0.001 respectively) in fecal drop. The abundance
estimates of these eight genera did not differ between cecal content and cecal drop (Figure 5a.2.). The

CHAPTER 5a
- 71 -
relative abundance of the most common genera (cut-off is 3%) in the three samples: cecal drop, cecal
content and fecal drop are presented (Figure 5a.3.).
Figure 5a.2. Abundance of bacterial genera in three different samples: cecal drop, cecal content and fecal drop (with *: P <
0.05; **: P < 0.01 and ***: P < 0.001). Overall results for the four chicken breeds and both diets, commercial and alternate (n
= 14 for cecal drop and cecal content, n = 12 for fecal drop).

CHAPTER 5a
- 72 -
Figure 5a.3. Relative abundance of most common bacterial genera in cecal drop, cecal content and fecal drop (in %). All
genera with an abundance > 3% are presented (n = 14 for cecal drop and cecal content, n = 12 for fecal drop).

CHAPTER 5a
- 73 -
Diversity
Analysis of molecular variance (AMOVA) indicates a genetic diversity between the bacterial populations
found in fecal drop and in cecal content (P < 0.001). The same applies for the comparison between fecal
drop and cecal drop (P < 0.001). The genetic diversity within the bacterial populations found in cecal
drop and cecal content did not differ from the genetic diversity when pooling both populations (P =
0.917).
Observed Species Richness (Sobs) and Chao1 analysis showed a significantly (P ≤ 0.002 for both) lower
richness in fecal drop compared to cecal drop and cecal content (Table 5a.3). Between cecal content and
cecal drop, no significant difference in bacterial richness in species level could be found (P = 0.902 for
Sobs and P = 0.878 for Chao1).
Bacterial diversity in species level was tested by NP Shannon and Simpson analyses. Both analyses
showed a lower (P ≤ 0.001) diversity in fecal drop compared to cecal drop and cecal content (Table 5a.3.).
Between cecal content and cecal drop, no significant difference in bacterial diversity in species level (P
= 0.805 for NP Shannon and P = 0.945 for Simpson) could be found.
Table 5a.3. Mean and standard deviation of the different diversity estimates for three samples: cecal
drop, cecal content and fecal drop
cecal drop cecal content fecal drop Sig.
Sobs 260 ± 60 a 271 ± 46 a 138 ± 94 b < 0.001
Chao1 387 ± 91 a 407 ± 105 a 225 ± 133 b < 0.001
Simpson 0.06 ± 0.07 a 0.04 ± 0.02 a 0.3 ± 0.3 b < 0.001
NP Shannon 4 ± 0.7 a 4 ± 0.3 a 3 ± 1 b < 0.001
Evenness 0.7 ± 0.1 a 0.8 ± 0.05 a 0.5 ± 0.2 b 0.002
Different superscripts (a and b) indicate significant differences using the post hoc Tukey test in the linear mixed model.

CHAPTER 5a
- 74 -
Community composition
The Weighted UniFrac of the three samples in species level indicated a similar population structure
between cecal drop and cecal content (W-Score: 0.37, P < 0.001). The analysis for fecal drop compared
to cecal drop and to cecal content showed a higher W-Score (0.85 and 0.89 respectively, P < 0.001 for
both) indicating a different population structure between fecal drop and both cecal drop and cecal
content.
The community composition was further compared with NMDS analysis over two axes since 96% of the
variation could be explained by two axes (NMDS1 and NMDS2). For NMDS1 no difference (P = 0.170)
could be found between cecal content and cecal drop, but both cecal content and cecal drop differed
significantly (P < 0.001 for both) from fecal drop. The same situation was found for NMDS2, with no
difference (P = 0.497) between both cecal content and cecal drop and a significant (P < 0.001 for both)
difference between both cecal samples and fecal drop (Figure 5a.4.).
Figure 5a.4. NMDS analysis for three samples: cecal drop, cecal content and fecal drop, over two axes (n = 14 for cecal drop
and cecal content, n = 12 for fecal drop).

CHAPTER 5a
- 75 -
Variation by breed and diet
Linear mixed models indicated that the similarity between cecal content and cecal drop regarding
diversity estimates and community composition was retained when variation was created in the cecal
microflora by diet and/or breed. No significant difference in bacterial richness between cecal content
and cecal drop was found, neither by Sobs nor by Chao1-analysis (P = 0.641 and P = 0.544 respectively).
For Sobs, no interaction between any of the factors or significant effect by breed or diet was found (P >
0.05). For Chao1, a significant interaction between breed and diet was found (P = 0.015). In addition,
Simpson, NP Shannon and Evenness analyses never showed a significant difference between cecal
content and cecal drop regarding bacterial diversity (P = 0.305; P = 0.280 and P = 0.218 respectively). The
linear mixed models for Simpson, NP Shannon and Evenness, showed no interaction between any of the
factors (P > 0.05). Regarding the community composition, no difference between cecal drop and cecal
content could be found for NMDS1 or NMDS2 (P = 0.138 and P = 0.102 respectively). Both breed and
diet affected the NMDS2 values (P < 0.001 and P = 0.001 respectively), no interactions were found (P >
0.05).
Linear mixed models, analyzing the data concerning cecal content and fecal drop, showed significant
interactions between sample and diet for both bacterial richness analyses: Sobs and Chao1 (P = 0.008 and
P = 0.005). NP Shannon showed a significant interaction (P < 0.001) between sample and diet on bacterial
diversity. Breed was not found to have an effect (P > 0.05) on Sobs, Chao1 or NP Shannon estimates. For
Simpson and Evenness analysis, an interaction between diet and sample (P = 0.004 and P = 0.001
respectively) and breed and sample (P = 0.026 and P = 0.039 respectively) was found regarding bacterial
diversity. The means of all diversity and richness estimates indicated a greater diversity for cecal content
compared to fecal drop and for the alternate diet compared to the commercial diet. Regarding the
community composition, a significant interaction between diet and sample was found for both NMDS1
(P = 0.009) and NMDS2 (P = 0.002). For NMDS2, a significant effect of breed was found (P = 0.004)
without interaction with sample or diet.

CHAPTER 5a
- 76 -
Discussion
In literature, the use of fecal samples as a reference for the gut microbiota in different species is still
under discussion. Three different kinds of studies can be distinguished: the first group of studies consider
fecal samples to be a reliable sample in quantifying and identifying the bacteria in the gut (Claesson et
al., 2011), the second group limits the use of fecal samples to monitoring shifts in the microbiota of the
gut (Mai et al., 2004; Lubbs et al., 2009) and the last group considers fecal samples to be of limited use
as a reference for the gut microbiota (Eckburg et al., 2005; Mentula et al., 2005). In our study, fecal drop
showed a bacterial diversity, richness and community composition that is low compared to cecal
content. This suggests that a fecal sample is not reliable in mapping the complete cecal microbiome in
chickens. In addition, the interactions between the factors, sample and diet, were significant for all
diversity estimates as well as community estimates, which indicate a different effect of changing diet on
the two samples, cecal content and fecal drop. This shows that fecal drop, under the circumstances
tested, cannot be considered as a reliable sample to monitor shifts and changes in cecal content.
Cecal drop showed a very similar bacterial diversity and richness and a similar community composition
when compared to cecal content. Even when variation by breed and diet was created, no differences
could be found in the bacterial community or diversity patterns. These results make cecal drop the best
alternative (as a sample unaffected by variation) to monitor the cecal microbiota. This alternative creates
an advantage in longitudinal studies since, by use of cecal drop, the same birds can be re-sampled for
every point in the time and no correction for individual differences will be required. This will significantly
reduce the number of animals needed in trials. In addition, the chickens don’t have to be euthanized at
the end of the experiment, which will refine the method used in terms of animal welfare. As such, the
use of cecal drop analysis will therefore improve two of the three R’s (Reduction, Refinement and
Replacement) that increase humanity in experiments with animals (Russell and Burch, 1959). In the
poultry industry, cecal drop analysis can be used to screen for pathogenic and/ or zoonotic bacteria in
the cecum without the need for killing animals to attain cecal content. In addition, this sample will
represent the cecal bacteria in a more reliable way than fecal drop analysis.
The alternate diet showed an increase in bacterial diversity and a change in the community composition
compared to a standard commercial diet (indicator genera are presented in Chapter 5b). It is, however,

CHAPTER 5a
- 77 -
not clear whether these changes in bacterial diversity and community composition, caused by the diet,
also affect functions such as digestive capacity, immunity or gut health.
Cecal content was sampled by separating ileum and cecum and emptying the cecum into an aliquot by
squeezing the content from the top of the cecum towards the opening. It must be considered that the
sample might, for example, not have included (all of) the mucosa-associated bacteria. Also, by opening
the ileocecal junction and squeezing the content out, contact with oxygen could not be avoided.
However, this was only for a few seconds, aliquots were closed and stocked in liquid nitrogen
immediately. The method of sampling might have resulted in differences in the microbiome in the cecum
and the bacteria in the sample of cecal content.
When using cecal drop to map the cecal microbiota, numbers must be considered carefully since
facultative anaerobic bacteria tend to overgrow the strict anaerobic bacteria. Lactobacillus,
Peptostreptococcaceae, Enterococcus and Gallibacterium -all facultative anaerobic bacteria, except for
some obligate anaerobic Peptostreptococcaceae- increased their concentrations when voided as a cecal
drop compared to their concentrations in cecal content. However, except for the
Peptostreptococcaceae, these increases did not change the overall profile. This is in contradiction to the
concentrations of the facultative anaerobic bacteria found in fecal drop, being four to seventy times
higher compared to that found in cecal content. This could be explained by the longer storage of the
feces in the cloaca and by the stickier content of the cecal drop compared to fecal drop, which makes it
much more difficult for oxygen to penetrate (Lombardo et al., 1996; Clench, 1999). The concentrations
of the strict anaerobic bacteria, Ruminococcaceae, Lachnospiraceae, Alistipes, Bacteroides and
Clostridiales in cecal content compared to cecal drop were very similar. Though, lower concentrations
were found in fecal drop for each of them, indicating that they were overgrown.
Conclusion
The bacterial diversity and community composition in fecal drop differs from cecal content for all
analyses performed, indicating that fecal drop is an unreliable reference for mapping the cecal
microbiota. In addition, the microbiota in fecal drop changed in a different manner compared to the
microbiota in cecal content when variation was created by diet and breed. This indicates that fecal drop
is not reliable in representing shifts in the cecal microbiome either. Regarding bacterial diversity and

CHAPTER 5a
- 78 -
community composition, no differences could be found between cecal drop and cecal content, indicating
that cecal drop analysis is a good reference for monitoring the microbiota in the cecum. This will reduce
the sample size in longitudinal studies considerably and alleviates the necessity to correct for inter-
individual differences.
Acknowledgements
The authors sincerely thank Herman De Rycke and Ruben Van Gansbeke for their technical assistance.
This study was funded by the VLIR-UOS. Vanessa Van Schoor is acknowledged sincerely for proofreading
this manuscript.


Chapter 5b
Domestication of the chickens’ cecal
microbiome: commercial versus
scavenger diet


CHAPTER 5b
- 83 -
Domestication of the chickens’ cecal microbiome: commercial versus scavenger diet
J. Pauwels, M. De Beenhouwer, G.P.J. Janssens and F. Coopman
Abstract
Prebiotic effects are attributed to some fibres (reviewed by Patterson and Burkholder, 2003) and the
cecal microbiota in chickens are responsible for the fermentation of fibre (Dunkley et al., 2007). We,
therefore, hypothesize that increasing the fibre content in the diet induces a microbial shift, across
breeds, in the cecum of chickens and furthermore, increases the presence of some bacterial genera. In
this study, the microbial communities in the chickens’ cecum are compared between different breeds
across two different diets: alternate diet (14.3% crude fibre (CF)) and commercial diet (4.0% CF). Ten
bacterial genera are found indicative for the alternate diet and two for the commercial diet. No
conclusions, however, could be made regarding gut health or digestion.

CHAPTER 5b
- 84 -
Introduction
A study on the microbiota of children in Burkina Faso suggested that the gut microbiota coevolved with
polysaccharide rich diets, allowing these children not only to maximize energy intake from fibres, but
also protecting them from inflammations and noninfectious colonic diseases by production of short-
chain fatty acids (SCFA) (De Filippo et al., 2010). This was in contrast to European children were the
microbiome was less diverse and produced less SCFA. The main cause of these differences was attributed
to the different diets as the diet of European children is richer in starch, sugar, calories, fat and animal
protein and lower in fibre, compared to the diet of the children in Burkina Faso (De Filippo et al., 2010).
As similar differences are observed between the diets of free-ranging and industrial chickens (Chapter
3), the question arises whether the microbiome evolved in the same way. The microbiota in the chickens’
cecum are known to produce SCFA, as seen in the human colon, by fermentation of the sugars released
from non-starch polysaccharides (NSP) (Dunkley et al., 2007). These SCFA improve the chickens’ gut
health by stimulating enterocytes and prevent colonization by pathogenic bacteria such as Salmonella
(Van Immerseel et al., 2004; Eeckhaut et al., 2008). In this study, we compared the microbial
communities in the chickens’ cecum from different breeds across two different diets: scavenger diet
(14.3% crude fibre (CF)) and commercial diet (4.0% CF). We hypothesize that the scavenger diet induces
a microbial shift, across breeds, in the cecum of chickens and furthermore, as the scavenger diet is rich
in fibres, increases the presence of bacterial genera that are important in the fermentation process of
fibres.
Material and methods
For this study all samples of cecal drop and cecal content from Chapter 5a were used (n = 28) while fecal
drop samples were omitted from this study (n = 12). Consequently, material and methods follows the
same methodology as in Chapter 5a (Pauwels et al., 2015). Additionally, using PC-ORD 6.0, we ran an
indicator species analysis to determine indicator genera for each diet (McCune and Mefford, 2006). This
analysis calculated an indicator value based on fidelity and relative abundance of a genus in relation to
the diet. By definition, an indicator value of 100 (perfect indicator) implies that the presence of a given
genus identifies a diet without error. The obtained indicator values were tested for significance using the
Monte Carlo randomization test with 999 permutations.

CHAPTER 5b
- 85 -
Results and discussion
The NMDS analysis showed a difference in microbial community composition between the cecal samples
of the chickens fed a scavenger diet and the chickens fed a commercial diet. Along the first axis (NMDS1,
54.6% variance explained) a significant difference between both diets was found (P = 0.046). For the
second axis (NMDS2, 36.2% variance explained) no significant difference was found (P = 0.37) (Figure
5b.1.). The Indicator Species Analysis found twelve genera to be indicative for a specific diet. Ten of them
were indicative of the scavenger diet and two of them were indicative of the commercial diet (Table
5b.1.).
Figure 5b.1. NMDS analysis on two axes, of the community composition of the microflora in cecal drop and cecal content (n
= 28) in chickens, displaying the effect of diet. Cummulative R² = 0.91.
It is difficult to obtain information of the impact of these diet-induced shifts in the cecal microbiota of
chickens on the health of the chicken because knowledge of the specific species that change within the
genera is too limited and statistically unreliable for now. Many species are “unclassified” or “incertae
sedis”, which is in accordance to the literature. Apajalahti et al. (2004), for example, discovered that,
based on the microbial DNA, 90% of the species in the gastrointestinal tract of the chicken were
previously unknown and more than half of the 640 different species belong to previously unknown
genera.

CHAPTER 5b
- 86 -
Table 5b.1. Bacterial genera in the chickens’ cecum that are indicative of a specific diet.
genus Indicator
value S. Dev. P
Genera indicative for scavenger diet Campylobacter (Campylobacteraceae) 69.3 10.3 0.04 Eggerthella (Coriobacteriaceae) 50.3 7.9 0.03 Unclassified (Coriobacteriaceae) 81.1 6.6 < 0.001 Unclassified (Desulfovibrionaceae) 70.3 6.4 0.01 Incertae Sedis (Erysipelotrichaceae) 77.0 6.3 < 0.001 Incertae Sedis, unclassified (Family.XIII.) 68.7 4.3 0.001 Incertae Sedis (Lachnospiraceae) 62.8 3.0 0.007 Lactobacillus (Lactobacillaceae) 75.0 6.9 0.02 unclassified (RF9) 77.9 5.2 < 0.001 unclassified (Ruminococcaceae) 59.0 2.3 0.01 Genera indicative for commercial diet Unclassified (Clostridiales) 57.6 2.4 0.04 Enterococcus (Enterococcaceae) 64.2 9.4 0.02
The higher the indicator value, the higher this genus can be reliably assigned to a specific diet. The P-value indicates the
goodness of fit of this specific Indicator genus. Only genera with a P-value < 0.05 are shown in the table.
Xylan and cellobiose degradation enzymes are similarly found in three main bacterial classes:
Actinobacteria, Clostridia and Bacteroidia (Sergeant et al., 2014). Four genera within these classes are
indicative for the scavenger diet: Eggerthella and an unclassified genus (both within the
Coriobacteriaceae family), a genus in the Lachnospiraceae family and a genus in the Ruminococcaceae
family. One unclassified genus from the Clostridiales family, however, was indicative for the commercial
diet.
Although Campylobacter is a non-pathogenic bacteria in the cecum of chickens, it is one of the most
frequent causes of food poisoning in humans (Humphrey et al., 2007). It is not clear why Campylobacter
is found as an indicator species for the scavenger diet. Different hygiene and husbandry practices are
proven to increase the risk of Campylobacter in chickens. Factors related to the care-takers, airflow or
water quality are unlikely to cause this difference as both groups were housed together (Refrégier-
Petton et al., 2001). Hence, the litter quality of the chickens on the scavenger diet was observed to be
more sticky and higher in volume, resulting in dirtier pens.

CHAPTER 5b
- 87 -
During fermentation, biochemical pathways produce molecular hydrogen while NADH gets recycled to
NAD+. An accumulation of hydrogen, however, reduces fermentation (Vignais and Billoud, 2007).
Campylobacter, Desulfovibrio spp. (and other sulfate reducing bacteria (Sørensen et al., 1981)), and
bacteria from the Ruminococcaceae and Lachnospiraceae family are potential hydrogen consumers and
can, therefore, prevent an impeded fermentation (Sergeant et al., 2014). Campylobacter and unclassified
or uncertain genera within the Desulfovibrionaceae, Ruminococcaceae and Lachnospiraceae families are
indicator genera for the scavenger diet. It can be expected that a fibre-rich diet increases the
fermentation, leading to a hydrogen accumulation. In that situation, bacteria that consume hydrogen
will become more important.
Chitin in the diet is known to increase Lactobacillus and decrease E. coli in the cecum of chickens (Li et
al., 2007). As the scavenger diet contained mealworms, it contained chitin too (Richards, 1958). No effect
of the scavenger diet on E. coli was found which might be due to the relatively low chitin level in the diet
(0.1% - 0.5%). Hence, as microbial resistance against E. coli is often reported, alternative ways to tackle
this bacteria species, for example by adding chitin to the diet, are valuable (Dho-moulin and Fairbrother,
1999). Lactobacillus is found indicative to the scavenger diet in this study and is overall considered a
beneficial genus as many Lactobacillus species are considered probiotics: they produce lactic acid and
SCFA and stimulate butyrate-producing bacteria (Dunkley et al., 2007; Meimandipour et al., 2009).
The present design does not answer the question whether either of both diets benefits the health of
chickens. In general, both pathogenic and non-pathogenic species can often be included in the same
genus. The Clostridia genus, for example, is found as an indicator of the commercial diet and is known
to include pathogenic and zoonotic species such as C. perfringens (Van Immerseel et al., 2004) and non-
pathogenic species such as C. butyricum (Yang et al., 2010), though this last one can produce botulinum
toxins. Another example is the Campylobacter genus, indicative of the scavenger diet. A bacterial species
such as Campylobacter jejuni can be non-pathogenic to the chicken but hazardous to human (Dasti et
al., 2010). Moreover, it is important to keep in mind that scavenger diets are extremely variable
regarding ingredients and nutrient composition (Chapter 3), and, therefore, the results of this study
cannot be generalized for all scavenging chickens.

CHAPTER 5b
- 88 -
Conclusion
The cecal microbiota in chickens is shown here to differ between chickens, fed on a commercial diet and
chickens, fed on a scavenger diet. No differences between the different breeds were found. Ten bacterial
genera in the cecal microbiome are indicative for the scavenger diet and two are indicative for the
commercial diet. Literature suggests some of them to be important in the fermentation process of fibres.
Also, the Lactobacillus increase can be explained by the presence of chitin in the diet. These results urge
for more studies on the potential health effect of diets that also take into account the natural feeding
strategy of chickens.


Chapter 6
Does chitin create a bias in
crude protein analysis?


CHAPTER 6
- 93 -
Does chitin create a bias in crude protein analysis?
J. Pauwels, A. Cools, H. De Rycke, S. Bukenbergs, and G.P.J. Janssens
Submitted at Food Chemistry
Abstract
The protein content in feed and food is a major determinant of nutritional value. Standard methods,
such as Kjeldahl analysis, assume all nitrogen to originate from protein, resulting in a loss of accuracy
when non-protein nitrogen is present. In particular, with the increasing use of insects as feed and food
ingredient, the nitrogenous non-protein compound chitin is introduced. This study analysed three
nitrogen fractions in twenty-three samples: first, total nitrogen was determined according to Kjeldahl
analysis; second, nitrogen was determined on the chitin fraction, and third, amino acid nitrogen was
calculated based on analysis of amino acids. The results show that correction of total nitrogen level for
the nitrogen in chitin improves the accordance with amino acid analysis, which is considered the
reference in this study. For pure crab chitin, the conventional Kjeldahl method rendered a concentration
of 385 g crude protein/ kg whereas calculations based on amino acids resulted in 3 g protein/ kg only.
These results indicate that the protein level in chitin containing diets might be overestimated if not
corrected for the nitrogen present in chitin. This correction does not compensate for all non-protein
nitrogen sources, but it is a fairly accessible method to obtain a more accurate determination of dietary
protein concentration.

CHAPTER 6
- 94 -
Introduction
The value of many diet sources depends on the quality and the quantity of protein. Conventionally, the
crude protein concentration in feed and food is determined by the Kjeldahl-analysis (ISO 5983-1, 2005),
which is based on the nitrogen (N) level in the sample (reviewed by Moore et al., 2010). However, when
analyzing feed or food that contains ingredients containing high amounts of non-protein N, crude protein
can be overestimated. Analysis of the amino acids gives a clear idea about the real protein content, but
these analyses are rather expensive.
Chitin (C8H13O5N)n gets increasing attention as insects become more popular as a protein source for feed
and food. As chitin contains 7% of nitrogen (calculated on atomic weights), it might bias the values for
crude protein found by Kjeldahl analysis (Weaver et al., 1977). In order to incorporate insects in diets
and to recommend them as good protein sources, one must make sure that the analytical methods used
are correct and specific, for protein as well as for chitin.
Methods based on fibre analysis have been used to determine chitin in samples (Finke, 2007; Liu et al.,
2012). However, these methods are not applicable to determine chitin in a diet that is composed of both
animal and plant derived materials, as crude fibre might give an overestimation of chitin with these tests.
The aim of this study was to evaluate a method to improve the accuracy of protein and chitin
determination in diets. Therefore, three nitrogen fractions were analysed in twenty-three samples: first,
total nitrogen was determined according to Kjeldahl analysis; second, nitrogen was determined on the
chitin fraction, and third, amino acid nitrogen was calculated based on analysis of amino acids. The
difference between total nitrogen and the two others was defined as non-protein non-chitin nitrogen.
Total nitrogen (NKjeldahl) was split in three sections depending on their origin: protein (Naa), chitin (Nchitin)
and others such as DNA and some vitamins (folic acid and thiamine for example56) (Nnpnc) (Figure 6.1.).

CHAPTER 6
- 95 -
Figure 6.1. The different nitrogen (N) fractions (Nchitin-orrected, Nchitin, Namino acid and Nnpnc) were determined for each sample.
Material and Methods
Samples
In total, twenty-three different samples were analysed. Ten were from insect origin: Tenebrio molitor
adult (fed wheat bran only) (Ecology Projects®), Tenebrio molitor larvae (fed wheat bran only and fasted
for ten days) (Ecology Projects®), Tenebrio molitor larvae (fed wheat bran and oats, not fasted) (Ecology
Projects®), Tenebrio molitor pupae (fed wheat bran only) (Ecology Projects®), Hermetia illucens adult and
Hermetia illucens pupae (fed mixed kitchen waste), Locusta migratoria migratorioides instar 5-6 and
Locusta migratoria migratorioides adult (Ecology Projects®), Galleria mellonella larvae (parboiled)
(Ecology Projects®) and Alphitobius diaperinus larvae (Ecology Projects®); two were from crustacean
origin: Gammarus pulex (Versele-Laga®), Macrobranchium nipponense (Versele-Laga®); three low protein
ingredients: chitin from shrimp shells (Sigma®), cellulose powder from spruce (Fluka®) and wood shavings
(Roose®); and eight protein containing ingredients: casein from bovine milk (Sigma®), feathermeal, wheat
bran (Lannoo paardenvoeders®), soy hulls (Lannoo paardenvoeders®), instant yeast (Saccharomyces
cerevisae) (Bruggeman®), dried mushrooms (Boletus edulis, le Montagnard®), porcine collagen (Vepro®)
and beef collagen (Federal Laboratories Corporation®).

CHAPTER 6
- 96 -
Analyses
All samples were dried and ground (screen size 1mm). Diethyl ether extract was removed from the
samples by use of the Soxhlet method (ISO, 1973). Subsequently, the samples were loaded in filter bags
(F57, Ankom Technology®), using two bags per sample with one gram of sample per filter bag and sealed
by use of Vacopack F380 (KRUPS®). Chitin was determined after digestion with HCl and NaOH of the filter
bags, based on Liu et al., (2012). Blank filter bags were analysed similarly and those results were used to
correct Nchitin of the samples. Subsequently, the nitrogen level in the analysed chitin (Nchitin) was
determined by Kjeldahl, assayed according to the Association of Official Analytical Chemists methods,
method 934.01 (AOAC, 2006). For this analysis, the samples remained in the filter bags. Total nitrogen
(NKjeldahl) was determined on each sample by standard Kjeldahl analysis (AOAC method 934.01). The
insoluble ash content was determined using the procedure of Van Keulen and Young (1977), as adapted
by Atkinson et al. (1984) and was used to correct the Nchitin content for residual ash. The calculated chitin
content was determined using the conversion factor 14.5 (based on the atom weights (A) in chitin
(C8H13O5N)n: (AN/ (8 × AC + 13 × AH + 5 × AO + 1 × AN)) -1 (with AN = 14, AC = 12, AH = 1 and AO = 16).
The amino acid content of each sample was determined by use of the amino acid analyser (Sykam,
Eresing, Germany) including the oxidation step as described by the International Organisation for
Standardization (ISO 13903, 2005). This method does not give reliable results for Trp and for Phe content
in chitin, therefore, Trp was not taken into account for all samples and Phe was not taken into account
for chitin. Total protein nitrogen (Naa) was calculated based on the formula of each amino acid and the
results of the amino acid analysis per sample. Amino acid levels below the detection limit (< 0.1 g/ kg)
were considered zero.
Calculations
Chitin was calculated as Nchitin × 14.5. The corrected level of N for chitin (Ncorr) was calculated as NKjeldahl
- Nchitin and the non-protein non-chitin N (Nnpnc) was calculated as NKjeldahl - Nchitin - Naa. Proteinaa is
calculated as the sum of all individually determined amino acids and Proteincrude is calculated as NKjeldahl
× 6.25. Linear relationships between Naa, Ncorr, and NKjeldahl and Proteinaa, Proteincrude and Proteincorr were
calculated by linear regression analysis using SPSS Statistics 23.

CHAPTER 6
- 97 -
Results
Terrestrial vertebrate derived ingredients had the highest NKjeldahl, followed by the insects and
crustaceans. Mushroom, chitin and yeast had intermediate NKjeldahl concentrations, plant derived
ingredients were the second lowest and cellulose and wood shavings contained nearly no NKjeldahl (Table
6.1.).
Pure chitin, derived from shrimp shells, had a Nchitin content of 55 g/ kg, therefore, 797.5 g calculated
chitin per kg was found which was lower than the analysed chitin (973 g/ kg). Porcine collagen, soy hulls
and wood shavings showed high levels of analysed chitin and low levels of calculated chitin. For casein,
bovine collagen and wheat bran, slightly negative values were found for Nchitin and, therefore, their
calculated chitin levels were negative as well. Negative values for analysed chitin were found for
cellulose, feathermeal and casein (Table 6.1.).

CH
AP
TER 6
- 98
-
Table 6.1. Different nitrogen (N) fractions (Nchitin' Ncom Naa and Nnpncl of the total N (NKjeldahJ l in feed samples of different origin: chitin, insects, crustaceans, plants, fungi and terrestrial vertebrates (g/ kg) . Chitin content in different samples were both analysed and calculated (g/ kg).
N Kjeldahl N chitin N corr Naa N npnc Analyzed chitin Calculated chitin Ch itine 61.6 55.0 6.6 0.5 6.1 973 797.5
lnsects Te nebrio malitor (adult) 117.4 8.3 109.1 68.2 40.9 163 120.4 Tenebrio malitor (larvae, fasted) 81.6 2.3 79.3 53.8 25.5 117 33.4
Tenebriomo/itor (larvae, not fasted) 97.9 5.2 92.7 57.3 35.4 88 75.4
Tenebrio mali tor (pupae) 97.1 10.0 87.1 60.6 26.5 69 145.0
Locusto migratorio (instar 5-6) 98.2 7.0 91.2 56.0 35.2 134 101.5
Locusto migratorio (adult) 96.8 8.7 88.1 53.6 34.5 157 126.2
Hermetio illucens (adult) 84.5 5.1 79.4 61.7 17.7 87 74.0 Hermetio i/lucens (pupae) 76.2 18.0 58.2 46.3 11.9 239 261.0 Gollerio meiionel/a (larvae, parboiled) 59.8 3.0 56.8 40.8 16.0 53 43.5
Alphitobius loevigotuo (larvae) 85.0 6.8 78.2 64.0 14.2 96 98.6
Crustacea Mocrobronchium nipponense 100.3 1.6 98.7 72.3 26.4 15 23.2
Gammarus pulex 79.2 2.9 76.3 57.2 19.1 39 42.1
plantand fungal derived ingredients Cellulose 7.0 0.0 7.0 0.1 6.9 -2 0.0
Wood shavings 7.1 3.2 3.9 0.9 3.0 575 46.4
Soyhulls 23.2 3.8 19.4 12.9 6.5 221 55.1
Wheat bran 31.0 -0.3 31.3 19.1 12.2 50 -4.4
Mushroom 52.5 4.6 47.9 24.9 23.0 84 66.7
Yeast 71.7 1.7 70.0 52.6 17.4 49 24.7
terrestrial vertebrate derived ca sein 139.8 -0.4 140.2 119.5 20.7 -8 -5.8
Collagene bovine 158.6 -0.8 159.4 138.4 21.0 4 -11.6
Collagene po reine 145.3 1.4 143.9 107.7 36.2 230 20.3
Feathermeal 143.4 0.4 143.0 117.7 25.2 -6 5.8
With NKjeldahl determined by Kjeldahl a na lysis on complete sample; Nchitin determined by Kjeldahl a na lysis on chitin fraction; Ncorr calculated as NKjeldahl - Nchitin; Naa calculated on molecular weights and amino acid content of each sample; Nnpnc (non-protein non-chitin nitrogen) calculated as NKieldahJ- (Nchitié Naal; Analysed chitin was determined accordingto Liu et al. (2012); Calculated chitin was calculated as Nchitin x 14.5.

CHAPTER 6
99
Table 6.2. NKjeldahl (g/ kg), ProteinKjeldahl (g/ kg), Proteinaa (g/ kg) and Proteinaa/ Naa for each sample.
NKjeldahl determined by Kjeldahl analysis on complete sample, ProteinKjeldahl (g/ kg) (calculated as
NKjeldahl × 6.25) represents the classical calculation of crude protein, Proteinaa (g/ kg) is the sum of
amino acids and Proteinaa/ Naa is the estimation of the specific nitrogen:protein conversion
factor.
N Kjeldahl Protein Kjeldahl Protein aa Protein aa/ Naa
Chitine 61.6 385 3.2 6.46
Insects
Tenebrio molitor (adult) 117.4 734 433.3 6.36
Tenebrio molitor (larvae, fasted) 81.6 510 352.8 6.55
Tenebrio molitor (larvae, not fasted) 97.9 612 368.0 6.42
Tenebrio molitor (pupae) 97.1 607 387.4 6.40
Locusta migratoria (instar 5-6) 98.2 614 337.7 6.03
Locusta migratoria (adult) 96.8 605 352.4 6.58
Hermetia illucens (adult) 84.5 528 393.9 6.38
Hermetia illucens (pupae) 76.2 476 256.7 5.55
Galleria mellonella (larvae, parboiled) 59.8 374 267.9 6.57
Alphitobius laevigatua (larvae) 85 531 413.7 6.46
Crustacea
Macrobranchium nipponense 100.3 627 471.3 6.52
Gammarus pulex 79.2 495 361.7 6.32
plant and fungal derived ingredients
Cellulose 7 44 0.5 5.83
Wood shavings 7.1 44 6.3 6.98
Soy hulls 23.2 145 83.6 6.50
Wheat bran 31 194 128.2 6.70
Mushroom 52.5 328 154.3 6.19
Yeast 71.7 448 359.2 6.83
terrestrial vertebrate derived
Casein 139.8 874 851.0 7.12
Collagene bovine 158.56 991 861.1 6.22
Collagene porcine 145.28 908 670.0 6.22
Feathermeal 143.36 896 805.2 6.84

CHAPTER 6
100
The linear relations found between NKjeldahl, Ncorr and Naa can be described as (Figure 6.2.):
NKjeldahl = 24.76 + 1.05 Naa (R² = 0.894; P < 0.001)
Ncorr = 12.18 + 1.16 Naa (R² = 0.960; P < 0.001)
Linear relations found between Proteinaa and Proteincrude on the one hand and Proteinaa and
Proteincorr on the other hand (Figure 6.3.):
Proteincrude = 167 + 0.98 Proteinaa (R² = 0.872; P < 0.001)
Proteincorr = 88.3 + 1.08 Proteinaa (R² = 0.944; P < 0.001)
Figure 6.2. Linear relation between NKjeldahl and Naa and between Ncorr and Naa (n = 23)
Figure 6.3. Linear relation between Proteinaa and Proteincrude and between Proteinaa and Proteincorr (n = 23)

CHAPTER 6
101
Discussion
Samples were compared on N level as conversion factors for calculating crude protein are very
sample specific (Boisen et al., 1987; Mariotti et al., 2008). Nitrogen, calculated on the amino acid
composition of the different samples (Naa), is considered as the reference. However, the amino
acid analysis is very destructive (ISO 13903, 2005) and could result in a slight underestimation of
the true amino acid content and, therefore, of the Naa. In contrast, Ncorr might show a slight
overestimation as it is calculated as NKjeldahl - Nchitin and therefore still includes non-protein non-
chitin sources of nitrogen (Nnpnc), such as DNA and amides.
Another reason for the crude protein to overestimate true protein, is the use of the conversion
factor 6.25, which is based on maize (Jones, 1931). Conversion factors for the samples analysed
in this study can be estimated as Proteinaa/ Naa. Conversion factors found in literature, however,
often differ largely from these results. For example: soy hulls (5.4), wheat bran (6.31),
mushrooms (3.99), casein (6.38), collagens (5.55) and feathermeal (6.21) were found in literature
(Jones, 1931; Dintzis et al., 1979; Fujihara et al., 1995; Tiwary and Gupta, 2012). It would be
interesting to review the variation on nitrogen: protein conversion factors for different samples.
Regarding the linear relations with Naa and Proteinaa, R² was bigger for the corrected values (Ncorr
and Proteincorr, respectively) compared to NKjeldahl and Proteincrude, respectively. This indicates that
estimating Naa and Proteinaa is most reliable when using Ncorr and Proteincorr.
Within the same species, Nchitin is highest for the pupae and lowest for the larval stages, with the
adult stages intermediate. This is in line with Bukkens’ suggestions that the chitin level is lower
when the body of the insect is softer, but is contradicted by Finke (Bukkens, 1997; Finke, 2007).
For pure chitin, the method of Liu et al. (2012) gave accurate results (973 g/ kg), although the
calculations based on Nchitin and conversion factor 6.90 (AN/ (5 × AO + 13 × AH + 8 × AC + AN)-1 based
on the formula for chitin (C8H13O5N)n) gave a lower result (807 g/ kg). Different sources of chitin
exist and the chemical compositions might change slightly depending on the origin of the chitin
(Tshinyangu and Hennebert, 1996). When calculating the nitrogen: chitin conversion factor from
our results (Nchitin/ analysed chitin = 55/ 973 (both in g/ kg)), a conversion factor for chitin from
crab shells of 5.65 is found.

CHAPTER 6
102
High values of analysed chitin for soy hulls, wheat bran and wood shavings were found, though,
these ingredients are generally accepted to contain no chitin. Comparing these values with those
for calculated chitin shows that low levels of N were present in the analysed chitin fraction. As
the method of Liu et al. (2012) is close to the methods to analyse crude fibre (DeVries, 2003;
Finke, 2007), and crude fibre does not contain nitrogen, it can be assumed that crude fibre
induced an overestimation for the chitin analysis.
ProteinKjeldahl overestimates the protein content in the samples analysed in this study. This
overestimation is both due to the lack of an exact conversion factor for each sample (Boisen et
al., 1987; Mariotti et al., 2008) and the overestimation of protein nitrogen. The bias of Nchitin in
the protein calculation is clear when looking at pure chitin. NKjeldahl of pure chitin is 62 g/ kg,
resulting in an estimation of 385 g/ kg Proteincrude. Hosain and Blair (2007) found a similar crude
protein content for chitin (373 g/ kg) (Hossain and Blair, 2007). Estimating the true protein
content by Ncorr (NKjeldahl – Nchitin) is perfect neither as sources such as amides and DNA still
contribute. Although, Ncorr is more correct to estimate the protein content than NKjeldahl. In insects,
Nchitin rarely exceeds 10g/ kg and, therefore, the overestimation of protein in insects is rarely
bigger than the conversion factor (Finke, 2007). Still, it is valuable to know Nchitin. On the one
hand, one can use Nchitin to distinguish between chitin and fibre when interpreting the results of
the chitin analysis. On the other hand, when chitin is included in high doses, the correction of
NKjeldahl for Nchitin will be important.
Conclusion
The specificity for the crude protein and the chitin analysis strongly depends on the type of
feedstuff. The crude protein analysis will overestimate the protein content in all samples
containing chitin: insects, crustaceans and fungi, though this overestimation might be small.
Standard Kjeldahl analysis showed a crude protein level of 38.5% in pure chitin. Correcting the
nitrogen level for the nitrogen level in chitin, gives values closer to the nitrogen level in the amino
acids. However, this correction does not include the nitrogen derived from non-protein non-
chitin sources such as amides and DNA. Sample specific conversion factors are needed for each
sample.

CHAPTER 6
103
Acknowledgements
The authors would like to thank Leon de Jong for the technical assistance. Jonas Claeys from
Inagro, Peter de Baptiste from Ecology Projects and Versele-Laga are sincerely acknowledged for
the contribution of samples. This study was funded by VLIR-UOS.


Chapter 7
Selection for growth performance in
broiler chickens associates with less
diet flexibility


CHAPTER 7
107
Selection for growth performance in broiler chickens associates with less diet flexibility
J. Pauwels, F. Coopman, A. Cools, J. Michiels, D. Fremaut, S. De Smet and G.P.J. Janssens
Modified from PLoS ONE 10(6): e0127819
Abstract
Global competition for high standard feed-food resources between man and livestock, such as
industrial broilers, is a concerning problem. In addition, the low productivity of scavenger
chickens in developing countries leaves much to be desired. Changing the ingredients, and
therefore, the nutrient composition of feed intake by commercially fed as well as scavenger
chickens seems like an obvious solution. In this study, the ability of four broiler chicken breeds to
perform on a commercial versus a scavenger diet was tested. The four broiler breeds differed
genetically in growth potential. A significant (P < 0.01) negative effect of the scavenger diet on
the bodyweight of the fast growing breeds was found and this effect decreased with decreasing
growth rate in the other breeds. These differences in bodyweight gain could not be explained by
differences in digestive capacity but were caused by the lack of ability of the fast growing breeds
to increase their feed intake sufficiently.

CHAPTER 7
108
Introduction
The feeding of industrial broiler chickens is often criticized because of the extensive use of feed
sources which are neither socially nor ecologically sustainable (Delgado et al., 2001; Barona et
al., 2010; Wilkinson, 2011; Erb et al., 2012). The diet of intensively-raised broilers consists mainly
of maize, soy and wheat, ingredients that could also be used directly in the human diet (Donohue
and Cunningham, 2009; Foley et al., 2011; Wilkinson, 2011). Ravindran (Ravindran, 2011) and
Farrell (Farrell, 2005) proposed alternative ingredients, less sought after in the human diet, that
could be used in the chickens’ diet.
The low productivity of scavenger chickens in developing countries is often blamed on the lack
of concentrated diets (Farrell, 2005; Badubi et al., 2006). The diet of scavenger chickens contain,
for example, crude fiber levels up to more than 100g/kg dry matter (Dessie and Ogle, 2001).
While Jørgensen et al. (1996) reported that broilers (by fermentation of three different NSP rich
substrates: pea fibre, wheat bran and oat bran) extract a maximum of 42kJ/d, representing only
3 to 4% of the daily metabolisable energy intake, hereby confirming the widely accepted idea
about the low energetic value of NSP-rich diets for poultry (Moran, 2006).
Solving both problems, both for the industrial as for the rural chickens, is especially interesting
as chickens are a widespread food source around the globe. The FAO estimated that there were
nearly 22 billion living chickens in 2012 (FAOSTAT, 2015). This is the equivalent of more than
three chickens per person. Moreover, in developing countries, chickens are often the main source
of animal protein through their meat and eggs and most of these chickens stem from indigenous,
slow growing, breeds (Neumann et al., 2002; Sonaiya, 2007).
In this study four different chicken breeds, with growth rates between 30 and 60 g/ d, were used
to plot a range in growth rate between the slow growing scavenger chicken on one side and the
fast growing industrial broiler chicken. Two diets were used to feed these chickens, one was a
commercial industrial diet while the other was based on reported scavenger diets (Dessie and
Ogle, 2001; Goromela et al., 2008; Mekonnen et al., 2009; Momoh et al., 2010). The average daily
bodyweight gain, average daily feed intake, feed conversion ratio and the length of the

CHAPTER 7
109
tarsometatarsus were registered for all breeds on each of the diets. The aim of this study was to
monitor the effect of the scavenger diet in relation to breed-specific growth rate.
Materials and Methods
Animals and housing
Four different broiler breeds were selected based on their commercial growth rate from hatching
weight to slaughter weight (hereafter referred to as breed-specific growth rate): Cobb 500 (60
g/d) (Cobb-Vantress, 2012), Cobb-Sasso 175 (46g/d) (Sasso, 2010a), Sasso (XL44 × SA₅₁(A)) (38g/d)
(Sasso, 2010b) and Sussex (Sussex × SA₅₁(A)) (30g/d) (Sasso, 2010c). A total of 240 one day old
male chicks, sixty from each breed, were obtained from the same hatchery (‘t Gulden Ei,
Kruishoutem, Belgium). From each breed, 15 chicks were randomly assigned to 4 pens littered
with wood shavings. Each pen contained 15 animals and breeds were not mixed. Each pen had a
surface of 2m² and was 75cm high (conform ETS 123 as birds were at all times < 2.4 kg). During
the first week, 23 hours of light were provided per day and from day 8 the light period was
reduced to 18 hours per day. At hatching all chicks were vaccinated against Newcastle disease
(Nobilis, NDC2®), infectious bronchitis (Nobilis, IB MA5®) and Marek’s disease (Fort Dodge,
Poulvac Marek HVT®). Four day old chicks were vaccinated against coccidiosis (Intervet, Paracox-
5®). At 19 days the vaccination against Newcastle disease (Nobilis, ND Clone 30®) was repeated
and a vaccination against Gumboro (Nobilis, Gumboro D78®) disease was performed at 22 and
25 days.
Diets and Treatments
From hatching day (day 0), two pens of each breed were fed the commercial diet and two pens
from each breed were fed the scavenger diet. A representative sample from eight randomly
chosen feed bags of each diet was taken and pooled for both diets. Both samples were analysed
in duplicate for nutritional values (Table 7.1.). The commercial diet (Fini Pur Croc®, Versele-Laga,
Deinze, Belgium) was mainly composed of wheat (42%), soybean meal (22%), maize (10%) and
maize middlings (5%) and it contained two enzymes: 6-phytase and E1617-Endo-1,4-β-xylanase.
This diet was ground into flour and 10 g/ kg of Celite® (VWR International, Leuven, Belgium) was

CHAPTER 7
110
added as source of acid insoluble ash (AIA) in order to determine diet digestibility (Scott and Hall,
1998). The scavenger diet contained 930 g/kg Austru 2 Growth® (wheat (20%), sunflower meal
(20%), maize (12%), wheat gluten (11%) and wheat semolina (11%), soybean meal (6%) and spelt
bran (5%)) (Versele-Laga, Deinze, Belgium), 40g/kg dried mealworms (Tenebrio molitor), 20g/kg
dried lucerne and 10g/kg Celite®. All components were ground into flour and mixed until a
homogenous feed was acquired. The Austru 2 Growth® contained no additional enzymes. To
accustom the animals to the scavenger diet, groups fed this diet received a mixture of one third
scavenger diet and two thirds commercial diet from day 0 to 5, two thirds scavenger diet and one
third commercial diet from day 6 to 10, and from day 11 onwards only the scavenger diets was
offered. Drinking water was provided ad libitum in drinking cups.
Table 7.1. Nutrient and energy concentration of both test diets: commercial and scavenger diet
Commercial
diet
Scavenger
diet
Dry matter (g/kg) 902 911
Crude protein (g/kg) 215 187
Ether extract (g/kg) 81 47
Crude fibre (g/kg) 40 143
Acid detergent fibre (g/kg) 13 18
Neutral detergent fibre (g/kg) 67 68
Ash (g/kg) 62 79
Acid-insoluble ash (g/kg) 15 15
Metabolisable energy (MJ/kg) 15 10
Measurements and sampling
Starting from day 0, the chickens were weighed weekly until day 36 and the average bodyweight
per pen was calculated. Average daily gain (ADG), average daily feed intake (ADFI) and feed
conversion ratio (FCR) were calculated over the period of 36 days and were corrected for
bodyweight at hatching and mortality during the trial. To collect excreta for the digestibility trials,

CHAPTER 7
111
a container (1cm × 40cm × 1m) with a grid was placed in each pen weekly, from the second week
on. After four hours the excreta were collected from the container and stored in a freezer (-20°C).
On day 36, the length of the tarsometatarsus of each bird was measured by flexing the leg and
registering the distance between the medial condyle of the fibula and the trochlea for metatarsus
III. The average was calculated per pen and the ratio of bodyweight to tarsometatarsus length
was calculated as in Deeb and Lamont (Deeb and Lamont, 1998). Each week the consistency of
the litter was observed by the same person.
Analysis
Both diets were analysed for dry matter (DM), ash, acid insoluble ash (AIA), crude fat (EE), crude
fiber (CF), neutral detergent fiber (NDF), acid detergent fiber (ADF) and crude protein (CP) (Table
7.1.). The DM and ash content were determined by drying the feed to a constant weight at 103°C
and combustion at 550°C, respectively. The AIA content was determined using the procedure of
Van Keulen and Young (Van Keulen and Young, 1977), as adapted by Atkinson et al. (Atkinson et
al., 1984). The diethyl ether extract was analyzed with the Soxhlet method (ISO, 1973). Crude
fiber was determined using the Association of Official Analytical methods (Method 962.09 and
985.29, 1995). To determine NDF and ADF, the methods of Van Soest et al. (Van Soest et al.,
1991) were used. The Kjeldahl method (ISO 5983-1, 2005) was used to determine CP (6.25 x N).
Excreta were freeze-dried at -50°C (Coolsafe, Labogene, Denmark) and homogenized. In the
excreta, EE, CF, Ash and AIA were analysed as described above. The CP content (6.25 x N) (Kjeldahl
method (ISO 5983-1,2005)) in the excreta of birds needed correction for uric acid (UA) as birds
excrete faeces and urine together (Kalmar et al., 2007) (equation [[1]]). This was performed
spectrophotometrically according to Terpstra and de Hart (Terpstra and de Hart, 1974). The
external marker method with AIA as external marker was used to calculate apparent fecal
digestibility as performed by Sales and Janssens (Sales and Janssens, 2003; Sales and Janssens,
2007) (equation [[2]], AFDₓ, with x = EE, CF and CP). Based on the EE, CF and ash percentage of
DM, ME was calculated according to Wiseman (Wiseman, 1987) (equation [[3]]).

CHAPTER 7
112
Calculations
CP = (total nitrogen – UA nitrogen) × 6.25 [[1]]
𝐴𝐹𝐷𝑋(%) = 100 − 100 xX_excreta x AIA_feed
AIA_excreta x X_feed [[2]]
ME (MJ) = (3951 + 54.4EE – 88.7CF – 40.8Ash) × 0.92 × 0.004184 [[3]]
Statistical analysis
Statistical analyses were performed using RStudio (Version 0.98.507, RStudio Inc, 2009) and
statistical significance was set at P < 0.05. For all analyses, pens were considered as the
experimental unit and non-parametric statistics was performed for data analysis as normality of
data could not be verified in the current trial set up. Both weekly bird weight (week 0 to 5) and
digestibility of nutrients (week 2 to 5) were subjected to longitudinal non parametric analysis
using the f2.ld.f1() function of the nparLD package with diet and breed as the whole-plot factors
and time as the sub-plot factor. Decisions on significance were made based on the ANOVA type
test statistics provided by the latter function (Brunner et al., 2002). To identify the effect of time,
a pairwise comparison was done between the different time points by means of the mctp.rm()
function of the nparcomp package. To estimate the effect of breed-specific growth rate and diet
on average daily feed intake (ADFI), average daily gain (ADG), feed conversion ratio (FCR) and
the tarsometatarsus length a linear permutation regression with 5000 replicates (lmp() of the
lmPerm package) was performed. Each of the 16 pens was randomly assigned to one of the two
diets. To differentiate the effect of diet and of breed-specific growth rate, the null hypothesis of
no effect was used. The alternative hypothesis is that there is an effect of diet and breed-specific
growth rate on the parameters (Higgins, 2004; Kabacoff, 2011). The maximum number of
performed permutations was set at 5000 because of a total of 16! possible permutations for this
data set. To exclude the possible error by only taking 5000 permutations the test was performed
a thousand times with each time another set of 5000 random permutations. From these
thousand permutation tests the maximum P-value was selected and represented together with
the corresponding estimates of the linear regression which is presented as:

CHAPTER 7
113
y = μ + αi + βj + αβij + εij
(with μ = intercept, α = breed-specific growth rate, β = diet, αβ = interaction growth rate × diet
and ε = the random error term). The commercial diet was considered as the reference in this
regression. Statistical significance was set at P < 0.05 and results were reported as mean ±
standard deviation.
Results
Growth performance
A higher bodyweight was found with increasing time, increasing breed-specific growth rate and
for the commercial diet (Figure 7.1.). For both diets, Cobb chickens achieved the highest
bodyweight, each week. Sussex chickens always had the lowest bodyweight compared to the
breeds with a higher breed-specific growth rate, but there was no significant effect resulting from
diet on the bodyweight of Sussex chickens. Longitudinal analysis indicated a significant
interaction of the factors breed, diet and time (P < 0.001) on the bodyweight.
The linear regression of ADG was determined by breed-specific growth rate (P < 0.001), diet (P <
0.01) and the interaction of both factors (P < 0.01) (Table 7.2.) (Figure 7.2.). The coefficient for
the diet × breed-specific growth rate interaction was -0.39. This means that, compared to a
commercial diet, the ADG of the chickens on a scavenger diet decreased with 0.39 g/ d when the
growth rate increased with 1 g/ d.
Feed intake
The ADFI was significantly higher for the scavenger diet (P < 0.001) and with increasing breed-
specific growth rate (P < 0.001). No significant interaction between breed-specific growth rate
and diet on the ADFI was found (P > 0.05) (Table 7.2.) (Figure 7.2.).
Feed conversion
No significant interaction between breed-specific growth rate and diet on the FCR was found (P
= 1). The scavenger diet significantly increased the FCR (P < 0.001) and a higher growth rate
decreased the FCR (P < 0.001) (Table 7.2.) (Figure 7.2.).

CHAPTER 7
114
Figure 7.1. Bodyweight (± standard deviation) of four chicken breeds, each with its breed-specific growth rate, fed
either a commercial or a scavenger diet.

CHAPTER 7
115
Table 7.2. The linear regression between both factors (BS growth rate and diet) and ADG, ADFI,
FCR, TMT and BW/ TMT
Intercept BS growth rate Diet BS growth rate
× Diet R² P
ADG 30.4 *** 0.85 *** -4.4 ** -0.39 ** 0.97 ***
ADFI 71.3*** 1.3 *** 14.5*** -0.33 0.97 ***
FCR 2.5 *** -0.03 *** 0.81 *** -0.01 0.88 ***
TMT 8.3 *** 0.05 *** -0.56 ** -0.03 0.82 ***
BW/TMT 140.5 *** 3.1 *** -8.7 -1.0 0.91 ***
Coefficients of the linear regression of broiler chickens differing in breed-specific growth rate fed a commercial
versus a scavenger diet correlated to the average daily gain (ADG), average daily feed intake (ADFI), feed conversion
ratio (FCR), length of tarsometatarsus (TMT) and the ratio between the bodyweight and the length of the
tarsometatarsus (BW/TMT). The factors in the equation are breed-specific (BS) growth rate and diet. The commercial
diet was considered as the reference. The BS growth rates for each of the breeds used in this experiment are: 60g/
d for Cobb, 46g/ d for CobbSasso, 38g/ d for Sasso and 30g/ d for Sussex. R² and the P-value of the linear regression
models are given in the right colomns. Superscripts represent the P-value: * = <0.05, ** = <0.01, *** = <0.001.
Tarsometatarsus length
The length of the tarsometatarsus increased significantly with increasing breed-specific growth
rate (P < 0.001) and when fed the commercial diet (P < 0.01). No interaction between the factors,
diet and breed-specific growth rate, was detected. The results of the linear regression for the
ratio of the bodyweight/ tarsometatarsus length were determined by the breed-specific growth
rate only (P < 0.001) (Table 7.2.) (Figure 7.2.).

CHAPTER 7
116
Figure 7.2.: The average daily gain, average daily feed intake, feed conversion ratio, length of the tarsometatarsus
and bodyweight/ tarsometatarsus length (± standard deviation) of chickens fed the scavenger or the commercial
diet in relation to their breed-specific (BS) growth rates.
Digestibility
The digestibility coefficients of EE and CP were lower on the scavenger diet compared with the
commercial diet (P < 0.001 and P = 0.004 respectively). The EE digestibility of the commercial diet
was 92% ± 3% and 82% ± 5% for the scavenger diet. The CP digestibility of the commercial diet
was 51% ± 10% and 25% ± 22% for the scavenger diet. There was no significant difference (P >
0.05) found between the four breeds according to the digestibility of CF, EE and CP.

CHAPTER 7
117
Litter
The litter was observed to be more humid and sticky with increasing breed-specific growth rate
and when the birds were fed the scavenger diet (pers. Obs. JP).
Discussion
All breeds increased their ADFI when fed the scavenger diet. The two slowest growing breeds in
this study, Sasso and Sussex, increased their feed intake by 40 and 30% respectively and therefore
managed to achieve the same bodyweights as on the commercial diet. The bodyweight of Sussex
was even slightly, but not significantly, higher when fed the scavenger diet. The fastest growing
breeds, Cobb and CobbSasso, consistently achieved the highest bodyweights compared to the
slower growing breeds. Yet, based on the FCR, they should have increased their feed intake by
45 and 40% respectively, in order to achieve the same bodyweights on the scavenger diet as on
the commercial diet, which they were not capable of doing. This in contradiction to an
experiment by Leeson et al. (Leeson et al., 1996a) where broilers of a commercial strain increased
their feed intake sufficiently as the energy content of the feed decreased. These broilers did
manage to maintain their bodyweight over an energy difference of 2.5 MJ. This contrast might
be explained by the use of an “older” commercial broiler breed (which was not specified) or by
the fact that the energy difference between the diets was lower than in our study, where it was
5.0 MJ/ kg. Olomu and Offiong (1980) found no significant effect on either feed intake or weight
gain for starting broilers fed diets with an energy difference of 1.7 MJ. This in contrast to the
study by Harms et al. (2000) where a significant effect (P < 0.05) of breed, diet and breed × diet
interaction was found concerning both weight gain and feed intake. Equally so, Leeson et al.
(1996b) noted an increase in feed intake as well as feed intake to bodyweight gain ratio of broilers
when the energy and protein level in the feed were diluted. The chickens’ bodyweight was
significantly affected on day 42 but not on day 49. No rating for the growth rates of the different
chicken breeds was made in any of these studies.
The effects of the scavenger diet on bodyweight seen in our study are in line with Havenstein et
al. (1994) and Grashorn (2006). In the first study, the effect of diet on the bodyweights of two
chicken breeds, Ross 308 and Athens-Canadian Randombred, was measured. The diets were an

CHAPTER 7
118
industrial diet from 1957 and one from 2001, the latter one being higher in protein, fat and
energy. For the Ross 308 breed a difference in bodyweight of 18.9 and 21.8% for females and
males respectively was found and for the Athens-Canadian Randombred breed a difference of
5.4 to 7.8% for females and males respectively was found. The highest weights were always
obtained for the 2001 industrial diet, but the differences with the 1957 industrial diet were
smaller for the “older” breed. Grashorn (2006) found a difference in bodyweight of 8-14% for
slow growing broilers, whereas for the fast growing broilers a difference of 25% between diets
with a high and low nutrient concentration was seen. Both studies support the association
between breed-specific growth rate and the difference in bodyweight when fed a less
concentrated diet. None of those two studies monitored the digestibility of nutrients or the feed
intake of the chickens.
The stable digestibility of EE and CP throughout time is in line with the results by Batal and
Parsons (Batal and Parsons, 2002). In that study, an increasing digestibility of EE and CP was found
up to the age of 14 and 10 days respectively. Later the digestibility coefficients reached a plateau.
These results can be explained by the development of the small intestine, digestive enzymes and
villus morphology between hatching and 6 to 14 days of age (Nitsan Z., Ben-Avraham G., Zoref
Z., 1991; Sell J.L., Angel C.R., Piquer F.J., Mallarino E.G., 1991; Uni Z., Noy Y., 1995; Obst et al.,
2014). In addition, the results of Jackson and Diamond (1996) and of Proudman et al. (1970)
present equal (both 67%) apparent dry-matter digestive capacity for both jungle fowls and
broilers for similar diets. This in contradiction with Krás et al. (2013) who found a significant, but
“not biologically coherent” effect of age on the digestibility of DM, OM, CP, NDF, ADF and gross
energy between the age of 10 and 41 days. The same study also showed a higher ADF-digestibility
for the Label Rouge breed compared to the Cobb500 at the age of 31 and 41 days. It must,
however, be considered that in the present study, the chicks on the scavenger diet only received
100% scavenger diet from day 11 on. Feeding the chicks 100% scavenger diet from day 0 might
have given different result. Hence, to prevent health problems by very sticky droppings at such a
young age, it was chosen to gradually introduce the scavenger diet.

CHAPTER 7
119
In our study, the lower rate of fat and protein digestibility in the scavenger diet compared to the
commercial diet could be explained by the high amount of NSP and the lack of added enzymes
to break them down. The lack of enzymes enables the fibres to enclose the nutrients and keep
them from enzyme break-down with their “cage-effect” (Knudsen et al., 1993; Jørgensen et al.,
1996). The high CF content in the scavenger diet might also state the decrease in manure quality
and increase in quantity, due to the water holding capacity of the fibres (Choct and Annison,
1992; Langhout and Schutte, 1996; Francesch M., 2004). The higher quantity of excreta in the
pens where the birds were fed the scavenger diet might also be caused by the higher feed intake.
Though not significant, the effect of the scavenger diet on the tarsometatarsus length was higher
with increasing breed-specific growth rate. This length was slightly, but significantly, higher for
chickens with a higher breed-specific growth rate (P > 0.001) or when fed the commercial diet (P
< 0.01). The ratio of bodyweight and a skeletal measurement, represented here as the length of
the tarsometatarsus, can be considered as an indicator for the conformation of the body (Deeb
and Lamont, 1998). The higher this ratio, the more weight per skeletal unit. A slightly, but not
significantly, higher ratio of bodyweight/ tarsometatarsus length was found for the slow growing
breeds on the scavenger diet compared to the commercial diet. This in contrast with Cobb and
CobbSasso where this ratio was higher for the commercially fed chickens. The share of muscle,
fat and digestive tract in the bodyweight was not determined.
An increasing FCR is generally considered an economic disadvantage but if the scavenger diet can
be obtained at lower cost than the commercial diets, this perspective might change. For example,
in a rural situation, where a scavenger diet can (partially) be found in the environment and is
available at libitum, our results suggest that the slow growing chickens might achieve the same
bodyweights as when they were fed a commercial diet. Still, factors such as disease, water
availability and housing must be controlled (Awuni, 2002; Mwalusanya et al., 2002). In addition,
chickens that are able to find (a share of) their feed in nature will minimize the competition
between humans and livestock for feed/food resources. The results of this experiment also
indicate that industrial broiler breeds will not be able to increase their feed intake sufficiently in
order to grow as fast on a diet with lower energy and nutrient density (such as the scavenger diet

CHAPTER 7
120
in the present study) as they would do on a commercial diet. Extending the production cycle with
ten days, however, is estimated to increase the price with 5% and an average consumer in the
USA indicates to be willing to pay 35% extra (range between -29.6% and 244.3%) for more
sustainable chicken meat (Moynagh, 2000; Van Loo et al., 2011). When using the FCR data from
this study, a Cobb chicken would nearly need twice the amount of scavenger feed compared to
the commercial feed to reach 2.2 kg of slaughter weight. This indicates that the scavenger diet
must be cheaper than half of the commercial diets’ price in order to make the same profit. This
calculation is only an estimate as the number of production cycles a year, transportation costs
and others are not taken into account.
Conclusion
The advantage of selecting fast growing broiler chickens on concentrated diets decreases rapidly
when less concentrated diets are given. This urges us to reconsider the current selection criteria
when considering increasing the amounts of by-products in poultry feed as driven by the feed-
food competition. For slow growing chicken breeds – such as the ones used by smallholders in
developing countries – the added value of using a concentrated diet versus a typical scavenger
diet is low. These differences in growth performance are caused more commonly by differences
in feed intake than by differences in digestive capacity.
Acknowledgements
The authors gratefully acknowledge the professional and technical assistance of Dr. Abdollah
Akbarian, Tessa Van Der Eecken and Herman De Rycke. The chickens were provided by Wout van
Wolfswinkel of Cobb Europe and the feeds were provided by Versele-Laga. No competing
interests exist. The authors sincerely thank both companies for their cooperation. Vanessa van
Schoor is thanked by the authors for the punctual proofreading


Chapter 8
General discussion

124
Take home messages from the studies
1. Human interference induces a shift from a fibrous, low-protein and low-energy
chicken diet to a low-fibre, high-protein and energy-rich chicken diet (Chapter 3).
2. Many different ingredients were found to be ingested by free-roaming, rural chickens
and insects were found in nearly each crop (Chapter 3).
3. Rural chickens in Limpopo, South-Africa are managed with a minimum of time, money
and effort. Both scavenged and supplemented feed is needed for the chickens to
survive but starvation is rarely a cause of death (Chapter 4).
4. Cecal drop is a good representative of the cecal microflora regarding bacterial
community, richness and diversity and fecal drop is not (Chapter 5a).
5. The scavenger diet showed an increase in bacterial diversity and a change in the
community composition compared to the commercial diet (Chapter 5a).
6. Ten bacterial genera were found to be indicative for the scavenger diet and two for
the commercial diet (Chapter 5b).
7. Chitin biases the results for crude protein analysis. However, the level of nitrogen
derived from chitin in insects is quite low compared to the overall nitrogen content
(Chapter 6).
8. The superiority of fast growing breeds compared to slow growing breeds decreases
when fed a scavenger diet compared to a concentrated diet (Chapter 7).

GENERAL DISCUSSION
125
General discussion
Decreasing the share of food in the feed of chickens, is not a goal on itself. Decreasing the feed-
food competition is about increasing the use of human-inedible sources and reducing the spillage
of ingredients that can still be used in feed. This in order to increase the food security for a
growing human population all around the world. In this dissertation, rural chickens were
observed as a model for a minimal feed-food competition (Chapter 3). Observing the scavenging
diet of free-ranging chickens taught that chickens ingest a huge variety of ingredients such as
seeds, insects and green forage, and that they do not avoid fibrous ingredients, while fibre is
generally considered unimportant in commercial poultry diets. Two points of interest were
subsequently identified.
The first one is the fibre content. As fibre fermentation is done by bacteria in the ceca, studies
on the cecal microbiome of chickens will be important in the future (Chapter 5a). The second
point concerns insects. They are believed to be one of the most promising alternative ingredients
of the future. Nevertheless, in order to analyse digestibility and nutritional composition of insects
or samples that contain insects, specific methods will be necessary (Chapter 6).
As the chickens observed in Chapter 3 are all slow growing, rural chickens, questions rise how
high productive, fast growing chickens will perform on low concentrated diets. Chapter 7 showed
a linear relation between the growth rate and the effect of a scavenger diet on weight gain.
Sussex, a slow growing breed, achieved the same growth rate on both diets. Although Cobb, the
fastest growing breed, still grew fastest of all breeds and regardless the diet, its superiority
decreased. This indicates that the best performing breeds in commercial situation should not
necessarily be the breeds of choice when the diet changes.
As no effect of diet could be shown on the growth rate of slow growing chickens (Chapter 7),
other points of focus should be identified in the attempt to increase the profit that rural chicken
owners make of keeping chickens. Rural chicken owners in Limpopo, South-Africa, were
questioned about the management of their chickens and the ingredients in their crops were
identified (Chapter 4). Disease prevention and protection of the chickens against predators are
important points of focus when attempting to increase the profit for rural chicken owners in this
area.

GENERAL DISCUSSION
126
On the one hand, rural chicken owners in developing countries might feed their chickens with
local ingredients in order to decrease the effect of currency devaluation and import costs
(Hutagalung, 2000; FAO, 2002). They can choose to use local breeds, even though they grow
slowly and have a low productivity, because their meat is more appreciated by the consumers
and they are able to take care of themselves and their offspring in extensive situations (Pym,
2008; Alders and Pym, 2009). Farmers who grow broilers in an intensive management system, on
the other hand, maximize their profits by using breeds that grow extremely fast on diets that
contain high levels of highly digestible protein and energy (Gill et al., 2010; Snels, 2012;
Tscharntke et al., 2012), although, the prices of these diets are high and these chicken breeds
often cope with health problems related to their high productivity (Donohue and Cunningham,
2009; Kalmar et al., 2013). Farmers in general, however, will only change their management if,
for example, the feed costs or the health of their chickens, increase the profit. Furthermore, as
the feed prices increase over the years, a tipping point might arrive where a lower production is
justified by the lower costs of feed ingredients.
When attempting to decrease the feed-food competition, many factors are involved. This PhD
thesis highlights some of them, however, we fully acknowledge that this list is not complete and,
therefore, end with suggestions for further research.
8.1. Methods to decrease the feed-food competition in the chicken industry
Lower the fibre content in fibre-rich ingredients
Obtaining complete guidelines regarding fibre, and especially the different fibre fractions, in the
feed of chickens is difficult (NRC, 1994; DeVries, 2003; Hall, 2003). It is even more complicated as
the optimal content and composition of fibre fractions in the diet will change with breed, age,
housing and health of the chickens (Hetland and Svihus, 2001; Jiménez-Moreno et al., 2010;
Mateos et al., 2012). Yet, high fibre contents will be one of the biggest challenges when
incorporating alternative ingredients in the chickens’ diets. Many of the suggested alternative
ingredients (Appendix 1) and nearly all diets of free roaming chickens, contain high levels of fibre

GENERAL DISCUSSION
127
compared to the commercial diets (up to 10% versus 4%) (Chapter 3). None of the studies
considered in Chapter 3 properly reported the content of the different fibre fractions in the
studied diets.
Although the contents of different fibre fractions in the scavenger diet and the capabilities of
rural chickens to deal with them are still unclear, reducing the fibre content of fibrous ingredients
will benefit the performance of the chickens (Kalmendal et al., 2011). The energy that chickens
can obtain from non-starch polysaccharides (NSP) rich ingredients is negligible (Jørgensen et al.,
1996). In addition, NSP can cause a “cage-effect” and, therefore, prohibit the accessibility by
enzymes to other nutrients (Bedford, 2002). Decreasing the fibre content in the alternative
ingredients can be done with a low risk of decreasing the fibre to a suboptimal level as 1) green
forages, leaves, seeds and/ or other fibrous ingredients, can easily be provided ad libitum and 2)
some alternative ingredients (Appendix 1) and scavenger diets (Tadele, 1996) show very high
levels of crude fibre.
Different methods to decrease the fibre in the chickens’ diet have been applied before. Enzymes
such as xylanase are a standard add-on in the commercial diets based on wheat (Bedford and
Schulze, 1998; Hetland and Svihus, 2001; Choct, 2006; Cowieson et al., 2006). They increase the
accessibility of the endogenous enzymes to the starch, therefore reducing the cage-effect caused
by the fibres (Bedford, 2002).
The cecal microbiota are responsible for the breakdown of fibres in the diet (Dunkley et al., 2007)
and are linked with the feed conversion of the chickens (Stanley et al., 2012). However, no
differences in cecal microflora between breeds have been found in our study (Chapter 5a).
Studying the cecal microflora of rural chickens, not only exposed to a scavenger diet since the
day they hatched, but also descending from generations of free roaming chickens, therefore
possibly adding a heritable effect (Amerah et al., 2009; Anderson et al., 2012), might provide
other results. Based on evolutionary fitness (Darwin, 1859), it can be expected that the cecal
microflora of rural chickens substantially differs from the one of commercial breeds and
promotes better fibre fermentation because 1) the cecal microflora is responsible for the fibre
degradation (Mathlouthi et al., 2002; Dunkley et al., 2007), 2) the scavenger diet is high in fibre

GENERAL DISCUSSION
128
(Chapter 3), and 3) the microflora of the chicks is determined by the environment and the gut
microflora of the mother (Amit-Romach et al., 2004). In addition, the scavenger diet increases
the diversity and richness of the cecal microflora (Chapter 5a), though, the effect of this change
on digestive capacity or health could not be ascertained (Chapter 5b). According to some authors,
the capacity to digest fibre increases with the age of the chicken (Carré et al., 1995) but this is
contradicted by others (Kras et al., 2013). Inoculating commercial chicks with the microbiota of
adult, rural chickens, might be one of the strategies to increase the use of fibre in the diet. Nurmi
and Rantala (1973) showed that by inoculating chicks with the cecal content of healthy adult
chickens, they are protected against Salmonella infection. So far, no studies have monitored the
effect of transplanting the cecal microflora on the breakdown of fibres.
When comparing the microbiota of children in Burkina Faso to European children, big differences
were found because their diet substantially differed (De Filippo et al., 2010). The diet of the
children in Burkina Faso was higher in fibre and lower in fat, animal protein, calories, sugar and
starch compared to the European diet. The evolutionary similarity with the diets of industrial and
rural, indigenous chickens is clear (Chapter 3). The microbiome of children in Burkina Faso was
richer and more diverse, which was also seen when comparing chickens on a commercial and on
a scavenger diet (Chapter 5a). For the children of Burkina Faso, more SCFA were produced, which
are known to benefit the gut health and to protect against colonization of pathogenic species (De
Filippo et al., 2010). For chickens too, SCFA are proven to stimulate the chickens’ health by
providing energy to enterocytes and inhibiting the colonization of pathogens by decreasing the
pH (Patterson and Burkholder, 2003). Another human study linked lower fibre in the diet to
“Western” diseases such as ischemic heart problems, high serum cholesterol levels and
gallbladder diseases (Burkitt et al., 1974). For these diseases too, there is a similarity with
industrial chickens as they suffer from ascites, heart conditions and fatty liver (Kalmar et al., 2013;
Rozenboim et al., 2016). A study in Nature discovered that mice, fed a low fibre diet, not only lost
a share of their microbiota richness, this loss was also irreversible when increasing the fibre in
the diet again. Furthermore, this loss was passed on to their offspring (Sonnenburg et al., 2016).
These results alarmed the authors as similarities with the Western human situation are obvious.
For chickens too, it can be expected that indigenous, free-ranging chickens might be important

GENERAL DISCUSSION
129
in the future as microbiota donors for the industrial chickens. Not only in terms of fibre
digestibility, but also to increase their overall health.
Another way of decreasing the level of fibre is to include an extra step in the feed processing.
Insects convert grass, kitchen waste, leaves and even manure, to protein and fat. Rather than
giving this organic material directly to the chickens, it would be interesting to let insects
decompose it first and, afterwards, feed the insects to the chickens (Awoniyi et al., 2003; Diener
et al., 2009; Makkar et al., 2014; Maurer et al., 2015). In the same idea this “processing” of waste
can also be done by bacteria. Positive effects of adding bacteria protein meal to the diet of
broilers have been demonstrated (Øverland et al., 2010 a-b).
Reducing the fibre content in fibrous feed ingredients will generally benefit the performance of
the chickens, however, one should not forget the benefits of fibre on the welfare and health of
the chickens. It improves the function of the gizzard (Jiménez-Moreno et al., 2010), increases the
digestibility of fat and protein (Alzueta et al., 2010), enriches the cecal microflora (Chapter 5a-b)
(Mathlouthi et al., 2002; Wang et al., 2005) decreases hunger (Jones et al., 2010) and increases
immunity (Schley and Field, 2002; Guo et al., 2003). Still, these effects are specific for the study
setup, for a particular source of fibre, inclusion level, age of the chickens, … (Jørgensen et al.,
1996; Jiménez-Moreno et al., 2010; Mateos et al., 2012). These effects, and many more, could
increase the welfare of chickens in the industry and are important to rural chickens, where drugs
are not standardly available and optimal use of the nutrients in the diets is essential (Goodger et
al., 2002).
Which breeds to use?
Slow growing breeds show more resilience to a challenging diet compared to fast growing breeds
(Chapter 7). This is in accordance to previous studies (Havenstein et al., 1994; Grashorn, 2006),
where “older” or “slower growing” breeds were less affected by an energy low diet compared to
the industrial breeds. However, even on the scavenger diet, the fast growing breeds still reach
the highest body weights (Chapter 7). These results can be interpreted in two ways: one can
conclude that rural chicken owners will benefit from exchanging their slow growing breeds for
fast growing chicken breeds. Or, one can conclude that owners of slow growing chickens can

GENERAL DISCUSSION
130
reduce their feed costs by exchanging the grains and commercial diets for locally available
substrates. Feed costs in the chicken industry occupied 68.7% of the production costs in 2008
and feed prices are shown to increase over the years (Figure 8.1.) (Hinrichs and Steinfeld, 2007;
Donohue and Cunningham, 2009).
Figure 8.1. Feed cost per ton for the US broiler industry (Donohue and Cunningham, 2009).
Slow growing indigenous breeds cannot be replaced by fast growing industrial chickens without
consequences. Features, important to survive in rural circumstances, might have been lost during
“unconscious” selection (Darwin, 1859). For example, a negative relation was found between
growth rate of chicken breeds and their immunity (Qureshi and Havenstein, 1994; Van Der Most
et al., 2011). Additionally, when White Leghorns are compared to red junglefowl, the foraging
strategy of the Leghorn was less active, the Leghorn was less responsive to fear tests with a hawk
model (Schütz et al., 2001), and red junglefowl were able to process more information during
foraging and forage more intensively for their feed (Lindqvist et al., 2002). Although not
confirmed by the results in Chapter 7 of this thesis, a better fibre diet digestibility was found for
the slow growing Label Rouge, compared to fast growing Cobbs (Kras et al., 2013). All these
features are important for chickens in rural situations.
In addition, the meat and eggs of indigenous chickens are preferred by the local people, who are
willing to pay a surplus for them (Guèye et al., 1997). Indigenous chickens play a cultural role in
ceremonies or as gifts and they provide an immediately available source of money in case of

GENERAL DISCUSSION
131
financial problems. Chapter 4 showed that the main reasons why rural people in Limpopo, South-
Africa, kept chickens were: meat for own consumption, reduction of kitchen waste and to have
some backup money. Selling and consumption of eggs were indicated as secondary reasons only.
Most of the chickens kept in the complete free-range system are in hands of women, providing
an income for them and therefore contributing to gender equality (Ekue et al.; Guèye, 2003;
Guèye, 2005). This is in contrast to more intensive systems which are often under the control of
business men. In addition, slow growing breeds can be managed with a low input, making it
possible for the poorest to provide an animal protein source for their families (Guèye, 1998;
Sonaiya et al., 1999; Henning et al., 2007). In developing countries, especially for young children,
both the physical and mental development are strongly correlated with the level of animal
products consumed. These animal products provide extra protein, but their biggest value lies
with the provision of extra micro-nutrients (mainly vitamin A, vitamin B12, riboflavin, Fe, Zn and
Ca) (Calloway et al., 1988; Allen et al., 1992; Murphy and Allen, 1996). This illustrates the
importance of an affordable animal component in the diet of people in developing countries.
When keeping slow growing, rural chickens on a scavenger diet, many points will require
attention. As shown in Chapter 7, the feed intake of the chickens increases when they shift to a
diet that is lower in energy and protein. Therefore, enough quantity of feed must be assured in
order to reach the maximal productions for a particular diet-breed combination. None of the
reviewed studies on the chickens’ natural feed, and our study neither (Chapter 3-4), included
information about the absolute amount of feed ingested. The relative composition of the diet
was presented, but this included only percentages and no daily volumes. It will technically be a
challenge to obtain these data in a situation where chickens roam around freely (Yo et al., 1997),
though, absolute quantities might be more determinative to the chickens’ performance
compared to the nutritional composition of the diet (Chapter 7). Of course, to optimize
performance in rural environments, other basic needs such as disease control and predator
control should also be taken care of (Alexander, 2001; Awuni, 2002)(Chapter 4).
Progresses in the fields of disease control, housing, management and others all contributed to
the industrial production results of today. When increasing the use of alternative ingredients,
these aspects might have to change too. It would be interesting to reconsider the industrial

GENERAL DISCUSSION
132
breeds and select chickens towards performance on low energetic diets. In that case, some
management factors might have to change too. It might, for example, be more economical to
rely on the feed flexibility of the chickens seen in Chapter 3 and 4. Anticipation to available
ingredients at the moment will be quicker, as no time and money will need to be spent on
preparing the “perfectly balanced” feed. Chickens can combine available protein sources to
maximize performance (Shariatmadari and Forbes, 1993; Gous and Swatsom, 2000), in addition,
their diet choice might be influenced by factors such as sex, age and health depending on their
specific need (Savory et al., 1978; Arshad et al., 2000; Minh et al., 2006). Not only will chickens
have the opportunity to compose their nutrient profile as they desire it will also increase their
welfare as picking, scratching and selecting their feed is close to their natural behavior (Costa et
al., 2012). Fanatico et al. (2016) showed an improved FCR for organic chickens that were choice
fed compared to a more expensive formulated diet. In addition, chickens can also limit their
protein intake if ingredients, (too) rich in protein, are offered (Kim, 2014).
Insects, alternative ingredient of choice?
As insects are found in the crop of nearly all chickens that were sampled (Chapter 4) and as they
were recited in each study that focusses on the diet of rural chickens (Chapter 3), they cannot be
overlooked as alternative ingredients in the chicken’s diet. They do not only provide animal
protein and fat, they can also reduce waste products. For example, black soldier flies can grow
on fish offal and cow manure (St-Hilaire et al., 2007) and an inclusion of 12% house fly larvae
meal, grown on municipal organic waste, did not affect final weight or feed conversion, compared
to a soybean meal diet (Ocio et al., 1979). Furthermore has it been proven that insects reduce
the number of bacteria in manure (Erickson et al., 2004).
Still, before the European Union will allow insects in the feed of livestock, much more research
will have to be completed. In general, the European legislation about insects as feed and food is
confusing as it is not clearly stated in the law whether insects are “novel food” and whether they
are considered animals when they are included in the diet (Belluco et al., 2013; van der Spiegel
et al., 2013). The EFSA wants to be sure that no health risks are involved for the consumers,
consuming insects or livestock fed with insects. Therefore all scenarios of allergies, disease

GENERAL DISCUSSION
133
transmission and toxic components have to be studied thoroughly (Adamolekun et al., 1997;
Linares et al., 2008; Klunder et al., 2012). Information about specific rearing methods (Sheppard
et al., 2002; Tomberlin et al., 2009), processing and storage (Klunder et al., 2012), preservation
of the nutrients (Kinyuru et al., 2010) and many more, is needed before insect breeding for
industrial purposes can be profitable. In addition, when including insects in the feed, nutrient
composition, availability and digestion will have to be tested too (Banjo et al., 2006; Finke, 2007;
Oonincx and Dierenfeld, 2012; Pieterse and Pretorius, 2013).
Getting a correct view on the different nitrogen fractions in chitin-containing diets is not easy
(Chapter 6). Chitin biases the results of the crude protein analysis by the Kjeldahl method because
it contains nitrogen. However, the level of chitin in insects is not found to be extremely high
(Chapter 6). Therefore, it can be concluded, in accordance with Finke (2002), that the protein
content, evaluated by the Kjeldahl method, does not significantly deviate from the actual protein
content. In 2007, Finke even reported lower levels of chitin (Finke, 2007), but this is probably due
to a mistaken citation. In an alternative diet, where insects only represent one of the ingredients,
the nitrogen derived from chitin will represent an even be smaller share of the total nitrogen
content. Yet, other sources of nitrogen, such as DNA, vitamins and amides, can also be present.
The results of Chapter 6 indicate that this share of nitrogen is bigger than the one derived from
chitin.
Even when the nitrogen in chitin does not substantially causes an overestimation of the protein
content in insects, it might still decrease the availability of the protein present. As chitin is stored
in the cuticle, which has the function of an exoskeleton, the question rises whether other
nutrients are still accessible for the enzymes in the gut (Hossain and Blair, 2007). This “cage-
effect” has been described for fibres in the cellwalls of grains before, where it is often bypassed
by adding enzymes to the diet. Puncturing the exoskeleton improved the bioavailability of the
nutrients in crickets and mealworms (Prinz et al., 2003). However, in free roaming chickens,
insects in the crop are rarely found in pieces (Figure 8.2.). Chickens appear to fully swallow their
feed, without picking it to pieces first. In order to get to the nutrients captured by the
exoskeleton, they thus have to rely on enzymes to digest the chitin and/ or have to mechanically
crush the insects in the gizzard.

GENERAL DISCUSSION
134
Figure 8.2. Intact invertebrates found in the crop of scavenging chickens in Limpopo, South-Africa.
Endogenous chitinase, the enzyme that digests chitin, is found in the proventriculus, gizzard and
liver of chickens (Han et al., 1997; Suzuki et al., 2002; Koh and Iwamae, 2013). Chitinase producing
bacteria in the microflora have been reported too (Whitaker et al., 2004), however, to our
knowledge, never in chickens. A chitin digestibility of 92% was found for laying hens (Hirano et
al., 1990), though the experimental design of this study is not completely clear. Much lower chitin
digestibility was found for a study on broilers where excreta were collected for three subsequent
days. A maximum of 24% was found for a 1.3% chitin diet, and the chitin digestibility decreased
with increasing chitin inclusion (Khempaka et al., 2006). Hossain and Blair (2007) described a
digestibility between 45% and 50% for chitin inclusion between 2.5% and 7.5%.
Both positive and negative effects of chitin on the performance of chickens have been reported
(Ramachandran Nair et al., 1987; Okoye et al., 2005; Khempaka et al., 2006). Chitin has been
suggested to not provide energy (Weiser et al., 1997) but to benefit the performance of chickens
by stimulating immunity (Huang et al., 2007), increasing feed intake (Ramachandran Nair et al.,
1987) or by acting as a prebiotic by increasing Lactobacillus and decreasing E. coli in the cecum
(Li et al., 2007). When feeding chickens a scavenger diet, containing mealworms, Lactobacillus
was found as an indicator genus for the scavenger diet (Chapter 5b). Some Lactobacilli spp. are

GENERAL DISCUSSION
135
proven to have probiotic effects in the cecum of chicken as they produce lactate and propionate
and stimulate butyrate-producing bacteria (Meimandipour et al., 2009). Although E. coli is
present in the intestines of healthy chickens, pathogenic strains can cause big losses. In addition,
there exists a high prevalence of antibiotic resistance among E. coli. Therefore, extra options,
such as chitin, to keep E. coli low, are valuable (Dho-moulin and Fairbrother, 1999).
8.2. Advantages for farmers and chickens
The increasing demand for grains in the fuel, food and feed industry has nearly doubled the live
production costs for broilers in the USA (from $0.25 to $0.45 between 2006 and 2008) (Donohue
and Cunningham, 2009) (Table 8.1.). When asking rural chicken owners in Limpopo, South-Africa,
about their main reasons for not keeping more chickens, 53.6% agreed that the feed expenses
are too high (Chapter 4). Offering alternative feed ingredients, less wanted in the human diet or
in the fuel industry, will allow those farmers to decrease their feed costs, even if only partial.
Table 8.1.: Components of live production costs of broilers in the USA as a percentage of total
production (Donohue and Cunningham, 2009).
2001 2007 August 2008
Chick cost 16.2 13.4 10.9
Grower cost 19.9 17.0 11.8
Feed ingredient 51.8 59.1 68.7
Mill and delivery 4.3 4.3 3.4
Vaccine & medicine 0.3 0.2 0.2
Live haul 5.2 4.4 3.5
Others 2.3 1.7 1.5
Hutagalung (2000) studied the poultry industry in Indonesia and concluded that low-protein
diets, supplemented with essential amino acids, provided a significant profit margin, although
production performance was lower compared to conventional methods. Equally so, compared to
conventional methods, these farmers were less dependent on global price fluctuations, currency

GENERAL DISCUSSION
136
devaluations and import costs, the latter often being too high for the poorest countries (FAO,
2002).
People in developed countries are willing to pay a surplus for organic poultry meat, based on
their concern for their health, animal welfare and environment (Oberholtzer et al., 2006). It is
estimated that breeding broilers that are ready for slaughter at 50 days instead of 40 days will
increase the overall production price with 5% (Moynagh, 2000), opening possibilities to include
slower growing breeds in the industry as the average consumer in the US is willing to pay 35%
extra (range between -29.6% and 244.3%) (Van Loo et al., 2011). The surplus that consumers are
willing to pay for organic food increased over the years together with the demand for organic
poultry meat (Oberholtzer et al., 2006).
Alternative diets, often high in fibres, might benefit the welfare of the chickens (reviewed by
Hetland et al., 2004) as fibre is shown to reduce hunger and therefore reduce cannibalism
(Hocking et al., 2004), stimulates the development of the digestive organs, both mechanically
and by the production of SCFA (Eeckhaut et al., 2008; Jiménez-Moreno et al., 2010) and boosts
the immune system (Schley and Field, 2002). When offered a choice, chickens, raised on grains,
equally consume insects, fruits (Actinidia arguta) and grains, although some time for adaptation
was needed (HoGent, 2015). Reverting to breeds that are less selected for high performance on
energy-rich diets, can solve some health problems that are regularly seen in the industry.
Selection caused, for example, a decrease of 20% to 33% of the lung volume per bodyweight unit
and makes these chickens, therefore, more vulnerable to stress factors (Vidyadaran et al., 1990).
Van der Most et al. (2011) found that selection for growth compromised immune function of
chickens, meaning that fast growing breeds depend more on antibiotics and therefore contribute
to the overall problem of antibiotic resistance for both animal and human (reviewed by Silbergeld
et al., 2008). In addition, drug residues in meat and eggs are a huge concern (Nisha, 2008). A
survey in Iraq found residues in 52% of the meat pieces tested (Shareef et al., 2009). Furthermore,
the use of antibiotics can also be reduced as fibres will improve the gut health through production
of butyrate and other SCFA (Eeckhaut et al., 2008).

GENERAL DISCUSSION
137
8.3. The opposition
Reducing the feed-food competition by reducing the share of human-edible feed might sound
evident, but many authors conclude differently. It has been suggested that decreasing the share
of cereal grains in the feed will decrease the cereal prices and will stimulate farmers to shift to
higher profit crops, bypassing the idea of increasing the availability of cereal grains to the people
(FAO, 2011). Westhoek et al. (2011) calculated that when livestock would only be fed grasses and
by-products, less than half of the livestock could be maintained and Keyzer et al. (2005)
concluded that animal production on residue-based feed alone will only be possible when the
demand for meat is low. The FAO (2011) concluded “there is no technical or economical
alternative to intensive production for providing the bulk of the livestock feed supply in the
future”. Bradfort et al. (1999) stated that research into ways of supplying more cereal grains will
be needed anyway.
Considering these opinions does not conclude that alternative ingredients will not be useful. As
chickens represent such a high share of the global livestock (Table 8.2.) and as they are the
livestock species that consumes most human-edible feed (Wilkinson, 2011), even small
improvements will substantially contribute to sustainable feeding. When only a share of cereal
grains can be replaced by alternatives in the chickens’ diet, a substantial amount of cereal grains
will become available to be used as food. Possibly, when the demand for feed-grains decreases,
the prices will drop and grain farmers might switch to higher priced crops. This is, however, not
necessarily a disadvantage as the supply of those high-priced crops will increase and therefore
those prices might drop, hence promoting the accessibility of human food sources after all. A
decreasing demand for cereal grains in feed might also be buffered by a concomitant rise of
cereal demand in the bio-fuel industry.

GENERAL DISCUSSION
138
Table 8.2. Total number of livestock species, cats and dogs, and humans in the world (Leenstra
and Vellinga, 2011; FAOSTAT, 2015)
Species Total number in the world
Chickens 21.3 billion
Humans 7.3 billion
Sheep & goats 2.2 billion
Cattle 1.5 billion
Pigs 986.6 million
Cats & dogs 438 million
Horses 58.9 million
Many of the suggested alternative ingredients are higher in fibre, have a lower protein content
or a less suitable amino acid profile compared to cereal grains and soybean meal (Appendix 1).
Others, however, strongly match the chickens’ requirements. Makkar et al. (2014) reviewed the
possibilities of different insect species in feed by comparing them to fishmeal and soybean meal
and concluded that they are of perfect nutritional quality to be included. Furthermore, increasing
more fibrous ingredients in the diet should not plainly be considered negative. Benefits on health,
digestibility and animal welfare by increasing the fibre content in feeds have been discussed
higher and hypotheses of increasing the fibre digestibility by transplanting cecal microbiota or
crossbreeding with rural breeds have been stated. In addition, protein and vitamin guidelines are
often overestimating the chickens’ needs. This does not only unnecessarily decrease the
applicability of alternative ingredients, it also increases the burden on the environment as more
nitrogen will be released.
Other solutions to decrease the feed-food competition than only decreasing human-edible
ingredients in livestock feed should be considered too. One third up to half of the food after
harvesting is reported to be wasted (Lundqvist et al., 2008; Gustavsson et al., 2011). Developing
countries lose over 40% of food post-harvest or during processing because of storage and
transport conditions. Industrialized countries have lower producer losses, but at the retail or
consumer level more than 40% of food is wasted (Gustavsson et al., 2011). Improving

GENERAL DISCUSSION
139
infrastructure, raising awareness among the consumers and increasing the use of rejected food
and leftovers, might help to reduce the waste. Boonen (2015) states that agriculture should focus
on the needs but acknowledges that “wealth encourages creations of desired demands”. Meat
consumption in the Western world, for example, has far exceeded nutritional needs (Westhoek
et al., 2011). As much as decreasing meat consumption in these countries would be beneficial,
this cannot be extended to the whole world as animal protein, meat included, plays an important
role in a balanced diet (Murphy and Allen, 1996). Even in developed countries, vegetarianism is
not the solution either. Although a balanced diet without meat can be composed in developed
countries, an increased amount of female animals would be needed to produce enough eggs and
milk. Today, two thirds of the beef in Europe comes from dairy cows (Topliff et al., 2009). The
biggest influence, however, lies with the consumer. Paying a fair price for local, healthy and
sustainable products will benefit all parties.
8.4. Shortcomings, research limitations and future research
Based on the studies described in Chapters 3-7, some suggestions for further research can be
made. Information on the diet choice of chickens, without human interaction, was very difficult
to obtain (Chapter 3). Only one study could be found (Savory et al., 1978) in which chickens were
not supplemented. Studying chickens, living away from crop fields or other human provision,
would give new insights. Not only the ingredients they ingest, but also the absolute volume of
feed they consume per day and the nutritional composition, with extra attention for the different
fibre fractions, would be very interesting.
Composing a diet for the trial described in Chapter 7, as a representative of a scavenger diet, was
a challenging mission. Fibre-rich ingredients and insects were included as they were found in the
scavenger diets described in Chapter 3. However, the protein content of the scavenger diet was
still quite high (18.7%) and the chicks on the scavenger diet got the chance to gradually adapt to
the scavenger feed. In addition, chickens that roam around seldom have their feed freely
available, where in this study the feed was available ad libitum.

GENERAL DISCUSSION
140
No difference in digestive capacity or cecal microflora between four breeds could be found
(Chapter 5a and 7). However, an extra trial, with more extreme breeds (indigenous chickens for
example), might show differences in digestive capacity and/ or cecal microflora. When chickens
are found, able to digest fibre to a bigger extent, one can proceed with in vitro studies and
inoculation trials. When performing an in vitro study, the digestibility of pure fibre samples,
including chitin, can be analysed.
Selecting chickens to perform on alternative ingredients would be a long term project. But once
a chicken breed is developed, able to optimize its production fed on alternative ingredients, both
developing and developed countries might benefit.
The value of sensitizing consumers about the whereabouts of their food, both in developing and
developed countries, should not be forgotten. Reducing waste, using local products and taking
care of the environment are things that all of us can apply on a personal level. All these matters,
reducing the feed-food competition included, will contribute to a sustainable world for the
future.


References


REFERENCES
145
References
Abou-Elezz Fouad Mohammed, K., L. Sarmiento-Franco, R. Santos-Ricalde, and J. F. Solorio-Sanchez. 2012. The nutritional effect of Moringa oleifera fresh leaves as feed supplement on Rhode Island Red hen egg production and quality. Trop. Anim. Health Prod. 44:1035–1040.
ACMF. 2013. Efficienty of chicken meat. Available from: http://www.chicken.org.au/page.php?id=4
Adamolekun, B., D. W. McCandless, and R. F. Butterworth. 1997. Epidemic of seasonal ataxia in Nigeria following ingestion of the African silkworm Anaphe venata: Role of thiamine defi ciency? Metab. Brain Dis. 12:251–258.
Aguilar, Y. M., O. M. Yero, M. I. V Navarro, C. A. B. Hurtado, J. A. C. López, and L. B. G. Mejía. 2011. Effect of squash seed meal (Cucurbita moschata) on broiler performance, sensory meat quality, and blood lipid profile. Rev. Bras. Cienc. Avic. 13:219–226. Available from: http://www.scopus.com/inward/record.url?eid=2-s2.0-84857862596&partnerID=tZOtx3y1
Aini, I. 1990. Indigenous chicken production in South-east Asia. Worlds. Poult. Sci. J. 46:51–57.
Alders, R. G., and R. a. E. Pym. 2009. Village poultry: still important to millions, eight thousand years after domestication. Worlds. Poult. Sci. J. 65:181–190. Available from: http://www.journals.cambridge.org/abstract_S0043933909000117
Alexander, D. J. 2001. Gordon Memorial Lecture. Newcastle disease. Br. Poult. Sci. 42:5–22.
Ali, S., and S. D. Ripley. 1989. The compact handbook of the birds of India and Pakistan. Oxford University Press, Bombay, India.
Ali, S. 2002. Study on the effect of feed supplementation to laying hen under the rural condition of Bangladesh. The Royal Veterinary and Agricultural University.
Allen, L. H., J. R. Backstrand, E. J. Stanek, G. H. Pelto, A. Chavez, E. Molina, J. B. Castillo, and A. Mata. 1992. The interactive effects of dietary quality on the growth and attained size of young Mexican children. Am. J. Clin. Nutr. 56:353–364.
Almeida, G. F. D., L. K. Hinrichsen, K. Horsted, S. M. Thamsborg, and J. E. Hermansen. 2012. Feed intake and activity level of two broiler genotypes foraging different types of vegetation in the finishing period. Poult. Sci. 91:2105–2113.
Al-Nasser, a., H. Al-KHALAIFA, a. Al-Saffar, F. Khalil, M. Albahouh, G. Ragheb, a. Al-Haddad, and M. Mashaly. 2007. Overview of chicken taxonomy and domestication. Worlds. Poult. Sci. J. 63:285. Available from: http://www.journals.cambridge.org/abstract_S004393390700147X
Alzueta, C., M. L. Rodríguez, L. T. Ortiz, a Rebolé, and J. Treviño. 2010. Effects of inulin on growth performance, nutrient digestibility and metabolisable energy in broiler chickens. Br. Poult. Sci. 51:393–398.
Amerah, a M., V. Ravindran, and R. G. Lentle. 2009. Influence of insoluble fibre and whole wheat inclusion on the performance, digestive tract development and ileal microbiota profile of broiler chickens. Br. Poult. Sci. 50:366–375.
Amit-Romach, E., D. Sklan, and Z. Uni. 2004. Microflora ecology of the chicken intestine using 16S ribosomal DNA primers. Poult. Sci. 83:1093–1098.
Anderson, J. O., and R. E. Warnick. 1966. Sequence in which essential amino acids become limiting for growth of chicks fed rations containing cottonseed meal. Poult. Sci. 45:84–89.
Anderson, O. S., K. E. Sant, and D. C. Dolinoy. 2012. Nutrition and epigenetics: an interplay of dietary methyl donors, one-carbon metabolism and DNA methylation. J. Nutr. Biochem. 23:853–859.
Apajalahti, J. H. a, A. Kettunen, M. R. Bedford, and W. E. Holben. 2001. Percent G+C Profiling Accurately Reveals Diet-Related Differences in the Gastrointestinal Microbial Community of Broiler Chickens. Appl. Environ. Microbiol.

REFERENCES
146
67:5656–5667.
Apajalahti, J., A. Kettunen, and H. Graham. 2004. Characteristics of the gastrointestinal microbial communities, with special reference to the chicken. Worlds. Poult. Sci. J. 60:223–232.
Apajalahti, J. 2005. Comparative gut microflora, metabolic challenges, and potential opportunities. J Appl Poult. Res 14:444–453.
Arshad, M. I., M. Zakaria, A. S. Sajap, and A. Ismail. 2000. Food and Feeding Habits of Red Junglefowl. Pakistan J. Biol. Sci. 3:1024–1026.
Atkinson, J. L., J. W. Hilton, and S. J. Slinger. 1984. Evaluation of acid-insoluble ash as an indicator of feed digestibility in rainbow trout (Salmo gairdneri). Can J Fish Aquat Sci 41:1384–1386.
Aviagen. Available from: http://en.aviagen.com/
Aviagen. 2012. Ross 308 broiler performance objectives. Available from: http://en.aviagen.com/assets/Tech_Center/Ross_Broiler/Ross308BroilerPerfObj2012R1.pdf
Awad, W. a, K. Ghareeb, S. Abdel-Raheem, and J. Böhm. 2009. Effects of dietary inclusion of probiotic and synbiotic on growth performance, organ weights, and intestinal histomorphology of broiler chickens. Poult. Sci. 88:49–56.
Awoniyi, T. A. M., V. A. Aletor, and J. M. Aina. 2003. Performance of broiler-chickens fed on maggot meal in place of fishmeal. Int. J. Poult. Sci. 2:271–274.
Awuni, J. 2002. Strategies for the improvement of rural chicken production in Ghana. … Parameters Fam. Poult. Prod. Africa. Available from: http://www-naweb.iaea.org/nafa/aph/public/4-strategies-awuni.pdf
Badubi, S. S., M. Rakereng, and M. M. 2006. Morphological characteristics and feed resources available for indigenous chickens in Botswana. Livest. Res. Rural Dev. 18.
Banjo, a D., O. a Lawal, and E. a Songonuga. 2006. The nutritional value of fourteen species of edible insects in southwestern Nigeria. African J. Biotechnol. 5:298–301. Available from: http://tspace.library.utoronto.ca/handle/1807/6678
Barnes, E. M., G. C. Mead, D. A. Barnum, and E. G. Harry. 1972. The intestinal flora of the chicken in the period 2 to 6 weeks of age, with particular reference to the anaerobic bacteria. Br. Poult. Sci. 13.
Barona, E., N. Ramankutty, G. Hyman, and O. T. Coomes. 2010. The role of pasture and soybean in deforestation of the Brazilian Amazon. Environ. Res. Lett. 5:024002.
Batal, a B., and C. M. Parsons. 2002. Effects of age on nutrient digestibility in chicks fed different diets. Poult. Sci. 81:400–407.
Becker, J., and C. Wittmann. 2012. Systems and synthetic metabolic engineering for amino acid production - the heartbeat of industrial strain development. Curr. Opin. Biotechnol. 23:718–726. Available from: http://dx.doi.org/10.1016/j.copbio.2011.12.025
Bedford, M. R., and H. Schulze. 1998. Exogenous enzymes for pigs and poultry. Nutr. Res. Rev. 11:91–114.
Bedford, M. R. 2002. The role of carbohydrases in feedstuff digestion. In: Poultry Feedstuffs: Supply, Composition and Nutritive Value. p. 319–336.
Belluco, S., C. Losasso, M. Maggioletti, C. C. Alonzi, M. G. Paoletti, and A. Ricci. 2013. Edible Insects in a Food Safety and Nutritional Perspective: A Critical Review. Compr. Rev. Food Sci. Food Saf. 12:296–313. Available from: http://doi.wiley.com/10.1111/1541-4337.12014
Bjerrum, L., R. M. Engberg, T. D. Leser, B. B. Jensen, K. Finster, and K. Pedersen. 2006. Microbial community composition of the ileum and cecum of broiler chickens as revealed by molecular and culture-based techniques.

REFERENCES
147
Poult. Sci. 85:1151–1164.
Blum, M. S. 1994. The limits of entomophagy: a discretionary gourmand in a world of toxic insects. Food Insects Newsl. 7:6–11.
Boisen, S., S. Bech-Andersen, and B. O. Eggum. 1987. A Critical View on the Conversion Factor 6.25 from Total Nitrogen to Protein. Acta Agric. Scand. 37.
Boonen, R. 2015. How to feed and not to eat our world? KU Leuven.
Bradford, G. . 1999. Contributions of animal agriculture to meeting global human food demand. Livest. Prod. Sci. 59:95–112.
Brunner, E., S. Domhof, and F. Langer. 2002. Nonparametric Analysis of Longitudinal Data in Factorial Experiments. Wiley, New York.
Budding, A. E., M. E. Grasman, A. Eck, J. a. Bogaards, C. M. J. E. Vandenbroucke-Grauls, A. a. Van Bodegraven, and P. H. M. Savelkoul. 2014. Rectal swabs for analysis of the intestinal microbiota. PLoS One 9:5–12.
Bukkens, S. G. F. 1997. Ecology of Food and Nutrition The nutritional value of edible insects. Ecol. Food Nutr. 36:287–319.
Burkitt, D. P., A. R. P. Walker, and N. S. Painter. 1974. Dietary fibre and disease. J. Am. Med. Assoc. 229:1068–1074.
Bywater, A. C., and R. L. Baldwin. 1980. Alternative strategies in food animal production. In: R. L. Baldwin, editor. Animals, Feed, Food and People. Westview Press. p. 1–30.
Çabuk, M., A. Alçiçek, M. Bozkurt, and S. Akkan. 2004. Effect of Yucca schidigera and Natural Zeolite on Broiler Performance. Int. Jouranl Poult. Sci. 3:651–654.
Calloway, D. H., S. Murphy, and G. Beaton. 1988. Food intake and human function: a cross-project perspective of the Collaborative Research Support Program in Egypt, Kenya and Mexica. Berkeley.
Carré, B., J. Gomez, and A. M. Chagneau. 1995. Contribution of oligosaccharide and polysaccharide digestion, and excreta losses of lactic acid and short chain fatty acids, to dietary metabolisable energy values in broiler chickens and adult cockerels. Br. Poult. Sci. 36:611–629.
Castellini, C., S. Bastianoni, C. Granai, A. D. Bosco, and M. Brunetti. 2006. Sustainability of poultry production using the emergy approach: Comparison of conventional and organic rearing systems. Agric. Ecosyst. Environ. 114:343–350.
Cerrate, S., F. Yan, Z. Wang, C. Coto, P. Sacakli, and P. W. Waldroup. 2011. Evaluation of Glycerine from biodiesel production as a feed ingredient for broilers. Int. J. Poult. Sci. 5:1001–1007.
Choct, G., and M. Annison. 1992. Anti-nutritive effect of wheat pentosans in broiler chickens: Roles of viscosity and gut microflora. Br. Poult. Sci. 33:821–834.
Choct, M., R. J. Hughes, and M. R. Bedford. 1999. Effects of a xylanase on individual bird variation, starch digestion throughout the intestine, and ileal and caecal volatile fatty acid production in chickens fed wheat. Br. Poult. Sci. 40:419–422.
Choct, M. 2006. Enzymes for the feed industry: past, present and future. Worlds. Poult. Sci. J. 62:5–16.
Chowdhury, S. R., D. K. Sarker, S. D. Chowdhury, T. K. Smith, P. K. Roy, and M. a Wahid. 2005. Effects of dietary tamarind on cholesterol metabolism in laying hens. Poult. Sci. 84:56–60.
Claesson, M. J., S. Cusack, O. O’Sullivan, R. Greene-Diniz, H. de Weerd, E. Flannery, J. R. Marchesi, D. Falush, T. Dinan, G. Fitzgerald, C. Stanton, D. van Sinderen, M. O’Connor, N. Harnedy, K. O’Connor, C. Henry, D. O’Mahony, A. P. Fitzgerald, F. Shanahan, C. Twomey, C. Hill, R. P. Ross, and P. W. O’Toole. 2011. Composition, variability, and

REFERENCES
148
temporal stability of the intestinal microbiota of the elderly. Proc. Natl. Acad. Sci. U. S. A. 108:4586–4591.
Clench, M. H. 1999. The avian cecum: Update and motility review. J. Exp. Zool. 283:441–447. Available from: http://doi.wiley.com/10.1002/(SICI)1097-010X(19990301/01)283:4/5<441::AID-JEZ13>3.0.CO;2-8
Cobb-Vantress. Available from: http://www.cobb-vantress.com/
Cobb-Vantress. 2012. Broiler performance and nutrition supplement. Available from: http://67.43.0.82/docs/default-source/cobb-500-guides/cobb500-broiler-performance-nutrition-supplement-(english).pdf?sfvrsn=8b500-broiler-performance-nutrition-supplement-(english).pdf?Status=Temp&sfvrsn=4
Colwell, R. K., A. Chao, N. J. Gotelli, S. Lin, C. X. Mao, R. L. Chazdon, and J. T. Longino. 2012. Models and estimators linking individual-based and sample-based rarefaction, extrapolation, and comparison of assemblages. J. Plant Ecol. 5:3–21.
Costa, L., D. Pereira, L. Bueno, and H. Pandorfi. 2012. Some aspects of chicken behavior and welfare. Rev. Bras. Ciência Avícola 14:159–164. Available from: http://www.scopus.com/inward/record.url?eid=2-s2.0-84873190928&partnerID=tZOtx3y1
Cowieson, a J., M. Hruby, and E. E. M. Pierson. 2006. Evolving enzyme technology: impact on commercial poultry nutrition. Nutr. Res. Rev. 19:90–103.
Crawford, R. D. 1990a. Poultry Biology: Origin and History of Poultry Species. In: R. D. Crawford, editor. Poultry Breeding and Genetics. Elsevier Science Publishing Company, Amsterdam and New York. p. 1–42.
Crawford, R. D. 1990b. Poultry genetic resources: evolution, diversity and conservation. In: Poultry Breeding and Genetics. p. 43–60.
Cromwell, G. 2012. Soybean meal: an exceptional protein source. Available from: http://www.soymeal.org/ReviewPapers/SBMExceptionalProteinSource.pdf
Cumming, R. B. 1992. Newcastle Disease research at the University of New England. (P. Spradbrow, editor.). Canberra.
Dahouda, M., S. S. Toléba, a K. I. Youssao, a a M. Ali, a Hambuckers, and J.-L. Hornick. 2008. Seasonal variations in the crop contents of scavenging Helmeted Guinea Fowls (Numida meleagris, L.) in Parakou (Benin). Br. Poult. Sci. 49:751–759.
Danzeisen, J. L., H. B. Kim, R. E. Isaacson, Z. J. Tu, and T. J. Johnson. 2011. Modulations of the chicken cecal microbiome and metagenome in response to anticoccidial and growth promoter treatment. PLoS One 6.
Darwin, C. 1859. The origin of species. (J. Murrey, editor.).
Dasti, J. I., A. M. Tareen, R. Lugert, A. E. Zautner, and U. Groß. 2010. Campylobacter jejuni: A brief overview on pathogenicity-associated factors and disease-mediating mechanisms. Int. J. Med. Microbiol. 300:205–211. Available from: http://linkinghub.elsevier.com/retrieve/pii/S1438422109000575
Davis, a. J., N. M. Dale, and F. J. Ferreira. 2003. Pearl millet as an alternative feed ingredient in broiler diets. J. Appl. Poult. Res. 12:137–144.
Deeb, N., and S. J. Lamont. 1998. Genetic architecture of growth and body composition in unique chicken populations. J. Hered. 93:107–118.
Delgado, C., M. Rosegrant, H. Steinfeld, S. Ehui, and C. Courbois. 2001. Livestock to 2020: the next food revolution. Outlook Agric. 30:27–29.
Delhoyo, J., J. Elliott, and J. Sargatal. 2001. Hand book of the birds of the world. Vol. 2. New world vultures to guineafowl. (L. Editions, editor.). Barcelona.

REFERENCES
149
Dessie, T., and B. Ogle. 2000. Nutritional Status of Village Poultry in the Central Highlands of Ethiopia as Assessed by Analyses of Crop Contents. 56:47–56.
Dessie, T., and B. Ogle. 2001. Village poultry production systems in the central highlands of Ethiopia. Trop. Anim. Health Prod. 33:521–537.
Desta, T. T., and O. Wakeyo. 2012. Uses and flock management practices of scavenging chickens in Wolaita Zone of southern Ethiopia. Trop. Anim. Health Prod. 44:537–544.
Detmann, E., and S. C. Valadares Filho. 2012. On the estimation of non-fibrous carbohydrates in feeds and diets. Arq. Bras. Med. Vet. Zootec. 62:980–984.
DeVries, J. W. 2003. On defining dietary fibre. In: The Proceedings of the Nutrition Society. Vol. 62. p. 37–43. Available from: http://journals.cambridge.org/abstract_S0029665103000077
Dho-moulin, M., and M. J. Fairbrother. 1999. Avian pathogenic Escherichia coli ( APEC ). Vet. Res. 30:299–316.
Diener, S., C. Zurbrügg, and K. Tocknera. 2009. Conversion of organic material by black soldier fly larvae - Establishing optimal feeding rates. Waste Manag. Res. 27:603–610.
Dintzis, F., L. Legg, W. Deatherage, F. Baker, G. Inglett, R. Jacob, S. Reck, J. Munoz, L. Klevay, H. Sandstead, and others. 1979. Human gastrointestinal action on wheat, corn, and soy hull bran–preliminary findings. Cereal Chem. 56:123–127. Available from: http://ddr.nal.usda.gov/handle/10113/26058
Donalson, L. M., W. K. Kim, C. L. Woodward, P. Herrera, L. F. Kubena, D. J. Nisbet, and S. C. Ricke. 2005. Utilizing different ratios of alfalfa and layer ration for molt induction and performance in commercial laying hens. Poult. Sci. 84:362–369.
Donohue, M., and D. L. Cunningham. 2009. Effects of grain and oilseed prices on the costs of US poultry production. J. Appl. Poult. Res. 18:325–337.
Dunkley, K. D., C. S. Dunkley, N. L. Njongmeta, T. R. Callaway, M. E. Hume, L. F. Kubena, D. J. Nisbet, and S. C. Ricke. 2007. Comparison of in vitro fermentation and molecular microbial profiles of high-fiber feed substrates incubated with chicken cecal inocula. Poult. Sci. 86:801–810.
EC. 2001. Regulation (EC) No 999/2001 Of the European Parliment and of the Council of 22 May laying down rules for the prevention, control and eradication of certain transmissible spongiform encephalopathies (31/5/2001). Off. J. Eur. Communities:1–69.
Eckburg, P. B., E. M. Bik, C. N. Bernstein, E. Purdom, L. Dethlefsen, M. Sargent, S. R. Gill, K. E. Nelson, and D. a Relman. 2005. Diversity of the human intestinal microbial flora. Science 308:1635–1638.
Eeckhaut, V., F. Van Immerseel, E. Teirlynck, F. Pasmans, V. Fievez, C. Snauwaert, F. Haesebrouck, R. Ducatelle, P. Louis, and P. Vandamme. 2008. Butyricicoccus pullicaecorum gen. nov., sp. nov., an anaerobic, butyrate-producing bacterium isolated from the caecal content of a broiler chicken. Int. J. Syst. Evol. Microbiol. 58:2799–2802.
Eeckhout, M., and W. Verbeke. 2015. Insecten in diervoeder: wetgeving als hindernis en uitdaging. Food Sci. Law 3.
Eisemann, C. H., W. K. Jorgansen, D. J. Merritt, M. J. Rice, B. W. Cribb, P. D. Webb, and M. P. Zalucki. 1984. Do insects feel pain? - A biological view. Experientia 40:164–167.
Ekue, F. N., K. D. Poné, M. J. Mafeni, A. N. Nfi, and J. Njoya. Survey of the traditional poultry production system in the Bemenda area, Cameroon.
Erb, K., A. Mayer, T. Kastner, K. Sallet, and H. Haberl. 2012. The Impact of Industrial Grain Fed Livestock Production on Food Security : an extended literature review Final report Main Messages. :1–83.
Erickson, M., M. Islam, C. Sheppard, J. Liao, and M. P. Doyle. 2004. Reduction of Escherichia coli O157:H7 and Salmonella enterica Serovar Enteritidis in Chicken Manure by Larvae of the Black Soldier Fly. J. Food Prot. 4:685–

REFERENCES
150
690.
van Es, A. J. H. 1975. Voedsel of veevoer? Bedrijfsontwikkeling 6:136–142.
Fanatico, A. C., C. M. Owens-Hanning, V. Brewer Gunsaulis, and A. M. Donohue. 2016. Choice feeding of protein concentrate and grain to organic meat chickens. J. Appl. Poult. Res. 25.
FAO. 2002. World agriculture: towards 2015/2030. Rome. Available from: http://www.fao.org/docrep/004/y3557e/y3557e00.htm
FAO. 2011. World livestock 2011: livestock in food security. Rome.
FAOSTAT. 2014. Available from: http://faostat3.fao.org/faostat-gateway/go/to/download/Q/QA/E
FAOSTAT. 2015. Food and agriculture organization of the united nations, statistic devision. Available from: faostat3.fao.org
Faouzi, K., N. E. L. Omari, N. Tmiri, and T. Jaouzi. 2000. Health and Management Constraints To Family Poultry Development in Morocco. Available from: http://www.iaea.org/nafa/d3/public/8-health-faouzi.pdf
Farrell, D. J., P. F. Mannion, and R. A. Perez-Maldonado. 1999. A comparison of total and digestible amino acids in diets for broilers and layers. Anim. Feed Sci. Technol. 82:131–142.
Farrell, D. J., R. a Perez-Maldonado, and P. F. Mannion. 1999. Optimum inclusion of field peas, faba beans, chick peas and sweet lupins in poultry diets. II. Broiler experiments. Br. Poult. Sci. 40:674–680.
Farrell, D. J. 2005. Matching poultry production with available feed resources: issues and constraints. Worlds. Poult. Sci. J. 61:298–307.
FAVV. 2014. In de handel brengen van insecten en levensmiddelen op basis van insecten voor humane consumptie. Available from: http://www.afsca.be/levensmiddelen/insecten/
Fenna, L., and D. A. Boag. 1974. Filling and emptying of the galliform caecum. Can. J. Zool. 52:537–540.
De Filippo, C., D. Cavalieri, M. Di Paola, M. Ramazzotti, J. B. Poullet, S. Massart, S. Collini, G. Pieraccini, and P. Lionetti. 2010. Impact of diet in shaping gut microbiota revealed by a comparative study in children from Europe and rural Africa. Proc. Natl. Acad. Sci. U. S. A. 107:14691–14696.
Finke, M. D. 2002. Complete nutrient composition of commercially raised invertebrates used as food for insectivores. Zoo Biol. 21:269–285.
Finke, M. D. 2007. Estimate of Chitin in Raw Whole Insects. Zoo Biol. 26:105–115.
Foley, J. a., N. Ramankutty, K. a. Brauman, E. S. Cassidy, J. S. Gerber, M. Johnston, N. D. Mueller, C. O’Connell, D. K. Ray, P. C. West, C. Balzer, E. M. Bennett, S. R. Carpenter, J. Hill, C. Monfreda, S. Polasky, J. Rockström, J. Sheehan, S. Siebert, D. Tilman, and D. P. M. Zaks. 2011. Solutions for a cultivated planet. Nature 478:337–342.
Follett, R. F., and J. L. Hatfield. 2001. Nitrogen in the environment: sources, problems, and management. ScientificWorldJournal. 1:920–926.
Francesch M., B. J. 2004. Nutritional factors affecting excreta/litter moisture and quality. Worlds. Poult. Sci. J. 60:64–75.
Fujihara, S., A. Kasuga, Y. Aoyagi, and T. Sugahara. 1995. Nitrogen-to-Protein Conversion Factors for some Common Edible Mushrooms. J. Food Sci. 60:1045–4047.
Fumihito, a, T. Miyake, S. Sumi, M. Takada, S. Ohno, and N. Kondo. 1994. One subspecies of the red junglefowl (Gallus gallus gallus) suffices as the matriarchic ancestor of all domestic breeds. Proc. Natl. Acad. Sci. U. S. A. 91:12505–12509.

REFERENCES
151
Genetics, H. 2014. Isa White Commercial Stock & Parent Stock. Available from: http://www.isapoultry.com/products/isa/isa-white/
Gerber, P., C. Opio, and H. Steinfeld. 2007. Poultry production and the environment-A review, Poultry in 21 st Century: Avian Influenza and Beyond. Poult. 21st Century:1–27. Available from: http://www.fao.org/ag/againfo/home/events/bangkok2007/docs/part2/2_2.pdf
Gill, M., P. Smith, and J. M. Wilkinson. 2010. Mitigating climate change: the role of domestic livestock. Animal 4:323.
González-Alvarado, J. M., E. Jiménez-Moreno, R. Lázaro, and G. G. Mateos. 2007. Effect of type of cereal, heat processing of the cereal, and inclusion of fiber in the diet on productive performance and digestive traits of broilers. Poult. Sci. 86:1705–1715.
Goodger, W. J., T. B. Bennett, and R. H. Dwinger. 2002. Comparative Analysis of Family Poultry Production in Twelve African Countries. Vienna. Available from: http://www-naweb.iaea.org/Nafa/aph/public/14-comparative-goodger.pdf
Goromela, E. H., R. P. Kwakkel, M. W. a Verstegen, and a M. Katule. 2008. Effect of season and farming system on the quantity and nutritional quality of scavengeable feed resources and performance of village poultry in central Tanzania. 2:63–71.
Goromela, E., R. Kwakkel, M. W. A. Verstegen, and A. M. Katule. 2006. Strategies to optimize the use of scavengeable feed resource base by smallholders in traditional poultry production systems in Africa: A review. African J. 1:91–100. Available from: http://www.academicjournals.org/ajar/pdf/Pdf2006/Nov/Goromela et al.pdf
Gous, R. M., and H. K. Swatsom. 2000. Mixture experiments: A severe test of the ability of a broiler chicken to make the right choice. Br. Poult. Sci. 41:136–140.
Grashorn, M. a \. 2006. Fattening performance, carcass and meat quality of slow and fast growing broiler strains under intensive and extensive feeding conditions.\par. XII Eur. Poult. Conf. Verona, Italy, 10.- 14.September 2006\par B. Abstr. Ets.Romboli, Flock, Fr.:249\par.
Grobas, S., J. Méndez, R. Lázaro, C. de Blas, and G. G. Mateo. 2001. Influence of source and percentage of fat added to diet on performance and fatty acid composition of egg yolks of two strains of laying hens. Poult. Sci. 80:1171–1179.
Groupe Grimaud. Available from: http://www.grimaud.com/
Guèye, E. F., A. Dieng, and S. Dieng. 1997. Meat quality of indigenous and commercial chickens in Senegal. In: Proceedings INFPD Workshop.
Guèye, E. F. 1998. Village egg and fowl meat production in Africa. Worlds. Poult. Sci. J. 54:73–86.
Guèye, E. F. 2003. Gender issues in family poultry production systems in low-income food-deficit countries. Am. J. Altern. Agric. 18:185–195.
Guèye, E. F. 2005. Gender aspects in family poultry management systems in developing countries. Worlds. Poult. Sci. J. 61:39–46. Available from: http://journals.cambridge.org/abstract_S004393390500005X
Gull, J. M., M. Stahl, C. Osmann, S. Ortmann, M. Kreuzer, J.-M. Hatt, and M. Clauss. 2014. Digestive physiology of captive giant anteaters ( Myrmecophaga tridactyla ): determinants of faecal dry matter content. J. Anim. Physiol. Anim. Nutr. (Berl). 99:n/a–n/a. Available from: http://doi.wiley.com/10.1111/jpn.12223
Gunaratne, S. P., A. D. Chandrasiri, W. A. Hemalatha, and J. A. Roberts. 1993. Feed resource base for scavenging village chickens in Sri Lanka. Trop. Anim. Health Prod. 25:249–57.
Guo, Y. M., R. A. Ali, and M. A. Quresh. 2003. The influence of beta-glucan on immune responses in broiler chicks. immunopharmacol immunotoxicol 25:461–472.

REFERENCES
152
Gustavsson, J., C. Cederberg, U. Sonesson, R. van Otterdijk, and A. Meybeck. 2011. Global food losses and food waste - extent, causes and prevention. Rome, Italy. Available from: http://www.fao.org/docrep/014/mb060e/mb060e.pdf
Hajati, H., and M. Rezaei. 2010. The application of prebiotics in poultry production. Int. J. Poult. Sci. 9:298–304.
Hall, M. B. 2003. Challenges with nonfiber carbohydrate methods. J. Anim. Sci. 81:3226–3232.
Han, B. K., W. J. Lee, and D. H. Jo. 1997. Chitinolytic enzymes from the gizzard and the chyme of the broiler ( Gallus gallus L .). 19:981–984.
Hanyani, C. T. 2012. Effect of full and semi-scavenging rearing systems on crop contents and the quality of meat from village chickens during the spring season of Eastern Cape, South Africa. Available from: http://ufh.netd.ac.za/bitstream/10353/440/1/Hanyanithesis.pdf
Harmoinen, J. a, J. M. Mättö, M. L. Rinkinen, M. Wilsson-Rahmberg, and E. Westermarck. 2001. Permanent jejunal fistula: promising method for obtaining small intestinal chyme without disturbing intestinal function. Comp. Med. 51:252–256.
Harms, R. H., G. B. Russell, and D. R. Sloan. 2000. PERFORMANCE OF FOUR STRAINS OF COMMERCIAL LAYERS WITH MAJOR CHANGES IN DIETARY ENERGY. J. Appl. Poult. Res. 9:535–541.
Havenstein, G. B., P. R. Ferket, S. E. Scheideler, and B. T. Larson. 1994. Growth, livability, and feed conversion of 1957 vs 1991 broilers when fed “typical” 1957 and 1991 broiler diets. Poult. Sci. 73:1785–1794.
Hendy, C. R. C., U. Kleih, R. Crawshaw, and M. Phillips. 1995. Interactions between Livestock Production Systems and the Environment Impact Domain: concentrate feed demand. 2.4.3. Concentrate utilization by different livestock species. Available from: http://www.fao.org/wairdocs/lead/x6123e/x6123e04.htm#bm4.4.3
Henning, J., R. Pym, T. Hla, N. Kyaw, and J. Meers. 2007. Village chicken production in Myanmar - purpose, magnitude and major constrains. Worlds. Poult. Sci. J. 63:308–322.
Herman, L., M. Heyndrickx, K. Grijspeerdt, D. Vandekerchove, I. Rollier, and L. De Zutter. 2003. Routes for Campylobacter contamination of poultry meat: epidemiological study from hatchery to slaughterhouse. Epidemiol. Infect. 131:1169–1180.
Herrick, C. a., and S. a. Edgar. 1947. Some Relationships between Cecal Function and Coccidiosis of Chickens. Poult. Sci. 26:105–107.
Hetland, H., M. Choct, and B. Svihus. 2004. Role of insoluble non-starch polysaccharides in poultry nutrition. Worlds. Poult. Sci. J. 60:415–422.
Hetland, H., and B. Svihus. 2001. Effect of oat hulls on performance, gut capacity and feed passage time in broiler chickens. Br. Poult. Sci. 42:354–361.
Higgins, J. J. 2004. Introduction to modern nonparametric statistics. Brooks/Cole, Belmont.
Hinrichs, J., and H. Steinfeld. Feed availability inducing structural change in the poultry sector. :1–8. Available from: http://www.fao.org/WAICENT/faoINFO/AGRICULT/againfo/home/events/bangkok2007/docs/part1/1_11.pdf
Hinrichs, J., and H. Steinfeld. 2007. Feed availability inducing structural change in the poultry sector. In: O. Thieme and D. Pilling, editors. Poultry in the 21th Century: avian influenza and beyond. Bangkok. Available from: http://www.fao.org/AG/againfo/home/events/bangkok2007/docs/part1/1_11.pdf
Hirano, S., C. Itakura, H. Seino, Y. Akiyama, I. Nonaka, N. Kanbara, and T. Kawakami. 1990. Chitosan as an ingredient for domestic animal feeds. J. Agric. Food Chem. 38:1214–1217. Available from: http://pubs.acs.org/doi/abs/10.1021/jf00095a012
Hocking, P., V. Zaczek, E. Jones, and M. Macleod. 2004. Different concentrations and sources of dietary fibre may improve the welfare of female broiler breeders. Br. Poult. Sci. 45:9–19.

REFERENCES
153
HoGent. 2015. Kimi-ei project: pluimvee als predator in kleinfruit.
Horsted, K., J. E. Hermansen, and H. Ranvig. 2007. Crop content in nutrient-restricted versus non-restricted organic laying hens with access to different forage vegetations. Br. Poult. Sci. 48:177–184.
Hossain, S. M., and R. Blair. 2007. Chitin utilisation by broilers and its effect on body composition and blood metabolites. Br. Poult. Sci. 48:33–38.
HSRC. 2014. State of poverty and its manifestation in the nine provinces of south africa.
Huang, R. L., Z. Y. Deng, C. B. Yang, Y. L. Yin, M. Y. Xie, G. Y. Wu, T. J. Li, L. L. LI, Z. R. Tang, P. Kang, Z. P. Hou, D. Deng, H. Xiang, X. F. Kong, and Y. M. Guo. 2007. Dietary oligochitosan supplementation enhances immune status of broilers. J. Sci. Food Agric. 87:153–159.
van Huis, A. 2013. Potential of insects as food and feed in assuring food security. Annu. Rev. Entomol. 58:563–583.
Humphrey, T., S. O’Brien, and M. Madsen. 2007. Campylobacters as zoonotic pathogens: A food production perspective. Int. J. Food Microbiol. 117:237–257.
Huque, Q. M. E. 1999. Nutritional status of family poultry in Bangladesh. Livest. Res. Rural Dev. 11. Available from: http://www.lrrd.org/lrrd11/3/huq113.htm
Hutagalung, R. I. 2000. The monetary crisis and its impact on the development of the poultry industry in indonesia. In: Proc. Aust. Poult. Sci. Sym. p. 12.
Hwangbo, J., E. C. Hong, A. Jang, H. K. Kang, J. S. Oh, B. W. Kim, B. S. Park, S. Korea, S. Korea, and S. Korea. 2009. Utilization of house fly maggots, a feed supplement in the production of broiler chickens. J. Environ. Biol. 30:609–614.
IMF. 2015. Unemployment in South-Africa. Available from: http://www.indexmundi.com/south_africa/unemployment_rate.html
Van Immerseel, F., F. Boyen, I. Gantois, L. Timbermont, L. Bohez, and R. Pasmans, F., Haesebrouck, F. Ducatelle. 2005. Supplementation of coated butyric acid in the feed reduces colonization and shedding of Salmonella in poultry. Poult. Sci. 84:1851–1856.
Van Immerseel, F., J. De Buck, F. Pasmans, G. Huyghebaert, F. Haesebrouck, and R. Ducatelle. 2004. Clostridium perfringens in poultry: an emerging threat for animal and public health. Avian Pathol. 33:537–549.
Jackson, S., and J. Diamond. 1996. Metabolic and Digestive Responses to Artificial Selection in Chickens. Evolution (N. Y). 50:1638–1650.
Jackson, S., J. D. Summers, and S. Leeson. 1982. Effect of dietary protein and energy on broiler performance and production costs. Poult. Sci. 61:2232–2240.
Janssen, P. W. M., R. G. Lentle, C. Hulls, V. Ravindran, and A. M. Amerah. 2009. Spatiotemporal mapping of the motility of the isolated chicken caecum. J. Comp. Physiol. B Biochem. Syst. Environ. Physiol. 179:593–604.
Jiménez-Moreno, E., J. M. González-Alvarado, D. González-Sánchez, R. Lázaro, and G. G. Mateos. 2010. Effects of type and particle size of dietary fiber on growth performance and digestive traits of broilers from 1 to 21 days of age. Poult. Sci. 89:2197–2212.
Jiménez-Moreno, E., J. M. González-Alvarado, R. Lázaro, and G. G. Mateos. 2009. Effects of type of cereal, heat processing of the cereal, and fiber inclusion in the diet on gizzard pH and nutrient utilization in broilers at different ages. Poult. Sci. 88:1925–1933.
Jones, D. B. 1931. Factors for converting percentages of nitrogen in foods and feeds into percentages of protein. USDA Circ. 183:1–21.

REFERENCES
154
Jones, E. K. M., V. Zaczek, M. Macleod, and P. M. Hocking. 2010. Genotype , dietary manipulation and food allocation affect indices of welfare in broiler breeders. Br. Poult. Sci. 45:725–737.
Jones, G. P. D., and R. D. Taylor. 2001. The incorporation of whole grain into pelleted broiler chicken diets: Production and physiological responses. Br. Poult. Sci. 42:477–483. Available from: http://www.tandfonline.com/doi/abs/10.1080/00071660120070587
Jongema, Y. 2015. World list of edible insects. Available from: http://www.wageningenur.nl/en/Expertise-Services/Chair-groups/Plant-Sciences/Laboratory-of-Entomology/Edible-insects/Worldwide-species-list.htm
Jørgensen, H., X. Q. Zhao, K. E. Knudsen, and B. O. Eggum. 1996. The influence of dietary fibre source and level on the development of the gastrointestinal tract, digestibility and energy metabolism in broiler chickens. Br. J. Nutr. 75:379–395.
Kabacoff, R. I. 2011. R in action: Data analysis and graphics with R. Manning Publications Co., New York.
Kalavathy, R., N. Abdullah, S. Jalaludin, and Y. W. Ho. 2003. Effects of Lactobacillus cultures on growth performance, abdominal fat deposition, serum lipids and weight of organs of broiler chickens. Br. Poult. Sci. 44:139–144.
Kalmar, I. D., a. Cools, M. W. a Verstegen, G. Huyghebaert, J. Buyse, P. Roose, and G. P. J. Janssens. 2011. Dietary supplementation with dimethylglycine affects broiler performance and plasma metabolites depending on dose and dietary fatty acid profile. J. Anim. Physiol. Anim. Nutr. (Berl). 95:146–153.
Kalmar, I. D., D. Vanrompay, and G. P. J. Janssens. 2013. Broiler ascites syndrome: collateral damage from efficient feed to meat conversion. Vet. J. 197:169–174.
Kalmar, I. D., G. Werquin, and G. P. J. Janssens. 2007. Apparent nutrient digestibility and excreta quality in African grey parrots fed two pelleted diets based on coarsely or finely ground ingredients. J. Anim. Physiol. Anim. Nutr. (Berl). 91:210–216.
Kalmendal, R., K. Elwinger, L. Holm, and R. Tauson. 2011. High-fibre sunflower cake affects small intestinal digestion and health in broiler chickens. Br. Poult. Sci. 52:86–96.
Kerje, S., Ö. Carlborg, L. Jacobsson, K. Schütz, C. Hartmann, P. Jensen, and L. Andersson. 2003. The twofold difference in adult size between the red junglefowl and White Leghorn chickens is largely explained by a limited number of QTLs. Anim. Genet. 34:264–274.
Keshavarz, K. 2003. The effect of different levels of nonphytate phosphorus with and without phytase on the performance of four strains of laying hens. Poult. Sci. 82:71–91.
Van Keulen, J., and B. A. Young. 1977. Evaluation of acid-insoluable ash as a nutral marker in ruminant digestibility studies. J. Anim. Sci. 44:282–287.
Keyzer, M. A., M. D. Merbis, I. F. P. W. Pavel, and C. F. A. van Wesenbeek. 2005. Diet shifts towards meat and the effects on cereal use: can we feed the animals in 2030? Ecol. Econ. 55:187–202.
Khajali, F., E. A. Khoshoei, and a K. Z. Moghaddam. 2006. Effect of vitamin and trace mineral withdrawal from finisher diets on growth performance and immunocompetence of broiler chickens. Br. Poult. Sci. 47:159–162.
Khajali, F., and B. a. Slominski. 2012. Factors that affect the nutritive value of canola meal for poultry. Poult. Sci. 91:2564–2575.
Khalafalla, a I., S. Awad, and W. Hass. 2002. Village Poultry Production in the Sudan.
Khempaka, S., M. Mochizuki, K. Koh, and Y. Karasawa. 2006. Effect of chitin in shrimp meal on growth performance and digestibility in growing broilers. J. Poult. Sci. 43:339–343.
Kien, C. L., R. Blauwiekel, J. Y. Bunn, T. L. Jetton, W. L. Frankel, and J. J. Holst. 2007. Cecal infusion of butyrate increases intestinal cell proliferation in piglets. J. Nutr. 137:916–922.

REFERENCES
155
Kim, J. H. 2014. Diet Selection for Protein Quality by Growing Broiler Chickens. Int. J. Poult. Sci. 13:461–466.
Kingori, a. M., J. K. Tuitoek, H. K. Muiruri, a. M. Wachira, and E. K. Birech. 2007. Protein intake of growing indigenous chickens on free-range and their response to supplementation. Int. J. Poult. Sci. 6:617–621.
Kinyuru, J. N., G. M. Kenji, S. M. Njoroge, and M. Ayieko. 2010. Effect of processing methods on the in vitro protein digestibility and vitamin content of edible winged termite (Macrotermes subhylanus) and grasshopper (Ruspolia differens). Food Bioprocess Technol. 3:778–782.
Klunder, H. C., J. Wolkers-Rooijackers, J. M. Korpela, and M. J. R. Nout. 2012. Microbiological aspects of processing and storage of edible insects. Food Control 26:628–631. Available from: http://linkinghub.elsevier.com/retrieve/pii/S0956713512000874
Knudsen, K. E., B. B. Jensen, and I. Hansen. 1993. Digestion of polysaccharides and other major components in the small and large intestine of pigs fed on diets consisting of oat fractions rich in beta-D-glucan. Br. J. Nutr. 70:537–556.
Kocher, A. 2003. Nutritional manipulation of necrotic enteritis outbreak in broilers. Recent Adv. Anim. Nutr. Aust. 14:111–116.
Koh, K., and S. Iwamae. 2013. Chitinolytic Activity of Mucosal Enzymes in the Different Parts of the Digestive Tract in Broilers. Japan Poult. Sci. Assoc. 50:65–67.
Kondombo, S. R., R. P. Kwakkel, A. J. Nianogo, and M. Slingerland. 2003. Effects of Local Feedstuff Supplementation on Zootechnic Performances and Nutritional Status of Village Chickens during the End of the Rainy Season in Burkina Faso. Rev. Elev. Med. Vet. Pays Trop. 56:199–204.
Kras, R. V., A. d. M. Kessler, A. M. L. Ribeiro, J. D. Henn, L. Bockor, and S. A.F. 2013. Effect of Dietary Fiber, Genetic Strain and Age on the Digestive Metabolism of Broiler Chickens. Brazilian J. Poult. Sci. 15:83–90.
Kusina, J., N. T. Kusina, and J. Mhlanga. 1999. A Survey on Village Chicken Losses : Causes and Solutions as Perceived by Farmers. In: Proceedings of SADC planning workshop on Newcastle disease control in village chickens, Maputo, Mozambique, 6-9 March 2000, Australian Center for International Agricultural Research. Canberra Proceedings 103. p. 148–155. Available from: http://aciar.gov.au/files/node/2131/pr103chapter30.pdf
Van Laere, K. M. J., R. Hartemink, M. Bosveld, H. A. Schols, and G. J. Voragen. 2000. Fermentation of Plant Cell Wall Derived Polysaccharides and Their Corresponding Oligosaccharides by Intestinal Bacteria. J. Agric. Food Chem. 48:1644–1652.
Lammers, P. J., B. J. Kerr, M. S. Honeyman, K. Stalder, W. a Dozier, T. E. Weber, M. T. Kidd, and K. Bregendahl. 2008. Nitrogen-corrected apparent metabolizable energy value of crude glycerol for laying hens. Poult. Sci. 87:104–107.
Langhout, D. J., and J. B. Schutte. 1996. Nutritional implications of pectins in chicks in relation to esterification and origin of pectins. Poult. Sci. 75:1236–1242.
Lee, K.-W., H. Everts, H. J. Kappert, M. Frehner, R. Losa, and A. C. Beynen. 2003. Effects of dietary essential oil components on growth performance, digestive enzymes and lipid metabolism in female broiler chickens. Br. Poult. Sci. 44:450–457.
Leenstra, F., and T. Vellinga. 2011. Indication of the ecological foot print of companion animals First survey, focussed on cats, dogs and horses in The Netherlands. Wageningen. Available from: http://www.foodlog.nl/files/achtergrond/509_indicatie_van_de_ecologische.pdf
Leeson, S., L. Caston, and J. D. Summers. 1996a. Broiler response to diet energy. Poult. Sci. 75:529–535.
Leeson, S., L. Caston, and J. D. Summers. 1996b. Broiler response to energy or energy and protein dilution in the finisher diet. Poult. Sci. 75:522–528.
LEESON, S. 2007. Vitamin requirements: is there basis for re-evaluating dietary specifications? Worlds. Poult. Sci. J.

REFERENCES
156
63:255. Available from: http://www.scopus.com/inward/record.url?eid=2-s2.0-34250838631&partnerID=tZOtx3y1
Leinonen, I., A. G. Williams, A. H. Waller, and I. Kyriazakis. 2013. The potential to reduce environmental impacts of poultry 2 production systems by including alternative protein crops in their 3 diet: a quantitative comparison with uncertainty analysis. Agric. Syst. 121:33–42.
Leng, R. a. 2005. Implications of the decline in world oil reserves for future world livestock production. 15:95–106.
Li, X. J., X. S. Piao, S. W. Kim, P. Liu, L. Wang, Y. B. Shen, S. C. Jung, and H. S. Lee. 2007. Effects of chito-oligosaccharide supplementation on performance, nutrient digestibility, and serum composition in broiler chickens. Poult. Sci. 86:1107–14. Available from: http://www.ncbi.nlm.nih.gov/pubmed/17495080
Liebert, F., J. K. Htoo, and a Sünder. 2005. Performance and nutrient utilization of laying hens fed low-phosphorus corn-soybean and wheat-soybean diets supplemented with microbial phytase. Poult. Sci. 84:1576–1583.
Linares, T., D. Hernandez, and B. Bartolome. 2008. Occupational rhinitis and astma due to crickets. Ann. Allerg. Asthma Immunol. 100:566–574.
Lindqvist, C. E. S., K. E. Schütz, and P. Jensen. 2002. Red Jungle Fowl have more contrafreeloading than white Leghorn layers: effect of food deprivation and consequences for information gain. Behaviour 139:1195–1209.
Liu, S., J. Sun, L. Yu, C. Zhang, J. Bi, F. Zhu, M. Qu, C. Jiang, and Q. Yang. 2012. Extraction and characterization of chitin from the beetle Holotrichia parallela motschulsky. Molecules 17:4604–4611.
Liu, Y. P., G. S. Wu, Y. G. Yao, Y. W. Miao, G. Luikart, M. Baig, A. Beja-Pereira, Z. L. Ding, M. G. Palanichamy, and Y. P. Zhang. 2006. Multiple maternal origins of chickens: Out of the Asian jungles. Mol. Phylogenet. Evol. 38:12–19.
Lloyd, L. E., B. E. McDonald, and E. W. Crampton. 1978. Fundamentals of nutrition. 2nd ed. W.H. Freeman and Company, San Francisco.
Lombardo, M. P., P. A. Thorpe, R. Cichewicz, M. Henshaw, C. Millard, C. Steen, and T. K. Zeller. 1996. Communities of cloacal bacteria in tree swallow families. Condor 98:167–172.
Lomu, M. A., P. C. Glatz, and Y. J. Ru. 2004. Metabolizable energy of crop contents in free-range hens. Int. J. Poult. Sci. 3:728–732.
Van Loo, E. J., V. Caputo, R. M. Nayga, J.-F. Meullenet, and S. C. Ricke. 2011. Consumers’ willingness to pay for organic chicken breast: Evidence from choice experiment. Food Qual. Prefer. 22:603–613. Available from: http://linkinghub.elsevier.com/retrieve/pii/S0950329311000243
Lozupone, C., and R. Knight. 2005. UniFrac : a New Phylogenetic Method for Comparing Microbial Communities UniFrac : a New Phylogenetic Method for Comparing Microbial Communities. Appl. Environ. Microbiol. 71:8228–8235.
Lubbs, D. C., B. M. Vester, N. D. Fastinger, and K. S. Swanson. 2009. Dietary protein concentration affects intestinal microbiota of adult cats: A study using DGGE and qPCR to evaluate differences in microbial populations in the feline gastrointestinal tract. J. Anim. Physiol. Anim. Nutr. (Berl). 93:113–121.
Lundqvist, J., C. De Fraiture, and D. Molden. 2008. Saving Water: from Field to Fork: Curbing Losses and Wastage in the Food Chain. Available from: https://center.sustainability.duke.edu/sites/default/files/documents/from_field_to_fork_0.pdf
Mai, V., H. a Katki, H. Harmsen, D. Gallaher, A. Schatzkin, D. J. Baer, and B. Clevidence. 2004. Effects of a controlled diet and black tea drinking on the fecal microflora composition and the fecal bile acid profile of human volunteers in a double-blinded randomized feeding study. J. Nutr. 134:473–478.
Makkar, H. P. S., G. Tran, V. Heuzé, and P. Ankers. 2014. State-of-the-art on use of insects as animal feed. Anim. Feed Sci. Technol. 197:1–33. Available from: http://linkinghub.elsevier.com/retrieve/pii/S0377840114002326

REFERENCES
157
Malathi, V., and G. Devegowda. 2001. In vitro evaluation of nonstarch polysaccharide digestibility of feed ingredients by enzymes. Poult. Sci. 80:302–305.
Mariotti, F., D. Tomé, and P. P. Mirand. 2008. Converting Nitrogen into Protein—Beyond 6.25 and Jones’ Factors. Crit. Rev. Food Sci. Nutr. 48:177–184. Available from: http://www.tandfonline.com/doi/abs/10.1080/10408390701279749
Mateos, G. G., E. Jimenez-Moreno, M. P. Serrano, and R. P. Lazaro. 2012. Poultry response to high levels of dietary fiber sources varying in physical and chemical characteristics1. J. Appl. Poult. Res. 21:156–174.
Mathlouthi, N., S. Mallet, L. Saulnier, B. Quemener, and M. Larbier. 2002. Effects of xylanase and beta-glucanase addition on performance, nutrient digestibility, and physico-chemical conditions in the small intestine contents and caecal microflora of broiler chickens fed a wheat and barley-based diet. Anim. Res. 51:395–406.
Matthews, D., and B. C. Cooke. 2003. The potential for transmissible spongiform encephalopathies in non-ruminant livestock and fish. Rev. Sci. Tech. 22:283–296.
Maurer, V., M. Hollinger, Z. Amsler, B. Früh, J. Wohlfahrt, A. Stamer, and F. Leiber. 2015. Replacement of soybean oil cake by Hermetia illucens meal in diets for layers. J. insects as food Feed.
McBride, G., I. P. Parer, and F. Foenander. 1969. The Social Organization and Behaviour of the Feral Domestic Fowl. Anim. Behav. Monogr. 2:125–181. Available from: http://linkinghub.elsevier.com/retrieve/pii/S0066185669800038
McCune, B., and M. J. Mefford. 2006. PC-ORD: Multivariate Analysis of Ecological Data.
McDonald, P., R. A. Edwards, J. F. D. Greenhalgh, C. A. Morgan, L. A. Sinclair, and R. G. Wilkinson. 2011. Animal nutrition.
McWorter, T. J., E. Caviedes-Vidal, and W. H. Karasov. 2009. The integration of digestion and osmoregulation in the avian gut. Biol. Rev. 84:533–566.
Megido, R., L. Sablon, M. Geuens, Y. Brostaux, T. Alabi, C. Blecker, D. Drugmand, E. Haubruge, and F. Francis. 2014. Edible Insects Acceptance by Belgian Consumers: Promising Attitude for Entomophagy Development. J. Sens. Stud. 29:14–20.
Meimandipour, a., M. Shuhaimi, M. Hair-Bejo, K. Azhar, B. M. Kabeir, B. Rasti, and a. M. Yazid. 2009. In vitro fermentation of broiler cecal content: The role of lactobacilli and pH value on the composition of microbiota and end products fermentation. Lett. Appl. Microbiol. 49:415–420.
Mekonnen, H., D. Mulatu, B. Kelay, and T. Berhan. 2009. Assessment of the nutritional status of indigenous scavenging chickens in Ada’a district, Ethiopia. Trop. Anim. Health Prod. 42:123–130.
Mentula, S., J. Harmoinen, M. Heikkilä, E. Westermarck, M. Rautio, P. Huovinen, and E. Könönen. 2005. Comparison between cultured small-intestinal and fecal microbiotas in beagle dogs. Appl. Environ. Microbiol. 71:4169–4175.
Millward, D. J. 1999. The nutritional value of plant-based diets in relation to human amino acid and protein requirements. Proc. Nutr. Soc. 58:249–260.
Minga, U. M., P. L. Msoffe, and P. S. Gwakisa. 2004. Biodiversity (variation) in disease resistance and in pathogens within rural chickens. In: 22nd World’s Poultry Congress. Istanbul.
Minh, D. V., J. E. Lindberg, and B. Ogle. 2006. Effect of season and location on the crop contents of local and improved scavenging hens in northern Vietnam. Trop. Anim. Health Prod. 38:121–129.
Mitsuhashi, J. 2010. The future use of insects as human food. In: P. Durst, D. Johnson, R. Lesie, K. Shono, and R. Eds, editors. Forest insects as food: Humans bite back. Chiang Mai, thailand. p. 115–122.
Moiseyeva, I. G., M. N. Romanov, A. A. Nikiforov, A. A. Sevastyanova, and S. K. Semyenova. 2003. Evolutionary relationships of Red Jungle Fowl and chicken breeds. Genet. Sel. Evol. 35:403–423.

REFERENCES
158
Momoh, O., J. Egahi, P. Ogwuche, and V. Etim. 2010. Variation in nutrient composition of crop contents of scavenging local chickens in North Central Nigeria. Agric. Biol. J. North Am. 1:912–915.
Moore, J. C., J. W. DeVries, M. Lipp, J. C. Griffiths, and D. R. Abernethy. 2010. Total Protein Methods and Their Potential Utility to Reduce the Risk of Food Protein Adulteration. Compr. Rev. Food Sci. Food Saf. 9:330–357. Available from: http://www.scopus.com/inward/record.url?eid=2-s2.0-77955838337&partnerID=tZOtx3y1
Moran, E. T. 2006. Anatomy, microbes, and fiber: Small versus large intestine. J. Appl. Poult. Res. 15:154–160.
Moreng, R., and J. S. Avens. 1985. lassification, nomenclature, and showing of poultry. In: Poultry Science and Production. Reston Publishing Co., Inc. Prentice-Hall Company, Reston, Virginia. p. 16–45.
Morgan, S. E. 1989. The Veterinary Clinics of North Amerca: Food Animal Practice. Gossypol as a toxicant in livestock. (G. E. Burrows, editor.). Saunders, W.B., Philadelphia.
Van Der Most, P. J., B. De Jong, H. K. Parmentier, and S. Verhulst. 2011. Trade-off between growth and immune function: A meta-analysis of selection experiments. Funct. Ecol. 25:74–80.
Moynagh, J. 2000. EU regulation and consumer demand for animal welfare. AgBioForum 3:107–114.
Mupeta, B., J. Wood, F. Mandonga, and J. Mhlanga. 2000. A comparison of the performance of village chickens, under improved feed management, with the performance of hybrid chickens in tropical Zimbabwe. In: T. Smith and S. H. Godfrey, editors. Sustaining Livestock in Challenging Dry Season Environments: Strategies for Small-scale Livestock Farmers. Matobo, Zimbabwe.
Murphy, S. P., and L. H. Allen. 1996. A greater intake of animal products could improve the micronutrient status and development of children in East Africa. Entebbe.
Murtaugh, P. 2014. In defence of P values. Ecology 95:611–617.
Mutayoba, S. K., E. Dierenfeld, V. A. Mercedes, Y. Frances, and C. D. Knight. 2011. Determination of Chemical Composition and Ant-nutritive Components for Tanzanian Locally Available Poultry Feed Ingredients. Int. Jouranl Poult. Sci. 10:350–357. Available from: http://www.canadianpoultrymag.com/content/news/1886
Mwalusanya, a. M. Katule, S. K. Mutayoba, M. M. a Mtambo, J. E. Olsen, and U. M. Minga. 2002. Productivity of local chickens under village management conditions. Trop. Anim. Health Prod. 34:405–416.
Mwalusanya, N. a, a M. Katule, S. K. Mutayoba, U. M. Minga, M. M. a Mtambo, and J. E. Olsen. 2002. Nutrient status of crop contents of rural scavenging local chickens in Tanzania. Br. Poult. Sci. 43:64–69.
Nathanson, N., J. Wilesmith, and C. Griot. 1997. Bovine Spongiform Encephalopathy (BSE): Causes and Consequences of a common source epidemic. Am. J. Epidemiol. 145.
Neumann, C., D. M. Harris, and L. M. Rogers. 2002. Contribution of animal source foods in improving diet quality and function in children in the developing world. Nutr. Res. 22:193–220.
Nisha, A. R. 2008. Antibiotic residues - A global health hazard. Vet. World 1:375–377.
Nitsan Z., Ben-Avraham G., Zoref Z., N. I. 1991. Growth and development of the digestive organs and some enzymes in broiler chicks after hatching. Br. Poult. Sci. 32:515–523.
Njue, S., J. Kasiiti, M. J. Macharia, S. G. Gacheru, and H. C. W. Mbugua. 2002. Health and management improvements of family poultry production in Africa–survey results from Kenya. Available from: http://www-naweb.iaea.org/nafa/aph/public/5-health-njue.pdf
NRC. 1994. Nutrient requirements of poultry. 9th ed. (S. on P. Nutrition, editor.). National Academic Press. Washington DC, USA.
Nurmi, E., and M. Rantala. 1973. New Aspects of Salmoneela Infection in Broiler Production. Nature 241:210–211.

REFERENCES
159
Oberholtzer, L., C. Greene, and E. Lopez. 2006. Organic poultry and eggs capture high price premiums and growing share of specialty markets. Washington DC. Available from: http://www.ers.usda.gov/publications/ldp/
Obst, B. S., J. Diamond, S. T. Auk, and N. Jul. 2014. Ontogenesis of Intestinal Nutrient Transport in Domestic Chickens ( Gallus gallus ) and Its Relation to Growth ONTOGENESIS OF INTESTINAL NUTRIENT TRANSPORT IN DOMESTIC CHICKENS ( GALLUS GALLUS ) AND ITS RELATION TO GROWTH. 109:451–464.
Ocio, E., R. Viñaras, and J. M. Rey. 1979. House fly larvae meal grown on municipal organic waste as a source of protein in poultry diets. Anim. Feed Sci. Technol. 4:227–231.
Okamura, M., Y. Ohba, S. Kikuchi, A. Suzuki, H. Tachizaki, K. Takehara, M. Ikedo, T. Kojima, and M. Nakamura. 2008. Loop-mediated isothermal amplification for the rapid, sensitive, and specific detection of the O9 group of Salmonella in chickens. Vet. Microbiol. 132:197–204.
Okoye, F. C., G. S. Ojewola, and K. Njoku-Onu. 2005. Evaluation of Shrimp Waste Meal as a Probable Animal Protein Source for Broiler Chickens. Int. J. Poult. Sci. 4:458–461.
Olomu, J. M., and S. A. Offiong. 1980. The Effects of Different Protein and Energy Levels and Time of Change from Starter to Finisher Ration on the Performance of Broiler Chickens in the Tropics. Poult. Sci. 59:828–835.
Olukosi, O. A., and E. B. Sonaiya. 2003. Determination of the quantity of scavengeable feed for family poultry on free range. Livest. Res. Rural Dev. 15. Available from: http://www.lrrd.org/lrrd15/5/oluk155.htm
Onderci, M., N. Sahin, K. Sahin, G. Cikim, a Aydín, I. Ozercan, and S. Aydín. 2006. Efficacy of supplementation of alpha-amylase-producing bacterial culture on the performance, nutrient use, and gut morphology of broiler chickens fed a corn-based diet. Poult. Sci. 85:505–510.
Oonincx, D. G. A. B., and I. J. M. de Boer. 2012. Environmental Impact of the Production of Mealworms as a Protein Source for Humans – A Life Cycle Assessment. PlosOne 7.
Oonincx, D. G. A. B., and E. S. Dierenfeld. 2012. An Investigation Into the Chemical Composition of Alternative Invertebrate Prey. Zoo Biol. 31:40–54. Available from: http://doi.wiley.com/10.1002/zoo.20382
Øverland, M., H. F. Schøyen, and a Skrede. 2010. Growth performance and carcase quality in broiler chickens fed on bacterial protein grown on natural gas. Br. Poult. Sci. 51:686–95. Available from: http://www.ncbi.nlm.nih.gov/pubmed/21058073
Øverland, M., A. Tauson, K. Shearer, and A. Skrede. 2010. Evaluation of methane-utilising bacteria products as feed ingredients for monogastric animals. Arch. Anim. Nutr. 64:171–189.
Parsons, C. M., F. Castanon, and Y. Han. 1997. Protein and amino acid quality of meat and bone meal. Poult. Sci. 76:361–368.
Patterson, J. a, and K. M. Burkholder. 2003. Application of prebiotics and probiotics in poultry production. Poult. Sci. 82:627–631.
Pauwels, J., F. Coopman, A. Cools, J. Michiels, D. Fremaut, S. De Smet, and G. P. J. Janssens. 2015. Selection for growth performance in broiler chickens associates with less diet flexibility. PlosOne. doi:10.1016/j.mimet.2015.08.006
Pauwels, J., B. Taminiau, G. P. J. Janssens, M. De Beenhouwer, L. Delhalle, G. Daube, and F. Coopman. 2015. Cecal drop reflects the chickens’ cecal microbiome, fecal drop does not. J. Microbiol. Methods 117:164–170. Available from: http://dx.doi.org/10.1016/j.mimet.2015.08.006
Perez-Maldonado, R. A., K. M. Barram, P. C. Trappett, and G. L. Kerven. 2002. Maximum inclusion of canola meal in broiler finisher diets formulated on a digestible or total amino acid basis. In: Proc. Aust. Poult. Sci. Sym. p. 14.
Perez-Maldonado, R. 2003. Canola meal and Cottonseed meal in broiler and layer diets. Available from:

REFERENCES
160
https://www.aecl.org/assets/RD-files/Outputs-2/DAQ-264JA-Final-Report.pdf
Peters, S. O., O. M. O. Idowu, and B. O. Agaviezor. 2010. Genotype and Sex Effect on Gastrointestinal Nutrient Content, Microflora and Carcass Traits in Nigerian Native Chickens. Int. J. Poult. Sci. 9:731–737.
Peterson, a. T., and I. L. Brisbin. 1998. Genetic endangerment of wild Red Junglefowl Gallus gallus? Bird Conserv. Int. 8:387–394.
Pieterse, E., and Q. Pretorius. 2013. Nutritional evaluation of dried larvae and pupae meal of the housefly (Musca domestica) using chemical- and broiler-based biological assays. Anim. Prod. Sci.
Pinotti, L., and V. Dell’Orto. 2011. Feed safety in the feed supply chain. Biotechnol. Agron. Soc. Environ. 15:9–14.
Pousga, S., H. Boly, J. E. Lindberg, and B. Ogle. 2005. Scavenging pullets in Burkina Faso: Effect of season, location and breed on feed and nutrient intake. Trop. Anim. Health Prod. 37:623–634.
Prinz, J. F., C. J. L. Silwood, A. W. D. Claxson, and M. Grootveld. 2003. Simulated Digestion Status of Intact and Exoskeletally&hyphen;Punctured Insects and Insect Larvae: A Spectroscopic Investigation. Folia Primatol. 74:126–140. Available from: http://www.karger.com/doi/10.1159/000070646
Prosky, L., N. G. Asp, I. Furda, J. W. De Vries, T. F. Schweizer, and B. F. Harland. 1985. Determination of total dietary fiber in foods and food products: collaborative study. Assoc. Off. Anal. Chem. 68:677–679.
Prosky, L., N. G. Asp, T. F. Schweizer, J. W. DeVries, and I. Furda. 1988. Determination of insoluble, soluble, and total dietary fiber in foods and food products: interlaboratory study. Assoc. Off. Anal. Chem. 71:1017–1023.
Proudman J.A., Mellen W.J., A. D. L. 1970. Utilization of Feed in Fast- and Slow-Growing Lines of Chickens. Poult. Sci. 49:961–972.
Pryde, S. E., S. H. Duncan, G. L. Hold, C. S. Stewart, and H. J. Flint. 2002. The microbiology of butyrate formation in the human colon. FEMS Microbiol. Lett. 217:133–139.
Pym, R., E. G. Bleich, and I. Hoffmann. 2006. The relative contribution of indigenous chicken breeds to poultry meat and egg production and consumption in the developing countries of Africa and Asia. In: 12th European Poultry conference. Available from: http://www.cabi.org/animalscience/uploads/file/animalscience/additionalfiles/wpsaverona/10222.pdf
Pym, R. 2008. Poultry genetics and breeding in developing countries: Contribution of indigenous genotypes to production and consumption of poultry meat and eggs. FAO Poult. Dev. Rev.:1–3.
Qureshi, M. A., and G. . Havenstein. 1994. A Comparison of the Immune Performance of a 1991 Commercial Broiler with a 1957 Randombred Strain When Fed “Typical” 1957 And 1991 Broiler Diets. Poult. Sci. 73:1805–1812.
Rahman, M. S., M. a R. Howlider, G. M. Rahman, and N. Mia. 2006. Nutrients availability to scavenging chickens in Bangladesh. Int. J. Poult. Sci. 5:275–278.
Ramachandran Nair, K., P. Mathew, P. Madhavan, and P. Prabhu. 1987. chitin as a feed additive for broiler chicken. Indian J. Poult. Sci. 22:40–44.
Ramos-Elorduy, J., J. M. P. Moreno, A. I. Vázquez, I. Landero, H. Oliva-Rivera, and V. H. M. Camacho. 2011. Edible Lepidoptera in Mexico: Geographic distribution, ethnicity, economic and nutritional importance for rural people. J. Ethnobiol. Ethnomed. 7:1–22.
Rashid, M. M., M. N. Islam, B. C. Roy, K. Jakobsen, and C. Lauridsen. 2005. Nutrient concentrations of crop and gizzard contents of indigenous scavenging chickens under rural conditions of Bangladesh. Livest. Res. Rural Dev. 17. Available from: http://www.lrrd.org/lrrd17/2/rash17016.htm
Ravindran, V., and R. Blair. 1992. Feed resources for poultry production in asia and the Pacific. II Plant protein sources. Worlds. Poult. Sci. J. 48:205–231.

REFERENCES
161
Ravindran, V. 2011. Poultry feed availability and nutrition in developing countries. Alternative feedstuffs for use in poultry feed formulations. Available from: http://www.fao.org/docrep/013/al706e/al706e00.pdf
Ravindran, V. 2012. Advances and future directions in poultry nutrition: an overview. Korean J. Poult. Sci. 39:53–62.
Refrégier-Petton, J., N. Rose, M. Denis, and G. Salvat. 2001. Risk factors for Campylobacter spp. contamination in French broiler-chicken flocks at the end of the rearing period. Prev. Vet. Med. 50:89–100.
Rehman, H. U., W. Vahjen, W. a Awad, and J. Zentek. 2007. Indigenous bacteria and bacterial metabolic products in the gastrointestinal tract of broiler chickens. Arch. Anim. Nutr. 61:319–335.
Rezaei, M., and H. Hafezian. 2007. Use of different levels of high fiber sunflower meal in commercial leghorn type layer diets. Int. J. Poult. Sci. 6:431–433.
Richards, G. A. 1958. The cuticle of Arthropods. In: Ergebnisse der biologie. p. 1–26.
Riise, J. C. 2004. Keeping village poultry: a technical manual on small-scale poultry production.
Roberts, S. a, H. Xin, B. J. Kerr, J. R. Russell, and K. Bregendahl. 2007. Effects of dietary fiber and reduced crude protein on nitrogen balance and egg production in laying hens. Poult. Sci. 86:1716–1725.
Rodehutscord, M., H. J. Abel, W. Friedt, C. Wenk, G. Flachowsky, H.-J. Ahlgrimm, B. Johnke, R. Kühl, and G. Breves. 2002. Consequences of the Ban of By-Products from Terrestrial Animals in Livestock Feeding in Germany and The European Union: Alternatives, Nutrient and Energy Cycles, Plant Production, and Economic Aspects. Arch. für Tierernaehrung 56.
Rodriguez-Romero, N., L. Abecia, J. Balcells, B. Martinez, and M. Fondevila. 2009. Comparison of bacterial profile from caecal content and caecotrophes in growing rabbits fed on two levels of indigestible fibre. In: XXXIX Jornadas de Estudio, XIII Jornadas sobre Producción Animal, Zaragoza, España, 12 y 13 de mayo de 2009. p. 784–786.
Rosegrant, M. W., and S. a Cline. 2014. Global Food Security : Challenges and Policies. Science (80-. ). 1917:10–13.
Rozenboim, I., J. Mahato, N. A. Cohen, and O. Tirosh. 2016. Low protein and high-energy diet: a possible natural cause of fatty liver hemorrhagic syndrome in caged White Leghorn hens. Poult. Sci.
Russell, W. M. S., and R. L. Burch. 1959. The principles of Humane Experimental Technique. 2nd ed. UFAW, London.
Saengkerdsub, S., R. C. Anderson, H. H. Wilkinson, W. K. Kim, D. J. Nisbet, and S. C. Ricke. 2007. Identification and quantification of methanogenic archaea in adult chicken ceca. Appl. Environ. Microbiol. 73:353–356.
Sakomura, N. K., R. D. Ekmay, S. J. Mei, and C. N. Coon. 2015. Lysine, methionine, phenylalanine, arginine, valine, isoleucine, leucine, and threonine maintenance requirements of broiler breeders. Poult. Sci. 94:2715–2721.
Sales, J., and G. P. J. Janssens. 2003. Methods to determine metabolizable energy and digestibility of feed ingredients in the domestic pigeon (Columba livia domestica). Poult. Sci. 82:1457–1461.
Sales, J., and G. P. J. Janssens. 2007. The use of markers to determine energy metabolizability and nutrient digestibility in avian species. Worlds. Poult. Sci. J. 59:314–327.
Sasso. 2010a. Cobb-Sasso. Available from: http://www.sasso.fr/coloured-chickens.php?ref_coq=COBBSASSO&lg=en
Sasso. 2010b. Sasso. Available from: http://www.sasso.fr/coloured-chickens.php?ref_coq=XL44&lg=en
Sasso. 2010c. Sussex. Available from: http://www.sasso.fr/coloured-chickens.php?lg=en&ref_coq=SUSSEX
Saura-Calixto, F., J. Canellas, and L. Soler. 1983. Dietare fibre and Components of the Nitrogen-free Extract of Almond Kernels. J. Sci. Food Africulture 34:1419–1422.
Savory, C. J., D. G. M. Wood-Gush, and I. J. H. Duncan. 1978. Feeding behaviour in a population of domestic fowls in the wild. Appl. Anim. Ethol. 4:13–27.

REFERENCES
162
Schabel, H. G. 2008. Forests insects as food: a global review. In: P. B. Durst, D. V. Johnson, R. N. Leslie, and K. Shono, editors. Forest insects as food: Humans bite back. FAO. p. 37–64.
Schley, P. D., and C. J. Field. 2002. The immune-enhancing effects of dietary fibres and prebiotics. Br. J. Nutr. 87:S221–S230.
Schreiner, M., H. W. Hulan, E. Razzazi-Fazeli, J. Böhm, and C. Iben. 2004. Feeding laying hens seal blubber oil: effects on egg yolk incorporation, stereospecific distribution of omega-3 fatty acids, and sensory aspects. Poult. Sci. 83:462–473.
Schütz, K. E., B. Forkman, and P. Jensen. 2001. Domestication effects on foraging strategy, social behaviour and different fear responses: A comparison between the red junglefowl (Gallus gallus) and a modern layer strain. Appl. Anim. Behav. Sci. 74:1–14.
Scott, T. a, and J. W. Hall. 1998. Using acid insoluble ash marker ratios (diet:digesta) to predict digestibility of wheat and barley metabolizable energy and nitrogen retention in broiler chicks. Poult. Sci. 77:674–679.
Sell J.L., Angel C.R., Piquer F.J., Mallarino E.G., A.-B. H. A. 1991. Developmental Patterns of Selected Characteristics of the Gastrointestinal Tract of Young Turkeys. Poult. Sci. 70:1200–1205.
Sergeant, M. J., C. Constantinidou, T. A. Cogan, M. R. Bedford, C. W. Penn, and M. J. Pallen. 2014. Extensive microbial and functional diversity within the chicken cecal microbiome. PLoS One 9.
Shakouri, M. D., P. a. Iji, L. L. Mikkelsen, and a. J. Cowieson. 2009. Intestinal function and gut microflora of broiler chickens as influenced by cereal grains and microbial enzyme supplementation. J. Anim. Physiol. Anim. Nutr. (Berl). 93:647–658.
Shalash, S. M. M., S. A. El-Wafa, M. A. M. Sayed, H. E. El-Gabry, N. A. Ramadan, and M. S. Mohamed. 2009. Nutritive value of distillers dried grains with soluble and broiler performance at starter period. Int. Jouranl Poult. Sci. 8:783–787.
Shareef, A. M., Z. T. Jamel, and K. M. Yonis. 2009. Detection of antibiotic residues in stored poultry products. Iraqi J. Vet. Sci. 23:45–49.
Shariatmadari, F., and J. M. Forbes. 1993. Growth and food intake responses to diets of different protein contents and a choice between diets containing two concentrations of protein in broiler and layer strains of chicken. Br. Poult. Sci. 34:959–970.
Sheppard, D. C., J. K. Tomberlin, J. A. Joyce, B. C. Kiser, and S. M. Sumner. 2002. Rearing Methods for the Black Soldier Fly ( Diptera : Stratiomyidae ). J. Med. Entomol. 39:695–698.
Shim, M. Y., G. M. Pesti, R. I. Bakalli, P. B. Tillman, and R. L. Payne. 2011. Evaluation of corn distillers dried grains with solubles as an alternative ingredient for broilers. Poult. Sci. 90:369–76. Available from: http://www.ncbi.nlm.nih.gov/pubmed/21248334
Siegel, P. B., A. Haberfeld, T. K. Mukherjee, L. C. Stallard, H. L. Marks, N. B. Anthony, and E. A. Dunnington. 1992. Jungle fowl - domestic fowl relationships: a use of DNA fingerprinting. Worlds. Poult. Sci. J. 48:147–155.
Silbergeld, E., J. Graham, and L. Price. 2008. Industrial Food Animal Production, Antimicrobial Resistance, and Human Health. Annu. Rev. Public Health 29:151–169.
Singh, D. N., R. Perez-Maldonado, P. F. Mannion, and D. Robinson. 2000. Pearl millet (pennistum americanum) - an alternative feed grain for layers. In: Proc. Aust. Poult. Sci. Sym.
Skinner, J. T., A. L. Waldroup, and P. W. Waldroup. 1992. EFFECTS OF REMOVAL OF VITAMIN AND MINERAL SUPPLEMENTS FROM GROWER AND FINISHER DIETS ON LIVE PERFORMANCE AND CARCASS COMPOSITION OF BROILERS ’. Appl. Poult. Sci.

REFERENCES
163
Snels, K. 2012. Efficiency as a starting point for a sustainable livestock production. KU Leuven. Available from: http://www.dewereldmorgen.be/docs/2012/07/10/wervel_masterthesis_efficientie_als_basis_voor_een_duurzame_dierlijke_productie_ku_leuven_2012_34707.pdf
Van Soest, P. J., J. B. Robertson, and B. a Lewis. 1991. Methods for dietary fiber, neutral detergent fiber, and nonstarch polysaccharides in relation to animal nutrition. J. Dairy Sci. 74:3583–3597. Available from: http://dx.doi.org/10.3168/jds.S0022-0302(91)78551-2
Sonaiya, E. B., R. D. S. Branckaert, and E. F. Guèye. 1999. The scope and effect of family poultry research and development. Research and development options for family poultry. Available from: http://www.fao.org/docrep/019/aq635e/aq635e.pdf
Sonaiya, E. B. 2007. Family poultry, food security and the impact of HPAI. Worlds. Poult. Sci. J. 63:132–138.
Sonnenburg, E. D., S. A. Smits, M. Tikhonov, S. K. Higginbottom, N. S. Wingreen, and J. L. Sonnenburg. 2016. Diet-induced extinctions in the gut microbiota compound over generations. Nature 529:212–215.
Sørensen, J., D. Christensen, and B. B. Jørgensen. 1981. Volatile Fatty acids and hydrogen as substrates for sulfate-reducing bacteria in anaerobic marine sediment. Appl. Environ. Microbiol. 42:5–11.
van der Spiegel, M., M. Y. Noordam, and H. J. van der Fels-Klerx. 2013. Safety of Novel Protein Sources (Insects, Microalgae, Seaweed, Duckweed, and Rapeseed) and Legislative Aspects for Their Application in Food and Feed Production. Compr. Rev. Food Sci. Food Saf. 12:662–678. Available from: http://doi.wiley.com/10.1111/1541-4337.12032
Stanley, D., S. E. Denman, R. J. Hughes, M. S. Geier, T. M. Crowley, H. Chen, V. R. Haring, and R. J. Moore. 2012. Intestinal microbiota associated with differential feed conversion efficiency in chickens. Appl. Microbiol. Biotechnol. 96:1361–1369.
Steenfeldt, S., J. B. Kjaer, and R. M. Engberg. 2007. Effect of feeding silages or carrots as supplements to laying hens on production performance, nutrient digestibility, gut structure, gut microflora and feather pecking behaviour. Br. Poult. Sci. 48:454–468.
Steinfeld, H., P. Gerber, T. Wassenaar, V. Castel, M. Rosales, and C. de Haan. 2006. Livestock’s Long Shadow. FAO, Rome.
Stern, N. J., and M. C. Robach. 1992. Nondestructive Sampling of Broilers for Campylobacter-Spp. Poult. Sci. 71:0–3.
St-Hilaire, S., K. Cranfill, M. A. Mc Guire, E. E. Mosley, J. K. Tomberlin, L. Newton, W. Sealey, C. Sheppard, and S. Irving. 2007. Fish Offal Recycling by the Black Soldier Fly Produces a Foodstuff High in Omega-3 Fatty Acids. J. world Aquac. Soc. 38:309–313.
Sundu, B., a. Kumar, and J. Dingle. 2006. Palm kernel meal in broiler diets: Effect on chicken performance and health. Worlds. Poult. Sci. J. 62:316–325. Available from: http://journals.cambridge.org/abstract_S0043933906000213
Suzuki, M., W. Fujimoto, M. Goto, M. Morimatsu, B. Syuto, and T. Iwanaga. 2002. Cellular expression of gut chitinase mRNA in the gastrointestinal tract of mice and chickens. J. Histochem. Cytochem. 50:1081–1089.
Swai, E. S., P. N. Sanka, and J. E. Kaaya. 2013. An investigation of the common causes of death in chicken around Arusha Municipality area, Tanzania. Livest. Res. Rural Dev. 25. Available from: http://www.lrrd.org/lrrd25/11/swai25204.htm
Tadele. 1996. Studies on village poultry production systems in the Central Highlands of Ethiopia. Swedish University of Agricultural Sciences. Uppsala, Sweden.
Terpstra, K., and N. de Hart. 1974. The estimation of urinary nitrogen and faecal nitrogen in poultry excreta. Z Tierphysiol Tierernahr Futtermittelk 32:306–320.

REFERENCES
164
Thacker, P. A., and G. P. Widyaratne. 2007. Nutritional value of diets containing graded levels of wheat distillers grains with solubles fed to broiler chicks. J. Sci. Food Africulture 87:1386–1390.
Tiwary, E., and R. Gupta. 2012. Rapid Conversion of Chicken Feather to Feather Meal Using Dimeric Keratinase from Bacillus licheniformis ER-15. J. Bioprocess. Biotech. 02:1–5. Available from: http://www.omicsonline.org/2155-9821/2155-9821-2-123.digital/2155-9821-2-123.html
Tixier-Boichard, M., B. Bed’Hom, and X. Rognon. 2011. Chicken domestication: From archeology to genomics. Comptes Rendus - Biol. 334:197–204.
Tomberlin, J. K., P. H. Adler, and H. M. Myers. 2009. Development of the Black Soldier Fly (Diptera: Stratiomyidae) in relation to temperature. Environ. Entomol.
Topliff, M., K. De Roest, C. Roguet, P. Chotteau, A. Mottet, P. Sarzeaud, M. C. Deblitz, P. Magdelaine, R. Hoste, and P. van Horne. 2009. The impact of increased operation costs on meat livestock in the EU. Brussels.
Tscharntke, T., Y. Clough, T. C. Wanger, L. Jackson, I. Motzke, I. Perfecto, J. Vandermeer, and A. Whitbread. 2012. Global food security, biodiversity conservation and the future of agricultural intensification. Biol. Conserv. 151:53–59. Available from: http://dx.doi.org/10.1016/j.biocon.2012.01.068
Tscharntke, T., Y. Clough, T. C. Wanger, L. Jackson, I. Motzke, I. Perfecto, J. Vandermeer, and A. Whitbread. 2012. Global food security, biodiversity conservation and the furure of agricultural intensification. Biol. Conserv. 151:53–59.
Tshinyangu, K. K., and G. L. Hennebert. 1996. Protein and chitin nitrogen contents and protein content in Pleurotus ostreatus var columbinus. Food Chem. 57:223–227.
Ukil, M. A. 1992. Availability of nutrients to scavenging chickens and duck in Bangladesh. Bangladesh Agricultural University.
Uni Z., Noy Y., S. D. 1995. Post-hatch changes in morphology and function of the small intestines in heavy and light-strain chicks. Poult. Sci. 74:1622–1629.
Verhoeckx, K. C. M., S. van Broekhoven, C. F. den Hartog-Jager, M. Gaspari, G. A. H. de Jong, H. J. Wichers, E. van Hoffen, G. F. Houben, and A. C. Knulst. 2014. House dust mite (Der p 10) and crustacean allergic patients may react to food containing Yellow mealworm proteins. Food Chem. Toxicol. 65:364–373. Available from: http://www.ncbi.nlm.nih.gov/pubmed/24412559\nhttp://www.sciencedirect.com/science/article/pii/S0278691514000088
Vidyadaran, M. K., a S. King, and H. Kassim. 1990. Quantitative comparisons of lung structure of adult domestic fowl and red jungle fowl, with reference to broiler ascites. Avian Pathol. 19:51–58.
Vignais, P. M., and B. Billoud. 2007. Occurrence, classification, and biological function of hydrogenases: An overview. Chem Rev 107:4206–4272.
de Vries, H. 2000. Observations on management and production of local chickens kept in Muy Muy , Nicaragua . In: World Poultry Congress of Montreal. p. 1–5.
Wang, Z. R., S. Y. Qiao, W. Q. Lu, and D. F. Li. 2005. Effects of enzyme supplementation on performance, nutrient digestibility, gastrointestinal morphology, and volatile fatty acid profiles in the hindgut of broilers fed wheat-based diets. Poult. Sci. 84:875–881.
Weaver, J. C., M. Kroger, and L. R. Kneebone. 1977. Comparative protein studies (Kjeldahl, dye binding, amino acid analysis) of nine strains of Agaricus bisporus (Lange) Imbach mushrooms. J. Food Sci. 42:364–366.
Weiser, J., A. Porth, D. Mertens, and W. Karasov. 1997. Digestion of chitin by notrhern bobwhites and American robins. Condor 99:554–556.

REFERENCES
165
West, B., and B. X. Zhou. 1989. Did chickens go north? New evidence for domestication. Worlds. Poult. Sci. J. 45:205–218.
Westhoek, H., T. Rood, M. van de Berg, J. Janse, D. Nijdam, M. Reudink, and E. Stehfest. 2011. The protein puzzle: consumption and production of meat, dairy and fish in the European Union. The Hague.
Weurding, R. E., a Veldman, W. a Veen, P. J. van der Aar, and M. W. Verstegen. 2001. Starch digestion rate in the small intestine of broiler chickens differs among feedstuffs. J. Nutr. 131:2329–2335.
Whitaker, J., H. Dannelly, and D. Prentice. 2004. Chitinase in insectivorous bats. J. Mammal. 85:15–18.
Wilkinson, J. M. 2011. Re-defining efficiency of feed use by livestock. Animal 5:1014–1022.
Wilson, K. J. 1965. A note on the crop content of two crested guinea-fowl Guttera edou ardi (hartlaub). Ostrich 36:103.
Wiseman, J. 1987. Feeding of non-ruminant livestock.
X-rates. 2013. Currency rates. Available from: http://www.x-rates.com/average/?from=ZAR&to=EUR&amount=1&year=2013
Yang, X., B. Zhang, Y. Guo, P. Jiao, and F. Long. 2010. Effects of dietary lipids and Clostridium butyricum on fat deposition and meat quality of broiler chickens. Poult. Sci. 89:254–260. Available from: http://www.ncbi.nlm.nih.gov/pubmed/20075277
Yang, Y., P. a Iji, a Kocher, E. Thomson, L. L. Mikkelsen, and M. Choct. 2008. Effects of mannanoligosaccharide in broiler chicken diets on growth performance, energy utilisation, nutrient digestibility and intestinal microflora. Br. Poult. Sci. 49:186–194.
Yegani, M., and D. R. Korver. 2013. Effects of corn source and exogenous enzymes on growth performance and nutrient digestibility in broiler chickens. Poult. Sci. 92:1208–20. Available from: http://www.ncbi.nlm.nih.gov/pubmed/23571330
Yen, A. L. 2010. Edible insects and other invertebrates in Australie: future prospects. In: P. Durst, D. Johnson, R. Leslie, and K. Shono, editors. Forest insects as food: humans bite back. Available from: http://ultimatepreparednesslibrary.com/wp-content/uploads/2012/03/EdibleInsects-humansbiteback.pdf
Yo, T., M. Vilarino, J. M. Faure, and M. Picard. 1997. Feed Pecking in Young Chickens: New Techniques of Evaluation. Physiol. Behav. 61:803–810.
Zaghini, a, G. Martelli, P. Roncada, M. Simioli, and L. Rizzi. 2005. Mannanoligosaccharides and aflatoxin B1 in feed for laying hens: effects on egg quality, aflatoxins B1 and M1 residues in eggs, and aflatoxin B1 levels in liver. Poult. Sci. 84:825–832.
Zagrobelny, M., A. L. Dreon, T. Gomiero, and G. L. Marcazzan. 2009. Toxic moths: source of a truly safe delicacy. J. Ethno-biol. 29:64–76.
Zorman, T., M. Heyndrickx, S. Uzunović-Kamberović, and S. Smole Možina. 2006. Genotyping of Campylobacter coli and C. jejuni from retail chicken meat and humans with campylobacteriosis in Slovenia and Bosnia and Herzegovina. Int. J. Food Microbiol. 110:24–33.
Zulkifli, I., N. Abdulllah, N. M. Azrin, and Y. W. Ho. 2000. Growth performance and immune response of two commercial broiler strains fed diets containing Lactobacillus cultures and oxytetracycline under heat stress conditions. Br. Poult. Sci. 41:593–597.
Zulkifli, I., R. T. Dass, and M. T. C. Norma. 1999. Acute heat-stress effects on physiology and fear-related behaviour in red jungle fowl and domestic fowl. Can. J. Anim. Sci. 79:165–170.


Appendix


APPENDIX
171
Appendix 1: List of reported alternative ingredients for broilers and/ or laying hens
Bacterial protein meal Improved feed conversion in broilers and did not affect weight gain compared to soybean control diet (Øverland, Schøyen, et al., 2010).
Broken rice Crude protein content of 9.8%, ADF and NDF low. But lysine nearly eight times lower compared to soybean meal (Mutayoba et al., 2011).
Canola meal Contains anti-nutritive factors such as glucosinolates, sinapine (can induce fishy taint in the eggs), phytic acid and tannins and dietary fibre is high. Amino acid composition complements with soybean meal (Khajali and Slominski, 2012). Feed conversion in broilers (4 - 41 d.) improved with a diet of 400 g/ kg Pinjarra canola meal (replacing 148g /kg of soybean meal and 424 g/ kg of wheat in the control diet) although weight gain decreased (Perez-Maldonado et al., 2002).
Chick peas Crude protein content of 166 g/ kg fresh chick peas (of which 10.8 g/ kg lysine) and tannins present (Farrell, Perez-Maldonado, et al., 1999).
Cottonseed meal Feed conversion in broilers (4-25 d.) improved with a diet of 400 g/ kg cottonseed meal (replacing 250g /kg of soybean meal and decreasing about 250 g/ kg of sorghum in the control diet) although weight gain decreased. For laying hens, an inclusion of 200 g/ kg cottonseed meal caused a 10% decrease in egg productivity (18 – 57 weeks of age) (Perez-Maldonado, 2003).
Curcubita seed meal Crude protein content of 34.10% with lysine of 1.56% DM but presence of trypsin inhibitor (Mutayoba et al., 2011). Inclusion of 66 g/ kg Cucurbita seed meal (replacing soybean meal and vegetable oil) improved feed conversion and increased live weight. Abdominal fat and harmful lipids in the serum were reduced by inclusion of 100 g/ kg. There was no effect on meat sensory quality (Aguilar et al., 2011).
Distillers dried grains with solubles (DDGS) Body weight and feed conversion were not affected after
inclusion of 9% DDGS in the diet of broilers (1- 4 wks) compared to a control diet that was higher in corn and soybean meal (Shalash et al., 2009). Inclusions up to 24%

APPENDIX
172
for corn DDGS (Shim et al., 2011) and 20% for wheat DDGS (Thacker and Widyaratne, 2007) have been reported to not affect the productivity compared to commercial diets.
Faba beans Feed intake, egg production, egg weight and food conversion ratio did not change after inclusion of 250 g/ kg faba beans in a laying hens’ diet (reducing wheat and soybean meal and increasing sorghum compared to the control diet) (Farrell, Perez-Maldonado, et al., 1999).
Field peas Contains tannins. Crude protein content of 196 g/ kg fresh field peas of which 13.0 g/ kg lysine (Farrell, Perez-Maldonado, et al., 1999).
Gliricidia sepium seed meal Crude protein content of 25.55% with lysine at 1.29% DM and high in Iron but tannins, HCN and phenols present (Mutayoba et al., 2011)
Leucaena leucocephala leaf meal Crude protein content of 29.38% with lysine at 1.47%DM and high in manganese. But NDF and AFD high and tannins, phenols and HCN present (Mutayoba et al., 2011)
Maize bran Crude protein content at 15.36% but lysine at 0.53% DM only and high in iron (Mutayoba et al., 2011).
Moringa oleifera leaf meal Crude protein content of 30.65% and lysine 1.40%DM. But phenols and tannins present (Mutayoba et al., 2011).
Musca domestica larvae meal For broiler chickens between 3 and 6 weeks of age maggot meal can completely replace fishmeal on equi-protein basis in their diets without effect on weight gain, feed consumption and feed conversion (Awoniyi et al., 2003).
Inclusion of 20% maggots in the diet of broiler chickens did not affect the feed intake and improved the live weight and the feed conversion. Soybean meal was higher in the control diet but corn, however, was lower (Hwangbo et al., 2009).
An inclusion of 12% house fly larvae meal, grown on municipal organic waste, compared to a soybean meal diet did not affect final weight or feed conversion (Ocio et al., 1979).
Palm kernel meal Contains no anti-nutritional factors but is high in fibre. Immune-boosting and prebiotic effect. Palm kernel meal can included at 40% in broiler diets, but methionine and lysine need to be supplemented (Sundu et al., 2006).

APPENDIX
173
Pearl millet The performance and carcass yield of broilers fed diets containing up to 50% pearl millet were equivalent or better compared to broilers fed typical corn-soybean diets (Davis et al., 2003). For laying hens, pearl millet can substitute for wheat, sorghum and some soybean meal without affecting egg production, feed conversion or egg weight (Singh et al., 2000).
Red sorghum Crude protein content of 11.19% with lysine 0.22% DM only. Rich in Ca, Na, S and Cu (Mutayoba et al., 2011).
Shrimp waste meal Contains 44% of crude protein on DM base. Shrimp waste meal can be included up to 10% in both starter and finisher broiler diets (Okoye et al., 2005).
Sunflower products Sunflower seed cake meal contains a crude protein content of 31.4% and lysine at 1.02% DM. High contents of NDF and ADF. High in Zn and Cu (Mutayoba et al., 2011).
High-fibre sunflower cake increased ileal digestibility of fat and protein and decreased Clostridium spp. in the jejunum. Feed conversion was not affected by 20% inclusion of high-fibre sunflower cake (Kalmendal et al., 2011). Replacing soybean meal and maize in layers’ diet up to 10% will not affect feed consumption or hen-day egg production. Egg parameter were never (up to 15% high fibre sunflower meal) affected (Rezaei and Hafezian, 2007).
Sweet lupins Feed intake, egg production, egg weight and food conversion ratio did not change after inclusion of 250 g/ kg sweet lupins in a laying hens’ diet (reducing wheat and soybean meal and increasing sorghum compared to the control diet) (Farrell, Perez-Maldonado, et al., 1999).
White sorghum (low tannin) Crude protein content of 13.65% but lysine at 0.27% DM
only (Mutayoba et al., 2011).

AP
PEN
DIX
17
4
Appendix 2: overview of reported bacteria in the chickens' cecum.
I Phylum Clut Order ~amlly Genus References
Neptlvlcutet Selenomonadales Veillonellaceae Sporomusa 4.87"(2): 2.2% (17) Mollicut~s Mycoplasmatales M'{coplasmataceae Mycoplasma 1,n "121
Syntrophococcut (4)
Ro!<!burla 4) Lachnospiraceae Co prococcus (4)
Anaeroflum 4 Acetltomaculum 4)
Ethanoligenens 4) Hespelia (4)
Clostrldiaceae Fastidlosiplla 4
Ciostridia (5" (7)) Clostrldlales Coprobacillus (4) lutispo_ra 4
Firmicutes CioSiridium 2.1" [12). 36.4" (8). 62.4" (2).(1(.(3).(5). (10).(13). (15) Eubacterlaceae Eubacterium 10.0% (8). 15.5" (2). 60.6% [12)
Gemmlger 3,4" (12)
Rumi'nococcaceae Oscillbacter 4 Hydrogenoanaerobocterium 4)
Rumlnococcus 16.4" (8) Blautla (4
Prokaryota·bactel1a Enterococcaceae Enterococcus 1.17" (8). 1.33" (2).(4),(5)
lactobadfales Lactobacllaceae Lactobadllus 0. 79% [8], 5.31"W· U]. [3},[4},[5],[10},[13}, [ IS] Baclll Ll!'uconostocaceae Weissella 0.48" (8)
Streptococcaceae Streptococcus 0.65" (8). 0.7% (12].0.9" 121 Baclllales Bacl acoae Bacillus 1.42" (8)
E_ry~il"'lotrlchla E_rysl!"''o trichales ~ry~lpelotrlchaceae 6
Gammaproteobacterfa enterobacterlales enterol»cter1aceae Salmonella (I) Escherichia !.26" (8). (1),(2).(3). (4],(5].(9), (15]
Alphaproteobacteria Rhlzoblales Srucellaceae Ochrobac~rlurn 0.79" (8) Proteobacteria (3.5" (2))
Betaproteobacteria Burkholderlales Alcallgenaceae Alcali enes 8
Adwomobacter 0.64" (8) Epsilonproteobacteria Calll!>}iobacterbacterales Campylobac~raceae Campylobacter I] Oeltaproteobacteria Desulfovlbrionales Desulfuvibrionaceae (14(
Bacterolde~s Bacteroldalet Bacteroldaceae Bacteroides 5.1" (8),12.8% (12). (3)
Baeteroldetes Cytophagla Cytophaplet Aammecvirpceae Perexillbacter (4)
Relchenbachiela {4)
Aawbatteria Flavobacterlales Ravobacteriaceae Flavobacterlum 0.16"(8) Fusobacterla Fusob.lcteria Fusobacterlales Fusobacteriaceae FusobactHlum 6.2% (12). 13.5" (8(
Actinobacteria Ai:tinobacterfa Bifidobacteriales Bifidobacteriaceae BifldobacterilMTl (3), (10). (IS] Corlobacterlales CorJobacteriaceae Eigerthella (16]
Alchaea·Eurvarchaeota Et.WYarthaeota Methanobact'erla Methanobacteriales Methanobacterîaceae Met ha nobrevibacte:r wor:sel UJ
Overview of reported bacteria in the chickens' cecum (based on [1] Amit-Romach et al., 2004; [2] Bjerrum et al., 2006; [3] Cao et al., 2005; [4] Danzeisen et al.,
2011; [5] Engberg et al., 2004; [6] De Maesschalck et al., 2010; [7] Gong et al., 2007; [8] Lu et al., 2003; [9] Mathlouthi et al., 2002; [10] Mountzouris et al., 2007;
[11] Saengkerdsub et al., 2007; [12] Salanit ro et al., 1978; [13] Shakouri et al., 2009; [14] Videnska et al., 2014; [15] Xia et al., 2004; [16] Yin et al., 2010; [17] Zhu
et al., 2002).

APPENDIX
175
Appendix 3: Articles not included in Chapter 3, study origin and the reason why it was not
included
Article Country Reason why it was not included
(Ali, 2002) Bangladesh masterthesis; crop and gizzard content mixed
(Almeida et al., 2012) Denmark any crop content, different from herbage and supplementary feed, was omitted from the analysis
(de Vries, 2000) Nicaragua no qualitative information
(Hanyani, 2012) South-Africa masterthesis
(Horsted et al., 2007) Denmark controlled forage vegetations
(Kingori et al., 2007) Kenya controlled free-range diet
(Kondombo et al., 2003)
Burkina Faso overall results for different supplemented feeds
(Lomu et al., 2004) Australia sample size too small (n = 2)
(Abou-Elezz Fouad Mohammed et al., 2012)
Mexico concentrated feed available at libitum and restriced scavenge area
(Rahman et al., 2006) South-East Asia
crop and gizzard content mixed
(Savory et al., 1978) Scotland analysis performed on fecal matter
(Wilson, 1965) Zimbabwe sample size too small (n = 2)
(Ukil, 1992) Bangladesh masterthesis, crop and gizzard content mixed

APPENDIX
176
Appendix 4: Articles used to estimate nutrient composition in commercial broiler and
laying hen diets
Commercial broiler diets Commercial laying hen diets
(Awad et al., 2009) (Chowdhury et al., 2005)
(Çabuk et al., 2004) (Donalson et al., 2005)
(Cerrate et al., 2011) (Grobas et al., 2001)
(Kalavathy et al., 2003) (Keshavarz, 2003)
(Kalmar et al., 2011) (Lammers et al., 2008)
(Lee et al., 2003) (Liebert et al., 2005)
(Onderci et al., 2006) (Roberts et al., 2007)
(Pauwels, Coopman, et al., 2015) (Schreiner et al., 2004)
(Yang et al., 2008) (Steenfeldt et al., 2007)
(Zulkifli et al., 2000) (Zaghini et al., 2005)

APPENDIX
177
Appendix 5: Questionnaire to chicken owners
This questionnaire is part of the PhD research of Jana Pauwels at the Faculty of Veterinary
Medicine, Ghent University. With these questions about your chickens I want to get an idea
about the costs and the benefits of keeping chickens in a non-commercial way. We are
especially interested in alternative food resources for chickens. There are no wrong answers;
we only ask that you complete this questionnaire as honest as possible.
Thank you very much for your cooperation!
Jana
Date of interview: ……………………
Identification owner :
- In which year where you born?
……………………………………………………….
- Male/female
- What is your profession?
………………………………………………………..
- What is your highest grade of education?
………………………………………………………..
- In which village or city are your chickens kept?
………………………………………………………..
How many adult (older than 6 months) chickens do you currently have ? …………….
How many chicks (younger or at the age of 6 months) do you currently have ? ………
If you have no chickens, please complete question one only.
If you have one or more chickens, please complete all questions.
Thank you very much

APPENDIX
178
1. There are many reasons why people have a limited number of chickens. Can you
indicate to which extent the following reasons contribute to the amount of chickens
in your flock? I don’t have more chickens because: 1
totally
disagree
2
disagree
3
slightly
disagree
4
neutral
5
slightly
agree
6
agree
7
totally
agree
It’s too expensive to
buy new chickens □ □ □ □ □ □ □
It’s too expensive to
feed more chickens □ □ □ □ □ □ □
It’s too much work to
take care of more
chickens
□ □ □ □ □ □ □
I just started keeping
chickens □ □ □ □ □ □ □
I don’t have enough
space □ □ □ □ □ □ □
I already have too
many chickens □ □ □ □ □ □ □
The adult chickens
often die □ □ □ □ □ □ □
The chicks often die □ □ □ □ □ □ □
I have enough chickens □ □ □ □ □ □ □
2. People have many reasons to keep chickens. These reasons depend on many things
and can vary in time for the same person. Which are your reasons to keep chickens?
1 totally
disagree
2 don’t
agree
3 moderately
disagree
4 neutral
5 moderately
agree
6 agree
7 totally
agree
Eggs for sale □ □ □ □ □ □ □
Eggs for own
consumption □ □ □ □ □ □ □
Meat for sale □ □ □ □ □ □ □
Meat for own
consumption □ □ □ □ □ □ □
To have a backup in
case I need money □ □ □ □ □ □ □
To show my wealth □ □ □ □ □ □ □
I use the feathers □ □ □ □ □ □ □
As a hobby □ □ □ □ □ □ □
They eat my kitchen
waste □ □ □ □ □ □ □
To give them away as a
gift □ □ □ □ □ □ □

APPENDIX
179
3. A lot of factors can cause death among your chickens. Which causes of death have
you noticed among your chickens and chicks in the last two years? 1
never
2
very rarely
3
rarely
4
sometimes
5
frequently
6
very frequently
7
always
Disease □ □ □ □ □ □ □
Starvation □ □ □ □ □ □ □
Thirst □ □ □ □ □ □ □
Predation □ □ □ □ □ □ □
Theft □ □ □ □ □ □ □
Slaughter □ □ □ □ □ □ □
Old age □ □ □ □ □ □ □
They disappear □ □ □ □ □ □ □
Cause of death
unknown □ □ □ □ □ □ □
None of my chickens
died in the last two
years □ □ □ □ □ □ □
4. How many people help you to take care of the chickens?......................................
5. How much time do you and your helpers spend on the chickens? ……………….
6. If you would have 10 newborn chicks, how many of them do you expect to reach
maturity (6 months)?………………………
7. In some villages the chickens run around freely. They can easily mix with the
chickens of the neighbors. How do you recognize your chickens?
1
totally
disagree
2
disagree
3
moderately
disagree
4
neutral
5
moderately
agree
6
agree
7
totally
agree
I know them
individually □ □ □ □ □ □ □
By color □ □ □ □ □ □ □
They come to me □ □ □ □ □ □ □
They are fenced □ □ □ □ □ □ □
There are no other
chickens around □ □ □ □ □ □ □
I don’t know them □ □ □ □ □ □ □
8. People often combine a job with keeping chickens. How do you experience the
impact of keeping chickens on your daily workload?
no impact negligible reasonable slightly heavy exhausting very exhausting Full time job
□ □ □ □ □ □ □

APPENDIX
180
9. Some people keep exact record of their chickens’ prestations while other people
have totally no idea about it or only follow some prestations e.g. number of eggs,
weight, age,…. Which prestations do you record and what is the reason for not
recording the other prestations?
1
totally
don’t
agree
2 don’t
agree
3 moderately
disagree
4 neutral
5 moderately
agree
6 agree
7 totally
agree
I have no interest □ □ □ □ □ □ □
I have no time □ □ □ □ □ □ □
It’s too difficult □ □ □ □ □ □ □
I never thought of it □ □ □ □ □ □ □
I don’t see the
benefits □ □ □ □ □ □ □
I weigh my chickens □ □ □ □ □ □ □
I observe them daily □ □ □ □ □ □ □
I keep record of the
number of eggs □ □ □ □ □ □ □
I keep record of the
number of chicks □ □ □ □ □ □ □
I keep record of the
number of chickens □ □ □ □ □ □ □
I keep record of my
chickens’ age □ □ □ □ □ □ □
10. Chicken meat is low in fat and rich in protein. If you had to choose a chicken for
slaughter, which one would you choose? 1
never
2
very unlikely
3
unlikely
4
neutral
5
likely
6
very likely
7
always
I would refuse to
choose a chicken for
slaughter □ □ □ □ □ □ □
The oldest hen □ □ □ □ □ □ □
The heaviest hen □ □ □ □ □ □ □
The oldest rooster, if I
have more than one □ □ □ □ □ □ □
The heaviest rooster, if
I have more than one □ □ □ □ □ □ □
The chicken that is
easiest to catch □ □ □ □ □ □ □
It doesn’t matter □ □ □ □ □ □ □
The most aggressive
one □ □ □ □ □ □ □
A young hen that is
not laying eggs yet □ □ □ □ □ □ □
I would slaughter my
own chickens □ □ □ □ □ □ □

APPENDIX
181
11. Some chickens have a whole village to live in and other chickens are kept on a small
fenced area. To which facilities do your chickens have access? 1
never
2
very rarely
3
rarely
4
sometimes
5
frequently
6
most of the time
7
always
Natural water supply □ □ □ □ □ □ □
Water provided by
people □ □ □ □ □ □ □
Accessible trees □ □ □ □ □ □ □
Bush to hide □ □ □ □ □ □ □
Open stable □ □ □ □ □ □ □
Predator safe shelter
during the night □ □ □ □ □ □ □
Unfenced area to
scavenge □ □ □ □ □ □ □
Fenced area to scavenge □ □ □ □ □ □ □
House of humans □ □ □ □ □ □ □
Garbage belt or compost
belt □ □ □ □ □ □ □
12. Some chickens run around freely and are supposed to find their own feed. These
chickens can be fed in addition to what they find outside. What do you feed your
chickens in addition to what they scavenge? 1
never
2
very
rarely
3
rarely
4
sometimes
5
frequently
6
very
frequently
7
always
Kitchen leftovers □ □ □ □ □ □ □
Commercial chicken
grain mix □ □ □ □ □ □ □
Grain from own
cultivation □ □ □ □ □ □ □
Crops from own
cultivation □ □ □ □ □ □ □
Collected insects □ □ □ □ □ □ □
It depends on the season
what I feed my chickens □ □ □ □ □ □ □
It depends on the season
how much I feed my
chickens □ □ □ □ □ □ □
I provide clean water □ □ □ □ □ □ □ My chickens could
survive on the feed I
provide them with,
without scavenging
□ □ □ □ □ □ □
My chickens could
survive on what they
find during scavenging
only
□ □ □ □ □ □ □

APPENDIX
182
13. Nobody exactly knows what chickens eat if they scavenge around. Which of the
following feeds have you noticed are eaten by your chickens? 1
never
2
very rarely
3
rarely
4
sometimes
5
frequently
6
very frequently
7
constantly
Grains/seeds □ □ □ □ □ □ □
Grass □ □ □ □ □ □ □
Flies □ □ □ □ □ □ □
Mosquito’s □ □ □ □ □ □ □
Beetles □ □ □ □ □ □ □
Worms □ □ □ □ □ □ □
Spiders □ □ □ □ □ □ □
Ticks □ □ □ □ □ □ □
Mice □ □ □ □ □ □ □
Leftovers from people □ □ □ □ □ □ □
Dead animals □ □ □ □ □ □ □ Small stones/
sand/gravel □ □ □ □ □ □ □
Others:
14. Insects are very common were animals live. Some people may even consider them
a plaque. Are there bugs that cause a plague where you live?
……………………………………………………………………………………….
15. If you go to the market or the shop, what do you expect to be the price of 1kg of the
cheapest commercial chicken feed? ………………
16. If you go to the market or the shop, what do you think is the normal price for an
egg? ………………………………………………
17. This is a 2 year old hen and a 2 year old rooster. How much money will you receive
if you sell them on the market?
For the hen:……………… For the rooster: ……………….

APPENDIX
183
18. People make all kinds of investments for their chickens. Some spend a lot of money
while others spend none. Where do/did you spend money on for your chickens? 1
nothing
2
very few
3
few
4
enough
5
a lot
6
very much
7
too much
Feed □ □ □ □ □ □ □
Veterinarian □ □ □ □ □ □ □
Housing □ □ □ □ □ □ □
Medicine □ □ □ □ □ □ □
New chickens □ □ □ □ □ □ □
Feed and drinking
equipment □ □ □ □ □ □ □
Protection for predators □ □ □ □ □ □ □
Litter □ □ □ □ □ □ □
Toys □ □ □ □ □ □ □
19. Imagine somebody gave you extra money to spend on your chickens, which things
would you immediately change and which ones would you not change? 1
I would
never change it
2
totally
unimportant
3
slightly
unimportant
4
neutral
5
important
6
very
important
7
priority
More food □ □ □ □ □ □ □
Vaccination □ □ □ □ □ □ □
Better housing □ □ □ □ □ □ □
Deworming □ □ □ □ □ □ □
New chickens □ □ □ □ □ □ □
Protection for
predators □ □ □ □ □ □ □
I would buy
more chickens □ □ □ □ □ □ □
I would not
change anything □ □ □ □ □ □ □
Thank you very much for your cooperation!
Jana


Summary


SUMMARY
- 187 -
Summary
Although the percentage of hungry people in the world is decreasing, still one out of ten (nearly
800 million) is undernourished. Nevertheless, commercial chickens are fed a diet that contains
over 80% of soybean meal and cereal grains such as wheat and corn. Of the global cereal grain
production, 8% goes to poultry feed while cereals can be used in the human diet too. Of the
global soybean meal production, 48% is used in poultry diets. Though soybean meal is not a part
of the human diet and is, strictly spoken, considered a by-product, soybeans are grown explicitly
to produce soybean meal for feed and 1 kg of soybeans is needed to gain 0.8 kg of soybean meal.
In addition, industrial chickens induce a loss of human-edible energy and protein while converting
feed to eggs and meat. This is in contrast to rural chickens were the efficiency is reported to
exceed 100% as these chickens are often fed human-inedible ingredients. Considering the
growing population, both of human and livestock, questions about the sustainability of the
current intensive feeding system, where food is used as feed, arise. Even if a small decrease of
the share of food in the diets of chickens could be achieved, the impact will be significant as there
are 21.3 billion chickens in the world, which equals three per person.
When aiming to decrease the use of food in the feed of chickens, the first step is to list alternative
ingredients. Knowing alternative, local ingredients that can be used in chicken feed will also
benefit rural chicken owners, especially in developing countries, for their dependence of
commercial grains will decrease. Observing the scavenging diet of free-ranging chickens (Chapter
3) teaches that chickens ingest a huge variety of ingredients such as seeds, green forages, insects
and kitchen waste. Seeds are the most common environmental ingredient, irrespective of
ingredients supplemented by humans. As the amount of seeds in the crop is positively correlated
with the crude fibre content, we learn that chickens do not avoid fibrous ingredients, while fibre
is generally considered of low energetic value and, in high amounts, even anti-nutritious.
Compared to a commercial diet, the scavenging diet was higher in crude fibre, lower in crude
protein, Ca, P and energy and tended to be lower in crude fat. As this was also seen when
comparing the nutrient content of the supplemented ingredients to the environmental
ingredients, the question raises whether the actual nutrient and energy profile of feeds for

SUMMARY
- 188 -
commercial breeds is a consequence of the increased requirements for fast growth or high egg
production, or did these breeds develop based on the diet change that was induced by humans?
When aiming to increase the profit of rural chicken owners, knowledge about their chicken
management is needed. In general, these chickens are kept in traditional free-range systems and
their management (or the absence thereof) differs largely from the management that is
considered optimal, based on industrial parameters. As exact information on this traditional
management is scarce, a survey among the rural chicken owners in Limpopo, South-Africa, was
performed (Chapter 4). Limpopo is the poorest province in the country and owning chickens is
suggested to be a possible additional source of income and animal protein. We aimed to
determine ways to increase the profit for rural chicken owners, without tackling the traditional
system. It was concluded that a minimum of time, money and effort was spent on the chickens.
The chickens, however, needed both scavenger and supplemented feed to survive. Besides
slaughter, the main causes of death were disease and predation, improving the health and the
protection of the chickens should be the focus when trying to increase the profit of traditional
free-ranging chicken husbandry.
If the fibre content increases by using alternative ingredients, fibre breakdown will be important
for the chickens. Fermentation of fibre in chickens is performed by the microbiota in the ceca
and literature suggests that the microbiota of indigenous free-range chickens is more capable to
break this fibre down compared to industrial chickens. Which raises questions about possibilities
to increase fibre fermentation by transplanting cecal microflora. To study these bacteria, so far,
chickens always had to be euthanized in order to obtain a cecal sample. In Chapter 5a,
quantification and identification of the microbial populations in cecal drop, cecal content and
fecal drop samples from chickens showed that cecal drop contains a bacterial community that is
very similar (concerning bacterial diversity, richness and species composition) to cecal content,
as opposed to the bacterial community found in fecal drop. Therefore, a sample from the cecal
drop can be used as a reliable representative for the cecal microbiota. Indicator genera for the
scavenger and the commercial diet could be identified but interpreting the effects of these
genera on the overall health and digestibility of nutrients was not possible (Chapter 5b).

SUMMARY
- 189 -
As insects are found in each scavenger diet (Chapter 3) and as they are known to convert waste
streams into protein, fat and micronutrients, they are very interesting alternative ingredients.
Before including insects in feed, however, studies on digestibility and nutrient composition will
be needed. Chitin is a nitrogen containing polysaccharide that is included in the insects’
exoskeleton. On the one hand does the nitrogen in chitin bias the results for crude protein,
obtained by the Kjeldahl analysis. On the other hand, crude fibre causes a bias in the chitin
analysis. A method, based on the determination of nitrogen in the chitin fraction, was discovered
to clarify these entangled results and to estimate true protein more accurately (Chapter 6).
Adding alternative ingredients (fibrous, insects or others) that do not compete with the human
diet might require changes throughout the whole chicken production system. The growth rate of
chicken breeds, for example, is linearly related to their resilience to cope with fibre-rich and
protein and energy-poor diets. Meaning that fast growing breeds decrease their weight gain on
a scavenger diet, whereas slow growing breeds can keep their growth rate the same for both
diets by increasing their feed intake. No differences of digestive capacity between the breeds
were observed (Chapter 7). Re-selecting chicken breeds for high performance on sustainable
diets might increase the final profit.
To increase the use of human-inedible ingredients in feed, more than only the feed might have
to change. Dealing with fibre-rich ingredients, exploring ways to add sustainably bred insects to
feed and selecting chicken breeds to produce on less concentrated diets are, by this PhD work,
found to be the topics that need priority. Today, chickens on less energy dense diets will not
exceed the profits made in the intensive poultry industry on concentrated diets. Yet, as the feed
prices increase over the years, a tipping point might arrive where a lower production is justified
by the lower costs of feed ingredients. Anyway, considering the global population growth,
increasing the production of animal products will be necessary. The question remains how to
achieve this within the finite sources of our planet.


Samenvatting


SAMENVATTING
- 193 -
Samenvatting Alhoewel het percentage ondervoede mensen in de wereld daalt, is vandaag de dag nog steeds
één op tien mensen (800 miljoen in totaal) ondervoed. Toch bestaat het voeder van kippen in de
industrie voor 80% uit sojaschroot en granen zoals tarwe en maïs. Acht procent van de globale
graanproductie gaat naar kippenvoeder terwijl granen ook direct door mensen geconsumeerd
kunnen worden. Van de algemene productie van sojaschroot gaat zelfs 48% naar kippenvoeder.
Alhoewel sojaschroot niet direct door mensen geconsumeerd wordt en dus, strikt genomen, een
bijproduct is, worden sojabonen geproduceerd met het specifieke doel om er sojaschroot voor
diervoeders van te maken. Om 0.8 kg sojaschroot te maken, heeft men 1 kg sojabonen nodig.
Bovendien gaan er voor de mens beschikbare eiwitten en calorieën verloren wanneer
commerciële kippen hun voeder omzetten in vlees en eieren, in tegenstelling tot kippen die
gevoederd worden met ingrediënten die voor de mens niet benutbaar zijn. Aangezien de
populatie van zowel mens als vee groeit, wordt de duurzaamheid van dit intensieve voeder
systeem, waarbij voedsel als voeder wordt gebruikt, in vraag gesteld. Zelfs een kleine besparing
op het aandeel “voedsel” in het voeder van kippen, zou al een groot verschil maken daar er 21.3
miljard kippen zijn in de wereld, ofte een drietal per persoon.
In het streven naar een lager gebruik van voedsel als voeder bij kippen, is het een eerste stap om
mogelijke alternatieven op te sommen. Kennis over het gebruik van lokale bronnen in
kippenvoeder is bovendien belangrijk voor landelijke boeren, vooral in ontwikkelingslanden, daar
zij hierdoor minder afhankelijk zullen worden van granen op de commerciële markt. Het
observeren van loslopende, scharrelende kippen (Hoofdstuk 3) wijst uit dat kippen een grote
variëteit aan ingrediënten consumeren zoals zaden, kruiden, grassen, insecten en keukenafval.
Zaden werden het meest geconsumeerd, los van de ingrediënten die door de mens
gesupplementeerd werden. Aangezien de hoeveelheid zaden in de krop positief gecorreleerd
was met het aandeel ruwe celstof, leerden we dat kippen geen vezelachtige substraten
vermijden, terwijl vezels in kippenvoeder als laag energetisch beschouwd worden en, in grotere
hoeveelheden, zelfs de voederwaarde van het dieet doen dalen. In vergelijking met een
commercieel dieet bevatte het scharreldieet meer ruwe celstof, minder ruw eiwit, Ca, P en
energie, en neigde lager te zijn in ruw vet. Aangezien dit ook opgemerkt werd wanneer

SAMENVATTING
- 194 -
nutriëntensamenstelling van natuurlijke ingrediënten vergeleken werd met door de mens
gesupplementeerde ingrediënten, kan men zich afvragen of de hedendaagse voeder- en
energiewaarden in commerciële voeders het gevolg zijn van behoeften voor snelle groei en hoge
eiproductie of juist aanleiding heeft gegeven tot de ontwikkeling van deze hoogproductieve
rassen.
Wanneer getracht wordt de opbrengst van landelijke kippenhouders in ontwikkelingslanden op
te krikken, is informatie over hun management onontbeerlijk. Traditioneel worden deze kippen
volledig vrij gehouden en hun management (of de afwezigheid ervan) verschilt in grote mate van
het optimale, bepaald op basis van industriële parameters. Daar exacte informatie over dit
management zeldzaam is, werd een enquête afgenomen bij de lokale kippenhouders in Limpopo,
Zuid-Afrika (Hoofdstuk 4). Limpopo is de armste provincie in Zuid-Afrika en het houden van
kippen kan de bevolking voorzien van extra geld en dierlijke eiwitten. Ons doel was om
mogelijkheden te identificeren waarop kippenhouders hun inkomsten via de kippen konden
verhogen zonder in conflict te treden met het traditionele beleid. Er werd geconcludeerd dat een
minimum aan tijd, geld en moeite aan de kippen werd gespendeerd. Toch hebben deze kippen
zowel het voeder dat ze vinden in de natuur als het voeder dat ze van de mensen krijgen nodig.
Als slachten niet wordt meegerekend, stierven kippen voornamelijk aan een ziekte of door
predatie. Dit suggereert dat, om de inkomsten van de traditionele kippenhouderij in
ontwikkelingslanden te verhogen, de klemtoon moet liggen op het verbeteren van de gezondheid
van de kippen en het beter beschermen tegen roofdieren.
Als de vezelinhoud van voeders verandert door het gebruik van alternatieve ingrediënten, zal
vezelafbraak voor kippen belangrijker worden. Bij kippen worden diëtaire vezels gefermenteerd
door de microbiota in de ceca en uit de literatuur blijkt dat de microbiota van rurale, scharrelende
kippen beter in staat is om vezels af te breken dan van industriële kippen. Dit roept uiteraard
vragen op over de mogelijkheden van het transplanteren van cecale microbiota. Om het cecale
microbioom van kippen te bestuderen werden, tot de dag van vandaag, kippen geëuthanaseerd
om een staal uit het cecum te bekomen. In Hoofdstuk 5a werd de microbiële populatie in cecale
drops, cecale inhoud en fecale drops geïdentificeerd en gekwantificeerd. Hieruit bleek dat de
bacteriële samenstelling in cecale drops zeer gelijkaardig is aan de bacteriële samenstelling in de

SAMENVATTING
- 195 -
ceca (aangaande diversiteit, rijkdom en species samenstelling), in tegenstelling tot de bacteriële
samenstelling in fecale drops. Dit zorgt ervoor dat een staal van de cecale drop als een
betrouwbare vertegenwoordiger kan beschouwd worden van de cecale microbiota. Enkele
genera werden aangetoond als specifieke indicatoren voor het scharreldieet maar het is
onmogelijk om hun effect op de gezondheid en verteerbaarheid te bepalen op basis van onze
data (Hoofdstuk 5b).
In elk scharreldieet werden insecten gevonden en aangezien insecten afvalstromen kunnen
omzetten naar eiwitten, vet en micronutriënten worden zij als zeer interessante alternatieve
ingrediënten beschouwd. Vooraleer insecten in voeders gebruikt kunnen worden, zullen er
echter studies nodig zijn naar hun voedingswaarde en verteerbaarheid. Chitine is een stikstof
bevattend polysaccharide in het exoskelet van insecten. Aan de ene kant interfereert stikstof in
chitine met de bepaling van ruw eiwit aangezien ruw eiwit geanalyseerd wordt op basis van totale
stikstof met de Kjeldahl methode. Aan de andere kant vertekent ruwe celstof in het staal het
chitine resultaat. In Hoofdstuk 7 werd een methode bepaald, op basis van de bepaling van
stikstof in de chitine fractie, om deze resultaten te ontwarren en daardoor ruw eiwit accurater
te kunnen bepalen.
Alternatieve ingrediënten incorporeren, die niet in competitie treden met de voeding van de
mens, zal veranderingen vergen doorheen het hele productieproces van de kip. Zo is de
groeisnelheid van kippenrassen bijvoorbeeld, lineair gecorreleerd met hun flexibiliteit om te
presteren op vezelrijke en eiwit- en energiearme voeders. Dit betekent dat snel groeiende rassen
minder in gewicht toenemen wanneer ze een scharreldieet gevoederd worden. Dit in
tegenstelling tot traag groeiende rassen die erin slagen hun gewicht op peil te houden door hun
voederopname te verhogen. Er werden geen verschillen in verteringscapaciteit gevonden tussen
de verschillende rassen (Hoofdstuk 7). Een selectie van kippenrassen die sterk presteren op
duurzame voeders kan de finale inkomsten verhogen.
Om meer ingrediënten, niet consumeerbaar voor de mens, te gebruiken in voeders, zal er meer
moeten veranderen dan enkel het voeder. Dit doctoraatswerk benadrukt het belang van
strategieën om hogere vezelgehaltes in het kippenvoeder te incorporeren, van onderzoek naar

SAMENVATTING
- 196 -
manieren om duurzaam gekweekte insecten toe te voegen in kippenvoeder en van kippenrassen
te selecteren die sterk produceren op minder geconcentreerde voeders. Vandaag de dag zullen
kippen op minder geconcentreerde diëten niet méér inkomsten genereren dan in de industrie
waar geconcentreerde voeders gebruikt worden. Maar, aangezien de voederprijzen stijgen
doorheen de jaren, wordt er een kantelpunt verwacht waarop een lagere productie
gerechtvaardigd zal worden door de lagere kosten van de alternatieve ingrediënten. In ieder
geval zal de vraag naar dierlijke eiwitten blijven stijgen daar de wereldbevolking blijft toenemen.
De vraagt blijft hoe dit te realiseren binnen de beperkte mogelijkheden van onze planeet.


Curriculum vitae


CURRICULUM VITAE
- 201 -
Curriculum vitae
Jana Pauwels werd geboren op 21 augustus 1986 in Eeklo. In 2004 behaalde zij haar diploma
secundair onderwijs in de richting Latijn-Wiskunde(8) aan Nieuwen Bosch te Gent. Nadien startte
zij haar universitaire studies en behaalde in 2011 haar diploma diergeneeskunde aan de
universiteit van Gent met onderscheiding.
In 2013 kreeg zij een VLIR-UOS beurs toegewezen en startte zij als doctoraatsstudent aan de
vakgroep Voeding, Genetica en Ethologie. Gedurende 3.5 jaar onderzocht zij het gebruik van
duurzame ingredienten in kippenvoeder. Haar onderzoek verliep in samenwerking met de
Universiteit van Limpopo in Zuid-Afrika. Zij begeleidde meerdere studenten, zowel in België als
in Zuid-Afrika.
Jana Pauwels is auteur en medeauteur van meerdere publicaties in internationale
wetenschappelijke tijdschriften en was meermaals spreker op internationale congressen.
Curriculum vitae
Jana Pauwels was born on August 21, 1986 in Eeklo. In 2004, she obtained her diploma of
secondary education in Latin-Mathematics(8) at Nieuwen Bosch in Ghent. In 2005, she started
her studies in Veterinary Medicine at Ghent University and graduated in 2011 with distinction.
In 2013 she obtained a VLIR-UOS scholarship and started as PhD student at the department of
Nutrition, Genetics and Ethology. For 3.5 years, she investigated the use of sustainable
ingredients in chicken feed in cooperation with the University of Limpopo, South-Africa. She
supervised several students, both in Belgium and in South-Africa.
Jana Pauwels has authored and co-authored several publications in international scientific
journals and was repeatedly speaker at international conferences.


Bibliography

BIBLIOGRAPHY
- 204 -
Bibliography
Articles in international journals
Pauwels J., Coopman F., Cools A., Michiels J., Fremaut D., De Smet S. and Janssens G.P.J. (2015).
Selection for growth performance in broiler chickens associates with less diet flexibility. PLoS ONE
10(6): e0127819.
Pauwels J., Taminau B., Janssens G.P.J., De Beenhouwer M., Delhalle L., Daube G. And Coopman
F. (2015). Cecal drop reflects the chickens’ cecal microbiome, fecal drop does not. Journal of
Microbiological Methods 117, 164-170.
Pauwels J., Coopman F., Ng’ambi J.W. and Janssens G.P.J. If chickens could pick: free-range versus
commercial diet. Submitted at International Journal for Sustainable Agriculture.
Pauwels J., Cools A., De Rycke H., Bukenberghs S. and Janssens G.P.J. Chitin induces an
overestimation of true protein. Submitted at Food chemistry.
Abstracts in conference proceedings
G.P.J. Janssens, M. De Graeve, M. Tagliabue, F. Geda, J. Pauwels, T. Van Hecke, A. Akbarian, J.
Michiels, 2012. Association between intestinal allometry, nutrient utilisation and growth in
broiler chickens. Proc. 16th ESVCN Congress, Bydgoscz, Poland, Sep. 13-15, 2012, p. 111.
A. Cools, A. De Cuyper, J. Pauwels and G.P.J. Janssens. Animal fiber: a key nutrient to carnivores,
but how to determine this dietary fraction analytically? Proc. 10th symposia of CNS, North
Carolina, U.S.A., Aug. 1-5, 2014.
J. Pauwels, F. Coopman and G.P.J. Janssens, 2014. The gap between the natural and commercial
diet of chickens. Proc. 18th ESVCN Congress, Utrecht, The Netherlands, Sep. 11-13, 2014, p. 21.
J. Pauwels, F. Coopman, A. Cools, J. Michiels, D. Fremout, S. De Smet and G.P.J. Janssens, 2014.
Selection for growth performance in broiler chickens associates with less diet flexibility. Proc.
18th ESVCN Congress, Utrecht, The Netherlands, Sep. 11-13, 2014, p. 20.

- 205 -
J. Pauwels, B. Taminiau, G.P.J. Janssens, M. De Beenhouwer, L. Delhalle, G. Daube, F. Coopman,
2014. The chickens’ cecal drop, a reflection of the cecal microbiome. 40th ANR Forum,
Merelbeke, Belgium, May 22, 2015, p. 21-22.
J. Pauwels, B. Taminiau, G.P.J. Janssens, M. De Beenhouwer, L. Delhalle, G. Daube, F. Coopman.
Cecal drop reflects the chickens’ cecal microbiome, fecal drop does not. Proc. 19th ESVCN
Congress, Toulouse, France, Sep. 17-19, 2015, p.34.


Dankwoord

DANKWOORD
- 208 -
Dankwoord
Geert, bedankt voor alles! Dan bedoel ik ook echt alles... Niet enkel om steeds meer oplossingen
dan problemen te zien of om die discussie nóg maar eens na te lezen (op zondagmiddag dan nog
wel). Maar ook en misschien wel vooral om gewoon jezelf te zijn en mij de vrijheid te geven
hetzelfde te doen. Ik heb veel meer aan jou te danken dan enkel het behalen van een PhD titel!
Frank, bedankt voor je enthousiasme voor het onderwerp. Al was het dan niet je “field of
expertise” vanaf het begin, ik kon altijd bellen voor een filosofisch of wetenschappelijk duwtje in
de rug. En, achteraf bekeken, ook bedankt voor die ongezouten meningen, ze hebben mij veel
tijd bespaard.
Prof Ng’ambi, I know you’re always busy and many students ask for your time and opinion. Still
you always helped me to organize and perform my trials and you even took the time to travel all
the way to Belgium to attend the defense of my dissertation. Tawonga chomene!
Mijn oprechte dank aan de voorzitter en de leden van mijn lees- en examencommissie: Prof.
Hermans, Prof. Ng’ambi, Prof. Ducatelle, Prof. Eeckhout, Dr. Kalmar en Dr. Cools. Voor het
nalezen en om met enthousiaste, doch kritische vragen en opmerkingen bij te dragen aan dit
werk.
I would like to sincerely acknowledge VLIR-UOS for sponsoring this research.
And then... many colleagues. Some of them only one floor down and others on the other side of
the world. Vele collega’s die vrienden werden en enkele vrienden die (zonder dat ze het goed en
wel beseften) voor de kar eindigden. Allemaal bedankt! Special thanks to:
An, bedankt voor de statistische magie en alles er rond! Andrea, thank you for making us dream of Costa Rica with stories and most of all with your smile. Annelies, bedankt voor de theetjes (inclusief...) en bedankt voor je eeuwig optimisme. Alireza, thank you for always making time to talk. The chickens are all yours now. Arturo, gracias por compartir su interés en la escalada, el senderismo, el ciclismo y el sueño. Dima, re leboga hlokomelo ya gago, o motswadi wa nnete. Donna, voor alles een oplossing met een eeuwige glimlach. Bedankt om zoveel vrolijkheid te brengen. Gary and Annie, for what was, what is and what is yet to come, thanks a million. Gavin and Rika, baie dankie dat julle julle huis, julle arms en julle harte oop gemaak het met elke ontmoeting van die eerste oomblik af. Helke, bedankt! Voor alles en veel meer! Zonder jou was dit één grote soep geworden... Herman, bedankt voor al de minutieus uitgevoerde analyses. Isabelle, bedankt om tijdens de verdediging geen lange en moeilijke vragen te stellen, toch? Jia, we all miss you very much!

DANKWOORD
- 209 -
Jimma crew, bedankt om de avonturen te verenigen, voor een mens alleen teveel om uit te voeren. Joris, voor de organisatie van de mountainbike tocht en voor alles ervoor en erna, bedankt. Kristel, jij in je laatste, wij in ons eerste jaar. Bedankt om ons wegwijs te maken, met bakken geduld. Louis en Char, om mij bezig te houden als Matt er niet was, of omgekeerd en vooral om ons alle twee bezig te houden als we er allemaal wel waren, bedankt! Luk, bedankt voor de gezellige koffie/ thee babbels over koetjes en kalfjes. Maarten, bedankt voor uw artistieke inbreng. Marielle, altijd zo leuk om met je te praten! Jammer dat er altijd wel eentje van ons “op reis” was. Mario, bedankt voor alle verhalen! Ik heb er u met plezier menig badminton match voor laten winnen. Marta, om voor alles een oplossing te hebben en die altijd genereus met ons te delen, obrigada. Ruben, bedankt om al mijn computer-, badminton- en administratieve vragen te beantwoorden met een lach. Al was het dan de vijfde vraag binnen hetzelfde uur... Sam, thanks a lot for all the chit-chat about Africa and beyond. It always cheered up my day. Sandra, succes aan de overkant, we missen u in de Heidestraat. Sarah, bedankt om de dingen gewoon te zeggen zoals ze zijn. Van onschatbare waarde! Silke, uren bij de kippen in Zuid-Afrika en uren in het labo in Merelbeke, bedankt voor je harde werk. Sofie, om ons de boterhammen met choco in soep combinatie te leren kennen, bedankt? Stijn, bedankt voor al de kaartspelletjes. Tante Annik, om mij op één week meer te leren dan in een jaar unief, dzięki. Tessa, bedankt om vanaf dag 1 zo sympathiek te zijn! Thomas, beroofd in Ethiopië of in bed naast Ali, niets krijgt jouw humeur kapot. Vanessa, thanks a lot for being my personal native speaker! Veerle, bedankt voor uw grappige bijdragen. Geen onderwerp te schunnig of je hebt een antwoord klaar. Veronique, bedankt om de travel bug te delen. Al hebben we daar uiteraard nergens zelf voor gekozen... Wendy, sorry van die 1 april grap. Maar eigenlijk was hij toch wel goed, nee? Familie langs Pauwels, Coopman of andere Beenhouwers kanten, oud of ongeboren, met veel
of weinig bijdrage aan dit werk, bedankt! For some words can be short or easy to speak, but their
echoes are truly priceless.
En dan is er nog (B)eentje die zich niet in een hokje laat plaatsen... Mijn strengste editor, mijn
beste vriend en meest bescheiden fotomodel, bedankt! Al was je er dan niet bij op de presentatie
(en misschien gelukkig maar), bij de verwezenlijking van dit werk heb je meer dan een stevige
steen bijgedragen. Zonder jou was dit (en zoveel meer) nooit gelukt. Skype gesprekken bij
onmogelijk internet, briefjes in Lariam doosjes of uren met de plooifiets door de regen, we vinden
altijd wel een manier. ’t Wordt nu tijd dat ik jou iets leer, daar in Zuid-Afrika...

It always seems impossible,
until it’s done.
Nelson Mandela