Computational Study of Transverse Slot Injection in ... - CORE
Upload
independentCategory
view
0download
0
1
Experimental and numerical analysis of a classical bleed slot system for a turbocharger compressor
Subenuka Sivagnanasundaram, Stephen Spence and Juliana Early School of Mechanical and Aero Space Engineering, Queen’s University of Belfast, UK Bahram Nikpour Cummins Turbo Technologies, Huddersfield, UK
ABSTRACT
This paper presents an insight into the performance and inducer flow field of a turbocharger centrifugal compressor incorporating a classical bleed slot system with various slot positions. The bleed slot is popular widely used map width enhancement method in the turbocharger industry. Even though the technique has been used for a long time, further study is still required to gain a better understanding of the flow structures inside the compressor stage due to the bleed slot. Therefore, this detailed study of the bleed slot system has been performed through a careful CFD analysis validated against experimental data. Three different positions of the bleed slot opening on the impeller shroud have been analysed and discussed in terms of their impact on the map width of the compressor. Discussion focuses on the slot flow variation throughout the speedline, the inducer inlet swirl near the surge flow condition and its impact on map width enhancement. The paper also demonstrates the capability of CFD analyses to predict the surge point.
NOMENTCLATURE
Absolute flow velocity (m/s) Meridional velocity (m/s)
Swirl velocity (m/s) Ratio of specific heats
Choke flow rate (kg/s) Surge flow rate (kg/s)
Total pressure (MPa) Static pressure (MPa) Total Temperature (K)
Static Temperature (K) Tip speed (m/s) Relative flow velocity (m/s)
Incidence angle (deg) Blade angle (deg) Flow angle (deg) Compressor efficiency Non-dimensional distance between the wall and the 1st node of the mesh
CFD Computational Fluid Dynamics CTT Cummins Turbo Technologies GGI General Grid Interface MW Map Width MCA Mass Circumferentially Averaged ND Non-Dimensional PR Total-to-Total Pressure Ratio SST Shear Stress Transport QUB Queen’s University Belfast
2
INTRODUCTION
The turbocharger compressor designer’s focus is on achieving a wider map with higher pressure ratio while simultaneously improving the efficiency characteristic to satisfy the development of modern internal combustion engines. However, the compressor map is limited by two flow phenomena at higher and lower flow rates, called choke and surge flow conditions respectively. The choke flow condition is the mass flow rate at which the flow velocity becomes sonic, whereas surge occurs due to the complete reversal of the flow at lower flow rate and higher pressure ratio. Surge is a system phenomenon and it is not acceptable to operate the compressor in this region. Therefore, it is challenging to design a compressor to satisfy the requirement of higher pressure ratio as well as increased map width.
Figure 1 Effect of swirl component on incidence at inducer inlet
A common cause of surge is the occurrence of stalled flow due to excessive incidence at the leading edge of the impeller blades, although it can also result from stall in the diffuser. At the target operating condition the inducer inlet is usually designed in such a way that flow enters the inducer with zero or close to zero incidence. However, at off-design conditions the flow approaches the blade leading edge at an incidence angle which can be positive or negative. The incidence angle depicted in Figure 1, which is associated with the extremes of low flow rate, is termed as a positive incidence angle. If the incidence is large enough the flow separates from the suction side of the blade after the leading edge, resulting in localized flow recirculation and reduced pressure ratio, leading the system to surge. As illustrated in Figure 1, introducing a positive swirl component to the inlet flow tends to reduce excessive positive incidence, . Consequently it reduces the possibility of flow separation on the suction side of the blade and moves the onset of surge to a lower mass flow rate. Imparting a positive swirl component in the inducer inlet, however, reduces the work input and therefore results in a lower pressure ratio for a given impeller speed. In an attempt to enhance the compressor map width and overcome the problems with surge, a number of approaches have been considered in the past. The bleed slot casing treatment is a popular method that has been widely investigated [1-4]. In the turbocharger industry, a very common design practise is to adopt a classical bleed slot system, which was first investigated by Fisher [1] in the late 1980s. The authors’ investigation showed that, with the inclusion of a classical bleed slot, there was a significant improvement in surge flow since the inducer flow was stabilized considerably. Recently, Xinqian et al [5] published an analysis of a non-symmetric bleed slot which reduced the surge flow by as much as 10% compared to a symmetric bleed slot. This investigation analysed the non-symmetric flow characteristics of the impeller due to the presence of the downstream scroll. In addition, the work published by Yamaguchi [6] revealed that an inclusion of cavity vanes improved the map width by 20% compared to
3
a bleed slot system with no cavity vanes where no penalty of the efficiency was found. This was performed by introducing counter swirl at the inducer inlet with an appropriate cavity vane vane design. Mohtar et al [7] analyzed the compressor performance with a classical bleed slot system. In this analysis, the slot opening to the impeller was completely replaced by a series of holes that injected the flow into/out of the impeller. No noticeable improvement in the map width was achieved due to this design. However, the author showed that the combination of the slot opening holes with the Super MWE techniques improved the map of the compressor significantly. The Super MWE technique was first investigated and published by Nikpour [2] and the addition of this to a classical bleed slot produced a significant impact on the map width in terms of improving the surge flow rate. The Super MWE technique allows better mixing of the recirculated slot flow with the main inlet flow at surge by introducing it further upstream from the inducer inlet. As a complete alternative to the classical bleed slot, reference [8] reports a state of the art high pressure ratio compressor for a helicopter engine using a series of fixed vanes at the inducer tip to facilitate inducer flow recirculation. As technology has improved, the ability to provide cheap and durable variable geometry inlet guide vanes and diffusers has also been investigated [9 and 10].
In the present study of compressor map width enhancement and performance, CFD
analysis has been performed for a full stage turbocharger compressor model. The investigation has been carried out for the baseline compressor model with different locations of the bleed slot systems. The detailed analysis of two different slot locations has been presented in this paper by comparison with the baseline slot. This shows the impact on the compressor map width and performance, and the influence of the variation of slot flow and incidence angle on the compressor performance. At or near surge, the incidence angle variation has been analysed by computing the variation of swirl and axial velocity components at the leading edge of the impeller blades due to the recirculating flow.
BASELINE COMPRESSOR
The centrifugal compressor stage used for this investigation as the baseline configuration was a commercially available turbocharger unit produced by Cummins Turbo Technologies (CTT). This compressor stage consisted of various components including an inlet duct, shroud bleed slot with an annular cavity, noise baffle, impeller, pinched vaneless diffuser and asymmetric scroll. The compressor is from a turbocharger used on a heavy duty diesel engine of approximately 400 HP (298 kW) output. The standard bleed slot, which has a width of 3 mm, was placed just after the inducer throat of the impeller at an angle of 45°. The position of the baseline slot was developed through a series of tests carried out at CTT (not published in open literature). The exact geometry details of the impeller have not been divulged for reasons of commercial confidentiality; however the impeller has an outer diameter of approximately 100 mm. The inducer of the impeller, where the map width enhancement slot is positioned, has a typical design and therefore it is expected that the findings of this research are relevant to most similar centrifugal impeller designs.
NUMERICAL METHOD
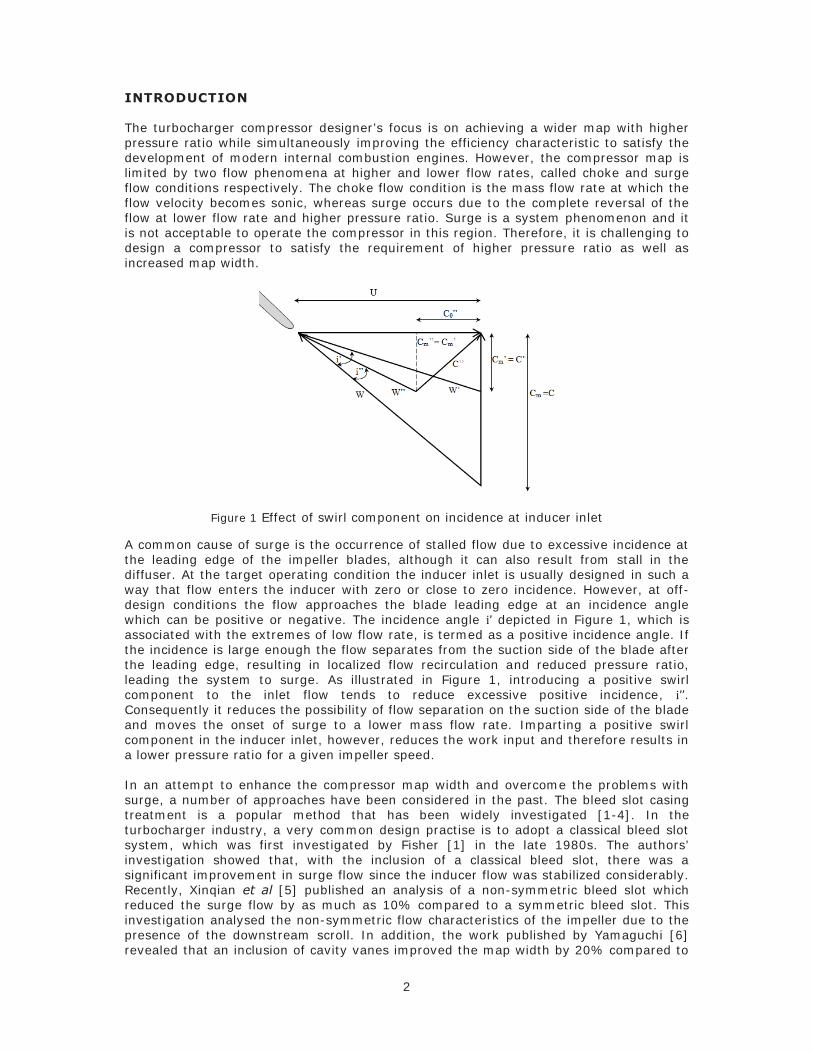
In this study the numerical analysis has been performed for a full stage of the compressor using ANSYS CFX and ICEM CFD software. A structured mesh has been generated for the inlet duct, bleed slot with an annular cavity, impeller and diffuser whereas the scroll has an unstructured mesh. For this analysis, the required mesh quality has been achieved through a grid independence study which revealed that the solutions were grid independent when the model consisted of around 10–12 million elements in total. Figure 2 represents the schematic of the full stage flow passage. The further details of the mesh generation including the quality of the mesh and the computational domain set-up have been described in reference [11].
4
Figure 2 Schematic of full stage compressor flow passage
For the CFD set-up the inlet boundary conditions have been defined as the total atmospheric pressure and temperature. Two different types of outlet boundary conditions have been used: the average static pressure from the choke point to the mid-map and the mass flow rate from the mid-map to the surge point. The convergence criteria have been set to a value of 1E-4 of RMS residuals. Since a steady state analysis has been carried out it is usually difficult to obtain a converged solution at stall due to the transient effects. Therefore, in this analysis, the blend factor or gradient relaxation has been applied, which helps to obtain a converged solution at the stall condition. Even though the simulation satisfied the set residual value, the results were only accepted when the efficiency and inlet mass flow also became constant and the mass flow imbalance at each component reached zero. In this investigation, the surge flow has been defined as the point when the static pressure begins to fall with decreasing mass flow (the gradient of the static pressure line becomes positive). However, in some cases the total pressure may be falling with decreasing mass flow even though the static pressure has not yet begun to fall.
EXPERIMENTAL SETUP
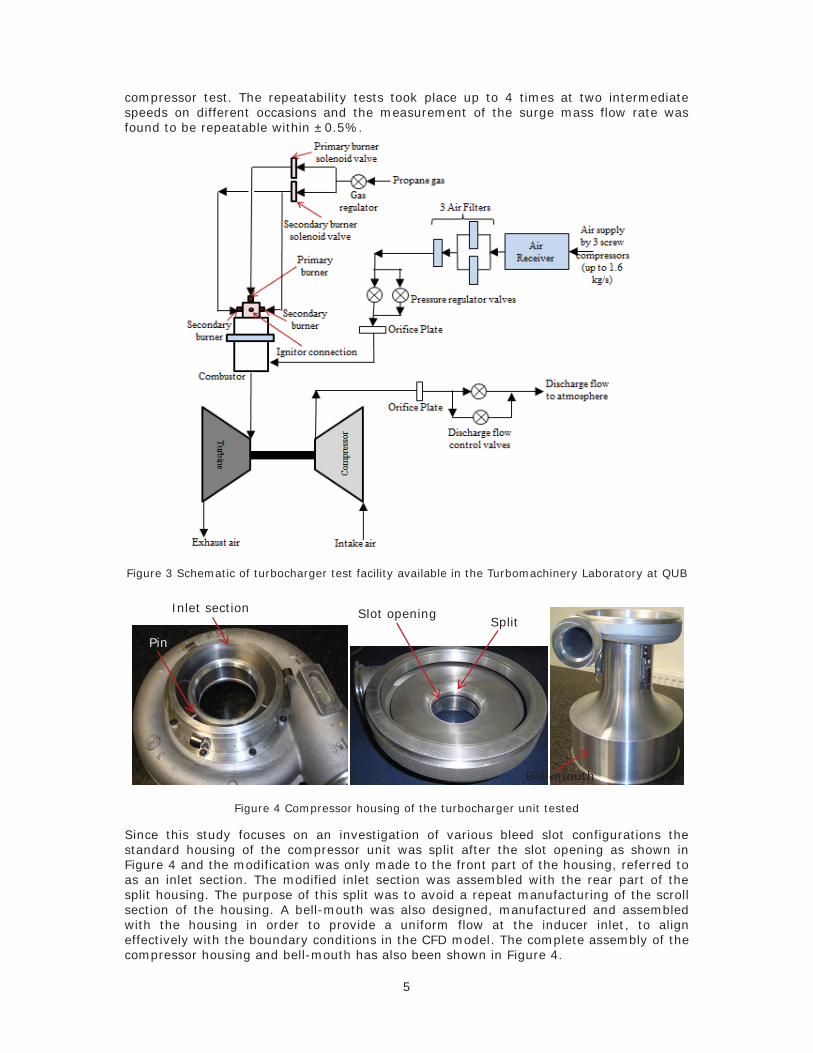
Figure 3 represents the schematic of the turbocharger test facility that was available in the Queen’s University of Belfast. On the turbine side of the turbocharger, the air and propane gas was supplied to the combustion chamber and then the combusted hot air was used to drive the turbine and so the compressor. On the compressor side, the ambient air was drawn in to the compressor and discharged to the atmosphere through the discharge line. On the air supply line before the combustion chamber and on the discharge line after the compressor, two orifice plates were placed to measure the turbine and compressor air flow rates. The mass flow rate has been calculated in accordance with ISO 5167. In order to obtain more confidence in the measurements, a number of pressure and temperature transducers were installed at the inlet and exit of the compressor and the average value of these readings was obtained. In this experimental analysis, the choke flow has been attained by fully opening the discharge valve and the surge flow has been determined through the operator’s observation of the audible cyclic flow reversals in the test system at the surge point. The flexibility of the test rig allowed refined control of the compressor flow rate near surge. The consistency of the surge point measurement was ensured through the repeatability of the baseline
Frozen rotor interface
Frozen rotor interface
Slot
Primary Inlet Duct Annular Cavity
GGI
Noise Baffle
Scroll
Impeller
Diffuser
Frozen rotor
GGI
5
compressor test. The repeatability tests took place up to 4 times at two intermediate speeds on different occasions and the measurement of the surge mass flow rate was found to be repeatable within ±0.5%.
Figure 3 Schematic of turbocharger test facility available in the Turbomachinery Laboratory at QUB
Figure 4 Compressor housing of the turbocharger unit tested
Since this study focuses on an investigation of various bleed slot configurations the standard housing of the compressor unit was split after the slot opening as shown in Figure 4 and the modification was only made to the front part of the housing, referred to as an inlet section. The modified inlet section was assembled with the rear part of the split housing. The purpose of this split was to avoid a repeat manufacturing of the scroll section of the housing. A bell-mouth was also designed, manufactured and assembled with the housing in order to provide a uniform flow at the inducer inlet, to align effectively with the boundary conditions in the CFD model. The complete assembly of the compressor housing and bell-mouth has also been shown in Figure 4.
Split Slot opening Inlet section
Pin
Bell-mouth

6
There was one difference between the compressor housing geometry used in this study and that for a typical turbocharger application. A turbocharger compressor housing normally includes a series of supporting struts in the bleed slot cavity to physically support the portion of the shroud that is upstream of the bleed slot. However, since these struts could influence the flow and in some way act like vanes in the bleed slot cavity, this investigation sought to remove their influence. Because the front portion of the shroud still needed to be mechanically supported in the absence of the struts, a series of 6 small round pins were incorporated in the experimental hardware to support the shroud while causing minimum disturbance to the flow. The pins had a diameter of 3 mm which was small by comparison with the dimensions of the struts cast into the original commercial turbocharger housing. The pins were not included in the CFD model.
BASELINE BLEED SLOT SYSTEM
For this study, the baseline compressor was tested at four different speeds (48%, 68%, 87% and 100%) using the experimental setup described above. However, the CFD analysis was only performed for three higher speeds. The pressure ratio characteristics and the efficiency of the baseline compressor model from both the CFD analysis and the experiments are shown in Figure 5 and Figure 6. The mass flow rate and efficiency are non-dimensionalised by considering the highest stage mass flow and efficiency from the experimental data as 100%. As illustrated, the pressure ratio obtained from the CFD results is in good agreement with the experimental results at all three speeds. Importantly, it should be noticed that the surge point is predicted effectively.
Figure 5 Pressure ratio – mass flow characteristics of the baseline compressor with baseline slot
The compressor total-to-total isentropic efficiency, ( ), has been calculated using the following conventional equation:
where and are the total temperatures at the inlet and exit of the experimental compressor and PR is the pressure ratio (total-to-total). In general, the efficiency prediction using CFD analysis has good agreement with the test data at the choke side of the map, however, there is more discrepancy towards the surge condition at the lower speed. Yet, the prediction has a similar trend to the test results and shows a good representation of the efficiency characteristic.
0.00
1.00
2.00
3.00
4.00
5.00
6.00
0 20 40 60 80 100 120
Baseline Exp
Baseline CFD
ND Mass flow (%)
Pres
sure
rat
io (
t-t)
7
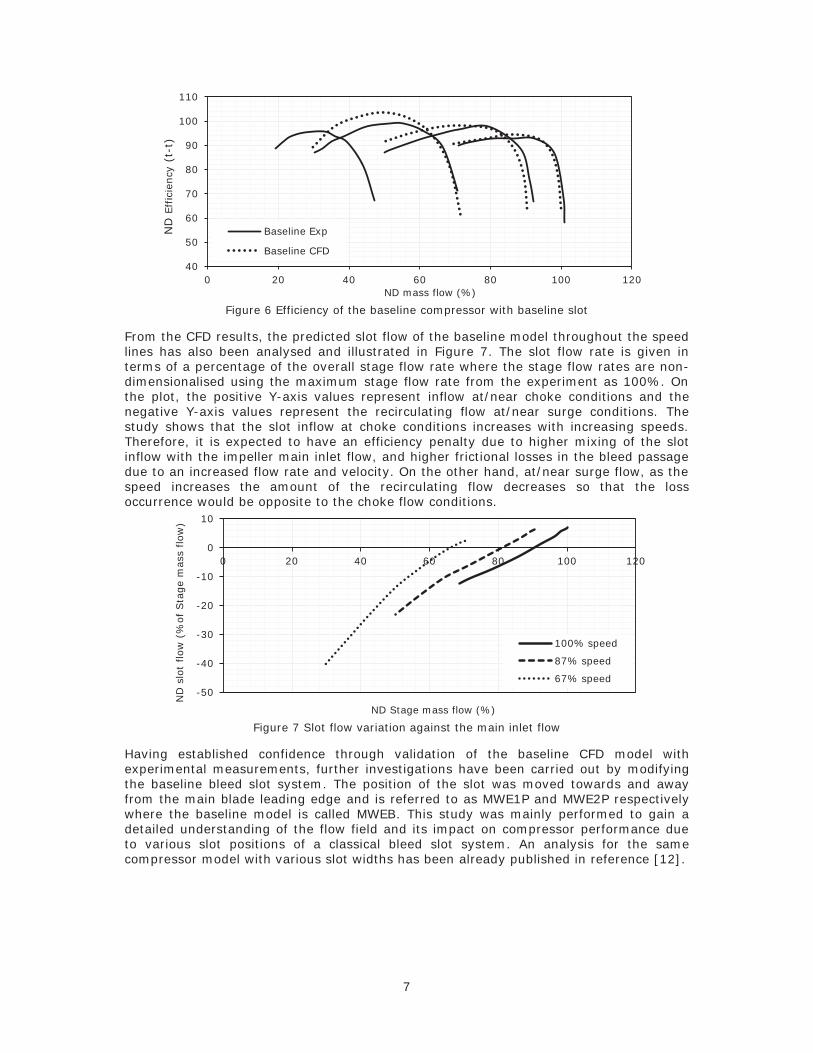
Figure 6 Efficiency of the baseline compressor with baseline slot
From the CFD results, the predicted slot flow of the baseline model throughout the speed lines has also been analysed and illustrated in Figure 7. The slot flow rate is given in terms of a percentage of the overall stage flow rate where the stage flow rates are non-dimensionalised using the maximum stage flow rate from the experiment as 100%. On the plot, the positive Y-axis values represent inflow at/near choke conditions and the negative Y-axis values represent the recirculating flow at/near surge conditions. The study shows that the slot inflow at choke conditions increases with increasing speeds. Therefore, it is expected to have an efficiency penalty due to higher mixing of the slot inflow with the impeller main inlet flow, and higher frictional losses in the bleed passage due to an increased flow rate and velocity. On the other hand, at/near surge flow, as the speed increases the amount of the recirculating flow decreases so that the loss occurrence would be opposite to the choke flow conditions.
Figure 7 Slot flow variation against the main inlet flow
Having established confidence through validation of the baseline CFD model with experimental measurements, further investigations have been carried out by modifying the baseline bleed slot system. The position of the slot was moved towards and away from the main blade leading edge and is referred to as MWE1P and MWE2P respectively where the baseline model is called MWEB. This study was mainly performed to gain a detailed understanding of the flow field and its impact on compressor performance due to various slot positions of a classical bleed slot system. An analysis for the same compressor model with various slot widths has been already published in reference [12].
40
50
60
70
80
90
100
110
0 20 40 60 80 100 120
Baseline Exp
Baseline CFD
ND mass flow (%)
ND
Eff
icie
ncy
(t-
t)
-50
-40
-30
-20
-10
0
10
0 20 40 60 80 100 120
100% speed
87% speed
67% speed
ND Stage mass flow (%)
ND
slo
t flow
(%
of Sta
ge
mas
s flow
)
8
VARIOUS POSITIONS OF THE BLEED SLOT
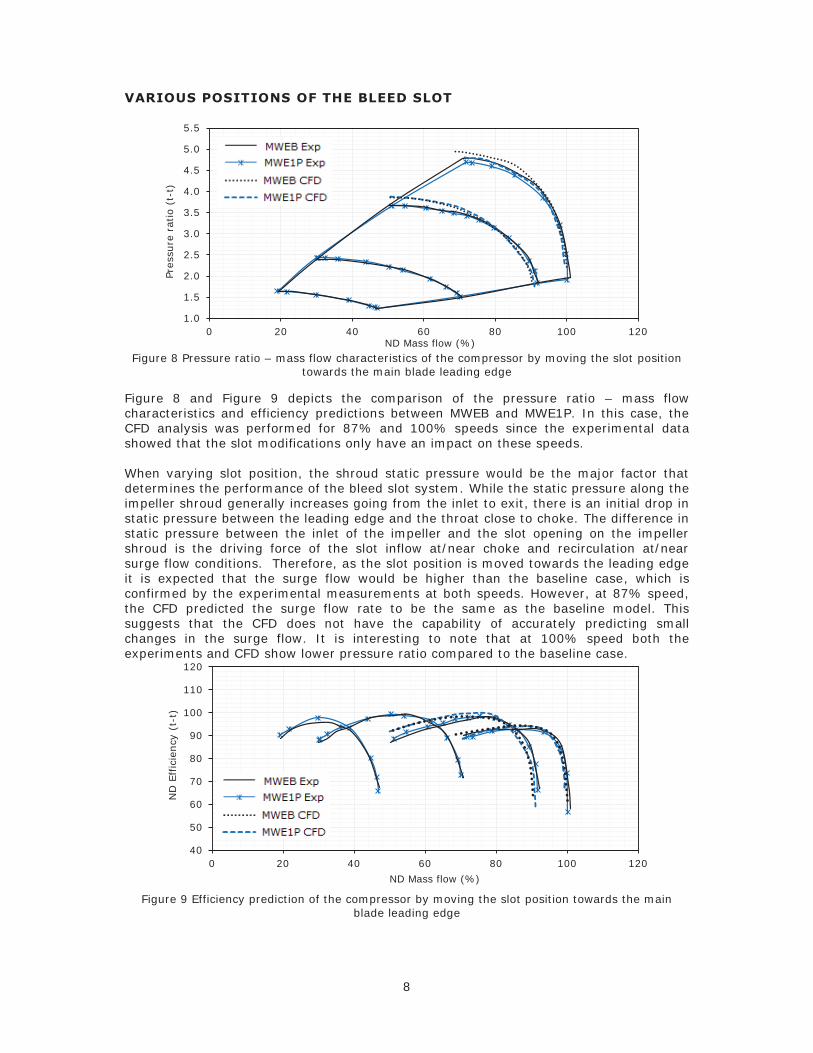
Figure 8 Pressure ratio – mass flow characteristics of the compressor by moving the slot position
towards the main blade leading edge
Figure 8 and Figure 9 depicts the comparison of the pressure ratio – mass flow characteristics and efficiency predictions between MWEB and MWE1P. In this case, the CFD analysis was performed for 87% and 100% speeds since the experimental data showed that the slot modifications only have an impact on these speeds. When varying slot position, the shroud static pressure would be the major factor that determines the performance of the bleed slot system. While the static pressure along the impeller shroud generally increases going from the inlet to exit, there is an initial drop in static pressure between the leading edge and the throat close to choke. The difference in static pressure between the inlet of the impeller and the slot opening on the impeller shroud is the driving force of the slot inflow at/near choke and recirculation at/near surge flow conditions. Therefore, as the slot position is moved towards the leading edge it is expected that the surge flow would be higher than the baseline case, which is confirmed by the experimental measurements at both speeds. However, at 87% speed, the CFD predicted the surge flow rate to be the same as the baseline model. This suggests that the CFD does not have the capability of accurately predicting small changes in the surge flow. It is interesting to note that at 100% speed both the experiments and CFD show lower pressure ratio compared to the baseline case.
Figure 9 Efficiency prediction of the compressor by moving the slot position towards the main
blade leading edge
1.0
1.5
2.0
2.5
3.0
3.5
4.0
4.5
5.0
5.5
0 20 40 60 80 100 120 ND Mass flow (%)
Pres
sure
rat
io (
t-t)
40
50
60
70
80
90
100
110
120
0 20 40 60 80 100 120
ND Mass flow (%)
ND
Eff
icie
ncy
(t-
t)
9
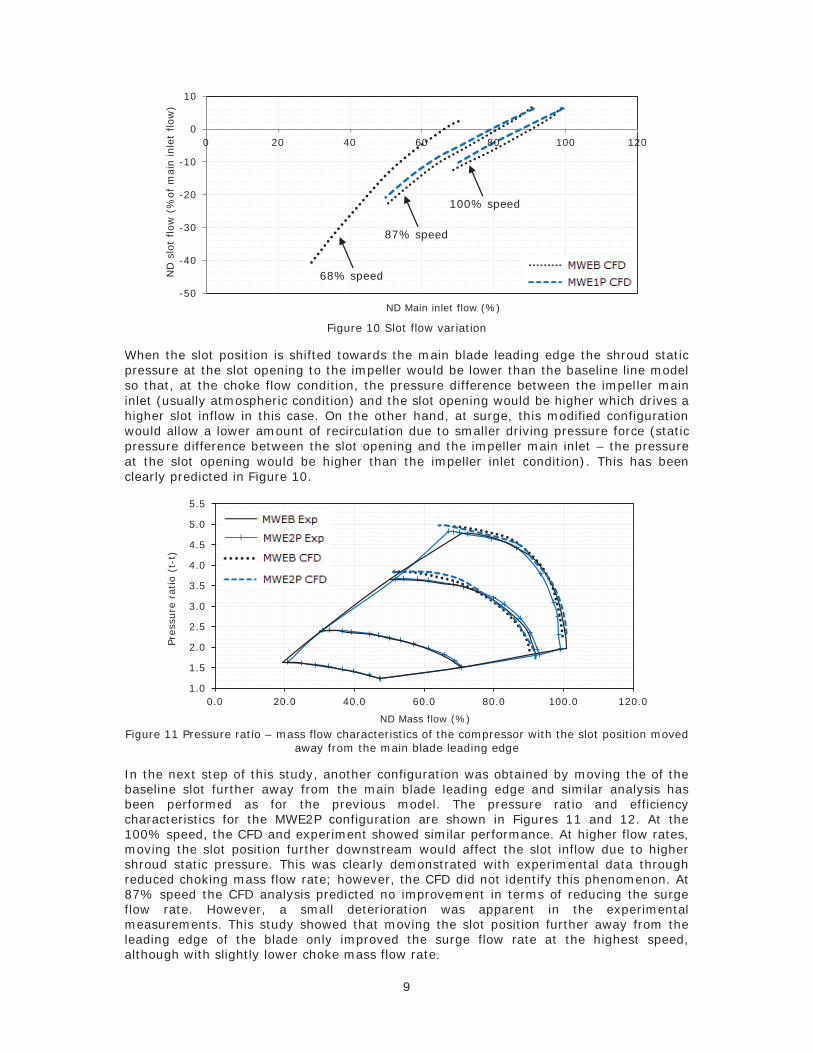
Figure 10 Slot flow variation
When the slot position is shifted towards the main blade leading edge the shroud static pressure at the slot opening to the impeller would be lower than the baseline line model so that, at the choke flow condition, the pressure difference between the impeller main inlet (usually atmospheric condition) and the slot opening would be higher which drives a higher slot inflow in this case. On the other hand, at surge, this modified configuration would allow a lower amount of recirculation due to smaller driving pressure force (static pressure difference between the slot opening and the impeller main inlet – the pressure at the slot opening would be higher than the impeller inlet condition). This has been clearly predicted in Figure 10.
Figure 11 Pressure ratio – mass flow characteristics of the compressor with the slot position moved
away from the main blade leading edge
In the next step of this study, another configuration was obtained by moving the of the baseline slot further away from the main blade leading edge and similar analysis has been performed as for the previous model. The pressure ratio and efficiency characteristics for the MWE2P configuration are shown in Figures 11 and 12. At the 100% speed, the CFD and experiment showed similar performance. At higher flow rates, moving the slot position further downstream would affect the slot inflow due to higher shroud static pressure. This was clearly demonstrated with experimental data through reduced choking mass flow rate; however, the CFD did not identify this phenomenon. At 87% speed the CFD analysis predicted no improvement in terms of reducing the surge flow rate. However, a small deterioration was apparent in the experimental measurements. This study showed that moving the slot position further away from the leading edge of the blade only improved the surge flow rate at the highest speed, although with slightly lower choke mass flow rate.
-50
-40
-30
-20
-10
0
10
0 20 40 60 80 100 120
ND Main inlet flow (%)
ND
slo
t flow
(%
of m
ain inle
t flow
)
1.0
1.5
2.0
2.5
3.0
3.5
4.0
4.5
5.0
5.5
0.0 20.0 40.0 60.0 80.0 100.0 120.0
ND Mass flow (%)
Pres
sure
rat
io (
t-t)
100% speed
87% speed
68% speed
10
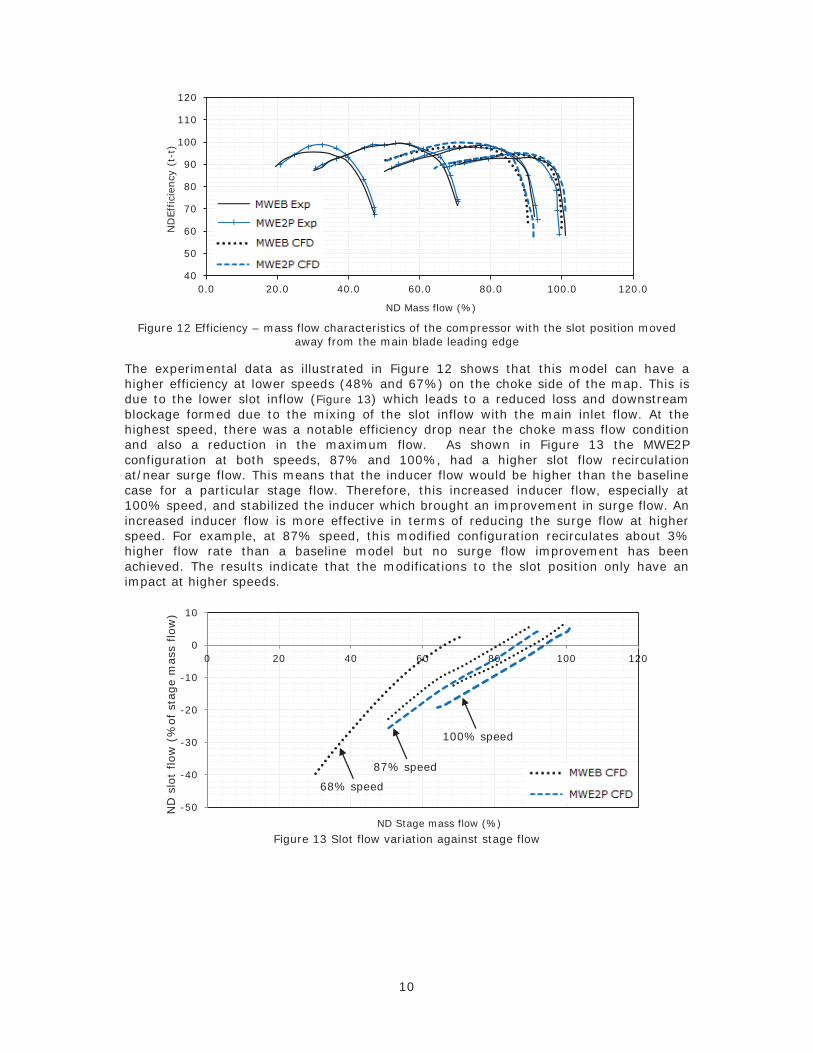
Figure 12 Efficiency – mass flow characteristics of the compressor with the slot position moved
away from the main blade leading edge
The experimental data as illustrated in Figure 12 shows that this model can have a higher efficiency at lower speeds (48% and 67%) on the choke side of the map. This is due to the lower slot inflow (Figure 13) which leads to a reduced loss and downstream blockage formed due to the mixing of the slot inflow with the main inlet flow. At the highest speed, there was a notable efficiency drop near the choke mass flow condition and also a reduction in the maximum flow. As shown in Figure 13 the MWE2P configuration at both speeds, 87% and 100%, had a higher slot flow recirculation at/near surge flow. This means that the inducer flow would be higher than the baseline case for a particular stage flow. Therefore, this increased inducer flow, especially at 100% speed, and stabilized the inducer which brought an improvement in surge flow. An increased inducer flow is more effective in terms of reducing the surge flow at higher speed. For example, at 87% speed, this modified configuration recirculates about 3% higher flow rate than a baseline model but no surge flow improvement has been achieved. The results indicate that the modifications to the slot position only have an impact at higher speeds.
Figure 13 Slot flow variation against stage flow
40
50
60
70
80
90
100
110
120
0.0 20.0 40.0 60.0 80.0 100.0 120.0
ND Mass flow (%)
ND
Eff
icie
ncy
(t-
t)
-50
-40
-30
-20
-10
0
10
0 20 40 60 80 100 120
ND Stage mass flow (%)
ND
slo
t flow
(%
of st
age
mass
flo
w)
100% speed
87% speed
68% speed
11
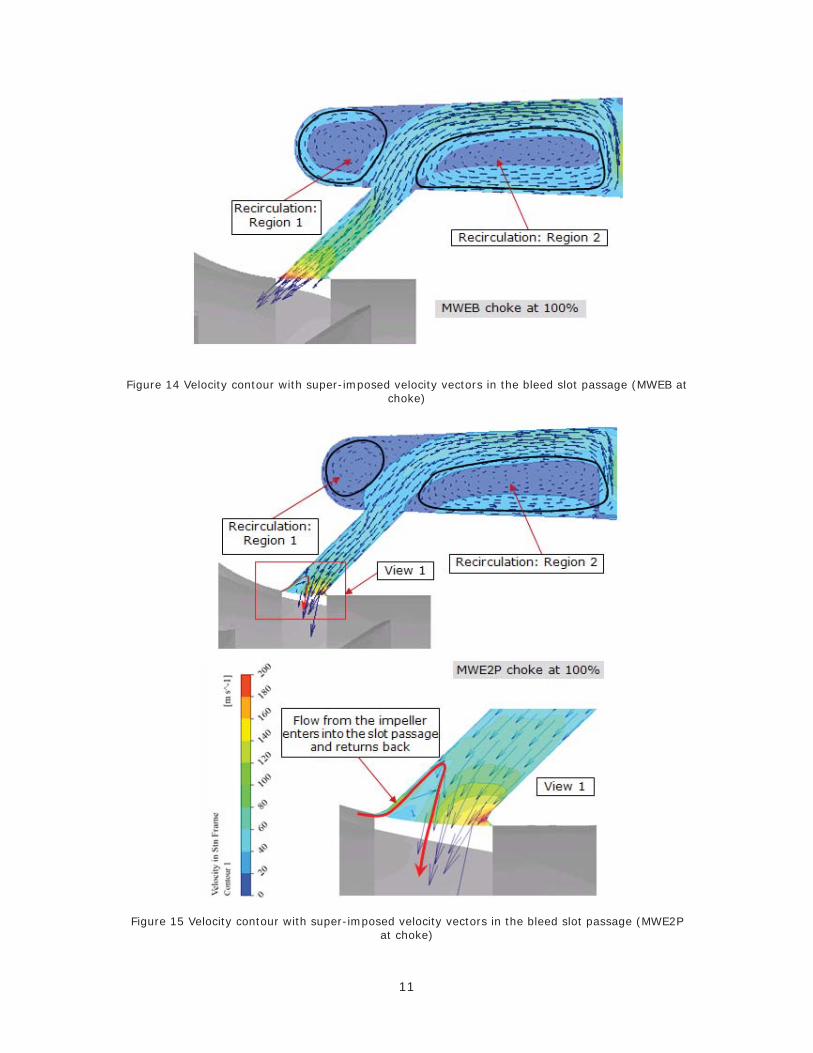
Figure 14 Velocity contour with super-imposed velocity vectors in the bleed slot passage (MWEB at
choke)
Figure 15 Velocity contour with super-imposed velocity vectors in the bleed slot passage (MWE2P at choke)
12
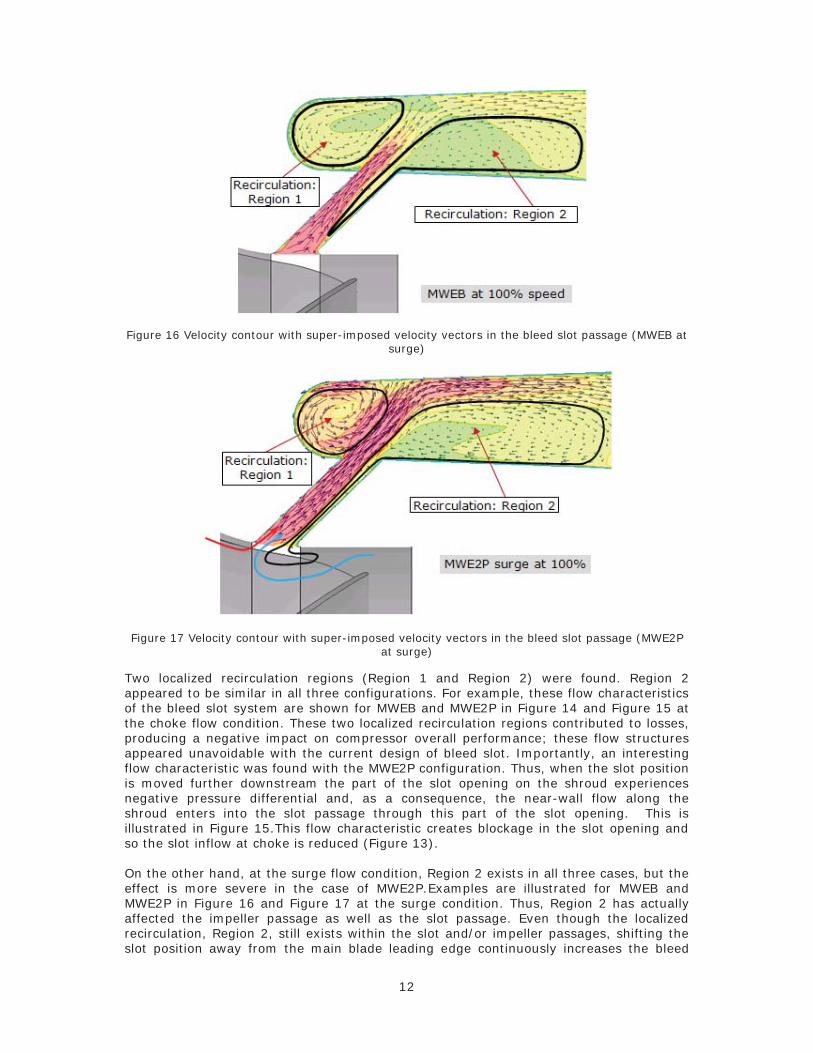
Figure 16 Velocity contour with super-imposed velocity vectors in the bleed slot passage (MWEB at surge)
Figure 17 Velocity contour with super-imposed velocity vectors in the bleed slot passage (MWE2P at surge)
Two localized recirculation regions (Region 1 and Region 2) were found. Region 2 appeared to be similar in all three configurations. For example, these flow characteristics of the bleed slot system are shown for MWEB and MWE2P in Figure 14 and Figure 15 at the choke flow condition. These two localized recirculation regions contributed to losses, producing a negative impact on compressor overall performance; these flow structures appeared unavoidable with the current design of bleed slot. Importantly, an interesting flow characteristic was found with the MWE2P configuration. Thus, when the slot position is moved further downstream the part of the slot opening on the shroud experiences negative pressure differential and, as a consequence, the near-wall flow along the shroud enters into the slot passage through this part of the slot opening. This is illustrated in Figure 15.This flow characteristic creates blockage in the slot opening and so the slot inflow at choke is reduced (Figure 13). On the other hand, at the surge flow condition, Region 2 exists in all three cases, but the effect is more severe in the case of MWE2P.Examples are illustrated for MWEB and MWE2P in Figure 16 and Figure 17 at the surge condition. Thus, Region 2 has actually affected the impeller passage as well as the slot passage. Even though the localized recirculation, Region 2, still exists within the slot and/or impeller passages, shifting the slot position away from the main blade leading edge continuously increases the bleed
13
flow out through the slot (Figure 13). For example, the MWE2P configuration recirculates 5 – 7% more flow through the slot than is achieved with the baseline configuration. The effective slot recirculation is achieved as a result of higher shroud static pressure at the slot opening as the slot position is moved further downstream from the leading edge. As already discussed, an increase in slot recirculation increases the inducer flow and so stabilizes the inducer at reduced stage flow rates. The flow field study of the bleed slot system with various slot location emphasizes the importance of an optimized position of the bleed slot in order to obtain the widest possible map.
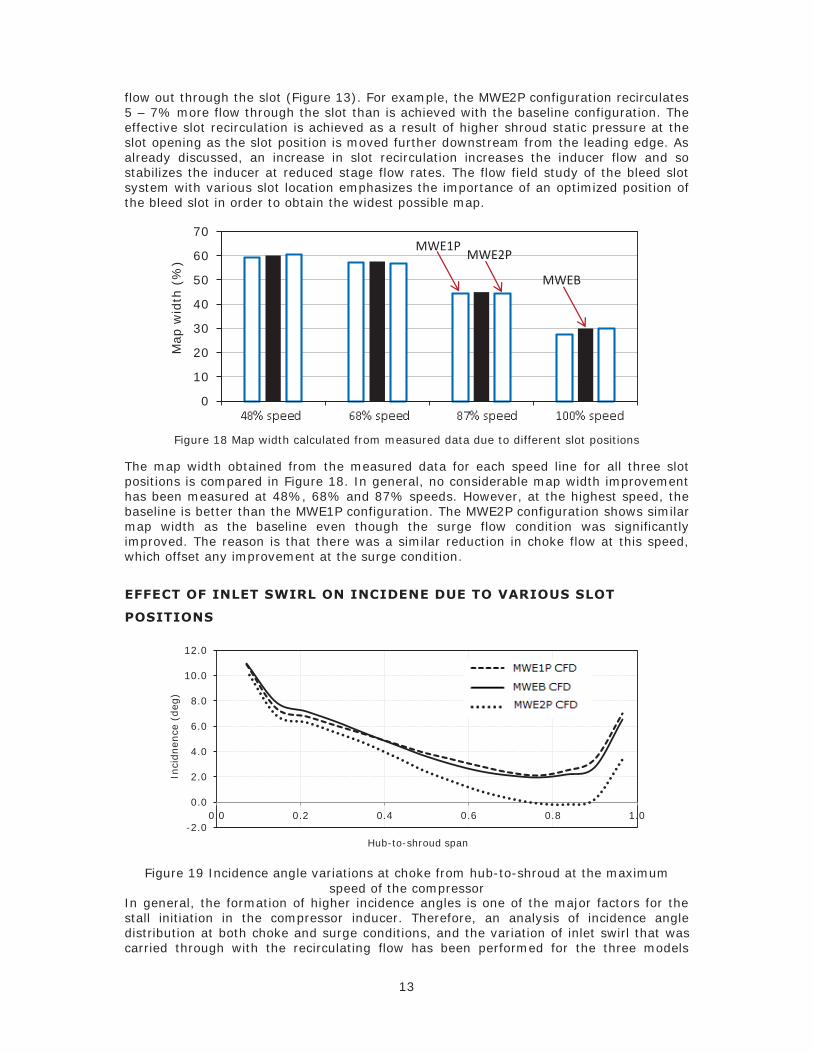
Figure 18 Map width calculated from measured data due to different slot positions
The map width obtained from the measured data for each speed line for all three slot positions is compared in Figure 18. In general, no considerable map width improvement has been measured at 48%, 68% and 87% speeds. However, at the highest speed, the baseline is better than the MWE1P configuration. The MWE2P configuration shows similar map width as the baseline even though the surge flow condition was significantly improved. The reason is that there was a similar reduction in choke flow at this speed, which offset any improvement at the surge condition.
EFFECT OF INLET SWIRL ON INCIDENE DUE TO VARIOUS SLOT
POSITIONS
Figure 19 Incidence angle variations at choke from hub-to-shroud at the maximum speed of the compressor
In general, the formation of higher incidence angles is one of the major factors for the stall initiation in the compressor inducer. Therefore, an analysis of incidence angle distribution at both choke and surge conditions, and the variation of inlet swirl that was carried through with the recirculating flow has been performed for the three models
-2.0
0.0
2.0
4.0
6.0
8.0
10.0
12.0
0.0 0.2 0.4 0.6 0.8 1.0
Hub-to-shroud span
Inci
dnen
ce (
deg
)
0
10
20
30
40
50
60
70
50000 70000 90000 103500
Map w
idth
(%
)
MWE1P MWE2P
MWEB
14
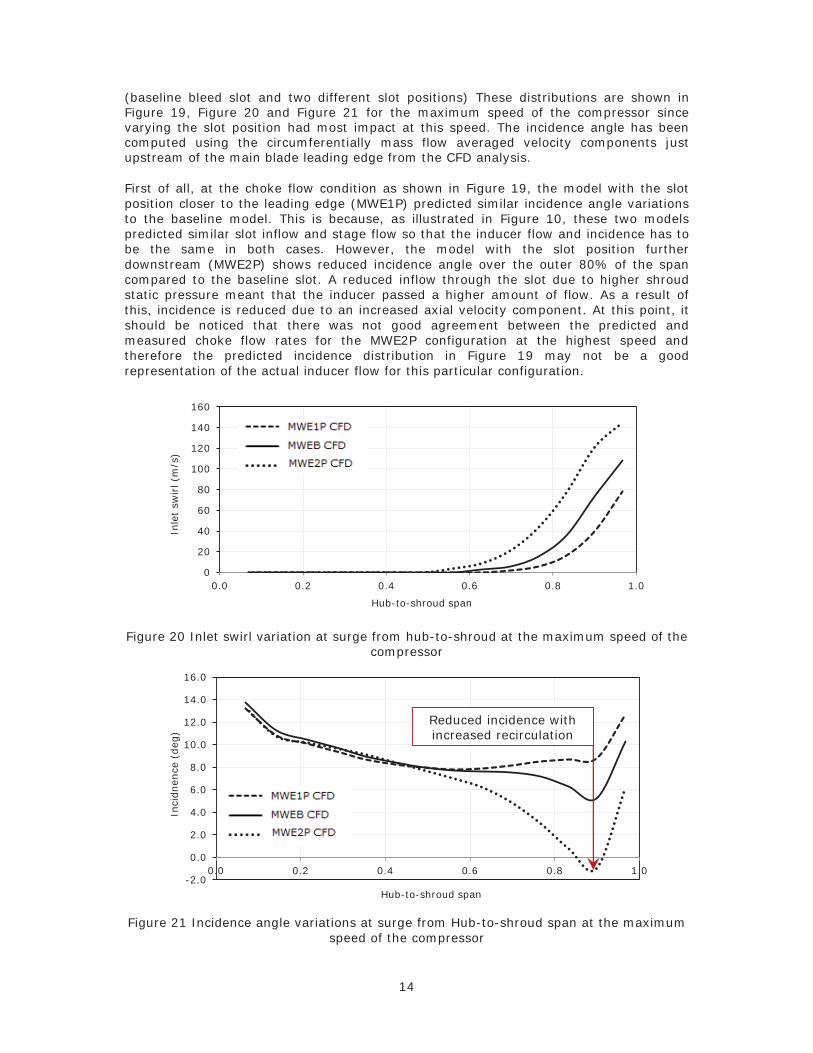
(baseline bleed slot and two different slot positions) These distributions are shown in Figure 19, Figure 20 and Figure 21 for the maximum speed of the compressor since varying the slot position had most impact at this speed. The incidence angle has been computed using the circumferentially mass flow averaged velocity components just upstream of the main blade leading edge from the CFD analysis. First of all, at the choke flow condition as shown in Figure 19, the model with the slot position closer to the leading edge (MWE1P) predicted similar incidence angle variations to the baseline model. This is because, as illustrated in Figure 10, these two models predicted similar slot inflow and stage flow so that the inducer flow and incidence has to be the same in both cases. However, the model with the slot position further downstream (MWE2P) shows reduced incidence angle over the outer 80% of the span compared to the baseline slot. A reduced inflow through the slot due to higher shroud static pressure meant that the inducer passed a higher amount of flow. As a result of this, incidence is reduced due to an increased axial velocity component. At this point, it should be noticed that there was not good agreement between the predicted and measured choke flow rates for the MWE2P configuration at the highest speed and therefore the predicted incidence distribution in Figure 19 may not be a good representation of the actual inducer flow for this particular configuration.
Figure 20 Inlet swirl variation at surge from hub-to-shroud at the maximum speed of the compressor
Figure 21 Incidence angle variations at surge from Hub-to-shroud span at the maximum speed of the compressor
0
20
40
60
80
100
120
140
160
0.0 0.2 0.4 0.6 0.8 1.0
Inle
t sw
irl (m
/s)
Hub-to-shroud span
-2.0
0.0
2.0
4.0
6.0
8.0
10.0
12.0
14.0
16.0
0.0 0.2 0.4 0.6 0.8 1.0
Hub-to-shroud span
Inci
dnen
ce (
deg
)
Reduced incidence with increased recirculation
15
As is evident in Figure 11, the MWE2P slot position clearly has a beneficial effect on extending the surge point to lower flow rates. The predicted distribution of inlet swirl that was introduced by the slot recirculation flow at surge is plotted in Figure 20. As the slot positions were moved further downstream of the leading edge an increased inlet swirl was produced. Two main reasons are responsible for this increased swirl:
1. An increased amount of recirculated flow 2. An increased amount of work input to the flow that is recirculated through the
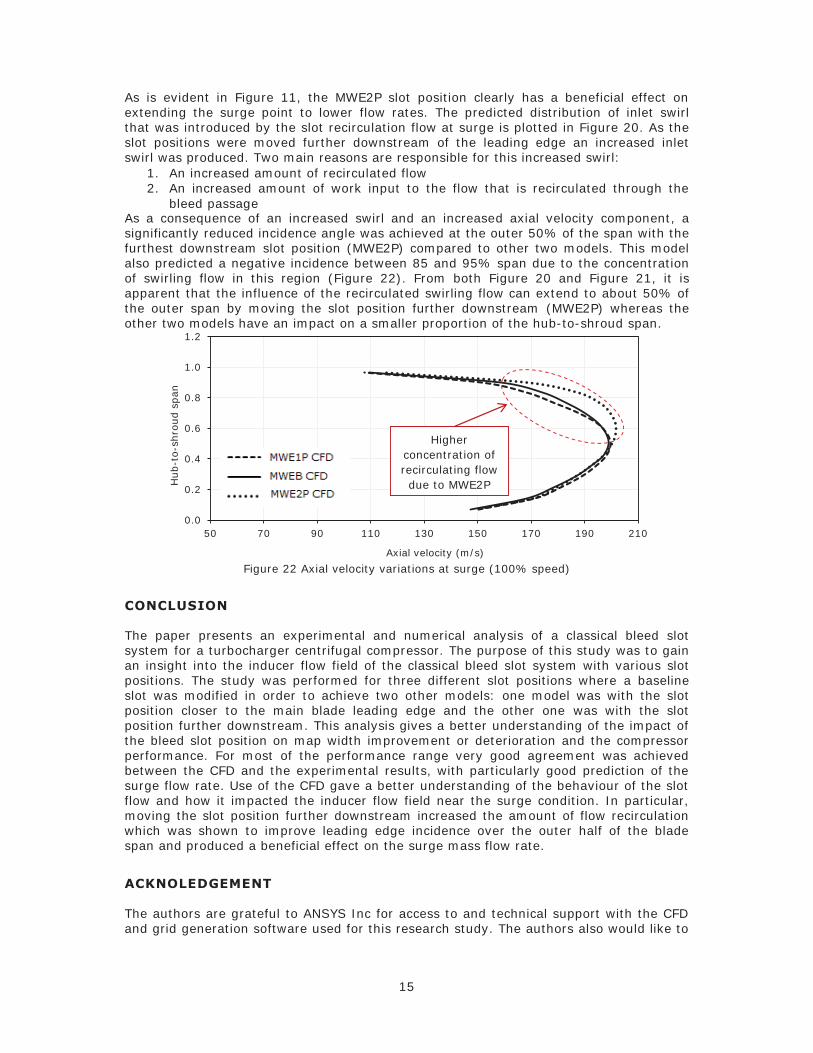
bleed passage As a consequence of an increased swirl and an increased axial velocity component, a significantly reduced incidence angle was achieved at the outer 50% of the span with the furthest downstream slot position (MWE2P) compared to other two models. This model also predicted a negative incidence between 85 and 95% span due to the concentration of swirling flow in this region (Figure 22). From both Figure 20 and Figure 21, it is apparent that the influence of the recirculated swirling flow can extend to about 50% of the outer span by moving the slot position further downstream (MWE2P) whereas the other two models have an impact on a smaller proportion of the hub-to-shroud span.
Figure 22 Axial velocity variations at surge (100% speed)
CONCLUSION
The paper presents an experimental and numerical analysis of a classical bleed slot system for a turbocharger centrifugal compressor. The purpose of this study was to gain an insight into the inducer flow field of the classical bleed slot system with various slot positions. The study was performed for three different slot positions where a baseline slot was modified in order to achieve two other models: one model was with the slot position closer to the main blade leading edge and the other one was with the slot position further downstream. This analysis gives a better understanding of the impact of the bleed slot position on map width improvement or deterioration and the compressor performance. For most of the performance range very good agreement was achieved between the CFD and the experimental results, with particularly good prediction of the surge flow rate. Use of the CFD gave a better understanding of the behaviour of the slot flow and how it impacted the inducer flow field near the surge condition. In particular, moving the slot position further downstream increased the amount of flow recirculation which was shown to improve leading edge incidence over the outer half of the blade span and produced a beneficial effect on the surge mass flow rate.
ACKNOLEDGEMENT
The authors are grateful to ANSYS Inc for access to and technical support with the CFD and grid generation software used for this research study. The authors also would like to
0.0
0.2
0.4
0.6
0.8
1.0
1.2
50 70 90 110 130 150 170 190 210
Axial velocity (m/s)
Hub-t
o-s
hro
ud s
pan
Higher concentration of recirculating flow due to MWE2P

16
express their gratitude to Cummins Turbo Technologies for supporting this project and providing extensive help.
REFERENCE
1. Fisher, F.B., (1988), “Application of Map Width Enhancement Devices to Turbocharger Compressor Stage”, Society of Automotive Engineers, Inc.
2. Nikpour, B., (2004) “Turbocharger compressor flow range improvement for future heavy duty diesel engines”, THIESEL 2004 Conference on Thermo- and Fluid Dynamic Processes in Diesel Engines.
3. Hunziker, R., Dickmann, H P., and Emmrich, R., (2001), “Numerical and experimental investigation of a centrifugal compressor with an inducer casing bleed system”, IMechE Pro Instn Mech Engrs, Vol 215 Part A.
4. Ishida, M., Sakaguchi, D., and Ueki, H., (2006) “Effect of pre-whirl on unstable flow suppression in a centrifugal impeller with ring groove arrangement”, ASME Turbo Expo 2006, GT2006-90400.
5. Xinqian, Z., Yangjun, Z., Mingyang, Y., Takahiro, B., and Hideaki, T., (2010), “Stability improvement of high-pressure-ratio turbocharger centrifugal compressor by asymmetric flow control – Part 2: Non-axisymmetric self recirculation casing treatment”, ASME Turbo Expo 2010, GT2010-22582.
6. Yamaguchi, S., Yamaguchi, H., Goto, S., and Nakamura, F., (2002), “The development of effective casing treatment for turbocharger compressor”, IMechE Turbocharger and Turbocharging.
7. Mohtar, H., Chesse, P. and Chalet, D., 2010, “Effect of a map width enhancement system on turbocharger centrifugal compressor performance and surge margin”, Proc. IMechE Vol. 225 Part D: J. Automobile Engineering
8. Barton, M. T., Mansour, M. L., Liu J. S., and Palmer D.L, (2006), "Numerical Optimization of a Vaned Shroud Design for Increased Operability Margin in Modern Centrifugal Compressors", Journal of Turbomachinery, ASME, Vol 128, pp. 627-631.
9. Kim, Y., Engeda, A., Aungier, R., and Amineni, N., (2002), "A compressor stage with wide flow range vaned diffusers and different inlet configurations", IMechE, Vol 216, Part A.
10. Engeda, A., (2001), "The unsteady performance of a centrifugal compressor with different diffusers", Proceedings of the Institution of Mechanical Engineers, Journal of Power and Energy, Part A, v 215, n 5, 2001, p 585-599.
11. Coppinger, M., and Swain, E., (2000), "Performance prediction of an industrial centrifugal compressor inlet guide vane system", IMechE Paper, Vol 214 Part A.
12. Sivagnanasundaram, S., Spence, S., Early, J., and Nikpour, B., (2011), “An impact of various shroud bleed slot configurations and cavity vanes on compressor map width and the inducer flow field”, ASME Turbo Expo 2011, GT2011-22154.
13. Japikse, D., 1996, “Centrifugal compressor design and performance”, Concepts NREC, ISBN 0-933283-03-2.
Copyright © 2022 FDOKUMEN