Geometric Features-Based Parking Slot Detection
16
sensors Article Geometric Features-Based Parking Slot Detection Qian Li, Chunyu Lin * ID and Yao Zhao Beijing Key Laboratory of Advanced Information Science and Network, Institute of Information Science, Beijing Jiaotong University, Beijing 100044, China; [email protected] (Q.L.); [email protected] (Y.Z.) * Correspondence: [email protected] Received: 27 July 2018; Accepted: 22 August 2018; Published: 27 August 2018 Abstract: In this paper, we propose a parking slot markings detection method based on the geometric features of parking slots. The proposed system mainly consists of two steps, namely, separating line detection and parking slot entrance detection. First, in the separating line detection stage, we propose a line-clustering method based on the line segment detection (LSD) algorithm. Our detecting and line-clustering algorithm can detect the separating lines that contain a pair of parallel lines with a fixed distance in a bird’s eye view (BEV) image under diverse lighting and ground conditions. Consequently, parking slot candidates are generated by pairing the separating lines according to the width of the parking slots. In the parking slot entrance detection process, we propose a multiview fusion-based learning approach that can increase the number of training samples by performing a perspective transformation on the acquired BEV images. The proposed method was evaluated using 353 BEV images covering diverse parking slot markings. Experiments show that the proposed method can recognize typical perpendicular and parallel rectangular parking slots, and a precision of 97.4% and recall of 96.6% are achieved. Keywords: around view; geometric features; parking slot detection 1. Introduction In recent times, interest in automotive technology and the popularity of automobiles have been increasing. In this context, parking in a narrow space is a difficult task for many beginners. As a result, intelligent transport systems have emerged. However, there are still many problems that need to be solved in this research field. An automatic parking system [1–3] consists of three parts: target position designation, path planning and path tracking. Target position designation is the most important component of intelligent transport. Various methods of identifying the target position designation have been proposed in the literature and they can be classified into four categories: free space-based [4–11], parking slot marking-based [12–25], interface-based [26–28] and infrastructure-based. Of these, the free space-based method is extensively researched but has a drawback; if there are no adjacent vehicles, the method cannot work. Compared with the other approaches, the parking slot marking-based method is able to recognize parking slots more accurately because its recognition process does not depend on the presence of adjacent vehicles, but on parking slot markings. Furthermore, it does not need assisted sensors, such as short-range radar and scanning laser radar. The previous approaches can roughly be generalized as follows. The method proposed in [12] can recognize various types of parking slot markings in a fully automatic manner. First, this method simultaneously finds parallel line pairs whose gradient orientations are opposite when detecting the separating lines. Next, the method utilizes the line detector and Harris corner detector to recognize the entrance positions. However, traditional vision-based features are sensitive to noise when the lines or corners are faint and distorted in the Around View Monitor (AVM) images. The methods in [13,14] are not robust. They cannot give the desired result Sensors 2018, 18, 2821; doi:10.3390/s18092821 www.mdpi.com/journal/sensors
-
Upload
khangminh22 -
Category
Documents
-
view
2 -
download
0
Transcript of Geometric Features-Based Parking Slot Detection
sensors
Article
Geometric Features-Based Parking Slot Detection
Qian Li, Chunyu Lin * ID and Yao Zhao
Beijing Key Laboratory of Advanced Information Science and Network, Institute of Information Science, BeijingJiaotong University, Beijing 100044, China; [email protected] (Q.L.); [email protected] (Y.Z.)* Correspondence: [email protected]
Received: 27 July 2018; Accepted: 22 August 2018; Published: 27 August 2018�����������������
Abstract: In this paper, we propose a parking slot markings detection method based on the geometricfeatures of parking slots. The proposed system mainly consists of two steps, namely, separating linedetection and parking slot entrance detection. First, in the separating line detection stage, we proposea line-clustering method based on the line segment detection (LSD) algorithm. Our detecting andline-clustering algorithm can detect the separating lines that contain a pair of parallel lines witha fixed distance in a bird’s eye view (BEV) image under diverse lighting and ground conditions.Consequently, parking slot candidates are generated by pairing the separating lines according to thewidth of the parking slots. In the parking slot entrance detection process, we propose a multiviewfusion-based learning approach that can increase the number of training samples by performinga perspective transformation on the acquired BEV images. The proposed method was evaluatedusing 353 BEV images covering diverse parking slot markings. Experiments show that the proposedmethod can recognize typical perpendicular and parallel rectangular parking slots, and a precision of97.4% and recall of 96.6% are achieved.
Keywords: around view; geometric features; parking slot detection
1. Introduction
In recent times, interest in automotive technology and the popularity of automobiles have beenincreasing. In this context, parking in a narrow space is a difficult task for many beginners. As a result,intelligent transport systems have emerged. However, there are still many problems that need to besolved in this research field. An automatic parking system [1–3] consists of three parts: target positiondesignation, path planning and path tracking. Target position designation is the most importantcomponent of intelligent transport. Various methods of identifying the target position designation havebeen proposed in the literature and they can be classified into four categories: free space-based [4–11],parking slot marking-based [12–25], interface-based [26–28] and infrastructure-based.
Of these, the free space-based method is extensively researched but has a drawback; if there areno adjacent vehicles, the method cannot work.
Compared with the other approaches, the parking slot marking-based method is able to recognizeparking slots more accurately because its recognition process does not depend on the presence ofadjacent vehicles, but on parking slot markings. Furthermore, it does not need assisted sensors, suchas short-range radar and scanning laser radar. The previous approaches can roughly be generalizedas follows. The method proposed in [12] can recognize various types of parking slot markings in afully automatic manner. First, this method simultaneously finds parallel line pairs whose gradientorientations are opposite when detecting the separating lines. Next, the method utilizes the line detectorand Harris corner detector to recognize the entrance positions. However, traditional vision-basedfeatures are sensitive to noise when the lines or corners are faint and distorted in the Around ViewMonitor (AVM) images. The methods in [13,14] are not robust. They cannot give the desired result
Sensors 2018, 18, 2821; doi:10.3390/s18092821 www.mdpi.com/journal/sensors
Sensors 2018, 18, 2821 2 of 16
under complex light intensity and ground conditions. The method in [15] also finds parallel lines witha fixed distance using line segment detection (LSD) based on edge image, but it has a drawbackthat the straight line will be divided into many small segments, leading to an increase in falsedetection. The method in [16] is a data-driven learning-based approach called PSDL, which detectsthe marking-points first and then infers the valid separating marking lines using six Gaussian linetemplates. If the marking-point is wrongly detected, the parking slot will not be found correctly, andthe detection accuracy will decrease.
By contrast, offline detection models always provide very accurate results. However,the learning-based approach is generally very time consuming because it trains multiple detectorsand the marking point can be in any direction. We will review the literature in more detail in thenext section.
Therefore, in order to address the aforementioned concerns, this paper proposes a geometricfeatures-based method that can achieve much better results even if the parking slot markings arepresented in various lights (dim, strong) and ground conditions (bricked, curved, blurred, marked)in a fully automatic manner. The proposed method first detects the separating lines by utilizing aline-clustering approach based on the previous LSD algorithm. Parking slot candidates are formedby pairing the separating lines according to geometric features of the parking slot. Finally, this paperdetects the entrance using a line-based and learning-based method. If the number of guide lines ishigher than 1 by using the line-based method, we use the learning-based method to redetect the guideline. The method was evaluated on a database containing various complex conditions, and it achievesa 96.6% recall and 97.4% precision.
The contributions of this paper are as follows:
(1) It suggests a line-clustering method, which, compared with previous line detection methodsincluding the distance transform and the Hough line detector, has more robust detection undervaried illumination conditions.
(2) As a large-scale dataset is still lacking, we propose a multiview fusion method to increase thetraining set.
(3) Previous learning-based methods need to train multiple marking-point detectors, whereas in thispaper, we only train one detector and identify the shape of a parking marking-point by using aconvex defect algorithm, which increases the number of the true positives and gives more robustdetection results.
The rest of this paper is organized as follows. Section 2 explains the related research. Section 3describes the proposed scheme. Section 4 presents experimental results. Finally, this paper is concludedwith a summary in Section 5.
2. Related Research
Given that this paper is concerned with a vision-based approach, the literature review in thissection focuses on slot-marking-based methods. All approaches using this method utilize cameras thatcan detect the parking slot markings painted on the ground. These methods are categorized into twostreams, the semiautomatic ones and automatic ones.
In 2000, Xu et al. [17] utilized the color of parking slot’s markings to identify the pixels of thesemarkings from images. In 2006, Jung et al. [18] recognized marking line-segments using directionalintensity-gradient on a line lying from seed-point to camera. This method is semi-automatic and requiresmanual selection of the parking slots. Our method is fully automatic and there is no need to manuallyselect the parking space. In 2011, Schmid et al. [19] proposed the use of a hierarchical three-dimensionaloccupancy grid for the detection of parking spaces. The presented approach derives the distance toobstacles and walls and is thus able to represent the free spaces that form parking spaces. In 2012,Suhr et al. [20] proposed a novel fully automatic method for recognizing various slot markings in imagesequences acquired by an Around View Monitor (AVM) system. In 2013, Suhr et al. [21] recognized various
Sensors 2018, 18, 2821 3 of 16
types of parking slot markings by modeling them as a hierarchical tree structure in a fully automaticmethod. In 2014, Wang et al. [14] proposed an automatic parking method through a bird’s eye viewvision system, which extracts the features of the parking spaces using a Radon transform-based method,after which double circular trajectory planning and a preview control strategy are utilized to realizeautonomous parking. Suhr et al. [22] proposed a vacant parking slot detection and tracking system thatfuses the sensors of an Around View Monitor (AVM) system and an ultrasonic sensor-based automaticparking system. In 2016, Lee et al. [23] proposed a robust parking slot detection algorithm based onthe line-segment-level clustering method. The proposed algorithm consists of line-segment detectionusing the proposed directional density-based spatial clustering algorithm (Directional-DBSCAN) and slotdetection using slot pattern recognition. The Directional-DBSCAN algorithm robustly extracts lines evenwhen they are short and faint. Lee et al. [24] presented a camera-based available parking-slot recognitionalgorithm based on slot-context analysis. This method can handle diverse available parking-slot conditions.The method proposed a new methodology of extracting and associating line-markings to recognize theparking slot, and via the histogram of gradient and frequency-magnitude features, the slot-occupancycould be classified. Suhr et al. [25] proposed a parallel line-based method that utilizes random sampleconsensus(RANSAC) and distance transform (DT)-based chamfer matching to detect parking slot markings.
The proposed method is a fully automatic approach. It can reliably recognize parking slot markingsunder diverse lighting and ground conditions. The proposed multiview fusion-based learning approachcan also increase the number of training samples and decrease the false detection results.
3. Proposed Scheme
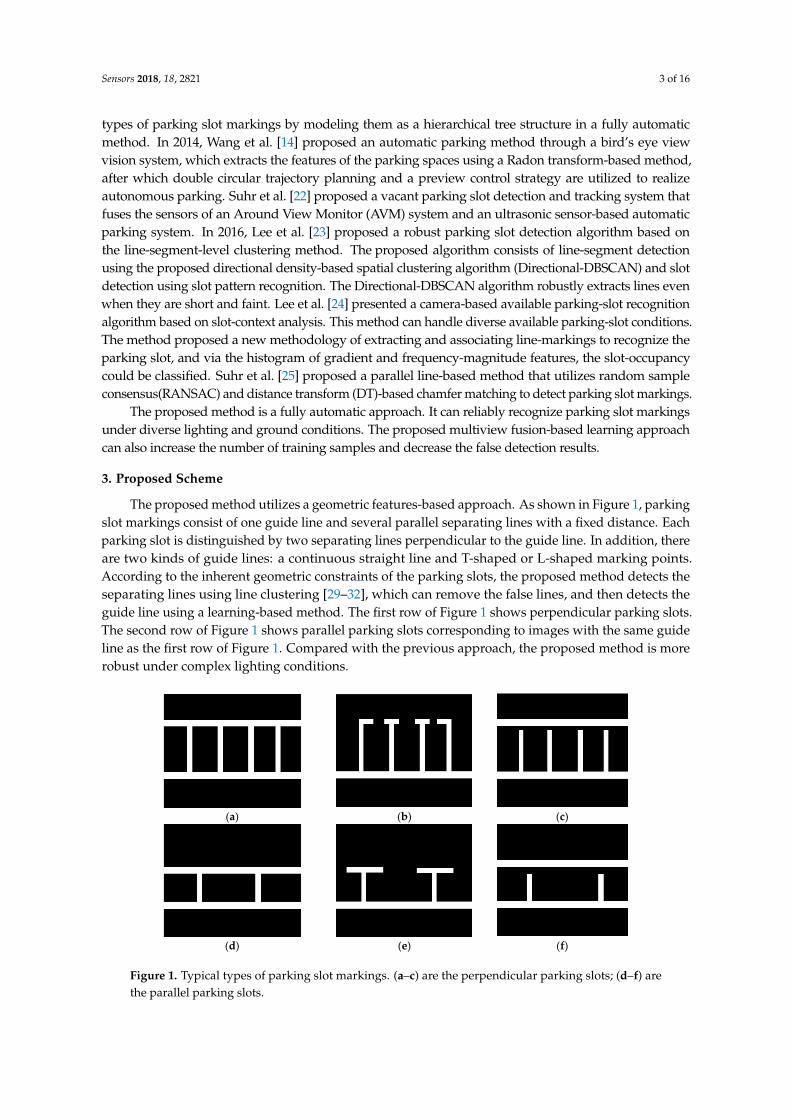
The proposed method utilizes a geometric features-based approach. As shown in Figure 1, parkingslot markings consist of one guide line and several parallel separating lines with a fixed distance. Eachparking slot is distinguished by two separating lines perpendicular to the guide line. In addition, thereare two kinds of guide lines: a continuous straight line and T-shaped or L-shaped marking points.According to the inherent geometric constraints of the parking slots, the proposed method detects theseparating lines using line clustering [29–32], which can remove the false lines, and then detects theguide line using a learning-based method. The first row of Figure 1 shows perpendicular parking slots.The second row of Figure 1 shows parallel parking slots corresponding to images with the same guideline as the first row of Figure 1. Compared with the previous approach, the proposed method is morerobust under complex lighting conditions.
Sensors 2018, 18, x FOR PEER REVIEW 3 of 15
preview control strategy are utilized to realize autonomous parking. Suhr et al. [22] proposed a vacant parking slot detection and tracking system that fuses the sensors of an Around View Monitor (AVM) system and an ultrasonic sensor-based automatic parking system. In 2016, Lee et al. [23] proposed a robust parking slot detection algorithm based on the line-segment-level clustering method. The proposed algorithm consists of line-segment detection using the proposed directional density-based spatial clustering algorithm (Directional-DBSCAN) and slot detection using slot pattern recognition. The Directional-DBSCAN algorithm robustly extracts lines even when they are short and faint. Lee et al. [24] presented a camera-based available parking-slot recognition algorithm based on slot-context analysis. This method can handle diverse available parking-slot conditions. The method proposed a new methodology of extracting and associating line-markings to recognize the parking slot, and via the histogram of gradient and frequency-magnitude features, the slot-occupancy could be classified. Suhr et al. [25] proposed a parallel line-based method that utilizes random sample consensus(RANSAC) and distance transform (DT)-based chamfer matching to detect parking slot markings.
The proposed method is a fully automatic approach. It can reliably recognize parking slot markings under diverse lighting and ground conditions. The proposed multiview fusion-based learning approach can also increase the number of training samples and decrease the false detection results.
3. Proposed Scheme
The proposed method utilizes a geometric features-based approach. As shown in Figure 1, parking slot markings consist of one guide line and several parallel separating lines with a fixed distance. Each parking slot is distinguished by two separating lines perpendicular to the guide line. In addition, there are two kinds of guide lines: a continuous straight line and T-shaped or L-shaped marking points. According to the inherent geometric constraints of the parking slots, the proposed method detects the separating lines using line clustering [29–32], which can remove the false lines, and then detects the guide line using a learning-based method. The first row of Figure 1 shows perpendicular parking slots. The second row of Figure 1 shows parallel parking slots corresponding to images with the same guide line as the first row of Figure 1. Compared with the previous approach, the proposed method is more robust under complex lighting conditions.
(a) (b) (c)
(d) (e) (f)
Figure 1. Typical types of parking slot markings.
Figure 2 illustrates an overall block diagram of the proposed scheme. For a given bird’s eye view (BEV) image, we perform preprocessing first. Under normal circumstances, when the driver is driving in the parking lot, parking slot markings will appear on the left and right sides of the driver.
Figure 1. Typical types of parking slot markings. (a–c) are the perpendicular parking slots; (d–f) arethe parallel parking slots.

Sensors 2018, 18, 2821 4 of 16
Figure 2 illustrates an overall block diagram of the proposed scheme. For a given bird’s eye view(BEV) image, we perform preprocessing first. Under normal circumstances, when the driver is drivingin the parking lot, parking slot markings will appear on the left and right sides of the driver. Therefore,we proposed a method for obtaining the region of interest (ROI) instead of detecting parking slotmarkings on the entire image, which can reduce our overall process time. Figure 3 illustrates themethod of defining the ROI. w1 indicates the width of the car in the AVM image, w2 indicates the widthof the AVM image, w3 and w4 are the widths of the left ROI and right ROI, respectively. The geometricconstraint is as follows: w3 = w4 = (w2 −w1)/2. The main steps of the proposed method are as follows:the first part is to detect parking separating lines, which have a pair of parallel lines with a fixeddistance in a surround view image. Next is to detect the parking slot entrance. The process utilizesa multiview fusion-based learning approach rather than the previously used Harris corner detectormethod in [12]. For the occupancy classification, we use the method proposed in [15].
Sensors 2018, 18, x FOR PEER REVIEW 4 of 15
Therefore, we proposed a method for obtaining the region of interest (ROI) instead of detecting parking slot markings on the entire image, which can reduce our overall process time. Figure 3 illustrates the method of defining the ROI. w1 indicates the width of the car in the AVM image, w2 indicates the width of the AVM image, w3 and w4 are the widths of the left ROI and right ROI, respectively. The geometric constraint is as follows: w3 = w4 = (w2 − w1)/2. The main steps of the proposed method are as follows: the first part is to detect parking separating lines, which have a pair of parallel lines with a fixed distance in a surround view image. Next is to detect the parking slot entrance. The process utilizes a multiview fusion-based learning approach rather than the previously used Harris corner detector method in [12]. For the occupancy classification, we use the method proposed in [15].
Figure 2. Overall block diagram of the proposed scheme.
Figure 3. Definition method of the region of interest (ROI).
Our method is based on an AVM [33] system. The AVM system consists of four fisheye cameras equipped at four positions, that is, front, rear, left and right side of the car. A view transform and image mosaicking are performed on the system, which provide a so-called ‘bird’s eye view’ image at the top of the vehicle. As the AVM system is very mature, it is not described in detail here. The system is shown in Figure 4.
Figure 2. Overall block diagram of the proposed scheme.
Sensors 2018, 18, x FOR PEER REVIEW 4 of 15
Therefore, we proposed a method for obtaining the region of interest (ROI) instead of detecting parking slot markings on the entire image, which can reduce our overall process time. Figure 3 illustrates the method of defining the ROI. w1 indicates the width of the car in the AVM image, w2 indicates the width of the AVM image, w3 and w4 are the widths of the left ROI and right ROI, respectively. The geometric constraint is as follows: w3 = w4 = (w2 − w1)/2. The main steps of the proposed method are as follows: the first part is to detect parking separating lines, which have a pair of parallel lines with a fixed distance in a surround view image. Next is to detect the parking slot entrance. The process utilizes a multiview fusion-based learning approach rather than the previously used Harris corner detector method in [12]. For the occupancy classification, we use the method proposed in [15].
Figure 2. Overall block diagram of the proposed scheme.
Figure 3. Definition method of the region of interest (ROI).
Our method is based on an AVM [33] system. The AVM system consists of four fisheye cameras equipped at four positions, that is, front, rear, left and right side of the car. A view transform and image mosaicking are performed on the system, which provide a so-called ‘bird’s eye view’ image at the top of the vehicle. As the AVM system is very mature, it is not described in detail here. The system is shown in Figure 4.
Figure 3. Definition method of the region of interest (ROI).
Our method is based on an AVM [33] system. The AVM system consists of four fisheye camerasequipped at four positions, that is, front, rear, left and right side of the car. A view transform andimage mosaicking are performed on the system, which provide a so-called ‘bird’s eye view’ image atthe top of the vehicle. As the AVM system is very mature, it is not described in detail here. The systemis shown in Figure 4.
Sensors 2018, 18, 2821 5 of 16
Sensors 2018, 18, x FOR PEER REVIEW 5 of 15
Figure 4. Camera calibration of the Around View Monitor (AVM) system.
3.1. Image Preprocessing
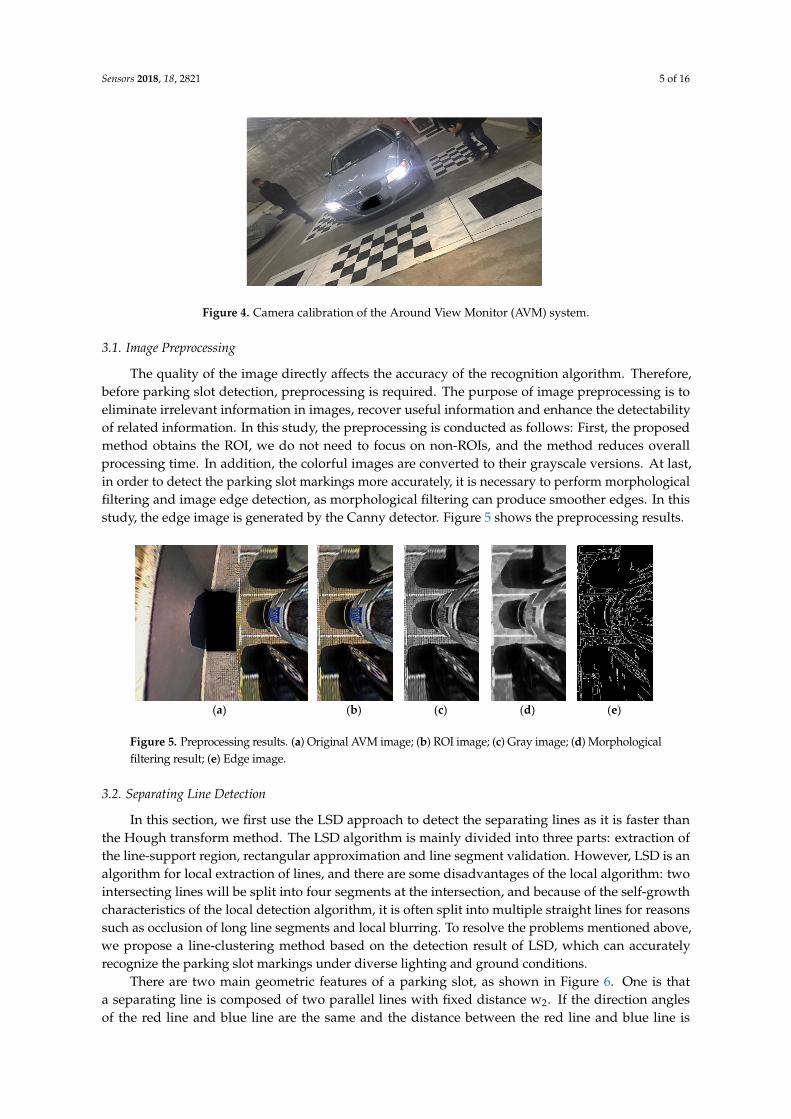
The quality of the image directly affects the accuracy of the recognition algorithm. Therefore, before parking slot detection, preprocessing is required. The purpose of image preprocessing is to eliminate irrelevant information in images, recover useful information and enhance the detectability of related information. In this study, the preprocessing is conducted as follows: First, the proposed method obtains the ROI, we do not need to focus on non-ROIs, and the method reduces overall processing time. In addition, the colorful images are converted to their grayscale versions. At last, in order to detect the parking slot markings more accurately, it is necessary to perform morphological filtering and image edge detection, as morphological filtering can produce smoother edges. In this study, the edge image is generated by the Canny detector. Figure 5 shows the preprocessing results.
(a) (b) (c) (d) (e)
Figure 5. Preprocessing results. (a) Original AVM image; (b) ROI image; (c) Gray image; (d) Morphological filtering result; (e) Edge image.
3.2. Separating Line Detection
In this section, we first use the LSD approach to detect the separating lines as it is faster than the Hough transform method. The LSD algorithm is mainly divided into three parts: extraction of the line-support region, rectangular approximation and line segment validation. However, LSD is an algorithm for local extraction of lines, and there are some disadvantages of the local algorithm: two intersecting lines will be split into four segments at the intersection, and because of the self-growth characteristics of the local detection algorithm, it is often split into multiple straight lines for reasons such as occlusion of long line segments and local blurring. To resolve the problems mentioned above, we propose a line-clustering method based on the detection result of LSD, which can accurately recognize the parking slot markings under diverse lighting and ground conditions.
There are two main geometric features of a parking slot, as shown in Figure 6. One is that a separating line is composed of two parallel lines with fixed distance w2. If the direction angles of the red line and blue line are the same and the distance between the red line and blue line is within the range of w2, the separating line will be detected. The other is that two separating lines can form a
Figure 4. Camera calibration of the Around View Monitor (AVM) system.
3.1. Image Preprocessing
The quality of the image directly affects the accuracy of the recognition algorithm. Therefore,before parking slot detection, preprocessing is required. The purpose of image preprocessing is toeliminate irrelevant information in images, recover useful information and enhance the detectabilityof related information. In this study, the preprocessing is conducted as follows: First, the proposedmethod obtains the ROI, we do not need to focus on non-ROIs, and the method reduces overallprocessing time. In addition, the colorful images are converted to their grayscale versions. At last,in order to detect the parking slot markings more accurately, it is necessary to perform morphologicalfiltering and image edge detection, as morphological filtering can produce smoother edges. In thisstudy, the edge image is generated by the Canny detector. Figure 5 shows the preprocessing results.
Sensors 2018, 18, x FOR PEER REVIEW 5 of 15
Figure 4. Camera calibration of the Around View Monitor (AVM) system.
3.1. Image Preprocessing
The quality of the image directly affects the accuracy of the recognition algorithm. Therefore, before parking slot detection, preprocessing is required. The purpose of image preprocessing is to eliminate irrelevant information in images, recover useful information and enhance the detectability of related information. In this study, the preprocessing is conducted as follows: First, the proposed method obtains the ROI, we do not need to focus on non-ROIs, and the method reduces overall processing time. In addition, the colorful images are converted to their grayscale versions. At last, in order to detect the parking slot markings more accurately, it is necessary to perform morphological filtering and image edge detection, as morphological filtering can produce smoother edges. In this study, the edge image is generated by the Canny detector. Figure 5 shows the preprocessing results.
(a) (b) (c) (d) (e)
Figure 5. Preprocessing results. (a) Original AVM image; (b) ROI image; (c) Gray image; (d) Morphological filtering result; (e) Edge image.
3.2. Separating Line Detection
In this section, we first use the LSD approach to detect the separating lines as it is faster than the Hough transform method. The LSD algorithm is mainly divided into three parts: extraction of the line-support region, rectangular approximation and line segment validation. However, LSD is an algorithm for local extraction of lines, and there are some disadvantages of the local algorithm: two intersecting lines will be split into four segments at the intersection, and because of the self-growth characteristics of the local detection algorithm, it is often split into multiple straight lines for reasons such as occlusion of long line segments and local blurring. To resolve the problems mentioned above, we propose a line-clustering method based on the detection result of LSD, which can accurately recognize the parking slot markings under diverse lighting and ground conditions.
There are two main geometric features of a parking slot, as shown in Figure 6. One is that a separating line is composed of two parallel lines with fixed distance w2. If the direction angles of the red line and blue line are the same and the distance between the red line and blue line is within the range of w2, the separating line will be detected. The other is that two separating lines can form a
Figure 5. Preprocessing results. (a) Original AVM image; (b) ROI image; (c) Gray image; (d) Morphologicalfiltering result; (e) Edge image.
3.2. Separating Line Detection
In this section, we first use the LSD approach to detect the separating lines as it is faster thanthe Hough transform method. The LSD algorithm is mainly divided into three parts: extraction ofthe line-support region, rectangular approximation and line segment validation. However, LSD is analgorithm for local extraction of lines, and there are some disadvantages of the local algorithm: twointersecting lines will be split into four segments at the intersection, and because of the self-growthcharacteristics of the local detection algorithm, it is often split into multiple straight lines for reasonssuch as occlusion of long line segments and local blurring. To resolve the problems mentioned above,we propose a line-clustering method based on the detection result of LSD, which can accuratelyrecognize the parking slot markings under diverse lighting and ground conditions.
There are two main geometric features of a parking slot, as shown in Figure 6. One is thata separating line is composed of two parallel lines with fixed distance w2. If the direction anglesof the red line and blue line are the same and the distance between the red line and blue line is

Sensors 2018, 18, 2821 6 of 16
within the range of w2, the separating line will be detected. The other is that two separating linescan form a parking slot if their distance is within a certain range of w1. Different from the methodin [12], the proposed method ignores the property that the gradient of two parallel lines are opposite.The process utilizes a line-clustering method based on previous preprocessing results, and it containsfour main steps. Figure 7 shows the block diagram of this process.
Sensors 2018, 18, x FOR PEER REVIEW 6 of 15
parking slot if their distance is within a certain range of w1. Different from the method in [12], the proposed method ignores the property that the gradient of two parallel lines are opposite. The process utilizes a line-clustering method based on previous preprocessing results, and it contains four main steps. Figure 7 shows the block diagram of this process.
Figure 6. Geometric features of a parking slot.
Figure 7. Block diagram of separating line detection.
Algorithm 1: Rules of line fitting Input: {L} , ε , θ Output: { lineclasses } 1.foreach line iL in {L} do 2. initialize lineclass; 3. flag = false; 4. foreach lineclass in { lineclasses } 5. if distance < ε , angle < θ 6. flag = true; 7. calculate new start point and end point of new lineclass 8. break; 9. end 10. if flag = false 11. pushback lineclass into {lineclasses}; 12. end 13.end 14.end
For a given edge image, as shown in Figure 8a, the LSD algorithm is performed on it first. According to the detection result of LSD, we set a length threshold value. If the length of the straight-line segment is less than the given threshold, the straight line is not retained; thus, the efficiency can be improved in later processing. Figure 8b shows the detection result by the LSD method. The next
Figure 6. Geometric features of a parking slot.
Sensors 2018, 18, x FOR PEER REVIEW 6 of 15
parking slot if their distance is within a certain range of w1. Different from the method in [12], the proposed method ignores the property that the gradient of two parallel lines are opposite. The process utilizes a line-clustering method based on previous preprocessing results, and it contains four main steps. Figure 7 shows the block diagram of this process.
Figure 6. Geometric features of a parking slot.
Figure 7. Block diagram of separating line detection.
Algorithm 1: Rules of line fitting Input: {L} , ε , θ Output: { lineclasses } 1.foreach line iL in {L} do 2. initialize lineclass; 3. flag = false; 4. foreach lineclass in { lineclasses } 5. if distance < ε , angle < θ 6. flag = true; 7. calculate new start point and end point of new lineclass 8. break; 9. end 10. if flag = false 11. pushback lineclass into {lineclasses}; 12. end 13.end 14.end
For a given edge image, as shown in Figure 8a, the LSD algorithm is performed on it first. According to the detection result of LSD, we set a length threshold value. If the length of the straight-line segment is less than the given threshold, the straight line is not retained; thus, the efficiency can be improved in later processing. Figure 8b shows the detection result by the LSD method. The next
Figure 7. Block diagram of separating line detection.
Algorithm 1: Rules of line fitting
Input: {L}, ε, θ
Output: { lineclasses }1.foreach line Li in {L} do2. initialize lineclass;3. flag = false;4. foreach lineclass in { lineclasses }5. if distance < ε, angle < θ
6. flag = true;7. calculate new start point and end point of new lineclass8. break;9. end10. if flag = false11. pushback lineclass into {lineclasses};12. end13.end14.end
For a given edge image, as shown in Figure 8a, the LSD algorithm is performed on it first.According to the detection result of LSD, we set a length threshold value. If the length ofthe straight-line segment is less than the given threshold, the straight line is not retained; thus,the efficiency can be improved in later processing. Figure 8b shows the detection result by the LSD
Sensors 2018, 18, 2821 7 of 16
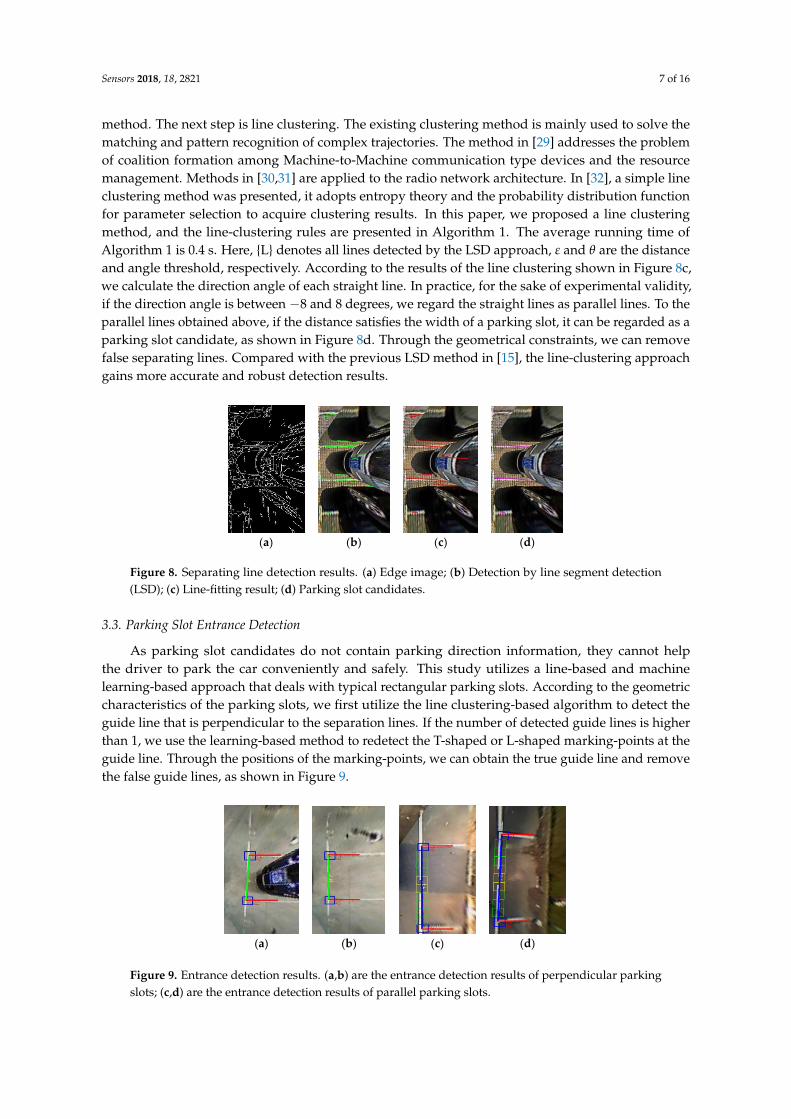
method. The next step is line clustering. The existing clustering method is mainly used to solve thematching and pattern recognition of complex trajectories. The method in [29] addresses the problemof coalition formation among Machine-to-Machine communication type devices and the resourcemanagement. Methods in [30,31] are applied to the radio network architecture. In [32], a simple lineclustering method was presented, it adopts entropy theory and the probability distribution functionfor parameter selection to acquire clustering results. In this paper, we proposed a line clusteringmethod, and the line-clustering rules are presented in Algorithm 1. The average running time ofAlgorithm 1 is 0.4 s. Here, {L} denotes all lines detected by the LSD approach, ε and θ are the distanceand angle threshold, respectively. According to the results of the line clustering shown in Figure 8c,we calculate the direction angle of each straight line. In practice, for the sake of experimental validity,if the direction angle is between −8 and 8 degrees, we regard the straight lines as parallel lines. To theparallel lines obtained above, if the distance satisfies the width of a parking slot, it can be regarded as aparking slot candidate, as shown in Figure 8d. Through the geometrical constraints, we can removefalse separating lines. Compared with the previous LSD method in [15], the line-clustering approachgains more accurate and robust detection results.
Sensors 2018, 18, x FOR PEER REVIEW 7 of 15
step is line clustering. The existing clustering method is mainly used to solve the matching and pattern recognition of complex trajectories. The method in [29] addresses the problem of coalition formation among Machine-to-Machine communication type devices and the resource management. Methods in [30,31] are applied to the radio network architecture. In [32], a simple line clustering method was presented, it adopts entropy theory and the probability distribution function for parameter selection to acquire clustering results. In this paper, we proposed a line clustering method, and the line-clustering rules are presented in Algorithm 1. The average running time of Algorithm 1 is 0.4 s. Here, {L} denotes all lines detected by the LSD approach, ε and θ are the distance and angle threshold, respectively. According to the results of the line clustering shown in Figure 8c, we calculate the direction angle of each straight line. In practice, for the sake of experimental validity, if the direction angle is between −8 and 8 degrees, we regard the straight lines as parallel lines. To the parallel lines obtained above, if the distance satisfies the width of a parking slot, it can be regarded as a parking slot candidate, as shown in Figure 8d. Through the geometrical constraints, we can remove false separating lines. Compared with the previous LSD method in [15], the line-clustering approach gains more accurate and robust detection results.
(a) (b) (c) (d)
Figure 8. Separating line detection results. (a) Edge image; (b) Detection by line segment detection (LSD); (c) Line-fitting result; (d) Parking slot candidates.
3.3. Parking Slot Entrance Detection
As parking slot candidates do not contain parking direction information, they cannot help the driver to park the car conveniently and safely. This study utilizes a line-based and machine learning-based approach that deals with typical rectangular parking slots. According to the geometric characteristics of the parking slots, we first utilize the line clustering-based algorithm to detect the guide line that is perpendicular to the separation lines. If the number of detected guide lines is higher than 1, we use the learning-based method to redetect the T-shaped or L-shaped marking-points at the guide line. Through the positions of the marking-points, we can obtain the true guide line and remove the false guide lines, as shown in Figure 9.
(a) (b) (c) (d)
Figure 9. Entrance detection results.
A typical learning-based method of the marking-point recognition system is shown in Figure 10. The system takes the T-shaped or L-shaped marking-point as the input and uses the classification result as the output. The marking-point detection of a parking slot is to locate and segment the
Figure 8. Separating line detection results. (a) Edge image; (b) Detection by line segment detection(LSD); (c) Line-fitting result; (d) Parking slot candidates.
3.3. Parking Slot Entrance Detection
As parking slot candidates do not contain parking direction information, they cannot helpthe driver to park the car conveniently and safely. This study utilizes a line-based and machinelearning-based approach that deals with typical rectangular parking slots. According to the geometriccharacteristics of the parking slots, we first utilize the line clustering-based algorithm to detect theguide line that is perpendicular to the separation lines. If the number of detected guide lines is higherthan 1, we use the learning-based method to redetect the T-shaped or L-shaped marking-points at theguide line. Through the positions of the marking-points, we can obtain the true guide line and removethe false guide lines, as shown in Figure 9.
Sensors 2018, 18, x FOR PEER REVIEW 7 of 15
step is line clustering. The existing clustering method is mainly used to solve the matching and pattern recognition of complex trajectories. The method in [29] addresses the problem of coalition formation among Machine-to-Machine communication type devices and the resource management. Methods in [30,31] are applied to the radio network architecture. In [32], a simple line clustering method was presented, it adopts entropy theory and the probability distribution function for parameter selection to acquire clustering results. In this paper, we proposed a line clustering method, and the line-clustering rules are presented in Algorithm 1. The average running time of Algorithm 1 is 0.4 s. Here, {L} denotes all lines detected by the LSD approach, ε and θ are the distance and angle threshold, respectively. According to the results of the line clustering shown in Figure 8c, we calculate the direction angle of each straight line. In practice, for the sake of experimental validity, if the direction angle is between −8 and 8 degrees, we regard the straight lines as parallel lines. To the parallel lines obtained above, if the distance satisfies the width of a parking slot, it can be regarded as a parking slot candidate, as shown in Figure 8d. Through the geometrical constraints, we can remove false separating lines. Compared with the previous LSD method in [15], the line-clustering approach gains more accurate and robust detection results.
(a) (b) (c) (d)
Figure 8. Separating line detection results. (a) Edge image; (b) Detection by line segment detection (LSD); (c) Line-fitting result; (d) Parking slot candidates.
3.3. Parking Slot Entrance Detection
As parking slot candidates do not contain parking direction information, they cannot help the driver to park the car conveniently and safely. This study utilizes a line-based and machine learning-based approach that deals with typical rectangular parking slots. According to the geometric characteristics of the parking slots, we first utilize the line clustering-based algorithm to detect the guide line that is perpendicular to the separation lines. If the number of detected guide lines is higher than 1, we use the learning-based method to redetect the T-shaped or L-shaped marking-points at the guide line. Through the positions of the marking-points, we can obtain the true guide line and remove the false guide lines, as shown in Figure 9.
(a) (b) (c) (d)
Figure 9. Entrance detection results.
A typical learning-based method of the marking-point recognition system is shown in Figure 10. The system takes the T-shaped or L-shaped marking-point as the input and uses the classification result as the output. The marking-point detection of a parking slot is to locate and segment the
Figure 9. Entrance detection results. (a,b) are the entrance detection results of perpendicular parkingslots; (c,d) are the entrance detection results of parallel parking slots.
Sensors 2018, 18, 2821 8 of 16
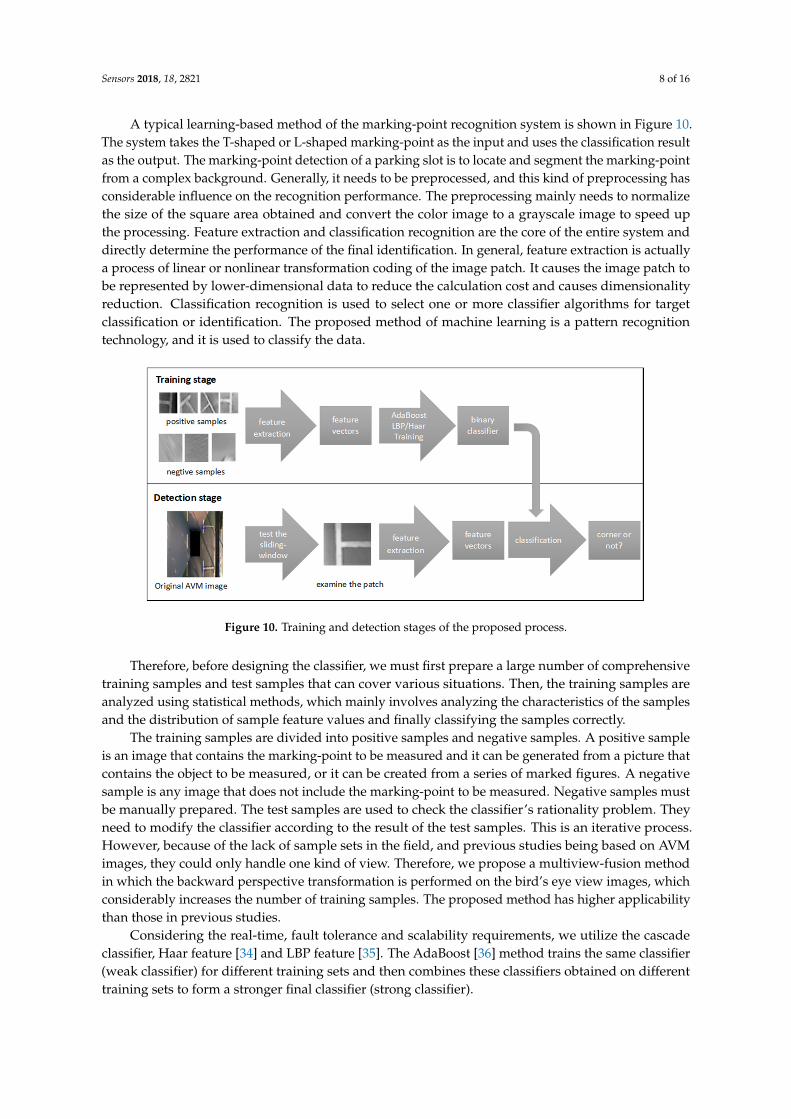
A typical learning-based method of the marking-point recognition system is shown in Figure 10.The system takes the T-shaped or L-shaped marking-point as the input and uses the classification resultas the output. The marking-point detection of a parking slot is to locate and segment the marking-pointfrom a complex background. Generally, it needs to be preprocessed, and this kind of preprocessing hasconsiderable influence on the recognition performance. The preprocessing mainly needs to normalizethe size of the square area obtained and convert the color image to a grayscale image to speed upthe processing. Feature extraction and classification recognition are the core of the entire system anddirectly determine the performance of the final identification. In general, feature extraction is actuallya process of linear or nonlinear transformation coding of the image patch. It causes the image patch tobe represented by lower-dimensional data to reduce the calculation cost and causes dimensionalityreduction. Classification recognition is used to select one or more classifier algorithms for targetclassification or identification. The proposed method of machine learning is a pattern recognitiontechnology, and it is used to classify the data.
Sensors 2018, 18, x FOR PEER REVIEW 8 of 15
marking-point from a complex background. Generally, it needs to be preprocessed, and this kind of preprocessing has considerable influence on the recognition performance. The preprocessing mainly needs to normalize the size of the square area obtained and convert the color image to a grayscale image to speed up the processing. Feature extraction and classification recognition are the core of the entire system and directly determine the performance of the final identification. In general, feature extraction is actually a process of linear or nonlinear transformation coding of the image patch. It causes the image patch to be represented by lower-dimensional data to reduce the calculation cost and causes dimensionality reduction. Classification recognition is used to select one or more classifier algorithms for target classification or identification. The proposed method of machine learning is a pattern recognition technology, and it is used to classify the data.
Figure 10. Training and detection stages of the proposed process.
Therefore, before designing the classifier, we must first prepare a large number of comprehensive training samples and test samples that can cover various situations. Then, the training samples are analyzed using statistical methods, which mainly involves analyzing the characteristics of the samples and the distribution of sample feature values and finally classifying the samples correctly.
The training samples are divided into positive samples and negative samples. A positive sample is an image that contains the marking-point to be measured and it can be generated from a picture that contains the object to be measured, or it can be created from a series of marked figures. A negative sample is any image that does not include the marking-point to be measured. Negative samples must be manually prepared. The test samples are used to check the classifier’s rationality problem. They need to modify the classifier according to the result of the test samples. This is an iterative process. However, because of the lack of sample sets in the field, and previous studies being based on AVM images, they could only handle one kind of view. Therefore, we propose a multiview-fusion method in which the backward perspective transformation is performed on the bird’s eye view images, which considerably increases the number of training samples. The proposed method has higher applicability than those in previous studies.
Considering the real-time, fault tolerance and scalability requirements, we utilize the cascade classifier, Haar feature [34] and LBP feature [35]. The AdaBoost [36] method trains the same classifier (weak classifier) for different training sets and then combines these classifiers obtained on different training sets to form a stronger final classifier (strong classifier).
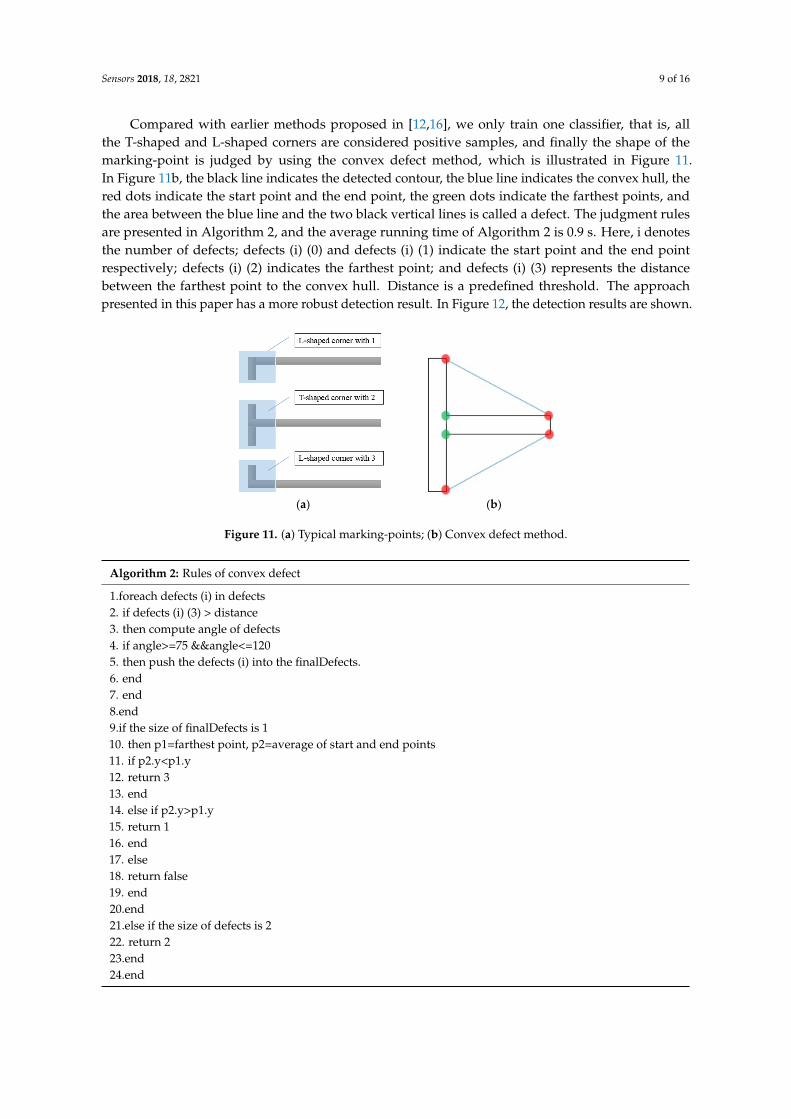
Compared with earlier methods proposed in [12,16], we only train one classifier, that is, all the T-shaped and L-shaped corners are considered positive samples, and finally the shape of the marking-point is judged by using the convex defect method, which is illustrated in Figure 11. In Figure 11b, the black line indicates the detected contour, the blue line indicates the convex hull, the red dots indicate the start point and the end point, the green dots indicate the farthest points, and the area between the blue line and the two black vertical lines is called a defect. The judgment rules are
Figure 10. Training and detection stages of the proposed process.
Therefore, before designing the classifier, we must first prepare a large number of comprehensivetraining samples and test samples that can cover various situations. Then, the training samples areanalyzed using statistical methods, which mainly involves analyzing the characteristics of the samplesand the distribution of sample feature values and finally classifying the samples correctly.
The training samples are divided into positive samples and negative samples. A positive sampleis an image that contains the marking-point to be measured and it can be generated from a picture thatcontains the object to be measured, or it can be created from a series of marked figures. A negativesample is any image that does not include the marking-point to be measured. Negative samples mustbe manually prepared. The test samples are used to check the classifier’s rationality problem. Theyneed to modify the classifier according to the result of the test samples. This is an iterative process.However, because of the lack of sample sets in the field, and previous studies being based on AVMimages, they could only handle one kind of view. Therefore, we propose a multiview-fusion methodin which the backward perspective transformation is performed on the bird’s eye view images, whichconsiderably increases the number of training samples. The proposed method has higher applicabilitythan those in previous studies.
Considering the real-time, fault tolerance and scalability requirements, we utilize the cascadeclassifier, Haar feature [34] and LBP feature [35]. The AdaBoost [36] method trains the same classifier(weak classifier) for different training sets and then combines these classifiers obtained on differenttraining sets to form a stronger final classifier (strong classifier).
Sensors 2018, 18, 2821 9 of 16
Compared with earlier methods proposed in [12,16], we only train one classifier, that is, allthe T-shaped and L-shaped corners are considered positive samples, and finally the shape of themarking-point is judged by using the convex defect method, which is illustrated in Figure 11.In Figure 11b, the black line indicates the detected contour, the blue line indicates the convex hull, thered dots indicate the start point and the end point, the green dots indicate the farthest points, andthe area between the blue line and the two black vertical lines is called a defect. The judgment rulesare presented in Algorithm 2, and the average running time of Algorithm 2 is 0.9 s. Here, i denotesthe number of defects; defects (i) (0) and defects (i) (1) indicate the start point and the end pointrespectively; defects (i) (2) indicates the farthest point; and defects (i) (3) represents the distancebetween the farthest point to the convex hull. Distance is a predefined threshold. The approachpresented in this paper has a more robust detection result. In Figure 12, the detection results are shown.
Sensors 2018, 18, x FOR PEER REVIEW 9 of 15
presented in Algorithm 2, and the average running time of Algorithm 2 is 0.9 s. Here, i denotes the number of defects; defects (i) (0) and defects (i) (1) indicate the start point and the end point respectively; defects (i) (2) indicates the farthest point; and defects (i) (3) represents the distance between the farthest point to the convex hull. Distance is a predefined threshold. The approach presented in this paper has a more robust detection result. In Figure 12, the detection results are shown.
(a) (b)
Figure 11. (a) Typical marking-points; (b) Convex defect method.
Algorithm 2: Rules of convex defect 1.foreach defects (i) in defects 2. if defects (i) (3) > distance 3. then compute angle of defects 4. if angle>=75 &&angle<=120 5. then push the defects (i) into the finalDefects. 6. end 7. end 8.end 9.if the size of finalDefects is 1 10. then p1=farthest point, p2=average of start and end points 11. if p2.y<p1.y 12. return 3 13. end 14. else if p2.y>p1.y 15. return 1 16. end 17. else 18. return false 19. end 20.end 21.else if the size of defects is 2 22. return 2 23.end 24.end
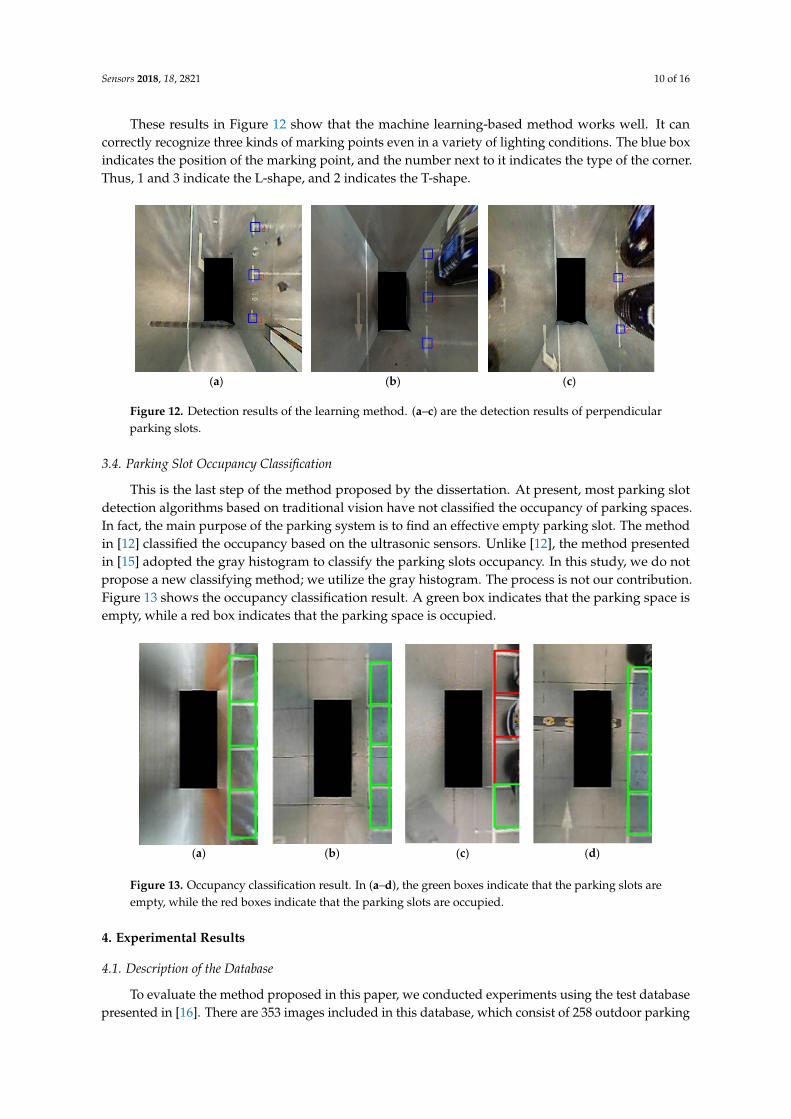
These results in Figure 12 show that the machine learning-based method works well. It can correctly recognize three kinds of marking points even in a variety of lighting conditions. The blue box indicates the position of the marking point, and the number next to it indicates the type of the corner. Thus, 1 and 3 indicate the L-shape, and 2 indicates the T-shape.
Figure 11. (a) Typical marking-points; (b) Convex defect method.
Algorithm 2: Rules of convex defect
1.foreach defects (i) in defects2. if defects (i) (3) > distance3. then compute angle of defects4. if angle>=75 &&angle<=1205. then push the defects (i) into the finalDefects.6. end7. end8.end9.if the size of finalDefects is 110. then p1=farthest point, p2=average of start and end points11. if p2.y<p1.y12. return 313. end14. else if p2.y>p1.y15. return 116. end17. else18. return false19. end20.end21.else if the size of defects is 222. return 223.end24.end
Sensors 2018, 18, 2821 10 of 16
These results in Figure 12 show that the machine learning-based method works well. It cancorrectly recognize three kinds of marking points even in a variety of lighting conditions. The blue boxindicates the position of the marking point, and the number next to it indicates the type of the corner.Thus, 1 and 3 indicate the L-shape, and 2 indicates the T-shape.Sensors 2018, 18, x FOR PEER REVIEW 10 of 15
(a) (b) (c)
Figure 12. Detection results of the learning method.
3.4. Parking Slot Occupancy Classification
This is the last step of the method proposed by the dissertation. At present, most parking slot detection algorithms based on traditional vision have not classified the occupancy of parking spaces. In fact, the main purpose of the parking system is to find an effective empty parking slot. The method in [12] classified the occupancy based on the ultrasonic sensors. Unlike [12], the method presented in [15] adopted the gray histogram to classify the parking slots occupancy. In this study, we do not propose a new classifying method; we utilize the gray histogram. The process is not our contribution. Figure 13 shows the occupancy classification result. A green box indicates that the parking space is empty, while a red box indicates that the parking space is occupied.
(a) (b) (c) (d)
Figure 13. Occupancy classification result.
4. Experimental Results
4.1. Description of the Database
To evaluate the method proposed in this paper, we conducted experiments using the test database presented in [16]. There are 353 images included in this database, which consist of 258 outdoor parking slots and 95 underground parking slots. Images in this test database were captured by fisheye camera, and their resolution is 600 × 600 pixels. This test database covers a variety of complex lighting and ground conditions, such as dim light in basement scenes, shadow in outdoor parking lots and large numbers of stains on the road surface.
In terms of the training database, we marked 5100 images. The images in the training database were also captured by an AVM system, and the resolution is the same as the test database. To increase the number of the training samples, we performed a perspective transformation on the acquired
Figure 12. Detection results of the learning method. (a–c) are the detection results of perpendicularparking slots.
3.4. Parking Slot Occupancy Classification
This is the last step of the method proposed by the dissertation. At present, most parking slotdetection algorithms based on traditional vision have not classified the occupancy of parking spaces.In fact, the main purpose of the parking system is to find an effective empty parking slot. The methodin [12] classified the occupancy based on the ultrasonic sensors. Unlike [12], the method presentedin [15] adopted the gray histogram to classify the parking slots occupancy. In this study, we do notpropose a new classifying method; we utilize the gray histogram. The process is not our contribution.Figure 13 shows the occupancy classification result. A green box indicates that the parking space isempty, while a red box indicates that the parking space is occupied.
Sensors 2018, 18, x FOR PEER REVIEW 10 of 15
(a) (b) (c)
Figure 12. Detection results of the learning method.
3.4. Parking Slot Occupancy Classification
This is the last step of the method proposed by the dissertation. At present, most parking slot detection algorithms based on traditional vision have not classified the occupancy of parking spaces. In fact, the main purpose of the parking system is to find an effective empty parking slot. The method in [12] classified the occupancy based on the ultrasonic sensors. Unlike [12], the method presented in [15] adopted the gray histogram to classify the parking slots occupancy. In this study, we do not propose a new classifying method; we utilize the gray histogram. The process is not our contribution. Figure 13 shows the occupancy classification result. A green box indicates that the parking space is empty, while a red box indicates that the parking space is occupied.
(a) (b) (c) (d)
Figure 13. Occupancy classification result.
4. Experimental Results
4.1. Description of the Database
To evaluate the method proposed in this paper, we conducted experiments using the test database presented in [16]. There are 353 images included in this database, which consist of 258 outdoor parking slots and 95 underground parking slots. Images in this test database were captured by fisheye camera, and their resolution is 600 × 600 pixels. This test database covers a variety of complex lighting and ground conditions, such as dim light in basement scenes, shadow in outdoor parking lots and large numbers of stains on the road surface.
In terms of the training database, we marked 5100 images. The images in the training database were also captured by an AVM system, and the resolution is the same as the test database. To increase the number of the training samples, we performed a perspective transformation on the acquired
Figure 13. Occupancy classification result. In (a–d), the green boxes indicate that the parking slots areempty, while the red boxes indicate that the parking slots are occupied.
4. Experimental Results
4.1. Description of the Database
To evaluate the method proposed in this paper, we conducted experiments using the test databasepresented in [16]. There are 353 images included in this database, which consist of 258 outdoor parking
Sensors 2018, 18, 2821 11 of 16
slots and 95 underground parking slots. Images in this test database were captured by fisheye camera,and their resolution is 600 × 600 pixels. This test database covers a variety of complex lighting andground conditions, such as dim light in basement scenes, shadow in outdoor parking lots and largenumbers of stains on the road surface.
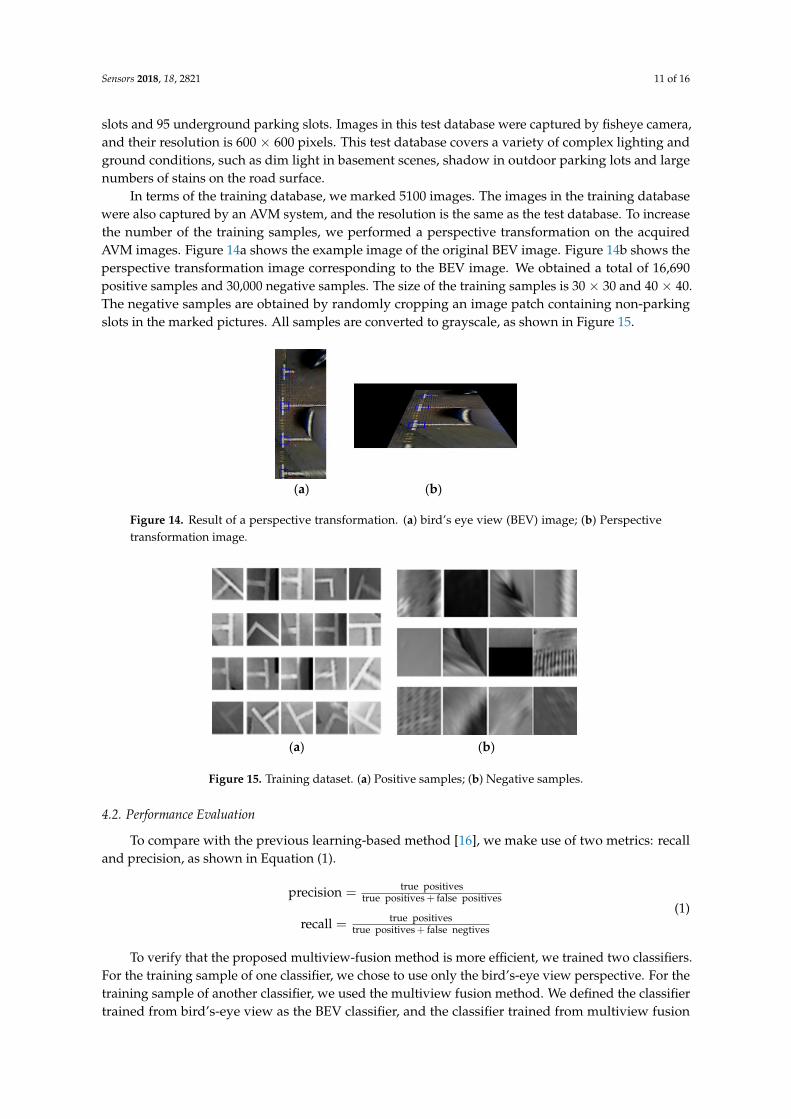
In terms of the training database, we marked 5100 images. The images in the training databasewere also captured by an AVM system, and the resolution is the same as the test database. To increasethe number of the training samples, we performed a perspective transformation on the acquiredAVM images. Figure 14a shows the example image of the original BEV image. Figure 14b shows theperspective transformation image corresponding to the BEV image. We obtained a total of 16,690positive samples and 30,000 negative samples. The size of the training samples is 30 × 30 and 40 × 40.The negative samples are obtained by randomly cropping an image patch containing non-parkingslots in the marked pictures. All samples are converted to grayscale, as shown in Figure 15.
Sensors 2018, 18, x FOR PEER REVIEW 11 of 15
AVM images. Figure 14a shows the example image of the original BEV image. Figure 14b shows the perspective transformation image corresponding to the BEV image. We obtained a total of 16,690 positive samples and 30,000 negative samples. The size of the training samples is 30 × 30 and 40 × 40. The negative samples are obtained by randomly cropping an image patch containing non-parking slots in the marked pictures. All samples are converted to grayscale, as shown in Figure 15.
(a) (b)
Figure 14. Result of a perspective transformation. (a) bird’s eye view (BEV) image; (b) Perspective transformation image.
(a) (b)
Figure 15. Training dataset. (a) Positive samples; (b) Negative samples.
4.2. Performance Evaluation
To compare with the previous learning-based method [16], we make use of two metrics: recall and precision, as shown in Equation (1).
positivesfalsepositivestruepositivestrueprecision+
=
negativesfalsepositivestruepositivestruerecall+
= (1)
To verify that the proposed multiview-fusion method is more efficient, we trained two classifiers. For the training sample of one classifier, we chose to use only the bird’s-eye view perspective. For the training sample of another classifier, we used the multiview fusion method. We defined the classifier trained from bird’s-eye view as the BEV classifier, and the classifier trained from multiview fusion as the MV classifier. Figure 16 shows the comparison result between the BEV classifier and the MV classifier. As seen in Figure 16, the detection result using the MV classifier is better than that of the BEV classifier.
Figure 14. Result of a perspective transformation. (a) bird’s eye view (BEV) image; (b) Perspectivetransformation image.
Sensors 2018, 18, x FOR PEER REVIEW 11 of 15
AVM images. Figure 14a shows the example image of the original BEV image. Figure 14b shows the perspective transformation image corresponding to the BEV image. We obtained a total of 16,690 positive samples and 30,000 negative samples. The size of the training samples is 30 × 30 and 40 × 40. The negative samples are obtained by randomly cropping an image patch containing non-parking slots in the marked pictures. All samples are converted to grayscale, as shown in Figure 15.
(a) (b)
Figure 14. Result of a perspective transformation. (a) bird’s eye view (BEV) image; (b) Perspective transformation image.
(a) (b)
Figure 15. Training dataset. (a) Positive samples; (b) Negative samples.
4.2. Performance Evaluation
To compare with the previous learning-based method [16], we make use of two metrics: recall and precision, as shown in Equation (1).
positivesfalsepositivestruepositivestrueprecision+
=
negativesfalsepositivestruepositivestruerecall+
= (1)
To verify that the proposed multiview-fusion method is more efficient, we trained two classifiers. For the training sample of one classifier, we chose to use only the bird’s-eye view perspective. For the training sample of another classifier, we used the multiview fusion method. We defined the classifier trained from bird’s-eye view as the BEV classifier, and the classifier trained from multiview fusion as the MV classifier. Figure 16 shows the comparison result between the BEV classifier and the MV classifier. As seen in Figure 16, the detection result using the MV classifier is better than that of the BEV classifier.
Figure 15. Training dataset. (a) Positive samples; (b) Negative samples.
4.2. Performance Evaluation
To compare with the previous learning-based method [16], we make use of two metrics: recalland precision, as shown in Equation (1).
precision =true positives
true positives+ false positives
recall = true positivestrue positives+ false negtives
(1)
To verify that the proposed multiview-fusion method is more efficient, we trained two classifiers.For the training sample of one classifier, we chose to use only the bird’s-eye view perspective. For thetraining sample of another classifier, we used the multiview fusion method. We defined the classifiertrained from bird’s-eye view as the BEV classifier, and the classifier trained from multiview fusion
Sensors 2018, 18, 2821 12 of 16
as the MV classifier. Figure 16 shows the comparison result between the BEV classifier and the MVclassifier. As seen in Figure 16, the detection result using the MV classifier is better than that of theBEV classifier.Sensors 2018, 18, x FOR PEER REVIEW 12 of 15
(a) (b)
Figure 16. Comparison result between the BEV classifier and the MV classifier.
Table 1 lists the comparison results of learning-based marking-point detection between the MV classifier and the BEV classifier using outdoor images in the test database. In this table, #marking point, #TP and #FP indicate the number of existing marking points, correctly recognized marking points, and incorrectly recognized marking points, respectively. The MV classifier gives a recall of 96.8% and a precision of 98.2%, while the BEV classifier gives a recall of 94.0% and a precision of 96.0%. This reveals that the MV classifier outperforms the BEV classifier by 2.2% and 2.8% in terms of precision and recall, respectively. This is because, through perspective transformation, the number of training samples has doubled, which made the performance of the classifier more reliable.
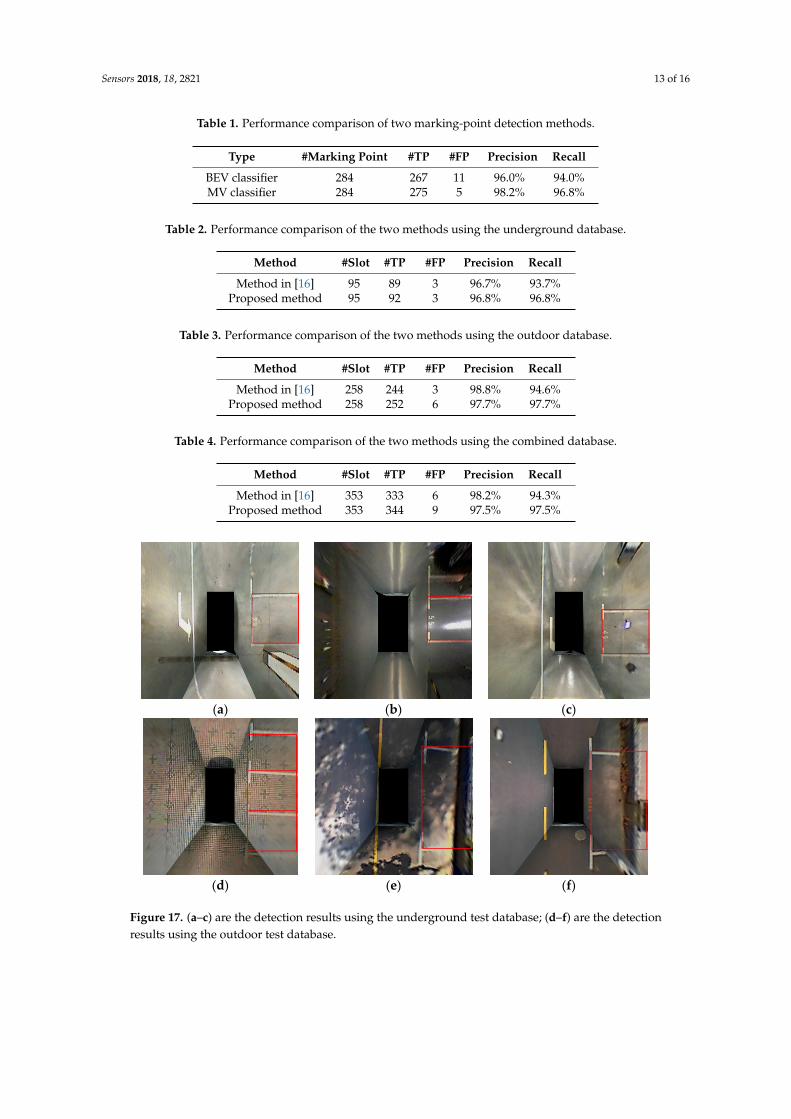
Table 2 presents the comparison results between the previous method in [16] and the proposed method, using the underground test database. In this table, #slots, #TP and #FP indicate the number of existing slots, correctly recognized slots and falsely recognized slots, respectively. The proposed method gives 96.8% for recall and precision, while the method in [16] gives a recall of 93.7% and a precision of 96.7%. This reveals that the proposed method outperforms the previous method by 0.1% and 3.1% in terms of precision and recall, respectively. This is mainly because, in the underground parking environment, the lighting is dim and there is strong reflected light on the ground. The proposed method can better detect the parking line under these lighting conditions. Table 3 shows the comparison results between the previous method in [16] and the proposed method, using the outdoor test database. The proposed method gives a 1.1% lower precision but 3.1% higher recall than the previous method. This is because the proposed algorithm is able to detect more true positives. Table 4 presents the comparison results between the previous method and the proposed method using the combined test database. On average, the proposed method achieves 97.5% for both recall and precision while the method in [16] gives a precision of 98.2% and a recall of 94.3%. In terms of the precision, the proposed method gives just 0.7% lower precision than the previous method described in [16]. This is because the previous method produces no parking slot when it cannot detect the marking point, which means that the number of false positives is lower than in the proposed method. In this case, we can compare the recall rates. The best method should achieve the highest recall rates. Based on Table 4, it can be seen that the proposed method gives a higher recall by 3.2% compared to the method in [16], which reveals that the proposed method outperforms the previous method. Figure 17 gives the final parking slot detection results under a variety of lighting conditions. These results show that the proposed method works well. It detects separating lines using a line-clustering method according to the geometric constraints, and it detects the entrances using multiview fusion-based learning method, which can increase the number of true positives.
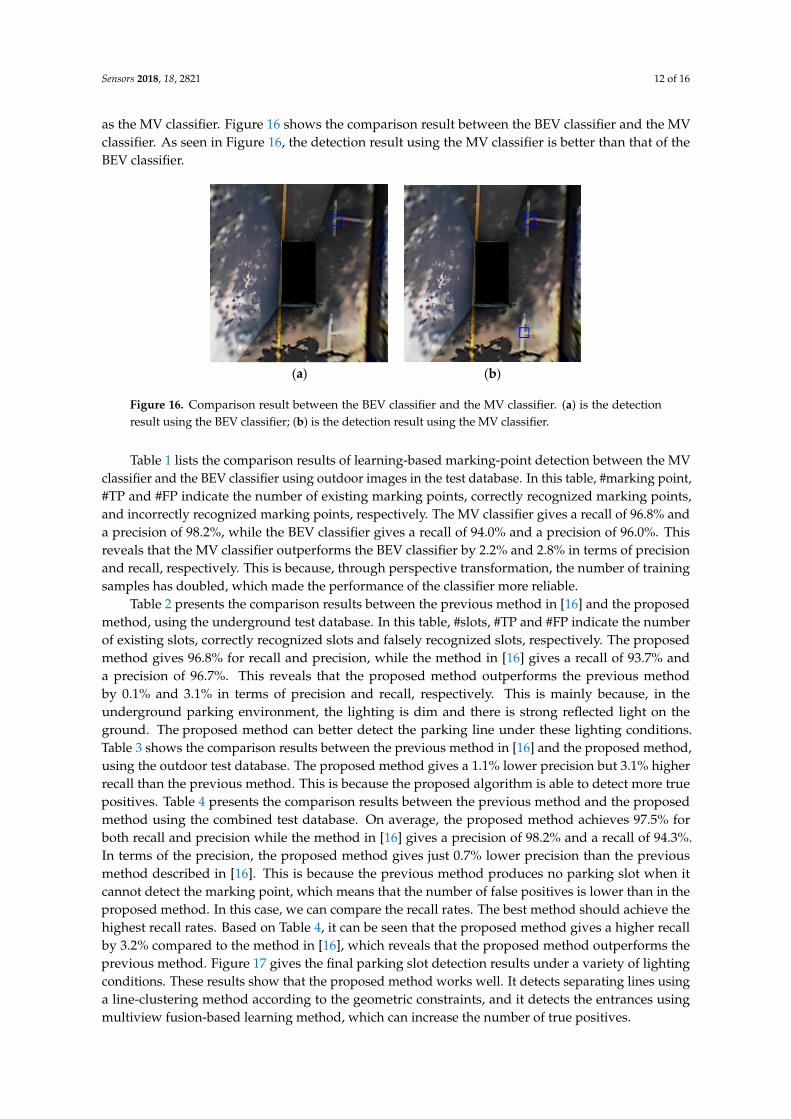
Figure 16. Comparison result between the BEV classifier and the MV classifier. (a) is the detectionresult using the BEV classifier; (b) is the detection result using the MV classifier.
Table 1 lists the comparison results of learning-based marking-point detection between the MVclassifier and the BEV classifier using outdoor images in the test database. In this table, #marking point,#TP and #FP indicate the number of existing marking points, correctly recognized marking points,and incorrectly recognized marking points, respectively. The MV classifier gives a recall of 96.8% anda precision of 98.2%, while the BEV classifier gives a recall of 94.0% and a precision of 96.0%. Thisreveals that the MV classifier outperforms the BEV classifier by 2.2% and 2.8% in terms of precisionand recall, respectively. This is because, through perspective transformation, the number of trainingsamples has doubled, which made the performance of the classifier more reliable.
Table 2 presents the comparison results between the previous method in [16] and the proposedmethod, using the underground test database. In this table, #slots, #TP and #FP indicate the numberof existing slots, correctly recognized slots and falsely recognized slots, respectively. The proposedmethod gives 96.8% for recall and precision, while the method in [16] gives a recall of 93.7% anda precision of 96.7%. This reveals that the proposed method outperforms the previous methodby 0.1% and 3.1% in terms of precision and recall, respectively. This is mainly because, in theunderground parking environment, the lighting is dim and there is strong reflected light on theground. The proposed method can better detect the parking line under these lighting conditions.Table 3 shows the comparison results between the previous method in [16] and the proposed method,using the outdoor test database. The proposed method gives a 1.1% lower precision but 3.1% higherrecall than the previous method. This is because the proposed algorithm is able to detect more truepositives. Table 4 presents the comparison results between the previous method and the proposedmethod using the combined test database. On average, the proposed method achieves 97.5% forboth recall and precision while the method in [16] gives a precision of 98.2% and a recall of 94.3%.In terms of the precision, the proposed method gives just 0.7% lower precision than the previousmethod described in [16]. This is because the previous method produces no parking slot when itcannot detect the marking point, which means that the number of false positives is lower than in theproposed method. In this case, we can compare the recall rates. The best method should achieve thehighest recall rates. Based on Table 4, it can be seen that the proposed method gives a higher recallby 3.2% compared to the method in [16], which reveals that the proposed method outperforms theprevious method. Figure 17 gives the final parking slot detection results under a variety of lightingconditions. These results show that the proposed method works well. It detects separating lines usinga line-clustering method according to the geometric constraints, and it detects the entrances usingmultiview fusion-based learning method, which can increase the number of true positives.
Sensors 2018, 18, 2821 13 of 16
Table 1. Performance comparison of two marking-point detection methods.
Type #Marking Point #TP #FP Precision Recall
BEV classifier 284 267 11 96.0% 94.0%MV classifier 284 275 5 98.2% 96.8%
Table 2. Performance comparison of the two methods using the underground database.
Method #Slot #TP #FP Precision Recall
Method in [16] 95 89 3 96.7% 93.7%Proposed method 95 92 3 96.8% 96.8%
Table 3. Performance comparison of the two methods using the outdoor database.
Method #Slot #TP #FP Precision Recall
Method in [16] 258 244 3 98.8% 94.6%Proposed method 258 252 6 97.7% 97.7%
Table 4. Performance comparison of the two methods using the combined database.
Method #Slot #TP #FP Precision Recall
Method in [16] 353 333 6 98.2% 94.3%Proposed method 353 344 9 97.5% 97.5%
Sensors 2018, 18, x FOR PEER REVIEW 13 of 15
Table 1. Performance comparison of two marking-point detection methods.
Type #Marking Point #TP #FP Precision Recall BEV classifier 284 267 11 96.0% 94.0% MV classifier 284 275 15 98.2% 96.8%
Table 2. Performance comparison of the two methods using the underground database.
Method #Slot #TP #FP Precision Recall Method in [16] 95 89 3 96.7% 93.7%
Proposed method 95 92 3 96.8% 96.8%
Table 3. Performance comparison of the two methods using the outdoor database.
Method #Slot #TP #FP Precision Recall Method in [16] 258 244 3 98.8% 94.6%
Proposed method 258 252 6 97.7% 97.7%
Table 4. Performance comparison of the two methods using the combined database.
Method #Slot #TP #FP Precision Recall Method in [16] 353 333 6 98.2% 94.3%
Proposed method 353 344 9 97.5% 97.5%
(a) (b) (c)
(d) (e) (f)
Figure 17. (a–c) are the detection results using the underground test database; (d–f) are the detection results using the outdoor test database.
5. Conclusions
Parking slot detection is an important aspect of an automatic parking system, but an accurate vision-based parking slot detection method has yet to be developed. In this paper, we proposed a geometric features-based parking-slot-marking detection approach, which involves three notable aspects. First, we proposed a line clustering method that can recognize the parking slot markings
Figure 17. (a–c) are the detection results using the underground test database; (d–f) are the detectionresults using the outdoor test database.
Sensors 2018, 18, 2821 14 of 16
5. Conclusions
Parking slot detection is an important aspect of an automatic parking system, but an accuratevision-based parking slot detection method has yet to be developed. In this paper, we proposeda geometric features-based parking-slot-marking detection approach, which involves three notableaspects. First, we proposed a line clustering method that can recognize the parking slot markings underdiverse complex lighting and ground conditions. Second, we proposed a multiview fusion-basedmethod, which can increase the number of training samples and improve the accuracy of the detectionresult. The experiment was evaluated on our test database, and the method outperforms the singlebird’s eye view method. Finally, we only trained one detector, and the convex defect was utilized toidentify the T-shape or L-shape of the marking points. Since the running time of our method cannotmeet the real-time requirement, we will try to reduce the complexity of our scheme later. In addition,we intend to use deep learning in parking slot detection, because deep learning has high accuratedetection performance. However, deep learning requires large number of labeled samples that can beaccumulated in the future.
Author Contributions: Q.L. and C.L. conceived of and designed the algorithm. Q.L., C.L., and Y.Z. performedthe experiments and analyzed the data. Q.L. and C.L. wrote the paper.
Acknowledgments: This work was supported in part by the National Natural Science Foundation of China underGrant (61772066), by the Fundamental Research Funds for the Central Universities (2018JBM011).
Conflicts of Interest: The authors declare no conflict of interest.
References
1. Rahayu, Y.; Mustapa, F.N. A secure parking reservation system using GSM technology. Int. J. Comput.Commun. Eng. 2013, 2, 518. [CrossRef]
2. Mainetti, L.; Palano, L.; Patrono, L.; Stefanizzi, M.L.; Vergallo, R. Integration of RFID and WSNtechnologies in a smart parking system. In Proceedings of the 22nd International Conference on Software,Telecommunications and Computer Networks (SoftCOM), Split, Croatia, 17–19 September 2014; pp. 104–110.
3. Gupta, A.; Kulkarni, S.; Jathar, V.; Sharma, V.; Jain, N. Smart Car Parking Management System Using IoT.Am. J. Sci. Eng. Technol. 2017, 2, 112.
4. Ban, X.; Chu, L.; Herring, R.; Margulici, J.D. Sequential modeling framework for optimal sensor placementfor multiple intelligent transportation system applications. J. Trans. Eng. 2011, 137, 112–120. [CrossRef]
5. Kim, W.; Kim, D.; Yi, K.; Kim, H.J. Development of a path-tracking control system based on model predictivecontrol using infrastructure sensors. Veh. Syst. Dyn. 2012, 50, 1001–1023. [CrossRef]
6. Jeong, S.H.; Choi, C.G.; Oh, J.N.; Yoon, P.J.; Kim, B.S.; Kim, M.; Lee, K.H. Low cost design of parallel parkingassist system based on an ultrasonic sensor. Int. J. Autom. Technol. 2010, 11, 409–416. [CrossRef]
7. Alonso, L.; Milanes, V.; Torre-Ferrero, C.; Godoy, J.; Oria, J.P. Ultrasonic sensors in urban traffic driving-aidsystems. Sensors 2011, 11, 661–673. [CrossRef] [PubMed]
8. Kim, H.; Lee, J.H.; Kim, S.W.; Ko, J.I.; Cho, D. Ultrasonic vehicle detector for side-fire implementation andextensive results including harsh conditions. IEEE Trans. Intell. Transp. Syst. 2001, 2, 127–134.
9. Carullo, A.; Parvis, M. An ultrasonic sensor for distance measurement in automotive applications.IEEE Sens. J. 2001, 1, 143. [CrossRef]
10. Agarwal, V.; Murali, N.V.; Chandramouli, C. A Cost-Effective Ultrasonic Sensor-Based Driver-Assistancesystem for Congested Traffic Conditions. IEEE Trans. Intell. Transp. Syst. 2009, 10, 486–498. [CrossRef]
11. Zhou, J.; Navarro-Serment, L.E.; Hebert, M. Detection of parking spots using 2D range data. In Proceedingsof the 15th IEEE International Conference on Intelligent Transportation Systems, Anchorage, AK, USA,16–19 September 2012; pp. 1280–1287.
12. Suhr, J.K.; Jung, H.G. A Universal Vacant Parking Slot Recognition System Using Sensors Mounted onOff-the-Shelf Vehicles. Sensors 2018, 18, 1213. [CrossRef] [PubMed]
13. Jung, H.G.; Kim, D.S.; Yoon, P.J.; Kim, J. Parking slot markings recognition for automatic parking assist system.In Proceedings of the IEEE Intelligent Vehicles Symposium, Tokyo, Japan, 13–15 June 2006; pp. 106–113.
Sensors 2018, 18, 2821 15 of 16
14. Wang, C.; Zhang, H.; Yang, M.; Wang, X.; Ye, L.; Guo, C. Automatic Parking Based on a Bird’s Eye ViewVision System. Adv. Mech. Eng. 2014, 6, 847406. [CrossRef]
15. Li, L.; Li, C.; Zhang, Q.; Guo, T.; Miao, Z. Automatic parking slot detection based on around view monitor(AVM) systems. In Proceedings of the 9th IEEE International Conference on Wireless Communications andSignal Processing, Nanjing, China, 11–13 October 2017; pp. 1–6.
16. Zhang, L.; Li, X.; Huang, J.; Shen, Y.; Wang, D. Vision-Based Parking-Slot Detection: A Benchmark and aLearning-Based Approach. Symmetry 2018, 10, 64. [CrossRef]
17. Xu, J.; Chen, G.; Xie, M. Vision-guided automatic parking for smart car. In Proceedings of the IEEE IntelligentVehicles Symposium, Dearborn, MI, USA, 3–5 October 2000; pp. 725–730.
18. Jung, H.G.; Kim, D.S.; Yoon, P.J.; Kim, J. Structure analysis based parking slot marking recognition forsemi-automatic parking system. In Proceedings of the Joint IAPR International WorkShops on StatisticalTechniques in Pattern Recognition and Structural and Syntactic Pattern Recognition, Hong Kong, China,17–19 August 2006; pp. 384–393.
19. Schmid, M.R.; Ates, S.; Dickmann, J.; Hundelshausen, F.; Wuensche, H.J. Parking space detection withhierarchical dynamic occupancy grids. In Proceedings of the IEEE Intelligent Vehicles Symposium,Baden-Baden, Germany, 5–9 June 2011; pp. 254–259.
20. Suhr, J.K.; Jung, H.G. Fully-automatic recognition of various parking slot markings in Around ViewMonitor (AVM) image sequences. In Proceedings of the 15th IEEE International Conference on IntelligentTransportation Systems, Anchorage, AK, USA, 16–19 September 2012; pp. 1294–1299.
21. Suhr, J.K.; Jung, H.G. Full-automatic recognition of various parking slot markings using a hierarchical treestructure. Opt. Eng. 2013, 52, 037203. [CrossRef]
22. Suhr, J.K.; Jung, H.G. Sensor fusion-based vacant parking slot detection and tracking. IEEE Trans. Intell.Transp. Syst. 2014, 15, 21–36. [CrossRef]
23. Lee, S.; Hyeon, D.; Park, G.; Baek, I.J.; Kim, S.W.; Seo, S.W. Directional-DBSCAN: Parking-slot detectionusing a clustering method in around-view monitoring system. In Proceedings of the 2016 IEEE IntelligentVehicles Symposium, Gothenburg, Sweden, 19–22 June 2016; pp. 349–354.
24. Lee, S.; Seo, S.W. Available parking slot recognition based on slot context analysis. IET Intell. Transp. Syst.2016, 10, 594–604. [CrossRef]
25. Suhr, J.K.; Jung, H.G. Automatic parking space detection and tracking for underground and indoorenvironments. IEEE Trans. Ind. Electron. 2016, 63, 5687–5698. [CrossRef]
26. Jung, H.G.; Lee, Y.H.; Kim, J. Uniform user interface for semiautomatic parking slot marking recognition.IEEE Trans. Veh. Technol. 2010, 59, 616–626. [CrossRef]
27. Jung, H.G.; Kim, D.S.; Yoon, P.J.; Kim, J. Two-touch type parking slot marking recognition for targetparking position designation. In Proceedings of the 2008 IEEE Intelligent Vehicles Symposium, Eindhoven,The Netherlands, 4–6 June 2008; pp. 1161–1166.
28. Jung, H.G. Semi-automatic parking slot marking recognition for intelligent parking assist systems. J. Eng.2013, 2014, 8–15. [CrossRef]
29. Tsiropoulou, E.E.; Paruchuri, S.T.; Baras, J.S. Interest, energy and physical-aware coalition formation andresource allocation in smart IoT applications. In Proceedings of the 51st Annual Conference on InformationSciences and Systems (CISS), Baltimore, MD, USA, 24–27 March 2017; pp. 1–6.
30. Gerla, M.; Tsai, T.C. Multicluster, mobile, multimedia radio network. Wirel. Netw. 1995, 1, 255–265. [CrossRef]31. Lin, C.R.; Gerla, M. Adaptive clustering for mobile wireless networks. IEEE J. Sel. Area Commun. 1997, 15,
1265–1275. [CrossRef]32. He, B.; Zhang, Y.; Chen, Y.; Gu, Z. A Simple Line Clustering Method for Spatial Analysis with
Origin-Destination Data and Its Application to Bike-Sharing Movement Data. ISPRS Int. J. Geo-Inf. 2018,7, 203. [CrossRef]
33. Gao, Y.; Lin, C.; Zhao, Y.; Wang, X.; Wei, S.; Huang, Q. 3-D Surround View for Advanced Driver AssistanceSystems. IEEE Trans. Intell. Transp. Syst. 2018, 19, 320–328. [CrossRef]
34. Saeed, A.; Al-Hamadi, A.; Ghoneim, A. Head Pose Estimation on Top of Haar-Like Face Detection: A StudyUsing the Kinect Sensor. Sensors 2015, 15, 20945–20966. [CrossRef] [PubMed]
Sensors 2018, 18, 2821 16 of 16
35. Nguyen, D.T.; Pham, T.D.; Baek, N.R.; Park, K.R. Combining Deep and Handcrafted Image Features forPresentation Attack Detection in Face Recognition Systems Using Visible-Light Camera Sensors. Sensors2018, 18, 699. [CrossRef] [PubMed]
36. Chen, Y.; Dou, P.; Yang, X. Improving Land Use/Cover Classification with a Multiple Classifier SystemUsing AdaBoost Integration Technique. Remote Sens. 2017, 9, 1055. [CrossRef]
© 2018 by the authors. Licensee MDPI, Basel, Switzerland. This article is an open accessarticle distributed under the terms and conditions of the Creative Commons Attribution(CC BY) license (http://creativecommons.org/licenses/by/4.0/).