Intelligent car parking management system
117
Copyright is owned by the Author of the thesis. Permission is given for a copy to be downloaded by an individual for the purpose of research and private study only. The thesis may not be reproduced elsewhere without the permission of the Author.
-
Upload
khangminh22 -
Category
Documents
-
view
0 -
download
0
Transcript of Intelligent car parking management system

Copyright is owned by the Author of the thesis. Permission is given for a copy to be downloaded by an individual for the purpose of research and private study only. The thesis may not be reproduced elsewhere without the permission of the Author.

Intelligent Car Parking Management System
A thesis presented in partial fulfilment of the requirements for thedegree of
Master of Engineering
in
Electronic and Computer System Engineering
at Massey University, Palmerston North
New Zealand
Hilal Al-Kharusi
2014

Abstract
Due to the increasing number of vehicles on the roads, traffic problems always exist. The
current unmanaged car parks and transportation facilities make it difficult to accommodate
the increasing number of vehicles in a proper, convinient manner so it is necessary to have a
car parking management system in big car parks. This study is aimed at analysing a car
parking management system. This system allocates available parking space to a given driver
to park their vehicle, renews the availability of the parking space when the car leaves and
computes the charges due. Implementing this system will increase parking utilization. The
system does this by providing more efficient and effective parking enforcement. An image
processing technique is used to implement an intelligent car parking management system at
the Massey University car park. In this project a camera is used as a sensor to take photos to
show the occupancy of car parks. The reason a camera is used is because with an image it can
detect the presence of many cars at once. Also the camera can be easily moved to detect a
different car park. By having this image, the particular car parks vacant can be known and
then used to guide a driver to a car park. Software processes these images so that a driver or
operator can know the vacant car parks.
Since most of the cars at Massey University are in one parking area, video cameras could be
used efficiently to detect many of them. This Thesis presents how a system could be made
that would detect the availability of car parks and tell a driver where the available car parks
are.
Green circles are placed on car parks so that cameras can easily differentiate whether a car is
parked in a spot or not. If there is a car on the spot then the green circle will not be seen. First
an excel spreadsheet with test data was used to test, displaying where empty and full car
i

parks are. Then a program that created random data was used to quickly see how the display
would look in different conditions.
ii

Acknowledgements
In completing this thesis for master degree in Electronics and Computer System Engineering,
I would like to give my sincere appreciation and thanks to:
My supervisor Dr Ibrahim Al-Bahadly, who encouraged me at times of failure, gave useful
advice, corrected errors, guided and supported me to the completion of my project,
accompanied me through the entire project, providing useful advice and encouraging me
when progress was slow.
The administration staff in the School of Engineering and Advanced Technology for their
cheerful and friendly support in all the administrative matters needed in my project.
iii

Table of Contents
Abstract.......................................................................................................................................i
Acknowledgements ..................................................................................................................iii
List of Figures..........................................................................................................................vii
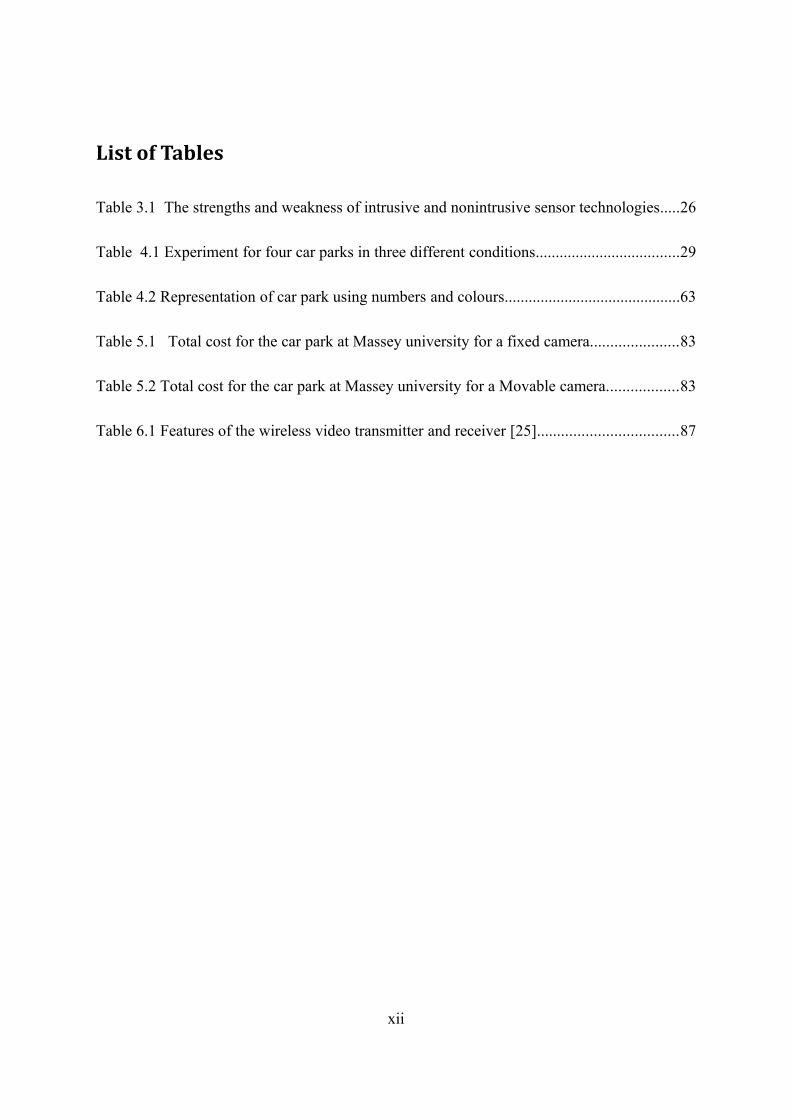
List of Tables............................................................................................................................xii
List of Abbreviations..............................................................................................................xiii
Chapter 1: Introduction .............................................................................................................1
1.1 Research topic....................................................................................................................................... 1
1.2 Scope of research................................................................................................................................. 1
1.3 The organisation of the thesis........................................................................................................ 3
Chapter 2: Literature review.......................................................................................................5
2.1 Advantages of a car parking management system.................................................................5
2.2 Safe, secure and easy for drivers................................................................................................... 6
2.3 Economical and efficient space utilization................................................................................6
2.4 Environmentally friendly parking system................................................................................ 7
2.4..1 Deciding how to use the system...............................................................................7
2.4.2 Categories of the car parking management system...................................................8
2.5 Requirements..................................................................................................................................... 12
2.6 Conclusion............................................................................................................................................ 13
Chapter 3: Investigation of the technology used for intelligent car park management ..........15
iv

3.1 Categorises of vehicle detection technology:.........................................................................15
3.1.1 Intrusive sensors:.....................................................................................................15
3.1.2 Non-intrusive sensors .............................................................................................21
3.2 Signal processing device................................................................................................................ 26
3.3 Data processing devices................................................................................................................. 27
Chapter 4: Proposed method ...................................................................................................28
4.1 Case study for four car parks in three different conditions.............................................28
4.1.1 Processing of template images...............................................................................30
4.1.2 Processing of template images...............................................................................35
4.1.3 Processing for decision............................................................................................40
4.2 Case study for 30 car parks........................................................................................................... 44
4.2.1 System initialization ...............................................................................................44
4.3.1 Spreadsheet with manually entered data displayed by a program...........................61
Chapter 5: Case study for a car park at Massey university......................................................67
5.1 Loading and converting images to HSV ................................................................................... 67
5-2 Complete morphological processing........................................................................................ 69
5.3 Loading template image................................................................................................................. 73
5.4 Extraction and calculation of the green circle.......................................................................76
5.5 Detect vacant parking lot and display the vacant parking lot........................................78
5.6 Showing the closest car park........................................................................................................ 79
v

Chapter 6: Communication system, architecture and components..........................................85
6.1 video camera with wireless transmitter and receiver.......................................................86
6.2 Image pre-processing module..................................................................................................... 87
6.3 Power sources.................................................................................................................................... 88
Appendix.................................................................................................................................94
vi

List of Figures
Figure 1-1 Intelligent car parking system management.............................................................2
Figure 2-1 Categories of the car parking management system..................................................8
Figure 2-2 The counter based system ........................................................................................9
Figure 2-3 Image based system [4]..........................................................................................10
Figure 2-4 Wired sensor based system [5] ..............................................................................11
Figure 2-5 Wireless based system [6] .....................................................................................12
Figure 2-6 Example of large car park ......................................................................................13
Figure 3-1 Inductive detector [4]..............................................................................................17
Figure 3-2 Pneumatic tubes [6] ...............................................................................................18
Figure 3-3 Magnetometer sensors [7] .....................................................................................19
Figure 3-4 The difference a metal object makes to the earth’s magnetic field [8] ..................20
Figure 3-5 Weight in motion detector system [9] ...................................................................21
Figure 3-6 Explanation of the operation of a microwave radar sensor [4] ..............................22
Figure 3-7 Ultrasonic sensors [10] ..........................................................................................23
Figure 3-8 Video image processor line of sight detection geometry [11] ...............................25
Figure 4-1 system module .......................................................................................................28
Figure 4-2 Parking image.........................................................................................................29
vii

Figure 4-3 Processing steps of template image........................................................................31
Figure 4-4 Template image......................................................................................................32
Figure 4-5 Template image converted to HSV........................................................................32
Figure 4-6 Red segment of image............................................................................................33
Figure 4-7 The green circle, showing their centre and middle obtained from circle detection34
Figure 4-8 Processing steps of edge images.............................................................................35
Figure 4-9 Parking image converted to HSV image................................................................36
Figure 4-10 HSV image showing how the background can be clearly found by looking at the
red value...................................................................................................................................37
Figure 4-11 Colour segmented image......................................................................................37
Figure 4-12 Grey segmented image.........................................................................................38
Figure 4-13 Images after morphological process.....................................................................39
Figure 4-14 Binary image.........................................................................................................39
Figure 4-15 picking a circle and relative position....................................................................40
Figure 4-16 Available and occupied car slots..........................................................................41
Figure 4-17 Cloudy Weather....................................................................................................42
Figure 4-18 Raining weather ...................................................................................................43
Figure 4-19 Sunny weather......................................................................................................43
Figure 4-20 Empty car park used to initialize the location of car parks..................................45
Figure 4-21 HSV image of empty car park..............................................................................45
Figure 4-22 Grey scale format of the HSV image....................................................................46
viii

Figure 4-23 Black and White images for empty car park........................................................47
Figure 4-24 Eroded image for empty car park.........................................................................48
Figure 4-25 Empty car park showing different colours for each object...................................49
Figure 4-26 Output for empty car park....................................................................................50
Figure 4-27 Car park with green dots for car park spaces........................................................51
Figure 4-28 Three dimensional graph of samples of RGB values from four images..............52
Figure 4-29 HSV image of a car park with cars.......................................................................52
Figure 4-30 Black and white image of HSV image.................................................................53
Figure 4-31 Left- real car park; right- black and white image for a light colours....................54
Figure 4-32 Car park image for dark cars................................................................................54
Figure 4-33 Combination of HSV, dark and light images.......................................................55
Figure 4-34 Dilated image........................................................................................................56
Figure 4-35 Eroded image........................................................................................................56
Figure 4-36 Output for a car park with cars showing the park that was not detected..............57
Figure 4-37 Undetected car......................................................................................................58
Figure 4-38 Comparison between the RGB image and the output produced from the HSV
image........................................................................................................................................58
Figure 4-39 GUI for car park image reader..............................................................................59
Figure 4-40 Images showing various modifications of an image............................................60
Figure 4-41 Excel spread Sheet of Massey car park using numbers to describe the areas......62
ix

Figure 4-42 Car Park Reader program showing approximately 50% of the car park being full
..................................................................................................................................................64
Figure 4-43 Car Park Reader program showing approximately 5% of the car park being full65
Figure 4-44 Car Park Reader program showing approximately 95% of the car park being full
..................................................................................................................................................66
Figure 5-1 Processing steps of detecting car lots in a car park................................................67
Figure 5-2 Car Park with some cars.........................................................................................68
Figure 5-3 Image in HSV colour with some cars ...................................................................68
Figure 5-4 Image after morphological......................................................................................69
Figure 5-5 Masked image with some cars................................................................................69
Figure 5-6 Binary image with some cars ................................................................................70
Figure 5-7 Black and white image for parking.........................................................................70
Figure 5-8 Grey image ............................................................................................................71
Figure 5-9 Grey Segmented image...........................................................................................72
Figure 5-10 Segmented images................................................................................................72
Figure 5-11 Template image for empty car park ....................................................................73
Figure 5-12 HSV of template image........................................................................................74
Figure 5-13 Black and white of template image ....................................................................74
Figure 5-14 Eroded image of template image ......................................................................75
Figure 5-15 Grey image of template image ............................................................................75
Figure 5-16 Red segment of image..........................................................................................76
x

Figure 5-17 Adaptive histogram of red....................................................................................77
Figure 5-18 Colour segmented image......................................................................................77
Figure 5-19 GUI for operators .................................................................................................78
Figure 5-20 GUI for users.....................................................................................................79
Figure 5-21 Image showing car park closest to entrance......................................................79
Figure 5-22 The locations of the cameras in Massey Universtiy car park...............................80
Figure 5-23 The field and angle of view for the camera at the lamp-post...............................81
Figure 6-1 Process of transferring images to the computer......................................................85
Figure 6-2 Video transmitter and receiver [24]........................................................................86
Figure 6-3 The design flow of an Image pre- processing module ...........................................88
Figure 6-4 Solar panel [27]......................................................................................................89
Figure 6-5 Outdoor power source for the car park ..................................................................89
Figure 6-6 Indoor power source for car park ..........................................................................90
xi
List of Tables
Table 3.1 The strengths and weakness of intrusive and nonintrusive sensor technologies.....26
Table 4.1 Experiment for four car parks in three different conditions....................................29
Table 4.2 Representation of car park using numbers and colours............................................63
Table 5.1 Total cost for the car park at Massey university for a fixed camera......................83
Table 5.2 Total cost for the car park at Massey university for a Movable camera..................83
Table 6.1 Features of the wireless video transmitter and receiver [25]...................................87
xii

List of Abbreviations
FPGA Field-Programmable-Gate-Array
GUI Graphical User Interface
HSV Hue Saturation Value
IDL Inductive Detector Loop
PAN Personal Area Network
PC Personal computer
RFID Radio Frequency Identification
RGB Red, Green and Blue
WIM Weigh-In-Motion
WSN Wire Sensor Network
xiii
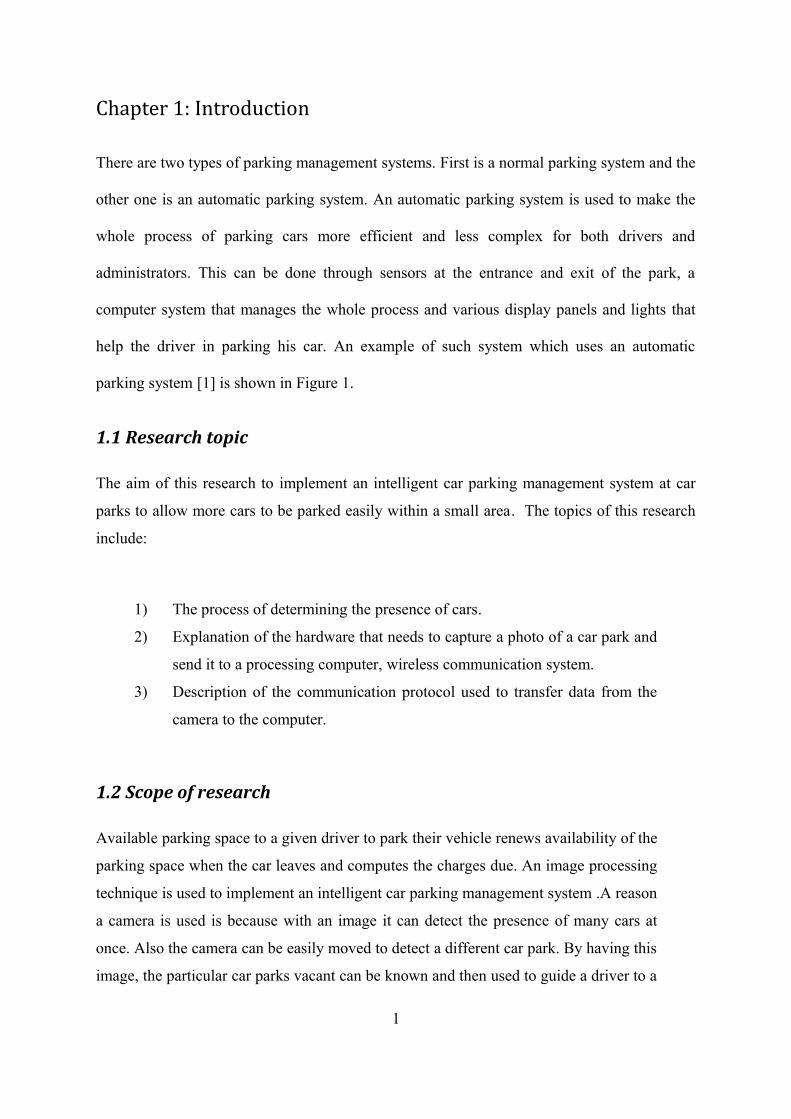
Chapter 1: Introduction
There are two types of parking management systems. First is a normal parking system and the
other one is an automatic parking system. An automatic parking system is used to make the
whole process of parking cars more efficient and less complex for both drivers and
administrators. This can be done through sensors at the entrance and exit of the park, a
computer system that manages the whole process and various display panels and lights that
help the driver in parking his car. An example of such system which uses an automatic
parking system [1] is shown in Figure 1.
1.1 Research topic
The aim of this research to implement an intelligent car parking management system at car
parks to allow more cars to be parked easily within a small area. The topics of this research
include:
1) The process of determining the presence of cars.
2) Explanation of the hardware that needs to capture a photo of a car park and
send it to a processing computer, wireless communication system.
3) Description of the communication protocol used to transfer data from the
camera to the computer.
1.2 Scope of research
Available parking space to a given driver to park their vehicle renews availability of the
parking space when the car leaves and computes the charges due. An image processing
technique is used to implement an intelligent car parking management system .A reason
a camera is used is because with an image it can detect the presence of many cars at
once. Also the camera can be easily moved to detect a different car park. By having this
image, the particular car parks vacant can be known and then used to guide a driver to a
1

car park. Software processes these images so that a driver or operator can know the
vacant car parks.
Figure 1-1 Intelligent car parking system management
2

Based on the literature survey of the research, the technologies available and the available
finance, the scope of this research includes:
1) An explanation of how the hardware captures a photo and sends it to a
processing computer.
2) A description of how the communication protocol is used to transfer data
from the camera to the computer
3) A method of finding the availability of a car park at Massey University will be
presented.
4) A Matlab program is going to be demonstrated that tested different occupancy
levels of car parks to show how a driver can be guided to the closest park.
5) A method of analysing an aerial view of the car park will be clearly shown
step by step.
6) The hardware and communication that could be used in the future will be
clearly presented [1-5].
1.3 The organisation of the thesis
The thesis contains 6 chapters. Each chapter has a short introduction to give an overview of
its content. Following is a summary of the chapters. Chapter 1 explains the topics of this
research by stating its requirements, objectives and scope. Chapter 2 provides the literature
review, showing the advantages of having a car parking system management that is safe,
secure and easy for drivers, is economical and efficient in its use of space, environmentally
friendly and principles to help the decision about how to use the system. Chapter 3 discusses
the categories of vehicle detection technology, methodology used in this research to localise
the car park lots and the requirements needed to implement the system. Chapter 4 continues
by presenting four cases of implementing the system. It firstly mentions for four car parks in
three different conditions. Finally, the process of implementing the system in a large car park
3

at Massey University by showing the steps of getting a template image and real image is
shown in chapter 4. Chapter 5 presents a case study for 148 car parks with its process.
Chapter 6 explains the methods of various communication systems, and the architecture and
components of the system. Chapter 6 concludes with the research’s future improvements and
conclusions.
4

Chapter 2: Literature review
Due to the increasing number of vehicles on the roads, traffic problems always exist. The
current car parks and transportation facilities are unable to cope with the increasing number
of vehicles so it is necessary to have a car parking management system in big cities. This
study is aimed at analysing a car parking management system in big cities.
2.1 Advantages of a car parking management system
Before implementing such a system, it’s benefit versus it’s cost needs to be considered. The
advantages of having a car parking management system as opposed to parking cars at an
unmonitored car park are listed below
1) Allows more cars to be parked easily within a small area.
2) Reduces traffic congestion & accidents inside car parks and therefore reduce
unnecessary use of cars.
3) Improved user options and quality of service
4) Improved design flexibility for areas requiring car parks,
5) Ability to accommodate new car park uses and respond to new demands.
6) Reduces detrimental environmental impacts.
5

There are some other advantages in terms of safety, security which makes it easier for
drivers. Also, economical and efficient space utilization and environmentally friendly parking
system [6-10].
2.2 Safe, secure and easy for drivers
By using a car parking management system, cars will spend less time moving around parts of
a car park that have no spaces available and will be able to drive directly to the correct car
parking space. Moving around car parks can be dangerous due to driver’s vision being
obstructed by other cars making it difficult to see other cars getting out of the car park or
pedestrians moving between cars. Therefore, reaching a car park quicker will remove
frustration among drivers and increase safety in the car park. This system will make parking
more convenient for drivers and also increase the safety of their vehicles as they are
monitored [11-13].
2.3 Economical and efficient space utilization
By using a car parking management system, cars can be allocated to a car park which can in
turn move cars by itself, using conveyor belts, to a specified place in the car park. By doing
this at least 30% more cars could fit into the area as compared to a conventional car park.
This also removes the need for so much ground area as people won’t need to climb stairways
or move around cars. This enables the car park to fit more cars in within the same area. This
would be especially useful in big cities where the area of land is expensive.
Although the system would cost money to maintain, expenses such as cleaning, ventilation,
lighting, and fire protection would be eliminated since the parking area is classified as an
“unoccupied” space [14-16].
6

2.4 Environmentally friendly parking system
By having a way of guiding vehicles within a car park, the amount that the cars will drive
within the car park will reduce. This will reduce the fuel used and the amount of toxic gases
such as carbon monoxide released into the atmosphere [17].
2.4..1 Deciding how to use the system
When deciding how to use a car parking management system, a number of general
principles are useful:
1. Drivers should have the ability to choose the most convenient car park that is
available.
2. Information about the car park’s availability could be given to users over the internet
or through the cellular network.
3. The automatic system should cater for multiple uses at the same time.
4. Have knowledge of the number of car parks needed so that car parks are not
unnecessarily built.
5. Flexibility - parking plans should accommodate uncertainty and change.
6. Prioritization - the most desirable spaces should be managed to favour higher-priority
users.
7. Pricing - As much as possible, users should pay directly for the parking facilities.
8. Peak management - special efforts should be made to deal with peak-demand.
9. Quality vs. quantity - parking facility quality should be considered as important as
quantity, including aesthetics, security, and accessibility and user information.
7

10. Comprehensive analysis - all significant costs and benefits should be considered in
parking planning [4], [19-20].
2.4.2 Categories of the car parking management system
The four main categories of the car parking management system using different technologies
[2] are shown in the figure 2-1.
Figure 2-2 Categories of the car parking management system
8

2.4.2.1 The counter based system
The counter based system uses sensors located at the entrance and exit of the car part to count
the number of cars that enter and leave the car park. This system simply calculates the
number of available car parks in a section of the car park by the number of parks less the
number cars that have entered the car park plus the number that has left it. Due to this, it
cannot guide a driver where to park [21-23]. Figure 2-2 illustrates how a counter based
system can display the number of available car parks on each level of a car park [3].
Figure 2-3 The counter based system
9

2.4.2.2 The image based system
The Image based technique uses a camera to take an image of the car park. This is useful
because with this image, the particular car parks which are vacant can be known and then
used to guide a driver to a car park. However, the amount of data captured from cameras is a
lot and sensors can be expensive [24-26]. An example of this system is shown in Figure 2-3
the left side shows the availability of car parks, the middle column, the GUI display and the
right column, the LCD display shown to the driver.
Figure 2-4 Image based system [4]
10

2.4.2.3 The wired Sensor based system
The wired sensor based system has ultrasonic sensors at each car park with wires carrying
their signal to a central processing unit. This system also provides data about the availability
of individual car parks but is expensive as many sensors are needed and a lot of wiring is
required [27-29]. Figure 2-4 illustrates an example of a wired sensor based system.
Figure 2-5 Wired sensor based system [5]
2.4.2.5 The wireless based system
A wireless based system uses nodes located around the car park that communicate their data
wirelessly. This eliminates the need for installation and maintenance costs and makes the
system more flexible. Figure 2-5 demonstrates an example of a wireless system. This system
uses nodes that have a light, acoustic, and temperature sensor and transmit their data over the
11

internet to a database where processing can be done and also to drivers who check on the car
park’s availability online [30-31].
Figure 2-6 Wireless based system [6]
2.5 Requirements
Some important requirements applied to having a sufficient car parking management system
that will make the project work smoothly are:
(a) The location of the car park should be easy to find in the street.
12

(b) The entrance of the car park should be easy to discover.
(c) There should be more than enough number of car parks, there should be a lot available
and each car park obtained should provide a large space to park a car in.
(d) Easy to exit and to re-enter on foot.
(e) Should be easy for the administrators and for the drivers [32-34].
Figure 2-6 illustrates an example of a convenient car park:
Figure 2-7 Example of large car park
2.6 Conclusion
From the discussion above, this differs from a car park with no monitoring of the cars which
exit and leave it. Although more expensive, a car parking management system helps to
remove congestion in a large car park where people may need to explore a bit to find a place
to park their car. 13

There are four main types of systems used when managing a car park: a counter based
system, in which cars entering and leaving the building are counted; an image based system,
where images are taken of the cars inside the car parking spaces; a wired system, having
sensors at each car parking spot that are wired to a central processing unit; and wireless
sensors that have nodes that take the data from several sensors and transmits it to a processor.
To detect cars entering and leaving a car park, either intrusion or non-intrusion sensors can be
used. Intrusion sensors require modification to be made either to the road or the side of it to
install the sensor to detect the vehicles. Non-intrusion sensors do not but often are more
costly and complicated.
The data from these sensors needs to be processed and sent to display units that give the
necessary information to drivers (e.g., the number of available car parks in a level of a car
park).
Each detector technology and particular device has its own limitations and individual
capability. The successful application of detector technologies largely depends on proper
device selection. Many factors impact detector selection, such as data type, data accuracy,
ease of installation, cost and reliability.
14

Chapter 3: Investigation of the technology used for intelligent
car park management
In order to implement a car parking management system sensors are required at the entrance
and exit of the car park. In some places sensors are also placed at the car parks themselves so
that information about where are car parks are vacant can be known. Since the data from
sensors may not be immediately useable by computers single processing is required so that
signals can be transformed into a form which computers can read. The information received
from all the sensors needs to be gathered and processed by a computer then sent to a display
unit or a monitor so that drivers can know where available car parks are [4-35-36].
3.1 Categorises of vehicle detection technology:
There are two main types of vehicle detection sensors which are: intrusive and non-intrusive
sensors. Intrusive sensors detect one vehicle at a time and placed below the vehicle or to the
side of where it will pass. Non-intrusive sensors can detect several vehicles at the same time
and be placed above at a place when many vehicles can be seen.
3.1.1 Intrusive sensors:
Intrusive sensors require a modification of the road or footpath beside it in order to detect
vehicles. This modification could include such things as cutting a hole in the road, tunnelling
under the road or attaching something on the side of the road. These modifications will
require traffic to stop using the road while this work is done. Since the sensors are placed by
the road, they will be in danger of being damaged by vehicles. Examples of intrusive sensors
15

include inductive loop, pneumatic road tube, Magnetometer, and Magnetic system sensors
[37-39].
3.1.1.1 Inductive detector loop (IDL)
An Inductive loop detector is the most common intrusive sensor. A coil is placed under where
the car will pass that has a signal with frequency with 10 to 50 Hz passing through it. When
the car drives over the coil the metal in it decreases the inductance in the coil which then
changes its frequency. When this frequency change is more than a certain threshold than a
signal a sent that indicates a vehicle has passed by the time that a vehicle requires travelling
between two detection points. Spot speed is measured by following equation:
Speed = (1)
Where,
= Distance between two loops in meters
= Vehicle entry time at first loop in sec
= Vehicle entry time at second loop in sec [8], [40]
Figure 3-1 shows this principle of Inductive Detector Loop
16

Figure 3-8 Inductive detector [4]
3.1.1.2 Pneumatic tube
A pneumatic tube is a simple and inexpensive method of counting cars that go past. A long
rubber tube, placed perpendicular to the road’s direction, is connected to a switch that can be
measured by a processing unit. When a car passes it, the air pressure in the tube closes the
switch thereby telling the processor that a car has passed. The disadvantage of this system is
that it is sensitive to temperature, produces inaccurate readings when many buses and trucks
pass it and can be easily vandalised. Figure 3-2 shows an example of a pneumatic Tube
system [42].
17

Figure 3-9 Pneumatic tubes [6]
3.1.1.3 Magnetometer sensors
The basic magnetometer consists of a sensor which produces a signal that is proportional to
the strength of the magnetic field around it as it is shown in Figure 3-3. Another type of
magnetometer uses a device called a fluxgate sensor. The fluxgate consists of a magnetic core
which is periodically hard saturated by a first coil (much like the proton liquid), while a
second coil senses the resulting electromagnetic field.
18

Figure 3-10 Magnetometer sensors [7]
3.1.1.4 Magnetic sensors
In the magnetic methods of car detection, the disturbance in the earth’s magnetic field caused
by cars is measured and used to detect cars. This is shown in Figure 3-4, the middle part of
Figure 3.4shows the magnetic field produced by a metal car and the right side of Figure 3-4
shows the effect of this to the earth’s magnetic field. The equation for it is shown in the
following:
(2)
19

where B is the field produced by the isolated coil and is the field change caused by the
layered system [44].
Figure 3-11 The difference a metal object makes to the earth’s magnetic field [8]
3.1.1.5 Weigh-in-motion (WIM)
WIM consists of a piezoelectric sensor laid in a channel across the road. It can be used in
specific locations for enforcement or access control. It is always combined with other
systems, either intrusive or non-intrusive, to provide additional cross-checks on collected data
[45].
Figure 3-5 shows that WIM detector consists of (bending-plate’ or fiber-optic).
20

Figure 3-12 Weight in motion detector system [9]
3.1.2 Non-intrusive sensors
The installation and maintenance of non-intrusive sensors do not affect the road on which
they monitor. This means that cars can still travel past the road on which they will monitor
while they are being installed or modified. Types of non-intrusive sensors include microwave
radar, passive acoustic array, passive infrared, RFID, and ultrasonic sensors. An image from a
video camera can also be used to detect cars [46].
3.1.2.1 Microwave radar
Microwave radar sensors emit an electromagnetic signal that has a frequency between 1-30
GHz and detects objects through their reflection of the signal as shown in Figure 3-6. It is
better than other sensors in rainy weather since it is not affected by the rain as much as other
sensors would be. It can detect vehicles travelling across multiple lanes and calculate the
speed at which they travel. However, without an additional sensor a microwave radar sensor
cannot detect stationary vehicles [47].
21

Figure 3-13 Explanation of the operation of a microwave radar sensor [4]
3.1.2.2 Active infrared sensors
Vehicles are detected using active infrared sensors in the same way as the microwave radar
through the reflection of an electromagnetic signal. Infrared signals have a much lower
frequency than microwave and are more sensitive to environmental conditions such as fog or
snow. An infrared sensor can emit multiple beams to detect the position and speed of cars
passing by more accurately [48].
3.1.2.3 Ultrasonic sensors
Ultrasonic sensors work in the same principle as microwave radar sensors. Their frequency is
above a human’s hearing range, between 25 and 50 kHz.
(3)
22

Where is the density of the fluid, the angular frequency, the velocity in the z-
direction and r = |x − y| is the distance between the evaluation point x and the source y on the
surface of S .An example of such a sensor is shown in Figure 3-8 Shows a picture of a typical
ultrasonic system setup [49].
Figure 3-14 Ultrasonic sensors [10]
3.1.2.4 Video image processing
One or more cameras are used for video image processing. Software is needed to process the
images taken by the cameras. This processing is usually done by examining the difference
between consecutive video frames. The area that a camera scans can be easily changed.
Figure 16 shows the detection distance at which a VIP can differentiate two closely spaced
vehicles along the surface of a road is a function of camera mounting height, inter-vehicle
23

distance or gap, and vehicle height. The maximum detection distance along a
roadway without a grade is given by
(4)
Where, h = camera mounting height,
= inter-vehicle gap, and
= vehicle height.
Other factors to be considered when installing cameras used in VIP systems include:
• Vertical and lateral viewing angles,
• Number of lanes observed,
• Stability with respect to wind and vibration, and
• Image quality [50].
24

Figure 3-15 Video image processor line of sight detection geometry [11]
Table 3.1 shows the strengths and weakness of intrusive and nonintrusive sensor technologies
[19]
25

Table 3.1 The strengths and weakness of intrusive and nonintrusive sensor technologies
Sensor Type Strength WeaknessMagnetometer Some types support wireless radio
making them portable Can handle difficult traffic conditions
Lanes need to be closed whenever they’re installedor maintained as pavement is cut. This cut
decreases the lifetime of the pavement
Magnetic Some types do not need a cut in thepavement and can be placed where
inductive loops cannot Can handle difficult traffic conditions
Cannot detect vehicles that are stationaryEither pavement needs to be cut or a tunnel made
under roadway
Inductive Loop Can detect the volume of traffic, gapsbetween cars and the presence of
stationary vehiclesTechnology being used for a long time
so manufacturers have muchexperience. Due to this there are many
designs that can be used in variousapplications
Often requires more than one device to detect carsat one location
Traffic problems and temperature can affectreadings
Pavement needs to be cut to install (same problemas magnetometer)
Microwave Radar Can detect vehicles travelling onseveral lanes of traffic and their speedNot usually affected by bad weather
Stationary vehicles cannot be detected
Ultrasonic Able to detect vehicles on more thanone lane
Large pulse repetition periods may degradeoccupancy measurement on freeways with vehicles
travelling at moderate to high speeds.Some environmental conditions such as
temperature change and extreme air turbulence canaffect performance. Temperature compensation is
built into some models.
Infrared Multiple lane operation available.Multizone passive sensors measure
speed.Active sensor transmits multiple beams
for accurate measurement of vehicleposition, speed, and class.
Passive sensor may have reduced sensitivity tovehicles in its field of view in rain and fog.
Video image
processor
Easy to add and modify detectionzones.
Provides wide-area detection wheninformation gathered at one cameralocation can be linked to another.
Rich array of data available.Monitors multiple lanes and multiple
zones/lane.
Inclement weather, shadows, vehicle projectioninto adjacent lanes, occlusion, day-to-night
transition, vehicle/road contrast, and water, saltgrime, icicles, and cobwebs on camera lens can
affect performance.cost-effective if many detection zones are required
within the field of view.
3.2 Signal processing device
The signals emitted by sensors need to be converted to a digital form that the computers that
process their signal can use. Many modern sensors have components that process the data
26

into various outputs that a computer can use. Often several sensors may be connected to a
microcontroller, a mini computer that takes in their data and sends it to the computer that
processes the information [21],[23].
3.3 Data processing devices
The data taken from all the sensors needs to be processed by a central computer and then
converted into data that can be shown to drivers. This data would include information such as
the available car parks in a section of the car park and how to guide a vehicle to an available
car park for systems that provide guidance [24],[25].
27

Chapter 4: Proposed method
This chapter describes the use of a car parking management system in many scenarios in
Palmerstone North and the Massey University car park.
The video image technique has five modules [12], they are shown in Figure 4-1
Figure 4-16 system module
4.1 Case study for four car parks in three different conditions
Most car parks today are not run efficiently. This means that on busy days drivers may take a
long time driving around a car park in order to find a free parking space. There are numerous
methods of detecting cars in a car park such as Magnetic sensors, Microwave Radar,
Ultrasonic sensors and image processing. This project describes the process of determining
28

the presence of cars at car spots from a camera image at the Massey university car park.
There are two different methods of implementing this system: either applying point detection
with the canny operator method or applying the edge detection with the boundaries condition
method for image detection module. In this project Matlab is used as software. A row at the
Massey car park is shown in Figure 4-2
Figure 4-17 Parking image
The images were all taken in different times and different conditions as they are shown in
Table 4.1.
Table 4.2 Experiment for four car parks in three different conditions
No ofEXP
Date Time7am-5pm
Condition Total Of CarPark
1 16/6 10 Sunny 4
2 19/6 11 Cloudy 4
3 27/6 8 Rain 3
4 4/7 12 Sunny 4
5 5/7 3 Cloudy 4
29

6 9/7 9 Rain 3
7 15/7 7 Sunny 4
8 19/7 12 Rain 3
9 20/7 4 Cloudy 4
10 27/7 2 Rain 3
11 4/8 10 Cloudy 4
12 6/8 1 Sunny 4
13 9/8 5 Sunny 4
14 11/8 2 Rain 315 15/8 8 Cloudy 4
16 20/8 3 Cloudy 4
17 25/8 11 Rain 3
18 1/9 5 Sunny 4
19 3/9 1 Cloudy 4
20 9/9 9 Sunny 4
4.1.1 Processing of template images
The aim of this project is to detect the existence of any car in each park slot. It is required to
prepare a template image which shows the location of each parking slot. The Processing of
preparing a template Image technique has five steps [13] as they are shown in Figure 4-3.
30

Figure 4-18 Processing steps of template image
4.1.1.1 Acquire image
First an image of the car park could be taken when there are no cars in the car park as is
shown in Figure 4-4. This would be used for the system to record the location of all the car
parks. The RGB value can be used to find where green circles are that represent empty car
spaces. With these the system will know where to look for cars in the future.
31

Figure 4-19 Template image
4.1.1.2 Convert image to HSV
For the empty car park, to get the location of the green dots, the image is converted into an
HSV image as is shown in Figure 4-5. This is done through using the ‘rgb2hsv’ command in
Matlab.
Figure 4-20 Template image converted to HSV
4.1.1.3 Extract green circles
Green circles can be extracted by choosing certain values of pixels H, S and V.
32

In this case a range of pixels is set so that pixels in this range will be extracted.
4.1.1.4 Circle detection
The circle detection processes require the Hough transform. The Hough transform is a feature
extraction technique that will be used to extract the circles, their radii, along with their
centres.
4.1.1.5 Red pixels
First of all the red segment of the image is extracted because as we know, red pixels are the
most powerful segment of the image as it is shown in Figure 4-6.
Figure 4-21 Red segment of image
4.1.1.7 Eliminate noise
If there are objects in the environment that have the same value of red pixels that will be
displayed in the extracted image as well. This will be noise for the extracted image and may
create an inaccurate result to be obtained when using the Hough Transform. Therefore, parts
that do not match the shape of the dot or circle that is being looked at should be trimmed
away.
33
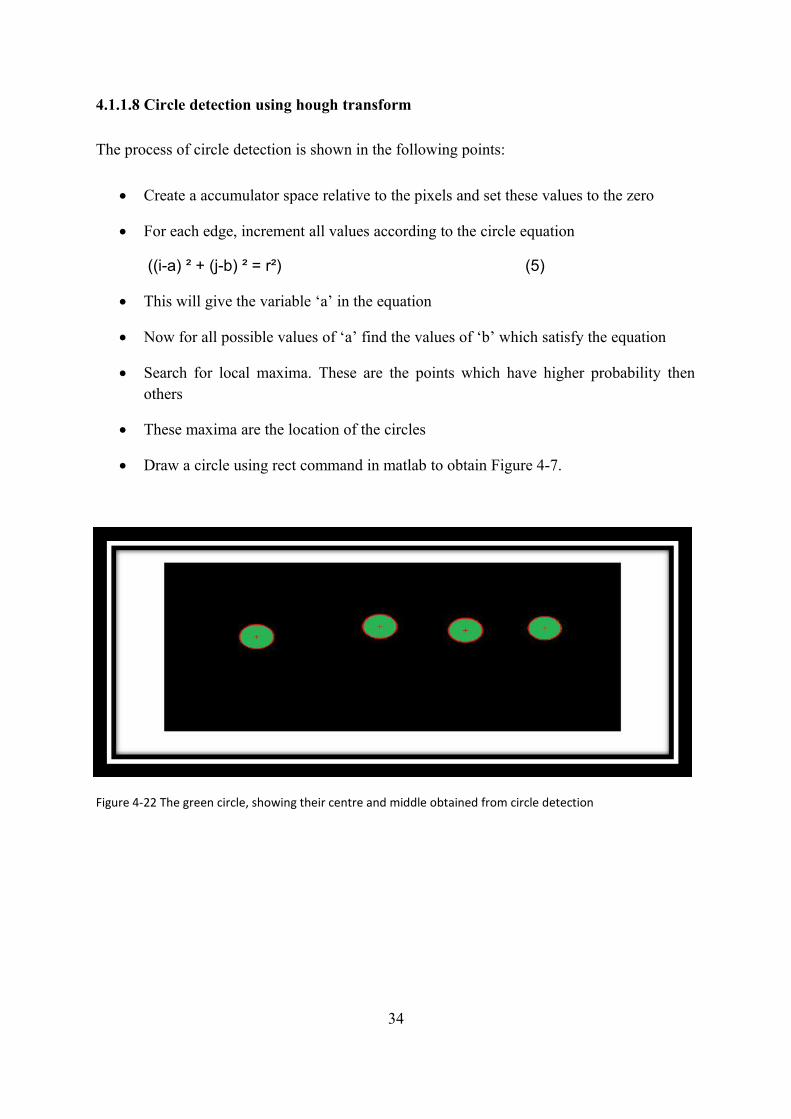
4.1.1.8 Circle detection using hough transform
The process of circle detection is shown in the following points:
Create a accumulator space relative to the pixels and set these values to the zero
For each edge, increment all values according to the circle equation
((i-a) ² + (j-b) ² = r²) (5)
This will give the variable ‘a’ in the equation
Now for all possible values of ‘a’ find the values of ‘b’ which satisfy the equation
Search for local maxima. These are the points which have higher probability thenothers
These maxima are the location of the circles
Draw a circle using rect command in matlab to obtain Figure 4-7.
Figure 4-22 The green circle, showing their centre and middle obtained from circle detection
34

4.1.2 Processing of template images
There are many ways to differentiate different objects and extract them but all the processes
have their limitations. A process considered here is back ground eliminations. As many car
parks have the same road which here is defined as its background. The background can be
extracted and hence objects like cars can easily be detected. The Processing of Edge Image
technique has five steps [13] as they are shown in Figure 4-8.
Figure 4-23 Processing steps of edge images
4.1.2.1 Converting to HSV
First the image is converted to HSV because it is easy to differentiate different coloured
pixels in HSV space. In the Figure 4-9, it can be clearly seen that the red looking colours are
back ground.
35

Figure 4-24 Parking image converted to HSV image
By looking at the pixels in the Figure 4-10 it becomes clear that pixels for the background fall
within a specified range of colours. By executing the following code, the background can be
obtained.
hue = (Img_HSV(:,:,1) >= 0) & (Img_HSV(:,:,1) <= .9);
saturation = (Img_HSV(:,:,2) >= .01) & (Img_HSV(:,:,2) <= .1);
value = (Img_HSV(:,:,3) >= .2) & (Img_HSV(:,:,3) <= 0.55);
Temp = uint8(hue & saturation & value);
Temp = imclose(Temp, strel('disk', 5));
Red_pixel = Temp .* Org_Img(:,:,1);
Green_pixel = Temp .* Org_Img(:,:,2);
Blue_pixel = Temp .* Org_Img(:,:,3);
Color_Img = cat(3, Red_pixel, Green_pixel, Blue_pixel);
36

figure,imshow(Color_Img)
title('color segmented image')
Figure 4-25 HSV image showing how the background can be clearly found by looking at the red value
The object is eliminated In the Figure 4-11
Figure 4-26 Colour segmented image
37

The image is converted to a grey image as shown in Figure 4-12
Figure 4-27 Grey segmented image
4.1.2.2 Morphological processing
This is non-linear process which is related to shape and morphology of image. It is relative to
ordering of pixel value not their numerical values as it is shown in the Figure 4-13
se=strel('disk',2);
I=imopen(Gray_img,se);
disp('Morphological process completed')
figure,imshow(I)
title('Image after Morphological process')
% I=imfill(I,'holes');
38

% se=strel('disk',5);
% I=imopen(I,se);
Figure 4-28 Images after morphological process
Then the image is converted to binary image as it is shown in the Figure 4-14.
Figure 4-29 Binary image
39

4.1.3 Processing for decision
The images of both the car parking template and the car park are now processed. The Car
parking template image contain the locations of car parking in the lot as a circle and the
information about circle radius and its centre is also known. The car park image after its
processing now contains road images and has eliminated any other objects.
An algorithm is set to check whether at a particular parking lot an object is present or not. It
can be simply checked by seeing the pixel value at a particular parking lot. For example as it
is seen in the Figure 4-15 ,the first image pick a circle and see it’s relative position to the
second image, if the second image contains a white space then the parking lot is empty if it
contains a black pixel then the space is occupied.
Figure 4-30 picking a circle and relative position
4.1.3.1 Drawing the empty space
In this algorithm free parking lot is calculated it can be drawn simply be drawn using
rectangle command in mat lab as it is shown in the Figure 4-16
figure,imshow(Org_Img);
hold on;
40

% plot(circen(:,1), circen(:,2), 'r+');
i=1;
for ii = 1 : size(circen, 1)
if (I(round(circen(i,2)),round(circen(i,1)))~=0)
rectangle('Position',[circen(ii,1) - cirrad(ii), circen(ii,2) - cirrad(ii), 2*cirrad(ii),
2*cirrad(ii)],...
'Curvature', [0.8,0.4], 'edgecolor', 'b', 'linewidth', 1,'FaceColor','b');
end
i=i+1;
end
hold off;
disp('Displayed free parking lot')
Figure 4-31 Available and occupied car slots
41

4.1.3.2 Car park display (Monitor)
To test different scenarios of car parking for four parks, a program was made that generated
car park positions which were empty and filled cars in different weather conditions. In this
way, the graphical user interface could be tested with a differing number of cars parks in
different positions. When the weather is cloudy the GUI will be as shown in Figure 16.
If the user wants to see what the car park would look like when it is raining. This would
produce Figure 4-17.
Figure 4-32 Cloudy Weather
If the user wants to see what the car park would look like when it is raining. This would
produce Figure 4-18
42

Figure 4-33 Raining weather
If the weather is clear the car park would look like as it produce in Figure 4-19
Figure 4-34 Sunny weather
43

4.1.4 Conclusion
A method of finding the availability of four parks has been presented. A Matlab program has
been demonstrated that tests different scenarios which are cloudy, raining and sunny. A
method of analysing an aerial view of the Template Images and Edge Images has been
presented step by step. This consists of acquiring image , converting the image HSV,
extracting green circles, circle detection, getting red pixels ,removing noise, applying
morphological processing and determining whether car parks are vacant or filled [4].
4.2 Case study for 30 car parks
4.2.1 System initialization
First an image of the car park could be taken when there are no cars in the car park as in
Figure 4-20. This would be used for the system to record the location of all the car parks. The
RGB value can be used to find where green circles are that represent empty car spaces. With
these the system will know where to look for cars in the future [13].
44

Figure 4-35 Empty car park used to initialize the location of car parks.
For the empty car park, to get the location of the green dots, the image is converted into an
HSV image as is shown in Figure 4-21. This is done through using the rgb2hsv command in
Matlab.
Figure 4-36 HSV image of empty car park.
45

This is simplified to a black and white binary image that is easier to deal with by making the
pixels white where the threshold is more than 40%. In order to do this the HSV image needs
to be converted to a grey scale format so that each pixel can be easily compared with the
threshold as it is shown in Figure 4-22. [14] The equation to do this is shown in equation 6.
The rgb2gray command is used to do this.
Grey = (0.299*R + 0.587*G +114*G) (6)
Figure 4-37 Grey scale format of the HSV image
As can be seen from Figure 4-23 the green circles are noticeably lighter than anything else in
the image. Therefore the image can be easily converted to a black and white image by using
im2bw command with the second argument being 0.4. This means if the pixel is less than the
threshold the colour of it will be black. Otherwise it will be white [16].
46

Figure 4-38 Black and White images for empty car park
As can be seen in Figure 4-23, there are some small white parts of the image. These can be
removed by using the erode function as it is shown in Figure 4-24. The imerode command is
used to remove the small dots in the image. The object used to erode the image was created
through using the following command:
se3 = strel('disk', 3)
This creates a disc with a radius of three that is used by the erode function. The result of
using this function is shown in Figure 4-24 [52].
47

Figure 4-39 Eroded image for empty car park.
The bwlabel command is used to give different values to separate objects. For example the
first object is composed completely of 1s and the second of 2s. As a result an image can be
created with different colours for each object as shown in Figure 4-25 [18]. In order to find
the coordinate of each car park, represented by the green circles, the top, bottom, left, and
right edges needed to be found. In order to find the left edge of each object the program starts
to the top left corner and goes down column by column. When a value greater than zero is
reached, then a matrix that stores all the left edges is queried to find whether that an object
has been detected already. The matrix, named ‘e’, stores the edges by using the index
specified by the bwlabel function mentioned previously. Therefore if at the index indicated
by pixel itself, an 0 is present, then that object has not been seen before. In this case, the x
current coordinate is stored as the left edge of the object. The following code shows how this
is done:
if (newmatrix(y,x) > 0) %an object is there
if (e(newmatrix(y,x)) == 0) this object has not been seen
48

e(newmatrix(y,x)) = x; make the value and index 3 equal to the current X
coordinate.
end
end
Figure 4-40 Empty car park showing different colours for each object.
These coordinates will be used when analysing an image with cars in it as described in the
following sections [53].
The values of the coordinates are divided by 1.5 times the average diameter of each dot. Each
of these car parks slots is given the same value and are displayed in a pcolor chart as shown
in Figure 4-26.
49

Figure 4-41 Output for empty car park
4.2.2 Image acquisition
A camera placed at a fixed position above the cars will be used to acquire the image used to
calculate the vacancy of the car parks. This camera should be in a position where it can
clearly see all the car parks and not be obstructed by any objects. Figure 4-27 shows an
example of what an image may look like.
50

Figure 4-42 Car park with green dots for car park spaces
4.2.3 Image segmentation
There are many different ways to differentiate the different objects (cars, dots, surface, white
road markings) in an image. One way is to take a sample of the RGB image and see where
clusters form in a 3 dimensional graph. This was done for four images and produced Figure
4-27. As it can be seen in Figure 4-28 the red dots form a cluster which means they could be
easily distinguished from other objects. These represent the green dots. These dots are all
high in green and low in blue. A cube could be made that encompasses only these dots. Then,
if the average colour of an object is within this cube, it could be said that it is a green dot.
51

Figure 4-43 Three dimensional graph of samples of RGB values from four images.
A simpler method of finding the green dots was found as explained in the previous section.
This involved using the HSV image of the car park. As it can be seen in Figure 4-29, the
empty car parks are still very bright compared with other objects.
Figure 4-44 HSV image of a car park with cars
52

This image was converted to a grey image and then to a black and white image (Figure 4-30)
by using the same 40% threshold mentioned in initialization section [31].
Figure 4-45 Black and white image of HSV image.
To avoid getting the surface of the car park, which is grey, the bright and dark colours are
obtained.t. To detect light colours such as white (to get white cars and white road markings) a
high threshold of 70% is used to form a black and white image as shown in Figure 4-31.
53

Figure 4-46 Left- real car park; right- black and white image for a light colours.
Dark colours are detected by using a threshold of 10% and inverting the result. This is done
in Matlab using
~im2bw(C, 0.1)
where ‘C’ refers to the RGB image and ‘~’ refers to the invert symbol as it is shown in the
figure 4-32.
Figure 4-47 Car park image for dark cars
54

In order to see all the objects the three black and white images are combined. This is done by
using the OR function as shown in the code below (where ‘|’ is the OR operator):
mix = HSVBWObject | lightObject | DarkObject;
The combination of the three shown in Figure 4-33.
Figure 4-48 Combination of HSV, dark and light images
4.2.4 Image enhancement:
After obtaining the segments for the objects used, the noise in the image needs to be
removed. This can be done through dilation and erosion. Dilation increases the boundary of
the objects in the image. This causes a problem in this image as shown in figure 4-34. The
problem is that objects merge together so it is hard to distinguish one object from another.
However this is good to fill up holes in objects.
55

Figure 4-49 Dilated image
Erosion decreases the boundary of the objects so that they can be easily distinguished from
one another. Figure 4-35 demonstrates the usefulness of this function. After erosion objects
are more distinguishable from each other and small dots are removed. This prepares the
image to identify whether parks are empty or filled.
Figure 4-50 Eroded image
56

4.2.5 Image detection module
By using the coordinates found in the initialization of the car park, each car park slot can be
analysed to determine whether a car is there or not. There were three methods used to
determine whether car parks were full or not. If the height, width or size of the connected
object at the car park coordinates were either too big or too small then the object was
considered to be a car. In this case the car park was given the value 5 meaning it is occupied.
This information was displayed as shown in Figure 4-36. One car was not detected using this
method due to its having a black window screen with the sun shining off part of it which was
a grey colour as shown in Figure 4-37.
Figure 4-51 Output for a car park with cars showing the park that was not detected
57

Figure 4-52 Undetected car
The above figures used the combination of HSV, light and dark black and white images.
When only the HSV image was used a better output was produced as shown in Figure 4-38
where there are no mistakes.
Figure 4-53 Comparison between the RGB image and the output produced from the HSV image
The GUI used to run the matlab program that opens the image and produces an output as is
shown in Figure 4-39. The method to use to prepare the image for display can be typed and
the user can specify the file path for the image to read. The program also generate it 10
images that shows various ways of manipulating the image as is shown is Figure 4-40.
58

Figure 4-54 GUI for car park image reader
59

Figure 4-55 Images showing various modifications of an image
4.2.6 Conclusion
A method of finding the availability of a car park at Massey University has been presented. A
Matlab program has been demonstrated that tests different occupancy levels of car parks to
show how a driver could be guided to the closest park. A method of analysing an aerial view
of the car park has been presented step by step. This consists of finding car park coordinates
from an empty car park, acquiring an image with cars, converting the image to black and
white for simple analysis, removing noise and determining whether car parks are vacant or
filled. The hardware and communication that could be used in the future has been presented.
In the future a real camera will need to be set up to take images of a real car park that will be
60

sent to a computer for processing. Image processing methods will need to be improved to
become more robust to cope with various different images.
4.3 Case Study for Massey car park
It would be helpful for a driver or car park operator to see an aerial view of the car park
showing which car parks are empty and which are occupied.
4.3.1 Spreadsheet with manually entered data displayed by a program
To test this, a Matlab program opening an excel spreadsheet was made. The data in the
spreadsheet consisted merely of numbers that indicated different parts (entrances, non-
parking areas, exits) and states (empty or full) of the car park. An Excel spreadsheet was
made to represent the Massey University main car park as shown in Figure 4-41. In this way,
a spreadsheet can represent the data processed from a photo of the car park.
61

Figure 4-56 Excel spread Sheet of Massey car park using numbers to describe the areas
Matlab opened this spreadsheet and stores its data into a matrix of numbers. This data is then
displayed on a figure using the ‘pcolor’ command which simply plots a figure with different
colours for different numbers in its array.
This command does not display the first row and the first column of the matrix it uses.
Therefore a new row and a new column were added to the beginning of the matrix. The code
to do this is shown below:
62

% Processing matrix to be displayed by pcolor% ‘m’ stores the number of rows and ‘n’ stores the number of columns[m,n] = size (newmatrix);% new row and column are needed as they are not used by pcolor% create an empty row for datanewrow = zeros(1, n);% create an empty column for datanewcolumn = zeros (m + 1, 1);% new data has an extra rownewdata = [newrow; newmatrix];% new data has an extra columnnewdata = [newdata newcolumn];% flip data vertically (using flipud) so that it is seen the same way % as displayed in thespreadsheetflipdata = flipud(newdata);% display flipped data h = pcolor(flipdata);
Table 4.2 shows the different numbers used to represent different states and parts of the car
park. The colour of the writing shows the colour ‘pcolor’ displays for that particular number.
Table 4.3 Representation of car park using numbers and colours
Number Representation0 Empty car space5 Full car space3 Car park entrance7 Car park exit2 Closest empty car park to the entrance
(empty) Road space (white colour)
4.3.2 Different scenarios tested
To test different scenarios of car parking, a program was made that randomly generated car
park positions. In this way, the graphical user interface could be tested with differing number
of cars parked in different positions.
In the program made, the approximate percentage of full car spaces in the car park can be
specified by the user. The program then randomly generates a number from 0 to 1 and
compares it with the percentage value the user gave (which is made from 0 to 1 too). Through
63

this, the car park is filled with a random arrangement of car parks according to the percentage
specified by the user. This allows different scenarios to be quickly tested.
Figure 4.42 shows the basic form of the program made using Matlab. On the left side is the
option for changing the number of full car parks and a key showing what each colour
represents. Below the filled and empty car park key, the number of actual filled and empty
car parks is displayed. As can be seen from Figure 4-42, although the car park is set to be
filled approximately 50%, since the data is random, the actual number of filled cars is less
than 50%.
Figure 4-57 Car Park Reader program showing approximately 50% of the car park being full
If the user wants to see what the car park would look like with few cars they could set the
percentage to be 5 %. This would produce Figure 4-43
64

Figure 4-58 Car Park Reader program showing approximately 5% of the car park being full
If the user wants to see what the car park would look like with many cars they could set the
percentage to be 95 %. This would produce Figure 4.44. This would be useful for a user to
quickly find the best car park to go to when at an entrance.
65

Figure 4-59 Car Park Reader program showing approximately 95% of the car park being full
4.3.3 Conclusion
A simple program has been presented that can produce a simple GUI from a manual
spreadsheet of data and another that randomly varies the position of cars in a car park
depending on the full level you require.
66

Chapter 5: Case study for a car park at Massey university
The objective of this Case is to detect the existence of any car in each park slot at Massey
university. It is required to prepare a template image and edge Images which show the
location of each parking slot. The Processing of this project [4] is shown in the Figure 5-1.
Figure 5-60 Processing steps of detecting car lots in a car park.
5.1 Loading and converting images to HSV
An image of the car park could be taken when there are some cars in the car park as is shown
in the Figure 5-2.
67

Figure 5-61 Car Park with some cars
In the Figure 5-3 It shows that the pixels become clear that pixels for the background fall within a specified range of colours.
Figure 5-62 Image in HSV colour with some cars
68

5-2 Complete morphological processing
This is non-linear process which is related to the shape and morphology of the image. It is
relative to ordering of pixel value not their numerical values as is shown in the figure 5-4 .
Figure 5-63 Image after morphological
Then the image is converted to Masked Image as is shown in the Figure 5-5
Figure 5-64 Masked image with some cars
69

After that the image is changed to Binary image as is shown in the Figure 5-6
Figure 5-65 Binary image with some cars
Then the image is converted to the Black and White as is shown in the Figure 5-7
Figure 5-66 Black and white image for parking
70

Then the image is converted to the Grey Image as is shown in the Figure 5-8
Figure 5-67 Grey image
After that image is converted to the Grey Segmented as is shown in the Figure 5-9
71

Figure 5-68 Grey Segmented image
After that image is converted to the Segmented Image as is shown in the Figure 5-10
Figure 5-69 Segmented images
72

5.3 Loading template image
The image of the car park could be taken when there are no cars in the car park as is shown in
the Figure 5-11. This would be used for the system to record the location of all the car parks.
Figure 5-70 Template image for empty car park
The RGB value can be used to find where the green circles are that represent empty car
spaces as is shown in the Figure 5-12.With these the system will know where to look for cars
in the future
73

Figure 5-71 HSV of template image
After that the Template image is converted to the Black and White Image as is shown in the Figure 5-13
Figure 5-72 Black and white of template image
After that the Template image is converted to the Eroded Image as it shown in the Figure 5-14
74

Figure 5-73 Eroded image of template image
After that the Template image is converted to the Gray Image as is shown in the Figure 5-15
Figure 5-74 Grey image of template image
75

5.4 Extraction and calculation of the green circle
Green circles can be extracted by choosing certain values of pixels H, S and V.
In this case a range of pixels is set so that pixels in this range will be extracted. The circle
detection processes require the Hough transform. The Hough transform is a feature extraction
technique that will be used to extract the circles, their radii, along with their centres. First of
all the red segment of the image is extracted because as we know, red pixels are the most
power full segment of the image as is shown it the Figure 5-16
Figure 5-75 Red segment of image
Then the image is adapted to the Histogram of Red as is shown in the Figure 5-17
76

Figure 5-76 Adaptive histogram of red
The image is extracted to the colour segmented Image as it is shown in the Figure 5-18
Figure 5-77 Colour segmented image
77

5.5 Detect vacant parking lot and display the vacant parking lot
To test different scenarios of a car parking lot a program was made that generated car park
positions with empty and filled cars In this way, the graphical user interface could be tested
with differing number of cars parks in different positions for the operators and users as is
shown in the Figure 5-19
Figure 5-78 GUI for operators
The graphical user interface could be tested with differing number of cars parks in different positions
for the users as it shown in the Figure 5-20
78

Figure 5-79 GUI for users
5.6 Showing the closest car park
An addition was made to the program so that it would show the closest car park to the
entrance. The car park entrance was made to be the top left and bottom left corner of the
image in the example shown in Figure 5-21
Figure 5-80 Image showing car park closest to entrance
5.7 Showing the locations of the cameras in the lamp-posts
There are 12 parallel lines in the park. The total numbers of the car lots are 764. Also there
are 14 lampposts are already in the park ,the high of each lamp is 5 m. each lamp can cover
60 cars slots by 1 camera angle which is half of the two parallel lanes, 2 cameras are required
79

to cover 2 parallel lanes so 12 parallel lanes can covered by 12 cameras. The locations of the
cameras in the lampposts and the capturing area for each camera are shown in Figure 5-22.
Figure 5-81 The locations of the cameras in Massey Universtiy car park
The total cameras which are needed to cover the whole park are 13 cameras. The Figures 5-23
shows what the field and angle of view are for one camera at the lamp-post.
80

Figure 5-82 The field and angle of view for the camera at the lamp-post
81

5.8 Estimated cost for the proposed system
To build the system which captures and notifies a user which car parks are available, several
components are necessary. There are three main places where the components of the system
will be: the camera at the car park, the entrance of the car park where a display for a driver to
be directed by will be and the station of an operator, who manages the system. The last two
components will be similar. They both will receive information from the camera process it,
and display it to a human user. The first component has two options either applying a fixed
camera or a movable camera. The fixed camera process unit will consist of a fixed camera
and a transmitter. The movable camera process will consist of a movable camera, motor,
microcontroller and a transmitter. The Lamp-post power supply will provide a power to the
camera system where it is fixed or movable. The camera will draw a continuous supply from
the Lamp-post's source and send continuous data through the transmitter (also powered by the
Lamp-post). For a fixed camera, there will be 13 transmitters and 39 cameras. The cost will
be 455 NZD and 2340 NZD respectively. That would make a total of 2795 NZD for the
camera circuit. For a moveable camera, there will be 13 transmitters, 13 cameras, 13 motors
and 13 microcontrollers. The cost will be 455 NZD, 780 NZD, 325NZD and 624 NZD
respectively. That would make a total of 2184 NZD for the camera circuit. The last two
components will be similar for a fixed camera or a movable camera. At the entrance of the car
park, there'll need to be some sort of display to indicate to the user where the available car
parks are and preferably indicate the best one to go to. This display will need a receiver to
receive information from the camera, a computer to process it and a computer for the operator
who manages the system. This may be powered by the main gird. Two cheap monitors, two
simple computers and two receivers. This would cost 250NZD, 600NZD and 200 NZD to
make a total of 1050 NZD. This would make this cheaper.
82

Table 5.1 shows the cost for the car park at Massey university if a fixed camera is applied and
table 5.2 shows the cost for the car park at Massey university if a moveable camera is
applied.
Table 5.4 Total cost for the car park at Massey university for a fixed camera.
Component Quantity Cost of Each Total
Camera 39 60 2340
Transmitter 13 35 455
GUI 2 125 250
Computer 2 300 600
Receiver 2 100 200
Total 3845NZD
83

Table 5.5 Total cost for the car park at Massey university for a Movable camera.
Component Quantity Cost of Each Total
Camera 13 60 780
Transmitter 13 35 455
Motor 13 25 325
Microcontroller 13 48 624
GUI 2 125 250
Computer 2 300 600
Receiver 2 100 200
Total 3234NZD
Obviously, the higher up a camera can go and the better resolution it has, the more cars a unit
can see, and therefore the less cameras are needed.
Different transmitters will have different frequencies sending the data different ranges. Which
frequency is used to transmit a signal would depend on the distance from a car park to an
operator. When the distance from the car park cameras to the entrance of the car park or to the
operator of it are large, repeaters may be useful. Repeaters simply receive the signal and
amplify it so that it travels further.
84

Chapter 6: Communication system, architecture and
components
In order to transfer the image to the computer, a wireless system is used. This is composed of
a video camera that captures the image, a transmitter sends the images to the receiver in the
control room, the receiver will send signals to a computer, the computer will process the
signals and send them to the indoor transmitter. The computer has a FPGA platform attached
that creates a filter to filter out the noise in the image [4]. The indoor transmitter sends the
signals wirelessly to the receiver attached with the monitor or display [22] as it is shown in
Figure 6-1.
Figure 6-83 Process of transferring images to the computer
85

6.1 video camera with wireless transmitter and receiver
To transmit video images and data from a video camera to a PC, an in-expensive compact
wireless video camera is used to transmit video from one location to another without using
traditional expensive and messy wiring; this is shown in Figure 6-2. It has the benefit of
working with all types of AV devices like video camera (NTSC or PAL), TV, recorder and so
forth. The transmission range is up to 1,000 feet (300 metres) with high gain omni-directional
antenna of 12 db Bi gain or higher, or 3000 feet (3 km) with Yagi or some other high gain
directional antennas. Table 6.1 shows more Features about wireless video transmitter and
receiver [54-56].
Figure 6-84 Video transmitter and receiver [24]
86

Table 6.6 Features of the wireless video transmitter and receiver [25]
Profile Receiver Transmitter
Demodulation/Modulation FM
AV output/input RCA output jacks for video and audio RCA input jacks for video and audio
Number of channel 4 channels. Selectable by switch.
Antenna connector SMA (F)
Antenna included standard antenna - SMA (M)
Antenna length 11.8 cm foldable
Operating power DC 12V (100~240V regulated power supply included)
Dimensions 80(W) x 115(D) x 20(H) mm 60(W) x 35(H) x 63(D) mm
Weight 149 gm 163 gm
Video output/input 75 Ohm 1V p-p
Power voltage/consumption DC12V / 350mA DC12V / 500 mA 0.6A
Sensitivity/Output power Sensitivity: -90 dBm Output power: 1W
Impedance 50 Ω
Preset channel frequencies Channel 1: 1080, Channel 2: 1120, Channel 3: 1160, Channel 4: 1200 <in MHz>
Highest resolution supported
NTSC: 768(H) x 494(V) / PAL: 752(H) x 582(V)
Operating temp/RH -10~+50°C / 20~80%
Transmission distance
Distance may vary substantially depending on the actual operating environment. Line of sight transmission range up to 1,000 feet (300 meters) with high gain omni-directional antennas of 12dBi gain or higher, or 1.8 miles (3 km) with Yagi or otherhigh gain directional antennas.
6.2 Image pre-processing module
An Image Pre-processing module is mostly about the design of filter. It is achieved in the
FPGA. The whole design [26] is shown in Figure 6-3. A filtering window creating module
creates filtering windows that are required by the use of follow-up modules. The noise
estimate module estimates the type of noise, so that the best kind of filtering approach can be
decided [32]. It counts the rows and columns of the input data to determine whether the87

window can be legitimately done by the counter’s function and then to count the lawful
window data to determine the output data in an image location. The last image data are sent
to the next level of processing equipment [55-58].
Figure 6-85 The design flow of an Image pre- processing module
6.3 Power sources
The lifetime of the video camera, transmitter, receiver, PC and the monitor depends on the
power source. In this project a lamppost power is used as an outdoor power source. It
supplies the power to the transmitter, receiver and monitor through a 12v DC battery. For in
case a solar panel can be used instead of the lampposts. The solar panel image is shown in
Figure 6-4.
88

Figure 6-86 Solar panel [27]
A whole process of an Outdoor power source for the car park if a solar panel is used instead
of lampposts [30] as is shown in Figure 6-5
Figure 6-87 Outdoor power source for the car park
89

Also a domestic power supply is used as an indoor power source. It supplies the power to the
computer transmitter and receiver
A whole process of indoor power sources [35] is shown in Figure 6-6
Figure 6-88 Indoor power source for car park
90

Chapter 7 Conclusions:
From the discussion above it is shown that a car parking management system differs from a
car park with no monitoring of the cars which exit and leave it. Although more expensive, a
car parking management system helps to remove congestion in a car park where people may
need to explore a bit to find a place to park their car.
There are four main types of systems used when managing a car park: a counter based
system, in which cars entering and leaving the building are counted; an image based system,
where images are taken of the cars inside the car parking spaces; a wired system, having
sensors at each car parking spot that are wired to a central processing unit; and a wireless
system that has nodes that receive data wirelessly from several sensors located also at
individual parks and transmit this to a processor.
To detect cars entering and leaving a car park, either intrusion or non-intrusion sensors can be
used. Intrusion sensors require modification to be made either to the road or the side of it to
install the sensor to detect the vehicles. Non-intrusion sensors do not but often are more
costly and complicated.
The data from these sensors needs to be processed and sent to display units that give the
necessary information to drivers (e.g., the number of available car parks in a level of a car
park and the closest available car park to the driver).
Each detector technology and particular device has its own limitations and individual
capability. The successful application of detector technologies largely depends on proper
device selection. Many factors impact detector selection, such as data type, data accuracy,
ease of installation, cost and reliability.
91

A method of finding the availability of four parks has also been presented. A car park is used
where green circles are placed in the centre of each car park so that they're easily recognized
by image processing from a camera's image. A Matlab program has been demonstrated that
tests images of a car park from a camera in cloudy, raining and sunny weather conditions. A
method of analysing an aerial view of the Template Images and Edge Images has been
presented step by step. This consists of acquiring images, converting them to HSV, extracting
green circles, circle detection to find where empty car parks are, getting red pixels, removing
noise, applying morphological processing and determining whether car parks are vacant or
filled.
A larger scale practical need - finding the availability of a car park at Massey University has
also been presented. A Matlab program has been demonstrated that tests different occupancy
levels of car parks to show how a driver could be guided to the closest park. A method of
analysing an aerial view of the car park has been presented step by step. This consists of
finding car park coordinates from an empty car park, acquiring an image with cars,
converting the image to black and white for simple analysis, removing noise and determining
whether car parks are vacant or filled. The hardware and communication that could be used in
the future has been laid out. In the future a real camera will need to be set up to take images
of a real car park that will be sent to a computer for processing. Image processing methods
will need to be improved to become more robust to cope with various different images. A
simple program has been presented that can produce a simple GUI from a manual spreadsheet
of data and another that randomly varies the position of cars in a car park depending on the
full level you require.
92

The closest park for a driver to go to is important information for a driving entering a park. A
Matlab program has been demonstrated that tests different occupancy levels of car parks to
show how a driver could be guided to the closest park. A method of analysing an aerial view
of the car park has been presented step by step. This consists of finding car park coordinates
from an empty car park, acquiring an image with cars, converting the image to black and
white for simple analysis, removing noise and determining whether car parks are vacant or
filled. The hardware and communication that could be used in the future has been presented.
In the future a real camera will need to be set up to take images of a real car park that will be
sent to a computer for processing. Image processing methods will need to be improved to
become more robust to cope with various images.
This report has presented a car parking management system. This differs from a simple car
park without any monitoring. Although more expensive, a car parking management system
helps to remove congestion in a car park where people may need to explore a bit to find a
place to park their car and makes it a nicer experience for drivers using the car park.
93

References
[1] Yu, H.M., Pang, Z. F. and Ruan, D.R. (2008) The Design of the Embedded Wireless
Vehicles Monitoring Management System Based on GPRS: Evidence from China.
International conference on Intelligent Information Technology,Shanghai, 21-22 December
2008, 677-680.
[2] Wang, L.F., Chen, H. and Li, Y. (2009) Integrating Mobile Agent with Multi-agent
System for Intelligent Parking Negotiationand Guidance. 4th IEEE Conference on Industrial
Electronics and Applications, 25-27 May 2009, Xi’an,1704-1707.
[3] Abdallah, L., Stratigopoulos, H.-G., Mir, S. and Kelma, C. (2012) Experiences With Non-
Intrusive Sensors For RFBuilt-In Test. 2012 IEEE International Test Conference (ITC),
Anaheim, 5-8 November 2012, 1-8.
[4] H. Al-kharusi and I. Al-Bahadly, (2014) Intelligent Parking Management System Based
on Image Processing,” World Journal of Engineering and Technology, Vol.2, Issue 2, May
2014, pp. 41-53.
[5] Zhang, B., Jiang, D.L., Wang, F. and Wan, T.T. (2009) A Design of Parking Space
Detector Based on Video Image.The Ninth International Conference on Electronic
Measurement & Instruments, Beijing, 16-19 August 2009, 253-256.
[6] Sreedevi, A.P. and Nair, B.S.S. (2011) Image Processing Based Real Time Vehicle Theft
Detection and PreventionSystem. 2011 International Conference on Process Automation,
Control and Computing (PACC), Coimbatore, 20-22July 2011, 1-6.
[7] Zhang, X., Li, Y., Wang, J. and Chen, Y. (2009) Design Of High-Speed Image Processing
System Based on FPGA.The Ninth International Conference on Electronic Measurement &
Instruments, Beijing, 16-19 August 2009, 65–69.
94

[8] Jermsurawong J., Ahsan, M., et al. (2012) Car Parking Vacancy Detection and Its
Application in 24-Hour StatisticalAnalysis. 10th International Conference on Frontiers of
Information Technology, Islamabad, 17-19 December 2012,84-90,
[9] Lin, S., Chen, Y. and Liu, S. (2006) A Vision-Based Parking Lot Management System.
IEEE International Conferenceon Systems, Man, and Cybernetics, Taipei, 8-11 October
2006, 2897-2902.
[10] Conci, A., Carvalho, J. and Rauber, T. (2009) A Complete System for Vehicle Plate
Localization, Segmentation andRecognition in Real Life Scene. IEEE Latin America
Transactions, 7, 497-506.http://dx.doi.org/10.1109/TLA.2009.5361185
[11] Lee, K. (2012) Colour Matching for Soft Proofing Using a Camera. IET Image
Processing, 6, 292–300.
[12] Tang, V., Zheng, Y., Cao, J., Hong, T. and Polytechnic, K. (2006) An Intelligent Car
Park Management System Basedon Wireless Sensor Networks. 1st International Symposium
on Pervasive Computing and Applications, 3-5 August2006, Urumqi, 65–70.
[13] D. Jinghong, D. Yaling, and L. Kun (2007) Development of Image Processing System
Based on DSP and FPGA. TheEighth International Conference on Electronic Measurement
and Instruments, 16 August 2007 - 18 July 2007, Xi’an,791-794.
[14] Matjašec, Ž. and Ĉonlagiü, D. (2011) An Optical Signal Processing Device for White-
Light Interferometry, Based onCPLD. 2011 Proceedings of the 34th International
Convention MIPRO, Opatija, 23-27 May 2011, 60-64.
[15] Wang, Y., Zhou, G. and Li, T. (2006) Design of a Wireless Sensor Network for
Detecting Occupancy of Vehicle Berthin Car Park. Seventh International Conference on
95

Parallel and Distributed Computing, Applications and Technologies,Taipei, December 2006,
115-118.
[16] Funck, S., Mohler, N. and Oertel, W. (2004) Determining Car-Park Occupancy from
Single Images. 2004 IEEE IntelligentVehicles Symposium, Parma, 14-17 June 2004, 325-328.
http://dx.doi.org/10.1109/IVS.2004.1336403
[17] Zilan, R., Barceló-Ordinas, J.M. and Tavli, B. (2008) Image Recognition Traffic Patterns
for Wireless Multimedia Mobility in Next Generation Internet, 4th International Workshop of
the EuroNGI/EuroFGI Network of Excellence,Barcelona, 16-18 January 2008, 49-59.
http://link.springer.com/chapter/10.1007%2F978-3-540-89183-3_5
[18] Wolff, J., Heuer, T., Gao, H., Weinmann, M., Voit, S. and Hartmann, U. (2006) Parking
Monitor System Based onMagnetic Field Sensors. Proceedings of the IEEE ITSC 2006
Intelligent Transportation Systems Conference, Toronto,
17-20 September 2006, 1275-1279. http://dx.doi.org/10.1109/ITSC.2006.1707398
[19] Riza, N.A., Marraccini, P.J. and Baxley, C.R. (2012) Data Efficient Digital Micromirror
Device-Based Image EdgeDetection Sensor Using Space-Time Processing. IEEE Sensors
Journal, 12, 1043-1047.
[20] Yusnita, R., Norbaya, F. and Basharuddin, N. (2012) Intelligent Parking Space Detection
System Based on Image,Processing. International Journal of Innovation, Management and
Technology, 3, 232-235.
[21] Caicedo, F. and Vargas, J. (2012) Access Control Systems and Reductions of Driver’s
Wait Time at the Entrance of a Car Park,” 7th IEEE Conference on Industrial Electronics
and Applications (ICIEA), Singapore, 18-20 July 2012,1639-1644.
96

[22] Prasad, A.S.G., Sharath, U., Amith, B. and Supritha, B.R. (2012) Fiber Bragg Grating
Sensor Instrumentation for Parking Space Occupancy Management. International
Conference on Optical Engineering (ICOE), Belgaum, 26-28 July 2012, 1-4.
[23] Chien, S.A. (1994) Automated Synthesis of Image Processing Procedures for a Large-
Scale Image Database. 4th International
Conference on Knowledge and Smart Technology (KST), Austin, 13-16 November 1994,
796-800.
[24] Caicedo, F. and Vargas, J. (2012) Access Control Systems and Reductions of Driver’s
Wait Time at the Entrance of a Car Park. IEEE 7th International Conference on Industrial
Electronics and Applications, Singapore, 18-20 July 2012,
1639-1644.
[25] Boluk, P.S., Irgan, K., Baydere, S. and Harmanci, E. (2011) IQAR : Image Quality
Aware Routing for Wireless MultimediaSensor Networks. 7th International Wireless
Communications and Mobile Computing Conference (IWCMC),
Istanbul, 4-8 July 2011, 394-399.
[26] Gall, R., Troester, F. and Mogan, G. (2010) Building an Experimental Car Like Mobail
Robot for Fully Autonomous Parking. 2010 IEEE/ASME International Conference on
Advanced Intelligent Mechatronics (AIM), Montreal, 6-9 July 2010, Montreal, 6-9 July 2010,
1081-1086. http://dx.doi.org/10.1109/AIM.2010.5695903
[27] Chen, M.K., Hu, C. and Chang, T.H. (2010) The Research on Optimal Parking Space
Choice Model in Parking Lots. 3rd International Conference on Computer Research and
Development (ICCRD), Vol. 2, Shanghai, 11-13 March 2011, 93-97.
97

[28] Barton, J., Buckley, J., O’Flynn, B., O’Mathuna, S.C., Benson, J.P., O’Donovan, T.,
Roedig, U. and Sreenan, C. (2007) The D-Systems Project—Wireless Sensor Networks for
Car-Park Management. IEEE 65th Vehicular Technology Conference, Dublin, 22-25 April
2007, 170-173.
[29] Souissi, R., Cheikhrouhou, O., Kammoun, I. and Abid, M. (2011) A Parking
Management System Using Wireless Sensor Networks. 2011 International Conference on
Microelectronics (ICM), Hammamet, 19-22 December 2011, 1-7.
[30] Srikanth, S.V., Pramod, P.J., Dileep, K.P., Tapas, S., Patil, M.U. and Sarat, C.B.N.
(2009) Design and Implementation of a prototype Smart PARKing (SPARK) System Using
Wireless Sensor Networks. International Conference on Advanced Information Networking
and Applications Workshops, Bradford, 26-29 May 2009, 401-406.
http://dx.doi.org/10.1109/WAINA.2009.53
[31] L. Wenghong, X.Fanghua, L. Fasheng, “Design of Inner Intelligent Car Parking
System”, International Conference on Information Management, Innovation Management
and Industrial Engineering 2008.
[32] C. Wenzhi, L. Bai, "A Smart Roadside Parking Navigation System Based On Sensor
Networks For ITS”, IET International Conference on Wireless, Mobile and Multimedia
Networks, 2006, pp.1-4, 6-9 Nov. 2006.
[33] C.C. Li, S.Y. Chou, S.W. Lin, "An agent-based platform for drivers and car parks
negotiation", 2004 IEEE International Conference on Networking, Sensing and Control,
pp. 1038- 1043, 2004.
[34] R.J. Oyentaryo, M. Pasquier, "Self-trained automated parking system", Control,
Automation, Robotics and Vision Conference, 8th ICARCV, pp. 1005- 1010, 6-9 Dec.
2004.
98

[35] S. Shankar, S.M. Mehmood, "An intelligent architecture for metropolitan area
parking control and toll collection", IEEE Intelligent Vehicles Symposium, 2005., pp. 723-
728, 6-8 June 2005.
[36] Y.Gongjan, M.C. Weigle, S.Olariu, "A Novel Parking Service Using Wireless
Networks", IEEE/INFORMS International Conference on Service Operations, Logistics
and Informatics, 2009, pp.406-411, 22-24 July 2009.
[37] X. Zhang, D. Wan, "Economic Analysis Of Regional Parking Guidance System
Based On TIA", 2010 WASE International Conference on Information Engineering
(ICIE),, pp.401-404, 14-15 Aug. 2010.
[38] S.Y. Chou, S.W. Lin, C.C. Li, “Dynamic Parking Negotiation And Guidance Using An
Agent-Based Platform”, Expert Systems With Applications, vol. 35, no. 3, pp. 805-817,
2008.
[39] W. Longfei, C. Hong, L. Yang, "Integrating Mobile Agent with Multi-Agent System for
Intelligent Parking Negotiation and Guidance”,4th IEEE Conference on Industrial
Electronics and Applications, pp.1704-1707, 25-27 May 2009.
[40] R.J.F. Rossetti, R.H. Bordinia, A.L.C Bazanna, S. Bampi, R. Liu, D.V. Vliet,
”Using DBI Agents To Improve Modeling In A Computer Scenario”, Transportation
Research Part C, 10C(5, 6), pp 373–398, 2002 .
[41] B. Chen, H.C. Harry, J. Palen, “Integrating Mobile Agent Technology With Multi-
Agent Systems For Distributed Traffic Detection And management Systems”,
Transportation Research Part C.
[42] H. Dia, “An Agent-Based Approach To Modelling Driver Route Choice Behaviour
Under The Influence Of Real-Time Information”, Transportation Research Part C:
Emerging Technologies , vol.10, pp 331–349, 2002.
99

[43] C. C. Min, D. Srinivasan, R.L. Cheu”, Cooperative, Hybrid Agent Architecture For
Real-Time Traffic Signal Control”, IEEE Transactions on Systems, Man and
Cybernetics, Part A: Systems and Humans, , vol.33, no.5, pp. 597- 607, Sept. 2003.
[44] J.L. Addler, G. Sathapathy, V. Manikonda, B. Bowles, V.J. Blue, “A Multi-Agent
Approach To Cooperative Traffic Management And Route Guidance”, Transportation
Research Part B 39 (4), pp 297–318, 2005.
[45] F. Balboa, S. Pinsona, “Dynamic Modeling Of A Disturbance In A Multi-Agent
System For Traffic Regulation” Decision Support Systems, vol.41, no.1, pp 131 – 146,
2005.
[46] Y. Li, R. Ma, L. Wang, “Intelligent Parking Negotiation Based On Agent
Technology”, WASE International Conference on Information Engineering, pp.265-268,
10-11 July 2009.
[47] A. Khoukhi, “An Intelligent Multi-Agent System For Mobile Robots Navigation And
Parking”, IEEE International Workshop on Robotic and Sensors Environments (ROSE),
pp.1-6, 15-16 Oct. 2010.
[48] H. Zhang, M. Zhou, Self-Organized Architecture For Outdoor Mobile Robot
Navigation'', Journal Of Zhejiang University Science A. Springer, vol. 6, no.6, pp. 583-
590, June 2005.
[49] R. Abielmona, E.M.Petriu, T.E. Whalen, “Distributed Intelligent Sensor Agent
System For Environment Mapping”, Journal Of Ambient Intelligence And
Humanized Computing.Springer, vol.1, no.2, pp.95-110, 2010.
[50] J. Takahashi, K. Sekiyama, T. Fukuda”, Cooperative Object Tracking With Mobile
Robotic Sensor Network.” Distributed Autonomous Robotic Systems. Springer, Berlin, pp
51–62, 2009.
100

[51] K. Kinoshita, S. Yasunobu, “Intelligent Parking Support System For Four-Wheeled
Vehicles In Consideration Of Human's Operation Error”, 2004 IEEE International
Conference on Systems, Man and Cybernetics, pp. 3938- 3943, 10-13 Oct. 2004.
[52] S. Insop, K. Gowan, J. Nery, H. Han, T. Sheng, H. Li, F. Karray, “Intelligent Parking
System Design Using FPGA”, International Conference on Field Programmable
Logic and Applications, pp.1-6, 28-30 Aug. 2006.
[53] M. Sharafi, A. Zare, S. Nikpoor, "Intelligent Parking Method For Truck In Presence
Of Fixed And Moving Obstacles And Trailer In Presence Of Fixed Obstacles: Advanced
Fuzzy Logic Technologies In Industrial Applications”, 2010 International Conference On
Electronics And Information Engineering (ICEIE), pp.268-272, 1-3 Aug. 2010.
[54] S. Mohammadi, M. Tavassoli, A. Rajabi, "Authoritative Intelligent Perfect Parallel
Parking Based On Fuzzy Logic Controller For Car-Type Mobile Robot”, 2011 Eighth
International Conference on Information Technology: New Generations (ITNG),
pp.135138, 11-13 April 2011.
[55] V.W.S. Tang, Y. Zheng, J. Cao, “An Intelligent Car Park Management System
Based On Wireless Sensor Networks”, 2006 1st International Symposium On Pervasive
Computing And Applications, pp.65-70, 3-5 Aug, 2006.
[56] S. Lee, D. Yoon, A. Ghosh, “Intelligent Parking Lot Application Using Wireless
Sensor Networks”, 2008. CTS 2008. International Symposium on Collaborative
Technologies and Systems, pp.48-57, 19-23 May 2008.
[57] S.Y. Cheung, S.C. Ergen, P. Varaiya, “Traffic Surveillance With Wireless Magnetic
Sensors”, Proceedings of the 12th World Congress On Intelligent Transport Systems,
San Francisco, CA, Nov 2005.
101

[58] V.K. Boda, A. Nasipuri, I. Howitt, “Design Considerations for a Wireless Sensor
Network for Locating Parking Spaces”, IEEE Sout heastCon, pp.698-703, 22-25 March
200.7
[59] B. O’Flynn, S. Bellis, K. Mahmood, M. Morris, G. Duffy, K. Delaney, C.
O’Mathuna,“A 3-D Miniaturised Programmable Transceiver”, Microelectronics
International, Emerald Group, vol. 22, no2, pp 8–12, 2005.
[60] J.P. Benson, T. O’Donovan, P. O’Sullivan, U. Roedig, C. Sreenan, J. Barton, A. Mu
rphy, B. O’Flynn, “Car-Park Management Usingwireless Sensor Networks”, Proceedings
Of The 31st IEEE Conference On Local Computer Networks , Tampa, FL, pp 588–595,
Nov 2006.
[61] J. Barton, J. Buckley, B. O’Flynn, S.C. O’Mathuna, J.P. Benson, T. O’Donovan, U.
Roedig, C. Sreenan, “The D-Systems Project - Wireless Sensor Networks For Car- Park
Management”, Proceedings Of The 65th IEEE Vehicular Technology Conference,
Dublin, Ireland, pp170-173, Apr 2007.
102