feed the future ilssi – tanzania - research design
29
1 FEED THE FUTURE ILSSI – TANZANIA RESEARCH DESIGN Bureau for Agricultural Consultancy and Advisory Services (BACAS) Sokoine University of Agriculture Innovation Laboratory for Small Scale Irrigation: Tanzania Aims of work The main aim of this project is to identify promising solutions through pilot-testing of technological options in small-scale irrigation for small-scale irrigation toward improving household nutrition and livelihoods. Timeframe 15 June 2016 to 30 September 2017 Justification and background Tanzania has vast undeveloped land resources. Various estimates have indicated that the country has a potential total arable area of about 44 million hectares. Of this total figure, only some 6.3 million hectares are currently under crop production, and the remaining 3.8 million is under other uses such as grazing. Out of the 6.3 million hectares, 82% (5.2 million hectares) is being cultivated by smallholder farmers. Irrigation in Tanzania has been taking place through traditional irrigation schemes, some of which are many hundreds of years old. Although such schemes have worked well for countless generations, they are now inadequate due to: (i) increase in population, (ii) continual deterioration, and (iii) catchment degradation and other environmental problems such as waterlogging and salinity. The traditional schemes have therefore become increasingly inadequate in recent decades. The response to the increasing shortcomings of the irrigation schemes from the colonial times until recently has largely been to construct expensive new schemes for the smallholder, public and private sectors. The great majority of these schemes have failed with the exception of those serving the private sector. This approach has also resulted in gross distortion in the financing of the sector. Regardless, irrigation in Tanzania is still very important as it helps in achieving the following primary objectives: (i) satisfying subsistence requirements in many parts of the country - increased food security at household level; (ii) generating local surpluses of main staples, particularly rice in order to achieve food security in the country; and (iii) ensuring production of much need dietary supplements such as vegetables, fruits and pulses. Other challenges were identified in the National Irrigation Master Plan (NIMP) (URT, 2002b) and the NIMP proposed an irrigation development programme that included smallholder schemes that were to be implemented by 2017. According to URT (2002b), the problems identified by the NIMP included lack of appropriate participatory approaches, unsound logical structure of projects and weak linkage between purpose and output of projects, and misunderstanding of the concept of "simple and low-cost technology", taken to mean "easy and no concern of technical know-how and understanding".
-
Upload
khangminh22 -
Category
Documents
-
view
4 -
download
0
Transcript of feed the future ilssi – tanzania - research design

1
FEED THE FUTURE ILSSI – TANZANIA RESEARCH DESIGN Bureau for Agricultural Consultancy and Advisory Services (BACAS) Sokoine University of Agriculture Innovation Laboratory for Small Scale Irrigation: Tanzania Aims of work The main aim of this project is to identify promising solutions through pilot-testing of technological options in small-scale irrigation for small-scale irrigation toward improving household nutrition and livelihoods. Timeframe 15 June 2016 to 30 September 2017 Justification and background Tanzania has vast undeveloped land resources. Various estimates have indicated that the country has a potential total arable area of about 44 million hectares. Of this total figure, only some 6.3 million hectares are currently under crop production, and the remaining 3.8 million is under other uses such as grazing. Out of the 6.3 million hectares, 82% (5.2 million hectares) is being cultivated by smallholder farmers.
Irrigation in Tanzania has been taking place through traditional irrigation schemes, some of which are many hundreds of years old. Although such schemes have worked well for countless generations, they are now inadequate due to: (i) increase in population, (ii) continual deterioration, and (iii) catchment degradation and other environmental problems such as waterlogging and salinity. The traditional schemes have therefore become increasingly inadequate in recent decades. The response to the increasing shortcomings of the irrigation schemes from the colonial times until recently has largely been to construct expensive new schemes for the smallholder, public and private sectors. The great majority of these schemes have failed with the exception of those serving the private sector. This approach has also resulted in gross distortion in the financing of the sector.
Regardless, irrigation in Tanzania is still very important as it helps in achieving the following primary objectives: (i) satisfying subsistence requirements in many parts of the country - increased food security at household level; (ii) generating local surpluses of main staples, particularly rice in order to achieve food security in the country; and (iii) ensuring production of much need dietary supplements such as vegetables, fruits and pulses.
Other challenges were identified in the National Irrigation Master Plan (NIMP) (URT, 2002b) and the NIMP proposed an irrigation development programme that included smallholder schemes that were to be implemented by 2017. According to URT (2002b), the problems identified by the NIMP included lack of appropriate participatory approaches, unsound logical structure of projects and weak linkage between purpose and output of projects, and misunderstanding of the concept of "simple and low-cost technology", taken to mean "easy and no concern of technical know-how and understanding".

2
The high dependency on rain-fed agriculture by smallholders has rendered them vulnerable to the impacts of rainfall variability and drought incidences. As a result many households are facing food insecurity and reduced incomes. Investing in dry season irrigation that will help smallholder farmers engage in vegetable production in the dry season promises to be a good approach for improving nutritional problems as well as improving incomes at household level.
Objectives of project under contract The main objective of the ILSSI project is to test and demonstrate technological options in small-scale irrigation. The project specifically aims to:
i) Demonstrate in field, collect data on, and assess feasibility of solutions (drip irrigation, small motor pumps and water use for pocket gardens),
ii) Develop context specific technological and strategic recommendations for small scale irrigation based on data collected in field, and
iii) Train students, agricultural development agents and professionals in line with the direct research activities
Scope of work
To address the objectives, the project is divided into 3 work packages (WP 1 – WP 3) as follows:
WP1: Assessing the feasibility of small motorized pumps for dry season irrigation of vegetables and improving irrigation water productivity of the irrigated vegetables
This work package has two sub-components, which are researcher-managed experiments and farmer-managed experiment. In the first experiment, irrigation water for tomato & eggplants and irrigation & fertilizer requirements for eggplant for Mkindo will be established and information generated will also guide to establish irrigation scheduling fertilizer rates for other horticultural crops. This is aimed at reducing water losses and improving water productivity.
In the second sub-component, groups of farmers who are sharing pumps will be investigated. The experiment aims at unlocking the potential of pump economics, optimum number of farmers per one pump, mode of repayments in case of credit systems, gender and nutrition related issues aside from the bio-physical analysis.
WP2: Assessing the feasibility of Small scale irrigation of pocket gardens for improving water productivity, household nutrition and income for women farmers.
This is a new work package introduced to address productivity of water, nutrition and gender elements in the project. The experiment has already been introduced in Rudewa village and it will also be implemented at Mkindo village. Pocket gardens as well as conventional home gardens are mainly irrigated using buckets and the main source of water is either boreholes or tap water. Furthermore, this implies there will be our increase in income of the nutrition. Pocket gardens are perceived to consume less water compared to conventional gardens. Therefore, the pocket gardens will be compared to conventional home garden technology to assess water use efficiency and productivity.

3
WP3: This implies, there will be an increase in income of the nutrition. Assessing the impact of the various small scale irrigation interventions on hydrological processes in the two watersheds, Mkindo and Rudewa - Mbuyuni.
Under this study, the two watersheds (Mkindo and Rudewa) will be monitored for climatic parameters, stream discharge, water quality, sediment concentration, borehole water consumption and abstractions from the various surface-water and groundwater resources in the watersheds. In each of the watersheds, water use patterns of at least 3 boreholes will be studied. It is assumed that water use and availability will differ during dry and wet reasons, which will affect irrigation activities.
A detailed land use/land cover map of the region will be established with particular emphasis on existing irrigated and rainfed crops and their respective location and area coverage within the watershed. Finally, the watershed boundaries will be delineated with respect to the control points using GIS.
Areas of work: Description of the study areas
Kilosa District
The site is located in Kilosa District, Morogoro Region. Water is available with the River being their main source of water though it cannot be accessed without lifting since it is deep down as compared to their fields. Women and elderly people form the majority of the farm labor force. The choice of the site was based on the biophysical factors, presence of a good source of water for irrigation and the diversity of farming activities in the dry season. Small-scale farmers in Rudewa are using the available water resources including rivers and shallow groundwater wells for dry season vegetable irrigation as well as growing rice. The study site is connected with a good number of tarred roads, though feeder roads are not passable during the rainy season cutting communications with remote areas. However, roads to the study site are passable throughout the year. This project is therefore targeting small-scale farmers, both male and female to improve their incomes and nutritional status. Additionally, the site lies within the SAGCOT area.
Mvomero District
Mvomero District is located in the northeast of Morogoro region. The altitude of district is between 380 meters and 1,520 meters above sea level. This altitude provides a suitable climate for tropical and subtropical varieties of crops. The district receives a bimodal type of rainfall with peaks in April and December for long and short rains respectively while May to October remains relatively dry. The average rainfall amounts to 1 200 mm per annum with variations from 800 mm to 2 000 mm. Average monthly rainfall is about 106 mm making up a total annual rainfall of about 1 270 mm. The district’s economy like most of Morogoro districts depends on agriculture mainly from crop production. Rice is one of the major crops grown in the district along with maize, cassava and bananas. Other crops include beans, millet, peas, potatoes and vegetables. Farming activities like in many other places in Tanzania are mainly carried out by women and elder people. Irrigation water is mainly available from surface water through rivers and shallow wells. Small scale farmers mainly use buckets for water lifting and traditional canals for conveying water to their farms. Morogoro town is the main market of vegetable produce due to its vicinity.

4

5
Activities, Deliverables and Outputs Work Package 1: ASSESSING THE FEASIBILITY OF SMALL MOTORIZED PUMPS FOR DRY SEASON IRRIGATION OF VEGETABLES AND IMPROVING IRRIGATION WATER PRODUCTIVITY OF THE IRRIGATED VEGETABLES
The aim of this working package is to evaluate the potential of the small motorized pumps for dry season irrigation of vegetables in two selected sites, which are at Mkindo and Rudewa villages. The evaluation will be done at two distinctive levels: researcher-managed plot and farmers’ managed plots. Within this working package agronomy, irrigation engineering, social science and economics will be combined to evaluate whether the investment in motorized pumps as a group is beneficial. Furthermore, it aims to define how irrigation scheduling and quantity can be optimized to ensure sustainable agricultural production.
Drip kits can help farmers conserve water and also save on pumping costs in the production of vegetables. Farmers will be shown the benefits of drip irrigation with a side by side comparison between drip irrigation and furrow irrigation in Rudewa. A researcher managed plot will be used to compare the performance of furrow irrigation against drip irrigation. Scheduling of irrigations in these sub plots will be according to the regularly measured soil moisture content in order to bring the soil water back to field capacity. Also, irrigation and fertilizer experiment will be conducted at Mkindo site, but succeeded by the determination of which nutrient is the determining factor.
1.1 How does this working package relate towards upscaling Drip irrigation using motor pumps is still a technology practiced by few individuals even though is a very promising technology expected to improve irrigation efficiency, productivity, income and reduce poverty. This technology works best in vegetable and fruit production systems. With increased population, water will become scarce; however, pressure to feed growing population will become even great. There is a strong need for mainstreaming this technology at all levels: national government, credit institutions and international funding communities to support this technology. This project is already working with Eastern Zonal Irrigation Office in Morogoro and National Irrigation Commission so that results from this study will be mainstreamed in the government and international action plans and programmes. Therefore, vertical upscaling of this technology is very crucial to ensure farmers are provided with affordable credits or grants, profitable value chains are promoted and sustainable motor pump group sharing mechanisms are established.
1.2 Hypotheses a) When irrigation scheduling is performed appropriately water can be saved beyond crop
water requirement using drip compared to furrow irrigation without significant yield reduction
b) Irrigation water requirements for several crops are not known for Tanzania; thus soil moisture monitoring methods and (scientific)irrigation scheduling will be employed to guide farmers on when and how much water to apply. This is aimed at reducing water losses and improving water productivity.
c) Adoption of dry season irrigation using small motor pumps in the presence of a reliable water source depends on the profitability of the investment; therefore cost-benefit

6
analysis will be conducted to understand which crop combinations irrigation with motor pumps can be most profitable.
d) Gender and nutrition impact of adoption of dry season irrigation using motor pumps depends on its impact on labor requirement work burden on irrigators and dietary of household members. However, it is not clear whether adoption of motor pumps for dry season irrigation may have differential effects on women, men and children work burden and nutrition, therefore gender and nutrition impact will be studied. Livelihood impact of motor pump based dry season irrigation will also be examined. For these studies, compression between gender and adopter and non-adopter households will be undertaken.
e) The dynamics and workability of shared pumps has not yet been explored in Tanzania; this information will help quantify how pump sharing affects timely irrigation supply vs. demand and also determine the ideal number of people to share a pump depending on the location of fields in relation to each other.
f) Providing the motor pumps on credit will enable us to demonstrate the ability of households to pay back loans for this technology. This information will reduce the financial risk to micro-credit institutions and banks for providing loans and will enable them to continue financing and expanding access of such technologies to the farmers.
1.3 Research Questions a) Can crop water use of vegetables be reduced through deficit irrigation using drip
compared to furrow without significantly reducing yields? b) How does deficit irrigation affect costs of production and profitability of vegetables? c) How does the effect of irrigation scheduling in combination with fertilizer application
affect crop water requirement? d) Does scientific irrigation scheduling help improve water productivity in small scale
irrigation? What are the various factors that prevent farmers from irrigating optimally in the 2 villages? (I.e. is water available throughout the dry season? With more than 8 people sharing the pump, is each farmer able to use the pump whenever they need it? Are pump breakdowns common? How long do repairs take?)
e) Is motor pump irrigation profitable for small scale vegetable farmers depending on size of land, various costs of production and crop(s) grown?
f) Are farmers willing to pay back loans for irrigation technologies; motor pump in this case?
1.4 Description of Experimental design 1.4.1 Drip and furrow experiment at Rudewa Site The drip experiment will be conducted at Rudewa site addressing research questions (a) and (b) (Section 1.3). The drip experiment will be compared against traditional furrow irrigation within a split plot design. (Figure 1.4.1 and Figure 1.4.2). The results will be compared against a second block with three furrow control sub-plots receiving the same treatments as drip irrigation experiment of the crop water requirement.The furrow plots will be effectively conducted in the coming dry season which is now (June to December). The treatments will be T1 (100% of crop water requirement (CWR)), T2 (80% of CWR) and T3 (60% of CWR). The three treatments are randomly assigned in a block containing three sub-blocks such that each sub-block had an equal chance of receiving one treatment. Each sub-plot will be 5 m

7
wide and 5 m long covering a total area of 25 m². Building will be use avoid cross contamination of the various treatments. The experiment is aimed to start in June 2016. The crop to be grown will be tomatoes and eggplant (Figure 1a). The estimated effective root zone to calculate CWR will be determined using Allen et al. (1998). The crop water requirement will be calculated based on the estimated crop evapotranspiration (ETc). The climatic data that will be used to calculate the ETc will be long term data from Ilonga meteorological station and adjusted using our short term data available at the experimental site. At the start of the dry season, 3 undisturbed soil samples, using soil cores, will be taken randomly at depths between 0 and 20 cm and tested for bulk density, field capacity and permanent wilting point. The averages will be representatives of the whole research plot. Field capacity and permanent wilting point will be used to determine irrigation scheduling. In each sub block a soil moisture sensor will be used to measure the volumetric soil moisture twice a week. The average measured soil deficit in sub plots T1 will be used to gauge how much water to apply at each irrigation event in sub plots T2 and T3.

8
Figure 1.4.1: Experimental plot layout (researchers managed) for Rudewa site
1.4.2 Irrigation scheduling and fertilizer application rate at Mkindo Site The experiment to evaluate changes in crop coefficients in function of water and nutrient stress will be conducted in Mkindo using furrow irrigation. Prior to the experiment it will need to be determined which nutrient is the limiting factor (i.e. P or N).
The experiment will follow a split-plot design with water levels as the main plots and fertilizer levels as sub-plots (Figure 1.4.2). At least three replicates of the main plots are needed. The furrow lengths and widths will be as uniform as possible across treatments. Irrigation application will be followed as at Rudewa Site. For the sub plots, there will be 3 fertilizer application rates recommended rate, 50 % of the recommended rate, and no fertilizer at all. The latter will evaluate the inherent soil fertility and effect of crop production, helping the calibration of APEX. The recommended fertilizer will depend on the chosen crop, local recommendations and soil analysis.
Irrigation scheduling will be based on the soil moisture deficit in the 100% (full irrigation) plots. Soil moisture measurements are needed up to 1 m or more for irrigation scheduling purposes and for monitoring movement of water throughout the growing season. As it was in Rudewa site also in Mkindo in each sub block a soil moisture sensor will be used to measure the volumetric soil moisture twice a week. Both core and composite soil samples will be taken before the start of the growing season to determine initial nutrient levels of each sub plot and also their field capacity, permanent wilting point, bulk density and texture. Water entering the main plot can be estimated by the multiplying the pump flow rate which will be determine prior to the start of the experiment) by the duration of pumping.

9
Figure 1.4.2: Experimental plot layout (researchers managed) for Mkindo site
1.4.3 Farmers’ managed experiment on sharing of motor pumps In both Mkindo and Rudewa-Mbuyuni villages, motor pumps will be field tested for dry season irrigation of vegetables. Training on pump use and maintenance, and on irrigation and agronomic management of the vegetables will be given to farmers.
In each village, 16 households have been selected; half female headed households and the other half male headed households. The experimental plot size vary between farmers and depend on how much land each of the target household owns. Two (2) motor pumps was bought for each village; each pump is be used by eight (8) target farmers (Table 2). Although the pump is shared, each individual farmer irrigates their individual plots. The motor & pumps have been given to each group of farmers on credit. If there is demand out of the group, and on agreement from all the target households sharing the pump, the pump can

10
be rented out to other farmers in the area at agreed price and other conditions. In Rudewa-Mbuyuni village, an additional motor pump will be given to a group of eight (8) youths who was grow, irrigate and manage a single plot collectively.
Irrigation scheduling advice will be given to one group in each site (see table 2) and results will be compared with the other group in the same site. The advice will be based on the crop water requirement determined for the chosen variety and the determined effective root zone. With the farmers no deficit irrigation will be performed, water will be applied using furrow irrigation based on the measured soil moisture content. Soil moisture will be regularly monitored for half of the farmers in each village (8 farmers only) and advice farmers to refill the soil moisture to field capacity when the moisture drops by 40 percent.
Table 2: Experimental design
Motor pump technology Mkindo Rudewa-Mbuyuni
With scheduling No scheduling With scheduling No scheduling FHHs 4 4 4 4 MHHs 4 4 4 4 Youth group - - - 1 1.5 Description of data collection
The following sections describe the data collected at the research plots as well as the farmers’ plots. For the modeling in APEX as well as understanding the effect of irrigation scheduling on soil fertility, nutrient uptake and overall agronomic performance undisturbed sampling is performed before planting. Five to ten soil samples will be taken diagonally within each sub-plot and bulked together to exclude micro-soil variability at 0-20 cm depth. The soil samples before planting will be analyzed on physical as well as chemical parameters whereas the soil samples after harvest will only be analyzed on chemical properties. The main parameters to be measured are: (i) physicaltexture and bulk density, (ii) chemical EC, CEC, organic matter, plant available nitrogen, total nitrogen, plant available phosphorus, total phosphorus, potassium, calcium, magnesium, sodium and other micro-nutrients. Additionally a soil profile up to 1-1.5 m will be dug neighboring the experimental site and sub-horizons will be sampled and analyzed on the same parameters. Irrigation quantity and quality will be measured from nursery to harvest stage in both the research as well as the farmers plot. Measurements will be conducted through calibration of the drip tank and emitter rate for the drip experiment or by calibrating the discharge within the furrow. Average drip emitter flow rate(s) (using random catch cans), emitter spacing (from manufacturer), and distance between drip lines will be recorded for each treatment (0.9m for tomatoes and egg plants) and also used for irrigation scheduling purposes. Average furrow dimensions, slope, width and length will be measured and recorded for each sub-plot in the control treatment. Pump flow rate will be measured at the inlet of sub-plots and calibrated in function of source and head for the furrow irrigated plots. The duration of pumping for each sub plot and at each irrigation event will be recorded, and the volume of

11
water applied determined. The volume water leaving each main plot will be estimated using a parshall flume. Soil moisture will be measured throughout the research and farmers plots at a twice a week time interval in each of the sub-plots using sensors. The TDR sensors measure the volumetric water content up to 30 cm. The soil moisture below the root zone will be measured by using the TDT so as to enable the estimation of deep percolation. This will allow for the evaluation of changes in soil moisture content throughout the cropping season for the various treatments within the research, group and farmers plots. Agronomic performance of the chosen variety will be measured at the distinct cropping stages and the length of the various stages will be monitored for the two research and farmers plots: (i) initial, (ii) development, (iii) middle stage, (iv) late stage. The stages are determined as follows Initial stage – runs from planting date to approximately 10% ground cover; Development stage – runs from 10% ground cover to effective full cover; Middle stage – runs from effective full cover to the start of maturity; Late stage – runs from start of maturity to harvest, or full senescence. For each (experiment research plot and three farmers plot, the days after planting will be recorded between the various cropping phases to assess potential differences in growing period of management. At the planting phase, planting density will be kept as uniformly as possible and will be measured. During the cropping season standard plant physiological parameters (e.g. plant height, ground coverage or LAI) will be monitored during the various crop stages. Within each stage the same 3 plants within 3 beds will be monitored in terms of crop height and width. Plant density after transplanting will be determined for the 3 beds. During the various stages crop failure, diseases etc. will be recorded as well. At harvest above ground biomass as well as the produce will be weighed at plant (3 plants per bed), bed (3 beds) and full sub-plot level for each treatment. The yield will be divided in marketable and non-marketable yield to understand whether the treatment has resulted in a higher, equal or lower marketable produce for the farmer and the value will be determined aside from its weight. The farmers will be asked to choose to rate the produce from the various treatments blindly. A sub-sample of the produce as well above ground biomass will be taken for each repetition within each treatment. Moisture content to calculated dry matter and water productivity as well as TN, TP and K will be assessed. A subsample of the fertilizer will be analyzed as well. Together with the soil analysis, results might elucidate on potential differences in nutrient uptake under the various water deficit scenarios both for the drip as well as the fertilizer-irrigation scheduling experiment. Gender disaggregated data will be collected during the various agricultural practices (e.g. weeding, fertilizer application, seeding, etc.) in order to estimate the labor and associated costs for each of the treatments and pots. It will also allow to evaluate and compare the labor cost under the various drip vs. furrow scheduled vs. farmers practice. Input costs such as seeds, fertilizer, labor (wage) as well as output (amount of crop produced, amount of crop consumed, and amount of crop sold) and market prices will be recorded for each farmer. In order to understand the group dynamics on sharing a pump detailed records will be taken to understand how the pump is rotated within the group.

12
1.5.2 Detailed overview of data collection
Table 1: Biophysical and socio-economic data collection 2016 and 2017 Measurement Method Experi
ment Spatial resolution
Temporal resolution
Data availability 2016
Data availability 2017
Potential evapotranspiration and actual crop evapotranspiration
Pen-Monteith equation
1.4.1, 1.4.2, 1.4.3
Plot level Continuously (Daily)
3 4
Bulk density Soil core (plot level)
1.4.1, 1.4.2, 1.4.3
Plot level Before each cropping season
3 4
Moisture content TDR 1.4.1, 1.4.2, 1.4.3
Plot level Twice a week
3 4
Crop development stages
Manual observation
1.4.1, 1.4.2, 1.4.3
Plot level At 3 crop development stages
3 4
Crop height Meter 1.4.1, 1.4.2, 1.4.3
Plot level At 3 crop development stages
3 4
Planting density Measurement grid
1.4.1, 1.4.2, 1.4.3
Plot level At planting stage
3 4
Any cost (labor, input) and price data
Manual observation and farmers interview
1.4.1, 1.4.2, 1.4.3
Plot level At harvest for the dry season and for the rainy season
3 4
Data related to amount and value of input, production/yield, market price, income, nutrition, wealth, asset holding
Manual observation and farmers interview
1.4.3 Household level
Throughout the seasons
3 4

13
Crop yield + biomass
Scale (quantification) + economic evaluation
1.4.1, 1.4.2, 1.4.3
Plot level At harvest for the dry season and for the rainy season
3 4
Gender participation
Manual observation
1.4.3 Plot level Throughout the seasons
3 4
Fertilizer application
Type, quantity and quality through manual recording and laboratory analysis
1.4.1, 1.4.2, 1.4.3
Plot level At each application
3 4
Soil physiochemical properties of the plots
Standard laboratory methods
1.4.1, 1.4.2, 1.4.3
Plot level Before each cropping season
3 4
For the intervention households: farm characteristics, farm family characteristics, including data from previous nearby studies
1.4.3 Follow up At the beginning of the season
3 4
Any cost (labor, input) and price data
1.4.1, 1.4.2, 1.4.3
Follow up + household field book
Throughout every crop season
3 4
Type of crop produced
1.4.1, 1.4.2, 1.4.3
Follow up + household field book
Throughout every crop season and time of harvest
3 4
Cropping period 1.4.1, 1.4.2, 1.4.3
Follow up + household field book
Throughout every crop season
3 4

14
Irrigation scheduling/frequency/amount
1.4.1, 1.4.2, 1.4.3
Follow up + household field book
Throughout every crop season
3 4
Amount of family labor in man days or hours for crop + irrigation management
1.4.1, 1.4.2, 1.4.3
Follow up + household field book
Throughout every crop season
3 4
Amount of hired labor in man days or hours for crop + irrigation management
1.4.1, 1.4.2, 1.4.3
Follow up + household field book
Throughout every crop season
3 4
Daily wage rate during the same time (Shillings)
1.4.3 Follow up + household field book
Throughout every crop season
3 4
Amount of fertilizer in value (Shillings)
1.4.1, 1.4.2, 1.4.3
Follow up + household field book
Throughout every crop season
3 4
Amount of seed in quantity
1.4.1, 1.4.2, 1.4.3
Follow up + household field book
Throughout every crop season
3 4
Amount of seed in value (Shillings)
1.4.1, 1.4.2, 1.4.3
Follow up + household field book
Throughout every crop season
3 4
Amount of chemicals (i.e. pesticides) in quantity
1.4.1, 1.4.2, 1.4.3
Follow up + household field book
Throughout every crop season
3 4
Amount of chemicals in value (TSH)
1.4.1, 1.4.2, 1.4.3
Follow up + household field book
Throughout every crop season
3 4
Total household food consumption
1.4.3 Follow up + household field book
Throughout every crop season
3 4
Total sales 1.4.1, 1.4.2, 1.4.3
Follow up + household field book
Throughout every crop season
3 4

15
Current market price of each product
1.4.1, 1.4.2, 1.4.3
Follow up + household field book
Throughout every crop season
3 4
1.6 Personnel and student requirements: 1. Prof. S Tumbo-PI
2. Prof. F Kahimba- Co-PI
3. Mr. S Terengia-WP1
Capacity building: 1. Two BSc Students: Assessment of water use efficiency and productivity (Irrigation
scheduling with farmers) Miss. Mushi Getrude-Mkindo Mr. Misana Gabriel-Rudewa
2. Two BSc Students: Assessment of dynamics of pump sharing (pump performance in group) -
Mr. Mattay Frank- Mkindo Miss. Yakubona Godliver- Rudewa

16
1.7 Time Plan
Activities
Oct. 2015 - Sep. 2016 (quarter)
Oct. 2016 - Sep. 2017 (quarters)
Oct. 2017 - Feb. 2018 (quarters) (quarters)
S.N. Activities 4 1 2 3 4 1 2 3 4
Working package 1
1 Setting up of the researcher’s experimental plots. July 2016 Jan. –
2017 July- 2017
2
Recruit at least four (4) BSc in water resources and irrigation students to do their special research in the project.
April-June, 2016
April – June, 2017
July-Sep, 2017
4 Supervise and monitor data recording by farmers
July– Sept,2016
Jan.–March 2017
April – June, 2017
July-Sep, 2017
5 Data collection in the experimental plots Aug. – Dec. 2016 Feb. –
June, 2017 Aug.-Dec., 2017
6 Report writing Oct.-Dec, 201
17
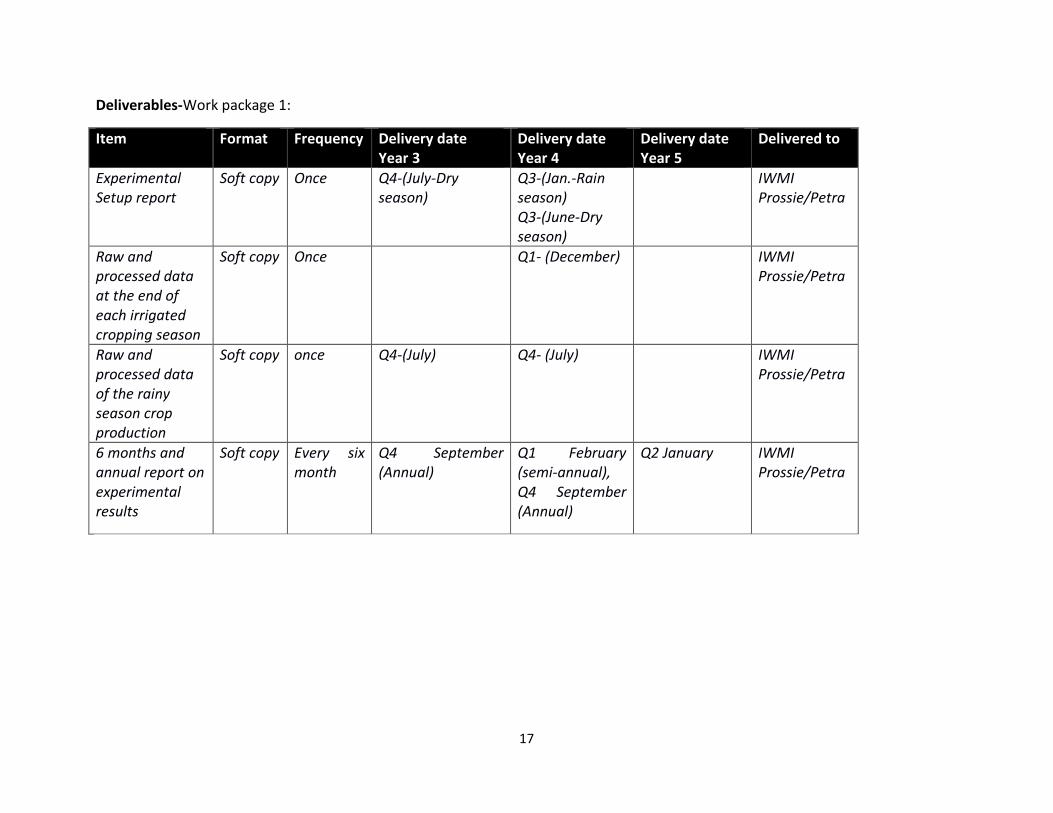
Deliverables-Work package 1:
Item Format Frequency Delivery date Year 3
Delivery date Year 4
Delivery date Year 5
Delivered to
Experimental Setup report
Soft copy Once Q4-(July-Dry season)
Q3-(Jan.-Rain season) Q3-(June-Dry season)
IWMI Prossie/Petra
Raw and processed data at the end of each irrigated cropping season
Soft copy Once Q1- (December) IWMI Prossie/Petra
Raw and processed data of the rainy season crop production
Soft copy once Q4-(July) Q4- (July) IWMI Prossie/Petra
6 months and annual report on experimental results
Soft copy Every six month
Q4 September (Annual)
Q1 February (semi-annual), Q4 September (Annual)
Q2 January IWMI Prossie/Petra

18
Work Package 2: ASSESS THE FEASIBILITY OF POCKET GARDEN ON IMPROVING WATER USE EFFICIENCY AND HOUSEHOLD NUTRITION
The aim of this work package is to improve water use efficiency and nutrition status of people at family level especially children. Management of a pocket garden is easy, cheap and use less amount of water (approximately 20 – 40 litres) per week. Household wastewater (free of soap) can also be re used to irrigate pocket garden thus increase water use efficiency and improve vegetables production for household consumption.
The pocket garden technology is an emerging solution to supplement food availability at household level, leverage income and improve dietary. The technology is believed to be cheap and easy to use with very minimum efforts needed to learn and it requires less water for irrigating. However there is lack of evidence to support these arguments. This research will explore the use of pocket garden irrigation technology as one of promising solutions for small-scale irrigation toward improving household nutrition and food security.
2.1 How does this working package relate towards upscaling Irrigation of pocket garden is still a new technology in the study area. The technology has shown to be promising in other areas such as Same, Kilimanjaro region. The technology has shown to improve irrigation efficiency, productivity and income, and reduce poverty. This technology works best in vegetable production systems. With increased population, water will become scarce; however, pressure to feed growing population will become even great. Therefore it is important to test and upscale this technology in both Mkindo and Rudewa areas. Upscaling will be done both horizontally and vertically. Horizontal upscaling will include training of more women within the village and outside the village through field visits and study tour to women within the project. Vertical upscaling will involve workshops attended by policy makers, extension officers. The study will also include a social science master student who will work with upscaling of the technology.
2.2 Hypotheses (Please define your hypothesis a) Introduction of pocket gardens will increase water use efficiency as compared to irrigation
of conventional home gardens b) Introducing pocket garden to the study site will increase vegetables consumption at
household level thus improve nutrition c) Pocket garden will improve women involvement in vegetables production and income
generation 2.3 Research Questions a) Can crop water use of vegetables be reduced through pocket garden irrigation compared to
conventional without significantly reducing yields? b) How does pocket garden affect costs of production and profitability of vegetables? c) To what extent vegetables consumption will increase in households with pocket garden as
compared to those without this technology?

19
d) Will pocket garden reduce gender roles significantly to females in different households?
2.4 Description of Experimental design 2.4.1 Experimental plot design To conduct pocket garden experiment, 10 women will be selected and trained in each village. Three women from each village will be selected at random so as to closely monitor their experimental plots for data collection. Each woman will have experiment for both pocket and conventional garden techniques for comparative analysis. Because the source of water for many households is boreholes, irrigation method employed will be bucket irrigation. In all setup irrigation water sources, amount and interval will be monitored. Agronomic practices, social economic data, yields and household nutrition status data will also be collected throughout the cropping cycle. For vegetables with 25 cm spacing, number of seedlings in one pocket garden is 80 – 100 seedlings. The layout of the experimental plots will therefore be as follows:
Conventional garden layout Pocket garden layout
2.4.2 Materials
Materials that are required for establishment of one pocket garden include 8 buckets (20 Liters capacity) of black soil, 2.5 - 3 buckets of manure, 1.5 buckets of course aggregates, 4 buckets of Sand, sack (of capacity of carrying 100 kg of maize), 1 pole (2-inches thick) for reinforcing erected sack. Other materials include 1 Shovel (For mixing the materials), small, hollowed 4-litres plastic bucket, 2 buckets of water (20 liters each), this depends on the amount of soil moisture present in the soil, 1 sword for cutting the pole into the required length, knife and hoe for cultivating and mixing.
Table 2.1: Materials for pocket garden
Material Quantity Unit
Black soils 8 20 liters buckets
Manure 2.5 – 3 20 liters buckets
Course aggregates 1.5 20 liters buckets

20
Sack 1 Sack of capacity of carrying 100 kg of maize
Shovel 1 Item
Hollow 4 liters plastic bucket 1 Item
Water 20 litres
2.4.3 Pocket and conventional gardens establishment
Installation of a pocket garden requires series of activities. These step to step activities include gathering the materials to installation site, digging a 30 cm – hole deep in which the pole will be inserted, erection of the pole and compaction with the soil, inserting the sack by cutting a small portion at the middle of the bottom of the sack, mixing all materials i.e Sand, Black soil, manure, aggregates using recommended ratios, water is then poured to the pile and mixed till all materials are uniformly mixed and water distributed evenly, place the hollow cylinder along the erected pole till it rest on the ground for filling of course aggregate, fill course aggregates in the cylinder and putting the mix of the other materials into the sack, around the cylinder (this step is repeated until the sack becomes full), application of water through the column of aggregates to the filled sack till the materials in the sack are well saturated is then conducted, finally vegetables seedlings are transplanted through drilled holes using knife on the sides of the sack at 25 cm spacing between seedlings. Finally, consider fencing with a net to protect vegetables from attack by birds such as chicken and turkey. This system will be compared with the conventional vegetables growing system (bunded basins) with the cultivated area equal to number of seedlings in one kitchen hole.
2.5 Description of data collection Data recording will be done through specific data sheets for the following subsections: Irrigation water quantity will be measured from nursery to harvest stage for both the control plot as the pocket garden. Measurements will be conducted through calibration of cans (tools) used for irrigation by a certain household. Soil moisture will be measured in both pocket and conventional practices treatments before and after irrigation throughout the cropping season to the three selected farmers using TDR sensors. In pocket garden, soil moisture will be measured horizontally at top, mid and bottom side where as in conventional practice, will be measured on the top soil at different points of the plot. The sensors measure the volumetric water content up to 30 cm. This will allow for the evaluation of changes in soil moisture content throughout the cropping season. Gender roles information will be collected within the study sites. Activities conducted by women in various agricultural practices will be monitored. This will help in estimation of labor requirements and associated costs for pocket garden as compared to conventional means of household vegetables production. Input costs information will include seeds, fertilizer, labor

21
(wage) while output information will include amount of crop produced, consumed, and sold and market prices. These information will be recorded from each farmer. The information will be recorded as shown in the table below: Table 2.2: Gender roles in different activities in the study site Investment (eg. Pocket garden or conventional plot)
Activities conducted by men
Activities conducted by women
Detailed overview of data collection
Table 2.2: Biophysical and socio-economic data collection Year 3 and Year 4 Measurement Method Experiment Spatial
resolution Temporal resolution
Data availability Y3
Data availability Y4
Sources and amount of irrigation water used
Calibrated bucket
2.4.1 Plot level Continuously (Daily)
3 4
Crop development stages
Manual counting number of leaves
2.4.1 Plot level At 3 crop development stages
3 4
Planting density
Measurement grid
2.4.1 Plot level At planting stage
3 4
Crop yield + biomass
Scale (quantification) + economic evaluation
2.4.1 Plot level At harvest for the dry season and for the rainy season
3 4
Soil physiochemical properties of the plots
Standard laboratory methods
2.4.1 Plot level Before each cropping season
3 4
Gender roles related to women and nutrition (vegetables consumption)
Data recording sheet
2.4.1 Plot level Throughout the cropping season
3 4
Descriptions of "typical"
Baseline survey 2.4.1 Plot level at the beginning of
3 4

22
household gardens
the season
Personal and student requirements: 1. Prof. S Tumbo – Principal Investigator of the project (PI) 2. Prof. F Kahimba – Co Principal Investigator of the Project (Co PI) – Pumping devices 3. Prof. H Mahoo – Co Principal Investigator of the Project (Co PI) – Pocket garden 3. Mr. S Terengia – Supervision and data collection on pumping devices and hydrology 4. Mr. P Reuben – Supervision and data collection on pocket garden and hydrology Capacity building:
1. Monitoring the irrigation and fertilizer experiment on pocket garden-WP2. Massay Pascal-Mkindo Anna Kavuraya-Rudewa
One MSc. Student: Investigate upscaling of small scale irrigation technologies (WP1 – 2)

23
Time Plan
Activities Oct. 2015 - Sep. 2016
(quarter) Oct. 2016 - Sep. 2017 (quarters)
Oct. 2017 - Feb. 2018 (quarters) (quarters)
S.N. Activities 3 4 1 2 3 4 1
1 Setting up for both sites (Mkindo and Rudewa). April –
June, 2016
2 Supervise and monitor data recording by farmers
April –
June., 2016
July-Sept., 2016
Oct.,-Dec.,2016
Jan.- March, 2017
Apr.-June., 2017
July-Sept., 2017
3 Data collection in the experimental plots April –
June., 2016
July-Sept., 2016
Oct.,-Dec.,2016
Jan.- March, 2017
Apr.-June., 2017
July-Sept., 2017
4 Final technical reports writeup January – February,
2018
Deliverables-Work package 2: Item Format Frequency Delivery
date 2016 Delivery date 2017
Delivery date 2018 Delivered to
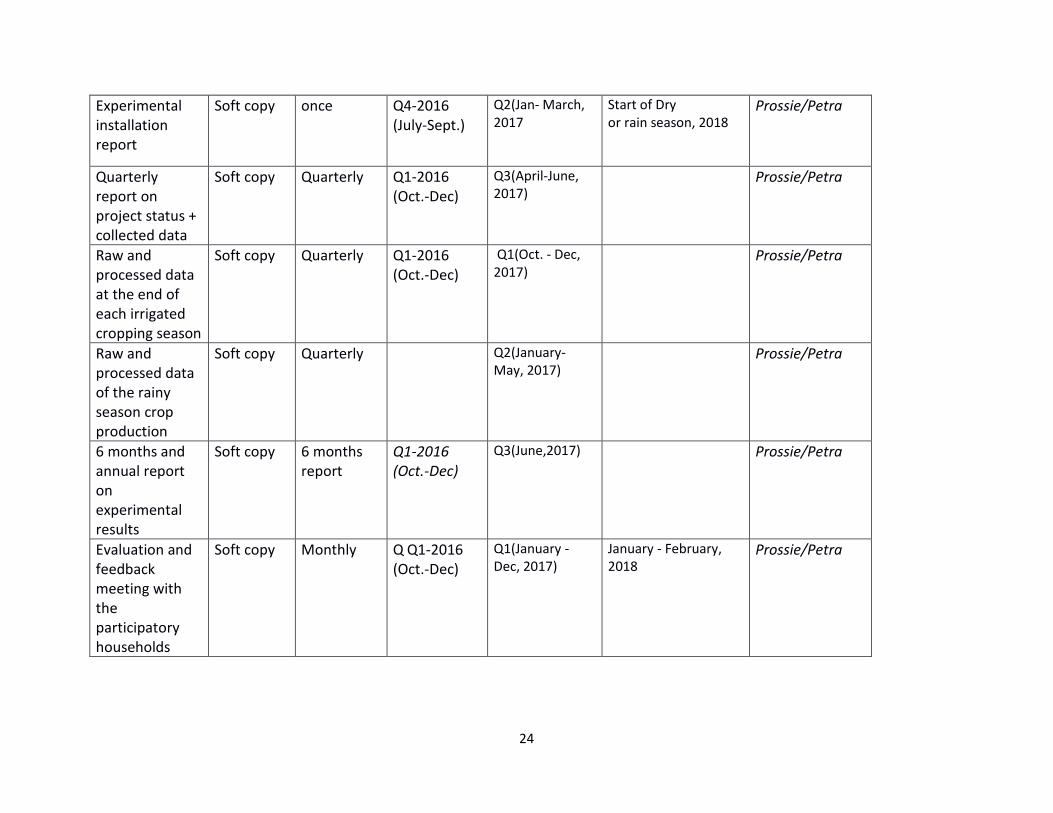
24
Experimental installation report
Soft copy once Q4-2016 (July-Sept.)
Q2(Jan- March, 2017
Start of Dry or rain season, 2018
Prossie/Petra
Quarterly report on project status + collected data
Soft copy Quarterly Q1-2016 (Oct.-Dec)
Q3(April-June, 2017)
Prossie/Petra
Raw and processed data at the end of each irrigated cropping season
Soft copy Quarterly Q1-2016 (Oct.-Dec)
Q1(Oct. - Dec, 2017)
Prossie/Petra
Raw and processed data of the rainy season crop production
Soft copy Quarterly Q2(January- May, 2017)
Prossie/Petra
6 months and annual report on experimental results
Soft copy 6 months report
Q1-2016 (Oct.-Dec)
Q3(June,2017) Prossie/Petra
Evaluation and feedback meeting with the participatory households
Soft copy Monthly Q Q1-2016 (Oct.-Dec)
Q1(January - Dec, 2017)
January - February, 2018
Prossie/Petra

25
Work Package 3: WATER RESOURCES ASSESSMENT AND ASSESSING THE IMPACT OF THE VARIOUS SMALL SCALE IRRIGATION INTERVENTIONS ON HYDROLOGICAL PROCESSES IN THE TWO WATERSHEDS, MKINDO AND RUDEWA-MBUYUNI.
The aim of this study will be to monitor the climatic parameters, stream discharge, groundwater levels, and abstractions from the various surface-water and groundwater resources in the two watersheds. 3.1 How does this working package relate towards upscaling Examining the different types of land use and land cover within a watershed, studying hydrological processes and its impact on the watersheds can reveal important information about potential sources of contamination to its water bodies, yields and sustainability. Using data collected and experience gained in this study with the link to GIS-based tools will help to determine land use composition for other geographical area and identify those water resources at the highest risk from agricultural or other human activities. This study will help hydrological modelers to have a baseline for studying other watersheds and advice on their sustainability. 3.2 Hypotheses a) Sustainable intensification through irrigation requires quantification of available water
resources and an assessment of current and future land use practices influencing those water resources at watershed scale
a) Promotion of irrigation, in our case, small scale irrigation should take into account the amount and quality of water resources available in the implementation areas throughout the year.
3.3 Description of Experimental design Under this work package of watershed assessment, basin outlets will correspond to stream gauging stations. A stream discharge will be measured at this location of river using automatic water level sensors that will be installed. Watershed mapping will then be used to measure basin characteristics (e.g., drainage density, and the proportion of a particular vegetation type). The watershed will be delineated from the available topographic base maps and then the area will be measured using a Plan meter. The two watersheds (Mkindo and Rudewa) will be monitored for climatic parameters, stream discharge, proxy measurement of groundwater levels and abstractions from the various surface-water and groundwater resources in the watersheds. In each of the watersheds, at least 4 borehole locations will be selected for proxy measurement of groundwater level observation. A detailed land use/land cover map of the region will be established with particular emphasis on existing irrigated and rainfed crops and their respective location and area coverage within the watershed. The location of old and big indigenous trees will be marked using GPS because these may indicate the presence of an aquifer. Finally, the watershed boundaries will be delineated with respect to the control points using GIS.

26
3.4 Description of data collection
Data requirements for this study include water level and flow data. Other data requirements are needed for the Integrated Decision Support Systems which includes the three models, Soil Water Assessment Tool (SWAT), Agricultural Policy/Environmental extender Model (APEX) and Farming Simulator (FARMSIM). Thus, the two watersheds will be instrumented. Rainfall and other climatic variables (i.e. relative humidity, solar radiation, wind speed, etc.), river/stream inflow and outflow, and change of groundwater storage over time will be measured and actual evaporation, subsurface flow and direct run-off estimated. A digital elevation model, land use, soil and other relevant maps of both watersheds will be collected. Climate data observation will be made using automated instruments located near to the center of each watershed. Discharge data will be collected both manually and automatically through the establishment of a rating curve for all gauged outlets. Additionally, sediment samples will be collected for selected storm events at the selected outlets in order to assess the erosion vulnerability of the watershed. Storm event samples will be taken from the selected outlets for sediment and water quality analysis. Optionally, one turbidity sensor will be installed at the outlet of both watersheds and calibrated for continuous sediment measurements. Sediment analysis will include standard carbon measurements (Total organic and inorganic carbon), total nitrogen, plant available and total phosphorus and potassium as well as particle size. 3.5 Data collection 1.5.2 Detailed overview of data collection
Table 1: Biophysical and socio-economic data collection Year 2 and Year 3 Measurement Method Experime
nt Spatial resolution
Temporal resolution
Data availability
Data availability
Climatic data Weather station 3.3 Watershed level
Continuously (Daily)
3 4
Potential evapotranspiration and actual crop evapotranspiration
Calculated according to Penman Monteith and FAO drainage paper 56
3.3 Watershed level
Continuously (Daily)
3 4
DEM, Soil and land use map
Sampling & governmental agencies/university data, GIS, Standard laboratory analysis
3.3 Watershed level
Once, start of the project
3 4

27
Discharge Water level sensors
3.3 Watershed level
Daily and event based
3 4
Both surface and groundwater abstraction amounts
Manually 3.3 Watershed level
Continuously
3 4
Sediment concentration/yield
turbidity sensors and manual sampling
3.3 Watershed level
Continuously and event based & base flow in dry season
3 4
Sediment quality at selected watershed locations
Standard laboratory analysis (Texture, Organic Carbon, Inorganic Carbon, Total Nitrogen)
3.3 Watershed level
Event based & base flow in dry season
3 4
Characterization of main irrigated and rainfed crops + crop calendar
Manual observation & GIS
3.3 Watershed level
Once, start of the project
3 4
Groundwater table
Manual/Floating method or gauged
3.3 Watershed level
Twice daily in the rainy season and once a week in the dry season
3 4
Personal and student requirements: 1. Prof. S Tumbo – Principal Investigator of the project (PI) 2. Prof. F Kahimba – Co Principal Investigator of the Project (Co PI) – Pumping devices 3. Prof. H Mahoo – Co Principal Investigator of the Project (Co PI) – Pocket garden 3. Mr. S Terengia – Supervision and data collection on pumping devices and hydrology 4. Mr. P Reuben – Supervision and data collection on pocket garden and hydrology Capacity building :(BSc Students)
1. Monitoring of water use levels for domestic water consumption Miss. Mwakilasa-Mkindo
2. Monitoring stream water quality
Mr. Mbunde Chadwick- Rudewa

28
1.6 Time Plan
S/N Activities
15 June to 30 Sep. 2016
(quarter)
1 Oct. 2016 – 30 Sep. 2017 (quarters)
1 Oct. 2017 – 28 Feb. 2018 (quarters) (quarters)
Working package3
1 Installation of data monitoring and collection instruments, flow monitoring sensors, and weather stations
- June, 2016 -
2 Watershed data monitoring and collection
Ongoing from July 2016 – June, 2017
Ongoing from July 2016 – June, 2017
Ongoing from July 2017 – January, 2018
3 Land scape and community survey
July – Sep., 2016
4 Report writing May – June , 2016
January , 2016 and June, 2016
January, 2017
5 Stakeholder meeting - August, 2016 August, 2017
Deliverables-Work package 3:

29
Item (Deliverable)
Format
Frequency
Delivery date 2016
Delivery date 1 Oct 2016-30 Sep 2017
Delivery date 1 October 2017-28 February 2018
Delivered to
Data from watershed monitoring stations
Soft copy
Once every year
Q4-2016 (Sept)
Q4-2017 (Sept)
Q3-2016 (Sept)
IWMI Prossie/Petra
Evaluation and feedback meeting with the participatory
Soft copy
Once every year
Q1-2016 (December)
Q1-2016 (December)
Q3-2016 (September)
IWMI Prossie/Petra
Characterization report of the landscape and communities
Soft copy
once Q1-2016 (December)
IWMI Prossie/Petra
6 months and annual report on data and experimental results
Soft copy
Every six month
Q1-2016 December.
Q3-June, 2017 and Q1-Dec, .2017
Q1-January, 2018.(end of project)
IWMI Prossie/Petra
Final Technical Report
Soft copy
Once Feb, 2018