Analysis of Subsynchronous Resonance Characteristics and ...
13
energies Article Analysis of Subsynchronous Resonance Characteristics and Influence Factors in a Series Compensated Transmission System Chengbing He 1, *, Dakang Sun 2 , Lei Song 3 and Li Ma 1 1 School of Energy, Power and Mechanical Engineering, North China Electric Power University, Beijing 102206, China 2 Information Technology Department, Guodian Nanjing Automation Corporation, Nanjing 210000, China 3 Technology and Engineering Center for Space Utilization, Chinese Academy of Sciences, Beijing 102206, China * Correspondence: [email protected]; Tel.: +86-010-61772359 Received: 4 July 2019; Accepted: 21 August 2019; Published: 26 August 2019 Abstract: Series capacitor compensation is used to improve the utilization of existing power systems. Subsynchronous resonance (SSR) can be caused by series compensated lines, which would lead to turbogenerator shaft breakdown. A novel approach was presented in this paper to analyze the characteristics and influence factors of SSR in a series compensated transmission system. The system model of SSR, including the various modules of the electromechanical network, was established, and the eigenvalue results under 70% series compensation level were analyzed by eigenvalue analysis method for the the institute of electrical and electronics engineers (IEEE) first benchmark model (FBM). Compared with the results of the power systems computer-aided design (PSCAD) modeling and simulation, the effectiveness of eigenvalue analysis method was proven. After that, the eigenvalue analysis method was used to study, in detail, the effects of system series compensation levels, synchronous generator parameters, speed governing system parameters, and excitation system parameters on SSR characteristics. The research results show that the series compensation level has the greatest influence on the torsional mode damping of the system. The parameters of generator reactance, speed governing system, and excitation system have some effect on the torsional mode damping. The parameters of excitation system significantly affect the low-frequency oscillation damping. Keywords: eigenvalue analysis method; series compensated transmission; subsynchronous resonance (SSR); torsional mode (TM) 1. Introduction Series capacitor compensation used in long-distance transmission systems can enhance the transfer capability and transient stability. However, it is well-known that capacitors in series with transmission lines can cause subsynchronous resonance (SSR) in power systems. Self-excitation or dynamic instability due to SSR produces very high amplitude mechanical torques in the turbogenerator shaft that could lead to shaft damage [1,2]. The first reported case of SSR in the world occurred at Mohave Power Station in Arizona, where the generator shafting was subjected to a continuously increasing torque, which led to the shafting fracture. After that, several cases of shaft damage caused by SSR have happened. For example: In 2004, the generator rotors of 2# and 3# turbogenerators set cracked due to SSR in Dresden nuclear power plant. In 2008, several SSR events occurred at Yimin power plant in China, which led to the shaft fracture of 3# turbogenerator set. In recent years, wind power has been developing rapidly worldwide, and there have been many incidents of damage to the wind Energies 2019, 12, 3282; doi:10.3390/en12173282 www.mdpi.com/journal/energies
-
Upload
khangminh22 -
Category
Documents
-
view
0 -
download
0
Transcript of Analysis of Subsynchronous Resonance Characteristics and ...
energies
Article
Analysis of Subsynchronous ResonanceCharacteristics and Influence Factors in a SeriesCompensated Transmission System
Chengbing He 1,*, Dakang Sun 2, Lei Song 3 and Li Ma 1
1 School of Energy, Power and Mechanical Engineering, North China Electric Power University,Beijing 102206, China
2 Information Technology Department, Guodian Nanjing Automation Corporation, Nanjing 210000, China3 Technology and Engineering Center for Space Utilization, Chinese Academy of Sciences,
Beijing 102206, China* Correspondence: [email protected]; Tel.: +86-010-61772359
Received: 4 July 2019; Accepted: 21 August 2019; Published: 26 August 2019�����������������
Abstract: Series capacitor compensation is used to improve the utilization of existing power systems.Subsynchronous resonance (SSR) can be caused by series compensated lines, which would leadto turbogenerator shaft breakdown. A novel approach was presented in this paper to analyze thecharacteristics and influence factors of SSR in a series compensated transmission system. The systemmodel of SSR, including the various modules of the electromechanical network, was established,and the eigenvalue results under 70% series compensation level were analyzed by eigenvalueanalysis method for the the institute of electrical and electronics engineers (IEEE) first benchmarkmodel (FBM). Compared with the results of the power systems computer-aided design (PSCAD)modeling and simulation, the effectiveness of eigenvalue analysis method was proven. After that,the eigenvalue analysis method was used to study, in detail, the effects of system series compensationlevels, synchronous generator parameters, speed governing system parameters, and excitationsystem parameters on SSR characteristics. The research results show that the series compensationlevel has the greatest influence on the torsional mode damping of the system. The parametersof generator reactance, speed governing system, and excitation system have some effect on thetorsional mode damping. The parameters of excitation system significantly affect the low-frequencyoscillation damping.
Keywords: eigenvalue analysis method; series compensated transmission; subsynchronous resonance(SSR); torsional mode (TM)
1. Introduction
Series capacitor compensation used in long-distance transmission systems can enhance thetransfer capability and transient stability. However, it is well-known that capacitors in series withtransmission lines can cause subsynchronous resonance (SSR) in power systems. Self-excitation ordynamic instability due to SSR produces very high amplitude mechanical torques in the turbogeneratorshaft that could lead to shaft damage [1,2]. The first reported case of SSR in the world occurred atMohave Power Station in Arizona, where the generator shafting was subjected to a continuouslyincreasing torque, which led to the shafting fracture. After that, several cases of shaft damage caused bySSR have happened. For example: In 2004, the generator rotors of 2# and 3# turbogenerators set crackeddue to SSR in Dresden nuclear power plant. In 2008, several SSR events occurred at Yimin powerplant in China, which led to the shaft fracture of 3# turbogenerator set. In recent years, wind powerhas been developing rapidly worldwide, and there have been many incidents of damage to the wind
Energies 2019, 12, 3282; doi:10.3390/en12173282 www.mdpi.com/journal/energies
Energies 2019, 12, 3282 2 of 13
farm equipment caused by SSR [3–7]. For example: In 2009, SSR occurred at the Zorillo-Gulf windfarms. This incident caused multiple transmission devices to trip and many crowbar circuits to fail.During the year 2013, dozens of SSRs occurred in the Guyuan wind power system in Hebei Province,China. More than one thousand wind turbine generators tripped due to overcurrent caused by SSR,and the power of the wind farm dropped sharply in a short time. SSR seriously affects the safe andreliable operation of power systems, which has attracted great attention of countries all over the world.
There are many methods to study SSR in the power system. Amongst these, the eigenvalue analysis,electromagnetic transient analysis, complex torque coefficient analysis, and frequency scanning are themost used methods [8–11]. A summary of several major analysis methods is shown in Table 1.
Table 1. Comparison of subsynchronous resonance (SSR) analysis methods.
SSR Analysis Methods Features Advantages Disadvantages
Eigenvalue analysis
It is also called state-spaceanalysis method, which isa quantitative analysis methodbased on the small disturbancelinearization model and obtainsSSR-related information bysolving eigenvalues.
• Provides frequency anddamping information forentire system inone calculation.
• Analyzes the influence ofparameters on SSR system.
Higher order modelparameters are required forthe entire system, which isdifficult to analyze.
Electromagnetictransient analysis
Using a step-by-step numericalintegration method, a set ofdifferential equations of thesystem are solved.The mathematical model can belinear or nonlinear.
• The dynamicalcharacteristics of all powersystem components canbe represented.
• Has a unified simulationsoftware tools such asEMTP, PSCAD, EMTDC.
Only time domain responseresults can be given. It isdifficult to directly give SSRreasons and the mechanismof instability.
Complex torquecoefficient analysis
Frequency scanning of themechanical and electricalcomplex torque coefficients ofthe shaft system in thesubsynchronous frequencyrange to determine whether thesystem will undergosubsynchronous oscillation.
• Damping frequency curvecan be obtained.
• The influence of variousparameters on the electricaldamping characteristicscan be analyzed.
• Large time-frequencyanalysis error.
• Only applicable tosingle machine infinitebus system.
Frequency scanning
It is an approximate linearmethod to calculate theequivalent impedance fora specific frequency and filterout the system conditions withpotential SSR.
• Simple theory andless calculation.
• Can quickly determine ifthere is a SSR risk.
• Only electricalresonance points canbe obtained.
• Can only be judgedqualitatively and withpoor accuracy.
The purpose of this paper was to study the SSR characteristics and influence factors of a seriescompensated transmission system. It can be seen from Table 1 that the combination of eigenvalueanalysis method and time domain simulation method can well meet the requirements of accurateanalysis. SSR system model, including a variety of electromechanical network modules, is theestablished. The eigenvalues under 70% series compensation level are analyzed by eigenvalue analysismethod for the institute of electrical and electronics engineers (IEEE) first benchmark model (FBM).At the same time, power systems computer-aided design (PSCAD) is used to model and analyzethe example, which proves the validity of eigenvalue analysis method. After that, the effects ofseries compensation levels, synchronous generator parameters, speed governing system parameters,and excitation system parameters on SSR characteristics of the system are studied in detail.

Energies 2019, 12, 3282 3 of 13
2. Eigenvalue Analysis and System Modeling
2.1. Eigenvalue Analysis
Eigenvalue analysis is a strict and accurate method based on linear theory. In order to analyze SSRcharacteristics by eigenvalue analysis method, it is necessary to establish the detailed mathematicalmodel of each system component. Then, the linear state-space model is obtained by linearizing thesystem at the stable operating points.
.X = AX (1)
where X is the system state variables of the incremental form, and A is the state matrix of the system.The corresponding eigenvalue equation of the system is [8]
|λI−A| = 0 (2)
where I is identity matrix. λ is the eigenvalues of matrix A, and it can be expressed as
λi = σi ± jωi (3)
In summary, the steps of eigenvalue analysis are as follows:
• A detailed mathematical model is established for various components of the SSR system and thepower network, and the differential equations describing the transient process is obtained.
• By linearizing the differential equations near stable values and writing out the standard form.
X = AX, the state-space representation is acquired, which is suitable for eigenvalue analysis.• The initial values of the studied system under stable operation are calculated.• The eigenvalues of characteristic equations are solved, and the stability and damping characteristics
of the system are analyzed based on the results.
2.2. System Modeling
The IEEE FBM, which was created by the IEEE Working Group in 1977, is used for SSR studies [12].The system is shown in Figure 1.Energies 2019, 12, x FOR PEER REVIEW 4 of 15
FX FX
RLX CX SYSX
Figure 1. The IEEE first benchmark model [12].
The system consists of a turbogenerator shaft system, which includes high pressure turbine (HP), intermediate pressure turbine (IP), low pressure turbine A (LP-A), low pressure turbine B (LP-B), generator (GEN), and exciter (EXC), and an infinite bus with a series compensated transmission line. The system models include turbogenerator shaft system, turbine speed governing system, turbine prime mover system, generator electromagnetic circuits, exciter system, transmission lines, and series compensation circuit system. The models of the turbine speed governing system and turbine prime mover system are as follows. Other models are given in [13].
2.2.1. Turbine Speed Governing System
The main function of the speed governing system of a modern large turbogenerator is to adjust the speed and load of the system. The state characteristic equations of the speed governing system at an operating point are established as follows [8].
Δ−Δ=Δ
Δ−Δ=Δ
μαμ
αωα
SMSM
SRSR
G
TTp
TTK
11
1-p
(4)
where, S MT is the integral time constant of the oil motive, GK and SRT are the amplification factor
and time constant of the speed regulator, respectively. α and μ are the position of the speed relay and the opening of the turbine inlet valve, respectively.
2.2.2. Turbine Prime Mover Model
Figure 2 is a typical turbine prime mover system model. Where, GVP is the valve opening signal output from electro-hydraulic servomechanism of the speed governing system. cssT is the steam volume time constant of the high pressure turbine. rhsT is the steam volume time constant of the reheater. cosT is the steam volume time constant of the connected pipe. FHP, FIP, and FLP are the power ratios of high pressure turbine, medium pressure turbine, and low pressure turbine, respectively.
Figure 1. The IEEE first benchmark model [12].
The system consists of a turbogenerator shaft system, which includes high pressure turbine (HP),intermediate pressure turbine (IP), low pressure turbine A (LP-A), low pressure turbine B (LP-B),generator (GEN), and exciter (EXC), and an infinite bus with a series compensated transmissionline. The system models include turbogenerator shaft system, turbine speed governing system,turbine prime mover system, generator electromagnetic circuits, exciter system, transmission lines,
Energies 2019, 12, 3282 4 of 13
and series compensation circuit system. The models of the turbine speed governing system and turbineprime mover system are as follows. Other models are given in [13].
2.2.1. Turbine Speed Governing System
The main function of the speed governing system of a modern large turbogenerator is to adjustthe speed and load of the system. The state characteristic equations of the speed governing system atan operating point are established as follows [8]. p∆α = −
KGTSR
∆ω− 1TSR
∆αp∆µ = 1
TSM∆α− 1
TSM∆µ
(4)
where TSM is the integral time constant of the oil motive, KG and TSR are the amplification factor andtime constant of the speed regulator, respectively. α and µ are the position of the speed relay and theopening of the turbine inlet valve, respectively.
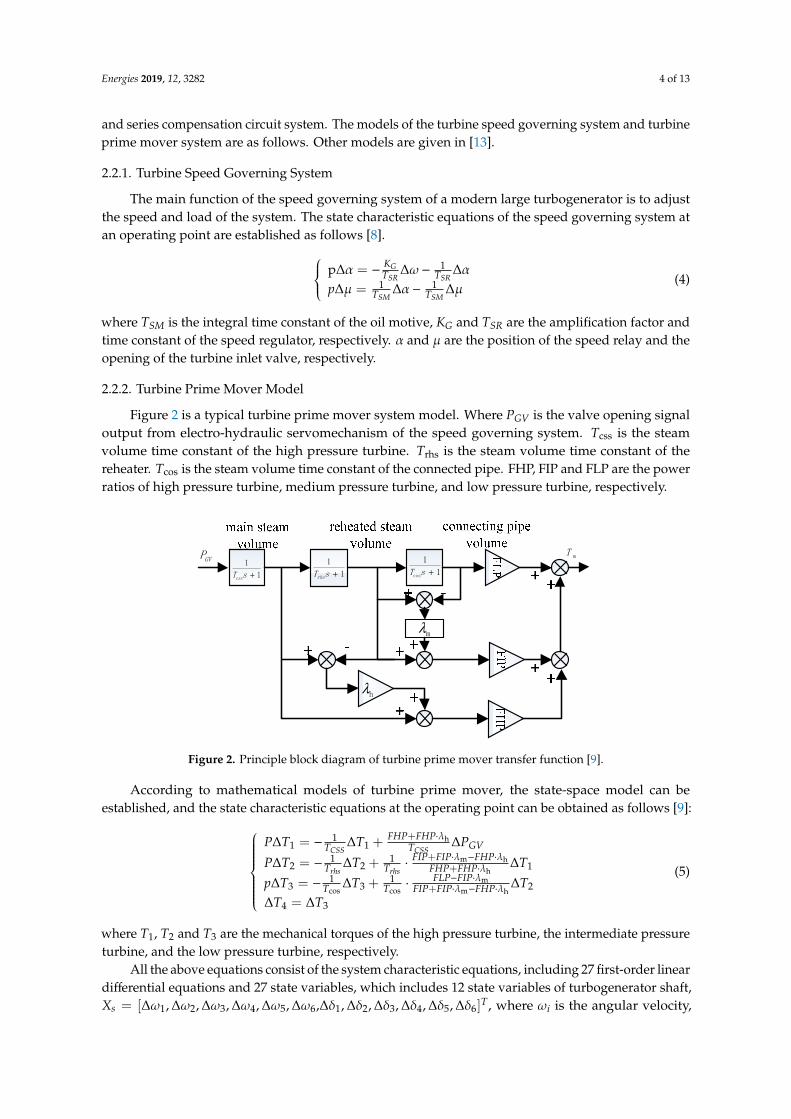
2.2.2. Turbine Prime Mover Model
Figure 2 is a typical turbine prime mover system model. Where PGV is the valve opening signaloutput from electro-hydraulic servomechanism of the speed governing system. Tcss is the steamvolume time constant of the high pressure turbine. Trhs is the steam volume time constant of thereheater. Tcos is the steam volume time constant of the connected pipe. FHP, FIP and FLP are the powerratios of high pressure turbine, medium pressure turbine, and low pressure turbine, respectively.Energies 2019, 12, x FOR PEER REVIEW 5 of 15
1
1
+sTcss 1
1
+sTrhs1
1
cos +sT
mλ
hλ
GVP mT
Figure 2. Principle block diagram of turbine prime mover transfer function [9].
According to mathematical models of turbine prime mover, the state-space model can be established, and the state characteristic equations at the operating point can be obtained as follows [9]:
Δ=Δ
Δ⋅−⋅+
⋅−⋅+Δ−=Δ
Δ⋅+
⋅−⋅+⋅+Δ−=Δ
Δ⋅++Δ−=Δ
34
2hm
m
cos3
cos3
1h
hm22
h11
11
11
1
TT
TFHPFIPFIP
FIPFLPT
TT
Tp
TFHPFHP
FHPFIPFIPT
TT
TP
PTFHPFHPT
TTP
rhsrhs
GVCSSCSS
λλλλ
λλ
λ
(5)
where, 1T , 2T , and 3T are the mechanical torques of the high pressure turbine, the intermediate pressure turbine, and the low pressure turbine, respectively.
All the above equations consist of the system characteristic equations, including 27 first-order linear differential equations and 27 state variables, which includes 12 state variables of turbogenerator shaft, ,,,,,,[ 654321 ωωωωωω ΔΔΔΔΔΔ=sX
T],,,,, 654321 δδδδδδ ΔΔΔΔΔΔ , where iω is the angular velocity , and iδ is the angular displacement of mass i. Two state variables of
turbine speed governing system, [ ]TgX μα ΔΔ= , ; three state variables of turbogenerator prime
movers, [ ]Ty TTTX 321 ΔΔΔ= ,, ; six state variables of generator electromagnetic voltage circuit, T
gqDfdG iii,i,iX ],,[ ΔΔΔΔΔ= , where gqDfd ii,i,ii ,, , and Qi are the currents through six windings
of the generator, which are stator equivalent d-axis winding, excitation winding, d-axis damper winding D, stator equivalent q-axis winding, q-axis damping winding g and Q, respectively; two
state variables of excitation system, [ ]TfdR EuX ΔΔ= ,e , where Ru and fdE are an intermediate
variable of the excitation system and the output voltage of the exciter, respectively; two state
variables of series compensation capacitors, [ ]TcqcdA uuX ΔΔ= , , where cdu and cqu are the
components of the voltage across the series compensation capacitor at the d-axis and the q-axis, respectively.
3. Case Analysis
3.1. Model Parameters
Figure 2. Principle block diagram of turbine prime mover transfer function [9].
According to mathematical models of turbine prime mover, the state-space model can beestablished, and the state characteristic equations at the operating point can be obtained as follows [9]:
P∆T1 = − 1TCSS
∆T1 +FHP+FHP·λh
TCSS∆PGV
P∆T2 = − 1Trhs
∆T2 +1
Trhs·
FIP+FIP·λm−FHP·λhFHP+FHP·λh
∆T1
p∆T3 = − 1Tcos
∆T3 +1
Tcos·
FLP−FIP·λmFIP+FIP·λm−FHP·λh
∆T2
∆T4 = ∆T3
(5)
where T1, T2 and T3 are the mechanical torques of the high pressure turbine, the intermediate pressureturbine, and the low pressure turbine, respectively.
All the above equations consist of the system characteristic equations, including 27 first-order lineardifferential equations and 27 state variables, which includes 12 state variables of turbogenerator shaft,Xs = [∆ω1, ∆ω2, ∆ω3, ∆ω4, ∆ω5, ∆ω6,∆δ1, ∆δ2, ∆δ3, ∆δ4, ∆δ5, ∆δ6]
T, where ωi is the angular velocity,

Energies 2019, 12, 3282 5 of 13
and δi is the angular displacement of mass i. Two state variables of turbine speed governingsystem, Xg = [∆α, ∆µ]T; three state variables of turbogenerator prime movers, Xy = [∆T1, ∆T2, ∆T3]
T;six state variables of generator electromagnetic voltage circuit, XG = [∆id, ∆i f , ∆iD, ∆iq, ∆ig]
T, whereid, i f , iD, iq, ig and iQ are the currents through six windings of the generator, which are stator equivalentd-axis winding, excitation winding, d-axis damper winding D, stator equivalent q-axis winding, q-axis
damping winding g and Q, respectively; two state variables of excitation system, Xe =[∆uR, ∆E f d
]T,
where uR and E f d are an intermediate variable of the excitation system and the output voltage of
the exciter, respectively; two state variables of series compensation capacitors, XA =[∆ucd, ∆ucq
]T,
where ucd and ucq are the components of the voltage across the series compensation capacitor at thed-axis and the q-axis, respectively.
3. Case Analysis
3.1. Model Parameters
The IEEE FBM model shown in Figure 1 is used for SSR studies. The system specific parametersand initial state variables are as follows [12].
A. Turbogenerator shaft parameters:The shaft system of the turbogenerator is modeled as a multi-mass system, including four turbine
sections, a generator, and an exciter. Turbogenerator shaft parameters are shown in Table 2.
Table 2. Turbogenerator shaft parameters [12].
Mass Block Inertia Constant, TJ (s) Shaft Segment Elastic Constant, K (p.u.)
HP 0.185794 - -IP 0.311178 HP-IP 19.303
LPA 1.717340 IP-LPA 34.929LPB 1.768430 LPA-LPB 52.038GEN 1.736990 LPB-GEN 70.858EXC 0.068433 GEN-EXC 2.822
The natural frequencies of the torsional vibration of the turbogenerator shaft are 15.78, 20.22,25.56, 32.31, and 47.46 Hz, respectively.
The following parameters are given in p.u., unless stated otherwise.
B. Turbine prime mover parameters:FHP = 0.3, FIP = 0.26, FLP = 0.44, Tcss = 0.3, Trhs = 7.0, Tcos = 0.2.
C. Transformer, series compensated transmission lines, and infinite power grid parametersPbase = 892.4MVA, XT = 0.14, RT = 0.01, XL = 0.56, RL = 0.02, XS = 0.06.
D. Synchronous generator parameters:Xd = 1.79, Xq = 1.71, Xad = 1.66, Xaq = 1.58, X f = 0.001, XD = 1.666, Xg = 1.825, XQ = 1.695,
Ra = 0.0015, R f = 0.001, RD = 0.0037, Rg = 0.0182, RQ = 0.0053.
E. Control system parameters of unit side:KG = 25, TSR = 0.2, TSM = 0.3, KA = 50, TE = 0.002, TA = 0.1.
F. System initial operating condition parameters:Pe =0.9, Vt = 1.05, cosϕ = 0.9(lag).
3.2. Eigenvalue Calculation Results
Based on the above system parameters and initial state variables, the eigenvalue analysis methodcan be used to calculate all 27 eigenvalues of the system, which consists of nine pairs of conjugatecomplex numbers and nine real numbers. In this model, eigenvalues 1 to 12 (six pairs of conjugate
Energies 2019, 12, 3282 6 of 13
complex numbers) represent the torsional dynamics of the turbogenerator shaft system. Eigenvalues 1and 2 correspond to the low frequency oscillation mode (TM0). Eigenvalues 3 to 12 correspond to thetorsional modes (TM1 to TM5). Eigenvalues 17 to 18 and 19 to 20 represent the supersynchronous andsubsynchronous electric network modes, respectively.
The series capacitor compensation level of transmission lines is the dominant factor influencingthe electrical damping of subsynchronous oscillations. The definition of compensation level kC forseries capacitors given by
kC =XCXL
(6)
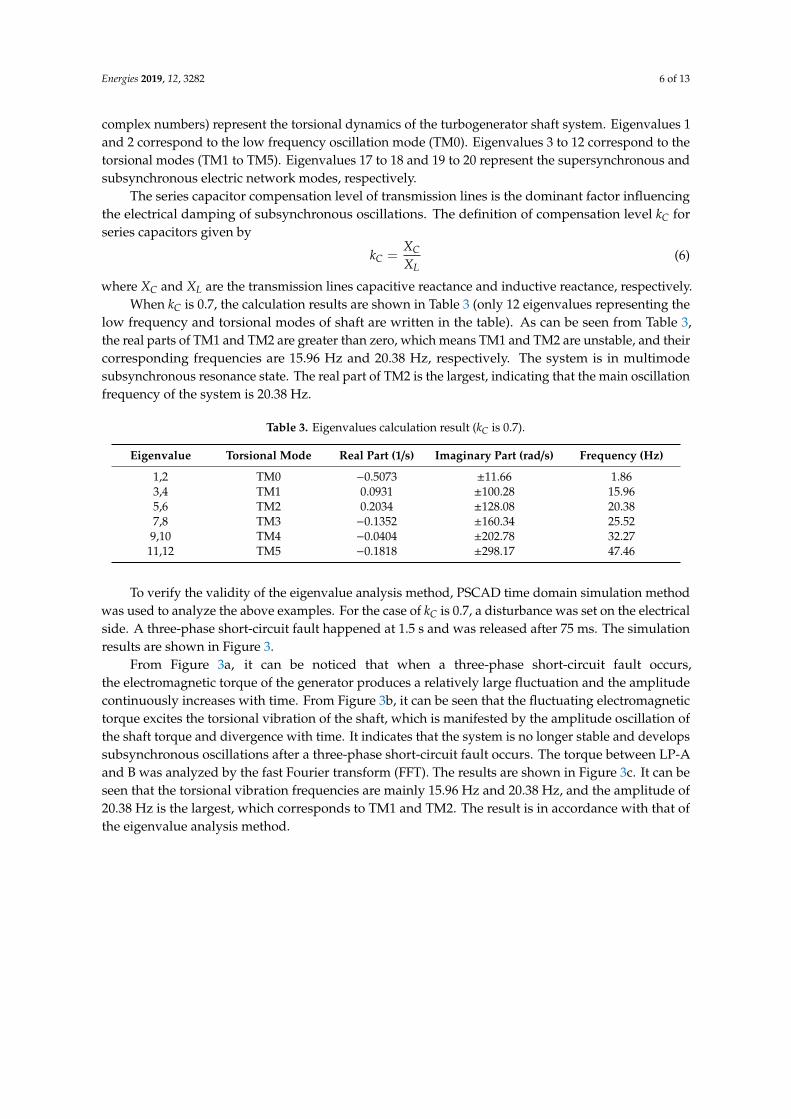
where XC and XL are the transmission lines capacitive reactance and inductive reactance, respectively.When kC is 0.7, the calculation results are shown in Table 3 (only 12 eigenvalues representing the
low frequency and torsional modes of shaft are written in the table). As can be seen from Table 3,the real parts of TM1 and TM2 are greater than zero, which means TM1 and TM2 are unstable, and theircorresponding frequencies are 15.96 Hz and 20.38 Hz, respectively. The system is in multimodesubsynchronous resonance state. The real part of TM2 is the largest, indicating that the main oscillationfrequency of the system is 20.38 Hz.
Table 3. Eigenvalues calculation result (kC is 0.7).
Eigenvalue Torsional Mode Real Part (1/s) Imaginary Part (rad/s) Frequency (Hz)
1,2 TM0 −0.5073 ±11.66 1.863,4 TM1 0.0931 ±100.28 15.965,6 TM2 0.2034 ±128.08 20.387,8 TM3 −0.1352 ±160.34 25.52
9,10 TM4 −0.0404 ±202.78 32.2711,12 TM5 −0.1818 ±298.17 47.46
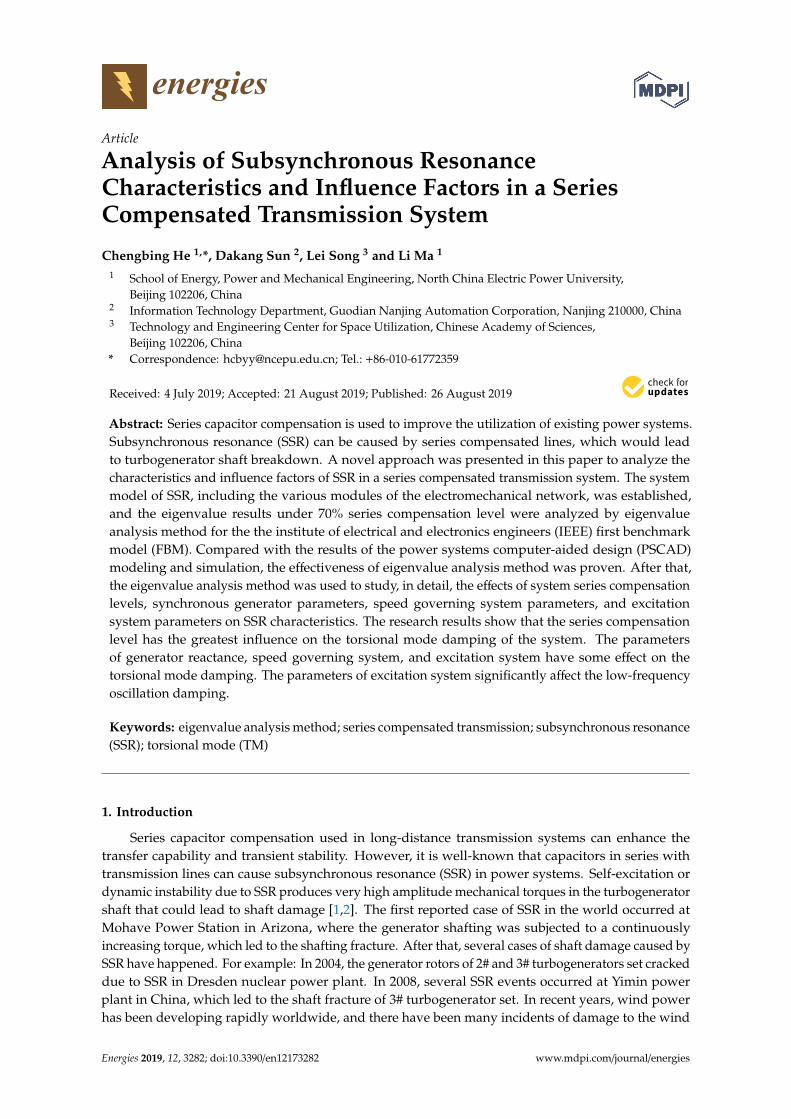
To verify the validity of the eigenvalue analysis method, PSCAD time domain simulation methodwas used to analyze the above examples. For the case of kC is 0.7, a disturbance was set on the electricalside. A three-phase short-circuit fault happened at 1.5 s and was released after 75 ms. The simulationresults are shown in Figure 3.
From Figure 3a, it can be noticed that when a three-phase short-circuit fault occurs,the electromagnetic torque of the generator produces a relatively large fluctuation and the amplitudecontinuously increases with time. From Figure 3b, it can be seen that the fluctuating electromagnetictorque excites the torsional vibration of the shaft, which is manifested by the amplitude oscillation ofthe shaft torque and divergence with time. It indicates that the system is no longer stable and developssubsynchronous oscillations after a three-phase short-circuit fault occurs. The torque between LP-Aand B was analyzed by the fast Fourier transform (FFT). The results are shown in Figure 3c. It can beseen that the torsional vibration frequencies are mainly 15.96 Hz and 20.38 Hz, and the amplitude of20.38 Hz is the largest, which corresponds to TM1 and TM2. The result is in accordance with that ofthe eigenvalue analysis method.

Energies 2019, 12, 3282 7 of 13Energies 2019, 12, x FOR PEER REVIEW 8 of 15
(a) (b)
(c)
Figure 3. System response in three phase short circuit fault. (a) Generator electromagnetic torque. (b) LPA-LPB torque. (c) Fast Fourier transform (FFT) of the LPA-LPB torque.
4. Analysis of Influence Factors of SSR
4.1. Influence of Compensation Level
The eigenvalue analysis method was used to calculate the system eigenvalues with different compensation levels Ck , and the results are shown in Table 4 and Figure 4.
Table 4. System eigenvalues with different compensation levels KC.
Eigenvalue Torsional
Mode KC = 0.1 KC =0.3 KC = 0.5 KC = 0.7 KC = 0.9
1,2 TM0 0.0693 ± j8.46 −0.0748 ± j9.31 −0.2597 ± j10.35 −0.5073 ± j11.66 −0.8623 ± j13.41
3,4 TM1 −0.1487 ± j99.13 −0.1422 ± j99.27 −0.1106 ± j99.52 0.0931 ± j100.28 3.9947 ± j98.05
5,6 TM2 −0.6549 ± j127.02 −0.6525 ± j127.03 −0.6423 ± j127.07 0.2034 ± j128.08 −0.6522 ± j126.92
7,8 TM3 −0.1627 ± j160.62 −0.1479 ± j160.69 0.4564 ± j161.08 −0.1351 ± j160.34 −0.1644 ± j160.46
9,10 TM4 −0.0301 ± j203.01 0.3233 ± j203.43 −0.0125 ± j202.68 −0.0404 ± j202.78 −0.0449 ± j202.84
11,12 TM5 −0.1819 ± j298.17 −0.1819 ± j298.17 −0.1819 ± j298.17 −0.1819 ± j298.17 −0.1819 ± j298.17
13,14 SUB −7.1191 ± j283.35 −7.1702 ± j213.94 −7.0882 ± j166.68 −6.5888 ± j128.06 −9.1422 ± j96.86
15,16 SUPER −7.5026 ± j470.47 −7.5806 ± j539.24 −7.6238 ± j586.55 −7.6543 ± j624.99 −7.6778 ± j658.22
17,18 −4.6872 ± j0.6335 −4.7382 ± j0.3856 −4.8737 ± j0.2566 −4.9573 ± j0.1521 −3.4114 ± j0.5459
19 −1.8966 −1.8446 −1.7833 −1.6996 −1.5619
Figure 3. System response in three phase short circuit fault. (a) Generator electromagnetic torque.(b) LPA-LPB torque. (c) Fast Fourier transform (FFT) of the LPA-LPB torque.
4. Analysis of Influence Factors of SSR
4.1. Influence of Compensation Level
The eigenvalue analysis method was used to calculate the system eigenvalues with differentcompensation levels kC, and the results are shown in Table 4 and Figure 4.
Energies 2019, 12, x FOR PEER REVIEW 9 of 15
20 −24.7628 −24.7842 −24.8113 −24.8466 −24.8939
21 −30.8793 −31.5042 −32.3627 −33.6064 −35.5306
22 −8.5726 −8.3123 −7.9786 −7.5383 −6.9382
23 −101.8931 −101.7953 −101.648 −101.4514 −101.1882
24 −499.9582 −499.9821 −499.9783 −499.9742 −499.9713
25 −2.9453 −3.1215 −3.4887 −3.4828 −3.9244
26 −0.1417 −0.1417 −0.1418 −0.1419 −0.1419
27 −4.6223 −4.3293 −3.6731 −3.5842 −4.1051
sum −696.0893 −696.1123 −696.1281 −696.0932 −696.1024
(a) (b)
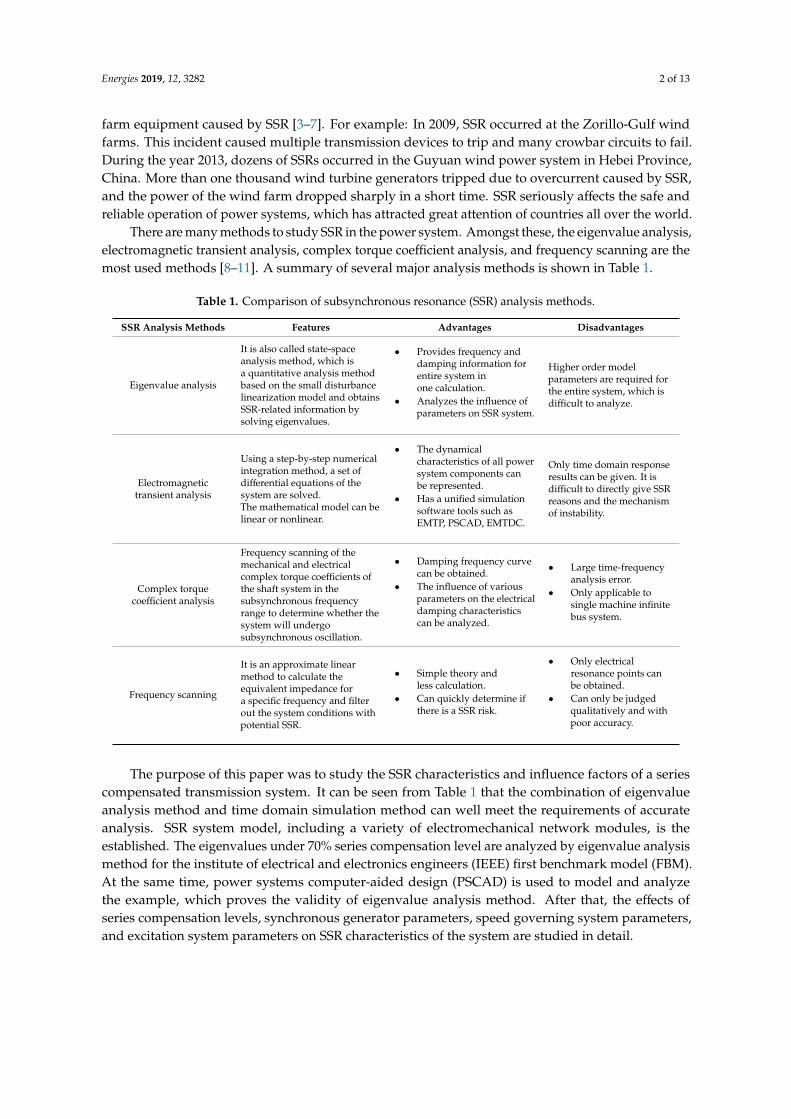
Figure 4. Influence of series compensation level on SSR characteristics. (a) The imaginary parts of eigenvalues. (b) The real parts of eigenvalues.
Table 4 shows the system eigenvalues when Ck is 0.1, 0.3, 0.5, 0.7, and 0.9, respectively. Figure 4a describes the variation of the torsional mode frequency and the electrical resonance complementary frequency with Ck . In the figure, SUBf corresponds to the electrical resonance complementary frequency, and its calculation formula given by [11]
++′′−=
LT
CSUB XXX
Xff 10
(7)
where 0f is the synchronous frequency, TX is the leakage reactance of the transformer, X ′′ is the subtransient reactance of the generator, and CX and LX are the transmission line inductive and capacitive reactance, respectively. Figure 4b depicts the variation of the real part of eigenvalue with Ck .
It can be seen from Table 4 that eigenvalues are different in the case of different Ck , but all the sums of the eigenvalues are constant and the absolute value is about 696.1, which indicates that the total damping of the system is conserved, that is, the changes of Ck do not affect the total system damping. Changing Ck will cause various part damping of the system to be transferred and distributed between different locations, but the total system damping remains unchanged. When Ck is small, the real part of TM0 is positive, the corresponding damping is negative, and the
system is prone to low-frequency oscillations. This is because the total reactance of transmission
Figure 4. Influence of series compensation level on SSR characteristics. (a) The imaginary parts ofeigenvalues. (b) The real parts of eigenvalues.

Energies 2019, 12, 3282 8 of 13
Table 4. System eigenvalues with different compensation levels KC.
Eigenvalue Torsional Mode KC = 0.1 KC = 0.3 KC = 0.5 KC = 0.7 KC = 0.9
1,2 TM0 0.0693 ± j8.46 −0.0748 ± j9.31 −0.2597 ± j10.35 −0.5073 ± j11.66 −0.8623 ± j13.413,4 TM1 −0.1487 ± j99.13 −0.1422 ± j99.27 −0.1106 ± j99.52 0.0931 ± j100.28 3.9947 ± j98.055,6 TM2 −0.6549 ± j127.02 −0.6525 ± j127.03 −0.6423 ± j127.07 0.2034 ± j128.08 −0.6522 ± j126.927,8 TM3 −0.1627 ± j160.62 −0.1479 ± j160.69 0.4564 ± j161.08 −0.1351 ± j160.34 −0.1644 ± j160.46
9,10 TM4 −0.0301 ± j203.01 0.3233 ± j203.43 −0.0125 ± j202.68 −0.0404 ± j202.78 −0.0449 ± j202.8411,12 TM5 −0.1819 ± j298.17 −0.1819 ± j298.17 −0.1819 ± j298.17 −0.1819 ± j298.17 −0.1819 ± j298.1713,14 SUB −7.1191 ± j283.35 −7.1702 ± j213.94 −7.0882 ± j166.68 −6.5888 ± j128.06 −9.1422 ± j96.8615,16 SUPER −7.5026 ± j470.47 −7.5806 ± j539.24 −7.6238 ± j586.55 −7.6543 ± j624.99 −7.6778 ± j658.2217,18 −4.6872 ± j0.6335 −4.7382 ± j0.3856 −4.8737 ± j0.2566 −4.9573 ± j0.1521 −3.4114 ± j0.5459
19 −1.8966 −1.8446 −1.7833 −1.6996 −1.561920 −24.7628 −24.7842 −24.8113 −24.8466 −24.893921 −30.8793 −31.5042 −32.3627 −33.6064 −35.530622 −8.5726 −8.3123 −7.9786 −7.5383 −6.938223 −101.8931 −101.7953 −101.648 −101.4514 −101.188224 −499.9582 −499.9821 −499.9783 −499.9742 −499.971325 −2.9453 −3.1215 −3.4887 −3.4828 −3.924426 −0.1417 −0.1417 −0.1418 −0.1419 −0.141927 −4.6223 −4.3293 −3.6731 −3.5842 −4.1051
sum −696.0893 −696.1123 −696.1281 −696.0932 −696.1024
Table 4 shows the system eigenvalues when kC is 0.1, 0.3, 0.5, 0.7 and 0.9, respectively. Figure 4adescribes the variation of the torsional mode frequency and the electrical resonance complementaryfrequency with kC. In the figure, fSUB corresponds to the electrical resonance complementary frequency,and its calculation formula given by [11]
fSUB = f0
1− √ XCX′′ + XT + XL
(7)
where f0 is the synchronous frequency, XT is the leakage reactance of the transformer, X′′ is thesubtransient reactance of the generator, and XC and XL are the transmission line inductive andcapacitive reactance, respectively. Figure 4b depicts the variation of the real part of eigenvalue with kC.
It can be seen from Table 4 that eigenvalues are different in the case of different kC, but all thesums of the eigenvalues are constant and the absolute value is about 696.1, which indicates that thetotal damping of the system is conserved, that is, the changes of kC do not affect the total systemdamping. Changing kC will cause various part damping of the system to be transferred and distributedbetween different locations, but the total system damping remains unchanged. When kC is small,the real part of TM0 is positive, the corresponding damping is negative, and the system is prone tolow-frequency oscillations. This is because the total reactance of transmission lines is larger when kCis low. The electric distance of transmission lines is longer, and low frequency oscillations can occurif a power system stabilizer is not installed in the system. With the increase of kC, it is equivalent toshortening the electrical distance of the transmission lines and enhancing the connection betweengenerators and the system, and the risk of low frequency oscillations is reduced. When kC is greaterthan 0.3, the real part of the TM0 eigenvalue is negative, which indicates that low-frequency oscillationsdo not occur in the system.
From Table 4, it can be seen that when kC is equal to 0.3, the real part of TM4 is positive (0.3233),and the oscillation frequency is 32.27 Hz; when kC is equal to 0.5, the real part of TM3 is positive (0.4564),and the oscillation frequency is 25.56 Hz; When kC is equal to 0.7, the real parts of TM2 and TM1 arepositive, and the oscillation frequencies are 20.22 Hz and 15.78 Hz, respectively; when kC is equal to0.9, the real part of TM1 is positive (3.9947) and the oscillation frequency is 15.78 Hz. This shows thatwhen kC is greater than 0.3, at least one eigenvalue of the system is positive, that is, there is always anegative damping of a torsional mode. Then, the system is likely to cause SSR. With the increase of kC,the dominant oscillation frequency decreases.
From Figure 4a, it can be noticed that the imaginary parts of TM1 to TM5’s eigenvalues changevery little in the process of kC being changed from zero to one, that is, the torsional mode frequencies( fTMx) of the turbogenerator shaft remain basically unchanged. The reason is that the torsional natural

Energies 2019, 12, 3282 9 of 13
frequencies are mainly determined by the turbogenerator shaft structure parameters, and the torsionalnatural frequencies will be determined after the turbogenerator is manufactured. The electricalresonance complementary frequency ( fSUB) decreases with the increase of kC. The changed amplitudeis relatively large, and it will generate intersections with different torsional resonant frequencies.At these intersections, the torsional frequency and the electrical resonant frequency are complementary.
From Figure 4b, it can be noticed that the damping of TM1 to TM5 vary greatly. The closer fTM
is to fSUB, the larger the real part of the eigenvalue is. When fTM is equal to fSUB, the real part ofthe eigenvalue reaches the maximum, which means that the risk of torsional vibration is maximum.The real part of TM5 eigenvalue (47.46 Hz) is negative in the process of kC being changed from 0 to 1,and it will not cause instability. The other four SSR modes will cause instability, and kC of instabilityareas are as follows: For TM4 (32.31 Hz), kC of instability areas is between 0.21 and 0.447, and instabilityis the most serious when kC is 0.35. For TM3 (25.56 Hz), kC of instability areas is between 0.43 and0.64, and instability is the most serious when kC is 0.53. For TM2 (20.22 Hz), kC of instability areas isbetween 0.67 and 0.72, and instability is the most serious when kC is 0.71. For TM1 (15.78 Hz), kC ofinstability areas is between 0.62 and 1.0, and instability is the most serious when kC is 0.86. Due tothe overlapping of instability intervals, the turbogenerator may generate multimode SSR instabilityproblems, for example, when kC is 0.7, both TM2 and TM1 are in a instability state.
4.2. Influence of Synchronous Generator Parameters
The parameters of synchronous generators include reactance and resistance parameters.The reactance parameters mainly include stator leakage reactance Xl, d-axis synchronous reactanceXd, q-axis synchronous reactance Xq, d-axis armature reaction reactance Xad, q-axis armature reactionreactance Xaq, excitation winding reactance X f , d-axis damper winding D reactance XD, q-axis damperwinding g reactance Xg, and q-axis damper winding Q reactance XQ. The resistance parameters mainlyinclude armature winding resistance Ra, excitation winding resistance R f , d-axis damper windingD resistance RD, q-axis damper winding g resistance Rg, and q-axis damper winding Q resistanceRQ. Among them, the study of parameters Xd and Xq for SSR can be converted into the analysis ofparameter Xl. Taking kC as 0.5, the generator parameters vary from 50% to 150% of nominal value.The eigenvalue analysis method was used to calculate the eigenvalues of five torsional modes, and theresults are shown in Figure 5.
It can be seen from Figure 5a that the frequency of each torsional mode remains basically unchangedwhen Xl increases, and the other electrical parameters have the same effect on the torsional frequency,which means that the torsional frequency of the turbogenerator shaft is basically irrelevant to thereactance parameters. It can be seen from Figure 5b that the real part of TM3 eigenvalue decreasesslightly when Xl increases, and the corresponding negative damping decreases, which is beneficial tothe stability of TM3.
The real part of TM4 eigenvalue increases, which means positive damping decreases and negativedamping increases. When Xl is greater than 1.2, the real part of TM4 eigenvalue changes from negativeto positive and TM4 oscillation is excited. The system presents a multimode resonance state inwhich TM3 and TM4 coexist. The reason is that the fSUB increases continuously when Xl increases,which transitions from near fTM3 to near fTM4.
The influence of reactance parameters X f , XD, Xg and XQ on the eigenvalues is similar, so Figure 5cshows only the influence of X f . It can be seen from the Figure 5c, the influence of reactance parametersX f on the eigenvalues is similar to Xl, but their influence on the real parts of the eigenvalues is lessthan Xl.
Figure 5d describes the effect of the generator resistance parameter Ra on the eigenvalues, and itcan be seen that Ra has little effect on the real parts of the eigenvalues, because Ra is much smallerthan the line resistance and has very little effect on the torsional modes. The effect of other resistanceparameters is similar to that of Ra.

Energies 2019, 12, 3282 10 of 13
In conclusion, neither the generator reactance parameters nor the resistance parameters willaffect the torsional frequencies of the shaft system. When the reactance parameters of the generatorchange, which makes fSUB and fTMx close to each other, the SSR instability may occur. However, it willincrease the damping of the adjacent torsional modes, which is beneficial to its stability. The resistanceparameters of synchronous generator have little effect on each torsional mode and it can be ignored.
Energies 2019, 12, x FOR PEER REVIEW 11 of 15
resistance fR , d-axis damper winding D resistance DR , q-axis damper winding g resistance gR ,
and q-axis damper winding Q resistance QR . Among them, the study of parameters dX and qX
for SSR can be converted into the analysis of parameter lX . Taking Ck as 0.5, the generator parameters vary from 50% to 150% of nominal value. The eigenvalue analysis method was used to calculate the eigenvalues of five torsional modes, and the results are shown in Figure 5.
(a) (b)
(c) (d)
Figure 5. Influence of synchronous generator parameters on SSR characteristics. The imaginary parts of eigenvalues affected by (a) lX , the real parts of eigenvalues affected by (b) lX , (c) fX , (d) aR .
It can be seen from Figure 5a that the frequency of each torsional mode remains basically unchanged when lX increases, and the other electrical parameters have the same effect on the torsional frequency, which means that the torsional frequency of the turbogenerator shaft is basically irrelevant to the reactance parameters. It can be seen from Figure 5b that the real part of TM3 eigenvalue decreases slightly when lX increases, and the corresponding negative damping decreases, which is beneficial to the stability of TM3.
The real part of TM4 eigenvalue increases, which means positive damping decreases and negative damping increases. When lX is greater than 1.2, the real part of TM4 eigenvalue changes from negative to positive and TM4 oscillation is excited. The system presents a multimode resonance state in which TM3 and TM4 coexist. The reason is that the SUBf increases continuously when lX increases, which transitions from near fTM3 to near fTM4.
The influence of reactance parameters fX , DX , gX , and QX on the eigenvalues is similar, so
Figure 5c shows only the influence of fX . It can be seen from the Figure 5c, the influence of
Figure 5. Influence of synchronous generator parameters on SSR characteristics. The imaginary partsof eigenvalues affected by (a) Xl, the real parts of eigenvalues affected by (b) Xl, (c) X f , (d) Ra.
4.3. Influence of Speed Governing System Parameters
4.3.1. With or Without Speed Governing System
The system models with and without a speed governing system were established, respectively.The eigenvalue analysis method was used to calculate the eigenvalues when kC is 0.5. The results areshown in Table 5. It can be seen from the Table that when there is a speed governing system, the realpart of each eigenvalue is slightly increased, which indicates that the existence of the speed governingsystem reduces the system damping and results in poor system stability. The speed governing systemhas a significant impact on the TM0, reducing the TM0 damping and frequency.
Energies 2019, 12, 3282 11 of 13
Table 5. Eigenvalues with and without speed governing system.
Torsional ModeWith Speed Governing System Without Speed Governing System
Real Part (1/s) Imaginary Part (rad/s) Real Part (1/s) Imaginary Part (rad/s)
TM0 −0.2597 10.35 −0.3099 10.56TM1 −0.1818 298.17 −0.1828 298.17TM2 −0.0125 202.68 −0.0153 202.68TM3 0.4564 161.08 0.4453 161.08TM4 −0.6423 127.07 −0.6505 127.07TM5 −0.1106 99.52 −0.1224 99.52
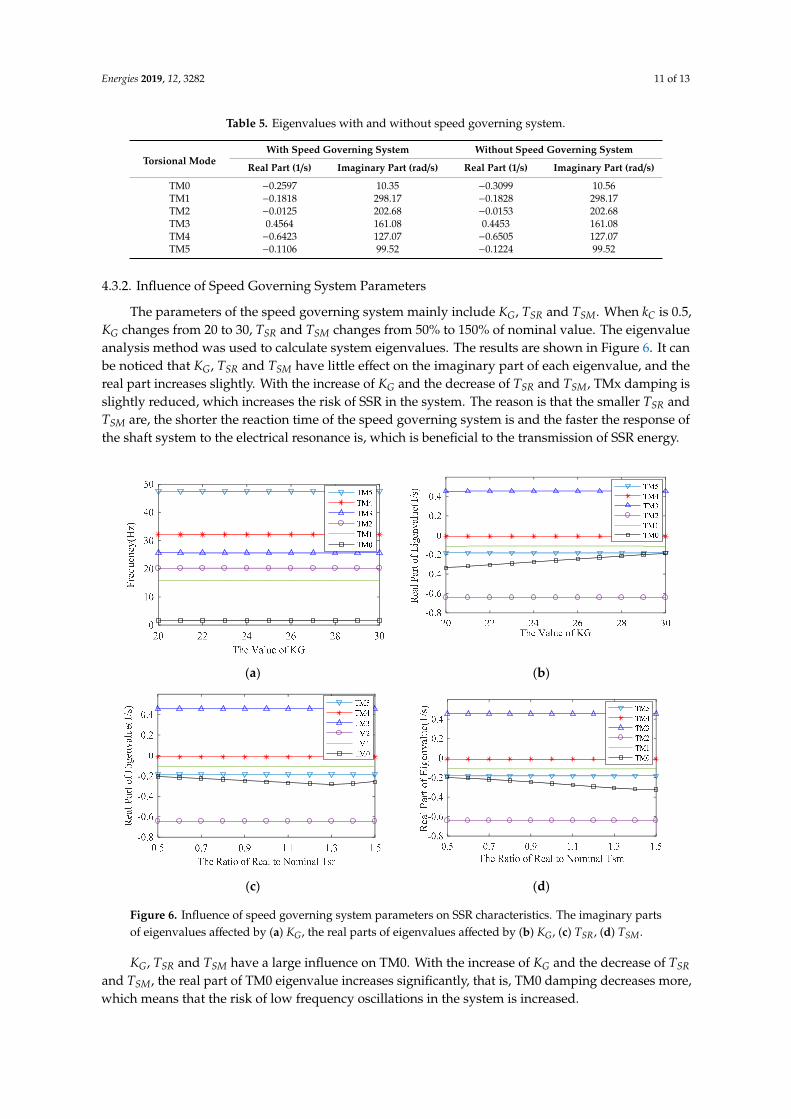
4.3.2. Influence of Speed Governing System Parameters
The parameters of the speed governing system mainly include KG, TSR and TSM. When kC is 0.5,KG changes from 20 to 30, TSR and TSM changes from 50% to 150% of nominal value. The eigenvalueanalysis method was used to calculate system eigenvalues. The results are shown in Figure 6. It canbe noticed that KG, TSR and TSM have little effect on the imaginary part of each eigenvalue, and thereal part increases slightly. With the increase of KG and the decrease of TSR and TSM, TMx damping isslightly reduced, which increases the risk of SSR in the system. The reason is that the smaller TSR andTSM are, the shorter the reaction time of the speed governing system is and the faster the response ofthe shaft system to the electrical resonance is, which is beneficial to the transmission of SSR energy.
Energies 2019, 12, x FOR PEER REVIEW 13 of 15
reason is that the smaller SRT and SMT are, the shorter the reaction time of the speed governing system is and the faster the response of the shaft system to the electrical resonance is, which is beneficial to the transmission of SSR energy.
(a) (b)
(c) (d)
Figure 6. Influence of speed governing system parameters on SSR characteristics. The imaginary parts of eigenvalues affected by (a) GK , the real parts of eigenvalues affected by (b) GK , (c) SRT ,
(d) SMT .
GK , SRT , and SMT have a large influence on TM0. With the increase of GK and the decrease of
SRT and SMT , the real part of TM0 eigenvalue increases significantly, that is, TM0 damping decreases more, which means that the risk of low frequency oscillations in the system is increased.
4.4. Influence of Excitation System Parameters
In the excitation regulator, the magnification of the excitation regulator AK is an important parameter. Taking Ck as 0.5 and changing AK from 25 to 75, the eigenvalue analysis method was used to calculate eigenvalues of the system, and the result is shown in Figure 7.
Figure 6. Influence of speed governing system parameters on SSR characteristics. The imaginary partsof eigenvalues affected by (a) KG, the real parts of eigenvalues affected by (b) KG, (c) TSR, (d) TSM.
KG, TSR and TSM have a large influence on TM0. With the increase of KG and the decrease of TSRand TSM, the real part of TM0 eigenvalue increases significantly, that is, TM0 damping decreases more,which means that the risk of low frequency oscillations in the system is increased.

Energies 2019, 12, 3282 12 of 13
4.4. Influence of Excitation System Parameters
In the excitation regulator, the magnification of the excitation regulator KA is an importantparameter. Taking kC as 0.5 and changing KA from 25 to 75, the eigenvalue analysis method was usedto calculate eigenvalues of the system, and the result is shown in Figure 7.Energies 2019, 12, x FOR PEER REVIEW 14 of 15
Figure 7. Influence of excitation system parameters on SSR characteristics.
As can be seen from Figure 7, with the increase of AK , the real part of TM3 eigenvalue decreases. That is to say, the negative damping of TM3 in the divergence mode decreases, which means that increasing AK can reduce the instability of SSR and reduce the risk of SSR. With the increase of AK , the real part of TM0 eigenvalue increases significantly, that is, the damping value of TM0 is obviously reduced. When AK is greater than 58, the real part of TM0 eigenvalue even changes from negative to positive, and the system has the risk of generating divergent low-frequency oscillations.
5. Conclusions
The purpose of this paper was to study the SSR characteristics and influence factors of the series compensation transmission system. By using the eigenvalue analysis method and time domain simulation method, the eigenvalues of a series compensated transmission system were calculated, and the following conclusions can be drawn:
• The series compensation level Ck has the greatest influence on the torsional mode damping of the system. With the increase of Ck , one or more torsional mode damping will appear negative, indicating that the system may have a single mode or multimode SSR, and the greater Ck is, the lower the torsional mode frequency is, but the change of Ck does not affect total
damping of the system, that is, the total damping of the system is conserved.
• The parameters of the synchronous generator will not affect torsional mode frequencies of the turbogenerator shaft, and the reactance parameters of generators have a certain influence on torsional mode damping of the system. The variation of the reactance parameters may lead to instability of the torsional mode when SUBf and TMxf become close. However, the damping of adjacent torsional modes will be increased, which is beneficial to its stability. In addition, the resistance parameters of synchronous generator have little effect on the damping of each torsional mode, which can be ignored.
• Speed governing system parameters GK , SRT , and SMT have a great influence on TM0 damping, and slightly affect other torsional modes damping. Excitation system parameter AK significantly affects TM0 damping, and has little effect on other torsional modes damping.
Author Contributions: All the authors were involved in the data collection, model constructing, software simulation, results analysis and discussion, and manuscript preparation. All authors have approved the submitted manuscript.
Funding: This work is supported by the Open Research Fund of Key Laboratory of Space Utilization, Chinese Academy of Sciences (No. LSU-2016-04-02) and the Natural Science Foundation of Beijing, China (Grant No. 3132015 ).
Figure 7. Influence of excitation system parameters on SSR characteristics.
As can be seen from Figure 7, with the increase of KA, the real part of TM3 eigenvalue decreases.That is to say, the negative damping of TM3 in the divergence mode decreases, which means thatincreasing KA can reduce the instability of SSR and reduce the risk of SSR. With the increase of KA,the real part of TM0 eigenvalue increases significantly, that is, the damping value of TM0 is obviouslyreduced. When KA is greater than 58, the real part of TM0 eigenvalue even changes from negative topositive, and the system has the risk of generating divergent low-frequency oscillations.
5. Conclusions
The purpose of this paper was to study the SSR characteristics and influence factors of theseries compensation transmission system. By using the eigenvalue analysis method and time domainsimulation method, the eigenvalues of a series compensated transmission system were calculated,and the following conclusions can be drawn:
• The series compensation level kC has the greatest influence on the torsional mode damping ofthe system. With the increase of kC, one or more torsional mode damping will appear negative,indicating that the system may have a single mode or multimode SSR, and the greater kC is,the lower the torsional mode frequency is, but the change of kC does not affect total damping ofthe system, that is, the total damping of the system is conserved.
• The parameters of the synchronous generator will not affect torsional mode frequencies of theturbogenerator shaft, and the reactance parameters of generators have a certain influence ontorsional mode damping of the system. The variation of the reactance parameters may leadto instability of the torsional mode when fSUB and fTMx become close. However, the dampingof adjacent torsional modes will be increased, which is beneficial to its stability. In addition,the resistance parameters of synchronous generator have little effect on the damping of eachtorsional mode, which can be ignored.
• Speed governing system parameters KG, TSR and TSM have a great influence on TM0 damping,and slightly affect other torsional modes damping. Excitation system parameter KA significantlyaffects TM0 damping, and has little effect on other torsional modes damping.
Author Contributions: All the authors were involved in the data collection, model constructing,software simulation, results analysis and discussion, and manuscript preparation. All authors have approved thesubmitted manuscript.

Energies 2019, 12, 3282 13 of 13
Funding: This work is supported by the Open Research Fund of Key Laboratory of Space Utilization,Chinese Academy of Sciences (No. LSU-2016-04-02) and the Natural Science Foundation of Beijing, China (GrantNo. 3132015).
Conflicts of Interest: The authors declare no conflict of interest.
References
1. Bizzarri, F.; Brambilla, A.; Milano, F. Simplified model to study the induction generator effect of thesubsynchronous resonance phenomenon. IEEE Trans. Energy Conver. 2018, 33, 889–892. [CrossRef]
2. Kumar, R.; Harada, A.; Merkle, M.; Miri, A.M. Investigation of the influence of series compensation inAC transmission systems on the bus connected parallel generating units with respect to subsynchronousresonance (SSR). In Proceedings of the 2003 IEEE Bologna Power Tech Conference Proceedings, Bologna,Italy, 23–26 June 2003; pp. 1083–1088.
3. Li, J.; Zhang, P.X. Impact of increased wind power generation on subsynchronous resonance ofturbine-generator units. J. Mod. Power Syst. Clean Energy. 2016, 4, 219–228. [CrossRef]
4. Virulkar, V.B.; Gotmare, G.V. Sub-synchronous resonance in series compensated wind farm: A review.Renew. Sustain. Energy Rev. 2016, 55, 1010–1029. [CrossRef]
5. Xie, X.R.; Zhang, X.; Liu, H.K.; Liu, H.; Li, Y.H.; Zhang, C.Y. Characteristic analysis of subsynchronousresonance in practical wind farms connected to series-compensated transmissions. IEEE Trans. Energy Conver.2017, 32, 1117–1126. [CrossRef]
6. Zhu, B.C.; Hu, M.; Wu, Z. Parameters impact on the performance of a double-fed induction generator-basedwind turbine for subsynchronous resonance control. IET Renew. Power Gener. 2012, 6, 92–98. [CrossRef]
7. Chen, W.H.; Xie, X.R.; Wang, D.H. Probabilistic stability analysis of subsynchronous resonance for seriescompensated DFIG-based wind farms. IEEE Trans. Sustain. Energ. 2018, 9, 400–409. [CrossRef]
8. Park, J.K.; Kim, C.H.; Cho, G.J.; Sohn, S.H.; Chung, S.J. A Novel Reclosing Algorithm ConsideringTurbine-Generator Shaft Torque. IEEE Trans. Power Deliv. 2017, 32, 703–712. [CrossRef]
9. Dong, D.Y.; Chen, W.H.; Zhang, J.; Tan, L.N. Subsynchronous resonance modeling method for real systems.Power Syst. Tech. 2015, 39, 1059–1066.
10. Johansson, N.; Ängquist, L.; Nee, H.P. A comparison of different frequency scanning methods for study ofsubsynchronous resonance. IEEE Trans. Power Syst. 2011, 26, 356–363. [CrossRef]
11. Li, H.F.; Liu, C.R.; Han, M.X. Analysis on subsynchronous resonance caused by series compensation in ACsystem based on frequency-scanning and eigenvalue. Power Syst. Tech. 2012, 36, 107–112.
12. IEEE Subsynchronous Resonance Task Force. First benchmark model for computer simulation ofsubsynchronous resonance. IEEE Trans. Power Appar. Syst. 1977, 96, 1565–1572. [CrossRef]
13. Yu, Y.X.; Li, J. The power system subsynchronous oscillations were studies based on eigenvalue analysis.Electr. Eng. 2017, 18, 44–48.
© 2019 by the authors. Licensee MDPI, Basel, Switzerland. This article is an open accessarticle distributed under the terms and conditions of the Creative Commons Attribution(CC BY) license (http://creativecommons.org/licenses/by/4.0/).