Mollusca Characteristics Feeding and Digestion: Mollusca Characteristics Digestive System
Upload
khangminh22Category
view
1download
0
Article
Spatial Characteristics and Activity Space PatternAnalysis of Dhaka City, Bangladesh
Naila Sharmeen 1,* and Douglas Houston 2
1 Transportation Science, University of California, Irvine, CA 92697-3600, USA2 Department of Urban Planning and Public Policy, University of California, Irvine, CA 92697, USA;
[email protected]* Correspondence: [email protected]; Tel.: +1-949-490-8139
Received: 31 December 2018; Accepted: 6 March 2019; Published: 18 March 2019�����������������
Abstract: Although a handful of studies have begun to integrate activity space within travelbehavior analysis in the European and United States (U.S.) contexts, few studies have measured thesize, structure, and implications of human activity spaces in the context of developing countries.To identify the effects of land-use characteristics, socio-demographics, individual trip characteristics,and personal attitudes on the travel-activity based spatial behavior of various population groupsin Dhaka city, Bangladesh, a household-based travel diary pilot survey (for two weekdays) wasconducted for 50 randomly selected households in the winter of 2017. The study focused on twoseparate subareas: one taken from Dhaka North City Corporation, and another taken from DhakaSouth City Corporation. Two methods—shortest-path network and road network buffer—wereused for calculating activity space in a geographic information system (GIS). The daily activity areasfor individual respondents ranged from 0.37 to 6.18 square miles. Land-use mix was found to be asignificant predictor of activity space size for the residents. Larger activity space was recorded for theresidents of one subarea over another due to less land-use diversity. The pilot data showed somespecific socio-economic and travel differences across the two study subareas (car ownership, income,modal share, distance traveled, trip duration).
Keywords: activity space; travel pattern; accessibility; social exclusion; individual perception
1. Introduction
Previous travel behavior and travel demand studies have suggested that travel is a deriveddemand which is undertaken to satisfy a set of desired activities or chain of activities, but these studiesfocused primarily on trip frequencies and travel distance/time, and few directly assessed the spatialdistributions of activity locations [1–4]. Measuring the geographic extent of travel-activity patternsis very important for understanding the relationship between land-use patterns and accessibility toopportunities. Previous activity space studies, primarily from the field of geography, demonstratedanalysis techniques to characterize and assess the spatial dimensions of areas that individuals comeinto contact with in daily life [5–10]. This approach generates insights into the potential activityspace around individual travel routes and activity locations, and can provide useful insights intohow accessibility varies across districts and population subgroups [9,11–14]. It can also be usedto identify and address potential geographic isolation and social exclusion [15–19]. Those who aresocially excluded may have more constrained activity spaces, which could restrict their social andeconomic opportunity.
Horton and Reynolds (1971), in a very early study, stated that understanding the geographicdistribution of daily activities within any urban setting generates important insights into individualand household accessibility to actual and potential amenities [20]. Activity space analysis can be used
Urban Sci. 2019, 3, 36; doi:10.3390/urbansci3010036 www.mdpi.com/journal/urbansci

Urban Sci. 2019, 3, 36 2 of 26
as a tool to explore the relationship between daily activity (travel demand) and urban form throughanalyzing the spatial distribution of activities. Two factors play an important role in activity spacemeasurement: (1) individual characteristics or preferences, and (2) surrounding environments, whichcan provide opportunities to perform activities [21]. Activity space distribution can be influenced byurban form, transport services (available transport mode, etc.), accessibility to transport network, andtime constraints.
Activity space methodologies have been used to understand spatial dimensions of travel behavior,address health accessibility and social exclusion issues, and investigate gendered differences in mobilityand accessibility [1,2,8,12,13,21–27]. Some studies have cautioned that attitudes are more stronglyassociated with travel and activity patterns than land-use characteristics; this suggests that land-usepolicies promoting higher densities and mixed uses alone may not materially alter travel demandor private vehicle ownership or usage [28]. Additional research is needed to better understand therelative influence that land-use characteristics, socio-demographics, and personal attitudes have onactivity space changes, and to understand the potential differences across population subgroups.
Existing activity space studies have typically focused on patterns in Europe or the United States(U.S.); few studies have examined the size, structure, and variability of spatial activity patterns ofresidents of developing countries [29–31]. Residents of megacities in developing countries often mustconfront congested, poor quality road transport networks with greater fluctuations in traffic conditionswhen organizing daily activities in time and space. In many cases, they have a greater number ofproximate destinations to fulfill daily needs due to dense and highly mixed land-use configurations.These conditions can influence the size, spread, orientation, and variability of the daily-activityspaces in developing countries. Rapidly increasing urban traffic congestion has become a majorchallenge in developing countries, but travel demand analysis has been neglected in transportationplanning and policy-making activities in many cities of the developing world [32–34]. Activity spacemethodologies provide a new tool for examining the spatial distribution of activities within megacitiesin developing countries and understanding urban sustainability development challenges in the contextof the developing world. Moreover, activity space is a completely new concept here, with far moredifficult transport situations to handle regarding the day-to-day activity-based travel behavior ofpeople. Through analyzing a traveler’s daily life depending on the spatial distribution of theiractivities, a clear feedback between potential and actual activity spaces can be found, which wouldbe helpful for future planning implications of spatial behavior. Unfortunately, very few studies havemeasured the size and structure of human activity spaces in the context of the developing world.
Dhaka city, the capital of Bangladesh, is confronted with badly managed traffic control systemsin conjunction with unprecedented population growth. According to a World Bank report, around3.2 million working hours are being wasted daily in Dhaka, with the current average driving speedof 4.35 miles per hour due to the traffic congestion [35]. According to the Traffic Index 2019, Dhakajust held the top position as the most traffic-congested city (also topped in wastage of time andtraffic inefficiency index) in the world [36]. Dhaka’s population is growing even as its importantadministrative functions and facilities are expanding [37]. Even though a large number of peoplecommute from nearby districts to work in Dhaka every day, Dhaka has failed to develop a publictransport system for commuters and residents [38]. Rapid population increase over the past decadesis the major reason for the higher demand for transportation. Limited resources (infrastructure andvehicles) for transport facilities development with the rapid rise in transport demand and the lackof adequate traffic management characterize the transport problems of the city [39,40]. The numberof single-occupancy vehicles (mainly cars) is increasing daily. According to the Bangladesh RoadTransport Authority (BRTA), every year, around 37,000 cars are added to Dhaka’s roads [41]. Seventypercent of the total road space is occupied by private cars [42], whereas only 10% of total trips in Dhakacity are made by cars [41]. While about 60% of trips are on foot and almost half of the remaining trips areon non-motorized vehicle [43], very few facilities are there in Dhaka for pedestrians and non-motorizedtransport. The average traffic flow for the major arterial roads of Dhaka is 1637 passenger car units

Urban Sci. 2019, 3, 36 3 of 26
(PCUs) per hour [44]. Traffic congestion and delays, poor traffic management, poor coordination, andconflict across agency jurisdictions characterize the transport situation in Dhaka. The city’s trafficproblems have reached such a crisis that they seriously compromise the ability of the transport sectorin Dhaka to sustain economic growth and a reasonable quality of life.
Definition of Key Terms
An individual’s activity space can be defined as the spatial extent of areas within which he orshe travels to satisfy his or her daily needs during a typical day. Activity space represents the spatialmovement element of an individual’s everyday living experiences of places. According to Thornton,Pearce, and Kavanagh (2011), all locations visited by an individual within a specified time period canbe termed an “activity space” [45]. Activity space can also be defined as the subset of all the locationswith which one has direct contact for accomplishing day-to-day activities [20]. Another important keyterm used in this paper is ‘social exclusion’, which can be expressed as a lack of access to adequatetransport, and thus a reduction of accessibility to opportunities, social networks, goods, and services.Kenyon et al. (2002) defined social exclusion as unequal access (lack of transportation facilities) toparticipate in social life [22]. In this paper, social exclusion is addressed mainly as exclusion due to alack of affordability in the case of availing a particular mode of transport (private car in the Dhaka citycontext). Also, there are social status issues in Dhaka with respect to the ownership of this particularmode. In Dhaka, due to not having private cars, some households are unable to attend social events,especially during the night-time, and if they are a distant location from home. Female travelers andolder people mostly fall within this deprived or socially excluded category.
This paper aims to pilot and assess methods to examine the influence of land-use characteristics,socio-demographics, individual trip characteristics, and personal attitudes on the travel and spatialbehavior of residents in two districts of Dhaka, the capital of Bangladesh. Dhaka is the 11th largestmegacity in the world, with a population of 18.2 million people living in an area of 590 squaremiles [46]. Although previous studies have examined the transportation patterns of Dhaka [47–49], noprevious study has analyzed the geographic distribution of the household activities of Dhaka residents.Some studies have been conducted regarding mode choice [50,51] and the trip-chaining behaviorof particular groups of people [52], travel time variability [53], and vehicular emission mitigationissues [54]. None of these studies have examined the differences in the activity spaces in their daily lifewithin the constraints of Dhaka’s unplanned land-use mix and diversified socio-economic conditions.It is important to examine the role of residential self-selection and personal attitudes or perceptions ontravel behavior and spatial behavior. Dhaka is the fourth most densely populated city, with a density of79,639 per square mile [54] providing residents with locational proximity to service facilities, but highspatial and temporal fixity constraints restrict their access to service facilities/opportunities. The paperis structured as follows. The following section describes the different activity space measurementtechniques used in this paper and also in previous studies, as well as the study area profile, surveydesign and data collection process, and methodology for the proposed full study. Section 3 presentsthe results of the pilot study, followed by a discussion of the results in Section 4 and conclusions inSection 5.
2. Materials and Methods
2.1. Activity Space Measurement Techniques
Two methods for representing activity space in a geographic information system (GIS), shortest-path network and road network buffer, were applied to the pilot data. The proposed full study targeted1000 households as the sample size. A total of 1790 travel logs containing weeklong travel data and 1000household’s information were collected from fall 2017 to spring 2018 in Dhaka. The proposed traveldiary survey period was for all seven days in a week, including weekdays and weekend. In additionto enabling greater comparisons between subareas and subgroups and analysis of intrapersonal

Urban Sci. 2019, 3, 36 4 of 26
variability, this sample size and longer data collection period will provide more activity locationdata that is necessary to implement other representations of activity space in GIS. Activity spacemeasures that will be generated for the full study include the standard deviational, minimum convexpolygon, minimum spanning trees (shortest path network), and road network buffer indicators usingNetwork Analyst.
Schönfelder and Axhausen (2004, 2003, 2002) in their series of papers developed and used a coupleof activity space measurement techniques, namely confidence ellipses, kernel density estimates, andshortest-path networks [24–26]. Confidence ellipse was developed based on the spatial distribution ofactivity locations. The area of the ellipse somewhat overestimates the activity space of an individual,as it assumes that the individual knows all of the area included in the ellipse. The size of the ellipseindicates the dispersion of the destination points by keeping the arithmetic mean relatively close tothe home location. The ellipse measures provide an estimate of the areas traveled by people with acertain probability. This technique of activity space measure is mainly used for investigating bivariaterelationships. They identify the smallest possible area in which the true population value will be foundwith a certain probability. One or two standard deviations (68% and 95% probability) are usuallyused to calculate the ellipse (also known as standard deviational ellipse, or SDE) and weighted by thefrequency of visiting each location. First, a covariance matrix of all the points (activity locations) of aperson is computed, and then by using the determinant of the covariance matrix, the size of ellipseis calculated.
Similar to a confidence ellipse, the kernel density approach also incorporates the frequency ofvisiting each location in its calculation. It transforms activity locations into a continuous representationof density, and visually shows the areas used more intensively. According to Handy and Niemeier(1997), kernel density estimation transforms point data into a continuous density surface where thedensity of a feature can be estimated for any point on the surface. First, the entire study region ispartitioned into grid cells of a predetermined size. Then kernels that are usually circular in shape, withthe radius defined by the user, are placed around the centroid of each cell. After that, weights areassigned as a defined function of distance from the geometric centroid of the kernel. Finally, a densityvalue is assigned to each cell for calculating the density values across the whole study region [55]. Cellsize and bandwidth can be specified within the GIS interface. Bandwidth can be chosen according tothe maximum walking distance between two places. The size of the activity space can be measured asthe number of cells for which the density exceeds a certain threshold (>0).
Minimum convex polygon (MCP) is another established method of estimating activity space.This is the smallest convex polygon containing all the activity locations within a respondent’sactivity pattern. This method captures the geographical extent and spatial dispersion of daily activityparticipation [56]. According to Mohr (1947), this measure is non-probabilistic (does not give theprobability of usage) [57]. Peripheral locations define the geometry in this method; the size of thegeometry mainly depends on the location sample size, and comparison of sizes across individuals orhouseholds require a standardization of sampling with no estimation of variance.
The shortest-path networks (SPN) method (Figure 1a), or the minimum spanning tree approach,is based on identifying the length of the minimum distance routes between the activity locations. Roadnetwork buffers around the shortest path routes are integrated with this method. Activity spaces canbe overestimated for the other two techniques (ellipse and density), as they represent the continuesspace around the activity locations visited, but with SPN, the actual estimation of activity space ispossible, as this method visualizes the size of the activity space around the path or route (potentially)chosen by travelers. Buffer width can be specified according to walking distance standards. In thispaper, the shortest-path network along with the road network buffer method is applied.
Botte (2015) in his research, used activity space techniques such as kernel density, confidenceellipse, super ellipse, Cassini oval, and bean curve for assessing the potential impact of transit-orienteddevelopments (TOD) [21]. Sherman et al. (2005) used two standard deviational ellipse activityspace measures—one generated for one standard deviation and another generated for two standard

Urban Sci. 2019, 3, 36 5 of 26
deviations—and three additional network-based activity space measures using Network Analyst inArcGIS in a healthcare accessibility study. Network-based approaches estimate all the routes connectingthe residence and activity nodes and create a buffer around the nodes and paths. The network-basedmeasures used in this study are road network buffer (RNB), standard travel time polygon (STT), andrelative travel time polygon (RTT) [13]. The size of the road network buffer (RNB) was set to 1 km(1000 m) assuming this distance corresponded with a typical walking distance (Figure 1b). Among thefive measures, this method can be considered the best representation of a respondent’s activity space,because the buffer area is limited to the possible routes and locations that a person travels. It is a closerrepresentation of the spaces that the person actually occupies, not what the person could or should do(probability), similar to the other techniques discussed above. This is the reason why shortest-pathnetwork with the road network buffer method was used to calculate the activity space in this paper.Also, collecting only one individual respondent’s travel information from each household limited theuse of other activity space measures (such as the standard deviation ellipse method), because mostof the respondents had only two activity points that could be used to calculate the activity space.The other activity space measures require more than two activity locations to be calculated, and werenot calculated for this preliminary analysis, as most of the pilot survey respondents only traveled toone non-home location per day during the pilot.Urban Sci. 2019, 3, x FOR PEER REVIEW 5 of 27
(a) (b)
Figure 1. (a) Examples of shortest path network (SPN). Source: (Schönfelder and Axhausen, 2004) [24] and (b) road network buffer (RNB) measure. Source: [13].
Botte (2015) in his research, used activity space techniques such as kernel density, confidence ellipse, super ellipse, Cassini oval, and bean curve for assessing the potential impact of transit-oriented developments (TOD) [21]. Sherman et al. (2005) used two standard deviational ellipse activity space measures—one generated for one standard deviation and another generated for two standard deviations—and three additional network-based activity space measures using Network Analyst in ArcGIS in a healthcare accessibility study. Network-based approaches estimate all the routes connecting the residence and activity nodes and create a buffer around the nodes and paths. The network-based measures used in this study are road network buffer (RNB), standard travel time polygon (STT), and relative travel time polygon (RTT) [13]. The size of the road network buffer (RNB) was set to 1 km (1000 m) assuming this distance corresponded with a typical walking distance (Figure 1b). Among the five measures, this method can be considered the best representation of a respondent’s activity space, because the buffer area is limited to the possible routes and locations that a person travels. It is a closer representation of the spaces that the person actually occupies, not what the person could or should do (probability), similar to the other techniques discussed above. This is the reason why shortest-path network with the road network buffer method was used to calculate the activity space in this paper. Also, collecting only one individual respondent’s travel information from each household limited the use of other activity space measures (such as the standard deviation ellipse method), because most of the respondents had only two activity points that could be used to calculate the activity space. The other activity space measures require more than two activity locations to be calculated, and were not calculated for this preliminary analysis, as most of the pilot survey respondents only traveled to one non-home location per day during the pilot.
Similar to the road network buffer (RNB), the two travel time polygon measures, standard travel time polygon (STT) and relative travel time polygon (RTT), are based on network calculations. For STT, a GIS-based service area command in the Network Analyst Extension was employed to determine how far each respondent could travel from their house in a standard travel time. To calculate RTT, the shortest network path was determined between the household location and activity destinations. One major limitation of these polygon measures is that they assume the same travel mode is available for all routes, which is usually not the case for Dhaka city, where a wide variety of travel modes are used by travelers compared to other cities.
The advantages and disadvantages of all the methods were discussed by Sherman et al. (2005). Euclidean measures (SDE) do not fully capture surface effects. They provide a comparatively poor representation of actual activity space, could capture opportunities not in activity space, and require a minimum of three unique points to generate. Road network buffer methods capture 100% of activity destinations and seem to provide the best representation of the actual space, as determined by activity locations and routes. Standard travel time polygon (STT) measures are fundamentally different from other measures, because they provide an indicator of relative locations within a road network. This
Figure 1. (a) Examples of shortest path network (SPN). Source: (Schönfelder and Axhausen, 2004) [24]and (b) road network buffer (RNB) measure. Source: [13].
Similar to the road network buffer (RNB), the two travel time polygon measures, standard traveltime polygon (STT) and relative travel time polygon (RTT), are based on network calculations. For STT,a GIS-based service area command in the Network Analyst Extension was employed to determinehow far each respondent could travel from their house in a standard travel time. To calculate RTT, theshortest network path was determined between the household location and activity destinations. Onemajor limitation of these polygon measures is that they assume the same travel mode is available forall routes, which is usually not the case for Dhaka city, where a wide variety of travel modes are usedby travelers compared to other cities.
The advantages and disadvantages of all the methods were discussed by Sherman et al. (2005).Euclidean measures (SDE) do not fully capture surface effects. They provide a comparatively poorrepresentation of actual activity space, could capture opportunities not in activity space, and require aminimum of three unique points to generate. Road network buffer methods capture 100% of activitydestinations and seem to provide the best representation of the actual space, as determined by activitylocations and routes. Standard travel time polygon (STT) measures are fundamentally different fromother measures, because they provide an indicator of relative locations within a road network. Thismeasure is not based on activity destinations, and uses an arbitrary travel time limit as the standard.Relative travel time polygon (RTT) is the most strongly conditioned measure by location relative to
Urban Sci. 2019, 3, 36 6 of 26
the road network. It captures 100% of activity destinations, which is also highly correlated with roadnetwork buffer (RNB). This method may overlap with standard travel time polygon (STT), and is alsoconditioned by location within a road network hierarchy [13].
Zenk et al. (2011) examined the relationships among activity space, environmental factors, anddietary and physical activity behaviors using the standard deviation ellipse and daily path areameasurement techniques [27]. Kwan (1998), in her ‘Space-Time and Integral Measures of IndividualAccessibility’ study, used three activity space techniques: gravity-type, cumulative-opportunity, andspace-time measures [9]. Kwan (1999b) in another pioneering work, ‘Gender and Individual Accessto Urban Opportunities’, used daily potential path area (DPPA) as an aggregation of potential pathareas (PPAs) as a measure of accessibility. PPAs contain all of the possible urban opportunities usingfeasible transportation routes within the time constraint of the traveler, which is defined by pairs offixed activities. A summation of all the potential path areas in a day is the daily PPA. Finally, Kwan(1999b) calculated the number of opportunities included in the DPPAs, an area-weighted sum ofall the opportunities contained in the DPPA, and the length of the network arcs or road segmentsincluded in the DPPA [8]. Olaru and Curtis (n.d.) investigated whether transit-oriented developmentreduces the activity spaces or not, and used the second moment of activity space and confidence ellipseactivity space measurement techniques. The second moments of activity location are the squareddistance between the residence location and center of gravity of all the other activity locations [58].Dharmowijoyo et al. (2014), and Susilo and Kitamura (2005) also used second moment of activitylocations to examine the day-to-day variability of activity spaces [4,30].
2.2. Study Area Profile
Dhaka, the capital city of Bangladesh and focus of this study, is one of the most denselypopulated cities of the world. Within an area of only 118.29 square miles, approximately 14.54 millionpeople reside in Dhaka City Corporation (DCC). Two sections of the city, each with multiple wards(administrative units) of Dhaka City Corporation, were selected to serve as the study areas basedon their distinctive demographic and transportation characteristics in Figure 2; one is Mirpur area(Ward no: 7, 11, 12, 13, 14) from Dhaka North City Corporation and another one is Dhanmondi area(Ward no: 47, 48, 49) from Dhaka South City Corporation. While making the selection, considerationshave been given to the different demographic and transportation characteristics of each subarea toensure that representation of a variety of socio-economic groups and transport service conditions wereincorporated in the study.
The study subareas were selected from the northern and southern parts of DCC. Dhanmondirepresents an upper-middle and higher-income group residential neighborhood, and Mirpur representsa lower-middle and middle-income residential neighborhood. This categorization was made based onthe land and property value of the area and income level of the residents [59,60]. Population densityis much higher in Mirpur [61]. Primary land use is residential for both the areas, but Dhanmondi israpidly developing commercial and mixed (residential plus commercial) land uses. Dhanmondi is acomparatively planned residential area compared to Mirpur. Originally, Dhanmondi was developedbased on a rectangular or gridiron road network system.
The target population for this study was mainly those with a postal address. People living inslums were not included (no initiative taken for understanding people without formal addresses) dueto some reasons such as there not being that much variation in mode choice, income group, etc. amongslum dwellers. Almost all the people are below the poverty line, and walk short distances to work.Therefore, the participation of informal housing (slums, squatters, etc.) in this study was somewhatrestricted. Informal settlements can be defined as: (1) housing units established on a land area thatresidents are occupying illegally with no legal claim, and (2) unauthorized or unplanned residentialareas where current planning and building regulations are not properly followed. According to thefirst part of this definition, Dhaka slums are not informal settlements, as these are occupied legallyby slum tenants. They give monthly rent to the legal slum owner (land owner). Also, Dhaka slums

Urban Sci. 2019, 3, 36 7 of 26
occupy only 5.1% of the city’s total land [62]. In the existing land-use distribution analysis (foundfrom the Dhaka GIS database), slum areas were found to occupy a very minimal percentage of the city.Squatter settlements are illegal, but their percentage of land-use distribution in the total land area ofDhaka city is much less than that of the slum area. Now, according to the second part of the abovedefinition, informal settlements are unplanned residential settlements that are 42.82% of the total area.This has already been considered in this pilot study, as Mirpur (an unplanned residential area) hasbeen selected as one of the study subareas.Urban Sci. 2019, 3, x FOR PEER REVIEW 7 of 27
(a) (b) (c)
Figure 2. (a) Land-use map of study subarea, Mirpur; (b) Ward map of Dhaka city showing the two study subareas; and (c) Land-use map of study subarea, Dhanmondi (Source: Capital Development Authority, Dhaka; GIS Database, 2010).
The target population for this study was mainly those with a postal address. People living in slums were not included (no initiative taken for understanding people without formal addresses) due to some reasons such as there not being that much variation in mode choice, income group, etc. among slum dwellers. Almost all the people are below the poverty line, and walk short distances to work. Therefore, the participation of informal housing (slums, squatters, etc.) in this study was somewhat restricted. Informal settlements can be defined as: (1) housing units established on a land area that residents are occupying illegally with no legal claim, and (2) unauthorized or unplanned residential areas where current planning and building regulations are not properly followed. According to the first part of this definition, Dhaka slums are not informal settlements, as these are occupied legally by slum tenants. They give monthly rent to the legal slum owner (land owner). Also, Dhaka slums occupy only 5.1% of the city’s total land [62]. In the existing land-use distribution analysis (found from the Dhaka GIS database), slum areas were found to occupy a very minimal percentage of the city. Squatter settlements are illegal, but their percentage of land-use distribution in the total land area of Dhaka city is much less than that of the slum area. Now, according to the second part of the above definition, informal settlements are unplanned residential settlements that are 42.82% of the total area. This has already been considered in this pilot study, as Mirpur (an unplanned residential area) has been selected as one of the study subareas.
2.3. Data Collection: Approach and Methodology
2.3.1. Survey Design and Collection of Primary Data
A household-based travel diary pilot survey was conducted in the winter of 2017 that included a sample size of 50 households (25 for each of the subareas). The reason for choosing exactly 50 households was convenience for the surveyors, due to the shortage of manpower and time to complete survey work. Sample households were randomly selected based on parcel number (or address) for in-person interviews. Surveyors went to the selected households from a full list of all addresses and asked about their willingness to take part in the survey. If the household refused to participate, surveyors went to the next household in the list. Respondents provided information on household characteristics and socio-economic factors (household income, occupation, age, gender, education level, and ownership of private vehicles), trip characteristics, which were mainly travel
Figure 2. (a) Land-use map of study subarea, Mirpur; (b) Ward map of Dhaka city showing the twostudy subareas; and (c) Land-use map of study subarea, Dhanmondi (Source: Capital DevelopmentAuthority, Dhaka; GIS Database, 2010).
2.3. Data Collection: Approach and Methodology
2.3.1. Survey Design and Collection of Primary Data
A household-based travel diary pilot survey was conducted in the winter of 2017 that included asample size of 50 households (25 for each of the subareas). The reason for choosing exactly 50 householdswas convenience for the surveyors, due to the shortage of manpower and time to complete surveywork. Sample households were randomly selected based on parcel number (or address) for in-personinterviews. Surveyors went to the selected households from a full list of all addresses and asked abouttheir willingness to take part in the survey. If the household refused to participate, surveyors went tothe next household in the list. Respondents provided information on household characteristics andsocio-economic factors (household income, occupation, age, gender, education level, and ownership ofprivate vehicles), trip characteristics, which were mainly travel diary information for two weekdays(trip segments, origin–destination of each trip, travel mode used, travel distance, travel time and cost,purpose of trip, frequency of visiting each location). The survey also collected data on individualperceptions (including perception toward different modal choice, environmental concerns, safetyconcerns, and gender issues, using Likert scale variables), which could influence activity space andtravel patterns. The questionnaire was divided into three parts. The first part was related to individualand household (socio-demographic) information. The second part focused on the travel behavior ofthe respondents. The third part contained questions on individual perceptions related to a range oftransportation topics focusing on activity space and travel pattern issues. Pilot survey questionnaire isgiven in Supplementary-II, Supplementary Material.

Urban Sci. 2019, 3, 36 8 of 26
Information on trips associated with both work and non-work was included in the household-based travel survey (travel log). Data was also collected through the questionnaire format on householdcharacteristics and socio-economic factors (occupation, income, gender, age, etc.), and perceptions.Household travel survey data was collected using an in-person questionnaire format in which thesurveyor prompted participants about household characteristics and perception-related information.Surveyors collected these data directly from the household head or any of the members of thehousehold who were able to provide information on all the household members. In the travel log(trip diary), respondents were asked about the specific address of their destinations. Using the detailland-use database with GIS shape files available for Dhaka city, origin–destination land uses weregeocoded using ArcGIS for the pilot study.
Before the data collection started, the study data collection process was approved by the Universityof California, Irvine (UCI) Office of Research, and Institutional Review Board (IRB) as an exemptcategory research. Random selection was used as the recruitment method from the list of buildingswith addresses, which was provided by the municipality or ward commissioner’s office. Followingrecommendations by Dillman (2000) [63], the first step of outreach and recruitment was to senda pre-notice letter that introduced the study to all the households (HHs) sampled to be invited toparticipate in the study. This pre-notice letter generally described the purpose of the study and surveyprocedures, indicated the general time period when the survey team would be visiting the household’sneighborhood to collect surveys, and provided contact information so that invited households couldcall the study contact phone number for more information. Each selected household received apre-notice letter more or less one week prior to being visited by surveyors. Respondent householdswere also contacted by phone in case of previously known respondents (friends and relatives). In thesecond step, survey team members traveled to the study area during the designated time periodand visited the households of the random sample invited into the study. Team members knockedon participant doors or rang doorbells and followed the survey invitation script to invite a head ofhousehold who was 18 years or older to participate. The participant could choose to complete thesurvey at that time, schedule a subsequent time the team could visit to complete the survey, or refuse toparticipate. As needed, the team conducted multiple follow-ups for non-contacts. The third outreachand recruitment step, which occurred just prior to conducting the survey, was to review with theparticipant the Study Information Sheet, which provided a description of the study purpose, surveyprocedure, potential risks, and survey team contact information. Some of the known people (fromthe Dhanmondi area) asked for a soft copy of the survey questionnaire and travel log; they sent thecompleted survey sheets by email to the surveyors.
Non-response rates were high for both the subareas (for Dhanmondi and Mirpur; rates were foundas respectively 26.47% and 24.24%). The reason for non-response was mainly the lengthy questionnaire,and that there was no incentive/reward for response. The non-response rate was handled by thesurveyors through knocking on the next available household in the address list and also collectingdata from known person’s (friends/relatives) households (especially in the Dhanmondi area, wheregetting access to pre-selected HHs was difficult due to strict security systems). Here, accessibilitywas difficult due to high security facilities and the unwillingness of the residents. People were notwilling to give their personal contact number, and were also not comfortable disclosing their incomerange. Due to these rejections, most of the data were collected from known persons in the case of theDhanmondi area (mostly relatives and friends of the surveyors). On the other hand, in the Mirpurarea, some people were very friendly and spent a long time completing the questionnaires and travellogs. Some people felt irritated and were not willing to spend much time completing the questionnaire.Overall, for both areas, most of the respondents provided their income range and contact number, butsome of the respondents (in particular, female respondents) were not willing to share their incomerange and personal contact number. Also, a response bias was found, as surveyors could not reachsome people (household members) who traveled a lot because they were out traveling in some of thecases. Some members were excluded as they were living outside Dhaka for work and visited homeonce a week/month.

Urban Sci. 2019, 3, 36 9 of 26
The majority of the respondents were literate, as the literacy rate in Dhaka has been increasingquickly. It was estimated it was at 69.2% in 2001 and had gone up to 74.6% by 2011, which is significantlyhigher than the national average of 51.77%. Those who were not literate among the respondents werehandled well by the surveyors through making them understand the questions and filling out thequestionnaires and logs on behalf of them after hearing their answers/responses.
Oral informed consent was obtained (i.e., no signature was obtained). Names and othersubject identifiable information were obtained. The following measures were in place to ensurethe confidentiality of study records. First, a code was used. Subject identifiers were kept separatelyto help ensure confidentiality. Data was stored both electronically and also in hard copies. Whenmaintained electronically, the data were password-protected and encrypted. When maintained in hardcopy, the data was stored in a locked area that was not accessible to non-study team members. Eachhousehold was assigned a Household ID (HID). The household survey was coded with the HID, anddid not include any identifiable information. Only the researcher had access to the key code that linkedthe HID to the identifiable information. Only approved research staff accessed the survey or trip diarydata (which did not include any identifiable information), and the key code linking the identifyinginformation was stored separate from the travel log/diary.
2.3.2. Collection of Secondary Data
Digital datasets (ArcGIS-generated shape files) for road networks, land use, and other requiredlayers were collected and cleaned to provide important secondary geographic data needed. A soft copyof Detail Area Plan (DAP) Map was collected from the Dhaka Capital Development Authority, whichprovided the data on the road network, existing land use, and other required layers. The networkdatabase contained the links and nodes of major arterial streets and other types in a road networkhierarchy of Dhaka with comprehensive address ranges for geocoding locations. Another source ofdata is the digital database for all of the land parcels in the study area belonging to the different land-usecategories, which will be selected as the origin–destination of trips for this study. The ArcGIS-generatedstructure shape file contained the land parcels of different service facility types (educational institute,hospital, recreation, retail shop, restaurant, open space, and so on). This database had good coverageboth spatially, and is also quite accurate with code values, but it was developed a couple of yearsago. Dhaka is growing in an unplanned way, and very quickly, so the current scenario may divergesomewhat from the existing available GIS data. For detailed information about both the primary andsecondary data, see the Supplementary Material.
2.3.3. Methodology
The shortest-path network with the road network buffer method was implemented using the pilotdata. For the shortest-path network, the size of the path buffer was set to 400 m (0.25 miles), assumingthat this distance represents a walking distance from the path in which participants could potentiallyaccess opportunities. The reason for choosing a 400-m buffer size is that for Dhaka city, this distancecan be traveled by walking mode within approximately five minutes. According to Mannan and Karim(2001), the average trip length of walk mode in Dhaka Metropolitan was 15 min [43]. Average walktrips are of 15-min duration, which at 5 km/h gives an average walk trip distance of 1.25 km (1250 m).With a 5-min walk trip, people can travel 417 m here. This is why a 400-m buffer size was chosen forthe study. The 15-min walk trip was not considered for this study as a standard since not all travelers(various age groups) would be comfortable walking that much, but 5 min is a considerable walkingdistance that is convenient for all. The buffer size could also be put at 1200 m, also assuming a 15-minwalk trip for this analysis, but since the Dhaka city area is very small (the city corporation area isonly 118.29 sq. mile), it can be expected that even a 400-m buffer can cover a number of potentialactivity spaces/opportunities for the residents. However, no age group-based walking time studywas reviewed before fixing the buffer size. It was only an assumption/hypothesis that 5 min is aconsiderable walking distance that is convenient for all travelers representing various age groups.

Urban Sci. 2019, 3, 36 10 of 26
After calculating the activity space for individuals and households; an assessment of therelationships of activity space with built form variables (land-use mix, intersection density),socio-economic variables (age, gender, income level, education level, employment status, occupation,household size, number of employed persons in household, car ownership status, marital status,number of children, number of elderly persons, number of cars in use, other vehicle ownership),trip-related variables (travel distance, travel time, trip purpose), and perception-related variables (socialexcludability feeling, safety concerns, etc.) was conducted. Implications of travel-activity patterns onaccessibility to various opportunities (educational institute and open space) were investigated.
Factor analysis is often used to transform the attitudinal questions (Likert scale variables) intoa smaller set of factors to include as explanatory variables in travel behavioral models. Anable(2005); Elias and Shiftan (2012); Horton and Reynolds (1971); Houston et al. (2015); Spears et al.(2013); and Wang and Chen (2012) conducted factor analysis based on attitudinal variables in theirstudies [20,64–68]. For most of these studies, the main respondent in each household was asked torank some attitude or perception-related statements on a seven-point Likert scale ranging from one(strongly disagree) to seven (strongly agree). The first step in analyzing participant responses toattitudinal questions was to use exploratory factor analysis to reduce the large number of questions toa smaller set of factors for regression analysis. Then, principal component analysis was used as theextraction method with Varimax rotation for most of the studies. Based on a scree plot showing thevariance explained by each factor, a fixed number of factors were chosen for analysis in most of thecases. Then, Cronbach’s alpha was calculated for each factor to assess the reliability and evaluate theinternal consistency of the factors. Here, in this paper, Step 1: Descriptives, Step 2: Extraction, andStep 3: Rotation were performed in SPSS. Kaiser–Meyer–Olkin (also performed here; see Table S16 inSupplementary-I, Supplementary Material) is not a test, but rather a measure of sampling adequacy,which is a number that measures the proportion of variance in the variables that might be explainedby underlying factors. Rotated eigenvalues and scree plot were used to determine the number ofsignificant factors (see Table S18 and Figure S10 in Supplementary-I, Supplementary Material). Factoranalysis is used to identify latent constructs or factors. It is commonly used to reduce variables intoa smaller set to save time and facilitate easier interpretations. The interpretation of factor analysis isbased on rotated factor loadings, rotated eigenvalues, and a scree test. Factor scores can be used in aregression to predict behavioral outcomes using travel perceptions. A confirmatory factor analysis(CFA) can be run to validate the factorial validity of the models derived from the results of thisexploratory factor analysis. Individual respondent’s home and work locations were first geocodedin ArcGIS using the land-use shape file for Dhaka City. Similarly, trip-level destination points forboth days were also geocoded in GIS. Addresses (including home, workplace, and trip destinationlocations) were transformed into WGS 1984 UTM Zone 46 N, which is the coordinate system for Dhaka,Bangladesh. Other ArcGIS land-use, building, place, and point shape files (obtained from a web basedopen data source) were used to cross check the actual activity locations (Source: [69]). MapCruzin.comis an independent firm specializing in the publication of educational and research resources. Afteranalyzing the shape files, it seems that the location points are accurate, and the data approximatelycorresponds with the original shape files collected for the study from the Dhaka Detail Area Plan(DAP) GIS database. All GIS database are given within Supplementary Material.
3. Results
3.1. Comparative Analysis between Two Study Areas
Mirpur is much larger than Dhanmondi, considering area and population. Population densityis also higher in Mirpur. The pilot survey oversampled the male population for both areas. Withrespect to employment situation and income level, the respondents chosen from Dhanmondi are ina better position. From the socio-economic aspect, both study areas have a varied range of incomegroups. Dhanmondi, being the higher middle-class residential area, has a large percentage share (68%)
Urban Sci. 2019, 3, 36 11 of 26
in the upper-middle and higher-income category, but Mirpur has a considerable percentage share ofresidents from the lower-income category. Dhanmondi respondents have a higher rate of using a carfor travel compared to those of Mirpur.
A higher level of car ownership was found in Dhanmondi. In Dhanmondi, almost 70% of thesample owned at least one vehicle, and about 40% owned a car. Compared to car ownership, the shareof other vehicle ownership is higher in Mirpur. It is interesting here that while car ownership is risingrapidly among the more affluent populations, there is an increasing tendency of people in the lessaffluent groups to opt for owning other vehicles such as an auto rickshaw or motorcycle to fulfill theneed for a private mode of travel. Independent sample T-tests were conducted for a set of indicators(income, number of employees, car ownership, number of cars, distance traveled, travel cost, tripduration) to compare both areas. The mean value of household income level, car ownership status,and number of cars were found to be significantly different between the two areas.
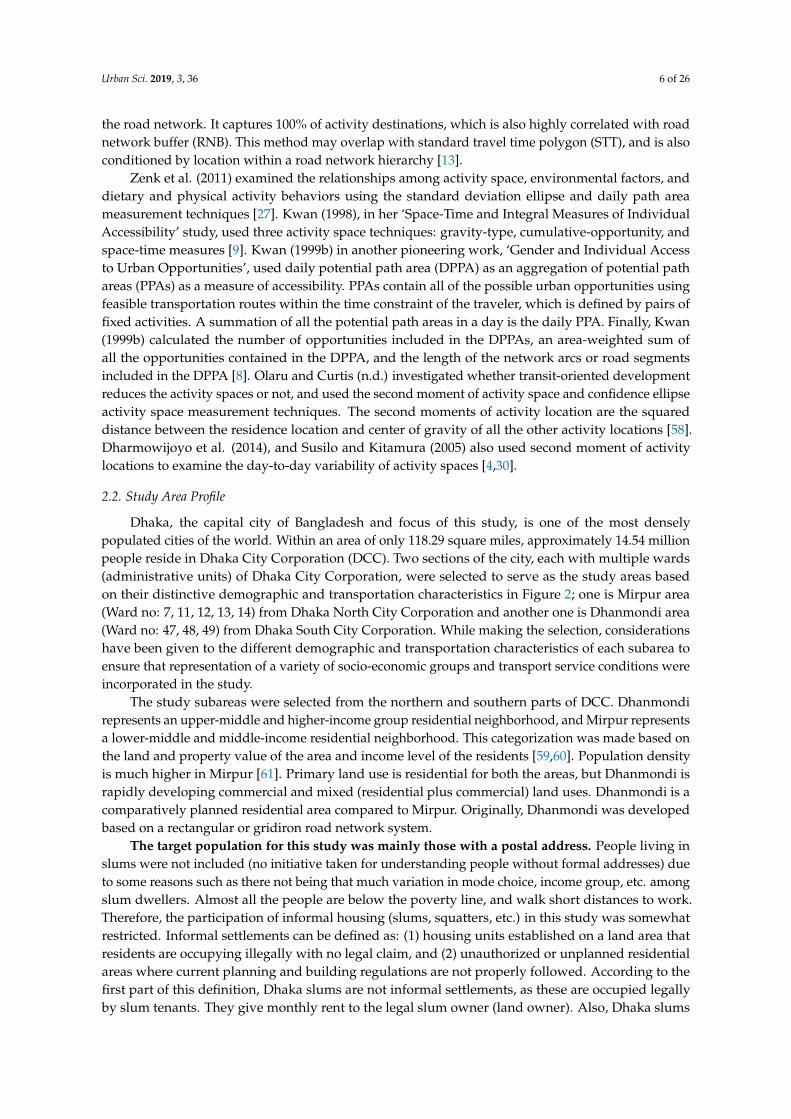
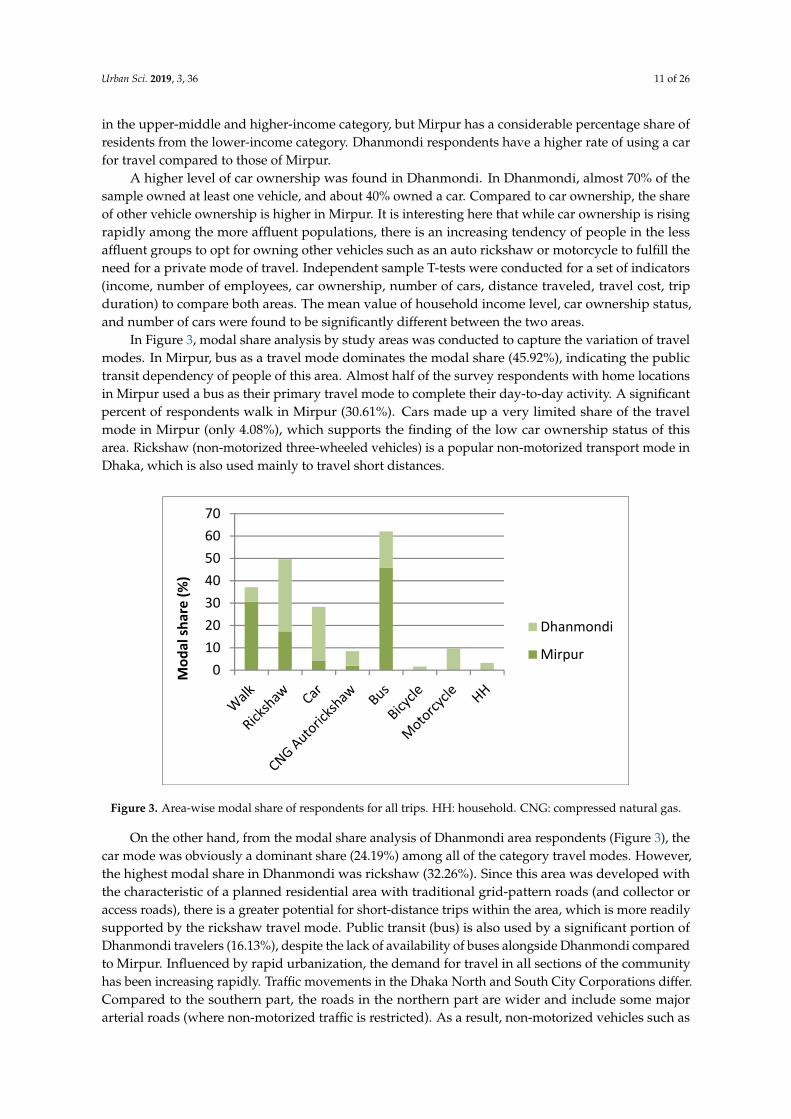
In Figure 3, modal share analysis by study areas was conducted to capture the variation of travelmodes. In Mirpur, bus as a travel mode dominates the modal share (45.92%), indicating the publictransit dependency of people of this area. Almost half of the survey respondents with home locationsin Mirpur used a bus as their primary travel mode to complete their day-to-day activity. A significantpercent of respondents walk in Mirpur (30.61%). Cars made up a very limited share of the travelmode in Mirpur (only 4.08%), which supports the finding of the low car ownership status of thisarea. Rickshaw (non-motorized three-wheeled vehicles) is a popular non-motorized transport mode inDhaka, which is also used mainly to travel short distances.
Urban Sci. 2019, 3, x FOR PEER REVIEW 11 of 27
3. Results
3.1. Comparative Analysis between Two Study Areas
Mirpur is much larger than Dhanmondi, considering area and population. Population density is also higher in Mirpur. The pilot survey oversampled the male population for both areas. With respect to employment situation and income level, the respondents chosen from Dhanmondi are in a better position. From the socio-economic aspect, both study areas have a varied range of income groups. Dhanmondi, being the higher middle-class residential area, has a large percentage share (68%) in the upper-middle and higher-income category, but Mirpur has a considerable percentage share of residents from the lower-income category. Dhanmondi respondents have a higher rate of using a car for travel compared to those of Mirpur.
A higher level of car ownership was found in Dhanmondi. In Dhanmondi, almost 70% of the sample owned at least one vehicle, and about 40% owned a car. Compared to car ownership, the share of other vehicle ownership is higher in Mirpur. It is interesting here that while car ownership is rising rapidly among the more affluent populations, there is an increasing tendency of people in the less affluent groups to opt for owning other vehicles such as an auto rickshaw or motorcycle to fulfill the need for a private mode of travel. Independent sample T-tests were conducted for a set of indicators (income, number of employees, car ownership, number of cars, distance traveled, travel cost, trip duration) to compare both areas. The mean value of household income level, car ownership status, and number of cars were found to be significantly different between the two areas.
In Figure 3, modal share analysis by study areas was conducted to capture the variation of travel modes. In Mirpur, bus as a travel mode dominates the modal share (45.92%), indicating the public transit dependency of people of this area. Almost half of the survey respondents with home locations in Mirpur used a bus as their primary travel mode to complete their day-to-day activity. A significant percent of respondents walk in Mirpur (30.61%). Cars made up a very limited share of the travel mode in Mirpur (only 4.08%), which supports the finding of the low car ownership status of this area. Rickshaw (non-motorized three-wheeled vehicles) is a popular non-motorized transport mode in Dhaka, which is also used mainly to travel short distances.
Figure 3. Area-wise modal share of respondents for all trips. HH: household. CNG: compressed natural gas.
On the other hand, from the modal share analysis of Dhanmondi area respondents (Figure 3), the car mode was obviously a dominant share (24.19%) among all of the category travel modes. However, the highest modal share in Dhanmondi was rickshaw (32.26%). Since this area was developed with the characteristic of a planned residential area with traditional grid-pattern roads (and collector or access roads), there is a greater potential for short-distance trips within the area,
010203040506070
Mod
al sh
are
(%)
Dhanmondi
Mirpur
Figure 3. Area-wise modal share of respondents for all trips. HH: household. CNG: compressed natural gas.
On the other hand, from the modal share analysis of Dhanmondi area respondents (Figure 3), thecar mode was obviously a dominant share (24.19%) among all of the category travel modes. However,the highest modal share in Dhanmondi was rickshaw (32.26%). Since this area was developed withthe characteristic of a planned residential area with traditional grid-pattern roads (and collector oraccess roads), there is a greater potential for short-distance trips within the area, which is more readilysupported by the rickshaw travel mode. Public transit (bus) is also used by a significant portion ofDhanmondi travelers (16.13%), despite the lack of availability of buses alongside Dhanmondi comparedto Mirpur. Influenced by rapid urbanization, the demand for travel in all sections of the communityhas been increasing rapidly. Traffic movements in the Dhaka North and South City Corporations differ.Compared to the southern part, the roads in the northern part are wider and include some majorarterial roads (where non-motorized traffic is restricted). As a result, non-motorized vehicles such as

Urban Sci. 2019, 3, 36 12 of 26
rickshaws are more restricted on major roads in the northern part than in the southern part of Dhaka.This is another reason of the greater share (32.26%) of rickshaws in the Dhanmondi area.
3.2. Combined Analysis of Both Areas
Changes of travel modes within a single trip were observed for some trips. Most of the trips weresingle-mode trips (62%). From the travel diary, 28% of all trips were multimodal trips that used twomodes. The remainder (10%) of trips were multimodal trips that were completed using three travelmodes. Since most of the pilot survey respondents only traveled to one non-home location per dayduring the pilot, some activity space measures requiring more than two activity locations were notcalculated. Instead, travel distance/length and activity area (or buffered areas around the route) wereused as a proxy for activity space measures.
Since two significant travel modes are bus and car, t-test analysis was conducted for trips madeby each of these modes. The reason for selecting these two modes specifically is because the transportmode preferences of urban commuters in Dhaka mainly vary according to these two broad categoriesof modes, namely private car and public bus [51]. If we want to compare between the private andpublic transportation systems of Dhaka, we need to choose car and bus. An independent sample T-testcomparing the mean between the activity length/area within these two modes shows no significantdifference found at the 95% confidence interval (Table 1). There were slightly different means observedwithin these two modes for activity length and area.
Table 1. Travel mode (bus and car) wise difference in activity space.
Typical TravelMode to Work Mean F Sig. t df Sig.
(2-Tailed)
Activity length Car 6373.472 0.144 0.707 −0.471 25 0.642Bus 7353.288 −0.505 15.496 0.621
Activity area Car 4.46315 × 10⁶ 1.229 0.278 −1.011 25 0.322Bus 6.01823 × 10⁶ −1.204 20.252 0.242
Respondents from both study areas used bus as their daily travel mode by a large percentageshare (Figure 3). The walking time to the nearest transit stop is a useful indicator for successful transitprovision, and its possible impact on respondent travel behavior. A five to 10-minute distance is aconvenient distance to walk, which is the walking time for 52% of the respondents. Also, 18% ofrespondents only needed to walk less than 5 min, which is a very positive finding. As people arewilling here to walk, and also from its modal share of all trips, it has been found that walking alsopossesses a significant percentage share among all the other modes, so it can be said that there is thepotential to motivate people to choose public transit in daily travel.
Gender-based analysis is very important to investigate the potential differences among the factorsthat influence travel behavior and activity travel patterns. Unfortunately, the pilot study includedonly a small number of women (only 18.4%). Their most popular mode was rickshaw and car. Thischoice can be easily explained by the convenience and privacy of these modes compared to bus. On theother hand, male respondents reported bus as their most preferred mode due to the lower travel costassociated with this mode, as well as because in Dhaka city, due to their socio-cultural perspective,the male population is not so bothered about the comfort and safety issues related to traveling by busas opposed to female travelers. In terms of the gendered difference on typical travel mode to work,identical results regarding preferred travel modes were found. Most of the male respondents takethe bus to work. On the other hand, most female respondents use cars as their typical travel modeto work. One interesting finding from this cross-tabulation is that 22.2% of women typically walk towork. These are mainly short-distance trips, and the respondents belong to the low-income workinggroup (garments workers). Another 22.2% of women work at home (mainly as homemakers).

Urban Sci. 2019, 3, 36 13 of 26
Independent sample T-tests were conducted for a set of indicators (travel distance, trip segments,activity space, and activity length) to investigate whether any gender difference existed (Table 2).The mean value of travel distance, activity space, activity length, and trip segments were not found tobe significantly different between male and female respondents. The small number of women sampledcould be one of the reasons of this finding. The activity length and travel distance are different in theway that activity length is based on the shortest-path network developed in ArcGIS using NetworkAnalyst based on different activity locations (from origin to destination of each trip). On the other hand,travel distance is the actual distance traveled for each trip by respondents (distance data collected fromrespondents during survey; later cross-checked in GIS and Google map).
Table 2. Gender-wise independent sample T-test results. Df: degree of freedom.
Gender of theRespondent Mean F Sig. t df Sig.
(2-Tailed)
Trip segments(per day)
Male 3.27 0.294 0.590 1.149 48 0.256Female 2.56 0.991 10.337 0.344
Activity length(meter)
Male 7959.003 4.842 0.033 −0.082 42 0.935Female 8134.720 −0.131 18.227 0.897
Activity area(sq. meter)
Male 5.96896E6 1.962 0.169 −0.240 42 0.812Female 6.32001E6 −0.332 13.012 0.745
Distance traveled(mile/day)
Male 10.294 2.766 0.103 0.732 44 0.468Female 8.116 1.256 14.041 0.230
Respondents were also asked about the safety and security concerns that they face in their dailytravel. They were also asked some perception-related questions. Most of the male respondents didnot feel unsafe due to gender and they did not think that there was gender discrimination in transit.In contrast, female respondents’ perceptions on these grounds were the opposite in Dhaka, as due tosocio-cultural practice, they have had to fight for equal rights in every sphere, including traveling inpublic transport modes. Issues related to a lack of safety are also experienced by female passengerscompared to their male counterparts while traveling. Safety and comfort issues are very dominantfactors for shaping individual travel behavior in Dhaka. That is why perception-related variables arevery important while analyzing variation in travel and activity space patterns. Almost 76% of therespondents indicated a lack of personal safety and comfort as reasons for not using the bus. Bus isthe only public transit option in Dhaka, as no intra-city train service or subway (underground) metrorail exists. Female passengers face gender issues; these include physical harassment while travelingby bus, seating problems, etc. A specific numbers of seats are reserved for female and older personsin the bus, but during peak-hour traffic, most of the time; these seats are taken by male passengers.Other reasons cited for not using the bus are the longer waiting time (bus scheduling issues), limitedfrequency or no service in some areas (lack of accessibility), and longer travel time. Certain socialnorms, such as a negative perception toward transit, were not mentioned by any of the respondents,which reflects an overall positive perception toward transit. As for there being a long distance to thenearest bus stop, this reason was also skipped, which supports the finding that most respondents havea minimum walking time to their nearest transit stop.
Safety is a very important aspect of people’s perception when choosing transport options. Activityspace could be more geographically restricted due to an unsafe environment. Safety-related problemsare very common in bus stops and during bus rides. From Table 3, on average, 67% of respondentsindicated that they faced no safety-related problems at bus stops and during bus rides.
In order to gain more insights about the perception of respondents toward having a saferenvironment within activity spaces, respondents were asked to indicate their feelings regardingconducting their daily activity at different times and at different activity points.

Urban Sci. 2019, 3, 36 14 of 26
Table 3. Percentage share of respondent’s perception of a safer environment within activity space.
Safety-Related Problemin Bus Stops
Safety-Related Problemduring Bus Ride
Percentage Share Percentage Share
No 70.0 64.0Yes, during the day only 4.0 8.0
Yes, at night only 2.0 6.0Yes, during the day and at night 24.0 22.0
From Figure 4, it can be understood that perceptions vary considerably between day and night.Being “completely unafraid” was more prevalent for daytime activities, and being more afraid wasmore prevalent for night-time activities, especially while walking, getting on and off the bus, andduring bus rides. Some respondents were extremely afraid of riding the bus at night. In Dhaka, due tosome social constraints, most of the female travelers feel unsafe within their activity space. Therefore,the full sample will obtain a greater sample of females to better understand the relationship betweenperceptions and behavior.
Urban Sci. 2019, 3, x FOR PEER REVIEW 14 of 27
problems are very common in bus stops and during bus rides. From Table 3, on average, 67% of respondents indicated that they faced no safety-related problems at bus stops and during bus rides.
Table 3. Percentage share of respondent’s perception of a safer environment within activity space.
Safety-Related Problem in Bus
Stops Safety-Related Problem during
Bus Ride
Percentage Share Percentage Share
No 70.0 64.0 Yes, during the day only 4.0 8.0
Yes, at night only 2.0 6.0 Yes, during the day and at
night 24.0 22.0
In order to gain more insights about the perception of respondents toward having a safer environment within activity spaces, respondents were asked to indicate their feelings regarding conducting their daily activity at different times and at different activity points.
From Figure 4, it can be understood that perceptions vary considerably between day and night. Being “completely unafraid” was more prevalent for daytime activities, and being more afraid was more prevalent for night-time activities, especially while walking, getting on and off the bus, and during bus rides. Some respondents were extremely afraid of riding the bus at night. In Dhaka, due to some social constraints, most of the female travelers feel unsafe within their activity space. Therefore, the full sample will obtain a greater sample of females to better understand the relationship between perceptions and behavior.
Figure 4. Perception of safer environment within activity space during different timespans along a 24-h day.
This pilot travel diary survey also included attitudinal questions to supplement the data on household characteristics that are traditionally collected in this type of survey. Although attitudinal surveys are not generally classified as a qualitative method, they provide a means for measuring important qualitative factors in travel behavior studies. Each respondent in the pilot survey was asked a series of attitudinal questions in the form of statements with which respondents were asked whether they agree or disagree on a seven-point Likert scale. Respondents’ feelings or experiences regarding a variety of transportation-related topics could shape their travel and activity behavior.
0
20
40
60
80
100
120
Walkingduring the
day
Walking atnight
Getting onand off of the
bus duringthe day
Getting onand off of thebus at night
Riding on thebus during
the day
Riding on thebus at night
Perc
enta
ge sh
are
of f
eelin
g re
agrd
ing
safe
ty
Completely unafraid Unafraid Somewhat unafraid
Neither Somewhat afraid Afraid
Extremely afraid
Figure 4. Perception of safer environment within activity space during different timespans along a24-h day.
This pilot travel diary survey also included attitudinal questions to supplement the data onhousehold characteristics that are traditionally collected in this type of survey. Although attitudinalsurveys are not generally classified as a qualitative method, they provide a means for measuringimportant qualitative factors in travel behavior studies. Each respondent in the pilot survey was askeda series of attitudinal questions in the form of statements with which respondents were asked whetherthey agree or disagree on a seven-point Likert scale. Respondents’ feelings or experiences regardinga variety of transportation-related topics could shape their travel and activity behavior. From theattitudinal characteristic importance ranking for the respondents (descriptive statistics of Likert scalevariables related with perception), the dominant attitude stressed the importance of protecting theenvironment (6.04 out of 7.0). Concern for the noise and air pollution from cars (5.98) was next inimportance, followed by increasing the perception that transit use is beneficial for the environment(5.84). Lower travel cost by bus compared to car and enjoyment of walking and bicycle as travel modes

Urban Sci. 2019, 3, 36 15 of 26
for short distances were next in the ranking, and both were rated at approximately 5.78 out of 7 forimportance. The least important attributes were generally related to the importance of car (1.98) andthe presence of physical limitations in getting around (1.52). One important finding to note is thatthe following attitudes were ranked within lower important categories (ranked in the lower half inimportance): carrying negative attitudes toward transit, feeling of restriction, deprivation, and socialexclusion for not having a car, lack of knowledge regarding transit, and perceiving the car as a symbolof social status. This indicates again the potentiality of promoting sustainable travel modes (walk,bicycle, and bus) in Dhaka rather than encouraging automobile use (private car ownership). Thisanalysis is given in Table S17 of Supplementary-I (Supplementary Material).
Factor Analysis of Attitudinal Questions
From the Kaiser–Meyer–Olkin test, it was found that the resulting factors explained 49.4% ofthe variance in the attitudinal responses. In the Bartlett’s test, the null hypothesis is that there is nocorrelation among the questions. The p-value is significant; thus, the null hypothesis is rejected. Afterapplying principal axis factoring as an extraction method, 11 factors were found from 39 questions.After extracting 11 factors, a factor matrix and rotated factor matrix were found, which are the SPSSoutput before and after Varimax rotation to illustrate how rotation aids interpretation.
To evaluate the internal consistency of the factors, Cronbach’s alpha was calculated for each factor(Table 4). Six factors had a Cronbach’s alpha of 0.594 (equivalent to 0.6) or higher, which is above therecommended minimum of 0.60 for exploratory research [70]. Cronbach’s alpha values for most ofthe factors were found as more than 60%, which indicates that those six factors explained 60% of thetotal variation in the responses to the corresponding attitudinal statements. If we discuss the firstfactor (transit preference), the Cronbach’s alpha value was found as 0.690, which indicates that 69% ofthe variance in that score would be considered a true score variance or internally consistent reliablevariance. Although the sample size for this pilot study is very small to run confirmatory factor analysis,even then, the Cronbach’s alpha values were found to be internally consistent (analysis is reliable) andindicate sufficient internal reliability.
Table 4. Summary of the factor analysis (statements organized as per correlation matrix).
Factor Statements (Survey Item) FactorLoading
Cronbach’sAlpha (α)
Transit preferences
I can get things done while riding on the public bus that I can’t doin my car. 0.805
0.690The public bus takes me where I need to go. 0.712
I try to minimize my impact on the environment by taking the buswhenever I can. 0.601
The public bus schedule is convenient for me. 0.560
I enjoy walking or bicycling near my home to travelshort distances. −0.579
Much of my travel is done to meet the needs of others inmy household. 0.725
Privacy and socialexclusion/trend
concerns
I feel restricted because I don’t have access to a car often enough. 0.701
0.789
I like the privacy of riding in a car compared to othermodes of traveling. −0.502
I am feeling socially deprived and excluded for not having a car. −0.669
I feel socially excluded for not having access to car. 0.523
I am feeling socially deprived and excluded for having a limitedactivity space or daily travel area. 0.550
I carry negative attitude toward using public transit. −0.454
Due to social trends, I want/wanted to buy a private car. 0.718

Urban Sci. 2019, 3, 36 16 of 26
Table 4. Cont.
Factor Statements (Survey Item) FactorLoading
Cronbach’sAlpha (α)
Car attachment
My car is an important part of who I am. 0.663
0.628My car acts as a symbol of social status for me. 0.623
I feel pressed for time in my daily travels. 0.541
Using the public bus takes too long to reach my destinationcompared to going by car. 0.495
It is/would be difficult to get everything done without a car,especially when multiple destinations are needed to be covered. 0.584
There are enough places in my daily travel area where I can go forrecreation or entertainment. 0.767
Personal safetyconcerns
People who are important to me worry about my safety when Iuse public transit. 0.653
0.745
According to me, a car is safer than other travel modes. 0.915
Support andenvironmental
concerns
My family and friends would support me if I used public transitfor environmental reasons. 0.579
0.693
My close friends and family are concerned about the environment. −0.500
Monetary andenvironmental
concerns
Taking the bus could save me money compared to driving a car. −0.6990.594
Noise and pollution from cars and trucks is a problem in my dailytravel area. −0.481
3.3. GIS Applications of Methods for Representing Activity Space
The shortest-path network (SPN) and road network buffer (RNB) were applied on the preliminarydata collected through the pilot survey. Analyses related with these two methods are included here.
In Figure 5, trip origin points are not located, as in all of the cases, the first trip origin was therespondents’ home location, and for all the other trips, one trip’s destination point is the immediatelyfollowing trip’s origin. In most of the cases, the second trip’s destination is the home location(people went back home). That is why, for most of the respondents, a maximum of two trips wasrecorded in a day. Overall, the maximum number of daily trips recorded for any respondent was four.The destination points found for both the days were very similar, as previously mentioned. This is thereason why the intrapersonal variation of the same respondent’s activity space is not so meaningfulregarding two-day survey data for Dhaka City. Not that much variation in activity space and travelpattern could be possibly captured with two weekday-based travel diary data. However, the weeklongfull travel survey data is expected to capture the variation.
The shortest-path network (SPN) complemented with road network buffer (RNB) method is usedhere to calculate activity space, as this method does not overestimate the spatial area traveled bythe respondents. Since this method is closely related to actual paths, there is less of a likelihood ofoverestimating the extent of the activity spaces, as can happen with the two methods not analyzedwith the pilot data, standard deviational and minimum convex polygon. The SPN and RNB methodsare useful for investigating the accessibility to potential services/opportunities, which will be exploredlater in this paper (see Section 3.5). While calculating RNB, the size of the buffer was set to 400 m(0.25 mile), assuming that this distance would be a typical walking distance for most people.
Some SPN and RNB figures are attached here to clearly depict the activity space of respondentscalculated from the pilot study. Sample shortest path network with 400 m road network buffer for oneindividual respondent from study sub-area Mirpur are shown in Figure 6. The road network bufferfor both areas with the separate-path network is shown in Figure 7a, which depicts the buffer (RNB)with transparency, so that the SPN travel paths around which the RNB are based are visible. Althoughseveral maps are produced using GIS, due to the overlapping buffer areas among the respondents, theresultant output are not that much clearer with maps.

Urban Sci. 2019, 3, 36 17 of 26Urban Sci. 2019, 3, x FOR PEER REVIEW 17 of 27
(a) (b)
Figure 5. Distribution of trip destination points for all the trips of two working days; (a) Day 1 and (b) Day 2. Shortest-Path Network with Road Network Buffer.
The shortest-path network (SPN) complemented with road network buffer (RNB) method is used here to calculate activity space, as this method does not overestimate the spatial area traveled by the respondents. Since this method is closely related to actual paths, there is less of a likelihood of overestimating the extent of the activity spaces, as can happen with the two methods not analyzed with the pilot data, standard deviational and minimum convex polygon. The SPN and RNB methods are useful for investigating the accessibility to potential services/opportunities, which will be explored later in this paper (see Section 3.5). While calculating RNB, the size of the buffer was set to 400 m (0.25 mile), assuming that this distance would be a typical walking distance for most people.
Some SPN and RNB figures are attached here to clearly depict the activity space of respondents calculated from the pilot study. Sample shortest path network with 400 m road network buffer for one individual respondent from study sub-area Mirpur are shown in Figure 6. The road network buffer for both areas with the separate-path network is shown in Figure 7a, which depicts the buffer (RNB) with transparency, so that the SPN travel paths around which the RNB are based are visible. Although several maps are produced using GIS, due to the overlapping buffer areas among the respondents, the resultant output are not that much clearer with maps.
Figure 5. Distribution of trip destination points for all the trips of two working days; (a) Day 1 and (b)Day 2. Shortest-Path Network with Road Network Buffer.Urban Sci. 2019, 3, x FOR PEER REVIEW 18 of 27
(a) (b)
Figure 6. Visualizing activity space: example of (a) shortest-path network (SPN) with (b) 400-m road network buffer (RNB) for one respondent (home location: Mirpur).
(a) (b) (c)
Figure 7. Shortest-path network with 400-m road network buffer of (a) both areas (with transparency), showing separately for the respondents of (b) Mirpur and (c) Dhanmondi.
From Figure 7b, c, it can be easily observed that the aggregate activity space area for the Mirpur respondents was much larger than that for the Dhanmondi-area respondents. The Mirpur respondents covered more activity points from a spatial perspective. This shows more dispersed activity locations for Mirpur over Dhanmondi. This finding can be matched with the larger average total distance traveled by Mirpur-area respondents per day. Also, respondents whose home locations were in Mirpur took a greater amount of time for all the trips compared to Dhanmondi respondents
Figure 6. Visualizing activity space: example of (a) shortest-path network (SPN) with (b) 400-m roadnetwork buffer (RNB) for one respondent (home location: Mirpur).

Urban Sci. 2019, 3, 36 18 of 26
Urban Sci. 2019, 3, x FOR PEER REVIEW 18 of 27
(a) (b)
Figure 6. Visualizing activity space: example of (a) shortest-path network (SPN) with (b) 400-m road network buffer (RNB) for one respondent (home location: Mirpur).
(a) (b) (c)
Figure 7. Shortest-path network with 400-m road network buffer of (a) both areas (with transparency), showing separately for the respondents of (b) Mirpur and (c) Dhanmondi.
From Figure 7b, c, it can be easily observed that the aggregate activity space area for the Mirpur respondents was much larger than that for the Dhanmondi-area respondents. The Mirpur respondents covered more activity points from a spatial perspective. This shows more dispersed activity locations for Mirpur over Dhanmondi. This finding can be matched with the larger average total distance traveled by Mirpur-area respondents per day. Also, respondents whose home locations were in Mirpur took a greater amount of time for all the trips compared to Dhanmondi respondents
Figure 7. Shortest-path network with 400-m road network buffer of (a) both areas (with transparency),showing separately for the respondents of (b) Mirpur and (c) Dhanmondi.
From Figure 7b,c, it can be easily observed that the aggregate activity space area for the Mirpurrespondents was much larger than that for the Dhanmondi-area respondents. The Mirpur respondentscovered more activity points from a spatial perspective. This shows more dispersed activity locationsfor Mirpur over Dhanmondi. This finding can be matched with the larger average total distancetraveled by Mirpur-area respondents per day. Also, respondents whose home locations were in Mirpurtook a greater amount of time for all the trips compared to Dhanmondi respondents (see Section 3.1).One reason could be that they traveled a longer distance, which supports this finding of the largeractivity area of Mirpur residents. The highest modal share in Dhanmondi (Figure 3) was found to be forrickshaws (32.26%). Rickshaws are a popular non-motorized three-wheeled transport mode in Dhakathat are used mainly to travel short distances. Since this area was developed with the characteristicof a planned residential area with traditional grid pattern roads (and collector or access roads), thereis a greater potential for short distance trips within the area, which is more readily supported by therickshaw travel mode. This travel characteristic of Dhanmondi residents can explain the result of thesmaller activity space found for Dhanmondi in comparison to Mirpur, the other study subarea.
On the other hand, regarding the socio-economic characteristic differences between the two areas,the above different activity area finding can be explained. In Mirpur, bus as a travel mode dominatesthe modal share (45.92%), indicating the public transit dependency of people of this area (Figure 3).Almost half of the survey respondents with home locations in Mirpur used bus as their primary travelmode to complete their day-to-day activity. Being a lower-income residential area (as bus fare iscomparatively cheaper), Mirpur residents can travel longer distances by bus. However, in Dhanmondi,as rickshaw is a semi-private mode of transport (no ownership by user, but the mode is used by asingle rider), the fare is comparatively high, which supports the upper-middle and higher-incomeresidential characteristic of Dhanmondi-area residents (see Section 3.1).
3.4. Quantification and Mapping of Built Form Indicators and Activity Space
The built form indicators selected in this paper are quantitative in nature, and thus each of themhas a numeric value. Here, a suitable measure for each built form indicator will be selected in termsof data availability and applicability for this study. Each measure will be calculated within eachrespondent’s daily activity area. Diversity, design, and accessibility can play a crucial role behindtravel and activity space patterns. Diversity in land use has many benefits. Heterogeneous land usecan promote different activities within a walking distance, which eventually helps people completemany activities within walking distance. In that case, even after having a smaller activity space,

Urban Sci. 2019, 3, 36 19 of 26
people will not be excluded from a variety of social and economic opportunities. On the other hand,homogeneous land use induces sprawl growth, which enhances automobile ownership among theresidents and simultaneously reduces the transit use. For up to a one-half mile catchment area, anentropy index can give a result that can be interpreted easily to understand the land-use balance [71].Usually, entropy is estimated on the basis of share of each land use in the area, which can also bereferred to as ‘land-use balance’.
Usually, a selection of land uses depends on the specific study area context [72,73]. For this paper,from a set of 19 land-use categories, five land-use categories (commercial and industrial, institutional,mixed use, recreation, and residential land uses) were considered while computing the entropy index(see Figures S4 and S5 in Supplementary-I, Supplementary Material). Mixed land uses were takeninto account because a considerable percentage share (15.27%) of mixed uses is apparent in theland-use distribution within the area of all the respondents’ activity space (mixed use holds the secondhighest percentage share; see Figure S6 in Supplementary-I, Supplementary Material). Commercialand industrial lands uses are summed up as purely commercial activity-based land parcels, and areless prevalent.
After reclassification, Dhaka South City Corporation was predominantly found to have a mixtureof mixed, institutional, recreational, and commercial and industrial use, whereas the northern part ofDhaka featured mostly residential use. Here, the residential land-use category contained both plannedand unplanned residential land parcels. Education and research, health, and public facility werecombined to create the institutional land-use category. Commercial activity has been identified bycombining manufacturing and processing land categories, and was named commercial and industrial.Three land-use categories—restricted area, unknown, and vacant land—were excluded from theanalysis. As people sometimes visit historical places for recreation in Dhaka city, historical land parcelswere combined with recreational land use and represented in the recreational land-use category.
While calculating the existing share of different land-use types within the activity space buffer ofall the respondents, residential land use dominates completely the activity space by a large proportion(58.82%) as seen from Figure S6 in Supplementary-I, Supplementary Material. For all of the land-usecategories except residential land use; the percentage distribution was higher within the buffer comparedto within the total area. Within the activity area of the respondents (buffer area), the land-use distributionwas more diversified compared to the total area of the city. The land-use diversity within the activityarea showed a positive result (heterogeneity of land use, which indicates balanced land-use distribution).Most of the areas showed a diversity value of higher than 0.5, which indicates heterogeneity of land useand would be supportive for enhancing accessibility. Moreover, it can also be said that Dhanmondi isslightly more diverse in land-use distribution than Mirpur.
In addition to good land-use mix, a good connectivity of the road network is essential forcommuters to access potential service facilities. The most recommended methods for road connectivityare street density and intersection density. Another measure, link–node ratio, is less intuitive, becauseit does not reflect the length of the link. Moreover, the link–node ratio is not corresponding to theactual size or spacing of road network [74]. In this paper, intersection density (per square mile) washypothesized as being positively associated with activity space expansion, and was used to analyze pilotresults. An intersection having more than two legs (connecting lines) was considered for this analysis.Intersections with one connecting line (cul de sac) and two connecting lines were ignored from theanalysis, because they are not preferable for good connectivity. In terms of road connectivity, the activityspace of respondents from Dhanmondi has relatively better connectivity than that of Mirpur. Poor roadnetwork connectivity would tend to reduce the activity space. However, it was found from Figure 7 thatthe aggregate activity space of Mirpur respondents was much larger than that of Dhanmondi residents,irrespective of the area’s poor connectivity. Dhanmondi respondents had relatively better connectivitythan Mirpur residents with more intersections (number of junctions >2) per square mile.
All of the respondents from the Dhanmondi area had a daily activity space of less than3.59 square miles, while 40% of the respondents from the Mirpur area had an activity space range

Urban Sci. 2019, 3, 36 20 of 26
of 3.12 to 6.18 square miles. The percentage share of activity space in each category and rangewere found after mapping in GIS using the equal frequency classification method. This clearlyreveals that the respondents that had larger activity spaces were mostly concentrated within Mirpur,which is predominantly residential use with a lower percentage share of other land-uses categories.The residents of Mirpur have to travel more to get other types of land-use facilities. Table 7 shows thatthe smallest daily activity area for any individual respondent was 0.37 square miles, and 6.18 squaremiles was the largest area. Both the areas were recorded for respondents from Mirpur. Similar patternsare apparent if we measure the daily activity length in areas with the shortest-path network method(in miles) (replacing the road network buffer method). Sixty percent of respondents from Dhanmondihad a daily activity length less than 3.84 miles, while 80% of the respondents from Mirpur belongedto that activity length range of 3.38 to 12.64 miles. This percentage share of activity length in eachcategory and range was also found after mapping in GIS. The smallest daily activity length for anyindividual respondent was found to be 0.42 miles, and 12.64 miles was found as the largest activitylength. Both the activity lengths were recorded for respondents from Mirpur.
3.5. Modeling Individual Accessibility Using Activity Space
Assessment of the implications of travel-activity space patterns on accessibility to opportunities(educational institution, hospital, recreation, retail shop, restaurant, open space, and so on) will beconducted for the full study. ArcGIS-generated structure shape files are available where different kindsof opportunities were geocoded. For preliminary analysis, school and open space were selected tomodel individual accessibility using the road network buffer activity space measure. The reason forselecting these two particular facilities is that one opportunity (school) is observed in large numbers incomparison to open space facilities, which are very limited in number within the city area.
Accessible schools and open spaces were defined as those located within a respondent’s activityspace. To examine accessibility, three sets of descriptive statistics were looked at for representation ofactivity space by RNB. These are: mean and median number of opportunities within an individual’sactivity space, percentage of respondents with at least one opportunity inside their activity space,and correlation between the area of activity space and the number of opportunities. As expectedfrom Table 5, it is clear that RNB had the highest percentage (100%) with at least one school facility,indicating that each individual respondent has at least one school within their activity space definedby the road network buffer measure.
Table 5. Access to opportunities for road network buffer.
Measure of Activity Space(Road Network Buffer)
Mean (S.D.) Median (Range)
Number of opportunities School 57.16 (29.08) 48 (0–114)Open space 1.66 (1.64) 1 (0–7)
Percent with at least one opportunity School 100Open space 29.55
Correlation between area andnumber of opportunities
School 0.639Open space 0.139
The RNB measure indicates that a substantial percentage of respondents did not have access toan open space opportunity (70.45%). Correlation was performed to test the strength of associationbetween the area of the activity space and the number of opportunities for the activity space model(RNB). While the activity space model used here (RNB) demonstrates a positive correlation betweenthe area and number of opportunities (both school and open space), the association was strong forschool facilities (0.639). However, there was a weak correlation between open space and activity area

Urban Sci. 2019, 3, 36 21 of 26
(0.139), which was expected. The mean, median, and range were very minimal for open space incomparison to school facility.
Area-Wise School Facility Comparison
From Table 6, it is clear that Mirpur has more schools in number compared to Dhanmondi. As aconsequence, the correlation value between the activity area of the respondents and number of schoolsis also stronger (0.703) for this area.
Table 6. Area-wise access to opportunity (school) for road network buffer.
Measure of Activity Space(Road Network Buffer)
Mean (S.D.) Median (Range)
Number of schoolsMirpur 56.5 (28.4) (0–110)
Dhanmondi 52.55 (28.06) (0–87)
Percent with at least one schoolMirpur 100
Dhanmondi 100
Correlation between area andnumber of schools
Mirpur 0.703Dhanmondi 0.629
4. Discussion
4.1. Summary of Pilot Results
From Table 7, we can see that the daily activity areas for individual respondents ranged from0.38 to 6.18 square miles. The average activity space for the respondents from Mirpur (2.88 squaremiles) was much larger than that of respondents from Dhanmondi (1.63 square miles). All of therespondents from the Dhanmondi area had a daily activity space of less than 3.59 square miles, while40% of respondents from the Mirpur area had an activity space of 3.12 to 6.18 square miles. Thisshows more dispersed activity locations for one area over another. An initial hypothesis regardingthis finding was that the Mirpur area is predominantly residential, with less commercial and otherfacilities, and therefore, Mirpur respondents needed to travel greater distances to satisfy their dailyneeds. This difference also likely occurred because the Dhanmondi area, in contrast, has a slightlymore diverse land-use distribution than the Mirpur area (based on a land-use entropy measure), soDhanmondi respondents could satisfy their needs within short distances. From the entropy valueranges, the Dhanmondi area was found to be slightly more diverse in land-use distribution thanthe Mirpur area, which complemented the greater land-use balance that was stated above. Whilecalculating diversity, residential land use was found to completely dominate the activity space by alarge proportion (58.82%). Most of the activity areas showed diversity values higher than 0.5, whichindicates heterogeneity of land use and would be supportive for enhancing accessibility. In termsof road connectivity, the Dhanmondi area had relatively better connectivity than the other one, withmore intersections per square mile. From the accessibility of opportunities (school and open space)analysis, each individual respondent was found to have at least one school within their activity space,while a substantial percentage of respondents were found without access to open space (70.45%). Afterperforming correlation analysis, positive correlations were found between the area and number ofopportunities for both school and open space; the association was strong for school facility (0.639),but a weak correlation was found between open space and activity area (0.139). While conductingsubarea-wise analysis, Mirpur was found to have more schools in comparison to Dhanmondi. As aconsequence, the correlation value between the activity area of respondents and number of schoolswas also stronger (0.703) for this area.
Urban Sci. 2019, 3, 36 22 of 26
Table 7. Summary of pilot results.
Daily activity area (sq. mile) Minimum 0.37Maximum 6.18
Mean activity space (sq. mile) Mirpur 2.88Dhanmondi 1.63
Dominant land use within activity space: Residential (58.82%)Diversity value > 0.5
Dhanmondi area: more diverse and better street connectivity
Correlation with activity space School facility 0.639Open space 0.139
4.2. Lessons Learnt from Pilot Study
Although the pilot study clarified the data and analytical requirements for the full study, severalelements will be revised in the proposed full study. The pilot data showed that some specificsocio-economic and travel differences were observed across the study areas (car ownership, income,modal share, distance traveled, trip duration, and so on). Therefore, in terms of the survey samplingand methodology for the full study, the selection of these two study areas may not be sufficient tocapture variation in travel behavior, since the majority of the trips were found to be work trips (64.48%).Collecting only one individual respondent’s travel information from each household limited the use ofother activity space measures (such as the standard deviation ellipse method), because most of therespondents had only two activity points that could be used to calculate their activity space.
Preliminary multiple regression analysis of the two measures of activity space size was conducted(not reported here given the small sample size) and suggested that, consistent with previous activityspace studies, land-use mix was a significant predictor of the activity space size for residents of DhakaCity. The collection of more trip-related information in the full survey will be beneficial. Exploratorycorrelation and regression analysis of the pilot data was limited by the small sample size. If GPS-baseddata collection procedures could be employed in the travel diary survey, the exact activity areas of therespondents could be collected. In terms of analytical methods, additional activity space measurementtechniques or different sets of indicators (variables) will be evaluated in the full study to assess a widerrange of factors associated with activity space patterns. Regression modeling techniques will also berefined. A more in-depth literature review will need to be conducted in order to identify most suitablemodels, variables, and activity space measurement techniques.
5. Conclusions
This paper will contribute to the literature based on travel-activity space patterns and planningpractice in several areas. Very few studies exist on travel-activity space measures outside the U.S. andEuropean contexts. Representing southeast Asia (from the developing world) in the transportationresearch literature by studying Dhaka City will make an important contribution. Differences acrosssubgroups of the population (based on gender, social class, etc.) can help identify and address socialexclusion concerns. Also, only a few previous studies have assessed the influence of individualperceptions and values on activity spaces. Finally, understanding the day-to-day interpersonaland intrapersonal variability of activity spaces and examining individual access to potential urbanopportunities will give specific guidance for reshaping the land-use and socio-economic policies of thestudy area. Some limitations are evident in this paper, which are as follows. As the ArcGIS-generatedland-use shape files were prepared a few years ago (2010), there is a possibility of there being some landparcels that were developed after that time not being included in the available data. However, thosemissing land parcels (if any) can be located in the map with reference to the adjacent land uses. It wasnot possible to conduct a GPS-based travel diary data collection method in the Dhaka city context, asmost of the people do not own automobiles and change mode frequently. The lack of affordability of

Urban Sci. 2019, 3, 36 23 of 26
GPS trackers (instrument) for each individual respondent was another issue. Without GPS trackingsurvey, data accuracy may be in question, but that is a limitation of collecting data for Dhaka.
Supplementary Materials: The following are available online at http://www.mdpi.com/2413-8851/3/1/36/s1,Table S17: Attitudinal Characteristic Importance Ranking for the Respondents (Descriptive Statistics of Likert scalevariables related with perception), Table S16: KMO and Bartlett’s Test: Factor analysis (Descriptives), Table S18:Total variance explained for extracted factors, Figure S10: Scree plot indicating that the data have eleven factors,Figure S4: Existing land use distribution, Figure S5(a): Reclassification to five types of land uses for diversitymeasurement, Figure S5(b): SPN with selected land use within buffer area for diversity measurement, Figure S6:Land use distribution comparison between total area and within the area of all respondent’s activity space. AllGIS database can be found at https://www.dropbox.com/s/2duphf9p6wqrfdb/GIS%20Dataset.zip?dl=0.
Author Contributions: Conceptualization, D.H. and N.S.; methodology, N.S.; software, N.S.; validation, D.H.;formal analysis, N.S.; investigation, N.S.; resources, D.H. and N.S.; data curation, N.S.; writing—original draftpreparation, N.S.; writing—review and editing, D.H.; visualization, N.S.; supervision, D.H.; project administration,D.H.
Funding: This research received no external funding.
Acknowledgments: The authors would like to express gratitude to Stephen G. Ritchie, Jean-Daniel Saphores, JaeHong Kim, and Teresa A. Dalton from University of California, Irvine for acting as the Candidacy committeemembers for this ongoing Ph.D. research and providing valuable suggestions during the dissertation proposalpresentation. Moreover, we would like to thank the undergraduate students of Bangladesh University ofEngineering and Technology, Dhaka, Bangladesh for their support and contribution in the Household Travelsurvey data collection.
Conflicts of Interest: The authors declare no conflict of interest.
References
1. Boarnet, M.G.; Sarm, S. Can Land-use Policy Really Affect Travel Behaviour? A Study of the Link betweenNon-work Travel and Land-use Characteristics. Urban Stud. 1998, 35, 1155–1169. [CrossRef]
2. Fan, Y.; Khattak, A. Urban Form, Individual Spatial Footprints, and Travel: Examination of Space-UseBehavior. Transp. Res. Rec. J. Transp. Res. Board 2008, 2082, 98–106. [CrossRef]
3. Manaugh, K.; El-Geneidy, A.M. What makes travel ‘local’: Defining and understanding local travel behavior.J. Transp. Land Use 2012, 5, 15–27. [CrossRef]
4. Susilo, Y.O.; Kitamura, R. Analysis of Day-to-Day Variability in an Individual’s Action Space Exploration of6-Week Mobidrive Travel Diary Data. J. Transp. Res. Board 2005, 1902, 124–133. [CrossRef]
5. Buliung, R.N.; Kanaroglou, P.S. A GIS toolkit for exploring geographies of household activity/travel behavior.J. Transp. Geogr. 2006, 14, 35–51. [CrossRef]
6. Dijst, M. Action space as planning concept in spatial planning. Neth. J. Hous. Built Environ. 1999, 14, 163–182.[CrossRef]
7. Dijst, M. Two-earner families and their action spaces: A case study of two dutch communities. GeoJournal1999, 48, 195–206. [CrossRef]
8. Kwan, M.-P. Gender, the Home-Work Link, and Space-Time Patterns of Nonemployment Activities.Econ. Geogr. 1999, 75, 370–394. [CrossRef]
9. Kwan, M.-P. Space-Time and Integral Measures of Individual Accessibility: A Comparative Analysis Using aPoint-based Framework. Geogr. Anal. 1998, 30, 191–216. [CrossRef]
10. Miller, H.J.; Wu, Y.-H. GIS Software for Measuring Space-Time Accessibility in Transportation Planning andAnalysis. GeoInformatica 2000, 4, 141–159. [CrossRef]
11. Kim, H.-M.; Kwan, M.-P. Space-time accessibility measures: A geocomputational algorithm with a focus onthe feasible opportunity set and possible activity duration. J. Geogr. Syst. 2003, 5, 71–91. [CrossRef]
12. Kwan, M.-P. Gender and Individual Access to Urban Opportunities: A Study Using Space–TimeMeasures.Prof. Geogr. 1999, 51, 210–227. [CrossRef]
13. Sherman, J.E.; Spencer, J.; Preisser, J.S.; Gesler, W.M.; Arcury, T.A. A suite of methods for representing activityspace in a healthcare accessibility study. Int. J. Health Geogr. 2005, 4, 1–21. [CrossRef] [PubMed]
14. Weber, J.; Kwan, M. Bringing Time Back In: A Study on the Influence of Travel Time Variations and FacilityOpening Hours on Individual Accessibility Bringing Time Back In: A Study on the Influence. Prof. Geogr.2002, 54, 226–240. [CrossRef]

Urban Sci. 2019, 3, 36 24 of 26
15. Casas, I. Social Exclusion and the Disabled: An Accessibility Approach. Prof. Geogr. 2007, 59, 463–477.[CrossRef]
16. Casas, I.; Horner, M.W.; Weber, J. A Comparison of Three Methods for Identifying Transport-Based Exclusion:A Case Study of Children’s Access to Urban Opportunities in Erie and Niagara Counties, New York. Int. J.Sustain. Transp. 2009, 3, 227–245. [CrossRef]
17. Kamruzzaman, M.; Hine, J. Analysis of Rural Activity Spaces and Transport Disadvantage using aMulti-Method Approach. Transp. Policy 2012, 19, 105–120. [CrossRef]
18. Mccray, T.; Brais, N. Exploring the Role of Transportation in Fostering Social Exclusion: The Use of GIS toSupport Qualitative Data. Netw. Spat. Econ. 2007, 7, 397–412. [CrossRef]
19. Wong, D.W.S.; Shaw, S. Measuring segregation: An activity space approach. J. Geogr. Syst. 2011, 13, 127–145.[CrossRef]
20. Horton, F.E.; Reynolds, D.R. Effects of Urban Spatial Structure on Individual Behavior. Econ. Geogr. 1971, 47,36–48. [CrossRef]
21. Botte, M. The Connection of Urban Form and Travel Behaviour: A Geo-Spatial Approach to Measuring Success of TransitOriented Developments Using Activity Spaces; The University of Western Australia: Crawley, Australia, 2015.
22. Kenyon, S.; Lyons, G.; Rafferty, J. Transport and social exclusion: Investigating the possibility of promotinginclusion through virtual mobility. J. Transp. Geogr. 2002, 10, 207–219.
23. Kwan, M.-P. Gender differences in space-time constraints. Area 2000, 32, 145–156.24. Schönfelder, S.; Axhausen, K.W. Structure and innovation of human activity spaces. ISTTT 2004, 16, 1–40.25. Schönfelder, S.; Axhausen, K.W. Activity Spaces: Measures of Social Exclusion? Institut für Verkehrsplanung
und Transportsysteme (IVT), ETH Zürich: Zürich, Switzerland, 2003.26. Schönfelder, S.; Axhausen, K.W. Measuring the Size and Structure of Human Activity Spaces the Longitudinal
Perspective; Institute for Transport Planning and Systems, Swiss Federal Institute of Technology: Zurich,Switzerland, 2002.
27. Zenk, S.N.; Schulz, A.J.; Matthews, S.A.; Odoms-Young, A.; Wilbur, J.; Wegrzyn, L.; Gibbs, K.;Braunschweig, C.; Stokes, C. Health & Place Activity space environment and dietary and physical activitybehaviors: A pilot study. Health Place 2011, 17, 1150–1161. [CrossRef]
28. Kitamura, R.; Mokhtarian, P.L.; Laidet, L. A micro-analysis of land use and travel in five neighborhoods inSan Francisco Bay Area. Transportation 1997, 24, 125–158. [CrossRef]
29. Dharmowijoyo, D.B.E.; Susilo, Y.O.; Karlstrom, A. Day-to-day variability in traveller’s activity-travel patternsin the Jakarta metropolitan area. Transportation 2016, 43, 601–621. [CrossRef]
30. Dharmowijoyo, D.B.E.; Susilo, Y.O.; Karlström, A. Day-to-day interpersonal and intrapersonal variability ofindividuals’ activity spaces in a developing country. Environ. Plan. B Plan. Des. 2014, 41, 1063–1076. [CrossRef]
31. Dharmowijoyo, D.B.E.; Susilo, Y.O.; Karlström, A.; Somantri, L. Collecting a multi-dimensional three-weekshousehold time-use and activity diary in the Bandung Metropolitan Area, Indonesia. Transp. Res. Part A2015, 80, 231–246. [CrossRef]
32. Hasan, S.; Hoque, M.S. A Simplified Travel Demand Modeling Framework: In the Context of a DevelopingCountry City. (n.d.). Available online: http://www.codatu.org/wp-content/uploads/A-simplifield-travel-demand-modeling-framework-in-the-context-of-a-developing-country-city-Samiul-HASANShamsul-HOQUE.pdf (accessed on 4 August 2016).
33. Evren, G.; Akad, M. Transportation Planning Problems in Developing Countries. (n.d.). Available online:http://www.iasi.cnr.it/ewgt/13conference/143_evren.pdf (accessed on 15 December 2018).
34. Gakenheimer, R. Transportation and Land Use in the Developing World: Planning in a Context of Controversy. InInternational Congress on Human Development Madrid. 2006. Available online: http://www.reduniversitaria.es/ficheros/RalphGakemheimer(i).pdf (accessed on 15 December 2018).
35. Dhaka Tribune. Dhaka Loses 3.2 m Working Hours to Traffic Congestion Daily. 2019. Available online:https://www.dhakatribune.com/bangladesh/dhaka/2018/07/05/dhaka-loses-3-2m-working-hours-to-traffic-congestion-daily (accessed on 10 February 2019).
36. NUMBEO. Traffic Index 2019. Available online: https://www.numbeo.com/traffic/rankings.jsp (accessedon 17 February 2019).
37. Zaman, M.U.; Haldar, K. Travel Demand Management (TDM) Measure as a Solution of Traffic Problems ofDhaka City. J. Bangladesh Inst. Plan. 2014, 7, 1–16.

Urban Sci. 2019, 3, 36 25 of 26
38. Islam, W.; Hadi, M. Transport and Infrastructure: Implementation Status of the Major Recommendation.In Proceedings of the National Policy Review Forum, Dhaka, Bangladesh, 3–5 June 2003.
39. Hoque, M. The Road to Road Safety: Issues and Initiatives in Bangladesh. Reg. Health Forum 2004, 8, 39–51.40. Qaium, A.S.M. Integration of Motorized and Non-Motorized Transport Modes: An Alternative Strategy for
Creating a Sustainable Urban Transport System for Dhaka, Bangladesh. In Proceedings of the InternationalSymposium on Urban Development, Transport, and the Environment, United Nations Centre for RegionalDevelopment, Sagamihara/Nagoya, Japan, 1994; pp. 335–361.
41. Rahman, M.; Ahmed, S. Increase of Traffic Congestion and Private Cars in Dhaka through Planning againstPublic Interest: A Solution. 2008. Available online: http://fpd-bd.com/wp-content/uploads/2013/04/Increase_Tra_fic_congestion_-Private-Car1.pdf (accessed on 15 August 2016).
42. Daily Star. Private Cars Fill 70pc City Roads. 2011. Available online: http://archive.thedailystar.net/newDesign/news-details.php?nid=171193 (accessed on 15 September 2016).
43. Mannan, S.M.; Karim, M.M. Current State of the Mobility of the Urban Dwellers in Greater Dhaka.In Proceedings of the 94th Annual Conference and Exhibition of Air and Waste Management Association,Orlando, FL, USA, 21–24 June 2001.
44. Sharmeen, N.; Neema, M.N. Development of a GIS-Based Model for Optimum Traffic Flow Distribution: A CaseStudy on Selected Major Routes of Dhaka City; Bangladesh University of Engineering & Technology: Dhaka,Bangladesh, 2014.
45. Thornton, L.E.; Pearce, J.R.; Kavanagh, A.M. Using Geographic Information Systems (GIS) to assess therole of the built environment in influencing obesity: A glossary. Int. J. Behav. Nutr. Phys. Act. 2011, 8, 71.[CrossRef]
46. Swapan, M.S.H.; Zaman, A.U.; Ahsan, T.; Ahmed, F. Transforming Urban Dichotomies and Challengesof South Asian Megacities: Rethinking Sustainable Growth of Dhaka, Bangladesh. Urban Sci. 2017, 1, 31.[CrossRef]
47. Habib, M.A.; Ahmed, M.; Siddiquee, M.Z.H. Transportation Problems and System Deficiencies of DhakaCity—An Integrated Approach for Solutions; Bangladesh University of Engineering and Technology: Dhaka,Bangladesh, 2002.
48. Habib, K.M.N. Evaluation of Planning Options to Alleviate Traffic Congestion and Resulting Air Pollution in DhakaCity by; Bangladesh University of Engineering and Technology (BUET): Dhaka, Bangladesh, 2002.
49. Mahmud, K.; Gope, K.; Chowdhury, S.M.R. Possible Causes & Solutions of Traffic Jam and Their Impact onthe Economy of Dhaka City. J. Manag. Sustain. 2012, 2, 112–135. [CrossRef]
50. Daisy, S.; Habib, M.A. Modeling the factors affecting mode choice behaviour for school trips in Dhaka City.In Proceedings of the 13th WCTR, Rio De Janiro, Brazil, 15–18 July 2013; pp. 1–19.
51. Mahmud, M.; Rabbani, A. Travel Mode Choice Preferences of Urban Commuters in Dhaka a Pilot Study; WorkingPaper; International Growth Centre (IGC): Dhaka, Bangladesh, 2012.
52. Ahmed, T. Exploring Trip Chain Behaviour of the Working Population in Dhaka. Bangladesh University ofEngineering and Technology. 2016. Available online: http://lib.buet.ac.bd:8080/xmlui/bitstream/handle/123456789/4295/FullThesis.pdf?sequence=1 (accessed on 25 April 2017).
53. Anwar, M. A Study on Factors for Travel Time Variability in Dhaka City Corporation Area. J. BangladeshInst. Plan. 2010, 3, 53–64.
54. Neema, M.N.; Jahan, J. An Innovative Approach to Mitigate Vehicular Emission through Roadside Greeneries:A Case Study on Arterial Roads of Dhaka City. J. Data Anal. Inf. Process. 2014, 2, 32–39. [CrossRef]
55. Handy, S.L.; Niemeier, D.A. Measuring accessibility: An exploration of issues and alternatives. Environ. Plan. A1997, 29, 1175–1194. [CrossRef]
56. Buliung, R.N.; Roorda, M.J.; Remmel, T.K. Exploring spatial variety in patterns of activity-travel behaviour:initial results from the Toronto Travel-Activity Panel Survey (TTAPS). Transportation 2008, 35, 697–722.[CrossRef]
57. Mohr, C.O. Table of equivalent populations of North American small mammals. Nature 1947, 37, 223–249.[CrossRef]
58. Olaru, D.; Curtis, C. Is Transit Oriented Development Reducing the Activity Spaces? In Proceedings of the11th World Conference on Transportation Research, Berkeley, CA, USA, 24–28 June 2007; Available online:http://hdl.handle.net/20.500.11937/27959 (accessed on 13 March 2017).

Urban Sci. 2019, 3, 36 26 of 26
59. Afrin, S.; Zerin, I.; Sharmin, S.; Morshed, K.M. Transformation of Dhanmondi Residential Area—Causes,Effects and Proposal to Rejuvenate. Asian J. Appl. Sci. Eng. 2012, 1, 31–47.
60. Islam, I.; Mitra, S.K.; Shohag, M.A.N.; Rahman, M.A. Land Price in Dhaka City: Distribution, Characteristicsand Trend of Changes. (n.d.). Available online: http://www.bip.org.bd/SharingFiles/journal_book/20130718115210.pdf (accessed on 10 May 2017).
61. BBS. Population & Housing Census 2011; Zila Report: Dhaka, Bangladesh, 2015.62. Mohit, M.A. Bastee Settlements of Dhaka City, Bangladesh: A Review of Policy Approaches and Challenges
Ahead Procedia-Soc. Behav. Sci. 2012, 36, 611–622. [CrossRef]63. Dillman, D.A. Mail and Internet Surveys: The Tailored Design Method, 2nd ed.; Wiley: New York, NY, USA, 2000.64. Anable, J. “Complacent Car Addicts”; or “Aspiring Environmentalists”? Identifying travel behaviour
segments using attitude theory. Transp. Policy 2005, 12, 65–78. [CrossRef]65. Elias, W.; Shiftan, Y. The influence of individual’s risk perception and attitudes on travel behavior. Transp. Res.
Part A Policy Pract. 2012, 46, 1241–1251. [CrossRef]66. Houston, D.; Boarnet, M.G.; Ferguson, G.; Spears, S. Can compact rail transit corridors transform the
automobile city? Planning for more sustainable travel in Los Angeles. Urban Stud. 2015, 52, 938–959. [CrossRef]67. Spears, S.; Houston, D.; Boarnet, M.G. Illuminating the unseen in transit use: A framework for examining
the effect of attitudes and perceptions on travel behavior. Transp. Res. Part A Policy Pract. 2013, 58, 40–53.[CrossRef]
68. Wang, T.; Chen, C. Attitudes, mode switching behavior, and the built environment: A longitudinal study inthe Puget Sound Region. Transp. Res. Part A Policy Pract. 2012, 46, 1594–1607. [CrossRef]
69. MapCruzin. Main Free GIS Maps & ArcGIS Shapefiles. Available online: http://www.mapcruzin.com/free-bangladesh-country-city-place-gis-shapefiles.htm (accessed on 21 January 2017).
70. Hair, J.F.; Black, B.; Babin, B.; Anderson, R.E.; Tatham, R.L. Multivariate Data Analysis, 6th ed.; PearsonEducation Inc.: Hoboken, NJ, USA, 2006.
71. Cervero, R.; Kockelman, K. Travel demand and the 3Ds: Density, diversity, and design. Transp. Res. Part DTransp. Environ. 1997, 2, 199–219. [CrossRef]
72. Ma, Y.-S.; Chen, X. Geographical and Statistical Analysis on the Relationship Between Land-Use Mixtureand Home—Based Trip Making and More: Case of Richmond. J. Urban Reg. Anal. 2013, 1, 5–44.
73. Munshi, T.G. Built form, Travel Behaviour and Low Carbon Develpment in Ahmedabad, India. Fac. ITC2013. [CrossRef]
74. Ewing, R.; Cervero, R. Travel and the Built Environment. J. Am. Plan. Assoc. 2010, 1–30. [CrossRef]
© 2019 by the authors. Licensee MDPI, Basel, Switzerland. This article is an open accessarticle distributed under the terms and conditions of the Creative Commons Attribution(CC BY) license (http://creativecommons.org/licenses/by/4.0/).
Copyright © 2022 FDOKUMEN