Saccharum spontaneum L. ‘SES 208’ genetic linkage map combining RFLP and PCR-based markers
Upload
independentCategory
view
1download
0
INTRODUCTION
DOI: 10.5897/AJB2014.13849
ISSN 1684-5315 Copyright © 2014
differentiation.
Article Number: 621CF8D48567
Author(s) retain the copyright of this article http://www.academicjournals.org/AJB
Full Length Research Paper
Vol. 13(46), pp. 4308-4319, 12 November, 2014
molecular markers
and Genetics Program, Ethiopia.
Received 10 April, 2014; Accepted 10 June, 2014
Esayas Tena1*, Firew Mekbib2 and Amsalu Ayana3
1Sugar Corporation of Ethiopia, Research and Training Ethiopia.
breeding programs to maximize yield as well as to maintain genetic diversity.
3Integrated Seed Sector Development Ethiopia Program Addis Ababa, Ethiopia.
Analysis of genetic diversity and population structure
among exotic sugarcane (Saccharum spp.) cultivars in
Ethiopia using simple sequence repeats (SSR)
2Haramaya University, College of Agriculture and Environmental Sciences, School of Plant Sciences, Plant Breeding
The present study was performed to study genetic relationships and population differentiation of 90 introduced sugarcane accessions in Ethiopia by means of 22 SSR molecular markers. The 22 SSR markers amplified a total of 260 alleles, of which 230 were polymorphic with a mean of 10.45 alleles per SSR locus. The range in allele number was 4–22. A high level of polymorphism with a mean of 60.51% polymorphic loci within the genotypes was detected. The polymorphic information content (PIC) ranged from 0.231 to 0.375 with an average of 0.303. Measures of effective number of alleles and genetic diversity on average were 1.55 and 0.317, respectively, across all the 22 markers evaluated. The SSR genetic profiles obtained using the 22 markers enabled complete discrimination among all the 90 introduced sugarcane cultivars. The neighbor- joining unweighted pair group method with arithmetic mean (UPGMA) cluster analysis based on the simple matching dissimilarity indices unambiguously distinguished all sugarcane genotypes with three major clusters and 11 groups. The same clustering pattern was also found in the PCoA analysis. In all the geographical populations, genotypes from the same country were often in different clusters and likewise accessions from different countries often clustered together indicating the possibility of exchange of materials between countries. Population genetic differentiation showed Fst values among pairs of populations ranging from 0.0024 to 0.5134 with an overall average of 0.0590. The average gene flow (Nm) among populations was 1.7213. Nei’s unbiased genetic distance ranged from 0.018 to 0.279 with an overall average of 0.053. Genetic identity values were in the range of 0.756 to 0.992 with overall average of 0.950. The genetic relationship information of the cultivars will help sugarcane breeders to select the appropriate parents in their
Key words: Sugarcane, Ethiopia, simple sequence repeats (SSR), genetic diversity, population genetic
African Journal of Biotechnology
Sugarcane is an important food crop of the tropics and between 40°N and 32° 5´S (Anonymous, 1998). A wide sub tropics that is cultivated in about 74 countries varietty of sweet cane types existed from which were

growing conditions of the country of source. At present, in Ethiopia sugarcane plantations are increasing at large and the demand for new superior varieties for each sugarcane growing region is expected to rise than ever. Accordingly, preparation to launch sugarcane breeding program in the country is underway to generate high yielding varieties that can adapt to different agro ecologies of sugarcane plantations and withstand different biotic and abiotic stresses. As the first step in this endeavour to broaden the genetic base of germplasm, exploration and collection of local sugarcane germplasm growing in the country in the back yards of small holder farmers since ancient times has been conducted and more than 200 clones were collected and preserved (Esayas et al., 2012).
There is lack of information on the imported varieties vis a vis pedigree, identity of the varieties etc., which is very difficult to trace as many of the clones are of old ge-
Tena et al. 4309
selected thick barrelled, high sucrose soft sticks and this neration and significant number are of unknown sources. crude method of selection eventually produced better In spite of a long history of introduction, no systematic cane types. Sugarcane produces numerous valuable by- effort has been made to understand the genetic products like alcohol used by pharmaceutical industry, relationship of these cultivars. For better use of these ethanol used as a fuel, bagasse used for manufacturing materials in the breeding program and for broadening the paper and chipboard and press mud used as a rich genetic base characterization of these germplasm, source of organic matter and nutrients for crop production efficient molecular marker is a must. The modern genetic (Muhammad and Farooq, 2007). The genome of modern breeding requires crosses between productive and sugarcane cultivars is a complex blend of aneuploidy and genetically divergent parents, in order to have better polyploidy derived from the interspecific hybridization heterotic effect and variability in the segregant involving different Saccharum species particularly, S. generations (Cruz, 2001). officinarum and S. spontaneum (Swarup et al., 2009). Genomic microsatellite markers are capable of Use of an efficient molecular marker system is essential revealing high degree of polymorphism. Sugarcane for sugarcane genome for understanding the genetic and (Saccharum spp.), having a complex polyploid genome taxonomic complexity, and broadening the genetic base requires such informative markers for various of sugarcane cultivars, thereby improving sugar yield and applications in genetics and breeding. Microsatellite its stabilization against abiotic and biotic stresses. markers have gained considerable importance in plant
Since the start of the sugar industry, Ethiopia has been genetics and breeding owing to their many desirable relying on importation of sugarcane varieties from many genetic attributes including hyper variability, wide source countries to satisfy the varietal requirements of genomic distribution, co-dominant inheritance, the sugarcane plantations. So far more than 300 reproducibility, multi-allelic nature, and chromosome sugarcane varieties have been imported and preserved in specific location (Singh et al., 2010). These markers are germplasm conservation garden located at Wonji. amenable to high throughput genotyping and are thus Importing variety per se is not an easy task, besides this suitable for paternity determination, construction of high all introduced varieties might not become successful density genome maps, mapping of useful genes, marker- commercial cultivars. For instance, among these assisted selection, and for establishing genetic and introduced varieties, currently only 6-7 varieties are evolutionary relationships (Swarup et al., 2009). SSRs grown widely and commercially for sugar production in are an ideal means for the identification of the genetic the three old sugar estates namely Wonji, Metehara and constitution of modern sugarcane cultivars of inter- Fincha and the recent ones like Tendaho, Kesem, Beles, specific origins (Giovanni et al., 2003). Kuraz and Wolkayit. These varieties are of very old Hence, this study was conducted to quantify genetic generation and are contracted with many problems and variability/diversity among introduced sugarcane not satisfactorily adapted to the different sugarcane germplasm collections using SSR markers and to assess growing areas of the country. This could be because of genetic associations within and among populations of the reason that the varieties were released to suit the clones from different source countries.
MATERIALS AND METHODS
Plant materials
A total of 90 accessions of sugarcane introduced from a range of sugarcane producing countries around the world were used in this study. These materials were selected amongst more than 300 introduced sugarcane varieties found at the field conservation garden of Sugar Corporation of Ethiopia, Research and Training located at Wonji (Table 1). Selection was made taking into consideration the variation in place of origin that is source countries and different periods of introductions to the country. For genomic DNA isolation, young immature leaves of sugarcane genotypes was taken and stored in zip lock plastic bags containing Grade 12, blue silica gel. The silica was added in the ratio 1:5 which was sufficient enough to dry the leaves completely. This way, the leaf samples were transported to Sugarcane Breeding Institute, Coimbatore, India and total DNA isolation was conducted using the method described by Walbot (1988) in the laboratory of department of biotechnology between November 2012 and February 2013.
*Corresponding author. E-mail: [email protected].
Author(s) agree that this article remain permanently open access under the terms of the Creative Commons Attribution License 4.0 International License

4310 Afr. J. Biotechnol.
Table 1. Introduced sugarcane varieties in Ethiopia used for SSR diversity analysis.
Number Cultivar Country of origin Year of introduction Number Cultivar Country of origin Year of
introduction Number Cultivar Country of origin Year of introduction
1 B3172 Barbados 1983 17 CB 41-76 Campos (Brazil) 1970 33 CP 36/111 Do 1970 2 B37172 Do 1956 18 C 105-73 Do 1974 34 CP44/101 Do 1957 3 B 4098 Do 1960 19 CB 56-20 Do 1983 35 CP 48/103 Do 1960 4 B41211 Do 1970 20 CO 245 Coimbatore(India) 1970 36 CP 52/68 Do 1974 5 B 4425 Do 1974 21 CO 331 Do 1954 37 H48/4605 Hawaii 1965 6 B 45154 Do 1957 22 CO 434 Do 1970 38 H49/5 Do 1965 7 B 49119 Do 1962 23 CO 440 Do 1963 39 H49/3533 Do 1974 8 B 5364 Do 1965 24 C120-78 Do 1970 40 CP 65/357 Canal point 1983 9 B 62347 Do 1974 25 CO 475 Do 1956 41 CP 8/1026 Do 1984
10 BO 10 Bihar-Orissa (India) 1960 26 CO 513 Do 1960 42 CP 1/441 Do 1983 11 BO 14 Do 1974 27 CO 740 Do 1962 43 CP 71/443 Do 1984 12 BO 29 Do 1974 28 CO 957 Do 1965 44 COS 109 Unknown 1965 13 BO 3 Do 1970 29 CO 1208 Do 1987 45 COS 443 Do 1965 14 CB 36-14 Campos,(brazil) 1974 30 CP 29/116 Canal point 1953 46 COS 510 Do 1962 15 CB 38-22 Do 1959 31 CP 29/291 Do 1954 47 COK 30 Do 1970
16 CB 40-35 Do 1983 32 CP 36/105 Do 1959 48 D 42/58 Demerara, (Guyana) 1974
49 D 141/46 Demerara, (Guyana) 1974 63 H 39/3633 Hawaii 1960 77 N 14 Natal (South Africa) 1980
50 D 188/56 Do 1974 64 H 44/3098 Do 1960 78 N 50/93 Do 1965 51 DB 95/57 (Demerara) X Barbados 1974 65 L 60-14 Louisiana, USA 1974 79 WD II Do 1953 52 DB 377/60 Do 1974 66 L 60-25 Do 1974 80 C86-12 Cuba 2003 53 DB 386/60 Do 1974 67 L 60-35 Do Unknown 81 C132-81 Do 2003 54 DB 414/60 Do 1974 68 L 60-40 Do 1974 82 NCD 310 Natal 1953 55 DB 414/66 Do 1983 69 M 31/45 Mauritius 1957 83 NCD 349 Do 1970 56 Ebene 1/37 Unknown 1957 70 M 53/263 Do Unknown 84 PR 905 Puerto Rico 1959 57 E 88/56 Do 1974 71 M 112/34 Do 1960 85 PR 980 Do 1965 58 E 188/53 Do 1974 72 M 147/44 Do 1957 86 PR 1000 Do 1960 59 E 188/56 Do 1974 73 Mex 52/29 Mexico 1970 87 PR 1007 Do 1970 60 F 134 Formosa, (Taiwan) 1970 74 Mex 59/1828 Do 1983 88 PR 1059 Do 1974 61 F 141 Do 1970 75 N 6 Natal (South Africa) 1983 89 PPQK 1604 Do 1958 62 H 38/4443 Hawaii 1960 76 N 11 Do 1987 90 Pindar Unknown 1957
pre-cooled sterilized mortar and pestle. Fine powder was Approximately 500 mg leaves of each genotype were transferred into sterilized centrifuge tube containing 10-15
DNA isolation separately ground to fine powder in liquid nitrogen using ml of grinding buffer and centrifuged at 6500 rpm for 6 min at 4C. After discarding the supernatant, the pellet was suspended in 3 ml of suspension buffer and 200 μl of 20%

for 15 min. After incubation, 1.5 ml ammonium acetate (7.5 M) was added, mixed well and placed on ice for half an hour. The sample
was decanted in 6 ml iso-propanol to precipitate the DNA. After
at 65C for 15 min. The DNA solution was transferred into sterilized microfuge tube using sterilized cut tips and 15 μl RNase (10 mg/ml) was added and incubated in a water bath at 37°C for 15 min. Then equal volume of choloroform:iso-amyl alcohol (24:1) was added and followed by centrifugation at 10,000 rpm for 10 min at room temperature. The aqueous phase was pipetted out and transferred into fresh microfuge tube. This was repeated two times. Then DNA was precipitated by adding 50 μl sodium acetate (1/10th) and 1 ml of ice-cold absolute ethanol and kept at -20°C for half an hour. After this, the DNA was pelleted by centrifuging at 15000 rpm for 15 min at 4°C. The pellet was washed two times with 70% ice-cold ethanol. Finally, the pellet was dried in air and dissolved in 200 μl TE and stored at -20°C until used.
The quantity and quality of the extracted genomic DNA were checked and normalization or adjustments to 10 ng μl-1 was done on agarose gel (0.8%) using lambda DNA standard (Thermo Scientific, USA). The DNA was quantified by loading the samples on 0.8% agarose gel containing 0.5 g ml-1 of ethidium bromide. The DNA was normalized to 10 ng μl-1 concentration by comparing visually the diluted DNA samples with the standard λ DNA molecular weight markers on 0.8% agarose gel by running it in 0.5xTBE (Tris-borate EDTA) buffer at a constant voltage (180 V/125 mili amp) for 45 min. The images of gels were documented under UV illumination using Uvi -Tech gel documentation system (DOL- 008.XD, England).
SSR assays
Twenty two (22) SSR markers designed in laboratory of the Department of Biotechnology, Sugarcane Breeding Institute, Coimbatore, India were used (Table 2). PCR reactions were performed in 15 μl reaction mixtures in 96-well PCR plates (Thermocycler, MJ Research Inc Model: PTC-100). Each PCR reaction contained 10 ng of genomic DNA (3 μl), 10XTaq Buffer with MgCl2 (1.5 μl), 1.25 mM dNTPS (2.4 μl), each 30 ng (1 μl) forward and reverse primers, 3 U/μl Taq DNA polymerase (0.3 μl) and sterile 5.8 μl milliQ water. PCR amplification was carried out at 94°C for 5 min initial denaturation, followed by 30 cycles of 94°C (denaturation) for 1 min, 50-65°C annealing temperature (depen- ding on AT and CG content of the primers) for 1 min and 72°C extension for 1 min. After completion of all 30 cycles, a final extension of 10 min at 72°C was performed.
PAGE
Checking of the amplification of the PCR products was done on 1% agarose gel containing 0.5 ml/10 ml ethidium bromide (10 mg ml-1) with 10 base-pair DNA ladder by running it at a constant voltage of 180 V/125 mili amp for 45 min. The amplification was visualized under UV illumination using Uvi Tech gel documentation system (DOL-008.XD, England). After this, PCR products were loaded on 4% PAGE gels, polyacrylamide: bis acrylamide (29:1) and electrophoresed in 1x TBE buffer at constant power of 180 V/125 milli amp) for 1 h using Sequi Gen® GT nucleic acid electrophoresis
Tena et al. 4311
SDS was added, mixed gently and placed on a water bath at 70°C cell and the products were resolved using silver staining procedure.
was centrifuged at 14,000 rpm for 10 min at 4°C. Then supernatant Data analysis
incubation for 30 min in ice the sample was centrifuged at 15,000 Only clear and unambiguous bands of SSR markers were scored. rpm for 15 min at 4°C to pellet the DNA, supernatant was discarded No assumption on the genetic nature of the alleles was made due and the pellet was resuspended in 500 μl TE and kept in water bath to the polyploid nature of sugarcane and the absence of a
segregation analysis (Gillet, 1991). Hence, each allele was scored in a dominant manner and transformed into either a 0 (absent) or 1 (present) matrix. Although SSRs are classified as co-dominant type markers, they have been treated as dominant markers in this study.
Genetic diversity analysis
The software program Genalex 6.5 (Peakall and Smouse, 2006, 2012) was used to calculate parameters such as: genetic distance, number of different alleles (NA), number of effective alleles (NE), Shannon’s information index, Analysis of Molecular Variance, etc. Genetic associations were determined with Darwin V. 5.0 software (Perrier et al., 2003) using neighbour-joining coefficient. Popgene program (Yeh et al., 1999) was also used to determine genetic
Assessment of quality and quantity of extracted DNA samples diversity, polymorphic loci, gene flow and F-values. Finally, the basic statistics such as polymorphic information content (PIC) and gene diversity were estimated using PowerMarker v. 3.25 (Liu and Muse, 2005).
RESULTS AND DISCUSSION
Allelic diversity
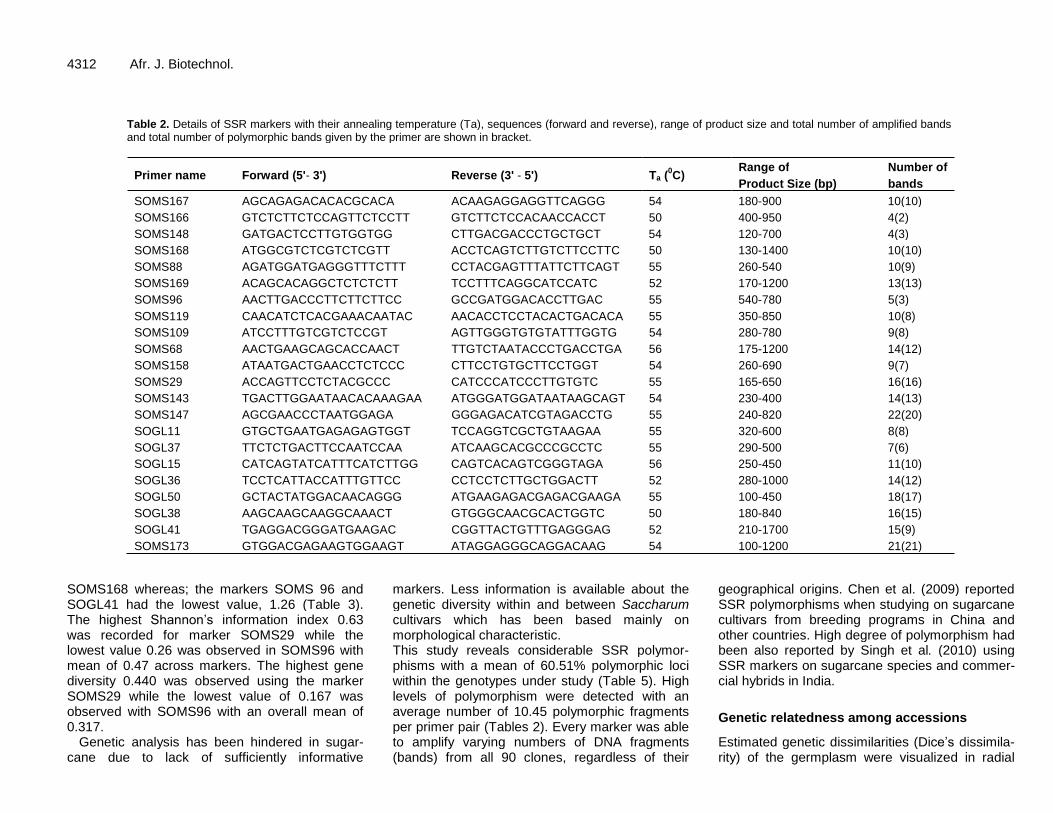
The genotyping of a total of 90 introduced sugarcane varieties, 81 of them from fourteen countries around the world and the remaining 9 from unknown sources (Table 1) with 22 SSR markers were allowed to identify a total of 260 alleles (Table 2). However, variations in the total number of fragments and the number of polymorphic fragments were evident. The data for microsatellite loci diversity are summarized in Table 3. Out of the total of 260 alleles amplified, 230 were polymorphic with a mean of 10.45 alleles per SSR locus (Table 2).
The highest level of polymorphism was detected in SOMS173 (100%) followed by SOMS167 (98.89%), SOMS169 (98.89%), and SOMS29 (97.78%). The range in allele number was 4–22, with the marker SOMS147 having the highest number of alleles (22), followed by SOMS173, SOGL50, SOMS29 and SOGL38 with 21, 17, 16 and 15 alleles, respectively (Table 2). Fragments size ranged from 100 (SOGL50 and SOMS173) to 1700 bp (SOGL41) in length. The polymorphism information content (PIC) calculated as a relative measure of informativeness for each of the markers ranged from 0.231 for the markers SOGL41 to 0.375 for the marker SOMS166 with an average of 0.303. Number of different alleles was in the range of 1.09 in SOMS166 to 2.0 in SOMS173 with overall mean of 1.75. Measure of effective number of alleles on average was 1.55 across all the 22 markers evaluated. The markers with the highest levels of effective number of alleles (1.71-1.82) were SOMS29, SOMS167, SOGL11 and
4312 Afr. J. Biotechnol.
Table 2. Details of SSR markers with their annealing temperature (Ta), sequences (forward and reverse), range of product size and total number of amplified bands and total number of polymorphic bands given by the primer are shown in bracket.
Primer name Forward (5'- 3') Reverse (3' - 5') Ta (0C)
Range of Product Size (bp)
Number of bands
SOMS167 AGCAGAGACACACGCACA ACAAGAGGAGGTTCAGGG 54 180-900 10(10) SOMS166 GTCTCTTCTCCAGTTCTCCTT GTCTTCTCCACAACCACCT 50 400-950 4(2) SOMS148 GATGACTCCTTGTGGTGG CTTGACGACCCTGCTGCT 54 120-700 4(3) SOMS168 ATGGCGTCTCGTCTCGTT ACCTCAGTCTTGTCTTCCTTC 50 130-1400 10(10) SOMS88 AGATGGATGAGGGTTTCTTT CCTACGAGTTTATTCTTCAGT 55 260-540 10(9) SOMS169 ACAGCACAGGCTCTCTCTT TCCTTTCAGGCATCCATC 52 170-1200 13(13) SOMS96 AACTTGACCCTTCTTCTTCC GCCGATGGACACCTTGAC 55 540-780 5(3) SOMS119 CAACATCTCACGAAACAATAC AACACCTCCTACACTGACACA 55 350-850 10(8) SOMS109 ATCCTTTGTCGTCTCCGT AGTTGGGTGTGTATTTGGTG 54 280-780 9(8) SOMS68 AACTGAAGCAGCACCAACT TTGTCTAATACCCTGACCTGA 56 175-1200 14(12) SOMS158 ATAATGACTGAACCTCTCCC CTTCCTGTGCTTCCTGGT 54 260-690 9(7) SOMS29 ACCAGTTCCTCTACGCCC CATCCCATCCCTTGTGTC 55 165-650 16(16) SOMS143 TGACTTGGAATAACACAAAGAA ATGGGATGGATAATAAGCAGT 54 230-400 14(13) SOMS147 AGCGAACCCTAATGGAGA GGGAGACATCGTAGACCTG 55 240-820 22(20) SOGL11 GTGCTGAATGAGAGAGTGGT TCCAGGTCGCTGTAAGAA 55 320-600 8(8) SOGL37 TTCTCTGACTTCCAATCCAA ATCAAGCACGCCCGCCTC 55 290-500 7(6) SOGL15 CATCAGTATCATTTCATCTTGG CAGTCACAGTCGGGTAGA 56 250-450 11(10) SOGL36 TCCTCATTACCATTTGTTCC CCTCCTCTTGCTGGACTT 52 280-1000 14(12) SOGL50 GCTACTATGGACAACAGGG ATGAAGAGACGAGACGAAGA 55 100-450 18(17) SOGL38 AAGCAAGCAAGGCAAACT GTGGGCAACGCACTGGTC 50 180-840 16(15) SOGL41 TGAGGACGGGATGAAGAC CGGTTACTGTTTGAGGGAG 52 210-1700 15(9) SOMS173 GTGGACGAGAAGTGGAAGT ATAGGAGGGCAGGACAAG 54 100-1200 21(21)
observed with SOMS96 with an overall mean of 0.317.
SOMS29 while the lowest value of 0.167 was levels of polymorphism were detected with an average number of 10.45 polymorphic fragments per primer pair (Tables 2). Every marker was able
SOMS168 whereas; the markers SOMS 96 and markers. Less information is available about the geographical origins. Chen et al. (2009) reported SOGL41 had the lowest value, 1.26 (Table 3). genetic diversity within and between Saccharum SSR polymorphisms when studying on sugarcane The highest Shannon’s information index 0.63 cultivars which has been based mainly on cultivars from breeding programs in China and was recorded for marker SOMS29 while the morphological characteristic. other countries. High degree of polymorphism had lowest value 0.26 was observed in SOMS96 with This study reveals considerable SSR polymor- been also reported by Singh et al. (2010) using mean of 0.47 across markers. The highest gene phisms with a mean of 60.51% polymorphic loci SSR markers on sugarcane species and commer- diversity 0.440 was observed using the marker within the genotypes under study (Table 5). High cial hybrids in India.
Genetic relatedness among accessions
Genetic analysis has been hindered in sugar- to amplify varying numbers of DNA fragments Estimated genetic dissimilarities (Dice’s dissimila- cane due to lack of sufficiently informative (bands) from all 90 clones, regardless of their rity) of the germplasm were visualized in radial

Tena et al. 4313
Table 3. Number of different alleles (Na), number of effective alleles (Ne), Shannon index (I), gene diversity and PIC of the 22 SSR markers used in the study.
Locus Sample size Na Ne I Gene diversity PIC SOMS167 90 1.98 1.77 0.60 0.418 0.334 SOMS166 90 1.09 1.35 0.27 0.188 0.375 SOMS168 90 1.98 1.71 0.59 0.406 0.257 SOGL37 90 1.73 1.60 0.48 0.330 0.348 SOGL15 90 1.89 1.58 0.51 0.340 0.307 SOGL36 90 1.69 1.46 0.42 0.274 0.324 SOGL50 90 1.86 1.67 0.55 0.380 0.307 SOMS88 90 1.87 1.69 0.54 0.373 0.296 SOMS169 90 1.98 1.56 0.50 0.332 0.327 SOMS96 90 1.10 1.26 0.26 0.167 0.241 SOMS119 90 1.78 1.42 0.40 0.260 0.337 SOMS109 90 1.71 1.37 0.37 0.236 0.281 SOMS68 90 1.69 1.48 0.43 0.282 0.329 SOMS158 90 1.53 1.56 0.46 0.318 0.261 SOGL38 90 1.91 1.63 0.54 0.362 0.296 SOGL41 90 1.27 1.26 0.28 0.175 0.231 SOMS29 90 1.96 1.82 0.63 0.440 0.317 SOMS143 90 1.84 1.35 0.38 0.237 0.220 SOMS147 90 1.78 1.68 0.54 0.372 0.331 SOMS148 90 1.81 1.64 0.51 0.354 0.338 SOMS173 90 2.00 1.53 0.45 0.299 0.346 SOGL11 90 1.97 1.77 0.60 0.421 0.272 Mean 90 1.75 1.55 0.47 0.317 0.303
diagram (Figure 1). Analysis of the SSR data using Dice’s pattern at the lower level of hierarchies after the dissimilarity indices showed that pair wise genetic differentiation of the major clusters showed sub-grouping dissimilarity (GD) values ranged from 6.1 (between of the clones into 11 major groups. Starting from the PR1007 and Ebene 1/37) to 73.5% (between CB41-76 bottom and moving clockwise in the dendrogram and H38/4443) with a mean of 38.74% (data not shown). (Figure1) depicting groups with different colours, group I In the dendrogram, clones CB41-76 and H38/4443 are in comprised 19 clones almost from every source country different clusters, diverse from each other and easily except India for Bihar Orissa (BO) varieties, Louisiana, distinguishable among the genotypes tested (Figure 1). A Mauritius and Demerra X Barbados crosses from high degree of dissimilarity was also found between Barbados. Group II included clones N50/93, L60-14 and CB41-76 and CP52/68 (72.3%), CB41-76 and CO740 PR980 from South Africa (Natal), Louisiana and Puerto (71.3%) and CB41-76 and F134 (71.2%). This relation- Rico respectively. ship clearly shows that these genotypes were geogra- Group III contained clones H48/4605 from USA (Hawai) phically diverse and evolved independently. Genetic and C120-78 from Cuba. Group IV had two clones from dissimilarity values ranging from 17-48% was reported by Lousiana namely L60-25 and L60-35 and one clone Selvi et al. (2005) using RFLP markers in tropical and E188/53 from unknown source. Group V had 41 clones subtropical Indian sugarcane cultivars. Chen et al. (2009) from every source country except Cuba, Hawaii, Demerra reported 56 to 91.6% similarity among sugarcane and Formosa (Taiwan). Group VI consisted of four clones cultivars of different geographic origins with SSR mar- from Hawaii, India (Coimbatore), Formosa (Taiwan) and kers. Genetic similarity coefficient ranging from 5.6 to Barbados each contributing one clone. Group VII had two 77.8% has been reported by Singh et al. (2010) using clones BO3 and M53/263 from Bihar Orissa (India) and SSR in a collection of sugarcane species and commercial Mauritius respectively. The next group (VIII) also had two hybrids in India. varieties C105-73 and CO331 from Cuba and India
Both neighbour joining and PCoA plot based on pair- (Coimbatore) respectively. Group IX had four clones wise genetic distances (Figures 1 and 2) assigned clones CB38-22, D42/58, DB386/60 and E188/56 from Campos into three clear distinct clusters. Moreover, the clustering Brazil, Demerra, crosses from Demerra and Barbados

4314 Afr. J. Biotechnol.
genotypes were geographically diverse and evolved evolutionary history.
and unknown source. Group X consisted of two clones joined different clusters. Accordingly, COS443 found H49/5 (Hawaii) and D141/46 (Demerra). The last group close to Puerto Rico variety PR1000 joined group I. XI contained two clones NCD349 and L60-40 from E188/53 joined group IV with Louisiana varieties L60-25 Barbados and Louisiana respectively. and L60-35. Pindar, COS109, Ebene1/37, COS443 and
Located between the different groups, seven clones COS510 clustered with accessions in group V. E188/56 namely CO957, CP36/105, WDII, H49/3533, COK30, joined group IX. The placement of these genotypes in the E88/56 and CO513 did not cluster with any group. This respective clusters might indicate their close similarityy relationship might be due to the reason that these with the accessions with which they cluster in theiir
independently. Out of these seven clones COK30 and Generally the results of the dendrogram and the PCoA E88/56 are clones whose countries of origin were analysis showed that regardless of their origin sugarcane unknown. The other eight clones with unknown sources cultivars from different source countries tend to cluster
Figure 1. Unrooted UPGMA tree, calculated from SSR data (260 Loci), assembling 90 genotypes which were sugarcane species clones introduced into Ethiopia from different source countries around the world.

indicating the possibility of existence of shared alleles
source countries and unknown sources around the world.
were often in different clusters (Figures 1 and 2) country of sources
Figure 2. PCoA graph of 90 sugarcane accessions introduced into Ethiopia from 14
detected. Further differentiation into recognized clones among Indian varieties (Table 5).
Tena et al. 4315
i i
i
13.69, and 11.47%, respectively. resultt may reflect the high degree of variation among
together and likewise accessions from the same country Genetic diversity within and among accessions of
among the genotypes. Thus the present clustering All off the microsatellite markers used in this study had pattern of clones also disclosed the possibility of close highest number of polymorphic loci (Table 2). The similarity between their evolutionary courses. No proportions of polymorphic loci were high (86.54%) in evidence was found for all genotypes with one geogra- accessions from India followed by 78.08 and 77.31% of phical location to be single cluster in the clustering the accessions from Barbados and Hawaii respectivelyy pattern of genetic diversity, thereby underscoring the (Table 5). Within populations number of different alleles importance of human-mediated gene flow in addition to was in the range of 0.523 in Cuba genotypes to 1.796 n artificial selection. the Indian accessiions with a mean of 1.369. The average
number of effective alleles per locus within the genotypes of the different countries of origin ranged from 1.144 n
Principal coordinate analysis the genotypes of Cuba to 1.489 in those of Canal Point with a mean of 1.365 over loci and populationss.
The principal coordinate analysis (PCoA) allowed the Shannon’s information index was highest (0.438) in separation of the genotypes into three gene pool groups Indian accessions followed by 0.411 in those of Canal regardless of the geographical area where the clones Point with over all mean of 0.321 (Table 5). Gene were introduced (Figure 2). Substantial diversity was diversity was highest (0.290) in accessions of India while found in the genotypes in the PCoA analysis and this was the lowest (0.084) was recorded in those of Cuba with distributed both within and between gene pools. Similar mean of 0.214 across populations (Table 5 and Figure 3)). to results of cluster analysis, accessions were seen Generally, within populations, higher number of different clustering randomly regardless of country of origin alleles, higher number of effective alleles, high Shannon
Results of the PCoA were in agreement with that of the information index, higher level of gene diversity and the neighbour-joining dendrogram, with three major clusters highest percentage of polymorphic loci were observed
belonging to each cluster was also observed as in the AMOVA results showed that 97% of allelic diversityy dendrogram. The overall variation explained by the PCoA was attributed to individuals within population while only was 74.96% with dimensions 1, 2 and 3 explaining 49.8, 3% was distributed among populations (Table 4). This

4315 Afr. J. Biotechnol.
Figure 3. Band patterns across populations. No. LComm Bands<=25%)= No. of Locally Common Bands (Freq.>=5%) Found in 25% or Fewer Populations; No LComm Bands (<=50%)= No. of Locally Common Bands (Freq.>=5%) Found in 50% or Fewer Populations.
Table 4. Analysis of molecular variance (AMOVA) for 90 individual exotic sugarcane clones from different source countries based on the analysis of 260 SSR fragments generated using 22 primer pairs.
Source of variation df Sum of squares Variance components % of total variation Among Populations 14 677.875 1.204 3 Within Populations 75 3102.880 41.372 97 Total 89 3780.756 42.576 100
Significance of comparisons; Hawaii vs Canal point, Hawaii vs Demerara X Barbados and Hawaii vs India P<0.01; Cuba vs Canal point, Demerara X Barbados vs Barbados, Demerara X Barbados vs Brazil, India vs Cuba, Louisiana vs Demerara X Barbados, Mauritius vs Demerara X Barbados, Mauritius vs Hawaii and Formosa (Taiwan) vs Demerara X Barbados P=0.05.
Table 5. SSR diversity for 22 microsatellite loci in 15 populations (genotypes from 15 respective source countries) of introduced sugarcane clones in Ethiopia.
Population Na Ne I GD P% Barbados 1.662 1.411 0.377 0.247 78.08 Brazil 1.481 1.402 0.361 0.239 70.00 Canal Point 1.627 1.489 0.411 0.279 74.23 Cuba 0.523 1.144 0.123 0.084 20.38 Demerara X Barbados 1.477 1.368 0.322 0.215 61.15 Demerara, (Guyana) 1.100 1.319 0.272 0.184 47.69 Hawaii 1.627 1.359 0.345 0.222 77.31 India 1.796 1.486 0.438 0.290 86.54 Louisiana 1.331 1.330 0.295 0.195 57.69 Mauritius 1.181 1.288 0.243 0.165 42.31 Mexico 1.062 1.280 0.240 0.164 39.62 Puerto Rico 1.619 1.481 0.409 0.276 74.62 South Africa 1.477 1.410 0.354 0.238 65.00 Formosa, (Taiwan) 0.935 1.261 0.223 0.153 36.92 Unknown 1.642 1.452 0.396 0.264 76.15 Mean 1.369 1.365 0.321 0.214 60.51 SE 0.013 0.006 0.005 0.015 4.94
Na =number of different alleles; Ne=effective number of alleles; I=Shannon index; GD= genetic diversity according to Nei (1978) and %P=percentage of polymorphic loci No. LComm Bands (<=25%) = No. of Locally Common Bands (Freq. >= 5%) Found in 25% or Fewer Populations; No. LComm Bands (<=50%) = No. of Locally Common Bands (Freq. >= 5%) Found in 50% or Fewer Populations.
0.100 0.150 0.200 0.250
100 150 200 250 0.300 300 0.350
Gene diversity
Number
Populations
No. Bands
No. Bands Freq. >= 5%
No. Private Bands 50 0.050 No. LComm Bands (<=25%)
0 0.000 No. LComm Bands (<=50%)
Gene diversity

Tena et al. 4317
Table 6. Unbiased Nei’s genetic distance (below diagonal) and genetic identity (above diagonal) among and between populations (genotypes from respective source countries), numbers representing populations here correspond to population numbers in Table 5.
Population 1 2 3 4 5 6 7 8 9 10 11 12 13 14 15 1 *** 0.981 0.953 0.939 0.887 0.978 0.978 0.977 0.965 0.862 0.937 0.971 0.974 0.950 0.962 2 0.020 *** 0.956 0.950 0.887 0.973 0.984 0.973 0.955 0.871 0.932 0.966 0.962 0.969 0.961 3 0.048 0.045 *** 0.856 0.958 0.947 0.932 0.977 0.946 0.935 0.939 0.982 0.982 0.920 0.978 4 0.063 0.051 0.155 *** 0.778 0.945 0.967 0.901 0.903 0.756 0.869 0.902 0.892 0.904 0.904 5 0.120 0.120 0.043 0.251 *** 0.896 0.856 0.939 0.890 0.891 0.889 0.932 0.931 0.867 0.926 6 0.022 0.027 0.055 0.057 0.109 *** 0.988 0.968 0.964 0.873 0.927 0.979 0.965 0.940 0.980 7 0.022 0.016 0.071 0.034 0.155 0.012 *** 0.956 0.952 0.838 0.914 0.973 0.955 0.939 0.968 8 0.023 0.027 0.023 0.105 0.062 0.033 0.045 *** 0.967 0.909 0.938 0.973 0.972 0.956 0.967 9 0.036 0.046 0.056 0.103 0.116 0.036 0.049 0.033 *** 0.882 0.926 0.967 0.976 0.950 0.966
10 0.149 0.139 0.068 0.279 0.115 0.136 0.177 0.095 0.126 *** 0.895 0.910 0.909 0.853 0.900 11 0.065 0.070 0.063 0.140 0.117 0.076 0.090 0.064 0.077 0.111 *** 0.932 0.942 0.942 0.926 12 0.030 0.034 0.018 0.103 0.071 0.021 0.027 0.027 0.033 0.094 0.071 *** 0.982 0.934 0.992 13 0.027 0.039 0.019 0.114 0.071 0.036 0.046 0.028 0.024 0.096 0.060 0.018 *** 0.934 0.975 14 0.052 0.032 0.083 0.101 0.143 0.062 0.063 0.045 0.051 0.159 0.060 0.068 0.068 *** 0.924 15 0.039 0.040 0.022 0.100 0.077 0.020 0.032 0.033 0.035 0.105 0.077 0.008 0.025 0.079 ***
molecular variation of 3.4% between populations and 96.6% within populations.
Among accessions of different source countries highly significant variation for molecular diversity
among them. This was supported by the results of the dendrogram in which identities of cultivars with
suggests that some genetically similar cultivars may be present in the different countries. In the dendrogram, it was also observed that accessions of countries with high molecular variation mostly
accessions of countries revealed FST values ranging from 0.0024 (between Demerara
sugarcane clones. Neil et al. (2009) studying on respect to country of sources did not contribute to (Guyana) and South Africa) to 0.5134 (between genetic diversity among main land USA sugar- the clustering pattern because individual clusters Cuba and India), which was a very large cane cultivars by SSR genotyping also reported include cultivars form different countries. This differentiation with an overall average of 0.059
(Table 7). High differentiation (FST=0.4113, p<0.05) was also observed between Barbados and Cuba and Canal Point and Cuba (FST=0.4112, p<0.05). Moderate gene differentiation among
(P<0.01) was observed between populations of didn’t cluster together. Future breeding efforts many pairs of populations was also evident (Table Hawaii vs Canal point, Hawaii vs Demerara X involving crosses between accessions of 7). The average gene flow (Nm) among Barbados and Hawaii vs India while the variation countries with high molecular variation may populations was 1.7213. Nei’s unbiased genetic was significant (P<0.05) between Cuba vs Canal provide beneficial genes and alleles in new distance ranged from 0.018 (between accessions point, Demerara X Barbados vs Barbados, sugarcane varieties while maintaining genetic of Puerto Rico and South Africa) to 0.279 Demerara X Barbados vs Brazil, India vs Cuba, diversity. (between accessions of Cuba and Mauritius) Louisiana vs Demerara X Barbados, Mauritius vs (Table 6) with an overall average of 0.053. Demerara X Barbados, Mauritius vs Hawaii and Genetic identity values were in the range of 0.756 Formosa (Taiwan) vs Demerara X Barbados. The Population differentiation to 0.992 with overall average of 0.950 (Table 6). molecular variation was not significant between From these results, we can therefore say that a other pairs of populations denoting shared alleles Analysis of genetic differentiation among the high percentage of genetic diversity is distributed
among populations. This can give a clue that some exotic genotypes have their unique genetic

4318 Afr. J. Biotechnol.
Table 7. Pair‐wise FST values of the 15 populations (genotypes from respective source countries) of introduced sugarcane clones in Ethiopia, numbers representing populations here correspond to population numbers in Table 5.
Population 1 2 3 4 5 6 7 8 9 10 11 12 13 14 15 1 0.0000 2 0.0128 0.0000 3 0.0567 0.0526 0.0000 4 0.4113 0.2523 0.4112 0.0000 5 0.0988 0.0911 0.0160 0.3911 0.0000 6 0.0716 -0.0047 0.0860 0.1104 0.0912 0.0000 7 0.0136 -0.0041 0.1133 0.3408 0.1658 0.0218 0.0000 8 0.0244 0.0508 0.0213 0.5134 0.0556 0.1537 0.0851 0.0000 9 0.0439 0.0341 0.0872 0.2586 0.1013 0.0031 0.0570 0.0858 0.0000
10 0.1701 0.0977 0.0467 0.3469 0.0869 0.0462 0.1821 0.1686 0.0890 0.0000 11 0.1043 0.0235 0.0490 0.1237 0.0414 -0.0732 0.1013 0.1934 0.0245 -0.0296 0.0000 12 0.0137 0.0175 -0.0192 0.3407 0.0245 0.0424 0.0391 -0.0032 0.0217 0.0480 0.0498 0.0000 13 0.0277 0.0112 -0.0062 0.2991 0.0088 0.0024 0.0527 0.0330 0.0143 0.0448 0.0133 -0.0274 0.0000 14 0.1090 0.0102 0.1312 0.0231 0.1092 -0.0617 0.0871 0.2095 -0.0044 0.0732 -0.0689 0.0827 0.0381 0.0000 15 0.0288 0.0308 0.0147 0.4076 0.0603 0.0560 0.0490 0.0286 0.0484 0.1058 0.0971 -0.0192 0.0124 0.1327 0.0000
constitution apart from each other which can be exploited for improvement of the crop in the future sugarcane breeding program of the country.
Conclusion
The present genetic analysis based on the segre- gation at SSR loci provides genetic information on the introduced sugarcane genotypes in the country. The genetic relationship information of the cultivars will help sugarcane breeders to select the appropriate parents in their breeding programs to maximize yield as well as to maintain genetic diversity.
ACKNOWLEDGEMENT
The authors are grateful to the financial grant of
the Sugar Corporation of Ethiopia. Sugarcane Breeding Institute, Tamil Nadu State, Coinbatore, India is duly acknowledged for hosting the laboratory work.
Conflict of Interest
The author(s) have not declared any conflict of interest.
REFERENCES
Anonymous (1998). Sugar and Sweetener. FAO Production Year Book.
Chen PH, Pan YB, Chen RK, Xu LP, Chen YQ (2009). SSR marker- based analysis of genetic relatedness among sugarcane cultivars (Saccharum spp. Hybrids) from breeding programs in China and other countries. Sugar Tech. 11(4):347-354.
Cruz CD (2001). GENES Program: windows version; computational application in genetics and statistics.
Lush: UFV. 648 p. Esayas T, Firew M, Amsalu A (2012). Collection,
characterization, genetic diversity analysis and association of traits for yield and yield components of sugarcane (Saccharum spp.) in Ethiopia. PhD study progress report, Wonji, Ethiopia.
Gillet EM (1991). Genetic analysis of nuclear DNA restriction patterns. Genome 34:69-703.
Giovanni M, Cordeiro AL,Yong-Bao, Pan BL, Robert JH (2003). Sugarcane microsatellites for the assessment of genetic diversity in sugarcane germplasm. Plant Sci. 165:181-189.
Liu K, Muse SV (2005). Power marker: integrated analysis environment for genetic marker data. Bioinformatics 21(9):2128-2129.
Muhammad K, Farooq AK (2007). Divergence in sugarcane (Saccharaum Officinarum L.) based on yield and quality traits. Pak. J. Bot. 39(5): 1559-1563.
Nei M (1978). Estimation of average heterozygosity and genetic distance from a small number of individuals. Genetics 89:583–590
Neil CG, Kay M, Jack CC (2009). Diversity among mainland USA sugarcane cultivars examined by SSR genotyping. J. Am. Soc. Sugar Technol. 29:36-52.
Peakall R, Smouse PE (2006). GENALEX 6: genetic analysis

relationship among the tropical and subtropical Indian sugarcane cultivars revealed by AFLP. Crop Sci. 45:1750-1757.
Singh RK, Sushil KM, Sujeet PS, Neha M, Sharma ML (2010). Evaluation of microsatellite markers for genetic diversity analysis among sugarcane species and commercial hybrids. Aust. J. Crop Sci. 4(2):115-124.
Tena et al. 4319
in Excel. Population genetic software for teaching and research. Mol. Swarup K, Parida S, Kalia K, Sunita K, Vivek D, Hemaprabha G, Selvi Ecol. Notes 6:288-295. A, Pandit A, Singh A, Gaikwad K, Sharma TR, Srivastava PS, Singh
Peakall R, Smouse PE (2012). GenAlEx 6.5: genetic analysis in Excel. NK, Mohapatra T (2009). Informative genomic microsatellite markers Population genetic software for teaching and research - an update. for efficient genotyping applications in sugarcane. Theor. Appl. Bioinformatics 28(19):2537-2539. Genet. 118:327-338.
Perrier X, Flori A, Bonnot F (2003). Data analysis methods. In: P. Walbot V (1988). Preparation of DNA from single rice seedlings. Rice Hamon, M. Seguin, X. Perrier and J.C. Glaszmann (eds.). Genetic Genet. News. 15:149-151. diversity of cultivated tropical plants. Enfield,Science Publishers. Yeh FC, Yang RC, Boyle T (1999). POPGENE,Version 1.31: a Montpellier. pp 43-76. Microsoft Windows-Based Freeware for Population Genetic Analysis
Selvi A, Nair NV, Noyer JL, Singh NK, Balasundaram N, Bansal KC, Release. Department of Renewable Resources, University of Alberta, Koundal KR, Mohapatra T (2005). Genomic constitution and genetic Edmonton, Canada.
Copyright © 2022 FDOKUMEN