Analysis of Electromagnetic Pollution Produced by Line Frequency Coreless Induction Furnaces
11
Analysis of Electromagnetic Pollution Produced by Line Frequency Coreless Induction Furnaces ANGELA IAGĂR GABRIEL NICOLAE POPA IOAN ŞORA Department of Electrotechnical Engineering and Industrial Informatics Politechnica University Timişoara Revoluţiei Street, no 5, Hunedoara, 331128 ROMANIA [email protected] http://www.fih.upt.ro Abstract: - This paper presents the electromagnetic pollution produced by the line frequency coreless induction furnaces in the power supply network. We analyzed a furnace with 12.5 t capacity of cast-iron. The measurements have been made in the secondary of the furnace transformer, using the CA8334 three-phase power quality analyser. Experimental results emphasized the presence of harmonics and interharmonics in the phase voltages and harmonics in the currents absorbed from the network. The operation of analyzed furnace also produces unbalance. Further to the harmonic analysis of the signals measured in the furnace installation, we have been proposed some optimization methods for its operation, in such way to comply with the European norms of Electromagnetic Compatibility (EMC). Key-Words: Harmonics, Unbalance, Power quality measurement, Induction furnace 1 Introduction In induction melting is noticed mainly the efficiency, high heating rate and the reduced oxidation level of the processed material, the improved work conditions and the possibility of an accurate control of the technological processes [1]. Induction heating equipments do not introduce dust and noise emissions in operation, but cause power quality problems in the electric power system [1-3]. The most important parameters which affect power quality are harmonics, voltage instability and reactive power burden [4-10]. Induction-melt furnaces supplies by medium- frequency converters generate fixed and variable frequency harmonics [2,4,5]. Both current and voltage-fed inverters generate harmonics back into power lines in the process of rectifying AC to DC. Harmonics flowing in the network causing additional losses and decreasing the equipments lifetime. Also, the harmonics can interfere with control, communication or protection equipments [4-6]. In addition to the harmonics that are normally expected from different pulse rectifiers, large furnaces operating at a few hundred hertz can generate interharmonics. Interharmonics can overload power system capacitors, introduce noise into transformers, cause lights to flicker, instigate UPS alarms, and trip adjustable-speed drives [2,4,6]. High-frequency systems, which operate at greater than 3 kHz are relatively small and limited to special applications. Electromagnetic pollution produced by the operation of these equipments is small. The induction furnaces supplied at line frequency (50 Hz) are of high capacity and represent great power consumers. The operation of these furnaces also produces important disturbances in the power supply network. Being single-phase loads, these furnaces introduce unbalances that lead to the increasing of power and active energy losses in the network [1,3,11]. In case of channel furnaces it was found also the presence of harmonics in the current absorbed from the power supply network. These harmonics can be determined by the non-sinusoidal supply voltages or the load’s nonlinearity, owed to the saturation of the magnetic circuit [3,12]. Because the specialty literature does not offer detailed information regarding the harmonic distortion in the case of line frequency coreless induction furnaces, we proposed ourselves to analyze the electromagnetic pollution introduced by the operation of these furnaces. On the other side, it must kept in view also the fact that in Romania are still operating line frequency coreless induction furnaces, and the cumulated effect of the electromagnetic pollution generated by these could be important. WSEAS TRANSACTIONS on SYSTEMS Angela Iagar, Gabriel Nicolae Popa, Ioan Sora ISSN: 1109-2777 1 Issue 1, Volume 8, January 2009
-
Upload
independent -
Category
Documents
-
view
2 -
download
0
Transcript of Analysis of Electromagnetic Pollution Produced by Line Frequency Coreless Induction Furnaces
Analysis of Electromagnetic Pollution Produced by Line Frequency Coreless Induction Furnaces
ANGELA IAGĂR GABRIEL NICOLAE POPA IOAN ŞORA
Department of Electrotechnical Engineering and Industrial Informatics Politechnica University Timişoara
Revoluţiei Street, no 5, Hunedoara, 331128 ROMANIA
[email protected] http://www.fih.upt.ro
Abstract: - This paper presents the electromagnetic pollution produced by the line frequency coreless induction furnaces in the power supply network. We analyzed a furnace with 12.5 t capacity of cast-iron. The measurements have been made in the secondary of the furnace transformer, using the CA8334 three-phase power quality analyser. Experimental results emphasized the presence of harmonics and interharmonics in the phase voltages and harmonics in the currents absorbed from the network. The operation of analyzed furnace also produces unbalance. Further to the harmonic analysis of the signals measured in the furnace installation, we have been proposed some optimization methods for its operation, in such way to comply with the European norms of Electromagnetic Compatibility (EMC). Key-Words: Harmonics, Unbalance, Power quality measurement, Induction furnace 1 Introduction In induction melting is noticed mainly the efficiency, high heating rate and the reduced oxidation level of the processed material, the improved work conditions and the possibility of an accurate control of the technological processes [1]. Induction heating equipments do not introduce dust and noise emissions in operation, but cause power quality problems in the electric power system [1-3]. The most important parameters which affect power quality are harmonics, voltage instability and reactive power burden [4-10]. Induction-melt furnaces supplies by medium-frequency converters generate fixed and variable frequency harmonics [2,4,5]. Both current and voltage-fed inverters generate harmonics back into power lines in the process of rectifying AC to DC. Harmonics flowing in the network causing additional losses and decreasing the equipments lifetime. Also, the harmonics can interfere with control, communication or protection equipments [4-6]. In addition to the harmonics that are normally expected from different pulse rectifiers, large furnaces operating at a few hundred hertz can generate interharmonics. Interharmonics can overload power system capacitors, introduce noise into transformers, cause lights to flicker, instigate UPS alarms, and trip adjustable-speed drives [2,4,6].
High-frequency systems, which operate at greater than 3 kHz are relatively small and limited to special applications. Electromagnetic pollution produced by the operation of these equipments is small. The induction furnaces supplied at line frequency (50 Hz) are of high capacity and represent great power consumers. The operation of these furnaces also produces important disturbances in the power supply network. Being single-phase loads, these furnaces introduce unbalances that lead to the increasing of power and active energy losses in the network [1,3,11]. In case of channel furnaces it was found also the presence of harmonics in the current absorbed from the power supply network. These harmonics can be determined by the non-sinusoidal supply voltages or the load’s nonlinearity, owed to the saturation of the magnetic circuit [3,12]. Because the specialty literature does not offer detailed information regarding the harmonic distortion in the case of line frequency coreless induction furnaces, we proposed ourselves to analyze the electromagnetic pollution introduced by the operation of these furnaces. On the other side, it must kept in view also the fact that in Romania are still operating line frequency coreless induction furnaces, and the cumulated effect of the electromagnetic pollution generated by these could be important.
WSEAS TRANSACTIONS on SYSTEMS Angela Iagar, Gabriel Nicolae Popa, Ioan Sora
ISSN: 1109-2777 1 Issue 1, Volume 8, January 2009
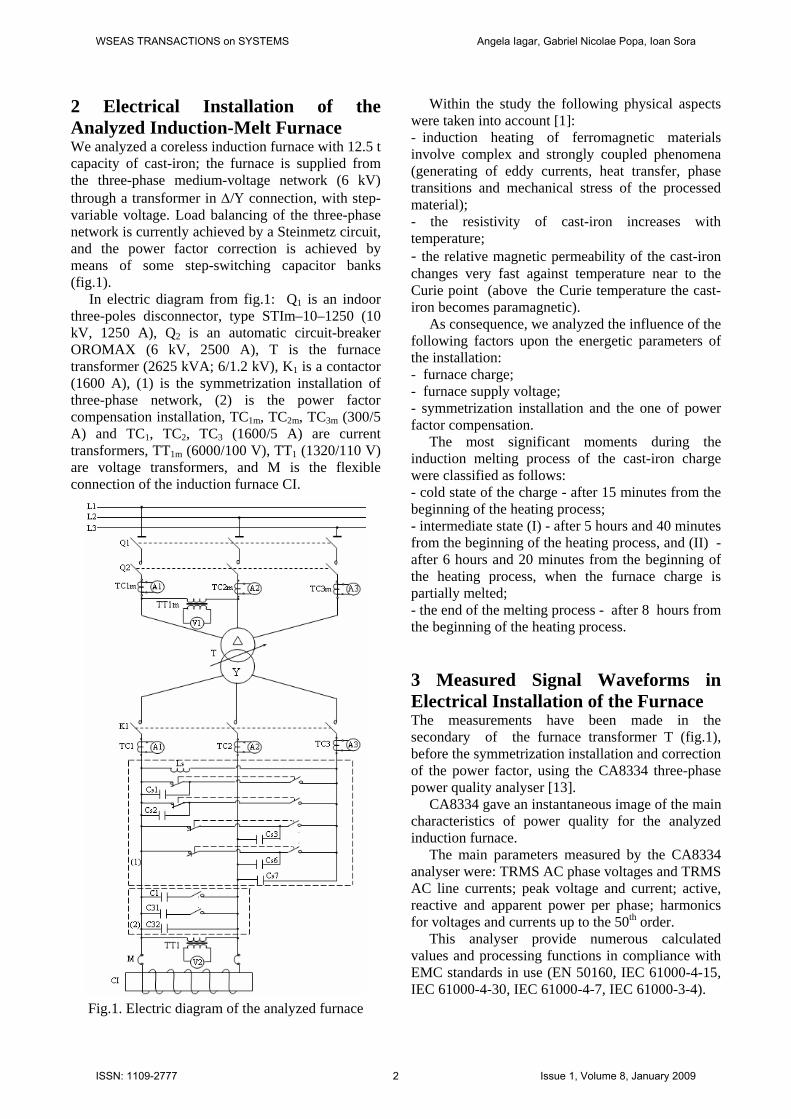
2 Electrical Installation of the Analyzed Induction-Melt Furnace We analyzed a coreless induction furnace with 12.5 t capacity of cast-iron; the furnace is supplied from the three-phase medium-voltage network (6 kV) through a transformer in Δ/Υ connection, with step-variable voltage. Load balancing of the three-phase network is currently achieved by a Steinmetz circuit, and the power factor correction is achieved by means of some step-switching capacitor banks (fig.1). In electric diagram from fig.1: Q1 is an indoor three-poles disconnector, type STIm–10–1250 (10 kV, 1250 A), Q2 is an automatic circuit-breaker OROMAX (6 kV, 2500 A), T is the furnace transformer (2625 kVA; 6/1.2 kV), K1 is a contactor (1600 A), (1) is the symmetrization installation of three-phase network, (2) is the power factor compensation installation, TC1m, TC2m, TC3m (300/5 A) and TC1, TC2, TC3 (1600/5 A) are current transformers, TT1m (6000/100 V), TT1 (1320/110 V) are voltage transformers, and M is the flexible connection of the induction furnace CI.
Fig.1. Electric diagram of the analyzed furnace
Within the study the following physical aspects were taken into account [1]: - induction heating of ferromagnetic materials involve complex and strongly coupled phenomena (generating of eddy currents, heat transfer, phase transitions and mechanical stress of the processed material); - the resistivity of cast-iron increases with temperature; - the relative magnetic permeability of the cast-iron changes very fast against temperature near to the Curie point (above the Curie temperature the cast-iron becomes paramagnetic). As consequence, we analyzed the influence of the following factors upon the energetic parameters of the installation: - furnace charge; - furnace supply voltage; - symmetrization installation and the one of power factor compensation. The most significant moments during the induction melting process of the cast-iron charge were classified as follows: - cold state of the charge - after 15 minutes from the beginning of the heating process; - intermediate state (I) - after 5 hours and 40 minutes from the beginning of the heating process, and (II) - after 6 hours and 20 minutes from the beginning of the heating process, when the furnace charge is partially melted; - the end of the melting process - after 8 hours from the beginning of the heating process.
3 Measured Signal Waveforms in Electrical Installation of the Furnace The measurements have been made in the secondary of the furnace transformer T (fig.1), before the symmetrization installation and correction of the power factor, using the CA8334 three-phase power quality analyser [13]. CA8334 gave an instantaneous image of the main characteristics of power quality for the analyzed induction furnace. The main parameters measured by the CA8334 analyser were: TRMS AC phase voltages and TRMS AC line currents; peak voltage and current; active, reactive and apparent power per phase; harmonics for voltages and currents up to the 50th order. This analyser provide numerous calculated values and processing functions in compliance with EMC standards in use (EN 50160, IEC 61000-4-15, IEC 61000-4-30, IEC 61000-4-7, IEC 61000-3-4).
WSEAS TRANSACTIONS on SYSTEMS Angela Iagar, Gabriel Nicolae Popa, Ioan Sora
ISSN: 1109-2777 2 Issue 1, Volume 8, January 2009
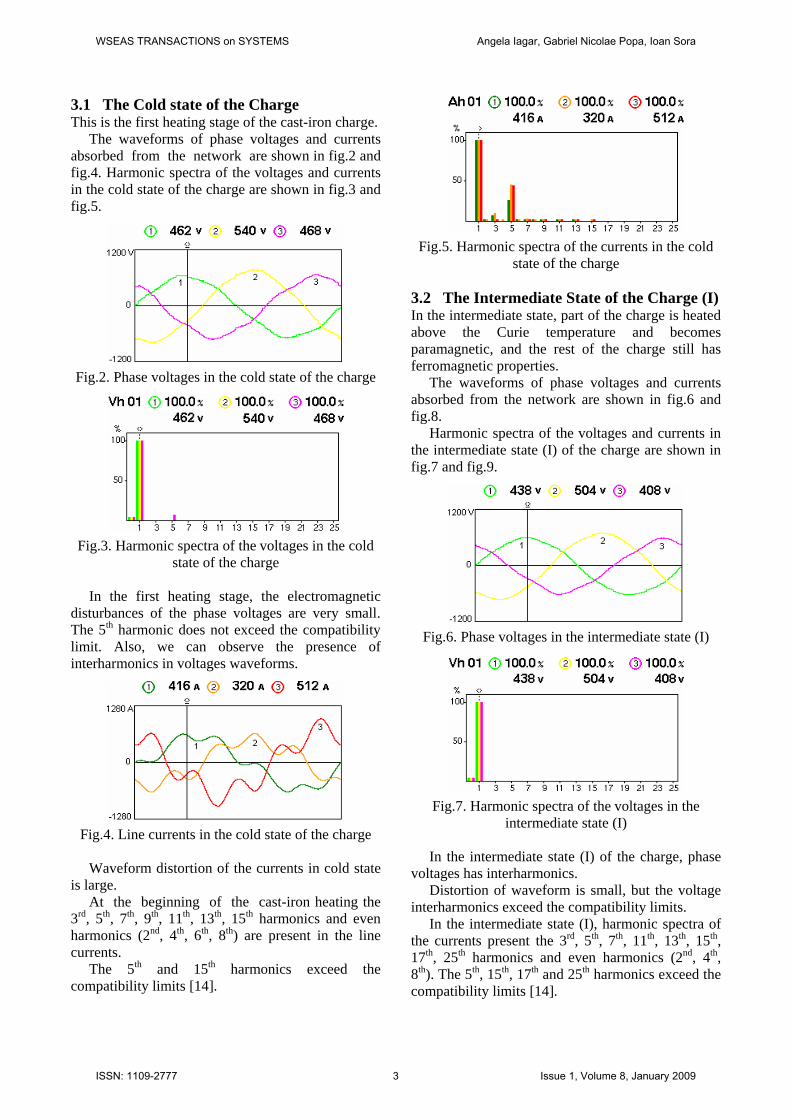
3.1 The Cold state of the Charge This is the first heating stage of the cast-iron charge. The waveforms of phase voltages and currents absorbed from the network are shown in fig.2 and fig.4. Harmonic spectra of the voltages and currents in the cold state of the charge are shown in fig.3 and fig.5.
Fig.2. Phase voltages in the cold state of the charge
Fig.3. Harmonic spectra of the voltages in the cold state of the charge
In the first heating stage, the electromagnetic disturbances of the phase voltages are very small. The 5th harmonic does not exceed the compatibility limit. Also, we can observe the presence of interharmonics in voltages waveforms.
Fig.4. Line currents in the cold state of the charge
Waveform distortion of the currents in cold state is large. At the beginning of the cast-iron heating the 3rd, 5th, 7th, 9th, 11th, 13th, 15th harmonics and even harmonics (2nd, 4th, 6th, 8th) are present in the line currents. The 5th and 15th harmonics exceed the compatibility limits [14].
Fig.5. Harmonic spectra of the currents in the cold state of the charge
3.2 The Intermediate State of the Charge (I) In the intermediate state, part of the charge is heated above the Curie temperature and becomes paramagnetic, and the rest of the charge still has ferromagnetic properties. The waveforms of phase voltages and currents absorbed from the network are shown in fig.6 and fig.8. Harmonic spectra of the voltages and currents in the intermediate state (I) of the charge are shown in fig.7 and fig.9.
Fig.6. Phase voltages in the intermediate state (I)
Fig.7. Harmonic spectra of the voltages in the intermediate state (I)
In the intermediate state (I) of the charge, phase voltages has interharmonics. Distortion of waveform is small, but the voltage interharmonics exceed the compatibility limits. In the intermediate state (I), harmonic spectra of the currents present the 3rd, 5th, 7th, 11th, 13th, 15th, 17th, 25th harmonics and even harmonics (2nd, 4th, 8th). The 5th, 15th, 17th and 25th harmonics exceed the compatibility limits [14].
WSEAS TRANSACTIONS on SYSTEMS Angela Iagar, Gabriel Nicolae Popa, Ioan Sora
ISSN: 1109-2777 3 Issue 1, Volume 8, January 2009
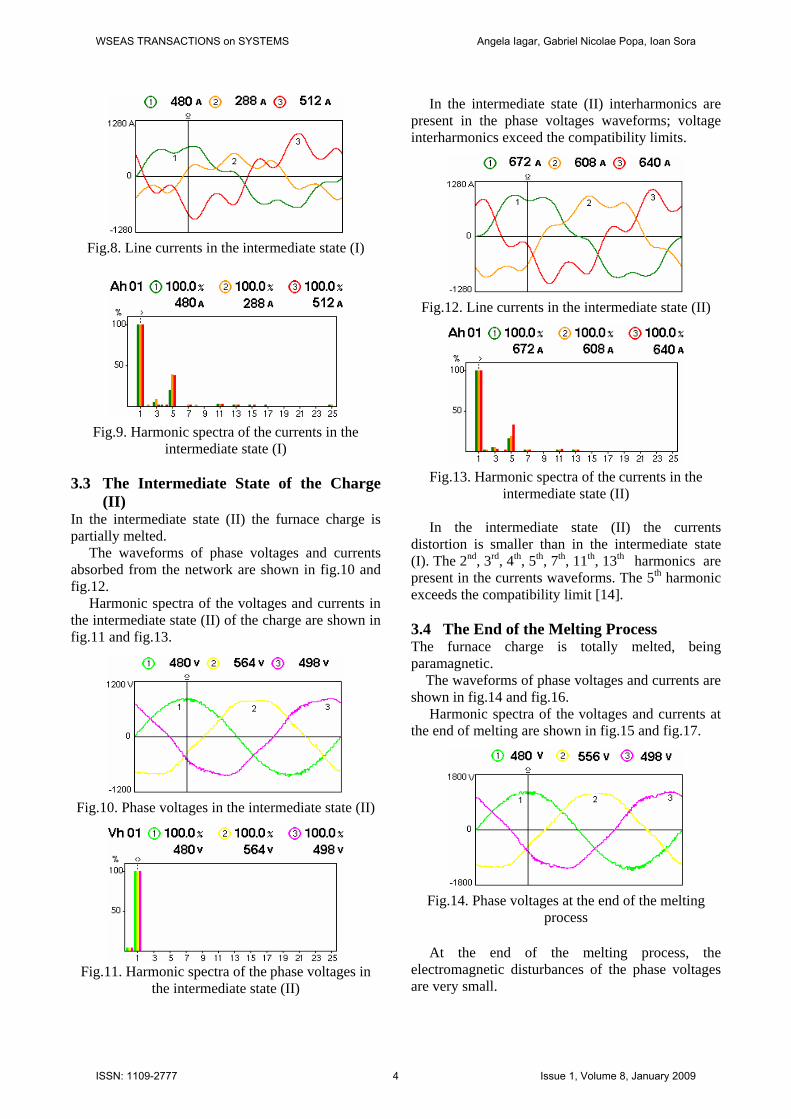
Fig.8. Line currents in the intermediate state (I)
Fig.9. Harmonic spectra of the currents in the intermediate state (I)
3.3 The Intermediate State of the Charge
(II) In the intermediate state (II) the furnace charge is partially melted. The waveforms of phase voltages and currents absorbed from the network are shown in fig.10 and fig.12. Harmonic spectra of the voltages and currents in the intermediate state (II) of the charge are shown in fig.11 and fig.13.
Fig.10. Phase voltages in the intermediate state (II)
Fig.11. Harmonic spectra of the phase voltages in
the intermediate state (II)
In the intermediate state (II) interharmonics are present in the phase voltages waveforms; voltage interharmonics exceed the compatibility limits.
Fig.12. Line currents in the intermediate state (II)
Fig.13. Harmonic spectra of the currents in the intermediate state (II)
In the intermediate state (II) the currents distortion is smaller than in the intermediate state (I). The 2nd, 3rd, 4th, 5th, 7th, 11th, 13th harmonics are present in the currents waveforms. The 5th harmonic exceeds the compatibility limit [14]. 3.4 The End of the Melting Process The furnace charge is totally melted, being paramagnetic. The waveforms of phase voltages and currents are shown in fig.14 and fig.16. Harmonic spectra of the voltages and currents at the end of melting are shown in fig.15 and fig.17.
Fig.14. Phase voltages at the end of the melting process
At the end of the melting process, the electromagnetic disturbances of the phase voltages are very small.
WSEAS TRANSACTIONS on SYSTEMS Angela Iagar, Gabriel Nicolae Popa, Ioan Sora
ISSN: 1109-2777 4 Issue 1, Volume 8, January 2009

Fig.15. Harmonic spectra of the phase voltages at the end of the melting process
Harmonic spectra of the phase voltages present interharmonics. Voltage interharmonics exceed the compatibility limits.
Fig.16. Line currents at the end of the melting process
Waveform distortion of the currents at the end of the melting process is smaller than in cold state, or intermediate state I.
Fig.17. Harmonic spectra of the currents at the end of the melting process
Harmonic spectra of the currents at the end of the melting process show the presence of 3rd, 5th, 7th, 9th, 11th, 13th, 15th, 17th, 25th harmonics and even harmonics (2nd, 4th, 6th). The 5th, 15th and 25th
harmonics exceed the compatibility limits [14]. 4 The Values Computed by the CA8334 Analyser The values computed by the CA8334 analyser are [13]: 1. Total harmonic distortion of voltages and
currents
100V
)V(V
i1harm
50
2n
2inharm
iTHD ⋅∑
= = (1)
100I
)I(I
i1harm
50
2n
2inharm
iTHD ⋅∑
= = (2)
V represents the phase voltage, I represents the line current, i represents the phase (i = 1, 2, 3) and n represents the order of harmonics.
2. Distortion factor of voltages and currents
100V
)V(21
ViRMS
50
2n
2inharm
iDF ⋅∑
= = (3)
100I
)I(21
IiRMS
50
2n
2inharm
iDF ⋅∑
= = (4)
VRMS and IRMS represent the RMS values for phase voltage and line current, computed over 1 second, and i represents the phase (i = 1, 2, 3).
3. K factor for current
∑
∑ ⋅=
=
=50
1n
2inharm
50
1n
2inharm
2
iKF)I(
)I(nI (5)
In the above relation I represents the line current, i represents the phase (i = 1, 2, 3) and n represents the order of harmonics. K factor is a weighting of the harmonic load currents according to their effects on transformer heating. A K factor of 1 indicates a linear load (no harmonics); a higher K factor indicates the greater harmonic heating effects.
4. Voltage and current unbalance The unbalanced three-phase systems of voltages (or currents) can be reduce into three balanced systems: the positive (+), negative (-) and zero (0) sequence components [4]. The positive voltage True RMS and the negative voltage True RMS are given by the relations:
3VaaVV
V 32
21rms
++=+ (6)
3aVVaV
V 322
1rms
++=− (7)
WSEAS TRANSACTIONS on SYSTEMS Angela Iagar, Gabriel Nicolae Popa, Ioan Sora
ISSN: 1109-2777 5 Issue 1, Volume 8, January 2009
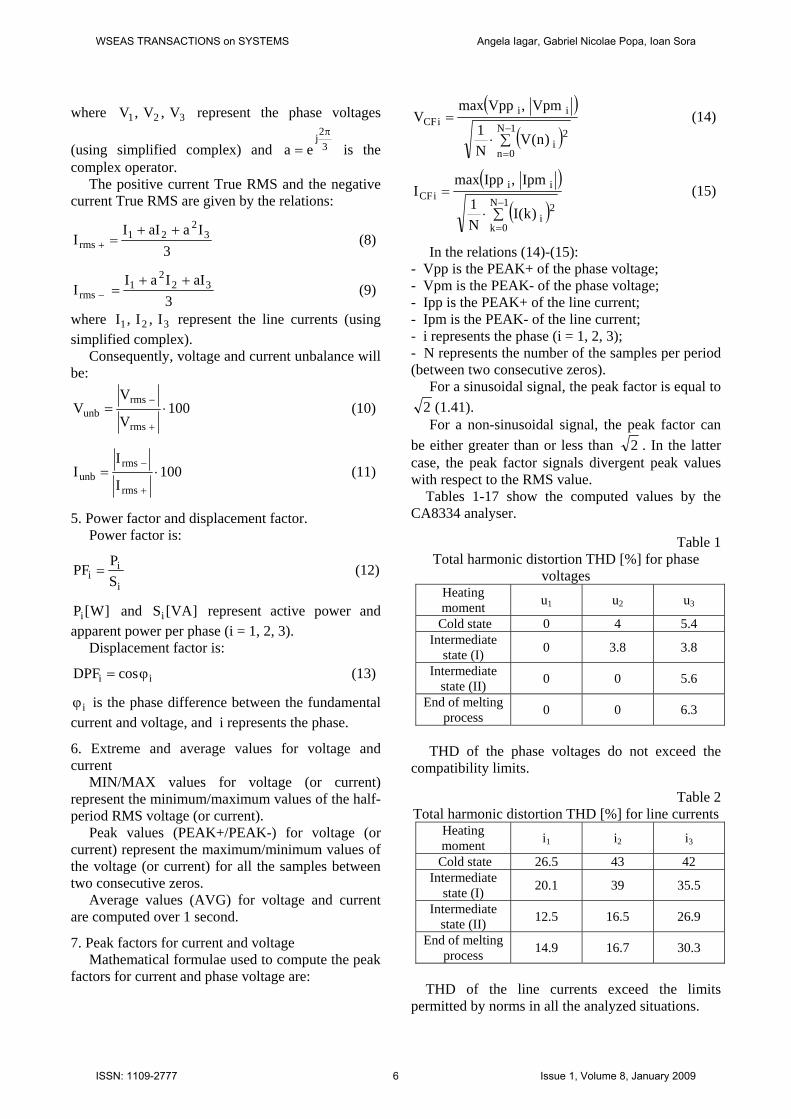
where 321 V,V,V represent the phase voltages
(using simplified complex) and 32j
eaπ
= is the complex operator. The positive current True RMS and the negative current True RMS are given by the relations:
3IaaII
I 32
21rms
++=+ (8)
3aIIaI
I 322
1rms
++=− (9)
where 321 I,I,I represent the line currents (using simplified complex). Consequently, voltage and current unbalance will be:
100V
VV
rms
rmsunb ⋅=
+
− (10)
100I
II
rms
rmsunb ⋅=
+
− (11)
5. Power factor and displacement factor. Power factor is:
i
ii S
PPF = (12)
]W[Pi and ]VA[Si represent active power and apparent power per phase (i = 1, 2, 3). Displacement factor is:
ii cosDPF ϕ= (13)
iϕ is the phase difference between the fundamental current and voltage, and i represents the phase.
6. Extreme and average values for voltage and current MIN/MAX values for voltage (or current) represent the minimum/maximum values of the half-period RMS voltage (or current). Peak values (PEAK+/PEAK-) for voltage (or current) represent the maximum/minimum values of the voltage (or current) for all the samples between two consecutive zeros. Average values (AVG) for voltage and current are computed over 1 second.
7. Peak factors for current and voltage Mathematical formulae used to compute the peak factors for current and phase voltage are:
( )( )∑⋅
=−
=
1N
0n
2i
iiiCF
)n(VN1
Vpm,VppmaxV (14)
( )( )∑⋅
=−
=
1N
0k
2i
iiiCF
)k(IN1
Ipm,IppmaxI (15)
In the relations (14)-(15): - Vpp is the PEAK+ of the phase voltage; - Vpm is the PEAK- of the phase voltage; - Ipp is the PEAK+ of the line current; - Ipm is the PEAK- of the line current; - i represents the phase (i = 1, 2, 3); - N represents the number of the samples per period (between two consecutive zeros). For a sinusoidal signal, the peak factor is equal to
2 (1.41). For a non-sinusoidal signal, the peak factor can be either greater than or less than 2 . In the latter case, the peak factor signals divergent peak values with respect to the RMS value. Tables 1-17 show the computed values by the CA8334 analyser.
Table 1 Total harmonic distortion THD [%] for phase
voltages Heating moment u1 u2 u3
Cold state 0 4 5.4 Intermediate
state (I) 0 3.8 3.8
Intermediate state (II) 0 0 5.6
End of melting process 0 0 6.3
THD of the phase voltages do not exceed the compatibility limits.
Table 2 Total harmonic distortion THD [%] for line currents
Heating moment i1 i2 i3
Cold state 26.5 43 42 Intermediate
state (I) 20.1 39 35.5
Intermediate state (II) 12.5 16.5 26.9
End of melting process 14.9 16.7 30.3
THD of the line currents exceed the limits permitted by norms in all the analyzed situations.
WSEAS TRANSACTIONS on SYSTEMS Angela Iagar, Gabriel Nicolae Popa, Ioan Sora
ISSN: 1109-2777 6 Issue 1, Volume 8, January 2009

Table 3 Distortion factor DF [%] of phase voltages Heating moment u1 u2 u3
Cold state 0 0 0 Intermediate
state (I) 0 0 0
Intermediate state (II) 0 0 0
End of melting process 0 0 5.5
Distortion factor of phase voltages is very small during the heating process of cast-iron charge. Distortion factor of phase voltages is smaller than total harmonic distortion, in all the situations.
Table 4 Distortion factor DF [%] of line currents
Heating moment i1 i2 i3
Cold state 21.7 46.2 32 Intermediate
state (I) 19.3 38.1 33.4
Intermediate state (II) 14.3 16.9 25.5
End of melting process 15.6 14.8 27.9
Distortion factor of line currents is very high in all the analyzed situations.
Table 5 K factor KF [-] of line currents
Heating moment i1 i2 i3
Cold state 2.02 6.07 3.52 Intermediate
state (I) 1.88 4.8 4.02
Intermediate state (II) 1.46 1.61 2.63
End of melting process 1.59 1.58 2.93
In all the heating stages K factor is greater than unity. The values of K factor in the cold state of furnace charge are very high and indicate the significant harmonic current content. K factor decrease at the end of the melting. Harmonics generate additional heat in the furnace transformer. If the transformer is non-K-rated, overheat possibly causing a fire, also reducing the life of the transformer. Table 6 shows the values of voltage and current
unbalance in all the heating stages.
Table 6 Voltage and current unbalance
Heating moment
Voltage unbalance [%]
Current unbalance [%]
Cold state 0.7 41.4 Intermediate
state (I) 10.1 32.3
Intermediate state (II) 0.5 15.1
End of melting process 0.4 2.6
Voltage unbalance exceeds the permitted values in intermediate state (I). Current unbalance is very large in the cold state and decreases as the furnace charge is melting down.
Table 7 PF and DPF per phase (1, 2, 3)
PF DPF Heating moment 1 2 3 1 2 3
Cold state 0.96 0.84 0.93 0.98 0.93 0.99 Intermediate
state (I) 0.93 0.88 0.92 0.95 0.97 0.98
Intermediate state (II) 0.98 0.95 0.95 0.99 0.98 0.99
End of melting process 0.97 0.97 0.96 0.99 0.99 0.99
PF is less than unity in all the analyzed situations; in cold state and in intermediate state (I), PF is less than neutral value (0.92) per phase 2. Tables 8-11 show the extreme and average values for phase voltages in all the heating stages of the cast-iron charge.
Table 8 Extreme and average values for phase voltages in
cold state Values u1 u2 u3
MAX [V] 552 624 558 AVG [V] 456 540 468 MIN [V] 0 0 0
PEAK+ [V] 660 786 678 PEAK- [V] -672 -786 -726
Table 9
Extreme and average values for phase voltages in intermediate state I
Values u1 u2 u3 MAX [V] 534 582 654 AVG [V] 438 504 402 MIN [V] 0 0 0
PEAK+ [V] 606 708 606 PEAK- [V] -648 -726 -630
WSEAS TRANSACTIONS on SYSTEMS Angela Iagar, Gabriel Nicolae Popa, Ioan Sora
ISSN: 1109-2777 7 Issue 1, Volume 8, January 2009
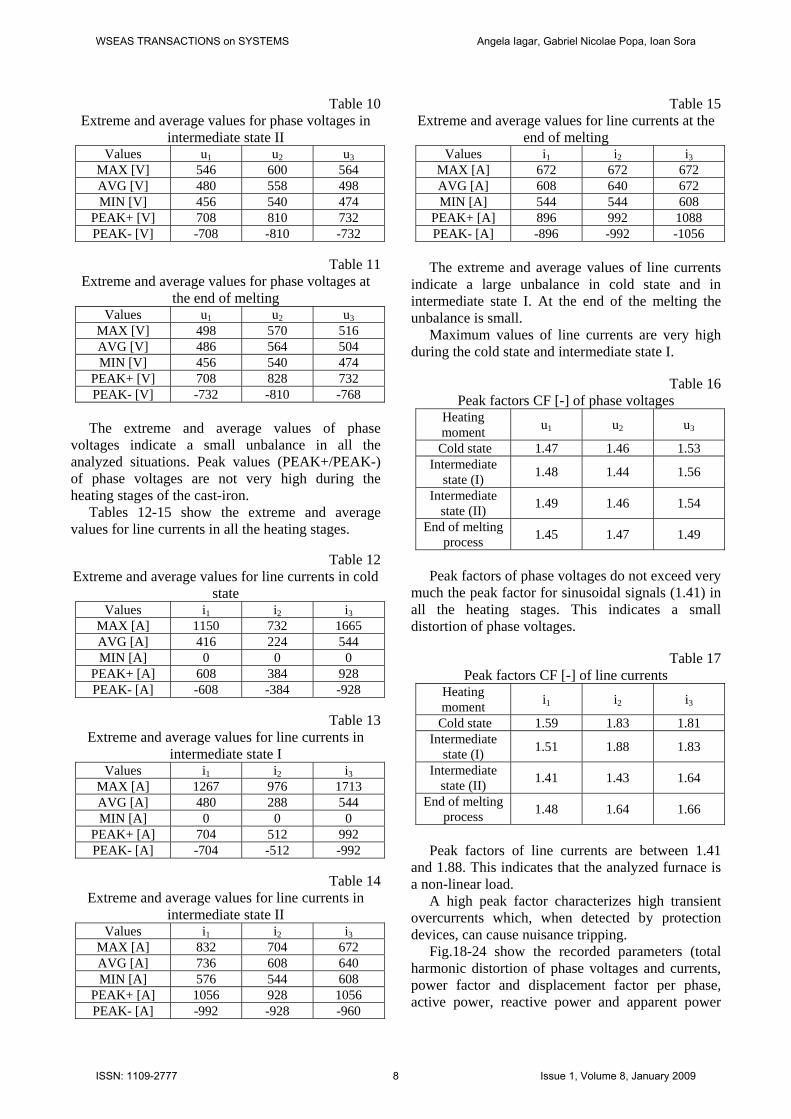
Table 10 Extreme and average values for phase voltages in
intermediate state II Values u1 u2 u3
MAX [V] 546 600 564 AVG [V] 480 558 498 MIN [V] 456 540 474
PEAK+ [V] 708 810 732 PEAK- [V] -708 -810 -732
Table 11
Extreme and average values for phase voltages at the end of melting
Values u1 u2 u3 MAX [V] 498 570 516 AVG [V] 486 564 504 MIN [V] 456 540 474
PEAK+ [V] 708 828 732 PEAK- [V] -732 -810 -768
The extreme and average values of phase voltages indicate a small unbalance in all the analyzed situations. Peak values (PEAK+/PEAK-) of phase voltages are not very high during the heating stages of the cast-iron. Tables 12-15 show the extreme and average values for line currents in all the heating stages.
Table 12 Extreme and average values for line currents in cold
state Values i1 i2 i3
MAX [A] 1150 732 1665 AVG [A] 416 224 544 MIN [A] 0 0 0
PEAK+ [A] 608 384 928 PEAK- [A] -608 -384 -928
Table 13
Extreme and average values for line currents in intermediate state I
Values i1 i2 i3 MAX [A] 1267 976 1713 AVG [A] 480 288 544 MIN [A] 0 0 0
PEAK+ [A] 704 512 992 PEAK- [A] -704 -512 -992
Table 14
Extreme and average values for line currents in intermediate state II
Values i1 i2 i3 MAX [A] 832 704 672 AVG [A] 736 608 640 MIN [A] 576 544 608
PEAK+ [A] 1056 928 1056 PEAK- [A] -992 -928 -960
Table 15 Extreme and average values for line currents at the
end of melting Values i1 i2 i3
MAX [A] 672 672 672 AVG [A] 608 640 672 MIN [A] 544 544 608
PEAK+ [A] 896 992 1088 PEAK- [A] -896 -992 -1056
The extreme and average values of line currents indicate a large unbalance in cold state and in intermediate state I. At the end of the melting the unbalance is small. Maximum values of line currents are very high during the cold state and intermediate state I.
Table 16
Peak factors CF [-] of phase voltages Heating moment u1 u2 u3
Cold state 1.47 1.46 1.53 Intermediate
state (I) 1.48 1.44 1.56
Intermediate state (II) 1.49 1.46 1.54
End of melting process 1.45 1.47 1.49
Peak factors of phase voltages do not exceed very much the peak factor for sinusoidal signals (1.41) in all the heating stages. This indicates a small distortion of phase voltages.
Table 17 Peak factors CF [-] of line currents
Heating moment i1 i2 i3
Cold state 1.59 1.83 1.81 Intermediate
state (I) 1.51 1.88 1.83
Intermediate state (II) 1.41 1.43 1.64
End of melting process 1.48 1.64 1.66
Peak factors of line currents are between 1.41 and 1.88. This indicates that the analyzed furnace is a non-linear load. A high peak factor characterizes high transient overcurrents which, when detected by protection devices, can cause nuisance tripping. Fig.18-24 show the recorded parameters (total harmonic distortion of phase voltages and currents, power factor and displacement factor per phase, active power, reactive power and apparent power
WSEAS TRANSACTIONS on SYSTEMS Angela Iagar, Gabriel Nicolae Popa, Ioan Sora
ISSN: 1109-2777 8 Issue 1, Volume 8, January 2009

per phase) in the last stage of the heating. The furnace charge was totally melted (and paramagnetic) in the recording period, 16:56-17:19.
Fig.18. Recorded values of VTHD in the last stage of the melting process
THD of phase voltages are within compatibility limits in the last stage of the melting process.
Fig.19. Recorded values of ITHD in the last stage of the melting process
THD of line currents are smaller in the last stage of melting comparatively with cold state or intermediate state I, but exceed the compatibility limits. THD of line currents are between 15% and 40% during the recording period. This indicates a significant harmonic pollution with a risk of temperature rise.
Fig.20. Recorded values of PF per phase in the last stage of the melting process
In the last stage of the melting process power factor (PF) per phase is less than unity, but exceed the neutral value (0.92).
Fig.21. Recorded values of DPF per phase in the last stage of the melting process
In the last stage of the melting displacement factor (DPF) per phase is less than unity. In the recording period, displacement factor is greater than power factor per phase.
Fig.22. Recorded values of active power per phase in the last stage of the melting process
Recorded values of active power per phase indicate a small unbalance in the last stage of the melting process. Recorded values of active power per phase (fig.22) are close to the apparent power values (fig.24). That indicates a good (satisfactory) power factor, but less than unity.
Fig.23. Recorded values of reactive power per phase in the last stage of the melting process
Recorded values of reactive power in the last stage of the melting process are negative per phases 1 and 2, respectively positive per phase 3. That indicates a capacitive power factor per phases 1, 2 and an inductive power factor per phase 3.
WSEAS TRANSACTIONS on SYSTEMS Angela Iagar, Gabriel Nicolae Popa, Ioan Sora
ISSN: 1109-2777 9 Issue 1, Volume 8, January 2009

Fig.24. Recorded values of apparent power per phase in the last stage of the melting process
Recorded values of apparent power per phase indicate a small unbalance in the last stage of the melting process. Under non-sinusoidal conditions, any attempt to achieve unity PF does not result in harmonic-free current. Similarly, compensation for current harmonics does not yield unity PF. The best solution to this tradeoff is the optimization of PF, THD and SHD (specific harmonic distortion) [15,16]. 5 Conclusions The measurements results show that the operation of the analyzed induction furnace determines unbalance and harmonics in the currents absorbed from the network. The unbalance and the waves distortion are very pronounced in the first stage of the cast-iron heating and decrease as this one is melting down. THD of the line currents exceed the compatibility limits in all the analyzed situations. THD of the phase voltages do not exceed the compatibility limits. Due to unbalance, THD of the line currents are bigger in intermediate state (I) comparatively with intermediate state (II). In the case of currents, 5th, 15th, 17th and 25th harmonics exceed the compatibility limits. THD of the phase voltages do not exceed the compatibility limits, but the voltage interharmonics exceed the compatibility limits in all the analyzed situations. The peak factors of line currents are high in the cold state and intermediate state I. That indicates high transient overcurrents which, when detected by protection devices, can cause nuisance tripping. To reduce the heating effects of harmonic currents created by the operation of analyzed furnace it must replaced the furnace transformer by a transformer with K-factor of an equal or higher value than 4. The capacitors destined for power factor
correction and the ones from Steinmetz circuit magnify in fact the harmonic problems. PF is less than unity in all the analyzed situations. But, Steinmetz circuit is efficient only for unity PF, under sinusoidal conditions. For optimizing the operation of analyzed induction furnace, it’s imposing the simultaneous adoption of three technical measures: harmonics filtering, reactive power compensation and load balancing. That is the reason to introduce harmonic filters in the primary of furnace transformer to solve the power interface problems. In order to eliminate the unbalance, we suggest to add another symmetrization system in the connection point of the furnace to the power supply network. Acknowledgments: This research has done by a grant research support. This project has been selected and funded by the BALKAN ENVIRONMENTAL ASSOCIATION (B.EN.A.), with the COSMOTE-ROMANIA sponsorship funds. References: [1] V. Rudnev, D. Loveless, R. Cook, M. Black,
Handbook of Induction Heating, CRC Press, Taylor&Francis Group, 2002.
[2] ***, Power Quality for Induction Melting in Metal Production, TechCommentary Electric Power Research Institute, U.S.A., 1999.
[3] J. Nuns, H. Foch, M. Metz, X. Yang, Radiated and Conducted Interferences in Induction Heating Equipment: Characteristics and Remedies, Fifth European Conference on Power Electronics and Applications, Vol.7, 1993, pp.194-199.
[4] J. Arrillaga, N. R. Watson, S. Chen, Power System Quality Assessment, New York, John Wiley and Sons, 2000.
[5] F. C. de la Rosa, Harmonics and Power Systems, CRC Press, Taylor&Francis Group, 2006.
[6] F. Lattarulo (Editor), Electromagnetic Compatibility in Power System, Elsevier Science&Technology Books, 2006.
[7] M. Popescu, A. Bitoleanu, M. Dobriceanu, Harmonic Current Reduction in Railway Systems, WSEAS Transactions on Systems, Vol. 7, Issue 7, 2008, pp. 689-698.
[8] M. Panoiu, C. Panoiu, I. Sora, A. Iordan, R. Rob, Using Simulation for Study the Possibility of Canceling Load Unbalance of Non-sinusoidal
WSEAS TRANSACTIONS on SYSTEMS Angela Iagar, Gabriel Nicolae Popa, Ioan Sora
ISSN: 1109-2777 10 Issue 1, Volume 8, January 2009
High Power three-phase Loads, WSEAS Transactions on Systems, Vol. 7, Issue 7, 2008, pp. 699-710.
[9] S. G. Seifossadat, M. Razzaz, M. Moghaddasian, M. Monadi, Harmonic Estimation in Power Systems Using Adaptive Perceptrons Based on a Genetic Algorithm, WSEAS Transactions on Power Systems, Vol. 2, Issue 11, 2007, pp. 239-244.
[10] Yang Han, Gang Yao, Li-Dan Zhou, Chen Chen, Harmonic Mitigation of Residential Distribution System using a Novel Hybrid Active Power Filter, WSEAS Transactions on Power Systems, Vol. 2, Issue 12, 2007, pp. 255-260.
[11] W. Hosny, B. Dobrucky, Harmonic Distortion and Reactive Power Compensation in Single Phase Power Systems using Orthogonal Transformation Strategy, WSEAS Transactions on Power Systems, Vol. 3, Issue 4, 2008, pp. 237-246.
[12] Ching-Tzong Su, Chen-Yi Lin, Ji-Jen Wong,
Optimal Size and Location of Capacitors Placed on a Distribution System, WSEAS Transactions on Power Systems, Vol. 3, Issue 4, 2008, pp. 247-256.
[13] ***, CA8334, Three Phase Power Quality Analyser, technical handbook, Chauvin Arnoux, France, 2007.
[14] ***, IEC 61000-3-4, EMC, Part 3-4: Limits – Limitation of Emission of Harmonic Currents in Low-Voltage Power Supply Systems for Equipment with Rated Current Greater than 16A, 1998.
[15] S. George, V. Agarwal, Optimum Control of Selective and Total Harmonic Distortion in Current and Voltage Under Nonsinusoidal Conditions, IEEE Transactions on Power Delivery, Vol.23, Issue 2, 2008, pp.937-944.
[16] T.B Sekara, J.C. Mikulovic, Z.R. Djurisic, Optimal Reactive Compensators in Power Systems Under Asymmetrical and Nonsinusoidal Conditions, IEEE Transactions on Power Delivery, Vol.23, Issue 2, 2008, pp.974-984.
WSEAS TRANSACTIONS on SYSTEMS Angela Iagar, Gabriel Nicolae Popa, Ioan Sora
ISSN: 1109-2777 11 Issue 1, Volume 8, January 2009