Analysis of clonogenic growth in vitro
33
UNCORRECTED PROOF 1 Analysis of clonogenic growth in vitro 2 Nikko Brix 1,5 , Daniel Samaga 2,5 , Claus Belka 1,3,4 , Horst Zitzelsberger 2,3,4 and 3 Kirsten Lauber 1,3,4 ✉ 4 5 The clonogenic assay measures the capacity of single cells to form colonies in vitro. It is widely used to identify and 6 quantify self-renewing mammalian cells derived from in vitro cultures as well as from ex vivo tissue preparations of 7 different origins. Varying research questions and the heterogeneous growth requirements of individual cell model systems 8 led to the development of several assay principles and formats that differ with regard to their conceptual setup, 2D or 3D 9 culture conditions, optional cytotoxic treatments and subsequent mathematical analysis. The protocol presented here is 10 based on the initial clonogenic assay protocol as developed by Puck and Marcus more than 60 years ago. It updates and 11 extends the previous Nature Protocols article by Franken et al. in 2006. It discusses different strategies and principles to 12 analyze clonogenic growth in vitro and presents the clonogenic assay in a modular protocol framework enabling a diversity 13 of formats and measures to optimize determination of clonogenic growth parameters. We put particular focus on the 14 phenomenon of cellular cooperation and consideration of how this can affect the mathematical analysis of survival data. 15 This protocol is applicable to any mammalian cell model system from which single-cell suspensions can be prepared and 16 which contains at least a small fraction of cells with self-renewing capacity in vitro. Depending on the cell system used, 17 the entire procedure takes ~2–10 weeks, with a total hands-on time of <20 h per biological replicate. 18 19 This protocol is an extension to: Nat. Protoc. 1, 2315–2319 (2006) https://doi.org/10.1038/nprot.2006.339 20 Introduction 21 Since its development in the mid-1950s, the clonogenic assay has been used by numerous researchers 22 to measure the self-renewing capacity of various mammalian cell model systems in vitro 1–4 . In this 23 context, ‘clonogenic’ growth is conventionally defined as a cluster of ≥50 cells originating from one 24 single cell. Initially used by Puck and Marcus to test the cytotoxic effects of ionizing radiation, it has 25 proven a versatile and easy-to-handle technique of basic mammalian cell culture in a wide range of 26 disciplines, including medical oncology, stem cell research, cell biology, pharmacology and toxicol- 27 ogy 5–15 . Over years of extensive use, the protocol, which was originally designed to assess the self- 28 renewing capacity of adherent single cells grown in 2D, has been adapted, extended and refined, and 29 protocol variants for the quantification of non-adherent clonogenic growth in 3D using semi-solid 30 matrices Q1 developed. This has broadened the range of applications to anchorage—independent, 31 growing, self-renewing cells as well as cells that require embedding in extracellular Q2 matrices. Q6 32 Irrespective of the assay format, for certain cell model systems, it can be challenging to determine 33 the ideal—or at least near-ideal—culture conditions for clonogenic growth in vitro. In particular, the 34 clonogenic potential depends on the culture medium composition and the growth requirements of 35 isolated cells at low density, which may be fundamentally different from the growth requirements of 36 the same cells at higher density 16 . Moreover, the phenomenon of cellular cooperation (i.e., a cell’s 37 ability to stimulate clonogenic survival via paracrine and/or autocrine mechanisms (Box 1)) needs to 38 be considered not only in the experimental setup but also in the mathematical analysis of clonogenic 39 survival experiments 17 . 40 In this Protocol Extension, we provide details of how to carry out clonogenic assays, updating the 41 previous Nature Protocols article on this topic 1 . We have used the protocol we describe here to 42 examine clonogenic survival of cancer and nonmalignant cells in response to radio- and che- 43 motherapy in single- and combined-modality settings 17–19 . Q3 Q4 Q5 1 Department of Radiation Oncology, University Hospital, LMU München, Munich, Germany. 2 Research Unit Radiation Cytogenetics, Helmholtz Center Munich, German Research Center for Environmental Health GmbH, Neuherberg, Germany. 3 Clinical Cooperation Group ‘Personalized Radiotherapy in Head and Neck Cancer’, Helmholtz Center Munich, German Research Center for Environmental Health GmbH, Neuherberg, Germany. 4 German Cancer Consortium (DKTK) partner site, Munich, Germany. 5 These authors contributed equally: Nikko Brix, Daniel Samaga. ✉ e-mail: [email protected] NATURE PROTOCOLS | www.nature.com/nprot 1 PROTOCOL EXTENSION https://doi.org/10.1038/s41596-021-00615-0 1234567890():,; 1234567890():,;
-
Upload
khangminh22 -
Category
Documents
-
view
0 -
download
0
Transcript of Analysis of clonogenic growth in vitro

UNCORRECTED PROOF
1Analysis of clonogenic growth in vitro2Nikko Brix1,5, Daniel Samaga2,5, Claus Belka 1,3,4, Horst Zitzelsberger2,3,4 and3Kirsten Lauber 1,3,4✉
4
5The clonogenic assay measures the capacity of single cells to form colonies in vitro. It is widely used to identify and6quantify self-renewing mammalian cells derived from in vitro cultures as well as from ex vivo tissue preparations of7different origins. Varying research questions and the heterogeneous growth requirements of individual cell model systems8led to the development of several assay principles and formats that differ with regard to their conceptual setup, 2D or 3D9culture conditions, optional cytotoxic treatments and subsequent mathematical analysis. The protocol presented here is10based on the initial clonogenic assay protocol as developed by Puck and Marcus more than 60 years ago. It updates and11extends the previous Nature Protocols article by Franken et al. in 2006. It discusses different strategies and principles to12analyze clonogenic growth in vitro and presents the clonogenic assay in a modular protocol framework enabling a diversity13of formats and measures to optimize determination of clonogenic growth parameters. We put particular focus on the14phenomenon of cellular cooperation and consideration of how this can affect the mathematical analysis of survival data.15This protocol is applicable to any mammalian cell model system from which single-cell suspensions can be prepared and16which contains at least a small fraction of cells with self-renewing capacity in vitro. Depending on the cell system used,17the entire procedure takes ~2–10 weeks, with a total hands-on time of <20 h per biological replicate.18
19This protocol is an extension to: Nat. Protoc. 1, 2315–2319 (2006) https://doi.org/10.1038/nprot.2006.339
20Introduction
21Since its development in the mid-1950s, the clonogenic assay has been used by numerous researchers22to measure the self-renewing capacity of various mammalian cell model systems in vitro1–4. In this23context, ‘clonogenic’ growth is conventionally defined as a cluster of ≥50 cells originating from one24single cell. Initially used by Puck and Marcus to test the cytotoxic effects of ionizing radiation, it has25proven a versatile and easy-to-handle technique of basic mammalian cell culture in a wide range of26disciplines, including medical oncology, stem cell research, cell biology, pharmacology and toxicol-27ogy5–15. Over years of extensive use, the protocol, which was originally designed to assess the self-28renewing capacity of adherent single cells grown in 2D, has been adapted, extended and refined, and29protocol variants for the quantification of non-adherent clonogenic growth in 3D using semi-solid30matrices Q1developed. This has broadened the range of applications to anchorage—independent,31growing, self-renewing cells as well as cells that require embedding in extracellular Q2matrices. Q3Q4Q5Q632Irrespective of the assay format, for certain cell model systems, it can be challenging to determine33the ideal—or at least near-ideal—culture conditions for clonogenic growth in vitro. In particular, the34clonogenic potential depends on the culture medium composition and the growth requirements of35isolated cells at low density, which may be fundamentally different from the growth requirements of36the same cells at higher density16. Moreover, the phenomenon of cellular cooperation (i.e., a cell’s37ability to stimulate clonogenic survival via paracrine and/or autocrine mechanisms (Box 1)) needs to38be considered not only in the experimental setup but also in the mathematical analysis of clonogenic39survival experiments17.40In this Protocol Extension, we provide details of how to carry out clonogenic assays, updating the41previous Nature Protocols article on this topic1. We have used the protocol we describe here to42examine clonogenic survival of cancer and nonmalignant cells in response to radio- and che-43motherapy in single- and combined-modality settings17–19.
Q3Q4Q5
1Department of Radiation Oncology, University Hospital, LMU München, Munich, Germany. 2Research Unit Radiation Cytogenetics, Helmholtz CenterMunich, German Research Center for Environmental Health GmbH, Neuherberg, Germany. 3Clinical Cooperation Group ‘Personalized Radiotherapy inHead and Neck Cancer’, Helmholtz Center Munich, German Research Center for Environmental Health GmbH, Neuherberg, Germany. 4GermanCancer Consortium (DKTK) partner site, Munich, Germany. 5These authors contributed equally: Nikko Brix, Daniel Samaga.✉e-mail: [email protected]
NATURE PROTOCOLS |www.nature.com/nprot 1
PROTOCOL EXTENSIONhttps://doi.org/10.1038/s41596-021-00615-0
1234
5678
90():,;
1234567890():,;
UNCORRECTED PROOF
44Development of the clonogenic assay protocol45Only a few years before the first clonogenic assay was published, mammalian single-cell growth was46considered impossible because the formulations of culture media available at that time were not47suitable to sustain cell growth at low density. The development of the clonogenic assay became48technically feasible when Sanford and colleagues recognized that single-cell proliferation could be49achieved by using conditioned media from high-density cultures to grow colonies of single-cell origin50in tiny capillaries where diffusion of cell-derived factors was restricted16.51This inspired Puck and Marcus to develop a procedure in which low-density cell cultures were52supplied with sufficient amounts of cell-derived growth factors to allow clonogenic growth4. Because53they found that some of these factors were unstable in culture, they used a layer of radiation-sterilized54feeder cells to condition the medium for single-cell survival in the same dish. The growing colonies
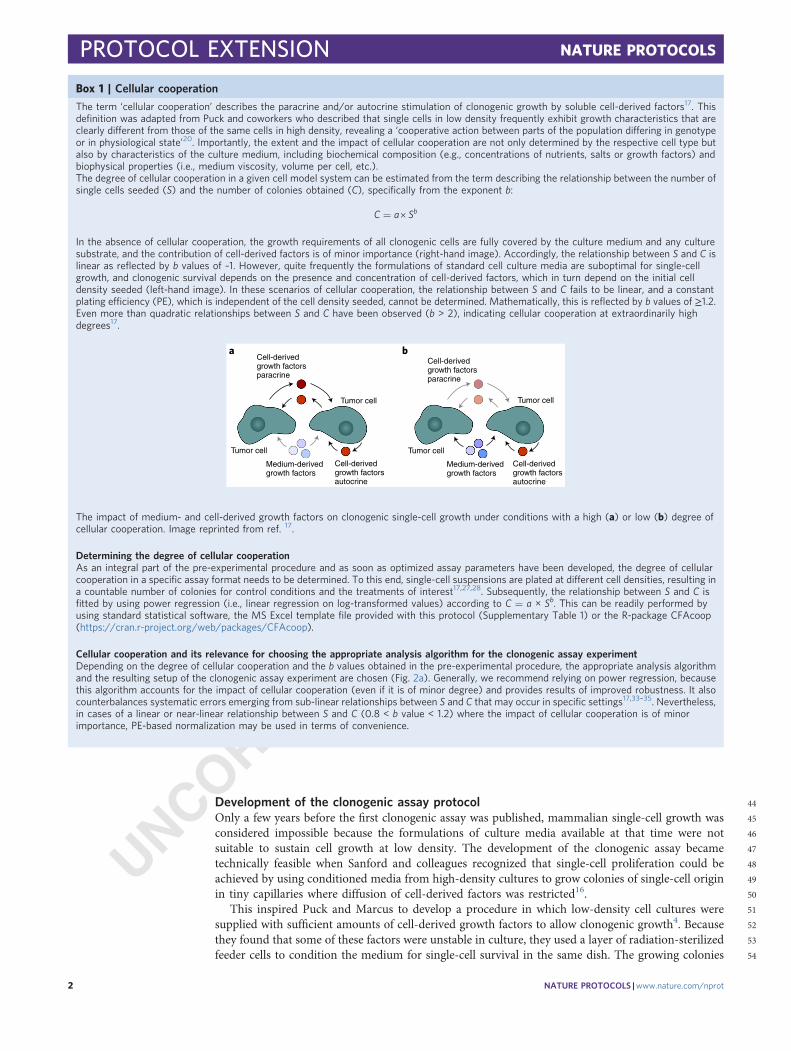
Box 1 | Cellular cooperation
The term ‘cellular cooperation’ describes the paracrine and/or autocrine stimulation of clonogenic growth by soluble cell-derived factors17. Thisdefinition was adapted from Puck and coworkers who described that single cells in low density frequently exhibit growth characteristics that areclearly different from those of the same cells in high density, revealing a ‘cooperative action between parts of the population differing in genotypeor in physiological state’20. Importantly, the extent and the impact of cellular cooperation are not only determined by the respective cell type butalso by characteristics of the culture medium, including biochemical composition (e.g., concentrations of nutrients, salts or growth factors) andbiophysical properties (i.e., medium viscosity, volume per cell, etc.).The degree of cellular cooperation in a given cell model system can be estimated from the term describing the relationship between the number ofsingle cells seeded (S) and the number of colonies obtained (C), specifically from the exponent b:
C ¼ a ´ Sb
In the absence of cellular cooperation, the growth requirements of all clonogenic cells are fully covered by the culture medium and any culturesubstrate, and the contribution of cell-derived factors is of minor importance (right-hand image). Accordingly, the relationship between S and C islinear as reflected by b values of ~1. However, quite frequently the formulations of standard cell culture media are suboptimal for single-cellgrowth, and clonogenic survival depends on the presence and concentration of cell-derived factors, which in turn depend on the initial celldensity seeded (left-hand image). In these scenarios of cellular cooperation, the relationship between S and C fails to be linear, and a constantplating efficiency (PE), which is independent of the cell density seeded, cannot be determined. Mathematically, this is reflected by b values of ≥1.2.Even more than quadratic relationships between S and C have been observed (b > 2), indicating cellular cooperation at extraordinarily highdegrees17.
a b
Cell-derivedgrowth factorsautocrine
Cell-derivedgrowth factorsautocrine
Medium-derivedgrowth factors
Medium-derivedgrowth factors
Cell-derivedgrowth factorsparacrine
Cell-derivedgrowth factorsparacrine
Tumor cell
Tumor cell Tumor cell
Tumor cell
The impact of medium- and cell-derived growth factors on clonogenic single-cell growth under conditions with a high (a) or low (b) degree ofcellular cooperation. Image reprinted from ref. 17.
Determining the degree of cellular cooperationAs an integral part of the pre-experimental procedure and as soon as optimized assay parameters have been developed, the degree of cellularcooperation in a specific assay format needs to be determined. To this end, single-cell suspensions are plated at different cell densities, resulting ina countable number of colonies for control conditions and the treatments of interest17,27,28. Subsequently, the relationship between S and C isfitted by using power regression (i.e., linear regression on log-transformed values) according to C = a × Sb. This can be readily performed byusing standard statistical software, the MS Excel template file provided with this protocol (Supplementary Table 1) or the R-package CFAcoop(https://cran.r-project.org/web/packages/CFAcoop).
Cellular cooperation and its relevance for choosing the appropriate analysis algorithm for the clonogenic assay experimentDepending on the degree of cellular cooperation and the b values obtained in the pre-experimental procedure, the appropriate analysis algorithmand the resulting setup of the clonogenic assay experiment are chosen (Fig. 2a). Generally, we recommend relying on power regression, becausethis algorithm accounts for the impact of cellular cooperation (even if it is of minor degree) and provides results of improved robustness. It alsocounterbalances systematic errors emerging from sub-linear relationships between S and C that may occur in specific settings17,33–35. Nevertheless,in cases of a linear or near-linear relationship between S and C (0.8 < b value < 1.2) where the impact of cellular cooperation is of minorimportance, PE-based normalization may be used in terms of convenience.
PROTOCOL EXTENSION NATURE PROTOCOLS
2 NATURE PROTOCOLS |www.nature.com/nprot

UNCORRECTED PROOF
55eventually became self sustaining, and clonogenic growth with nearly 100% plating efficiency (PE),56defined as the number of clonogenic cells divided by the number of single cells initially seeded, was57achieved. Puck and coworkers concluded that single cells needed to be supplied with sufficient58amounts of cell-derived factors from feeder layers and described the ‘cooperative action’ of cells under59low-density culture conditions to be crucial for clonogenic growth20. In successive experiments, they60refined the single-cell seeding procedure, rendering feeder layers dispensable in certain contexts.61Nevertheless, they clearly emphasized the need to optimize single-cell growth conditions for any cell62type of interest2,3,21.63Since then, 2D clonogenic assays with adherent cells have been frequently used, and this technique64enabled fundamental oncological and radiobiological discoveries11,22–24. The need for a method to65determine clonogenicity was obviously not restricted to cells growing adherently in 2D in vitro, and66the protocol was readily adopted by pioneering stem cell researchers who used in vivo assays to67determine the frequency of colony-forming hematopoietic cells in the spleens of recipient mice25,26.68Furthermore, the necessity to measure anchorage-independent clonogenic growth led to the devel-69opment of in vitro clonogenic assay formats for 3D embedded cells in the 1970s27–29. In this setting,70nutrient and growth factor supplementation was provided by a bottom layer of semi-solid culture71medium (i.e., culture medium supplemented with gellants, such as agarose, agar agar, methylcellulose72or, more recently, extracellular matrix preparations), and single cells were allowed to grow to 3D73spheroids or organoids in a second layer of semi-solid medium, which both limits diffusion of cell-74derived factors and restricts dispersion of embedded cells from growing cell clusters. Importantly, this75modification of the initial protocol by Puck and Marcus extended not only the spectrum of cell model76systems that could be applied to clonogenic assay formats in vitro (Fig. 1), but also the range of77research questions that could be addressed. Whereas adherent 2D colony growth is an important78feature for assessing the cytotoxic effects of diverse treatments in established mammalian cell lines79and other cell model systems that can be grown in adherent monolayers, matrix-embedded colony80growth has often been used to measure the frequency of anchorage-independent, growing stem(-like)81cells capable of self-renewal and/or differentiation. Accordingly, the methodology to detect colony-82forming cells in ex vivo preparations of various tissues in vitro essentially enabled the characterization83of rare stem(-like) cells within heterogeneous populations of different origins5,6,15,30–32. In addition to84the clonogenic assay, technically related assay principles that we herein refer to as the clonal assay and85the limiting dilution assay are available (Fig. 2). These are commonly performed with 3D embedded86single-cell preparations or in suspension. Similar to the clonogenic assay, they were developed to87detect and quantify clonally growing cells with self-renewing capacity in vitro, but their conceptual88assay designs and technical readouts are different (see Comparison between cell viability, clonal and89limiting dilution assays).90The clonogenic assay has traditionally been analyzed by PE-based normalization; that is, the91fraction of clonogenic cells surviving upon a given cytotoxic treatment is divided by the fraction of92clonogenic cells under control conditions. It is important to stress that the robustness of this kind of93normalization relies on the constancy of the PE as indicated by a linear relationship between the94number of cells seeded (S) and the number of colonies obtained (C)17. However, various studies have95revealed that the PE of a relevant proportion of cell culture models is not as constant as it has been96considered to be17,33–36. It can be strongly influenced by different assay parameters. As such, the total97assay volume and the cell density seeded are of critical importance17. The underlying reasons (i.e., the
Adherentin 2D format
Matrix-embeddedin 3D format
In suspension
Clonogenic assay
Clonal assay
Limiting dilution assay
Adherent cells
Spheroids and organoids
Suspension cells
Assay principle
Format
Cell model
Fig. 1 | Overview on the different assay formats and assay principles to determine clonogenic growth Q7.
NATURE PROTOCOLS PROTOCOL EXTENSION
NATURE PROTOCOLS |www.nature.com/nprot 3

UNCORRECTED PROOF
Clonogenic assay Clonal assay Limiting dilution assay
46 68 100
147 215 316
1 1 1 1 1 1 1 1 1 1 1 11 1 1 1 1 1 1 1 1 1 1 11 1 1 1 1 1 1 1 1 1 1 11 1 1 1 1 1 1 1 1 1 1 11 1 1 1 1 1 1 1 1 1 1 11 1 1 1 1 1 1 1 1 1 1 11 1 1 1 1 1 1 1 1 1 1 11 1 1 1 1 1 1 1 1 1 1 1
200 200 200 200 200 200 200 200 200 200 200200
100 100 100 100 100 100 100 100 100 100 100100
50 50 50 50 50 50 50 50 50 50 5050
20 20 20 20 20 20 20 20 20 20 2020
10 10 10 10 10 10 10 10 10 10 1010
5 5 5 5 5 5 5 5 5 5 55
2 2 2 2 2 2 2 2 2 2 22
1 1 1 1 1 1 1 1 1 1 11
Seeding
Readout
Calculation
Results
Major applications
Number of wells with clonogenicgrowth (NCF) normalized on
total number of wells seeded (Ntotal)
Dilution series of cells seeded (S )
Number of colonies counted (C )
Demonstration of clonogenic growth in different cell systems
Analysis of clonogenic survivalof (cancer) cells upon
cytotoxic treatment
Qualitative demonstrationof clonogenic growth
in different cell systems
Analysis of clonogenicityof stem and precursor cells
Analysis of clonogenicity of stem and precursor cells
(in complex mixtures)
Number of wells with clonogenic growth
Number of wells with clonogenic growth failure
Exactly one cell per well in multiple wells
Dilution series of cells seeded in multiple wells
Seeded cell number (x ) with clonogenicgrowth failure in 37% of wells determined
(zero term of poisson distribution with λ = 1)
F0 = e–1
Percentage ofclonogenic cells ina cell population
Clonogenic self-renewal of different cellpreparations
Frequency ofclonogenic cells in
(mixed) cell populations
In general:power regressionand interpolation
No relevant cooperation:PE-based
normalization
Normalization on total number of wells seeded
Calculation via zero term ofpoisson distribution with λ = 1
Percentage of clonogenic survival upon treatment
normalized on PE(at non-matchedcolony numbers)
Clonogenic survival upon treatment calculated fromcell numbers seeded atmatched (interpolated)
colony numbers(Ctreated = Cuntreated)
Cx = axSxbx
100
37
14
5Fai
lure
frac
tion
(%)
Clonogenic survival of cytotoxic treatment
vs. control
Treatmentdose
Clo
noge
nic
surv
ival
(%
)
Per
cent
age
ofcl
onog
enic
cel
lsPop
ulatio
nA
Population A
Population B
Popula
tion
B
Clo
noge
nic
self-
rene
wal
Prepa
ratio
nA
Prepa
ratio
nB
No. of seededcells
PE =Cuntreated
Suntreated
= SF =Ctreated Suntreated
Streated Cuntreated
Clonogenicsurvival= SF =
Suntreated
Streated
Clonogenicsurvival =Percentage of
clonogenic cells
NCF
Ntotal
Frequency ofclonogenic cells at F0 = 1/x
a b c
F0(A)= 1/xA
F0(B )= 1/xB
100
Fig. 2 | Comparison of different assay principles to assess clonal cell growth. a, Clonogenic assays are typically performed in culture dishes withsurface areas of clearly more than 1 cm2 (e.g., six-well plates). Depending on the cell model system and the treatment(s) of interest, the number ofsingle cells seeded in the same well (S) can vary from <10 to several thousands. After an incubation period sufficiently long for clonogenic growth, thecolony counts (C) in each well are determined. Because multiple cells are seeded into each well, cellular cooperation is frequently observed. Twodifferent mathematical approaches for the calculation of SFs relative to controls exist as discussed in detail in the main text: power regression–basedanalysis and PE-based normalization. Depending on the scientific question of interest, the results are displayed as clonogenic survival upon cytotoxictreatment (at different doses), or a comparison of clonogenic self-renewing capacity of different cell preparations is shown. b and c, Similar toclonogenic assays, clonal assays (b) and limiting dilution assays (c) are used to determine the frequency of clonal single-cell growth. In contrast to theclonogenic assay, these are usually performed in smaller multi-well formats, such as 96-well plates. In the clonal assay (b), each well is equipped withexactly one single cell, thus excluding the occurrence of cellular cooperation. To determine the percentage of clonogenic cells in a population, thenumber of wells with clonal growth (NCF) is normalized to the total number of cells seeded (Ntotal). The primary readout of limiting dilution assays (c)differs from the other two assay principles. Here, multiple cell densities per treatment condition are plated to determine the fraction of wells withcolony-formation failure. With the use of Poisson statistics, the frequency of clonal cells in the cell population of interest can be inferred from thefailure fraction (F) according to the zero term of the Poisson distribution with the expected value λ = 1.
PROTOCOL EXTENSION NATURE PROTOCOLS
4 NATURE PROTOCOLS |www.nature.com/nprot

UNCORRECTED PROOF
98characteristics of the chosen culture medium and the phenomenon of cellular cooperation (Box 1))99were well known to the pioneers in the field of low-density cell culture and clonogenic survival but100moved out of scientific awareness afterwards2,3,20,21. In consequence, the nonconstancy of the PE and101its impact on the robustness of clonogenic survival analyses have been largely underestimated for a102long time. In clonogenic assays with cooperatively growing cell model systems, PE-based normal-103ization generates large assay-intrinsic errors, and alternative analysis algorithms that can account for104the impact of cellular cooperation need to be used17. The present protocol provides a mathematical105approach involving power regression and interpolation to address this issue. Although the pre-106requisite for this analysis workflow does not exceed simple linear regression (on log-transformed107values), it would have been harder to implement in the 1950s when survival data were commonly108fitted by hand. Nevertheless, it is inspired by Puck’s recommendations. In principle, it calculates how109many times more cells need to be seeded for a given condition to obtain identical numbers of colonies110to those seen under control conditions and thus corrects for varying degrees of cellular cooperation in111different dishes of the same experiment. This is fundamentally different from the PE-based workflow112whose use should be restricted to cell model systems that do not exhibit cooperative growth behavior113(Fig. 2a).
114Applications115The clonogenic assay can be undertaken on a wide spectrum of mammalian cells, including con-116tinuously growing established cancer cell lines, low-passage-number patient-derived tumor explant117cultures, purified primary cells and mixtures of cells from ex vivo tissue preparations. However, two118crucial conditions must be met. First, at least a fraction of cells within the population of interest needs119to be capable of undergoing a minimum of six cell divisions in vitro, giving rise to colonies of ≥50120cells. Second, (near-perfect) single-cell suspensions must be able to be generated from the cell121population of interest. The latter can usually be achieved by the use of cell strainers and enzymatic or122mechanical dissociation of the Q8cells. In contrast, the capacity of clonal growth may greatly depend on123the cell type as well as the in vitro culture conditions, and their optimization can be the most124challenging part of a clonogenic assay. Whereas satisfactory levels of clonogenic growth can be125commonly achieved for established cancer cell lines by using standard culture media as recommended126by the suppliers, more elaborate cell model systems may have complex requirements. For instance,127single cell–derived colonies of epidermal keratinocytes in vitro were obtained in adherent 2D128coculture with feeder cells at optimized density in basal medium supplemented with calf serum and129hydrocortisone5. In contrast, clonogenic in vitro growth of neural stem cells isolated from adult brain130tissue was first described by using nonadhesive culture dishes and serum-free medium supplemented131with epidermal growth factor6. These examples show that the applicability of the clonogenic assay132largely depends on whether suitable culture conditions for the colony-forming cells in the population133of interest can be identified. Particularly for cell mixtures of ex vivo tissue preparations, this may be134technically demanding but eventually possible. With emerging research interest in a given field,135commercially available culture media are being increasingly developed to facilitate this, even for cell136types with complex growth requirements37.
137Comparison between cell viability, clonal and limiting dilution assays138Unlike widely used cell viability assays, which assess the metabolic activity, reductive capacity and/or139energized status of cells38–42, the clonogenic assay detects only the proliferating fraction of cells that is140able to form colonies with ≥50 cells. This corresponds to a minimum of six cell divisions and is141considered as a surrogate for long-term, ‘unlimited’ proliferation. Commonly, clonogenic assays are142more time consuming and laborious than viability assays, and they can barely be automated.143Nevertheless, in various settings, it may not only be advantageous but even essential to quantify only144cells with long-term, ‘unlimited’ replicative potential instead of cell viability alone—for instance to145assess an in vitro relapse upon treatment with anti-cancer therapy or with the aim of identifying stem146(-like) cells in cell suspensions of ex vivo tissue preparations.147The primary readout of clonogenic assays is typically obtained by counting the numbers of148colonies that develop in different culture dishes (Fig. 2a). This raw dataset is subsequently used to149calculate the fraction of clonogenic cells as discussed below. Other assays that determine the cellular150self-renewing capacity with similar yet distinct conceptual setups and analysis workflows are clonal151and limiting dilution assays (Fig. 2b,c). For these assays, the primary readout of clonality is binary152because they distinguish only between samples with or without clonal growth, often followed by
NATURE PROTOCOLS PROTOCOL EXTENSION
NATURE PROTOCOLS |www.nature.com/nprot 5
UNCORRECTED PROOF
153morphological, biochemical and/or surface marker characterization of the colony-forming cells.154Accordingly, these assays are typically performed in smaller multi-well formats, such as 96-well155plates, with multiple wells per treatment condition. In the assay principle that is commonly referred156to as a ‘clonal assay’, a single cell per well is cultivated (e.g., by using micro-manipulation techniques),157and the number of wells exhibiting clonal growth is determined under a (stereo-)microscope43–45
158(Fig. 2b). Although this approach certainly measures bona fide clonality and naturally excludes159cellular cooperation between different cells of the donor population, it is very laborious and not160practical if the frequency of colony-forming cells is in the lower or sub-percentage range. In these161scenarios, the ‘limiting dilution assay’ is an alternative. It is particularly suitable for inferring fre-162quencies of colony-forming cells in heterogeneous cell mixtures (e.g., in ex vivo tissue preparations).163It was developed initially for the study of hematopoiesis and interrogates the occurrence of clonal164growth in serial dilutions of individual wells with different numbers of single cells seeded46–49
165(Fig. 2c). The limiting dilution assay may be helpful if a classical clonogenic assay with multiple166colonies grown in the same well is not feasible, not desired or excluded due to other reasons.167Mathematically, the analysis of limiting dilution assays relies on determining the failure fraction of168wells without clonogenic growth according to the Poisson distribution with an expected value λ = 1.169An easy-to-use online tool is readily available to facilitate the analysis50 (http://bioinf.wehi.edu.au/170software/elda/).
171Experimental design172The basic stages of the clonogenic assay are summarized in Fig. 3. Most importantly, two different173plating formats—adherent 2D growth and embedded 3D growth—are available. Moreover, if the174impact of cytotoxic treatments on clonogenic survival is tested as described below, it is additionally175necessary to choose between one of two plating options. In option A (pretreatment plating), a single-176cell suspension of a given cell type is generated from one donor culture, seeded into six-well plates (or177culture dishes), allowed to adhere and finally subjected to the treatment(s) of interest. In option B178(posttreatment plating), several donor culture flasks are subjected to the treatment(s) of interest, and179plating is performed either immediately afterwards or after a given time period, respectively. For both180options A and B, plates are filled with identical volumes of culture medium per well and are181subsequently incubated in a humidified CO2 incubator at physiological temperature for sufficient182time to allow surviving cells to form colonies of ≥50 cells (a minimum of six population doublings).183Finally, colonies are fixed, stained and counted before mathematical analysis is performed.
1842D and 3D plating formats of clonogenic assays185Adherent 2D growth is the most simple and most rapid technique that is commonly used for186adherently growing cell model systems, whereas 3D embedding of single cells in a semi-solid matrix187may be the option of choice if adherent clonogenic cell growth is either not possible or not desired. In188Reagent setup, we describe the use of agarose as gellant for embedded 3D clonogenic assays allowing189and/or requiring anchorage-independent growth, a feature of many stem(-like) cells. Moreover, agar190agar30,51,52 and methylcellulose31,32,53,54 have been used for this purpose. Similarly, preparations of191extracellular matrix allow embedded 3D colony growth55. This 3D assay format may be useful for192anchorage-dependent cells that are unable to grow in agar(-ose) and/or methylcellulose.193Numerous variations of the 3D embedded growth protocol exist. Usually, the single-cell sus-194pension of interest is plated onto a semi-solid bottom layer that may improve nutrient supple-195mentation. Moreover, growth-promoting or cytotoxic agents can be added on top of (or into) the196semi-solid matrix layers after (or during) plating (see Treatment options and Facilitation of colony197growth).198Further information on the advantages and limitations of the two assay formats is provided in199Table 1.
200Pretreatment plating (option A) versus posttreatment plating (option B)201Regarding the two common alternative plating options, it should be emphasized that both pre- and202posttreatment plating (Fig. 3) have distinct advantages in certain settings and, conversely, may be less203useful in others. Pretreatment plating usually requires less time than posttreatment plating if several204different conditions are tested (e.g., four to six different doses of ionizing radiation). Only one donor205culture flask and one dilution series thereof are necessary to equip all plates (condition(s) of interest206and controls) with the required numbers of seeded cells for one biological replicate. Yet, treatment
PROTOCOL EXTENSION NATURE PROTOCOLS
6 NATURE PROTOCOLS |www.nature.com/nprot

UNCORRECTED PROOF
207may be time consuming, for instance, when a large number of plates needs to be subjected to208radiation.209Conversely, posttreatment plating may be useful when many plates with one or very few identical210treatments are needed (e.g., treatment with only one dose of ionizing radiation versus control and211subsequent addition of pharmacological inhibitors). In this case, it is clearly less laborious to treat212large numbers of cells in separate culture flasks before preparing single-cell suspensions and the213derived dilution series to equip all plates (condition(s) of interest and control) of one experiment.214However, this plating protocol has an additional source of error that needs to be considered. Here, the215single-cell suspensions for each condition and for the controls as well as the dilution series thereof are216prepared independently from different (pretreated) donor cultures. This can give rise to relevant217unwanted variability in cell count, cell aggregation, cell adhesion, etc. Because of the resulting errors,218posttreatment plating may be inappropriate to detect relatively small survival differences between219treatments. For instance, the error of the counting procedure with a hemocytometer has been220reported to exceed 20% if only one count for each cell suspension is performed56.
Choose preferred assay formatand optimize assay parameters
Preparation of culture dishes
Generation of single-cell suspension and cell counting
Plating of cells
Treatmentafter plating
Incubation to allow colony formation
Fixation and staining
Poor growth
Colony counting
Determine degree of cellular cooperation
Cell model system of interestcells from in vitro culture
Ex vivo tissue preparation
No treatment Pre-treatmentplating
Post-treatmentplating (+/– recovery)
Strongb ≥ 1.6
Relevantb ≥ 1.2
Noneb ≈ 1.0
Treatmentbefore plating
Recovery
Design final experimentalsetup with PE-based
normalization
Design final experimentalsetup with power
regression–based analysis
Perform main experiment with optimized parametersand calculate clonogenic survival fractions
Box 2Box 3
Box 4
Box 1
Figure 6Figure 7Figure 8
Figure 4Figure 9
2D 2D 2D 2D3D 3D 3D 3D
Optimize assay parameters
Fig. 3 | Schematic overview of the different clonogenic assay procedures Q9.
NATURE PROTOCOLS PROTOCOL EXTENSION
NATURE PROTOCOLS |www.nature.com/nprot 7

UNCORRECTED PROOF
221Treatment options222Various treatments, including ionizing radiation, cytotoxic drugs, molecularly targeted agents, hyper-223thermia, nanoparticles, genetic manipulation, hydrostatic pressure, extracellular vesicles, killing by224cytotoxic immune cells and combinations thereof, have been tested in clonogenic assays7–14,53,57–59.225Depending on the cell model system and the severity of the treatment(s) of interest, the number of226S per dish may range from <101 to >105 cells per well. In the case of widely-used established cell lines,227the fraction of cells with clonogenic self-renewing capacity under suitable conditions without cyto-228toxic treatment is commonly in the double-digit percent range. Nevertheless, clonal growth of more229complex cell model systems and particularly cell suspensions from ex vivo tissue preparations may be230clearly below 1%, particularly after severe cytotoxic treatment, implying that the assay may not be231suitable for some applications.232With regard to combined-modality treatments, the treatment sequence may be of importance. For233instance, when combining a chemotherapeutic drug and ionizing radiation, the drug can be added234before or after irradiation. It can be removed after a certain time or left with the cells during the full235assay incubation period. In this scenario, the half-life of the drug in the culture medium as well as its236concentration in biologically relevant settings should be considered. If clonogenic survival is237exceedingly low, dose reduction and shortening of the drug incubation period may be helpful. In238general, seeding of single cells for adherent 2D growth in the presence of a potentially damaging drug239should be avoided because this may compromise the adhesion process. Moreover, additional240monotherapy control plates may be necessary for reasonable comparisons between treatments and241analyses of synergism. In 3D assay formats, soluble agents of interest can be integrated into at least242one of the semi-solid phases during plating. Alternatively, aqueous drug solutions can be added onto243the upper gel layer (once or repeatedly).
244Technical and mathematical assay optimization245We strongly recommend that preliminary assays be undertaken to optimize the key parameters before246setting up all the experimental conditions required for the main experiment. This optimization247includes (i) finding an appropriate method for the generation of (near-perfect) single-cell suspensions248(Box 2 and 3), (ii) defining suitable parameters that allow clonogenic growth under all conditions of249interest (see Facilitation of colony growth, Reagent setup and Box 4) and (iii) assessing the degree of250cellular cooperation (Box 1).251As soon as the pre-experimental procedure has been successfully completed, the optimized assay252parameters can be used for the main experiment. Actual experiments are typically performed by using253three or more independent biological replicates. At this step, the appropriate mathematical analysis254algorithm for the calculation of survival fractions (SFs) needs to be chosen (Fig. 2a and Box 1). If the255impact of cellular cooperation is negligible, SFs in response to the treatments of interest can be256calculated by normalization to the PE of the untreated controls:
PE ¼ Cuntreated=Suntreated
257258
SFtreated ¼ Ctreated=StreatedPE
Table 1 | Advantages and disadvantages of 2D and 3D clonogenic assay formats
Adherent 2D growth Embedded 3D growth
Advantages Easy and rapid seeding More physiological growth conditions
Less expensive than 3D embedded growth Biophysical limitation of cellular cooperation
Rapid colony counting Increased colony density because of reduced cell migration
Disadvantages Clonogenic potential may be abrogated by adherent growth(loss of stemness)
Clonogenic potential may be abrogated by embedding
Cellular cooperation occurs frequently More time and consumables required
Cell migration may result in dispersed colony growth Potential cell stress because of overheating (hot liquidagarose solution) and/or cooling (agarose gelling)
Limited in vivo relevance (2D growth) Complex counting procedure or surrogate readout (colonydiameter instead of cellularity)
PROTOCOL EXTENSION NATURE PROTOCOLS
8 NATURE PROTOCOLS |www.nature.com/nprot

UNCORRECTED PROOF
259260This mathematically simple approach can be advantageous, because only a few (typically one to261three) different cell densities per condition need to be plated. If, however, a nonlinear relationship262between S and C for any condition of interest is observed, PE-based normalization generates large to263enormous systematic errors that are not amenable to statistical error analysis17. This is commonly the264case for b values ≥1.2. Under these conditions, we recommend power regression-based analysis265according to C = a × Sb, which is applicable without restriction because it accounts for the effects of266cellular cooperation and thus provides clonogenic survival results of improved robustness. For each267treatment condition, this approach requires at least five different S values to be seeded giving rise to C268values in the range of ~5–100 colonies. Here, the calculation of SFs does not rely on a fixed PE of the
Box 2 | Generating single-cell suspensions from cells of different origin
To generate single-cell suspensions from cells grown in vitro, follow option A below. Use option B to generate single-cell suspensions from ex vivotissue preparations. We use option A for A-549 and EFM-19 cells.Clonogenic assays are designed to quantify clonal single-cell growth. Therefore, it is crucial that the cells are plated in single-cell suspensionswithout any aggregates. Plating of cell clusters instead of single cells undermines the ability to measure truly clonogenic growth and results inoverestimation of SFs at low to intermediate treatment doses73,74. Depending on the origin of the cells to be tested, very different protocols may beused to obtain (near-perfect) single-cell suspensions of which two common options are briefly described in this box. Suspension cell lines andsuspensions of ex vivo preparations (e.g., hematopoietic cells or cells from effusions) often contain few or no cell aggregates. Nevertheless,mechanical and/or enzymatic disruption of cell clusters may also be achieved by using the techniques described below.(A) Generation of single-cell suspensions from adherent cells grown in culture ● Timing 10–45 min
Additional materials required● Cell detachment reagent, such as 0.05% (wt/vol) trypsin/EDTA (0.5% (wt/vol) stock solution (e.g., from Thermo Fisher Scientific, cat. no.15400054) can be diluted 1 + 9 in PBS) or TrypLE Express (Thermo Fisher Scientific, cat. no. 12604039). We use 0.05% (wt/vol) trypsin/EDTA for A-549 and EFM-19 cells.
● (Optional) Cell strainers, e.g., 30-µm mesh size (Miltenyi, cat. no. 130-110-915)
Procedure1 Remove culture medium from the donor culture and wash cells twice with PBS.2 Remove PBS and add the detachment agent (e.g., 1 ml of 0.05% (wt/vol) trypsin solution per 60-cm2 flask surface for A-549 and EFM-19
cells) without damaging the cells. Ensure that the cell detachment reagent covers the entire bottom of the flask.3 Incubate at 37 °C. Repeatedly check whether cells round up and detach by using a microscope. Depending on the cell type, washing
procedure and cell density, cell detachment takes 3–30 min and may be accelerated by gently tapping the side of the culture flask. Wefind it usually takes 8–15 min for A-549 and EFM-19 cells.
4 Inactivate cell detachment reagent by adding a sufficient amount of FCS containing culture medium or a trypsin inhibitor solution.Transfer the cell suspension to a sterile 50-ml centrifuge tube.
5 Generate viable single-cell suspensions by using a method optimized for your cells. For example, we triturate the A-549 or EFM-19 cellsuspension several times with a serological pipette to dissociate cell aggregates. Avoid formation of air bubbles.
6 Using a microscope, check if a (near-perfect) single-cell suspension was obtained. If necessary, proceed with other measures for thegeneration of a single-cell suspension of the given cell type, such as centrifugation of the cells (300g and 5 min are suitable for most celltypes) and subsequent washing in 20 ml of PBS. In case of strong cell aggregation, cell strainers with mesh sizes of ≤30 µm may also behelpful. Ensure that the suspension is free from cell aggregates before proceeding. We usually obtain a (near-perfect) single-cellsuspension for A-549 cells without other measures than those described in step A(v). For EFM-19 cells, we additionally wash the cells in20 ml of PBS and triturate several times.? TROUBLESHOOTING
7 Resuspend the single-cell suspension in culture medium and proceed with cell counting.(B) Generation of single-cell suspensions from ex vivo tissue preparations ● Timing several hours, depending on the digestion protocol
Additional materials required● (Optional) Sterile scalpels (e.g., neoLab, cat. no. 1-1409), tissue homogenizers (e.g., Miltenyi, cat. no. 130-095-937) or cell strainers with30–100-µm mesh size (e.g., Miltenyi, cat. nos. 130-110-915 and 130-098-463)
● Tissue-specific digestion kit or customized combination of tissue digestion reagents, such as collagenase, hyaluronidase and DNAsepreparations (an overview can be found at https://www.sigmaaldrich.com/DE/de/products/protein-biology/proteins-and-enzymes)
Procedure1 Aseptically transfer the ex vivo preparation of tissue to a fresh culture dish or tube containing PBS or suitable culture medium to preventdehydration.
2 Generate a viable single-cell suspension from the primary tissue preparation. Single cells can be liberated by a combination of mechanicalmeasures (cutting, tissue homogenization, cell straining and repeated pipetting) and enzymatic digestion by using customized enzymepreparations or commercially available tissue type–specific digestion kits. Further enrichment of the cell population(s) of interest can beachieved by cell surface marker–based purification by using magnetic-activated cell sorting or FACS. Ensure that the suspension is freefrom cell aggregates before proceeding.
3 Using a microscope, check if a (near-perfect) single-cell suspension was obtained. If necessary, proceed with other measures for thegeneration of a single-cell suspension of the given cell type, such as centrifugation of the cells (300g and 5 min are suitable for most celltypes) and subsequent washing in 20 ml of PBS. In case of strong cell aggregation, combinations of cell strainers with decreasing meshsizes may also be helpful. Ensure that the suspension is free from cell aggregates before proceeding.? TROUBLESHOOTING
4 Transfer the single-cell suspension to a sterile 50-ml centrifuge tube.5 (Optional) Wash the cells in 20 ml of PBS.6 Resuspend the single-cell suspension in culture medium and proceed with cell counting.
NATURE PROTOCOLS PROTOCOL EXTENSION
NATURE PROTOCOLS |www.nature.com/nprot 9

UNCORRECTED PROOF
269untreated controls. Instead, clonogenic survival is obtained via power regression and interpolation of270matched colony numbers under untreated and treated conditions (Fig. 4).271To eliminate the error that originates from violating the linearity assumption for S-C variable272pairs, the SFs resulting from the condition(s) of interest are calculated by determining Suntreated/Streated273ratios of matched colony numbers (Cuntreated = Ctreated). Power regression according to C = a × Sb is274used to model the number of C in dependence of the number of S and to estimate the corresponding275parameters a and b (Fig. 4a). With these parameters, S values (Suntreated and Streated) are interpolated,276and SFs at matched colony numbers are calculated via:
SFtreated ¼ SuntreatedStreated
¼ explog C
auntreated
� �
buntreated�log C
atreated
� �
btreated
0@
1A
277278We suggest performing the calculation for C = 20 (Fig. 4b), reflecting a number of colonies that279can typically be observed under various treatment conditions in clonogenic assays. For a detailed280derivation of the formula, see Brix et al.17.281An illustration of the entire assay optimization procedure and an actual experiment with an282established human breast cancer cell line is depicted in Fig. 5.
283Facilitation of colony growth284For various cell model systems, particularly primary cells, standard culture media may be suboptimal285with regard to single-cell growth. This is usually reflected by poor colony growth even in complex286media, which is often accompanied by very high degrees of cellular cooperation (Box 1). In specific287settings, it might therefore be advisable and/or necessary to modify single-cell culture conditions to288obtain sufficient colony growth under all relevant treatment conditions of interest. This can be
Box 3 | Cell counting ● Timing 5–10 min
The accurate determination of viable single-cell counts is critical for clonogenic survival experiments. To date, hemocytometers are the cheapestoption of manual cell counting for which the Neubauer Improved Chamber is very commonly used. The 3 × 3 mm2 laser-etched gridded area of thishemocytometer consists of nine squares of 1-mm2 size (and with properly mounted coverslip, 100-nl volume) each. Nucleated mammalian cellsare typically counted in the four corner squares (Fig. 5e,f): a coverslip is mounted onto the chamber, the cell suspension is loaded by capillaryaction and the cell count is determined as described below. Exclusion of dead cells is achieved by mixing the single-cell suspension with, forinstance, trypan blue, a vital stain that is exclusively taken up by dying and dead cells.Automated alternatives to hemocytometer-based manual cell counting are available. Although more expensive, these devices facilitate rapid andreliable cell counting. They use different detection principles, such as resistive pulse sensing, photo-microscopy with integrated digital analysis andflow cytometry–based optical analysis with laser detection72. In specific settings, the latter technique may be particularly relevant for the analysisof colony-forming cells because it allows the combination of cell counting with FACS of relevant subpopulations in a cell suspension31,53.
Manual cell counting with a Neubauer Improved ChamberAdditional materials required● Small aliquot of the single-cell suspension as generated according to Box 2● 0.4% (wt/vol) trypan blue solution (e.g., Sigma-Aldrich, cat. no. T8154)! CAUTION Trypan blue is toxic. Handle with care and always wear protective gloves.
● Neubauer Improved Chamber (e.g., BRAND, cat. no. 717805)
Procedure1 Prepare two independent 1:1 dilutions of the single-cell suspension of interest with 0.4% (wt/vol) trypan blue and mix gently (e.g., 40 µl ofsuspension + 40 µl of trypan blue in a fresh microcentrifuge tube). Incubate for 1–2 min at room temperature.
2 Prepare the Neubauer Improved Chamber by making the coverslip and chamber humid and mounting the coverslip properly onto the chamber.Newton’s rings should be visible.
3 Load 10 µl of the diluted single-cell suspension to each side of the chamber by using a 2–20-µl micropipette and check if the coverslip is still inplace. Avoid air bubble formation.? TROUBLESHOOTING
4 Count the viable cells within the four corner squares at 40-fold magnification. Exclude dark blue (i.e., trypan blue–positive) cells and debris.Count only cells touching two of the four outer grid lines of each 1-mm2 square and note the total cell count of both chambers.? TROUBLESHOOTING
5 Clean the Neubauer Improved Chamber in 70% (vol/vol) ethanol and let dry. Repeat steps 2–4 to obtain two more counting results.6 Determine the average cell counts of all sixteen 1-mm2 squares from four independent countings.7 Calculate the concentration of viable single cells with the following formula. Consider the dilution factor of 2 for the 1 + 1 dilution in trypan blue.
Note that the total volume in one 1-mm2 square is 100 nl.
c ¼ Mean viable cell count of all 1mm2 squares100 nl
´ dilution factor
PROTOCOL EXTENSION NATURE PROTOCOLS
10 NATURE PROTOCOLS |www.nature.com/nprot

UNCORRECTED PROOF
289achieved with one of the following options or combinations thereof. Note that these additions to the290procedure may be rather time consuming, and optimal adaptations are often based on mostly291unknown individual requirements of the cell model system of interest.
292Optimization of culture medium. The formulations of standard culture media differ considerably with293regard to the composition of ingredients and their concentrations60. Cell growth of a specific cell type294may be greatly facilitated by using another medium formulation and/or additives (such as fetal calf295serum, bovine pituitary extract, recombinant growth factors, hormones, etc.). Of note, many addi-296tives, such as fetal calf serum and growth factor supplements, may exhibit substantial variability297across providers, preparations and batches.
298Conditioned media. An enrichment of factors supporting or necessary for clonogenic single-cell299growth can be obtained by use of cell-free conditioned media from high-density cell cultures of the300cell type of interest or an unrelated cell type that is known to secrete growth-promoting factors301suitable for the cell type to be analyzed. Conditioned media have been successfully used since the very302first mammalian single-cell growth experiments16,17. If standardization of the conditioned media is303desired, basic parameters, such as cell density after seeding, cell-to-volume ratio, conditioning time
Box 4 | Single-cell plating
Use the single-cell plating technique compatible with the selected assay format, ensuring that cells remain in a single-cell suspension (preparedaccording to Box 2). Proceed with option A below for adherent 2D growth. Follow option B for embedded 3D growth.(A) Plating of cells for adherent 2D growth in liquid medium ● Timing 20 min + cell adhesion time
Additional materials required● Culture dishes with liquid medium, as prepared according to Reagent setup● 50-ml centrifuge tubes with single-cell suspensions of appropriate dilutions for plating as generated according to Box 2 and 3
Procedure1 Remove the prefilled six-well plates from the incubator.2 Using a micropipette and the single-cell suspensions of appropriate concentrations, add the indicated number of cells into the respective
wells containing 2 ml of medium. Unequal final volumes at this stage are acceptable if the culture medium is refreshed before starting themain incubation step.
3 Distribute the cells evenly by moving the six-well plates several times in the x-y direction. Check homogeneous distribution under themicroscope.
c CRITICAL STEP When cells are not distributed evenly, colony counting will be compromised.4 Place the six-well plates into a humidified incubator for adhesion (physiological temperature and culture medium–matched CO2
concentration). Depending on the cell type, this may take 2–20 h. Generally, 3–4 h are required for A-549 cells and 4–6 h for EFM-19cells. Additional control plates may be helpful to enable regular checking under the microscope whether cells are adherent. Proceed assoon as adhesion of the vast majority (>90%) of cells is completed. Avoid exceedingly long adhesion times if subsequent treatment ofsingle cells is desired because these may rapidly restart proliferation after plating. Treatment of cell clusters instead of single cells resultsinQ10 overestimation of SFs at low to intermediate treatment doses 73,74.? TROUBLESHOOTING
(B) Plating of cells for embedded 3D growth ● Timing 30 min + time for matrix gellingAdditional materials required● Liquid 4% (wt/vol) agarose stock solution (or other desired embedding matrix) and culture dishes with a bottom layer of semi-solidmedium prepared as described in Reagent setup
● 50-ml centrifuge tubes with single-cell suspensions of appropriate dilutions for plating, generated as described in Box 2 and 3
Procedure1 Keep agarose solutions and single-cell suspensions at 37 °C. Dilute all single-cell suspensions 9 + 1 with 4% (wt/vol) agarose. Mix theresulting suspensions containing 0.4% (wt/vol) agarose and immediately store at 37 °C.
c CRITICAL STEP A heating device is required to keep agarose solutions, culture medium and the single-cell suspensions at 37 °C. Higheror lower temperatures will damage the cells or cause premature solidification of agarose, respectively.
2 Add 1 ml of suitable single-cell suspension to the solid bottom layer of each well of the cooled prepared culture dishes. Avoid air bubbleformation. Work quickly to avoid premature agarose gelling.? TROUBLESHOOTING
3 Distribute the suspension evenly by moving the six-well plates several times in the x-y direction.4 Allow gelling of the 0.4% (wt/vol) agarose layer containing the embedded single cells on a balanced, flat surface for 30–45 min at room
temperature.? TROUBLESHOOTING
5 Add 100–200 µl of liquid culture medium (optionally containing cytotoxic agent(s) of interest) to each well to prevent dehydration of thegels. This step may be repeated after several days if long assay incubation times are required.
6 Place the six-well plates into a humidified incubator for equilibration (physiological temperature and medium-matched CO2
concentration). Avoid exceedingly long incubation times if subsequent treatment of single cells is desired because proliferation mayrestart rapidly after plating. Treatment of cell clusters instead of single cells results in overestimation of SFs at low to intermediatetreatment doses73,74.
NATURE PROTOCOLS PROTOCOL EXTENSION
NATURE PROTOCOLS |www.nature.com/nprot 11

UNCORRECTED PROOF 304and storage, should be harmonized. An example of a procedure to generate conditioned media by
305using the cell line A-549 is given in Reagent setup.
306Feeder cells. Similar to conditioned media, the use of feeder cells is intended to supply single cells in a307clonogenic assay experiment with sufficient amounts of growth-promoting factors needed for pro-308liferation. Feeder cells can additionally provide cell-to-cell contacts (depending on whether physical309barriers between the feeder cells and the cells of interest are used or not). This measure was used in310the first clonogenic experiments by Puck and colleagues, and many slightly adapted protocols for311these co-culture systems have been developed. Unintentional scoring of feeder cell–derived colonies312needs to be excluded. This can be achieved by using feeder cells that are per se unable to form313colonies (e.g., due to mitotical inactivation) and/or by avoiding misidentification of colonies due to314morphological differences between the two cell types3,4,54.
315Embedding of cells in semi-solid matrices. Whereas assay optimization according to any of the three316aforementioned measures results in improved ‘external’ growth factor supply, it is also possible to317limit the extent of diffusion by increasing the viscosity of the culture medium. This enhances the318pericellular halo of growth factors produced by the cell type of interest3. Although not systematically319analyzed yet, this technique is likely to reduce the impact of cellular cooperation. Loss of cell-derived320growth factors can be prevented by embedding and/or overlaying single cells by using semi-solid321matrices of which agar agar, agarose, methylcellulose and extracellular matrix preparations have been322used most frequently. As discussed above, this standard technique has been extensively used for 3D323clonogenic assays but was already recommended by Puck and colleagues in very early 2D clonogenic324experiments3,27–29.
325Limitations of clonogenic assays326Optimization of assay parameters and colony counting327The pre-experimental procedure of this protocol is intended to develop a clonogenic assay design and328optimized culture conditions that allow ideal or at least acceptable clonal growth of single cells. It329should, however, be kept in mind that clonogenic growth of a given cell model system can be330obtained by using differing conditions, including liquid or semi-solid culture media with varying331nutrient and growth factor composition, additives, viscosity, etc. Consequently, clonogenic survival332data should be interpreted with care, and the biochemical and biophysical context in which they were333generated should be considered. A comparison of survival analyses obtained across different334experimental parameters may be misleading, because this type of variability is not accounted for61.
Suntreated
ControlTreatment dose 1Treatment dose 2Treatment dose 3Treatment dose 4Treatment dose 5
Cells seeded (S ) Treatment dose
Col
onie
s co
unte
d (C
)
Clo
noge
nic
surv
ival
(%
)
a b
Average C valuesacross biologicalreplicates
Streated
SF =
Determine SFvalues for eachtreatment doseat C = 20
Cx = axSxbxC0 = a0S0
b0
Perform powerregression for alltreatment conditions
Estimate parametersa and b
MeansReplicates
C = 100
C = 20
C = 5
S0 for C = 100
S0 for C = 20
Sx for C = 5
Sx for C = 100
Sx for C = 20
S0 for C = 5
100
Fig. 4 | Scheme depicting the principle of power regression–based clonogenic survival data analysis. a, For any treatment condition of interest, ≤12variable pairs of S and C are acquired. Each single data point in the left panel corresponds to the colony count obtained from one well in a six-well dishof one biological replicate. For controls (S0-C0 pairs of values) and each treatment of interest (Sx-Cx pairs of values), C values are averaged across allbiological replicates, power regression (i.e., linear regression on log-transformed values) according to C = a × Sb is performed and the parameters aand b are estimated. Note that any power function appears linear when plotted on a double-logarithmic scale. The SFs for any treatment are calculatedby the Suntreated/Streated ratios at matched C values. We suggest using C = 20, because this reflects a colony number that can be typically observedunder various treatment conditions. b, Clonogenic survival in dependence of the treatment dose as calculated according to a for C = 20 plotted withsemi-logarithmic scaling, standard deviation approximated via error propagation of regression parameters and superimposed linear-quadratic fitting.This scheme was constructed on the basis of a hypothetical dataset.
PROTOCOL EXTENSION NATURE PROTOCOLS
12 NATURE PROTOCOLS |www.nature.com/nprot

UNCORRECTED PROOF
Control Treatment 1 Treatment 2
0 4
Cell density #1 (lowest) 46 316
Cell density #2 68 464
Cell density #3 100 681
Cell density #4 147 1,000
Cell density #5 215 1,468
Cell density #6 316 2,154
Cell density #7 464 3,162
Cell density #8 681 4,642
Cell density #9 1,000 6,813
Cell density #10 1,468 10,000
Cell density #11
Cell density #12 (highest)
Cell density #1 (lowest) 1.667 2.500
Cell density #2 1.833 2.667
Cell density #3 2.000 2.833
Cell density #4 2.167 3.000
Cell density #5 2.333 3.167
Cell density #6 2.500 3.333
Cell density #7 2.667 3.500
Cell density #8 2.833 3.667
Cell density #9 3.000 3.833
Cell density #10 3.167 4.000
Cell density #11
Cell density #12 (highest)
Enter name of experiment below
EFM-19
log(S-values)
a
g
n
b
h
c
i
d
j
e
k
f
l m1 mm 1 mm
4 Gy
S C316 1464 1681 21,000 91,468 62,154 213,162 354,642 586,813 10810,000 220
Control
S C46 368 8100 6147 13215 22316 31464 69681 1191,000 2201,468 355
EFM-19 cells: freshly thawed and cultivatedd1 after thawing
Seeding of cells for pilot experiment to determine the degree of cellular cooperation
EFM-19 cells: freshly thawed and cultivatedd7 after thawing
Clonogenic growth on d12: colony size still too small
Initial test: generation of a single-cell suspensionwith suboptimal results
Clonogenic growth on d28:colony size appropriate
Optimized generation of a single-cell suspensionwith near-perfect results
Fixation and staining with methylene blue solution
Cell counting: trypan blue–stained cellsuspension in a neubauerimproved chamber
Staining results Colony counting Colony-counting results and obtainedS-C value pairs
Cell-counting results
Seeded cells (S) Replicate 1 Replicate 2 Replicate 3
Control
46 3 5 9
68 8 6 3
100 6 14 12
147 13 18 16
215 22 22 21
316 31 49 45
464 69 78 80
681 119 122 134
1,000 220 172 199
1,468 355 260 315
Seeded cells (S) Replicate 1 Replicate 2 Replicate 3
Treatment 1
316 1 0 3
464 1 5 0
681 2 6 5
1,000 9 5 9
1,468 6 6 7
2,154 21 13 19
3,162 35 28 50
4,642 58 64 84
6,813 108 146 143
10,000 220 157 310
0
4
EFM-19
Control Treatment 10 4
Surviving fraction SF for C = 20 (%) 100 7.90Uncertainty sd(SF) (%) 0 0.59
Upper bound (95%) (%) 9.14Lower bound (95%) (%) 6.83
log10(SF) 0 –1.102Uncertainty sd(log10(SF) 0 0.032
Upper bound (95%) –1.039Lower bound (95%) –1.165
b-value of fit 1.22 1.52R-squared (log(S) vs. log(C)) 0.985 0.982
o p
q
Mathematical analysis with the CFAcoop MS-excel template fileresults tab:extract all results of interest: mean surviving fractions, estimated uncertainties, b values, and R2 of power regression.
Mathematical analysis with the CFAcoop MS-excel template filebasic information tab:enter the cell numbers used for both treatment conditions (0 and 4 Gy).
Mathematical analysis with the CFAcoop MS-excel template filedata input tab:enter the colonies counted for all independent replicates of both treatment conditions (0 and 4 Gy). Mathematical
analysis: plot finalresults.
0 Gy 4 Gy1
10
100
Clo
noge
nic
surv
ival
(%
)
Counting results for two independent 1 + 1 dilutions of the cellsuspension in trypan blue staining solution
Chamber1 2 3 4
The viable single-cell concentration of the cell suspension is
Viable cells in four 1-mm2 squares (100 nl each)169142175194
Average cell count (in 100 nl) = = 42.5 cells169 + 142 + 175 + 1944
c = × 2 = 850,000 cells/ml42.5 cells100 nl
3 mm
Fig. 5 | An example of the assay optimization procedure for a breast cancer cell line grown in adherent 2D growth. a and b, EFM-19 cells(RRID: CVCL_0253) were thawed and cultivated in T175 flasks for 8 d at 37 °C and 5% CO2 in 1× RPMI 1640 medium with GlutaMAX supplementedwith 10% (vol/vol) FCS and 1% (vol/vol) penicillin-streptomycin. The images show the cells on day (d) 1 and d7 after thawing. c, An initial testwith the cells was made to generate a viable single-cell suspension and to determine whether adherent 2D clonogenic growth can be observedwhen seeding the cells in their standard culture medium without further additives or embedding. Cells were washed twice in PBS and trypsinized for8 min at 37 °C by using 3 ml of 0.05% (wt/vol) trypsin. After detachment and gentle agitation of the culture flask, trypsin was inactivated by using7 ml of culture medium, and the suspension was triturated several times with a serological pipette. Small clusters of cells were observed, indicatingthat the single-cell nature of the suspension was not suitable for plating. d, Cells shown in c were transferred to a 50-ml tube, centrifuged (300g and5 min), washed once in 20 ml of PBS and triturated several times. After resuspending the cells in 5 ml of fresh medium, a (near-perfect) single-cellsuspension was obtained as shown. e, The concentration of viable, trypan blue–negative single cells in the suspension from d was determined with aNeubauer Improved Chamber as described in Box 3. f, A typical example of a 1-mm2 square of the loaded chamber is depicted. A concentration of8.5 × 105 cells/ml was obtained (see the figure for the calculation). 1 ml of this solution (i.e., 8.5 × 10⁵ cells) was diluted in culture medium to a finalconcentration of 105 cells/ml in a fresh 50-ml tube. This suspension was mixed, and serial 1 + 9 dilutions with 104 cells/ml and 103 cells/ml weregenerated. g, Four six-well culture dishes (2 ml of medium/well) were prepared to examine clonogenic growth as well as the degree of cellularcooperation under control conditions and the treatment of interest (irradiation with 4 Gy and untreated control). Suitable numbers of cells (46–21,500cells/well) were plated into the dishes and distributed evenly by moving the plates in the x-y direction. Adherence of cells was allowed for 4 h (37 °C,5% CO2 and humidified atmosphere), and the great majority of the single cells was adherent afterwards. The medium was refreshed (2 ml/well),and x-ray treatment of 4 Gy plates was performed before starting the incubation period for colony growth. Mock-irradiated cells served as 0 Gycontrols. h, After 12 d, clonogenic growth on control plates was checked. Several colonies had formed, but these were still very tiny and often below 50cells, indicating that further incubation of the plates was necessary. i, On day 28, EFM-19 colonies of adequate size had developed. j, The culturemedium was poured off, and EFM-19 colonies were carefully fixed and stained for 1 h at room temperature with 2 ml of 0.8% (wt/vol) methylene bluesolution per well. The staining solution was re-collected, and the plates were carefully rinsed in warm tap water and subsequently placed in a dryingcabinet (70 °C). k and l, Colony counting was performed with a stereomicroscope at 8–30× magnification by using a fine-tip lab marker. 10 ofthe 12 cell densities initially seeded (S) resulted in wells with countable numbers of colonies (C) for both control and treated plates. m, Datasetshowing the S-C value pairs obtained from the counting procedure as shown in k and l (four independent biological replicates; data taken from ref. 17).n–p, Mathematical analysis with the supplied MS Excel template file CFAcoop. q, Final graph obtained from the clonogenic assay experiment by usingthe raw data shown in m–o.
NATURE PROTOCOLS PROTOCOL EXTENSION
NATURE PROTOCOLS |www.nature.com/nprot 13

UNCORRECTED PROOF
335This is particularly important when comparing 2D and 3D clonogenic assay formats, which can lead336to conflicting results (Table 1)55,62.337The reliability of clonogenic survival results is further affected by other parameters that cannot be338universally standardized. First, the incubation time chosen to allow colony formation is subjective and339can in part depend on the experience and the personal preferences of the researcher. Importantly, if340insufficient time is allowed for colony formation, the efficacy of a cytotoxic treatment of interest with341regard to the abrogation of clonogenic survival can be overestimated. In this case, small and slowly342growing colonies that are typically overrepresented on plates with harsh treatment conditions may be343overlooked. Conversely, very large and partially confluent colonies resulting from exceedingly long344incubation periods will complicate and/or disturb proper data analysis. We recommend optimizing345the incubation period in pilot experiments of the pre-experimental procedure. For all conditions of346interest, the colony-formation incubation time should be synchronized and be sufficiently long to347allow at least six population doublings (even with the harshest treatment) without giving rise to348overgrown control plates.349In addition, data quality may be compromised by errors occurring during colony counting.350Colonies can vary substantially in size and shape depending on the cell line and the treatment of351interest (Figs. 6–8). Even within one cell line and without any further treatment, colonies can have a352very diverse appearance (Fig. 6b). Moreover, it may not always be clear whether a given structure of353≥50 cells represents exactly one colony. Fusions between colonies, cell migration phenomena and354overgrown plates may render data acquisition difficult (Fig. 7). Finally, the occurrence of huge,355morphologically altered, mostly treatment-induced, senescent and/or other forms of giant cells may356confound the (non-)clonogenicity of a cell cluster (Fig. 8). Accordingly, we recommend performing357colony scoring with the greatest care and with the help of a stereomicroscope. This is of particular358importance when using 3D assay formats where colony growth must be analyzed in different layers of359a given well55.360Even experienced researchers may need to practice the critical colony-counting step with every361new cell model of interest. Importantly, we strongly discourage using workflows that solely quantify
1
4
7
2
5
8
3
6
1: BT-474 (RRID: CVCL_0179)2: Cal-27 (RRID: CVCL_1107 )3: Cal-33 (RRID: CVCL_1108)4: A172 (RRID: CVCL_0131)5: MDA-MB-436 (RRID: CVCL_0623 )6: HCC-1937 (RRID: CVCL_0290)7: MDA-MB-231 (RRID: CVCL_0062)8: U87-MG (RRID: CVCL_0022)
>104 cells>103 cells>103 cells>103 cells±150 cells±150 cells±500 cells±150 cells
500 μm
Circular Semi-regular AmorphousH
igh
dens
ityM
ediu
m d
ensi
tyLo
w d
ensi
ty
Shape
Den
sity
a b
500 μm
Fig. 6 | Colony morphology displays substantial inter- and intra-cell line heterogeneity. a, Typical colony morphologies of eight different cell lines ofbreast cancer (BT-474, RRID: CVCL_0179; MDA-MB-436, RRID: CVCL_0623; HCC-1937, RRID: CVCL_0290; MDA-MB-231, RRID: CVCL_0062),head and neck squamous cell carcinoma (Cal-27, RRID: CVCL_1107; Cal-33, RRID: CVCL_1108) and glioblastoma (A172, RRID: CVCL_0131; U87-MG,RRID: CVCL_0022) under untreated conditions are depicted (20× magnification; images were collected from colony-formation assays prepared forref. 17). Colonies displayed a high level of inter-cell line heterogeneity with regard to the overall shape of the colony (circular, semi-regular oramorphous) and the density of the colony-forming cells within a colony (high, medium or low). Despite the similar size of all colonies, the overallnumber of cells within the different types of colonies differed enormously. b, Illustration of intra-cell line heterogeneity of colony morphology andsize in the pancreatic cancer cell line L3.6pL (RRID: CVCL_0384) under untreated conditions. Circular colonies with high cell density as well assemi-regular and amorphous colonies of different cell density were observed (20× magnification).
PROTOCOL EXTENSION NATURE PROTOCOLS
14 NATURE PROTOCOLS |www.nature.com/nprot
UNCORRECTED PROOF
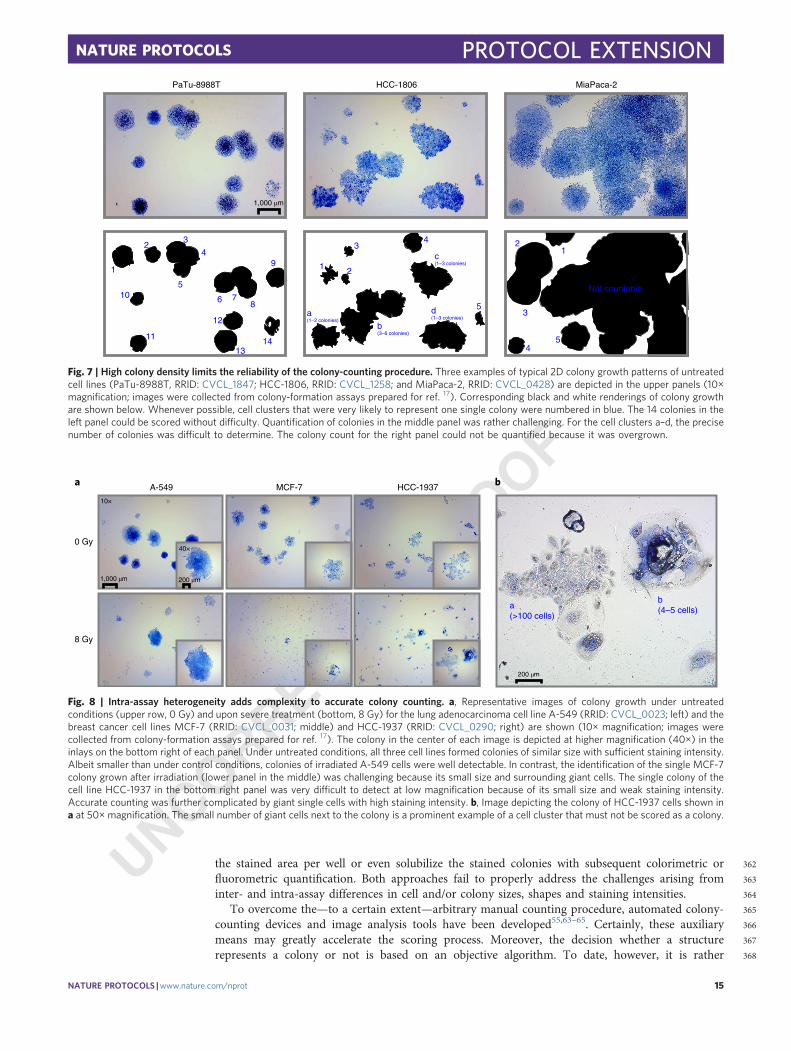
362the stained area per well or even solubilize the stained colonies with subsequent colorimetric or363fluorometric quantification. Both approaches fail to properly address the challenges arising from364inter- and intra-assay differences in cell and/or colony sizes, shapes and staining intensities.365To overcome the—to a certain extent—arbitrary manual counting procedure, automated colony-366counting devices and image analysis tools have been developed55,63–65. Certainly, these auxiliary367means may greatly accelerate the scoring process. Moreover, the decision whether a structure368represents a colony or not is based on an objective algorithm. To date, however, it is rather
1 2
34
5
1
b(3–6 colonies)
c(1–3 colonies)
d(1–3 colonies)
a(1–2 colonies)
1
23
4
6 7
5
11
10
9
8
12
1314
1,000 μm
PaTu-8988T HCC-1806 MiaPaca-2
2
3
45
Not countable
Fig. 7 | High colony density limits the reliability of the colony-counting procedure. Three examples of typical 2D colony growth patterns of untreatedcell lines (PaTu-8988T, RRID: CVCL_1847; HCC-1806, RRID: CVCL_1258; and MiaPaca-2, RRID: CVCL_0428) are depicted in the upper panels (10×magnification; images were collected from colony-formation assays prepared for ref. 17). Corresponding black and white renderings of colony growthare shown below. Whenever possible, cell clusters that were very likely to represent one single colony were numbered in blue. The 14 colonies in theleft panel could be scored without difficulty. Quantification of colonies in the middle panel was rather challenging. For the cell clusters a–d, the precisenumber of colonies was difficult to determine. The colony count for the right panel could not be quantified because it was overgrown.
1,000 μm 200 μm
A-549
0 Gy
8 Gy
MCF-7 HCC-1937
10×
40×
a b
200 μm
a(>100 cells)
b(4–5 cells)
Fig. 8 | Intra-assay heterogeneity adds complexity to accurate colony counting. a, Representative images of colony growth under untreatedconditions (upper row, 0 Gy) and upon severe treatment (bottom, 8 Gy) for the lung adenocarcinoma cell line A-549 (RRID: CVCL_0023; left) and thebreast cancer cell lines MCF-7 (RRID: CVCL_0031; middle) and HCC-1937 (RRID: CVCL_0290; right) are shown (10× magnification; images werecollected from colony-formation assays prepared for ref. 17). The colony in the center of each image is depicted at higher magnification (40×) in theinlays on the bottom right of each panel. Under untreated conditions, all three cell lines formed colonies of similar size with sufficient staining intensity.Albeit smaller than under control conditions, colonies of irradiated A-549 cells were well detectable. In contrast, the identification of the single MCF-7colony grown after irradiation (lower panel in the middle) was challenging because its small size and surrounding giant cells. The single colony of thecell line HCC-1937 in the bottom right panel was very difficult to detect at low magnification because of its small size and weak staining intensity.Accurate counting was further complicated by giant single cells with high staining intensity. b, Image depicting the colony of HCC-1937 cells shown ina at 50× magnification. The small number of giant cells next to the colony is a prominent example of a cell cluster that must not be scored as a colony.
NATURE PROTOCOLS PROTOCOL EXTENSION
NATURE PROTOCOLS |www.nature.com/nprot 15

UNCORRECTED PROOF
369questionable whether even sophisticated algorithms are able to detect colonies with sufficient370specificity and sensitivity under challenging conditions that might occur in clonogenic survival371experiments (Figs. 7 and 8). The mentioned inter- and intra-cell line heterogeneity with regard to372colony size, morphology and staining intensity upon different treatments further adds complexity373to this problem (Fig. 6). Nevertheless, future technical improvements, including the implementation374of machine learning–based solutions, could help to address these issues and will hopefully offer375more reliable automated workflows of colony counting, thus potentially outperforming human376subjects66–68.
377Data analysis according to power regression (option A) or PE-based normalization (option B)378This protocol provides two mathematical analysis approaches for clonogenic survival data: a generally379applicable power regression–based algorithm and a PE-based algorithm for noncooperatively growing380cell model systems. Their limitations need to be considered separately.381The generally applicable approach relies on power regression and interpolation (option A).382Accordingly, errors originating from the fitting procedure should be minimized to achieve reliable383results. This requires an acceptable degree of biological replication (n ≥ 3). Moreover, a caveat of any384regression-based analysis needs to be given attention: an insufficient number of S-C variable pairs will385result in rather erroneous estimations of the fitted parameters (a and b). We therefore strongly386recommend using this workflow with a minimum of five appropriately different S-C variable pairs per387treatment. The goodness of fit should be double-checked for all regressions. Regression coefficients R2
388≥ 0.9 are considered acceptable. Uncertainties of the fitted parameters can be used to approximate the389uncertainties of the estimated SFs by first-order Taylor series expansion of the formula for SF390calculation (e.g., as implemented in the provided MS Excel template file (Supplementary Table 1) and391the CFAcoop R-Package (https://cran.r-project.org/web/packages/CFAcoop)).392The PE-based approach (option B) is mathematically less complex and does not rely on regression393analysis. However, this algorithm should be applied only in settings without relevant cellular coop-394eration. This refers not only to the control conditions but also to all treatment conditions of interest.395Otherwise, pseudo-precise survival results with underestimated assay-intrinsic systematic errors will396be calculated17,69. Uncertainties of results obtained by this analysis algorithm can be determined by397first-order Taylor approximation (e.g., as implemented in the provided MS Excel template file398(Supplementary Table 2)).399For both mathematical approaches, the technical limits with regard to very harsh treatment400conditions should be considered. For instance, it may be impossible to obtain individual wells with a401sufficient number of colonies after high-dose irradiation of certain cell model Q11systems.
402Materials
403Reagents404● Cell type(s) of Q12interest (e.g., A-549 cells (RRID: CVCL_0023) from the American Type Culture405Collection or EFM-19 (RRID: CVCL_0253) cells from the Deutsche Sammlung von Mikroorganismen406und Zellkulturen) ! CAUTION If established, continuously growing cell lines are used, ensure proper407authentication (e.g., by short tandem repeat typing) and ensure that cells are not contaminated with408mycoplasma.409● Suitable cell culture media (we use DMEM (1×) + GlutaMAX (Thermo Fisher Scientific, cat. no.41031966-021) for A-549 cells and RPMI 1640 medium (1×) + GlutaMAX + HEPES (Thermo Fisher411Scientific, cat. no. 72400-021) for EFM-19 cells)412● Supplements for cell culture medium, such as FCS (e.g., Thermo Fisher Scientific, cat. no. 10270-106),413penicillin-streptomycin (e.g., Thermo Fisher Scientific, cat. no. 11548876), and others. We have found414that medium supplementation with 10% (vol/vol) FCS and 1% (vol/vol) penicillin-streptomycin mix415are required for both A-549 and EFM-19 cells. c CRITICAL Note that type, quality and batch of the416FCS preparation may have a relevant impact on clonogenic growth and cellular cooperation.417● PBS, pH 7.2 (e.g., Thermo Fisher Scientific, cat. no. 14190250)418● Additional reagents and consumables necessary for preparation of single-cell suspensions (Box 2), cell419counting (Box 3) and plating (Box 4)420● 70% (vol/vol) ethanol (e.g., Carl Roth, cat. no. T913) ! CAUTION Ethanol is flammable. Keep away421from sources of ignition.422● Low-gelling-temperature agarose (gel formation at ≤31 °C; e.g., Sigma-Aldrich, cat. no. A9045)423c CRITICAL This is required only if embedding cells for 3D growth in semi-solid medium.
PROTOCOL EXTENSION NATURE PROTOCOLS
16 NATURE PROTOCOLS |www.nature.com/nprot
UNCORRECTED PROOF
424● Methylene blue (e.g., PanReac AppliChem, cat. no. A1402) ! CAUTION Methylene blue is toxic.425Handle with care and always wear protective gloves and goggles. c CRITICAL This is required only for426methylene blue staining of adherent 2D colonies (Step 6A).427● Nitro blue tetrazolium chloride (e.g., Thermo Fisher Scientific, cat. no. N6495) ! CAUTION Nitro blue428tetrazolium chloride is toxic. Handle with care and always wear protective gloves and goggles.429c CRITICAL This is required only for nitro blue tetrazolium chloride staining of embedded 3D430colonies (Step 6B).
431Equipment432● Six-well culture dishes (e.g., Corning, cat. no. 353046)433● 50-ml polypropylene centrifuge tubes (e.g., Sarstedt, cat. no. 62.547.254)434● 1.5-ml polypropylene microcentrifuge tubes (e.g., Eppendorf, cat. no. 0030121872)435● Stereomicroscope with continuous 8–40× zoom function (e.g., Zeiss Stemi 305, cat. no. 435063-9010-100)436● Hemocytometer (e.g., Neubauer Improved, BLAUBRAND; Brand, cat. no. 717805) or other device for437cell counting438● X-ray source (e.g., X-Strahl, RS225) or any other agent(s) of interest to be tested
439Software440● MS Excel template files provided with this article: MS Excel template file for power regression–based441analysis (Supplementary Table 1) and MS Excel template file for PE-based normalization (Supple-442mentary Table 2)443● R-package CFAcoop (https://cran.r-project.org/web/packages/CFAcoop)444● Any other analysis software capable of linear regression (of log-transformed S-C value pairs) for445parameter estimation and calculation of SFs
446Reagent setup447Preparation of six-well plates for adherent 2D growth in liquid medium ● Timing 10 min4481 Using serological pipettes, add a sufficient amount of culture medium into the six-well plates (e.g.,4492 ml per well).4502 Place the plates into the incubator to equilibrate (physiological temperature and medium-matched451CO2 concentration) just before use. 452
453Preparation of six-well plates for embedded 3D growth in semi-solid medium ● Timing 2–3 h4541 Prepare a 4% (wt/vol) agarose stock solution. Add 4 g of agarose to 100 ml of PBS and allow agarose455dissolution by carefully heating and swirling the mixture in a microwave oven. Subsequently456autoclave agarose. Cool down to ~45 °C and optionally compensate for osmolarity changes457resulting from evaporation by adding autoclaved deionized water. ! CAUTION Avoid superheating458of agarose solution and wear protective goggles.4592 Prepare a 37 °C water bath or heating block in or directly next to a laminar flow cabinet for aseptic460cell culture to store 4% (wt/vol) agarose and culture medium at 37 °C. c CRITICAL STEP This461heating device is required to keep agarose solutions at optimal temperature. Lower temperatures462will cause premature solidification of agarose.4633 Dilute the 4% (wt/vol) agarose solution 1 + 4 with culture medium to generate a 0.8% (wt/vol)464agarose solution in a prewarmed 50-ml tube. Mix gently and keep at 37 °C.4654 Using serological pipettes, add 2 ml of the 0.8% (wt/vol) gel mixture into each well of the six-well466dishes, avoiding formation of air bubbles. Work quickly to avoid premature agarose gelling. Please467see Troubleshooting.4685 Distribute the liquid agarose layer evenly by moving the six-well plates several times in the x-y direction.4696 Allow agarose to gel in six-well plates for 10–20 min at 4 °C on a balanced, flat surface and store until470further use. Plates can be stored over night at 4 °C (prevent from drying out). Please see471Troubleshooting.4727 Maintain 4% (wt/vol) agarose stock solution at 37 °C for cell embedding (Box 4). 473
4740.8% (wt/vol) methylene blue solution475Transfer 8 g of methylene blue powder into a glass flask containing 1 liter of 70% (vol/vol) ethanol at476room temperature (20 °C). Close the flask firmly, agitate vigorously and allow full dissolution of477methylene blue on a magnetic stirrer. The solution is stable for >6 months at room temperature and
NATURE PROTOCOLS PROTOCOL EXTENSION
NATURE PROTOCOLS |www.nature.com/nprot 17

UNCORRECTED PROOF
478can be reused for staining several times. c CRITICAL This is required only for methylene blue staining479of adherent 2D colonies (Step 6A).
4800.8% (wt/vol) nitro blue tetrazolium chloride solution481Transfer 0.8 g of nitro blue tetrazolium chloride into a glass flask containing 100 ml of PBS at room482temperature. Close the flask firmly and allow full dissolution on a magnetic stirrer. The solution is483stable for 2 weeks at 4 °C. c CRITICAL This is required only for nitro blue tetrazolium chloride staining484of embedded 3D colonies (Step 6B).
485Conditioned media486As discussed in Facilitation of colony growth, conditioned medium can be used to improve growth of487colonies for some cell types. Here, we describe how to generate conditioned medium from A-549 lung488carcinoma cells (RRID: CVCL_0023). This approach can also be used for other cell lines. All steps489should be performed under aseptic conditions.4901 Seed 2.5 × 10⁶ A-549 cells into a T175 culture flask containing 50 ml of culture medium and let them491adhere over night.4922 Incubate the cells for a time sufficiently long to allow conditioning of culture medium (e.g., 72 h for493A-549 cells).4943 Harvest the culture medium (50 ml) by using a sterile pipette and transfer it to a 50-ml495centrifuge tube.4964 Ensure full removal of proliferating cells by spinning down the culture medium (300g and 5 min)497and transfering 45 ml of the cell-free supernatant to a fresh tube. Optionally, subject the medium to498filtration with low-protein-binding sterile filters (0.2 µm; e.g., Merck-Millipore, cat. no. SLGV033RS).499We usually do this with A-549 culture supernatants to remove cell debris and remaining cells. Snap-500freeze immediately at −80 °C. c CRITICAL STEP Ensure that there are no viable, proliferating cells in501the conditioned medium preparation.5025 Prewarm medium and use in place of usual medium before starting the incubation period for colony503formation (plating option 3A(vii) and plating option 3B(ix)). Conditioned medium may be used504pure or diluted with fresh nonconditioned medium at optimized concentration. We usually use5051 + 1 diluted conditioned medium for adherently growing cell lines, such as A-549 and EFM-19. 506
507Procedure
508Pre-experimental procedure and assay optimization509c CRITICAL Several clonogenic assay parameters require context-dependent optimization. Therefore,510(i) a method for satisfying colony growth in a desired 2D or 3D format, (ii) suitable S on control and511treated plates, (iii) assay incubation time, (iv) the occurrence of cellular cooperation and (v) the512appropriate mathematical analysis approach for downstream survival calculations need to be513determined in the pre-experimental procedure as described in Experimental design.
514Generation and plating of single-cell suspensions ● Timing 3 h to 1 d, depending on the515assay format516c CRITICAL Steps 1–5 should be performed under sterile conditions.5171 Label all six-well plates properly (one or two plates for both controls and representative518treatments). At least five wells with different cell densities for controls as well as for any519representative treatments should be prepared. Additional plates to optimize other parameters, such520as cell adhesion (in 2D assays) and total incubation time, are recommended.521c CRITICAL STEP To identify the most convenient assay design, it is necessary to determine522whether cellular cooperation occurs in any of the treatment conditions of interest. This can be523achieved only by seeding very different cell densities at this stage, even if the PE-based analysis524approach is preferred for the main experiment.5252 Make sure that complete culture medium, PBS and all reagents for the generation of a single-cell526suspension and cell plating are prewarmed and ready for use.5273 Choose between option A (pretreatment plating) and option B (posttreatment plating) to test528cytotoxic agents. If no cytotoxic treatment is required, proceed with Step 3A(i–v) and omit the529treatment steps (Step Q133A(vi–viii)).530The two workflows diverge with regard to the time point of plating and cytotoxic treatment(s)531(Fig. 3). In option A, single-cell suspensions from one untreated donor culture are plated into the
PROTOCOL EXTENSION NATURE PROTOCOLS
18 NATURE PROTOCOLS |www.nature.com/nprot

UNCORRECTED PROOF
532dishes where clonogenic survival is assessed, and cells are treated immediately upon adhesion (2D533format) or embedding (3D format), respectively. In option B, the cytotoxic treatment of interest is534performed before plating into the assay dishes, thus giving rise to multiple donor cultures. Either535immediately afterwards or after a fixed recovery period, independent single-cell suspensions and536dilutions thereof are prepared from all treated donor cultures, and posttreatment plating is537performed in either 2D adherent or embedded 3D growth format.538For both options, it is recommended to plate serial dilutions of at least five different cell densities539per treatment condition (one or two six-well plates per treatment condition), to synchronize540incubation periods under nonphysiological conditions for all plates, such as inadequate541temperature and insufficient CO2 concentration, and to keep the latter as short as possible.542(A) Pretreatment plating543(i) Prefill six-well plates with culture medium to allow either adherent 2D or embedded 3D544colony growth, as detailed in Reagent setup.545(ii) Harvest the cells from a donor cell preparation and generate a (near-perfect) single-cell546suspension. Details of different methods to generate single-cell suspensions are described in547Box 2.548(iii) Transfer a small aliquot of the cell suspension to a 1.5-ml microcentrifuge tube and549determine the cell count as described in Box 3.550(iv) Using fresh 50-ml centrifuge tubes, prepare serial dilutions of the single-cell suspension551suitable for the experimental setup, such as 105, 104, 103 and 102 cells/ml.552c CRITICAL STEP The dilutions need to be prepared with great care, and pipetting errors553need to be minimized. Ensure that micropipettes are regularly calibrated.554(v) Plate the cells into the six-well plates prefilled with liquid medium (2D growth) or over a555bottom layer of semi-solid culture medium (3D growth) as described in Box 4.556(vi) Once single cells have adhered (2D growth) or equilibrated after 3D embedding,557simultaneously remove all dishes from the incubator.558(vii) Carefully refresh any liquid culture medium without disturbing the single cells. This step559can be omitted if the volume difference between all wells upon seeding is minimal (<5%).560(viii) Treat the cells with any agent(s) of interest. Make sure that the final assay volume is561identical in all wells. Examples of treatment options are discussed above. 562
563(B) Posttreatment plating564(i) Seed a sufficient number of cells into the desired number of donor culture flasks (one flask565for each treatment of interest). If required, incubate in a humidified incubator566(physiological temperature and medium-matched CO2 concentration) until cells are567adapted to the culture medium and/or the desired cell density is obtained.568(ii) Treat the donor flasks with any agent(s) of interest.569(iii) Depending on the research question of interest, either incubate the treated cells in a570humidified incubator (physiological temperature and medium-matched CO2 concentra-571tion) to allow repair from potentially lethal damage followed by delayed plating (usually5726–24 h) or move directly to the next step to perform immediate plating.573(iv) Prefill six-well plates with culture medium in preparation for either 2D adherent or 3D574embedded colony growth. Details are given in Reagent setup.575(v) Harvest the cells from all donor cell preparations and generate (near-perfect) single-cell576suspensions. Details of different methods to generate single-cell suspensions are described577in Box 2.578(vi) Transfer small aliquots of the cell suspensions to 1.5-ml microcentrifuge tubes and579determine the cell counts according to Box 3.580(vii) Using fresh 50-ml centrifuge tubes, prepare serial dilutions of the single-cell suspensions581suitable for the experimental setup, such as 105, 104, 103 and 102 cells/ml.582c CRITICAL STEP The dilutions need to be prepared with great care, and pipetting errors583must be minimized. Ensure that micropipettes are regularly calibrated.584(viii) Plate the cells into the six-well plates prefilled with liquid medium (2D growth) or over a585bottom layer of semi-solid culture medium (3D growth) as described in Box 4.586(ix) Once single cells have adhered (2D growth) or equilibrated after 3D embedding,587simultaneously remove all dishes from the incubator. Carefully refresh any liquid culture588medium without disturbing the single cells. This step can be omitted if the volume589difference between all wells upon seeding is minimal (<5%). 590591592
NATURE PROTOCOLS PROTOCOL EXTENSION
NATURE PROTOCOLS |www.nature.com/nprot 19

UNCORRECTED PROOF
593Incubation period, fixation and staining ● Timing 1–5 weeks5944 Before starting the incubation period, make sure that the final assay volume is identical in all wells.595c CRITICAL STEP Varying volumes of culture media in different treatment conditions need to be596avoided because this may heavily influence clonogenic survival of single cells in a given dish.5975 Place the culture plates into a humidified incubator (physiological temperature and medium-598matched CO2 concentration). Incubate until colonies on both control and treated plates have599reached a sufficiently large size by allowing a minimum of six population doublings. Depending on600the cell line and the respective proliferation rate, this may take ≤1 week to >1 month. For A-549601and EFM-19 cells, we usually incubate for 14 and 28 d, respectively. Ideally, control and treated602plates should yield at least five wells with consecutive and differing seeding cell numbers that603have countable numbers of colonies per well. The colonies should be visible by eye and/or with a604(stereo-)microscope.605c CRITICAL STEP Do not move the plates during the incubation period, and avoid opening and606closing the incubator within the first days of growth. Use additional plates from Step 1 to identify607an ideal incubation time without disturbing other plates.608? TROUBLESHOOTING6096 Remove all culture dishes from the incubator and proceed with a suitable staining procedure. For610adherent 2D growth, we recommend that staining be carried out as described in option A by using611an ethanolic methylene blue staining solution. Alternatively, other dyes, such as crystal violet can be612used1. For embedded 3D colonies, staining can be omitted if visibility of unstained colonies is613acceptable. If staining of embedded colonies is desired, metabolic dyes, such as nitro blue614tetrazolium chloride (option B) can be used52. Viable cells convert this water-soluble dye into a615dark violet precipitate. This greatly increases the visibility of small cell clusters, but the cellular616architecture may be destroyed by the precipitate. Visualization of 3D colonies with the DNA dye617DAPI is an alternative for proper analysis of cellularity in individual 3D colonies. However, this is618more laborious and requires a fluorescent microscope55.619(A) Fixation and staining of adherent 2D colonies ● Timing 40 min to 1 d, depending on620staining time621(i) Remove the culture medium from the wells either by carefully pouring off or by aspiration.622Ensure that the amount of remaining medium is minimal.623(ii) Fix and stain the colonies by carefully adding 2 ml of 0.8% (wt/vol) methylene blue624solution. Make sure not to detach the colonies accidentally.625? TROUBLESHOOTING626(iii) Incubate for 0.5–24 h. Sufficient staining of colonies from different cell lines requires627varying incubation times. Stain until colonies are clearly detectable. We find that A-549628and EFM-19 cells require 1 h and 0.5 h minimum, Q14respectively. Overstaining is not629possible, but the staining solution should not dry out in the wells.630(iv) Remove and optionally recollect the methylene blue solution. Place the lid back onto the631culture dishes.632(v) Fill the sink with warm tap water (30 °C) and rinse the six-well plates for 1 min with the633lids closed.634? TROUBLESHOOTING635(vi) Remove the plates from the sink and let air-dry at room temperature or in a drying cabinet636(60–80 °C).637j PAUSE POINT Stained six-well plates can be stored for years after staining at room638temperature if kept dry and protected from light. Restaining of dry plates is possible if639desired. 640
641(B) Staining of embedded 3D colonies ● Timing ~1 d642(i) Carefully remove any liquid culture medium on top of the agar layer by aspiration.643(ii) Add 200 µl of 0.8% (wt/vol) nitro blue tetrazolium chloride staining solution to each well644and place the dishes into the incubator (physiological temperature and medium-matched645CO2 concentration).646(iii) Incubate for 16–24 h. Sufficient staining of colonies from different cell lines requires647varying incubation times. Stain until colonies are well detectable.648(iv) Remove culture dishes from the incubator. Optionally, take high-resolution photographs of649all wells at suitable magnification (in z-stacks) and/or proceed with colony counting in the650dishes. Avoid dehydration of gel matrices, which occurs if plates are stored for a long time. 651652653
PROTOCOL EXTENSION NATURE PROTOCOLS
20 NATURE PROTOCOLS |www.nature.com/nprot

UNCORRECTED PROOF
654Colony counting of pre-experiment and development of final assay design ● Timing 1–1.5 h6557 Count all colonies with ≥50 cells by using a (stereo-)microscope. Depending on cell type and colony656size, this is best performed at 8–40× magnification. For each treatment, start with the lowest657S. Proceed with increasing S values. Stop counting colonies for a given treatment as soon as the658number of colonies per well is too high for counting (overgrown culture dishes and/or much more659than ~200 colonies per well).660c CRITICAL STEP Staining intensity, shape, cellular morphology and size of colonies with >50 cells661may be very different between cell lines as well as within one experiment, especially when662harsh treatments are tested (Figs. 6 and 8). In many cases, counting without magnification will give663rise to false-positive and/or false-negative scorings. In particular, colonies with very tiny cells664should not be overlooked, whereas abnormally large cells or diffuse aggregates must not be scored665(Fig. 8). In case of embedded 3D growth, colonies in all layers of the semi-solid medium need to be666considered.667? TROUBLESHOOTING6688 For each treatment condition, identify the highest S value, where all biological replicates resulted in669zero colonies (C = 0) and exclude all counting results with identical or lower S values from the670analysis.6719 Enter the raw data for the pairs of values (S, C) of all biological replicates in a statistical software672tool capable of power regression analysis (i.e., linear regression of log-transformed S-C data), or use673the MS Excel template file provided with this article (Supplementary Table 1). For details, see also674Figs. 4, 5, and 9.67510 Average the C values from all biological replicates for each individual S value.67611 Perform power regression analysis according to C = a × Sb for the averaged pairs of values (S, C)677and determine the parameters a and b for untreated controls and all treatment conditions.678? TROUBLESHOOTING67912 Design the final assay setup and choose the mathematical approach (power regression–based or680PE-based) to be used in the main experiment. These decisions should rely on wells with reasonable681colony counts of all dishes (Step 7) and the b values obtained from power regression analysis682(Step 11). Composition of culture medium, 2D or 3D assay format, generation of single-cell683suspensions, plating according to option A or option B, ideal numbers of seeded cells and684adherence and incubation parameters should now be set. Harsh treatments with overall poor colony685growth should be excluded from the main experiment.686c CRITICAL STEP Note that the power regression–based approach counterbalances the influence of687cellular cooperation. For each treatment of interest, it requires at least five to six countable wells688covering the range of ideally <10 to >100 colonies per well. The PE-based approach may appear689more convenient, because fewer cell densities need to be plated, and survival calculations are less690complex. However, its use is strongly discouraged in conditions of nonlinear relationships between691S and C as reflected by b values ≥1.2. 692
693Main experiment ● Timing 1–5 weeks69413 Use the final assay parameters as optimized in Step 12 and perform your experiment in three or695more independent biological replicates by repeating Steps 1–7 with the chosen assay setup (power696regression–based or PE-based analysis), the resulting cell densities needed and the optimized697parameters as described above.69814 Proceed with clonogenic survival data analysis by using either power regression–based analysis699(option A) or PE-based normalization (option B).700(A) Data analysis of the final experiment by using power regression ● Timing 30 min701(i) Determine power regression parameters a and b as described in Steps 8–11 for control and702all treatment conditions by using a statistical software tool, the MS Excel template file703provided with this article (Supplementary Table 1) or the CFAcoop R-Package (https://cra704n.r-project.org/web/packages/CFAcoop).705? TROUBLESHOOTING706(ii) Using the determined parameters a and b, calculate the S values needed to expect C = 20707colonies for controls and all treatment conditions.708(iii) Determine the SFs for all treatment conditions by calculating the SFtreated = Suntreated/709Streated ratios at C = 20. Uncertainties of the calculated SFtreated values can be approximated710from the variance-covariance matrix of the regression parameters via error propagation by
NATURE PROTOCOLS PROTOCOL EXTENSION
NATURE PROTOCOLS |www.nature.com/nprot 21

UNCORRECTED PROOF
711using first-order Taylor series expansion of SFtreated (e.g., as implemented in the provided712MS Excel template file (Supplementary Table 1) or the CFAcoop R-Package (https://cran.713r-project.org/web/packages/CFAcoop)). 714
715(B) Data analysis of the final experiment by using PE-based normalization ● Timing 30 min716(i) Determine for each individual biological replicate the average PE from all control717wells by using a statistical software tool or the MS Excel template file (Supplementary718Table 2).719? TROUBLESHOOTING
Clo
noge
nic
surv
ival
(%
)
Dose (Gy)
Option B:immediate plating
Option B:immediate plating
Option B:delayed plating
Option B:delayed plating
ControlControl
Control Control Control, b = 1.37
Immediate plating
Treatment Treatment Treatment, b = 2.11
Delayed plating
2 Gy 2 Gy4 Gy 4 Gy6 Gy 6 Gy8 Gy 8 Gy
a
b
dc
1
10
100
1,000
1
10
100
1,000
1
10
100
1,000
1
10
100
1,000
Cells seeded
Col
onie
s co
unte
d C
olon
ies
coun
ted
Col
onie
s co
unte
d
1
10
100
1,000
1
10
100
1,000
1
10
100
1,000
1
10
100
1,000
10 100
1,00
0
10,0
00
Cells seeded
10 100
1,00
0
10,0
00 10 100
1,00
0
10,0
00 10 100
1,00
0
10,0
00 10 100
1,00
0
10,0
00
1
10
100
1,000
10 100
1,00
0
10,0
00
1
10
100
1,000
0 2 4 6 80.1
1
10
100
Clo
noge
nic
surv
ival
(%
)
Dose (Gy)
Only four countableconditions
Suboptimal overlapin countable range
Suboptimal numberof replicates
Strong difference inb value upon treatment
Means
Replicates P = 0.0015
SF at C = 100SF = 3.43% at C = 100
SF = 2.27% at C = 20
SF = 1.59% at C = 5
SF at C = 20
SF at C = 5
0 2 4 6 81
10
100
Power regression-basedsurvival calculation
Immediate platingDelayed plating
Clo
noge
nic
surv
ival
(%
)
Dose (Gy)
P = 0.0002
PE-basednormalization
0 2 4 6 80.1
1
10
100
Control b = 1.76, R2 = 0.971 Gy b = 1.86, R2 = 0.922 Gy b = 2.06, R2 = 0.974 Gy b = 2.15, R2 = 0.976 Gy b = 2.15, R2 = 0.988 Gy b = 2.11, R2 = 0.93Means + replicates
Cells seeded
10 100
1,00
0
10,0
00 10 100
1,00
0
10,0
00 10 100
1,00
0
10,0
00 10 100
1,00
0
10,0
00
Fig. 9 | Examples of clonogenic survival data analysis. a, The breast cancer cell line BT-20 (RRID: CVCL_0178) was plated according to option A andtreated with 0–8 Gy (four biological replicates; data taken from Brix et al. with slight modifications17). Data were subjected to power regressionaccording to C = a × Sb, and b values of each fit and the corresponding regression coefficients R2 were determined. The survival curve derived fromthis dataset (SF values obtained for C = 20 with corresponding standard deviations as determined by first-order Taylor approximation, plotted independence of the radiation dose with superimposed linear-quadratic fitting) is displayed in the right panel. b, Clonogenic survival of the glioblastomacell line A172 (RRID: CVCL_0131) upon irradiation at 0–8 Gy was tested by using plating option B with both immediate and delayed plating variants(three biological replicates each). Power regression and calculation of SFs for both plating variants were performed as in a (left), and mean SF values± s.d.s are shown. Statistical comparison was performed by ANOVA of nested models (F statistics: F = 49.2, degrees of freedom (df)1 = 2, df2 = 4,P =Q15 0.0015). c, The same dataset as in b was subjected to PE-based normalization, yielding nearly identical results. Statistical comparison ofimmediate and delayed plating was performed by ANOVA of nested models (F statistics: F = 144.2, df1 = 2, df2 = 4, P = 0.0002). d, Examples ofexperiments requiring optimization simulated with hypothetical data. Power regression was impaired by insufficient numbers of S-C value pairs(first panel) or insufficient numbers of biological replicates (second panel). SF value calculation was suboptimal if the range in the countable overlap ofS-C value pairs was small (third panel). An assay-intrinsic error originated from largely different b values across treatments (fourth panel). Here, theb values of control and treatment differed strongly, and the uncertainties of calculated SF values were rather large, because SF values increasedsystematically with increasing C values.
PROTOCOL EXTENSION NATURE PROTOCOLS
22 NATURE PROTOCOLS |www.nature.com/nprot

UNCORRECTED PROOF
720(ii) Calculate the SFs for each biological replicate at all treatment conditions according to:
SFtreated ¼ Ctreated=StreatedPE
721722Uncertainties of SFtreated values can be approximated from the variances of the Ctreated/723Streated ratios and PE estimates via error propagation by using first-order Taylor series724expansion (e.g., as implemented in the provided MS Excel template file (Supplementary725Table 2)).726(iii) Determine the mean SFs for each treatment condition by averaging the SFtreated values of727the biological replicates. Uncertainties of the mean SFs can be estimated from the standard728deviations of the corresponding biological replicates. A lower bound of this uncertainty can729be obtained via the sum of the SFtreated variances of the corresponding biological replicates730(e.g., as implemented in the provided MS Excel template file (Supplementary Table 2)).731? TROUBLESHOOTING 732733
73415 Plot the SFs versus any treatment conditions. For experiments testing ionizing radiation, a semi-735logarithmic presentation is conventionally used (x axis: radiation dose; y axis: log(survival)), and736survival data are commonly subjected to linear-quadratic fitting70. Alternative approaches,737including nonlinear logistic fitting, dimensionality reduction and unsupervised hierarchical738clustering, may also be helpful71.73916 (Optional) For statistical comparison of different survival curves (e.g., between two cell lines),740several options may be used. If the dose-response relationship is fitted according to an established741model (e.g., linear-quadratic fitting in the case of clonogenic survival upon ionizing radiation), the742SFs can be subjected to ANOVA comparison of nested models (F-statistics). If no underlying743regression model is used, two-way ANOVA (without interaction term) can be used. 744
745Troubleshooting
746Troubleshooting advice can be found in Table 2.
Table 2 | Troubleshooting table
Step Problem Possible reason Solution
5 All or many wells of one or moretreatment option(s) are eitherempty or (sub-)confluent
Inappropriate range of cellnumbers seeded
Adjust the range of cell densities to be testedand/or plate additional cell densities
Increase or decrease the incubation time
Consider changing growth conditions (e.g., mediaand supplements), the assay format (2D vs 3Dgrowth) and/or composition of 3D matrix
Fewer than five consecutivewells with a countable numberof colonies
Inappropriate range of cellnumbers seeded
Adjust the range of cell densities to be testedand/or plate additional cell densities
Increase or decrease the incubation time
Consider changing growth conditions (e.g., mediaand supplements), the assay format (2D vs 3Dgrowth) and/or composition of 3D matrix
Hardly any cell growth Inappropriate culture conditionsfor single cells: medium-derivedgrowth factors; auto- and paracrinestimulation of cell growth areinsufficient to sustain cell growth
Consider the use of other culture media,alternative additives and/or measures tofacilitate colony formation as described inFacilitation of colony growth. Consider usingalternative assay formats (2D or 3D)
6A(ii andQ16 v) 2D colonies detach during thestaining procedure
Too harsh treatment; colonieswith highly epithelial morphologycan detach easily
Avoid pipetting directly onto the colonies, addstaining solution cautiously and rinse the plateswith great care
7 Irregular colony growth; poorcorrelation between numberof cells seeded and coloniescounted
Suboptimal growth conditions fora fraction of the wells of oneexperiment
Avoid using culture media from different batcheswithin one biological replicate of the assay.Growth conditions can be different between twosupposedly identical medium preparations
Do not move the plates during the incubation;avoid repeated opening and closing of theincubator
Table continued
NATURE PROTOCOLS PROTOCOL EXTENSION
NATURE PROTOCOLS |www.nature.com/nprot 23

UNCORRECTED PROOF
747Timing
748The timing estimates given here assume that the researcher has basic knowledge in aseptic mam-749malian cell culture techniques. The total hands-on time of a single-replicate clonogenic experiment750(e.g., 10 six-well plates for the assay optimization procedure and 10 six-well plates for the main751experiment) is usually <20 h. Depending on the chosen assay format, it varies considerably. The total752time required is largely determined by the proliferation rate of the cell model system of interest and753may be as long as 10 weeks (up to 5 weeks for assay optimization as well as the main experiment).
754Cell model system-dependent assay optimization755Steps 1–3, generation and plating of single-cell suspensions: 3 h to 1 d, depending on the cell model756system of interest and the chosen assay format (origin of cells, procedure to generate single-cell757suspension, 2D or 3D growth and treatment options)758Steps 4–6, incubation period and staining: 1–5 weeks, depending on the doubling time of cells759Steps 7–12, colony counting of the pre-experiment and development of the final assay design: 1–1.5 h
Table 2 (continued)
Step Problem Possible reason Solution
11 and 14A(i) The dataset cannot be subjectedto power regression accordingto C = a × Sb
Power regression is only doableif the dataset to be fitted doesnot contain any zero values foraveraged C values
Check whether power regression was performedwith S values where C equals zero in all biologicalreplicates
Flattening increase of colonynumbers at increasing celldensities
Scoring of overgrown wells Check whether high-density wells wereinappropriately counted in Step 7. If necessary,exclude them from analysis
14B(i and iii) Determined PE values varystrongly with cell densityseeded, and uncertainties ofcalculated SFs are huge
PE-based normalization is notappropriate for the respectivesetting
Repeat the assay with power regression–basedanalysis
Box 2, options A(vi)and B(iii)
Cell aggregates instead ofsingle cells
Suboptimal cell dissociationprotocol
Test alternative detachment/dissociationreagents and incubation times and/or carefullyintensify mechanical separation of cell clumpswith micropipettes. Use cell strainers combinedwith (repeated) washing steps in PBS
Box 3, step 3 The suspension leaks out ofthe chamber
Improper preparation of thechamber
Rinse the chamber in 70% (vol/vol) ethanol, letthe chamber dry and repeat the filling procedure
Box 3, step 4 <20 or >250 cells per 1-mm2
squareDilution not suitable for manualcell counting72
Prepare appropriate dilutions of the single-cellsuspension
Poor cell viability after generatingthe single-cell suspension(high percentage of trypanblue–positive cells)
Too harsh enzymatic and/ormechanical treatment
Handle cells with greater care when generatingthe single-cell suspension, decrease enzymeincubation time and/or use other enzyme(s)
In the case of cells cultured in vitro, use donorcultures with lower cell density to facilitatedissociation
Box 4, option A(iv) Cells do not adhere toculture dishes
Too harsh treatment or too longincubation of cells in single-cellsuspension under nonphysiologicalconditions (suboptimaltemperature and insufficient CO2
concentration)
Generate and handle the single-cell suspensionwith greater care
Reduce incubation times under nonphysiologicalconditions
Suboptimal conditions for adhesion Do not move the plates during the adhesionprocess; avoid repeated opening and closing ofthe incubator
Box 4,option B(ii)
Matrix gels prematurely Unsuitable agarose preparation Choose an agarose type with meltingtemperature clearly <37 °C
Use prewarmed serological pipettes and/orincrease room temperature (>20 °C)
Box 4,option B(iv)
Matrix does not gel Too low agarose concentrationand/or suboptimal gellingtemperature
Allow gelling at lower temperature but avoidcold-shocking the cells
Slightly increase the concentration of the gel-forming matrix (e.g., 1% agarose for the bottomlayer and 0.5% for embedded cells)
PROTOCOL EXTENSION NATURE PROTOCOLS
24 NATURE PROTOCOLS |www.nature.com/nprot
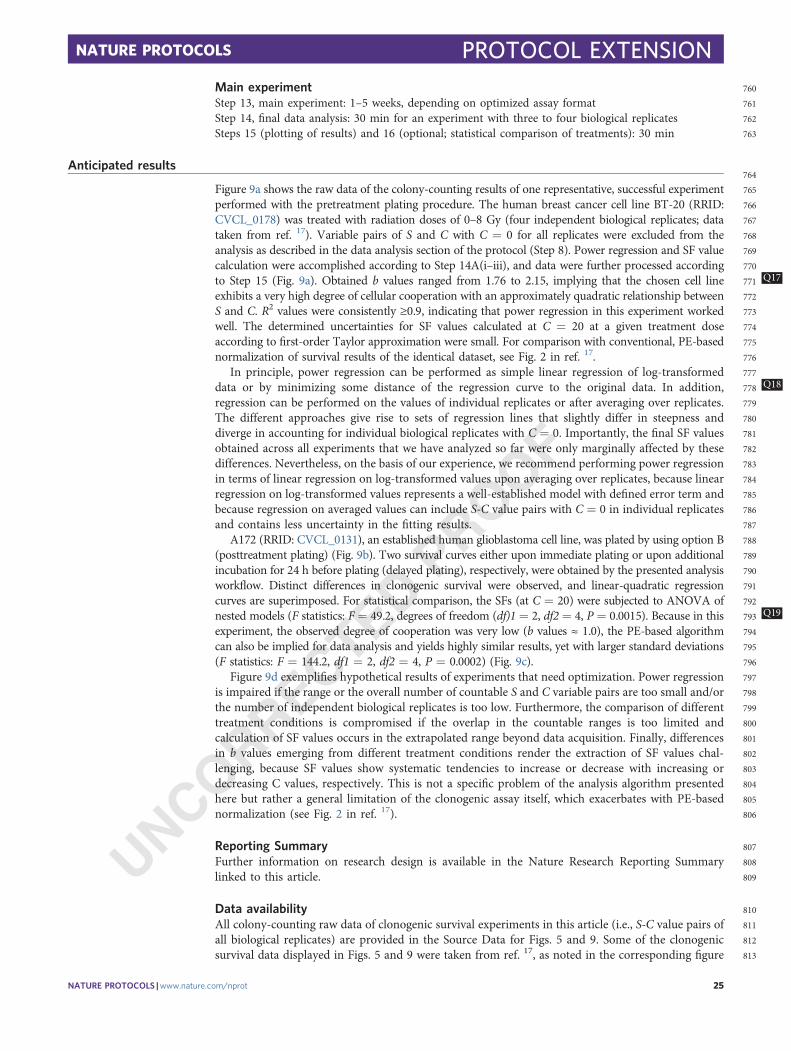
UNCORRECTED PROOF
760Main experiment761Step 13, main experiment: 1–5 weeks, depending on optimized assay format762Step 14, final data analysis: 30 min for an experiment with three to four biological replicates763Steps 15 (plotting of results) and 16 (optional; statistical comparison of treatments): 30 min
764Anticipated results
765Figure 9a shows the raw data of the colony-counting results of one representative, successful experiment766performed with the pretreatment plating procedure. The human breast cancer cell line BT-20 (RRID:767CVCL_0178) was treated with radiation doses of 0–8 Gy (four independent biological replicates; data768taken from ref. 17). Variable pairs of S and C with C = 0 for all replicates were excluded from the769analysis as described in the data analysis section of the protocol (Step 8). Power regression and SF value770calculation were accomplished according to Step 14A(i–iii), and data were further processed according771to Step 15 (Fig. 9a). Obtained b values Q17ranged from 1.76 to 2.15, implying that the chosen cell line772exhibits a very high degree of cellular cooperation with an approximately quadratic relationship between773S and C. R2 values were consistently ≥0.9, indicating that power regression in this experiment worked774well. The determined uncertainties for SF values calculated at C = 20 at a given treatment dose775according to first-order Taylor approximation were small. For comparison with conventional, PE-based776normalization of survival results of the identical dataset, see Fig. 2 in ref. 17.777In principle, power regression can be performed as simple linear regression of log-transformed778data or by minimizing some distance of the regression curve to the original Q18data. In addition,779regression can be performed on the values of individual replicates or after averaging over replicates.780The different approaches give rise to sets of regression lines that slightly differ in steepness and781diverge in accounting for individual biological replicates with C = 0. Importantly, the final SF values782obtained across all experiments that we have analyzed so far were only marginally affected by these783differences. Nevertheless, on the basis of our experience, we recommend performing power regression784in terms of linear regression on log-transformed values upon averaging over replicates, because linear785regression on log-transformed values represents a well-established model with defined error term and786because regression on averaged values can include S-C value pairs with C = 0 in individual replicates787and contains less uncertainty in the fitting results.788A172 (RRID: CVCL_0131), an established human glioblastoma cell line, was plated by using option B789(posttreatment plating) (Fig. 9b). Two survival curves either upon immediate plating or upon additional790incubation for 24 h before plating (delayed plating), respectively, were obtained by the presented analysis791workflow. Distinct differences in clonogenic survival were observed, and linear-quadratic regression792curves are superimposed. For statistical comparison, the SFs (at C = 20) were subjected to ANOVA of793nested models (F statistics: F = 49.2, degrees of freedom (df)1 = 2, df2 = 4, P = Q190.0015). Because in this794experiment, the observed degree of cooperation was very low (b values ≈ 1.0), the PE-based algorithm795can also be implied for data analysis and yields highly similar results, yet with larger standard deviations796(F statistics: F = 144.2, df1 = 2, df2 = 4, P = 0.0002) (Fig. 9c).797Figure 9d exemplifies hypothetical results of experiments that need optimization. Power regression798is impaired if the range or the overall number of countable S and C variable pairs are too small and/or799the number of independent biological replicates is too low. Furthermore, the comparison of different800treatment conditions is compromised if the overlap in the countable ranges is too limited and801calculation of SF values occurs in the extrapolated range beyond data acquisition. Finally, differences802in b values emerging from different treatment conditions render the extraction of SF values chal-803lenging, because SF values show systematic tendencies to increase or decrease with increasing or804decreasing C values, respectively. This is not a specific problem of the analysis algorithm presented805here but rather a general limitation of the clonogenic assay itself, which exacerbates with PE-based806normalization (see Fig. 2 in ref. 17).
807Reporting Summary808Further information on research design is available in the Nature Research Reporting Summary809linked to this article.
810Data availability811All colony-counting raw data of clonogenic survival experiments in this article (i.e., S-C value pairs of812all biological replicates) are provided in the Source Data for Figs. 5 and 9. Some of the clonogenic813survival data displayed in Figs. 5 and 9 were taken from ref. 17, as noted in the corresponding figure
NATURE PROTOCOLS PROTOCOL EXTENSION
NATURE PROTOCOLS |www.nature.com/nprot 25

UNCORRECTED PROOF
814legends. Schematic graphs in Figs. 2, 4 and 9d were generated from hypothetical datasets. All other815data supporting the findings of this study are available within the article and its supplementary816information files. Additional information can be provided by the corresponding author upon817request. Source data are provided with this paper.
818Code availability819The paper is accompanied by two MS Excel template files for the presented analysis workflows:820Supplementary Table 1 for the power regression–based analysis approach and Supplementary Table 2821for PE-based normalization. The R-package CFAcoop is available at https://cran.r-project.org/web/pa822ckages/CFAcoop.
823References
8241. Franken, N. A., Rodermond, H. M., Stap, J., Haveman, J. & van Bree, C. Clonogenic assay of cells in vitro.825Nat. Protoc. 1, 2315–2319 (2006).8262. Puck, T. T. & Marcus, P. I. Action of x-rays on mammalian cells. J. Exp. Med. 103, 653–666 (1956).8273. Puck, T. T., Marcus, P. I. & Cieciura, S. J. Clonal growth of mammalian cells in vitro; growth characteristics828of colonies from single HeLa cells with and without a feeder layer. J. Exp. Med. 103, 273–283 (1956).8294. Puck, T. T. & Marcus, P. I. A rapid method for viable cell titration and clone production with hela cells in830tissue culture: the use of X-irradiated cells to supply conditioning factors. Proc. Natl Acad. Sci. U. S. A. 41,831432–437 (1955).8325. Rheinwald, J. G. & Green, H. Serial cultivation of strains of human epidermal keratinocytes: the formation of833keratinizing colonies from single cells. Cell 6, 331–343 (1975).8346. Reynolds, B. A. & Weiss, S. Generation of neurons and astrocytes from isolated cells of the adult mammalian835central nervous system. Science 255, 1707–1710 (1992).8367. Phillips, T. M., McBride, W. H. & Pajonk, F. The response of CD24-/low/CD44+ breast cancer-initiating cells837to radiation. J. Natl Cancer Inst. 98, 1777–1785 (2006).8388. Wink, D. A. et al. Nitric oxide protects against cellular damage and cytotoxicity from reactive oxygen species.839Proc. Natl Acad. Sci. U. S. A. 90, 9813–9817 (1993).8409. Liebmann, J. E. et al. Cytotoxic studies of paclitaxel (Taxol) in human tumour cell lines. Br. J. Cancer 68,8411104–1109 (1993).84210. Wang, Q. et al. UCN-01: a potent abrogator of G2 checkpoint function in cancer cells with disrupted p53.843J. Natl Cancer Inst. 88, 956–965 (1996).84411. Elkind, M. M. & Sutton, H. Radiation response of mammalian cells grown in culture. 1. Repair of X-ray845damage in surviving Chinese hamster cells. Radiat. Res. 13, 556–593 (1960).84612. Huang, P. et al. Folic acid-conjugated silica-modified gold nanorods for X-ray/CT imaging-guided dual-mode847radiation and photo-thermal therapy. Biomaterials 32, 9796–9809 (2011).84813. Elgendy, M., Sheridan, C., Brumatti, G. & Martin, S. J. Oncogenic Ras-induced expression of Noxa and849Beclin-1 promotes autophagic cell death and limits clonogenic survival. Mol. Cell 42, 23–35 (2011).85014. Alimova, I. N. et al. Metformin inhibits breast cancer cell growth, colony formation and induces cell cycle851arrest in vitro. Cell Cycle 8, 909–915 (2009).85215. Rochat, A., Kobayashi, K. & Barrandon, Y. Location of stem cells of human hair follicles by clonal analysis.853Cell 76, 1063–1073 (1994).85416. Sanford, K. K., Earle, W. R. & Likely, G. D. The growth in vitro of single isolated tissue cells. J. Natl Cancer855Inst. 9, 229–246 (1948).85617. Brix, N. et al. The clonogenic assay: robustness of plating efficiency-based analysis is strongly compromised857by cellular cooperation. Radiat. Oncol. 15, 248 (2020).85818. Orth, M., Unger, K., Schoetz, U., Belka, C. & Lauber, K. Taxane-mediated radiosensitization derives from859chromosomal missegregation on tripolar mitotic spindles orchestrated by AURKA and TPX2. Oncogene 37,86052–62 (2018).86119. Hess, J. et al. Genomic amplification of Fanconi anemia complementation group A (FancA) in head and neck862squamous cell carcinoma (HNSCC): cellular mechanisms of radioresistance and clinical relevance. Cancer863Lett. 386, 87–99 (2017).86420. Puck, T. T., Cieciura, S. J. & Fisher, H. W. Clonal growth in vitro of human cells with fibroblastic mor-865phology; comparison of growth and genetic characteristics of single epithelioid and fibroblast-like cells from a866variety of human organs. J. Exp. Med. 106, 145–158 (1957).86721. Fisher, H. W. & Puck, T. T. On the functions of x-irradiated “feeder” cells in supporting growth of single868mammalian cells. Proc. Natl Acad. Sci. U. S. A. 42, 900–906 (1956).86922. Terasima, T. & Tolmach, L. J. Changes in x-ray sensitivity of HeLa cells during the division cycle. Nature 190,8701210–1211 (1961).87123. Son, J. et al. Glutamine supports pancreatic cancer growth through a KRAS-regulated metabolic pathway.872Nature 496, 101–105 (2013).87324. Varfolomeev, E. et al. IAP antagonists induce autoubiquitination of c-IAPs, NF-kappaB activation, and874TNFalpha-dependent apoptosis. Cell 131, 669–681 (2007).
PROTOCOL EXTENSION NATURE PROTOCOLS
26 NATURE PROTOCOLS |www.nature.com/nprot

UNCORRECTED PROOF
87525. Till, J. E. & McCulloch, C. E. A direct measurement of the radiation sensitivity of normal mouse bone876marrow cells. Radiat. Res. 14, 213–222 (1961).87726. Becker, A. J., McCulloch, C. E. & Till, J. E. Cytological demonstration of the clonal nature of spleen colonies878derived from transplanted mouse marrow cells. Nature 197, 452–454 (1963).87927. Park, C. H., Bergsagel, D. E. & McCulloch, E. A. Mouse myeloma tumor stem cells: a primary cell culture880assay. J. Natl Cancer Inst. 46, 411–422 (1971).88128. Courtenay, V. D. & Mills, J. An in vitro colony assay for human tumours grown in immune-suppressed mice882and treated in vivo with cytotoxic agents. Br. J. Cancer 37, 261–268 (1978).88329. Hamburger, A. W. & Salmon, S. E. Primary bioassay of human tumor stem cells. Science 197, 461–463 (1977).88430. Whitlock, C. A. & Witte, O. N. Long-term culture of B lymphocytes and their precursors from murine bone885marrow. Proc. Natl Acad. Sci. U. S. A. 79, 3608–3612 (1982).88631. Kondo, M., Weissman, I. L. & Akashi, K. Identification of clonogenic common lymphoid progenitors in887mouse bone marrow. Cell 91, 661–672 (1997).88832. Matsui, W. et al. Characterization of clonogenic multiple myeloma cells. Blood 103, 2332–2336 (2004).88933. Eliason, J. F., Aapro, M. S., Decrey, D. & Brink-Petersen, M. Non-linearity of colony formation by human890tumour cells from biopsy samples. Br. J. Cancer 52, 311–318 (1985).89134. Pomp, J. et al. Cell density dependent plating efficiency affects outcome and interpretation of colony forming892assays. Radiother. Oncol. 40, 121–125 (1996).89335. Veldwijk, M. R., Zhang, B., Wenz, F. & Herskind, C. The biological effect of large single doses: a possible role894for non-targeted effects in cell inactivation. PLoS One 9, e84991 (2014).89536. Adrian, G., Ceberg, C., Carneiro, A. & Ekblad, L. Rescue effect inherited in colony formation assays affects896radiation response. Radiat. Res. 189, 44–52 (2018).89737. Dakhore, S., Nayer, B. & Hasegawa, K. Human pluripotent stem cell culture: current status, challenges, and898advancement. Stem Cells Int. 2018, 7396905 (2018).89938. Repetto, G., del Peso, A. & Zurita, J. L. Neutral red uptake assay for the estimation of cell viability/900cytotoxicity. Nat. Protoc. 3, 1125–1131 (2008).90139. Lindhagen, E., Nygren, P. & Larsson, R. The fluorometric microculture cytotoxicity assay. Nat. Protoc. 3,9021364–1369 (2008).90340. Riss, T. L. et al. Cell viability assays. In Assay Guidance Manual (eds. Markossian S. et al.) (Eli Lilly and the904National Center for Advancing Translational Sciences, 2004).90541. Rampersad, S. N. Multiple applications of Alamar Blue as an indicator of metabolic function and cellular906health in cell viability bioassays. Sensors (Basel) 12, 12347–12360 (2012).90742. Lundin, A., Hasenson, M., Persson, J. & Pousette, A. Estimation of biomass in growing cell lines by adenosine908triphosphate assay. Methods Enzymol. 133, 27–42 (1986).90943. Temple, S. Division and differentiation of isolated CNS blast cells in microculture. Nature 340, 471–473 (1989).91044. Davis, A. A. & Temple, S. A self-renewing multipotential stem cell in embryonic rat cerebral cortex. Nature911372, 263–266 (1994).91245. Watanabe, K. et al. A ROCK inhibitor permits survival of dissociated human embryonic stem cells. Nat.913Biotechnol. 25, 681–686 (2007).91446. Ploemacher, R. E., van der Sluijs, J. P., Voerman, J. S. & Brons, N. H. An in vitro limiting-dilution assay of915long-term repopulating hematopoietic stem cells in the mouse. Blood 74, 2755–2763 (1989).91647. Sutherland, H. J., Lansdorp, P. M., Henkelman, D. H., Eaves, A. C. & Eaves, C. J. Functional characterization917of individual human hematopoietic stem cells cultured at limiting dilution on supportive marrow stromal918layers. Proc. Natl Acad. Sci. U. S. A. 87, 3584–3588 (1990).91948. Fogg, D. K. et al. A clonogenic bone marrow progenitor specific for macrophages and dendritic cells. Science920311, 83–87 (2006).92149. Riether, C. et al. Targeting CD70 with cusatuzumab eliminates acute myeloid leukemia stem cells in patients922treated with hypomethylating agents. Nat. Med. 26, 1459–1467 (2020).92350. Hu, Y. & Smyth, G. K. ELDA: extreme limiting dilution analysis for comparing depleted and enriched924populations in stem cell and other assays. J. Immunol. Methods 347, 70–78 (2009).92551. Fiebig, H. H., Maier, A. & Burger, A. M. Clonogenic assay with established human tumour xenografts: cor-926relation of in vitro to in vivo activity as a basis for anticancer drug discovery. Eur. J. Cancer 40, 802–820 (2004).92752. Borowicz, S. et al. The soft agar colony formation assay. J. Vis. Exp. (92), e51998 (2014).92853. Leivas, A. et al. Natural killer cells efficiently target multiple myeloma clonogenic tumor cells. Cancer929Immunol. Immunother. Forthcoming (2021).93054. Kukreja, A. et al. Enhancement of clonogenicity of human multiple myeloma by dendritic cells. J. Exp. Med.931203, 1859–1865 (2006).93255. Eke, I., Hehlgans, S., Sandfort, V. & Cordes, N. 3D matrix-based cell cultures: automated analysis of tumor933cell survival and proliferation. Int. J. Oncol 48, 313–321 (2016).93456. Nielson, L., Smyth, G. & Greenfield, P. Hemacytometer cell count distributions: implications of non-Poisson935behavior. Biotechnol. Prog. 7, 560–563 (1991).93657. Harnicek, D. et al. Hyperthermia adds to trabectedin effectiveness and thermal enhancement is associated937with BRCA2 degradation and impairment of DNA homologous recombination repair. Int. J. Cancer 139,938467–479 (2016).93958. Weiss, E. M. et al. High hydrostatic pressure treatment generates inactivated mammalian tumor cells with940immunogeneic features. J. Immunotoxicol. 7, 194–204 (2010).
NATURE PROTOCOLS PROTOCOL EXTENSION
NATURE PROTOCOLS |www.nature.com/nprot 27

UNCORRECTED PROOF
94159. Preciado, S. et al. The incorporation of extracellular vesicles from mesenchymal stromal cells into CD34+
942cells increases their clonogenic capacity and bone marrow lodging ability. Stem Cells 37, 1357–1368 (2019).94360. Yao, T. & Asayama, Y. Animal-cell culture media: history, characteristics, and current issues. Reprod. Med.944Biol. 16, 99–117 (2017).94561. Nuryadi, E., Mayang Permata, T. B., Komatsu, S., Oike, T. & Nakano, T. Inter-assay precision of clonogenic946assays for radiosensitivity in cancer cell line A549. Oncotarget 9, 13706–13712 (2018).94762. Lacerda, L. et al. Simvastatin radiosensitizes differentiated and stem-like breast cancer cell lines and is948associated with improved local control in inflammatory breast cancer patients treated with postmastectomy949radiation. Stem Cells Transl. Med. 3, 849–856 (2014).95063. Dahle, J., Kakar, M., Steen, H. B. & Kaalhus, O. Automated counting of mammalian cell colonies by means of951a flat bed scanner and image processing. Cytometry A 60, 182–188 (2004).95264. Choudhry, P. High-throughput method for automated colony and cell counting by digital image analysis953based on edge detection. PLoS One 11, e0148469 (2016).95465. Bewes, J. M., Suchowerska, N. & McKenzie, D. R. Automated cell colony counting and analysis using the955circular Hough image transform algorithm (CHiTA). Phys. Med. Biol. 53, 5991–6008 (2008).95666. Meijering, E., Carpenter, A. E., Peng, H., Hamprecht, F. A. & Olivo-Marin, J. C. Imagining the future of957bioimage analysis. Nat. Biotechnol. 34, 1250–1255 (2016).95867. Moen, E. et al. Deep learning for cellular image analysis. Nat. Methods 16, 1233–1246 (2019).95968. Segebarth, D. et al. On the objectivity, reliability, and validity of deep learning enabled bioimage analyses.960eLife 9, e59780 (2020).96169. Parker, W. S. & Risbey, J. S. False precision, surprise and improved uncertainty assessment. Philos. Trans. A962Math. Phys. Eng. Sci. 373, 20140453 (2015).96370. Kellerer, A. M. & Rossi, H. H. A generalized formulation of dual radiation action. Radiat. Res. 75, 471–488 (1978).96471. Unkel, S., Belka, C. & Lauber, K. On the analysis of clonogenic survival data: statistical alternatives to the965linear-quadratic model. Radiat. Oncol. 11, 11 (2016).96672. Vembadi, A., Menachery, A. & Qasaimeh, M. A. Cell cytometry: review and perspective on biotechnological967advances. Front. Bioeng. Biotechnol. 7, 147 (2019).96873. Gerweck, L. E., Dullea, R., Zaidi, S. T., Budach, W. & Hartford, A. Influence of experimental factors on969intrinsic radiosensitivity assays at low doses of radiation: cell multiplicity. Radiat. Res. 138, 361–366 (1994).97074. Rockwell, S. Effects of clumps and clusters on survival measurements with clonogenic assays. Cancer Res. 45,9711601–1607 (1985).
972Acknowledgements973This work was supported by the Deutsche Forschungsgemeinschaft DFG (SFB1321, Project-ID 329628492, P16), the Bundesministerium974fuer Bildung und Forschung BMBF (ZiSStrans NUK047A, NUK047C, METABOLiST NUK061C and DKTK) and the International975graduate program iTarget (Elitenetzwerk Bayern).
976Author contributions977N.B. and K.L. conceived and designed the protocol with support from D.S., H.Z. and C.B. N.B. acquired the data. D.S. provided978mathematical consultation and developed and programmed the R-package CFAcoop. The MS Excel template files for power979regression–based and PE-based survival analysis were generated by N.B. and D.S. N.B. and K.L. wrote the manuscript, and all authors980commented on and discussed the final version of the manuscript.
981Competing interests982The authors declare no competing interests.
983Additional information984Supplementary information The online version contains supplementary material available at https://doi.org/10.1038/s41596-021-00615-0. 985986Correspondence and requests for materials should be addressed to Kirsten Lauber. 987988989Peer review information Nature Protocols thanks Tatsuya Ohno, Daniel Wahl and the other, anonymous, reviewer(s) for their990contribution to the peer review of this work. 991992Reprints and permissions information is available at www.nature.com/reprints. 993994995996997Received: 23 December 2020; Accepted: 10 August 2021;998
Related linksKey references using this protocolBrix, N. et al. Radiat. Oncol. 15, 248 (2020) https://doi.org/10.1186/s13014-020-01697-yOrth, M. et al. Oncogene 37, 52 (2018) https://doi.org/10.1038/onc.2017.304Hess, J. et al. Cancer Lett. 386, 87 (2017) https://doi.org/10.1016/j.canlet.2016.11.014
PROTOCOL EXTENSION NATURE PROTOCOLS
28 NATURE PROTOCOLS |www.nature.com/nprot

UNCORRECTED PROOF
AOP
QUERY FORM
NPROT
Manuscript ID [Art. Id: 615]
Author
Editor
Publisher
Journal: NPROT
Author :- The following queries have arisen during the editing of your manuscript. Please answer by makingthe requisite corrections directly in the e.proofing tool rather than marking them up on the PDF. This willensure that your corrections are incorporated accurately and that your paper is published as quickly aspossible.
Query
No.
Description Author’s Response
AQ1 The references were not cited in numerical order. They have been renumbered in theorder of appearance. Please check the numbering of all references and citations foraccuracy.
AQ2 In the sentence that begins ‘This has broadened the…’, please confirm that edits are asmeant.
AQ3 Please check your article carefully, coordinate with any co-authors and enter all finaledits clearly in the eproof, remembering to save frequently. Once corrections aresubmitted, we cannot routinely make further changes to the article.
AQ4 Note that the eproof should be amended in only one browser window at any one time;otherwise changes will be overwritten.
AQ5 Author surnames have been highlighted. Please check these carefully and adjust if thefirst name or surname is marked up incorrectly. Note that changes here will affectindexing of your article in public repositories such as PubMed. Also, carefully check thespelling and numbering of all author names and affiliations, and the corresponding emailaddress(es).
AQ6 You cannot alter accepted Supplementary Information files except for critical changes toscientific content. If you do resupply any files, please also provide a brief (but complete)list of changes. If these are not considered scientific changes, any altered Supplementaryfiles will not be used, only the originally accepted version will be published.

UNCORRECTED PROOF
AOP
QUERY FORM
NPROT
Manuscript ID [Art. Id: 615]
Author
Editor
Publisher
Journal: NPROT
Author :- The following queries have arisen during the editing of your manuscript. Please answer by makingthe requisite corrections directly in the e.proofing tool rather than marking them up on the PDF. This willensure that your corrections are incorporated accurately and that your paper is published as quickly aspossible.
Query
No.
Description Author’s Response
AQ7 Figure legends should begin with a brief title for the whole figure as the first sentence,then continue with a caption containing a short description of each panel and thesymbols used. Please provide the missing title/caption for this figure 1.
AQ8 In the sentence that begins ‘The latter can usually…’, please confirm that edits are asmeant.
AQ9 Figure legends should begin with a brief title for the whole figure as the first sentence,then continue with a caption containing a short description of each panel and thesymbols used. Please provide the missing title/caption for this figure 3.
AQ10 In the sentence that starts ‘Treatment of cell clusters…’, please confirm edits as meant.
AQ11 Please add an appropriate ethics statement, if needed.
AQ12 Please check the protocol thoroughly to make sure that all materials mentioned are listedin the Materials section, along with supplier and catalog/model number. This will help toensure that readers can successfully use your protocol.
AQ13 In the sentence that begins ‘If no cytotoxic treatment…’, please confirm that edits are asmeant.
AQ14 In the sentence that begins ‘Stain until colonies are…’, please confirm that edits are asmeant.

UNCORRECTED PROOF
AOP
QUERY FORM
NPROT
Manuscript ID [Art. Id: 615]
Author
Editor
Publisher
Journal: NPROT
Author :- The following queries have arisen during the editing of your manuscript. Please answer by makingthe requisite corrections directly in the e.proofing tool rather than marking them up on the PDF. This willensure that your corrections are incorporated accurately and that your paper is published as quickly aspossible.
Query
No.
Description Author’s Response
AQ15 In the Fig. 9 legend, please confirm ‘degrees of freedom’ as meant for ‘df’.
AQ16 In Table 2, Step 6A(iv) was listed. However, the Procedure had a Troubleshooting calloutafter Step 6A(v). Table 2 has thus been changed for consistency. Please confirm orcorrect as needed.
AQ17 In the sentence that begins ‘Power regression and SF…’, please confirm that edits (i.e.,‘Step 14A(i–iii)’) are as meant.
AQ18 Is the sentence ‘In principle, power regression…’ correct as revised by the Editor?
AQ19 In the sentence that begins ‘For statistical comparison, the…’, please confirm ‘degrees offreedom’ as meant for ‘df’.