Analysis of Basic Video Metrics in a Flipped Statics Course
21
Paper ID #21147 Analysis of Basic Video Metrics in a Flipped Statics Course Benjamin Keith Morris, The University of Georgia Benjamin Morris is a senior at The University of Georgia with a major in Mechanical Engineering. Dr. Siddharth Savadatti, University of Georgia Dr. Siddharth Savadatti received his PhD in Computational Mechanics from North Carolina State Univer- sity in 2011 and has since been on the faculty of the College of Engineering at the University of Georgia. He teaches mechanics and numerical methods courses such as Statics, Fluid Mechanics, Programming, Numerical Methods for Engineers and Finite Element Analysis. In addition to traditional face-to-face classes, he has designed and taught courses in fully online and completely flipped formats. c American Society for Engineering Education, 2018
-
Upload
khangminh22 -
Category
Documents
-
view
2 -
download
0
Transcript of Analysis of Basic Video Metrics in a Flipped Statics Course

Paper ID #21147
Analysis of Basic Video Metrics in a Flipped Statics Course
Benjamin Keith Morris, The University of Georgia
Benjamin Morris is a senior at The University of Georgia with a major in Mechanical Engineering.
Dr. Siddharth Savadatti, University of Georgia
Dr. Siddharth Savadatti received his PhD in Computational Mechanics from North Carolina State Univer-sity in 2011 and has since been on the faculty of the College of Engineering at the University of Georgia.He teaches mechanics and numerical methods courses such as Statics, Fluid Mechanics, Programming,Numerical Methods for Engineers and Finite Element Analysis. In addition to traditional face-to-faceclasses, he has designed and taught courses in fully online and completely flipped formats.
c©American Society for Engineering Education, 2018

Analysis of basic video metrics in a flipped statics course Abstract The flipped class, wherein students typically encounter new content outside the classroom with an opportunity to explore it deeper in the classroom, is becoming an increasingly popular format of teaching in engineering. Since the flipped class typically results in increased availability of instructor created/curated resources for use outside the class and provides greater opportunity for receiving tailored assistance in the class, one would expect students to perform far better when classes are flipped. However, studies have shown that students generally do not perform much better (if at all) in flipped classes, but that students appreciate the increased resources available to them. Although the resources and help exist, it is possible that students simply do not know the best way to incorporate them into their studies. With the eventual aim of helping students better interact with the new resources available to them (pre-class lecture videos in this case), this study aims to understand their current viewing behavior by analyzing video viewing data collected from multiple sections of a sophomore-level engineering statics course. The dataset consisting of 69 students viewing 89 pre-class videos assigned thrice a week over 17 weeks indicates that, on an average, approximately three quarters of videos were viewed to any extent before class, and when viewed, videos were viewed to approximately three quarters of their duration before class. Coverage of each video as well as number of full viewings dropped over the semester, longer videos were watched to a lesser extent than shorter videos, and day of the week had a significant effect on viewing metrics. Video viewing was unaffected by gender and pre-class GPA, and there was no correlation between video viewing metrics and course performance. Hypotheses for differences between the above and previously published trends are discussed with suggestions for improving engagement in pre-class videos. Introduction An increasing number of engineering courses are being taught in a flipped (or inverted) format [1], [2], [3] and improving learning in flipped classes is a timely need. In its most general sense, a flipped class is a class where activities that normally occur in the classroom are swapped with those that normally occur outside the classroom [4]. Traditionally, classroom activities in many engineering classes involve lectures and instructor-led problem-solving sessions. Since these activities can be presented outside the classroom most effectively through online videos (rather than through readings), watching videos has become an integral part of learning in flipped engineering classes [5]. Given this, improving learning in flipped classes requires improving learning through watching online videos, and a first step in this direction is to understand students’ current video viewing behaviors. Towards this end, we analyze basic video metrics from a flipped statics course and investigate correlations between viewing data and pre-class GPA, course performance, day and week of class, and student gender.

Literature Review The effects of the flipped classroom on student learning have been studied extensively. The general consensus in recent engineering education literature is that students do not usually learn better or worse in a flipped classroom structure, but that they much prefer flipped classes over traditional ones (as revealed by interviews and surveys) [1], [2], [6], [7]. In terms of instructional resources, flipped classes have proved to be economical. Although the initial time investment required to create out-of-class materials might be high, they can be reused over several semesters, and in-class time can be spent addressing the needs of individual students. It has also been shown that pre-made video content from third-party instructors and institutions can be used to optimize instructional resources with no loss of student learning [8], [9]. Additionally, flipped classes have been shown to scale much better than traditional classes. A 2017 study of a large flipped class with around 800 enrolled freshman students at varying skill levels found that students gained comparable knowledge to students in a traditional classroom setting, preferred the online lecture format to a traditional lecture format, and were able to receive satisfactory individual attention from the instructor and teaching assistants [7].
Some prior investigations have attempted to determine the effects of individual parts of the flipped class format on student learning and performance. Hieb, Corley, and McNeil [10] determined in an analysis of three flipped calculus sections that participation in pre-class activities had a much weaker positive effect on student exam performance than participation in in-class activities. Although all three sections had a positive correlation between in-class participation and exam scores, only one section showed a significant correlation between pre-class participation and exam scores. Swithenbank and DeNucci [2] qualitatively studied a section of Newtonian dynamics that implemented both traditional and flipped-class methods for different topics over the course of the semester, and found that many students preferred the flipped-class model over the traditional model. However, student preparedness for the in-class portion of the course decreased as the semester progressed due to a drop in participation in pre-class activities. They also found that students who lacked in pre-class participation were not hindered relative to their performance in the traditional classroom parts of the course, but they did not flourish in the same way as their peers who made good use of the flipped-class resources. Gross and Dinehart [11] performed a quantitative analysis of video viewership in a sophomore-level engineering mechanics course and analyzed viewing data on a per-student and per-video basis. Their study reinforced the findings of [2], [10], confirming that student engagement has only a weak correlation with performance, and that student engagement tends to decrease as the semester progresses. Need/Purpose The fact that student learning and performance does not (usually) improve significantly in flipped classes as compared to traditional classes in engineering is surprising, since students do have greater access to instructor created/curated resources outside of class and opportunities to receive tailored assistance in class. Although resources and help exist, it is possible that either these resources are not very effective in impacting learning and performance, or students simply do not know the best way to utilize them effectively. In either case, knowing students' current level of engagement with in-class and out-of-class resources in flipped engineering classes is a

necessary first step towards designing more impactful resources or teaching students to use them more effectively. The purpose of this study is to: 1. Present video viewing trends by analyzing basic video metrics from a flipped statics course
and investigate correlations between viewing data and pre-class GPA, course performance, day and week of class, and student gender.
2. Compare trends and correlations from this study to those previously published (specifically those in [11]), and discuss the effects of differing course structures and instructional strategies.
This study was conceptualized with an intent to replicate the analysis in [11]; to investigate which trends and correlations held across institutions/instructors among flipped classes dealing with similar subjects. As such, many definitions and methods used here are directly borrowed from [11]. Course Structure Engineering Statics (ENGR2120) at the College of Engineering at the University of Georgia (UGA) is a 3-credit lecture based (no lab) sophomore level course that is required for 7 engineering majors (Agricultural, Biochemical, Biological, Civil, Electrical & Electronics, Environmental, and Mechanical). The course has an annual enrollment (Fall, Spring, Summer) of approximately 500 students. This course has typically been offered in classes that meet three times a week (Monday, Wednesday, Friday) for 50 minutes each. Since Fall 2016, it is offered in sections that meet with 38 students twice a week (on Monday, Wednesday) and in two smaller sections of 19 students once a week (on Friday). This split into larger and smaller sections is primarily to maximize student-faculty interaction under the constraint of limited faculty availability, and there is generally no difference in course activities between the larger Monday/Wednesday sections, and the smaller Friday section. In Fall 2016, 15 sections of Engineering Statics were taught by 3 faculty with a total enrollment of about 270 students; 5 of the 15 sections were taught by one of the authors of this paper (Dr. S. Savadatti) in a flipped format and form the basis of this study. Details on the 5 sections (numbered 1, 2a, 2b, 3a, 3b) are presented in Table 1. A total of 70 students completed the course in these 5 sections, and data collected from 69 students informed our analysis (we were unable to record data from one student). For data that required informed consent (GPA, course performance, gender), 46 students (~67%) provided consent. Data from students who withdrew from the course is not included in this paper. Table 1. Enrollment and class times for the 5 flipped sections of Engineering Statics.
Section Enrollment Monday, Wednesday Friday Sec-1 14 09:05 am – 10:10 am 09:05 am – 10:10 am Sec-2a 14
11:15 am – 12:05 pm 10:10 am – 11:00 am
Sec-2b 11 11:15 am – 12:05 pm Sec-3a 14
01:25 pm – 02:15 pm 01:25 pm – 02:15 pm
Sec-3b 17 02:30 pm – 03:20 pm

All 5 sections were taught in an identical flipped format that required pre-class, in-class, and post-class work as shown in Figure 1 for every class (except the first class of the semester and two classes following each of the three tests). Students (a) watched pre-class videos individually (logging in with their UGA ID), but were free to obtain instructor/peer help in solving problems assigned as part of their pre-class activity, (b) attended their scheduled in-class sessions and solved assigned problems individually, but were free to discuss with their peers and request help from the instructor or undergraduate teaching assistant, and (c) completed the assigned post-class work individually, but as in the case of their pre-class work, they were free to obtain instructor/peer help.
Figure 1. Pre-, in-, and post-class activities in the flipped sections of Engineering Statics.
Pre-class videos were hosted on UGA’s media storage and streaming system (Kaltura) and links were posted on UGA’s learning management system (Desire2Learn). Pre-class problems were assigned on the online assessment system (Mastering Engineering) accompanying Hibbeler's Engineering Mechanics: Statics textbook [12] and the in-class problems were mostly assigned from this textbook. An online discussion forum (Piazza) was available and daily instructor office hours were offered. The auto-graded pre-class problems were worth 10% of the course grade, and completing the in-class problems was worth 5%. There were three 2-hour tests (spaced approximately a month apart), and a 3-hr final exam that altogether accounted for the remaining 85% of the course grade. During in-class sessions, students could get help from their peers, instructor and an undergraduate teaching assistant. Outside of class (for pre-/post-class activities), students could get help from their peers or the instructor. All tests and the final exam were cumulative, closed-book/no-notes examinations. Pre-class problems were based on the concepts covered in the pre-class videos. Since these were auto-graded (worth 10% of course grade) and due at the beginning of the scheduled in-class session, they served as an indirect check/incentive to watch the videos. Moreover, the in-class problem-solving activity was not instructor-led and there were no in-class lectures, hence students who did not watch the pre-class videos were typically unable to start solving in-class problems.

Data and Analysis Methodology A total of 89 pre-class videos were assigned over 38 class periods during the semester of study. 7 class periods were not assigned any pre-class videos, including the first class of the semester and two classes following each of the three tests. The combined duration of all pre-class videos was 30.8 hours (summary statistics are shown in Table 2). All videos were created by the instructor of the course (Dr. S. Savadatti). Table 2. Summary statistics of pre-class videos in the flipped sections of Engineering Statics. Mean Median Std.Dev Max Min Number of videos assigned per class period† 2.3 2 1.13 6 1 Duration of videos per class period† (min) 48.6 48.2 9.57 67.8 29.3 Duration of videos (min) 20.7 17 13.1 56.9 2.98 † 38 class periods
For each student and each video, Kaltura recorded the number of views and total viewing time at the end of each day. Knowing the length of each video, the following quantities are defined and calculated in a manner similar to [11]. Coverage – Coverage is defined as the total amount of a video or set of videos viewed (in
terms of time) out of the possible amount of time that could be spent viewing those videos, expressed as a percentage. Coverage may be defined per student or per video using the formula
Viewing time
= 100Number of views ×Video length
Coverage
,
where the sums are taken over the number of students if Coverage is to be calculated per video and the sums are taken over the number of videos if Coverage is to be calculated per student.
Participation – A student participated in a video if he/she viewed any portion of it. Full Viewing – A student fully viewed a video if her/his Coverage for that video was above
95%. Before Class – Before (and including) the video’s due date. After Class – After the video’s due date and before (and including) the last day of the
semester. End of Semester – Before (and including) the last day of the semester.
The following are worth noting: a) Coverage as defined above is based on time spent viewing in the average sense. E.g. if
Coverage for a particular video (Coverage per video) is 75% and there were 2 students watching it, it means that the two students altogether spent as much time viewing it as if each had watched the video for 75% of its duration in every viewing (one student might have watched it twice for 100% of the duration and the other student might have watched it once for 25% of the duration). Similarly, if Coverage for a particular student (Coverage per student) is 75% and there were 2 videos, it means that the total time spent by the student in watching both videos was as much as if he/she had watched each video for 75% of its duration in every viewing.
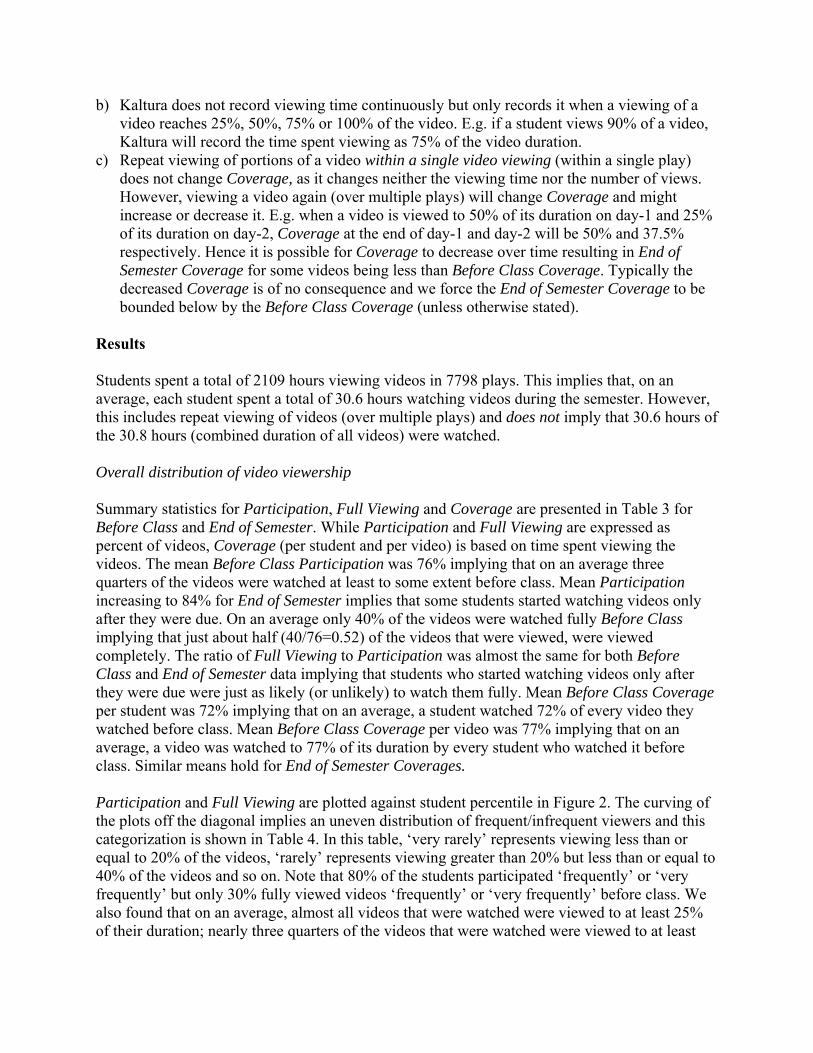
b) Kaltura does not record viewing time continuously but only records it when a viewing of a video reaches 25%, 50%, 75% or 100% of the video. E.g. if a student views 90% of a video, Kaltura will record the time spent viewing as 75% of the video duration.
c) Repeat viewing of portions of a video within a single video viewing (within a single play) does not change Coverage, as it changes neither the viewing time nor the number of views. However, viewing a video again (over multiple plays) will change Coverage and might increase or decrease it. E.g. when a video is viewed to 50% of its duration on day-1 and 25% of its duration on day-2, Coverage at the end of day-1 and day-2 will be 50% and 37.5% respectively. Hence it is possible for Coverage to decrease over time resulting in End of Semester Coverage for some videos being less than Before Class Coverage. Typically the decreased Coverage is of no consequence and we force the End of Semester Coverage to be bounded below by the Before Class Coverage (unless otherwise stated).
Results Students spent a total of 2109 hours viewing videos in 7798 plays. This implies that, on an average, each student spent a total of 30.6 hours watching videos during the semester. However, this includes repeat viewing of videos (over multiple plays) and does not imply that 30.6 hours of the 30.8 hours (combined duration of all videos) were watched. Overall distribution of video viewership Summary statistics for Participation, Full Viewing and Coverage are presented in Table 3 for Before Class and End of Semester. While Participation and Full Viewing are expressed as percent of videos, Coverage (per student and per video) is based on time spent viewing the videos. The mean Before Class Participation was 76% implying that on an average three quarters of the videos were watched at least to some extent before class. Mean Participation increasing to 84% for End of Semester implies that some students started watching videos only after they were due. On an average only 40% of the videos were watched fully Before Class implying that just about half (40/76=0.52) of the videos that were viewed, were viewed completely. The ratio of Full Viewing to Participation was almost the same for both Before Class and End of Semester data implying that students who started watching videos only after they were due were just as likely (or unlikely) to watch them fully. Mean Before Class Coverage per student was 72% implying that on an average, a student watched 72% of every video they watched before class. Mean Before Class Coverage per video was 77% implying that on an average, a video was watched to 77% of its duration by every student who watched it before class. Similar means hold for End of Semester Coverages. Participation and Full Viewing are plotted against student percentile in Figure 2. The curving of the plots off the diagonal implies an uneven distribution of frequent/infrequent viewers and this categorization is shown in Table 4. In this table, ‘very rarely’ represents viewing less than or equal to 20% of the videos, ‘rarely’ represents viewing greater than 20% but less than or equal to 40% of the videos and so on. Note that 80% of the students participated ‘frequently’ or ‘very frequently’ but only 30% fully viewed videos ‘frequently’ or ‘very frequently’ before class. We also found that on an average, almost all videos that were watched were viewed to at least 25% of their duration; nearly three quarters of the videos that were watched were viewed to at least

75% of their duration; and approximately half of the videos that were watched were viewed to their full duration. This was true for both Before Class and End of Semester viewings. Table 3. Summary statistics for Participation, Full Viewing and Coverage of pre-class videos.
Before Class (End of Semester)
Mean Median Std. Dev. Max Min Participation 76% (84%) 89% (98%) 31% (29%) 100% (100%) 0% (2%) Full Viewing 40% (44%) 39% (46%) 24% (24%) 82% (83%) 0% (0%)
Coverage (per student)
72% (74%) 75% (75%) 14% (10%) 94% (94%) 0% (39%)
Coverage (per video)
77% (77%) 77% (77%) 7% (6%) 92% (92%) 61% (61%)
Figure 2. Participation and Full Viewing of pre-class videos. The points denoted by the red circles can be read as “80% of students watched some part of at least 82% of videos by the end of the semester” and “50% of students fully viewed at least 39% of videos before class”.
Table 4. Categorization of participants and full viewers of pre-class videos.
Before Class (End of Semester)
Very Rarely
Rarely Occasionally Frequently Very
Frequently Percent of students participating in videos
12% (10%)
3% (1%)
6% (3%)
16% (4%)
64% (81%)
Percent of students fully viewing videos
20% (19%)
32% (22%)
28% (35%)
13% (17%)
7% (7%)
0%
10%
20%
30%
40%
50%
60%
70%
80%
90%
100%
0% 10% 20% 30% 40% 50% 60% 70% 80% 90% 100%
Percen
t of Videos
Student Percentile(percent of students viewing at least a given percent of videos)
End of SemesterBefore Class
Participation
Full Viewing

Coverage (per student) is plotted in Figure 3 and Coverage (per video) is plotted in Figure 4 with summary statistics in Table 3. Coverage plots curving off diagonal in both Figure 3 and Figure 4 show that the number of ‘high coverage’ viewers/videos are many more in number than ‘low coverage’ ones and this is shown in Table 5. In this table, ‘low coverage’ represents Coverage less than or equal to 20%, ‘somewhat low coverage’ represents Coverage greater than 20% but less than or equal to 40%, and so on. Note that 83% of the students and 100% of the videos are categorized as ‘somewhat high coverage’ or ‘high coverage’ viewers/videos before class.
Figure 3. Coverage (per student) of pre-class video. The point denoted by the red circle can be read as “80% of the students had a Coverage of at least 64% before class”.
Figure 4. Coverage (per video) of pre-class videos. The point denoted by the red circle on the solid line can be read as “80% of the videos had a Coverage of at least 70% before class”.
0%
10%
20%
30%
40%
50%
60%
70%
80%
90%
100%
0% 10% 20% 30% 40% 50% 60% 70% 80% 90% 100%
Coverage
(per student)
Student Percentile(percent of students watching at or greater than a given coverage)
End of SemesterBefore Class
0%
10%
20%
30%
40%
50%
60%
70%
80%
90%
100%
0% 10% 20% 30% 40% 50% 60% 70% 80% 90% 100%
Cove
rage
(per video)
Video Percentile(percent of videos being watched at or greater than a given coverage)
End of SemesterBefore Class

Table 5. Categorization of students/videos based on Coverage of pre-class videos.
Before Class (End of Semester)
Low Coverage
Somewhat Low
Moderate Coverage
Somewhat High
High Coverage
Percent of students with 1% (0%) 1% (1%) 14% (10%) 57% (59%) 26% (29%) Percent of videos with 0% (0%) 0% (0%) 0% (0%) 66% (64%) 34% (36%)
Effect of day of week Videos would be assigned at the end of a class period (on Monday, Wednesday, or Friday) and were due to be watched before the beginning of the next class period (typically Wednesday, Friday, and Monday respectively). Viewing statistics for videos assigned on different days are shown in Table 6. While there was no statistically significant difference in video durations over Monday/Wednesday/Friday, there was a statistically significant difference for Before Class Full Viewing and Coverage of videos assigned on Monday/Wednesday/Friday as determined by a one-way ANOVA. A post-hoc Tukey HSD test showed a statistically significant difference between Monday and Wednesday only for both these Before Class video metrics. Even though Before Class Participation metric doesn’t strictly meet the criteria for statistical significance for α = 0.05, its p value is close enough (0.055) to suggest a difference between videos assigned on Monday/Wednesday/Friday with a similar near significant difference between Monday and Wednesday through the Tukey HSD test. Table 6. Viewing statistics and significance by day of week for pre-class videos. Mon (36 videos) Wed (28 videos) Fri (25 videos)
p Mean Std.Dev Mean Std.Dev Mean Std.Dev
Duration (min) 18.8 12.0 21.6 12.0 22.6 15.9 0.502 Before Class Participation 77% 7.7% 73% 10% 77% 4.1% 0.055 Full Viewing 43% 11% 36% 11% 40% 13% 0.042* Coverage 79% 6.2% 74% 6.7% 76% 6.8% 0.014* End of Semester Participation 84% 5.3% 83% 4.0% 84% 4.9% 0.571 Full Viewing† 41% 9.8% 37% 9.4% 40% 13% 0.342 Coverage† 77% 6.1% 74% 6.4% 76% 6.5% 0.127 * significant at 0.05, one-way ANOVA † End of Semester metric not bounded below by Before Class metric
It is interesting to note that all Before Class video metric means are maximum for videos assigned on Mondays and minimum for videos assigned on Wednesdays. It is possible students start a week after having caught up with pending work over the weekend and have more time to watch videos at the beginning of the week; whereas they get busy with other work by the middle of the week, leading to low viewership for videos assigned on Wednesdays. The arrival of the weekend once again allows students time to get caught up and view videos assigned on Fridays. Table 6 shows that no significant difference exists for End of Semester Participation, Full Viewing and Coverage for videos assigned over Monday/Wednesday/Friday. This is expected because the much longer timeframe over which the viewing metric is measured (from the day a

video was assigned to the last day of the semester) makes the effect of the day on which a video was assigned irrelevant. Effect of week into semester The change in Participation, Full Viewing and Coverage with time over the 18 week semester is shown in Figure 5 and Figure 6. Tests 1/2/3 were held in weeks 5/9/13, Thanksgiving break was in week 16, and the final exam was held in week 19. No videos were assigned the week of Test 1, during Thanksgiving break week, and in the last week (week 18) of the semester. Before Class Participation shows weak negative correlation while End of Semester Participation shows a weak positive correlation with week into semester. The generally widening gap between Before Class and End of Semester Participation suggests that students started watching more videos after their due dates later in the semester. Both Full Viewing and Coverage show strong negative correlation (for both Before Class and End of Semester viewings), suggesting that fewer videos were watched fully and videos were watched to a lesser extent as the semester progressed. Likely reasons for these trends could be students getting busier with other classes/activities and a general decrease in student motivation/discipline over the semester. However, it should be noted that while Coverage near the end of the semester was lower than that at the beginning, it was not drastically so (72% in week 17 vs. 83% in week 1); this, along with the fact that End of Semester Participation actually increased between beginning and end of semester, suggests that the videos maintained their value in the eyes of the students over the semester.
Figure 5. Weekly average of Participation and Full Viewing over the 18-week semester for pre-class videos. Weak negative correlation exists for Before Class Participation (R2 = 0.1027) and is not shown.
R² = 0.4342
R² = 0.2261
0%
10%
20%
30%
40%
50%
60%
70%
80%
90%
100%
0 1 2 3 4 5 6 7 8 9 10 11 12 13 14 15 16 17 18 19
Percent video
s (w
eekly average)
WeekParticipation (Before Class) Full Viewings (Before Class)
Participation (End of Semester) Full Viewings (End of Semester)
Linear (Full Viewings (Before Class)) Linear (Participation (End of Semester))
Test 1 Test 2 Test 3 Thksgiv Final

Figure 6. Weekly average of Coverage over the 18 week semester for pre-class videos. Correlation for End of Semester is similar to that for Before Class.
There is a clear increase in Participation/Full Viewing/Coverage during the week after Test 1 (week 6). In our opinion, this is likely because the first test usually serves as a wake-up call for many students who had not realized the effort required to do well in the course. Test 1 scores are historically the lowest of the test scores, and the Test 1 average was 66% for the semester under consideration (vs. 75% and 82% for Tests 2 and 3 respectively). There seemed to be a sudden drop in the week immediately following Tests 2,3 which suggests the easing of studying after every major test. We do not know why there is a steady increase in weeks 11-13, though the withdrawal deadline occurs in week 11, and one can hypothesize that students who withdrew from other courses had more time to invest in our course or that some students realized they were finally committed to our course after the withdrawal deadline had passed. Note that data from withdrawn students are not included in this study. Plotting the total and average duration of videos assigned over the semester in Figure 7, we notice that the average durations of videos suddenly increased in weeks 7 and 14. These weeks show clear drops in Full Viewing/Coverage but not in Participation, suggesting that students might have started watching videos at the usual rates during these weeks, but they couldn’t cover as much of them because they hadn’t budgeted time for the unexpectedly longer videos. With time, students probably started expecting longer videos and learned to budget sufficient time to watch them, resulting in Coverage picking back up (e.g. in weeks 8-13).
R² = 0.5037
0%
10%
20%
30%
40%
50%
60%
70%
80%
90%
100%
0 1 2 3 4 5 6 7 8 9 10 11 12 13 14 15 16 17 18 19
Coverage (wee
kly average)
Week
Before Class
End of Semester
Linear (Before Class)
Test 1 Test 2 Test 3 Thksgiv Final

Figure 7. Total and average duration of pre-class videos assigned over the 18-week semester. Effect of video duration Change in video duration is expected to affect Full Viewing/Coverage, and this is shown in Figure 8 and Figure 9.
Figure 8. Variation of Participation and Full Viewing with pre-class video duration. No correlation exists for Before Class Participation. Correlation for End of Semester Full Viewing is similar (R2
= 0.1908) to Before Class Full Viewing.
R² = 0.7967
0
40
80
120
160
200
0 1 2 3 4 5 6 7 8 9 10 11 12 13 14 15 16 17 18 19
Duration (min)
WeekAverage duration of videos Total duration of videos
R² = 0.1836
R² = 0.1688
0%
10%
20%
30%
40%
50%
60%
70%
80%
90%
100%
0 10 20 30 40 50 60
Percent Students
Duration (min)Participation (Before Class) Participation (End of Semester)
Full Viewings (Before Class) Full Viewings (End of Semester)
Linear (Participation (End of Semester)) Linear (Full Viewings (Before Class))

Figure 9. Variation of Coverage with pre-class video duration. Correlation for End of Semester is similar to that for Before Class. Unsurprisingly, video duration does not affect Participation (students did not know how long a video was until they actually clicked on its link and the video loaded on their screen). There exists a clear (but weak) negative correlation between Full Viewing/Coverage and video duration. This implies that fewer students watch long videos fully and when viewed, longer videos are viewed to a lesser extent than shorter videos. Figure 9 shows that there were many ‘high coverage’ (Coverage > 80%) short videos (< 20 min duration), but all long videos (> 40 min duration) fell under the ‘somewhat high coverage’ (60 < Coverage <= 80%) category. Short/medium/long videos had mean Before Class Coverages of 79%, 73% and 71% respectively, and mean Before Class Full Viewing of 44%, 34% and 31% respectively. It should be noted that Coverage decreases with increasing week into semester (Figure 6) and with increasing duration of videos (Figure 9). Since average duration of the videos increased with increasing week into semester (Figure 7) there is a confounding effect that should be kept in mind while noting the decreased Coverage. Effect of gender and pre-course GPA Two thirds of the class (46 students with 35 males and 11 females) consented to us using their gender/pre-course GPA/course grade data. There was no statistically significant difference between the pre-course GPAs of males and females (first row of Table 7), and this allowed us to compare video viewership and course performance between genders. It turned out that there was no statistically significant difference between the genders on any measure (only some of which are shown in Table 7)
R² = 0.2236
0%
10%
20%
30%
40%
50%
60%
70%
80%
90%
100%
0 10 20 30 40 50 60
Cove
rage
Duration (min)
Before Class
End of Semester
Linear (Before Class)

Table 7. Pre-course GPA, numerical course grade and Before Class video metrics for males and females. There is no significant difference between the genders on any parameter. Males: 35 Females: 11
p Mean Std.Dev Mean Std.Dev
Pre-course GPA 3.34 0.45 3.31 0.47 0.844 Numerical course grade 82.3% 8.68% 81.1% 8.71% 0.704 Before Class Participation 64% 27% 69% 31% 0.703 Before Class Full Viewing 35% 21% 35% 20% 0.956 Before Class Coverage 70% 16% 70% 13% 0.974
A plot of Before Class Coverage versus pre-course GPA is shown in Figure10 (a) with no correlations. The graph is separated into four quadrants based on median pre-course GPA (3.42) and median Before Class Coverage (73%) of students who gave consent. There is no distinguishable difference in the distribution of males/females between the four quadrants; e.g. there were similar number of males/females in the low GPA/high Coverage quadrant as there were in the high GPA/high Coverage quadrant. No correlation exists for either genders between pre-course GPA and End of Semester Coverage. A relatively strong positive correlation was seen between Participation/Full Viewing (both Before Class and End of Semester) and pre-course GPA for females only (R2=0.34 – 0.42), even though there is no statistically significant difference between the genders for any of these metrics. Effect on numerical course grade Numerical course grade is generally known to be correlated with pre-course GPA in a course like Statics, and our data is shown in Figure10 (b). While overall regression (both males and females) has a positive correlation with R2 = 0.333 (not shown on figure), and the plot shows strong correlation for males, there is no correlation for females who consented to let us use their pre-course GPA and numerical course grade. Our small sample size of females and the presence of an outlier (whose elimination will change R2 from 0.0547 to 0.265 for females) prevent us from inferring much from this lack of correlation for females. There does not seem to be a correlation between numerical course grade and video viewing metrics. Variation of numerical course grade with Before Class Coverage is shown in Figure10 (c) where the graph is separated into four quadrants based on median Before Class Coverage (73%) and median numerical course grade (82%) of students who gave consent. There is no distinguishable difference in the distribution of males/females between the four quadrants, e.g. there are similar proportions of males/females in the high Coverage/low Grade quadrant as there are in the high Coverage/high Grade quadrant. There is not much correlation for either gender. Similar slight correlation existed for females only between numerical course grade and End of Semester Coverage (plot not shown). There was no correlation for either gender between numerical course grade and Participation/Full Viewing (both Before Class and End of Semester) and these plots are also not shown.

0%
20%
40%
60%
80%
100%
22.5
33.5
4
Before Class Coverage
Pre‐course GPA
Male
Female
60
65
70
75
80
85
90
95
100
0%
20%
40%
60%
80%
100%
Numerical Course Grade
Before Class Cove
rage
Male
Female
R² = 0.4641
R² = 0.0547
60
65
70
75
80
85
90
95
100
22.5
33.5
4
Numerical Course Grade
Pre‐course GPA
Males
Females
Linea
r (M
ales)
Linea
r (Fem
ales)
R² = 0.1021
R² = 0.1293
60
70
80
90
100
0%
10%
20%
30%
40%
50%
60%
Numerical Course Grade
Percent of To
tal V
ideos
After Class Participation
After Class Full Viewing
Linea
r (After Class Participation)
Linea
r (After Class Full Viewing)
(a)
(b)
(c)
(d)
Figure10.(
a) V
aria
tion
of
Bef
ore
Cla
ss C
over
age
wit
h pr
e-co
urse
GPA
for
stu
dent
s w
ho g
ave
cons
ent.
No
corr
elat
ions
exi
st.
(b)
Var
iati
on o
f nu
mer
ical
cou
rse
grad
e w
ith
pre-
cour
se G
PA
for
stu
dent
s w
ho g
ave
cons
ent.
(c)
Var
iati
on o
f nu
mer
ical
cou
rse
grad
e w
ith
Bef
ore
Cla
ss C
over
age
for
stud
ents
who
gav
e co
nsen
t. W
eak
posi
tive
cor
rela
tion
exi
sts
for
fem
ales
onl
y (R
2 = 0
.116
4, n
ot
show
n). (
d)
Var
iati
on o
f nu
mer
ical
cou
rse
grad
e w
ith
Aft
er C
lass
Par
tici
pati
on a
nd F
ull V
iew
ing
of p
re-c
lass
vid
eos.

Finally, it is conceivable that students who participate in or fully view a majority of videos only after class (after they are due to be watched) will perform poorly in the course. To test this, numerical course grade was plotted against percent of total videos that were either accessed only after class or had their Full Viewing completed only after class; this is shown in Figure10 (d). While the downward trend is expected, the correlation is not strong. As can be seen in this figure, the points on the vertical axis on the left denote students who have participated or fully viewed all videos by the due date, but their numerical course grades varied widely. Effect on/of withdrawal The above results do not include data from the 19 students who withdrew from the course. A preliminary analysis shows that by the withdrawal deadline (week 11), students who withdrew from the course had watched on an average 30% fewer videos than those who stayed in the course. However, the videos that they did watch were watched to the same extent (same Coverage) as the students who stayed in the course. Our data is not sufficient to determine whether watching fewer videos was the cause of withdrawal (couldn’t keep up with the work and so decided to withdraw) or whether it was the effect (decided to withdraw and hence did not watch the videos). Comparisons with previous work The second stated purpose of this study was to compare our results with previously published work, especially those in [11], and discuss the effects of differing course structures and teaching strategies. Comparing our results presented in Table 3 with Gross and Dinehart’s Table 4 [11], we see that our mean Participation and Coverage are substantially higher (72-84% as against 56-65%) while our Full Viewing are substantially lower (40-44% as against 50-54%). Our higher values are very likely because (a) our students were expected to solve pre-class problems based on concepts taught in the pre-class videos and this counted towards 10% of their course grade, and (b) there were no in-class lectures or instructor-led problem-solving sessions that could be used to make up for not watching pre-class videos. Gross and Dinehart [11] did not provide an explicit incentive to watch videos, and each class period primarily involved instructor-led problem solving that would effectively allow someone who hadn’t watched the videos to still participate in the class. Hence, both the incentive for watching pre-class videos and the cost of not watching them were relatively low in [11]. Moreover, lecture notes associated with the videos and post-class example problem solution videos were provided to the students in [11], which essentially presented multiple alternatives to watching videos. We would like to stress here that we are not implying that alternatives should be withheld (we encourage their provision given students’ varied learning preferences), but we are merely stating that alternatives existed in [11], and this probably led to decreased video viewership. Note that despite the similarity in total duration of video content that was made available (30.8 hours in our case to 34.4 hours in [11]), on an average our students had spent 30.6 hours watching videos by the end of the semester as opposed to 9.3 hours in [11].

In light of the above, our Full Viewing being substantially lower than [11]’s is surprising. One reason for this could be that our videos were longer and substantially more video content was required to be watched before class (average duration of 20.7 minutes and total duration of 30.8 hours vs. [11]’s 14.3 minutes and 11.7 hours for pre-class videos). So, while our students did cover a fair amount of every video (as denoted by high Coverage values), they may not have fully viewed them as frequently. Another reason for our low Full Viewing could be that Kaltura only recorded viewing times when viewing reached 25%, 50%, 75% and 100% of the video duration. And since Full Viewing requires at least 95% Coverage, this could only be achieved in our case if a student watched 100% of a video (viewing 95% to 99.9% of a video was recorded in Kaltura as viewing 75% and would not be counted towards a Full Viewing). Hence, our true Full Viewing is actually greater than what is presented here. As an alternative, one can look at ‘Substantial Viewings’ (Coverage > 75%) whose mean was a much higher 57% (64%) Before Class (End of Semester) than the Full Viewing mean of 40% (44%). Full Viewing and Substantial Viewing taken from Kaltura can be interpreted as lower and upper bounds, respectively, on our true Full Viewing metric. Note that Kaltura’s recording of times only when viewing reached 25%, 50%, 75% and 100% of the video duration implies that our true Coverage is also greater than what is presented here. Comparing our Figure 3 with [11]’s Figure 1, we immediately see our Coverage plots curving upward from the diagonal suggesting an uneven distribution of high vs. low coverage students. Table 5 shows that the percentage of our students who were categorized as ‘somewhat high coverage’ or ‘high coverage’ viewers was 83% (88%) – [11] would have had approximately 40% under such a categorization as their distribution of students was uniform across high/low Coverages. On the other hand, we had a much lower percentage of students that fell in the categories of students who fully watched videos ‘frequently’ or ‘very frequently’ (~20-24% against [11]’s 40%). The same reasons that produced our high Participation/Coverage but low Full Viewing as compared to [11] are attributable to our uneven distribution of frequent/infrequent or high/low coverage viewers. We had significantly different Before Class viewing behaviors between videos assigned on Mondays vs. Wednesdays. While differences between days of week existed in [11], they were not statistically significant. This is very likely because there was nothing to enforce the due date for watching videos in [11] (no incentive or cost), and so the day when the video was assigned had a less significant effect on viewing behavior. This is in some way similar to our End of Semester viewing behaviors being unaffected by the day of the week. Coverages presented in both [11] and here decreased over the semester, but the rate of decrease is substantially greater in [11] (our Figure 6 vs. their Figure 2); starting at approximately the same Coverages at the beginning of the semester, we ended the semester at around 72% Coverage while [11]’s Coverage ended at around 25-30%. Swithenbank and DeNucci [2] suggest that many students become more preoccupied with other classes and activities (or simply less motivated) as the semester progresses, resulting in a drop in completion of pre-class activities over the course of the semester. The lower drop in our Coverage is very likely the result of incentives/cost mentioned before and our course structure perhaps made the value of our video content more starkly visible to students (by not having in-class instructor-led problem solving).
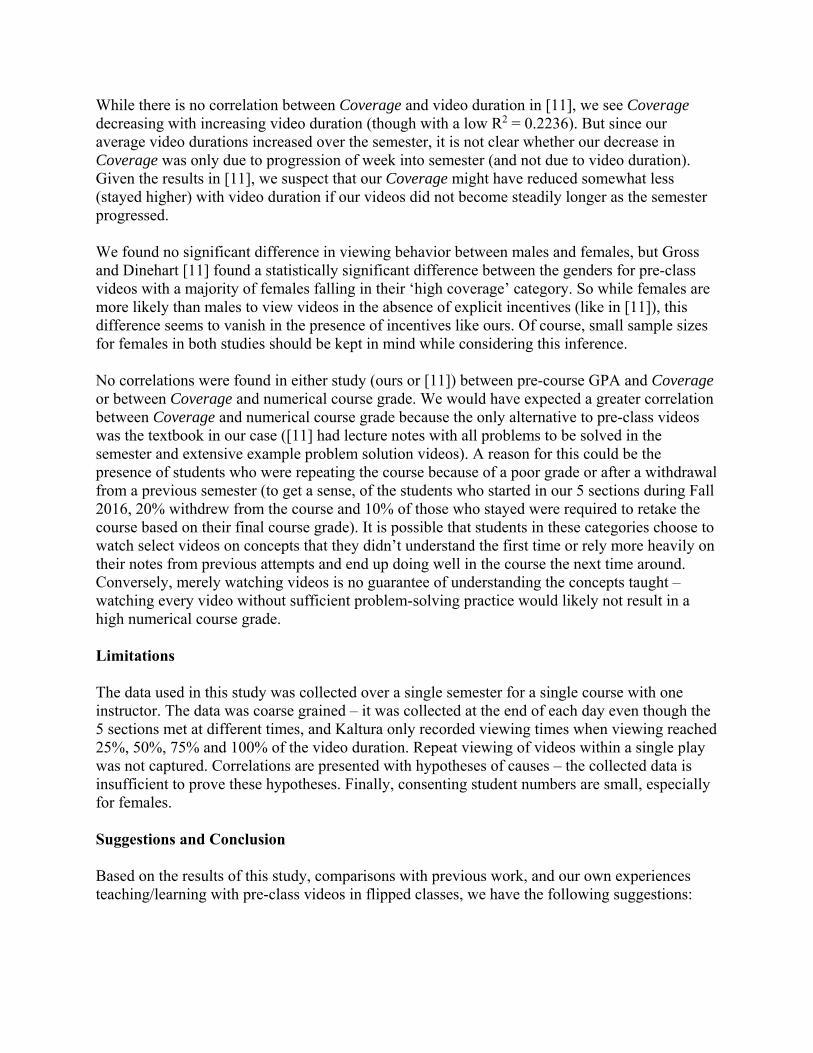
While there is no correlation between Coverage and video duration in [11], we see Coverage decreasing with increasing video duration (though with a low R2 = 0.2236). But since our average video durations increased over the semester, it is not clear whether our decrease in Coverage was only due to progression of week into semester (and not due to video duration). Given the results in [11], we suspect that our Coverage might have reduced somewhat less (stayed higher) with video duration if our videos did not become steadily longer as the semester progressed. We found no significant difference in viewing behavior between males and females, but Gross and Dinehart [11] found a statistically significant difference between the genders for pre-class videos with a majority of females falling in their ‘high coverage’ category. So while females are more likely than males to view videos in the absence of explicit incentives (like in [11]), this difference seems to vanish in the presence of incentives like ours. Of course, small sample sizes for females in both studies should be kept in mind while considering this inference. No correlations were found in either study (ours or [11]) between pre-course GPA and Coverage or between Coverage and numerical course grade. We would have expected a greater correlation between Coverage and numerical course grade because the only alternative to pre-class videos was the textbook in our case ([11] had lecture notes with all problems to be solved in the semester and extensive example problem solution videos). A reason for this could be the presence of students who were repeating the course because of a poor grade or after a withdrawal from a previous semester (to get a sense, of the students who started in our 5 sections during Fall 2016, 20% withdrew from the course and 10% of those who stayed were required to retake the course based on their final course grade). It is possible that students in these categories choose to watch select videos on concepts that they didn’t understand the first time or rely more heavily on their notes from previous attempts and end up doing well in the course the next time around. Conversely, merely watching videos is no guarantee of understanding the concepts taught – watching every video without sufficient problem-solving practice would likely not result in a high numerical course grade. Limitations The data used in this study was collected over a single semester for a single course with one instructor. The data was coarse grained – it was collected at the end of each day even though the 5 sections met at different times, and Kaltura only recorded viewing times when viewing reached 25%, 50%, 75% and 100% of the video duration. Repeat viewing of videos within a single play was not captured. Correlations are presented with hypotheses of causes – the collected data is insufficient to prove these hypotheses. Finally, consenting student numbers are small, especially for females. Suggestions and Conclusion Based on the results of this study, comparisons with previous work, and our own experiences teaching/learning with pre-class videos in flipped classes, we have the following suggestions:

Incentivize pre-class video viewing The substantial difference in Coverage between our videos and those of [11] is very likely attributable to the presence/absence of incentives. We had much greater mean Coverage (72% vs. 56%) and our Coverage dropped much less over the semester (ending at 72% vs. 25-30%).
Expect less than 100% viewership/coverage Even when video viewing is incentivized, not every student will watch videos and not every viewing will be complete. Roughly speaking, on an average, only three quarters of videos were viewed to any extent; when viewed, videos were viewed to only three quarters of their duration; and only two fifths of the videos were watched fully before class. Coverage also reduced with time; videos assigned later in the semester were watched to a lesser extent, and fewer of them were watched fully. Note that the less than 100% statistics and reduction over time occurred both in this study (with indirect incentives for video viewing) and in [11] (without any explicit incentives).
Be mindful of video duration In general, shorter videos were viewed to a greater extent and were fully viewed more frequently than longer videos (under the caveat that video duration was confounded with week into semester in our study). Our short/medium/long videos had mean Before Class Coverages of 79%, 73%, and 71% respectively and mean Before Class Full Viewing of 44%, 34%, and 31% respectively.
Track and provide video metrics Knowing the extent of video viewership is a first step to improving it. While it is impractical to perform extensive analysis (as provided in [11] and here) for every course we teach, it is possible to get some sense of viewership by reviewing basic statistics that are automatically provided by video hosting systems. Periodically making students aware of key viewing statistics will help them become aware of their own viewing behavior and may reduce the drop in Coverage over time.
The above suggestions should be considered in light of the limitations listed before. It is also important to note that the pre-class video component of a course is not the most important factor affecting student learning [10], and both this study and [11] show that video viewership in itself is not a reliable predictor of student learning/performance. In order to fully understand what makes a student successful in a flipped class, it is important to recognize that every part of the course has an influence on student success and learning. Future research should determine the relative level of impact of in-class activities and post-class work on student learning/performance in order to create a more detailed understanding of the flipped format. By researching all three parts (pre-class, in-class, and post-class activities) a full picture of the influence of each component on student learning can be developed, which can then be refined to develop better methods of implementing each part. At the same time, qualitative research should be conducted to determine the specific components of a flipped class that students enjoy and appreciate so that these components may be enhanced while optimizing the teaching method for better student learning.
Acknowledgements We wish to thank Mr. James Castle, Lead Instructional Designer at UGA’s Office of Online Learning, for facilitating collection and interpretation of viewing data recorded by Kaltura.
References
[1] M. H. Holdhusen, "A "Flipped" Statics Classroom," presented at the 2015 ASEE Annual
Conference & Exposition, Seattle, Washington, June 14-17, 2015. Available: https://peer.asee.org/23356
[2] S. B. Swithenbank and T. W. DeNucci, "Using a "Flipped Classroom" Model in Undergraduate Newtonian Dynamics," presented at the 2014 ASEE Annual Conference & Exposition, Indianapolis, Indiana, June 15-18, 2014. Available: https://peer.asee.org/23249
[3] Y. Hu, J. M. Montefort, and E. Tsang, "And Innovative Redesign of Statics: Approach and Lessons Learned," presented at the 2015 ASEE Annual Conference & Exposition, Seattle, Washington, June 14-17, 2015. Available: https://peer.asee.org/23528
[4] M. J. Lage, G. J. Platt, and M. Treglia, "Inverting the Classroom: A Gateway to Creating an Inclusive Learning Environment," The Journal of Economic Education, research-article vol. 31, no. 1, p. 13, 2000.
[5] J. L. Bishop, "The Flipped Classroom: A Survey of the Research," presented at the 2013 ASEE Annual Conference & Exposition, Atlanta, Georgia, June 23-26, 2013. Available: https://peer.asee.org/22585
[6] T. E. Marlin, "Flipping the Chemical Engineering Process Control Class with e-Lessons," presented at the 2017 ASEE Annual Conference & Exposition, Columbus, Ohio, June 24-28, 2017. Available: https://peer.asee.org/28371
[7] E. A. Marasco, M. Moshirpour, and M. Moussavi, "Flipping the Foundation: A Multi-Year Flipped Classroom Study for a Large-Scale Introductory Programming Course," presented at the 2017 ASEE Annual Conference & Exposition, Columbus, Ohio, June 24-28, Available: https://peer.asee.org/28372
[8] M. J. Jensen, A. K. Howard, and S. Jensen, "Flipped Classes: Do Instructors Need To Reinvent The Wheel When It Comes To Course Content?," presented at the 2015 ASEE Annual Conference & Exposition, Seattle, Washington, June 14-17, 2015. Available: https://peer.asee.org/24118
[9] J.-D. S. Yoder, "Flipping the Design Class Using Off-the-shelf Content: Can it work?," presented at the 2016 ASEE Annual Conference & Exposition, New Orleans, Louisiana, June 26 - August 28, 2016. Available: https://peer.asee.org/26926
[10] J. L. Hieb, W. B. Corley, and J. C. McNeil, "Flipping Calculus for Engineering Students: Pre-class Assignments and Readiness Assessment Strategies," presented at the 2017 ASEE Annual Conference & Exposition, Columbus, Ohio, June 24-28, 2017. Available: https://peer.asee.org/28369
[11] S. P. Gross and D. W. Dinehart, "Pre- and Post-Class Student Viewing Behaviors for Recorded Videos in an Inverted Sophomore Mechanics Course," presented at the 2016 ASEE Annual Conference & Exposition, New Orleans, Louisiana, June 26 - August 28, 2016. Available: https://peer.asee.org/25924
[12] R. C. Hibbeler, Engineering Mechanics: Statics, 14th ed., Boston, Prentice Hall, 2015.