the effect of a supported flipped learning approach on
79
THE EFFECT OF A SUPPORTED FLIPPED LEARNING APPROACH ON STUDENT LEARNING, ENGAGEMENT, AND PARTICIPATION IN A HIGH SCHOOL CHEMISTRY CLASSROOM by Dana L. Donlon A professional paper submitted in partial fulfillment of the requirements for the degree of Master of Science in Science Education MONTANA STATE UNIVERSITY Bozeman, Montana July 2016
-
Upload
khangminh22 -
Category
Documents
-
view
0 -
download
0
Transcript of the effect of a supported flipped learning approach on

THE EFFECT OF A SUPPORTED FLIPPED LEARNING APPROACH ON
STUDENT LEARNING, ENGAGEMENT, AND PARTICIPATION
IN A HIGH SCHOOL CHEMISTRY CLASSROOM
by
Dana L. Donlon
A professional paper submitted in partial fulfillment
of the requirements for the degree
of
Master of Science
in
Science Education
MONTANA STATE UNIVERSITY
Bozeman, Montana
July 2016

©COPYRIGHT
by
Dana L. Donlon
2016
All Rights Reserved

ii
DEDICATION
This paper is dedicated to my husband, Kevin, who took on the responsibility of
being a single parent many days while I worked on this project. Without his support and
persistence, this project would not have been realized. I also dedicate this paper to my
parents who have always encouraged me to follow my dreams and my children, Brendan,
Ryan, Kellen, and Ciara, most of whom were not born when I started this endeavor. This
is a reminder that the accomplishments of which they will be most proud in this life
demand that they work hard and reach for the stars.

iii
ACKNOWLEDGEMENT
I would like to take this opportunity to acknowledge the administration and board
of education of West Morris Regional High School District for supporting this classroom
research project. In particular, I am grateful to my former supervisor, Margaret Sheldon,
and principal, Stephen Ryan, for their approval and support of this project. They allowed
a new teacher to incorporate a novel teaching approach in their school for the sake of this
project and in the interest of best practice. I am thankful for your confidence in my
abilities and your continued support throughout the year.
This project would not have succeeded in practice without the support and
guidance of my mentor, Maria Sumereau. Our continuous collaboration about how to
best incorporate the flipped learning model into the chemistry classroom and honest
reflection about how it was working was instrumental in making this classroom project a
reality.
Finally, I would like to thank John Graves who, without once getting frustrated,
spent eight years guiding me to the end of the road. Through three different projects and
numerous life detours, he saw me through this experience with patience and
professionalism. I am very grateful to John as well as to Peggy Taylor, Diana Paterson,
Nick Childs, and all of the members of the MSSE team.

iv
TABLE OF CONTENTS
1. INTRODUCTION AND BACKGROUND ..................................................................1
2. CONCEPTUAL FRAMEWORK ..................................................................................3
3. METHODOLOGY ........................................................................................................9
4. DATA AND ANALYSIS ............................................................................................14
5. INTERPRETATION AND CONCLUSION ...............................................................30
6. VALUE ........................................................................................................................35
REFERENCES CITED ......................................................................................................39
APPENDICES ...................................................................................................................41
APPENDIX A Institutional Review Board Exemption ...............................................42
APPENDIX B Chemical Reactions Content Test .......................................................43
APPENDIX C Stoichiometry Content Test .................................................................48
APPENDIX D Reaction Kinetics Content Test ...........................................................51
APPENDIX E Thermodynamics Content Test ............................................................54
APPENDIX F Solutions Content Test .........................................................................57
APPENDIX G Student Pre-Treatment Survey ............................................................60
APPENDIX H Student Post-Treatment Survey ...........................................................63
APPENDIX I Post-Treatment Student Interview .......................................................66
APPENDIX J Daily Teacher Journal ...........................................................................68

v
LIST OF TABLES
1. Data Triangulation Matrix ...........................................................................................14
2. Survey Response Concerning Perceived Level of Preparedness .................................23
3. Post-Treatment Survey Responses About Video Lecture from
Prepared Group ............................................................................................................24
4. Post-Treatment Survey Responses About Video Lecture from
Unprepared Group .......................................................................................................24
5. Survey Response Concerning Perceived Level of Preparedness Revised ...................25
6. Comparison of Participation Treatment Phases ...........................................................28

vi
LIST OF FIGURES
1. Pre- and Post-Content Test Scores ...............................................................................15
2. Average Normalized Gains for Pre- and Post-Content Tests ......................................16
3. Mean Normalized Gains for Participating Low Performing Students .........................17
4. Summative Unit Test Scores ........................................................................................18
5. Summative Unit Test Scores for Students with an IEP ...............................................18
6. Summative Unit Test Scores for Participating Low Performing Students ..................19
7. Students Demonstrating Understanding via Formative Assessments ..........................20
8. Percentage of Students Interested in Chemistry ..........................................................21
9. Percentage of Student Responses on Pace of Lectures ................................................22
10. Average Percentage of Students Completing Homework ...........................................27

vii
ABSTRACT
The flipped learning approach takes direct content instruction out of the
classroom in order to incorporate more student-centered, inquiry-based activities that
facilitate learning. In-class lectures are replaced by video lessons that students watch
outside of class meeting time. Class time is reserved for practice, activities, and
laboratory experiences in the presence and with the support of the teacher. Advantages
of the flipped learning approach for students are control over the pace of their learning,
increased one-to-one time with the teacher, seamless access to available resources, and
more dynamic in-class activities to support learning.
The purpose of this study was to determine if the incorporation of the flipped
learning approach to instruction coupled with technology-based formative assessments
affected academic achievement, student engagement, and participation in a high school
chemistry classroom. A pretreatment phase of traditional instruction was followed by
two separate treatment phases. The first treatment incorporated technology-based
formative assessments into traditional instruction. In the second treatment phase, the
flipped learning approach was used for direct content instruction in addition to the
technology-based formative assessments.
Students were administered pre- and post-tests as well as summative tests for each
unit to assess and compare learning and achievement. Students participated in surveys
and interviews to determine the impact on engagement and participation. A daily journal
was kept by the teacher as part of the study as well.
The results of the study revealed that there was no substantial difference in
student academic achievement overall. However, students with an IEP and historically
low-performing students did show an increase in test scores. Students showed increased
interest in chemistry and engagement over the treatment period due to the increased time
available for student-centered, inquiry activities in class. While participation rates for
class activities remained unchanged, participation rates in class discussion increased. I
will continue to utilize the flipped learning approach as a result of this study.

1
INTRODUCTION AND BACKGROUND
West Morris Central High School (WMC) is a public high school serving students
in grades 9 – 12 from Washington Township in Morris County, New Jersey. WMC is
part of the West Morris Regional High School District and has a sister school with
common curriculum, Mendham High School, which serves the residents of Mendham
and Chester, New Jersey. WMC had 1285 students enrolled for the 2015-2016 school
year and graduated 327 students in 2015 (West Morris Central, 2015). The WMC student
population and community have little ethnic diversity with approximately 88.5%
Caucasian students, 5.5% Hispanic, 3.4% Asian, 1.2% African-American, and 1.3% of
two or more races (National Center for Educational Statistics, 2015). The school is
positively supported by the people of the community who value and invest in strong
public education. WMC prides itself on its academic excellence offering Advanced
Placement courses in all of its core subjects and is endorsed as a World School by the
International Baccalaureate Organization. There is also strong commitment from the
administration and staff to create and support a digital learning environment for students
across the curricula (West Morris Central, 2015).
I began teaching chemistry at WMC in September 2015 after working several
years outside of the classroom raising my children. Just prior to my hiatus from teaching,
I had begun the process of transitioning from primarily a traditional lecture-practice-lab
teacher to one who incorporated student-centered projects and inquiry activities into my
repertoire. Upon returning to the classroom, my greatest concern was not the content of
the curriculum or my ability to manage a classroom, it was whether I would be able to

2
continue to move toward a student-centered approach or if I would rely on the teacher-
centered approach that was so often in my comfort zone. In addition, New Jersey was on
the precipice of implementing the Next Generation Science Standards (NGSS) for the
2016-2017 school year which required teachers to not only incorporate scientific inquiry
into classroom practices but also engineering design. This presented itself as another
challenge to be faced upon my return.
Technology had also advanced in my time away from the classroom. Grading
programs, learning management systems, web-based assessment tools, screencasts,
podcasts, and interactive software either did not exist or had not yet emerged in most
schools upon my exit. I worried that I would not be able to engage students who, unlike
me, were digital natives. In an effort to prepare for this aspect of today’s classroom, I
enrolled in a web tools course for educators over the summer. Through this course, I was
introduced to the idea of flipped learning.
Although I was originally skeptical of the idea of moving direct instruction out of
the classroom, I began to realize the benefits that such a move could provide. For my
situation and in light of my concerns, the greatest benefit that the flipped classroom
approach promised was time, which was always the limiting factor in my attempts to
create a more student-centered environment in my classroom. I was also hoping that
utilizing the flipped model would afford me the time to implement inquiry-based lessons.
Looking forward, the flipped model could also provide time for the scientific inquiry and
engineering design practices that NGSS demands.

3
Upon meeting my chemistry students in September, I found that most students
enjoyed science and felt that they learned science best using a “hands-on” approach. All
students had Internet connectivity at home and brought some type of device to school.
Therefore, incorporating a flipped learning approach would not create a hardship for any
student. During the first marking period, I utilized video lectures produced by other
science teachers to supplement my lessons. Informal discussion with my students
revealed that some students watched the videos several times for understanding while
others didn’t bother to watch them at all. I realized that my strategy for implementing a
flipped learning approach needed to incorporate some type of formative assessment in
order to provide feedback as well as accountability for the content of video lectures. The
question remained, however, of whether this strategy would support student learning and
keep students engaged during both in-class and out-of-class activities. Therefore, the
focus questions that guided my action research were:
1. How did the use of the flipped learning approach and technology-based
formative assessments affect students’ academic achievement in chemistry?
2. How did the use of the flipped learning approach and technology-based
formative assessments affect student engagement?
3. How did the use of the flipped learning approach and technology-based
formative assessments affect class participation?
CONCEPTUAL FRAMEWORK
The release and subsequent adoption of the Next Generation Science Standards
(NGSS) marks a major shift in how science education is approached and will require

4
many science educators to teach in a new way. In A Framework for K-12 Science
Education: Practices, Crosscutting Concepts, and Core Ideas, the National Research
Council (2012) explained that its vision for science education is that students “actively
engage in scientific and engineering practices and apply crosscutting concepts to deepen
their understanding of the core ideas in these fields” (p. 8-9). In order to realize this
vision, educators must create an atmosphere of learning that incorporates not only the
acquisition of content knowledge but the application of knowledge through scientific
inquiry and engineering design. The vision challenges educators to deviate from the
traditional method of teaching facts recognizing that science “is not just a body of
knowledge that reflects current understanding of the world; it is also a set of practices
used to establish, extend, and refine that knowledge. Both elements – knowledge and
practice – are essential” (National Research Council, 2012, p. 26). The implementation
of the NGSS requires that educators balance the need for content instruction with the
need to practice science through inquiry and engineering design. At the same time,
educators must also address the requirements of diverse learners and limited class time.
One solution to these challenges is the flipped learning approach.
The flipped learning, or flipped classroom, approach is one in which “direct
instruction moves from the group learning space to the individual learning space, and the
resulting group space is transformed into a dynamic, interactive learning environment
where the educator guides students as they apply concepts and engage creatively in the
subject matter” (Flipped Learning Network, 2014, n.p.). In a flipped classroom, this is
achieved by delivering direct instruction to students via video lecture which they watch

5
outside of class. This reserves in-class time for students to practice what they have
learned in the presence of their teacher who can provide direct, targeted instruction (Sams
& Bergmann, 2013).
There are several suggested benefits to the flipped learning approach. Utilization
of the flipped learning approach provides the teacher with the gift of time to engage
students through more meaningful activities that support learning (Bergmann & Sams,
2014; Sams & Bergmann, 2013). Flipping the science classroom maximizes the time in
class that can be spent on student-centered activities, project-based learning, and inquiry
instruction. Consequently, it eases the transition to the implementation of the NGSS
practices of scientific inquiry and engineering design. Furthermore, project-based
learning is no longer restricted to an activity that occurs after content instruction takes
place. Students have the content resources available on video, and, therefore, can meet
learning objectives as they participate in the problem, actively involving them in
knowledge acquisition (Sams & Bergman, 2013; FLN, 2014; Johnson, Adams Becker,
Estrada, & Freeman, 2015).
Another advantage to employing a flipped learning approach is that it permits
teachers the freedom to work one-on-one with students allowing for differentiated
instruction. Whether a student is in need of reinforcement or a challenge, the teacher has
time to work with students individually or in small groups providing timely instruction at
an appropriate level rather than a one size fits all level. In addition, the use of video
lectures allows for self-paced learning. Students have the ability to stop, rewind, and re-
watch video content that they do not completely understand. They can watch the videos

6
over and over again for greater content understanding. Once a teacher makes the
transition to the flipped learning approach, it affords her students a library of content
video lectures. This allows them to move from topic to topic at their own pace
developing a mastery of each topic before advancing (Sams & Bergmann, 2013; Johnson
et al., 2015; Finkel, 2012).
Until recently, there was no scientific research to support the use of the flipped
learning approach as a viable method to improve student achievement (Goodwin &
Miller, 2013). However, as the flipped model gains popularity, more concrete scientific
research is emerging. One study compared test scores of students in a traditional
advanced placement chemistry course to those of students in an identical flipped course.
In all assessments, the flipped learning students scored significantly higher (Schultz,
Duffield, Rasmussen, and Wageman, 2014). At Marquette University, test scores of
students enrolled in a flipped general chemistry course were compared to test scores of
students who were enrolled in the traditionally taught version of the course during the
prior semester. Results revealed that scores were higher for the bottom third of students
on all exams in the flipped classroom. A decrease in “D” and “F” grades and
withdrawals was also reported (Ryan & Reid, 2015). In another study, low performing
students showed the greatest increase in semester grades in a flipped International
Baccalaureate Environmental Systems and Societies course (Marlowe, 2012). Schultz et
al. (2014) attributes the increase in student academic performance to three characteristics
of the flipped learning approach: self-paced learning, the application of knowledge

7
through in-class activities, and the additional teacher support available during face-to-
face class time.
Other case studies support improvement in the area of academic performance as a
result of the flipped learning approach. At Clintondale High School in Michigan, the
implementation of the flipped learning approach is credited with reducing the failure rate
of ninth grade math students from 44 to 13 percent (Finkel, 2012). Similarly, math
mastery at Byron High School in Minnesota as measured by the Minnesota
Comprehensive Assessments increased from 29.9% in 2006 to 73.8% in 2011 (Fulton,
2012).
The aforementioned studies also analyzed the effect of the flipped learning
approach on student engagement and preference. Students who experienced flipped
learning indicated a preference for the flipped method (Schultz et al., 2014; Lage, Platt, &
Treglia, 2000), showed positive feelings toward the flipped model (Marlowe, 2012), and
more effective engagement with lecture content (Ryan & Reid, 2015). Another study
found that students preferred and experienced more innovation and cooperation during
the classroom learning experience as a result of the flipped learning approach (Strayer,
2009). The flipped approach also engaged a diverse spectrum of learners resulting from
increased student-instructor interaction, more active engagement, and group collaboration
during face-to-face instruction time. Survey results revealed that increased student
motivation was a result of students taking ownership of their learning (Lage et al., 2000).
Others support the idea of increased student engagement and accountability due to the

8
independent work required of students in a flipped classroom (Sparks, 2011; Bergman
and Waddell, 2012).
If you try flipping your classroom, I think you will find that your students start
taking more responsibility for their own learning as well. They will be more
engaged and active in your classroom, where they will learn how to work
collaboratively. They will see you more as a mentor and a coach instead of a
disseminator of knowledge. (Bergman and Waddell, 2012, p. 7)
Limitations to the flipped learning approach have also been identified. One study
revealed that students were not comfortable with how the flipped classroom structure
oriented them to accomplishing learning tasks in the classroom. Students indicated
difficulty connecting the online portion of the course with the in-class portion which may
actually lower student engagement (Strayer, 2009). Other limitations that have been cited
include student distraction while viewing videos at home or students not viewing videos
which would leave them unprepared for in-class activities. Furthermore, the videos are
viewed by students asynchronously which prohibits students from asking questions of
teachers and/or peers while receiving content instruction (Milman, 2012). Teachers must
also consider the connectivity of students before deciding to flip their classroom
(Bergmann & Wadell, 2012; Milman, 2012).
Although the challenge of ensuring connectivity for all students can be overcome
through the use of DVD copies of lectures, borrowed devices, or dedicated in-school time
to engage with videos, the other limitations mentioned are less easily resolved. For the
flipped learning approach to be effective and meet the goal outlined in its accepted

9
definition of creating a meaningful face-to-face learning environment, the educator must
have a strategy for student accountability and feedback for the out-of-class knowledge
acquisition (Milman2012; Kim, Kim, Khera, & Getman, 2014). One strategy is
providing incentives for students to watch video lectures by utilizing formative online
quizzes and discussion groups in which students can ask questions (Kim et al., 2014). In
addition, incorporating technology-enhanced formative assessment techniques during
class can serve to evaluate student understanding of video lecture content in real time for
the student and teacher. These practices also drive instruction so that teachers can focus
some in-class time on comprehension of the material (Millard, 2012; Kim et al., 2014).
Pairing the flipped learning model with technology that has student-response capabilities
is a supported flipped approach that can increase student engagement, strengthen team-
based skills, offer personalized guidance, and focus classroom discussion and activities
(Millard, 2014, p. 29).
METHODOLOGY
The focus of this study was to examine the effects of replacing traditional
classroom lecture with video lectures coupled with technology-based formative
assessments that provide instant feedback on student achievement, engagement, and
participation. This study was conducted over a period of five content units in two
sections of Advanced Chemistry with a total of 49 students. Twenty-five students were
female, 24 students were male, and all students were sophomores at West Morris Central
High School, Chester, New Jersey. The high school was part of a Bring Your Own
Technology district, and all students participating in this study brought a device to school

10
and had access to Internet resources. The research methodology for this project received
an exemption from Montana State University’s Institutional Review Board and
compliance for working with human subjects was maintained (Appendix A).
The implementation of this study began with a pretreatment phase which covered
the chemistry topic of chemical reactions. During this pretreatment phase, new content
was introduced to students in a teacher-centered, lecture format. Occasionally, video
lectures were utilized to support the lesson content. These video lectures were available
on the teacher’s Learning Management System (LMS), Haiku. Formative assessments
including exit tickets and minute papers were typically administered to students at the
end of class once or twice per week. These assessments were collected and evaluated by
the teacher and returned during the subsequent class period. The Assess feature of Haiku
was used to create online formative quizzes for students to practice math skills related to
chemistry. The online format for formative quizzes was not employed to support content
on current topics. Summative assessments such as unit tests, quizzes, labs, and activities
were used to measure student achievement to determine their marking period grade.
There were two different treatment phases of this study with each phase
encompassing two units of study. The content of the first treatment phase covered the
topics of stoichiometry and reaction kinetics. During this phase, the teacher-centered,
lecture format for content instruction was maintained. However, technology-based
formative assessments accompanied each lecture using the online assessment feature in
Haiku or other real-time, online presentation and formative assessment tools like Pear
Deck and Kahoot. These formative assessments allowed immediate feedback to be

11
delivered to both the students and teacher. Other classroom activities such as practice,
projects, and labs as well as summative assessment techniques remained the same as
during the pretreatment phase.
The second treatment phase was implemented during the thermochemistry and
solutions units of the chemistry course of study. This treatment phase coupled the use of
technology-based formative assessment tools with the use of video lectures in a flipped
learning approach. Four videos were assigned for the thermochemistry unit that provided
content instruction and problem solving strategies for heat of reaction, heat of solution,
calorimetry, and Hess’s Law. Four videos were also assigned for the solutions unit which
provided content instruction about mixtures, solutions, and solubility and problem
solving strategies to calculate solution concentration. Six of the eight videos were self-
created using annotated presentations such as PowerPoint and Prezi, virtual chalkboards,
simulations, and video clips. In general, each video was six to ten minutes in length.
Students watched the video lectures for homework prior to class meetings and
participated in formative assessments that provided immediate feedback using online
tools in Haiku. Each class meeting began with a short discussion of content that
sometimes utilized online tools such as Pear Deck and Kahoot to formatively assess
students before they embarked on classroom activities of practice, projects, and labs.
Participation points were given to those students who watched the videos and completed
the online formative assessments in Haiku prior to class. These participation points, in
addition to summative assessments such as tests, quizzes, labs and activities, were used to

12
measure student achievement for their marking period grade but not utilized as data to
inform this study.
Student academic achievement was evaluated by the administration of the
Chemical Reactions Content Test (Appendix B), Stoichiometry Content Test (Appendix
C), Reaction Kinetics Content Test (Appendix D), Thermochemistry Content Test
(Appendix E), and Solutions Content Test (Appendix F) both prior to and at the
conclusion of each unit. These teacher-generated tests consisted of 12 multiple choice
questions specific to each unit of study. A Wilcoxon Signed Rank test was applied to
each of these tests to determine a statistical difference in score from pre- to post-test.
Each set of pre- and post-test scores was also analyzed for normalized gains for which 0
to 0.3 was considered low gain, 0.3 to 0.7 were medium gain, and above 0.7 was high
gain. The normalized gains for the Stoichiometry and Reaction Kinetics Content Tests
from the traditional with technology-based formative assessment (TBFA) treatment phase
and the Thermochemistry and Solutions Content Tests from the flipped learning
treatment phase were compared to the normalized gains of the Chemical Reactions
Content Test from the traditional pretreatment phase to determine trends in student
achievement with each treatment. Summative unit test scores from the treatment phases
were also compared to that of the pretreatment phase. The effect of the treatment on
student achievement was also measured by a qualitative analysis of the percentage of
students who demonstrated understanding of current content through formative
assessments.

13
The level of student engagement and participation during the traditional
pretreatment phase was determined utilizing the Student Pre-Treatment Survey
(Appendix G). The Student Post-Treatment Survey was administered after the
conclusion of the flipped learning treatment phase (Appendix H). Both surveys included
Likert-type statements about content delivery, participation, preparedness, and formative
assessments with the choice to respond strongly agree, agree, disagree, or strongly
disagree. The results of the two surveys were qualitatively compared to determine trends
in engagement and participation as a result of the treatments.
Further qualitative evidence of the effect of the treatment on engagement and
participation was gathered from Post-Treatment Student Interviews of eight students at
the conclusion of the flipped learning treatment (Appendix I). Nine questions about the
video lectures and formative assessments were administered to two male students and
two female students from each of the two chemistry classes.
A record of participation in the online activities was kept using data amassed from
Haiku. The Haiku LMS provided daily reports about student activity that included which
students watched the assigned videos, how long they watched, and how many times they
watched. A student was considered to have participated if they watched the video for a
time equivalent to the length of the video at least once and completed the associated
Haiku formative assessment.
A Daily Teacher Journal (Appendix J) was kept during pre-treatment and
treatment phases of the classroom research project. The journal entries documented
participation, levels of engagement and other observations to qualitatively inform this

14
study. Observations recorded in the Daily Teacher Journal were made by the classroom
teacher. Colleagues also contributed information concerning engagement and interest
levels of students to establish a more unbiased view (Table 1).
Table 1
Data Triangulation Matrix
Focus Questions Data Source 1 Data Source 2 Data Source 3
1. How does the use of the
flipped learning
approach and
technology-based
formative assessments
affect students’
academic achievement
in chemistry?
Summative
Assessment
Scores
Pre- and Post-
Content Test
Scores
Formative
Assessments
2. How does the use of the
flipped learning
approach and
technology-based
formative assessments
affect student
engagement?
Student
Pre- and Post-
Treatment Survey
Post-Treatment
Student Interview
Daily Teacher
Journal
3. How does the use of the
flipped learning
approach and
technology-based
formative assessments
affect class
participation?
Daily Teacher
Journal
Participation
Data for
Technology-
Based Formative
Assessments
Post-Treatment
Student
Interview
DATA AND ANALYSIS
A difference in the median pre-test and post-test scores for all content tests was
revealed by Wilcoxon Signed Rank tests that each produced p-values less than 0.01
(N=49). The median score for the Chemical Reactions Content Test administered during
the traditional pretreatment phase increased from 58% in the pre-test to 92% in the post-
test. The Stoichiometry Content Test and Reaction Kinetics Content Test administered

15
during the traditional with technology-based formative assessments (TBFA) treatment
phase showed increases in median scores from 42% to 67% and 50% to 83% from pre-
test to post-test, respectively. Similarly, median scores for the flipped learning treatment
phase rose from 33% to 75% for the Thermochemistry Content Test and from 42% to
75% for the Solutions Content Test (Figure 1).
Figure 1. Pre- and post-content test scores, (N=49).
These positive changes in score from pre-test to post-test corresponded to a 59%
increase for the traditional pretreatment unit, 60% and 66% increases for the traditional
with TBFA units, and 127% and 79% increases for the flipped learning units.
75%
42%
75%
33%
83%
50%
67%
42%
92%
58%
0 10 20 30 40 50 60 70 80 90 100
Post
Pre
Post
Pre
Post
Pre
Post
Pre
Post
Pre
Solu
tions
Ther
mo-
chem
istr
y
Rea
ctio
n
Kin
etic
s
Sto
ichio
-
met
ry
Chem
ical
Rea
ctio
ns
Content Test Scores (%)
Traditional Traditional w/TBFA Flipped Learning

16
An evaluation of normalized gains for all content tests revealed mean normalized
gains between 0.3 and 0.7, which were considered to be medium gain. The mean
normalized gains for the Stoichiometry Content Test from the traditional with TBFA
phase was considerably lower at 0.43 than the mean normalized gain for the Chemical
Reactions Content Test from the traditional pretreatment phase at 0.65. The differences
in gains for the other three content tests compared to the Chemical Reactions Test were
not as dramatic with gains of 0.57 for the Reaction Kinetics & Thermochemistry Content
Tests and 0.51 for Solutions Content Test (Figure 2).
Figure 2. Average normalized gains for pre- and post-content tests, (N=49).
A separate analysis of mean normalized gains was conducted for two groups of
students, students with Individualized Education Plans (IEP) and students with low
academic performance in chemistry. For the group of students with an IEP, mean
normalized gains were consistent with the distribution of normalized gains for the whole
population (N=5). The second group was taken from twelve students who averaged a
0.65
0.43
0.57 0.57
0.51
0.00
0.10
0.20
0.30
0.40
0.50
0.60
0.70
Chemical
Reactions
Stoichiometry Reaction Kinetics Thermochemistry Solutions
Mea
n N
orm
aliz
ed G
ains
Content Test
Traditional Traditional w/TBFA Flipped Learning

17
75% or below overall in chemistry before this classroom research project began. Of
those 12 students, eight actively participated in class and homework activities specific to
the treatment. This was evidenced by homework checks, participation in technology-
based formative assessments, and watching video lectures prior to class. An analysis of
mean normalized gains for this group of eight students revealed an increase from 0.48 in
the traditional unit to 0.61 and 0.64 in the flipped learning units (Figure 3).
Figure 3. Mean normalized gains for participating low performing students, (N=8).
A synopsis of data from summative assessment scores from tests that were
administered at the conclusion of each of the five content units indicated that the median
assessment scores were within the 80th percentile range for all tests regardless of
treatment. The range of test scores was similar for all treatment units spanning from the
40th percentile to the 100th percentile. The traditional unit had a slightly smaller range
from 55% to 99%. Maximum test scores of 100% were earned in the flipped learning
units and for the stoichiometry unit during the traditional with TBFA phase. (Figure 4).
0.480.53
0.580.61
0.64
0
0.1
0.2
0.3
0.4
0.5
0.6
0.7
Chemical
Reactions
Stoichiometry Reaction Kinetics Thermochemistry Solutions
Mea
n N
orm
aliz
ed G
ains
Content Test
Traditional Traditional w/TBFA Flipped Learning

18
Figure 4. Summative unit test scores, (N=49).
A separate analysis of summative test scores for students with an IEP and
participating low performing students was conducted. Students with an IEP maintained
median scores within six percentage points on the summative assessments over the five
content units. There was slight increase from the traditional unit with a median score of
87% compared to the flipped learning units with scores of 90% and 89% (Figure 5).
Figure 5. Summative unit test scores for students with an IEP, (N=5).
85
83
83
87
89
0 10 20 30 40 50 60 70 80 90 100
Solutions
Thermodynamics
Reaction Kinetics
Stoichiometry
Chemical Reactions
Summative Test Score (%)
Traditional Traditional w/TBFA Flipped Learning
87%93%
86%90% 89%
0%
10%
20%
30%
40%
50%
60%
70%
80%
90%
100%
Chemical
Reactions
Stoichiometry Reaction KineticsThermochemistry Solutions
Su
mat
ive
Tes
t S
core
(%
)
Content Unit
Traditional Traditional w/TBFA Flipped Learning

19
Median summative test scores for the low performing students increased from
72% in the traditional unit to 80% and 74% during the traditional with TBFA units and
79% and 81% during the flipped learning units (Figure 6).
Figure 6. Summative unit test scores for participating low performing students, (N=8).
During the traditional pretreatment phase, students were given paper and pencil
formative assessments that were collected and returned with feedback during the next
class session. Due to this method of delivery, students were provided only one attempt to
demonstrate understanding of content. There were five formal formative assessment
opportunities during this phase. Data collected indicated that an average of 78% of the
students demonstrated understanding of content using these formative assessments.
Both treatment phases allowed for the use of technology-based formative
assessments. These types of assessments provided immediate feedback and students
were provided more than one attempt at the assessment. Five formative assessments
72%
80%74%
79% 81%
0%
10%
20%
30%
40%
50%
60%
70%
80%
90%
Chemical
Reactions
Stoichiometry Reaction Kinetics Thermochemistry Solutions
Sum
mat
ive
Tes
t S
core
(%
)
Content Unit
Traditional Traditional w/TBFA Flipped Learning

20
were administered for each treatment unit. During the traditional with TBFA phase, 73%
of students on average demonstrated an understanding of content during their first
attempt at a formative assessment. However, when provided with a second or third
opportunity, the percentage of students who could demonstrate understanding increased
to 96% on average. Similarly, during the flipped learning phase, the average percentage
of students who showed evidence of learning changed from 84% on the first attempt to
98% on subsequent attempts (Figure 7).
Figure 7. Students demonstrating understanding via formative assessments, (N=49).
Student engagement was identified in this classroom research project by the
students’ interest in chemistry, comfort with pace of the lecture component, perceived
level of preparedness, confidence, interest and involvement during class activities, and
completion of assignments. The Pre- and Post-Treatment Surveys revealed that student
interest in chemistry was elevated over the treatment period. The percentage of students
who agreed or strongly agreed that they were interested in chemistry increased from 76%
to 88%. Additionally, the percentage of students who strongly agreed increased from 6%
78%72%
84%
96% 98%
0
10
20
30
40
50
60
70
80
90
100
Traditional Traditional w/TBFA Flipped Learning
Stu
den
ts d
emonst
rati
ong
under
stan
din
g (
%)
First Attempt Last Attempt

21
to 18% after participating in the flipped learning approach with technology-based
formative assessments (Figure 8).
Figure 8. Percentage of students interested in chemistry, (N=49).
Student responses to the Pre-Treatment Survey statements concerning the pace of
lectures indicated that 22% of students felt that traditional lectures were too fast. Only
6% of students in the Post-Treatment Survey felt that similar lectures accessed by video
with the flipped learning approach were too fast. Although the percentage of students
who were comfortable with the lecture pace remained consistent, the percentage of
students who felt that lectures were too slow rose from 4% for traditional lectures to 25%
for the flipped video lectures (Figure 9).
2
%
12%
22%
74%
70%
14%
6%
0% 20% 40% 60% 80% 100%
Post-Treatment
Pre-Treatment
Percentage of Student Responses (%)
Strongly Disagree Disagree Agree Strongly Agree

22
Figure 9. Percentage of student responses on pace of lectures, (N=49).
According to the Post-Treatment Survey, 82% of students felt that they were in
control of the pace of their own learning by utilizing the video lectures. One student
commented, “I miss information when I am trying to listen and take notes in class. I like
the video because everything on it is deliberate, and I can control it if I need to go slower
or go over it again.” Eighty-eight percent of the students interviewed indicated that the
most beneficial aspect of watching the videos at home was the ability to pause, rewind,
and watch again (N=8). According to Pre- and Post-Treatment Survey results, 75% of
students agreed or strongly agreed that it was easy to listen to the video and take notes
compared to 51% for the in-class, traditional lecture. Even a student who thought the
pacing of the flipped video lectures was slow said, “I’m better with a fast pace, but I
could always fast forward through videos. That’s what I would do if I knew something. I
would just focus on the new information.”
4%
74%
22%25%
69%
6%0%
10%
20%
30%
40%
50%
60%
70%
80%
Slow Adequate Fast
Per
cen
tag
e o
f S
tud
ent
Res
po
nse
(%
)
Traditional Lecture Flipped Lecture

23
The level at which students felt prepared for in-class activities and practice was
also measured by the Pre- and Post-Treatment Surveys. The results seemed to suggest
that the traditional approach left students feeling more prepared for in-class activities and
practice than the flipped learning approach (Table 2).
Table 2
Survey Response Concerning Perceived Level of Preparedness
I feel prepared to participate in: Traditional Lecture Flipped Video Lecture
Classroom activities 83% 65%
Laboratory activities 86% 69%
Homework/Classwork practice 83% 80%
Note. (N=49)
However, all students who were present in class had the benefit of participating in
a traditional, in-class lecture. Moving the lecture out of the classroom introduced the
possibility that students did not participate in the flipped video lecture because they chose
not to watch it. Post-Treatment Survey results revealed that 16% of students did not
watch the videos when they were assigned. In order to realize the effect of students who
chose not to watch the videos on the preparedness data, students were grouped according
to the Post-Treatment Survey response: I feel more prepared for class after viewing a
video lecture. Seventy-one percent of students agreed or strongly agreed that they felt
prepared for class as a result of viewing the videos. All of these students watched the
videos when they were assigned, and the majority of this group exhibited positive and
proactive behaviors when interacting with the video lectures (N=35) (Table 3).

24
Table 3
Post-Treatment Survey Responses about Video Lecture from Prepared Group
Agree/Strongly Agree
I watch video lectures when they are assigned. 100%
I take notes on my own while I watch video lectures. 66%
I watch video lectures to prepare for tests and quizzes. 57%
Note. (N=35)
The remaining 29% of students responded that they did not feel prepared for
class. From this group, only 43% of the students responded that they watched the video
lectures when they were assigned, and few exhibited positive behaviors such as note-
taking and watching videos for test and quiz preparation (N=14) (Table 4).
Table 4
Post-Treatment Survey Responses about Video Lecture from Unprepared Group
Agree/Strongly Agree
I watch video lectures when they are assigned. 43%
I take notes on my own while I watch video lectures. 36%
I watch video lectures to prepare for tests and quizzes. 7%
Note. (N=14)
Analytical data from the learning management system where the video lectures
were posted confirmed that the eight students who responded that they did not watch the
videos consistently did not participate in the flipped videos lectures. Removing the
responses from these eight students from the Pre-and Post-Treatment Survey data
revealed a different picture when comparing how prepared students felt with traditional,
in-class lectures versus the flipped video lectures. Students felt only slightly less

25
prepared for classroom and laboratory activities when using flipped video lectures, and
more students felt prepared for homework/classwork practice from the videos (Table 5).
Table 5
Survey Response Concerning Perceived Level of Preparedness Revised
I feel prepared to participate in: Traditional Lecture Flipped Video Lecture
Classroom activities 85% 78%
Laboratory activities 87% 83%
Homework/Classwork practice 85% 95%
Note. (N=41)
Student interviews supported the idea that students who participated in the flipped
video lectures felt prepared for class. One student commented, “I knew what was going
on in class a lot better because I had background information. I wasn’t coming in
wondering what we were learning and completely overwhelmed with new stuff.”
Another student agreed that watching the videos “made it more efficient coming in
knowing what we were doing.”
Student interviews and teacher observations indicated that students came to class
with more confidence and interest during the traditional with TBFA units and the flipped
learning units. Eighty-eight percent of students interviewed indicated that watching
videos prior to class increased their confidence. “It does give me more confidence in
chemistry because I know what I am doing compared to the beginning of the year when I
had to figure it out in class.” Seventy-five percent of students interviewed also agreed
that the technology-based formative assessments that supported the lectures boosted
confidence. One student commented, “I’m not good at seeing what I’m not good at. So,
if I saw that I was bad doing this one thing and good at other stuff, I’d work on that more

26
before the next day.” Students interviewed also appreciated the chance to have multiple
attempts at assessment questions. As one student said, “when you get it wrong, you
know to look for your mistake and correct it so you learn that way.”
Daily observations made by the teacher and by colleagues indicated a disparity in
the level of interest during lecture and during problem-solving, class activity, or lab time.
Traditional class lectures were consistently described as a low engagement and low
interest activity. Students were always described as passive with few asking questions or
volunteering to answer questions. The Pre-Treatment Survey data supports this
observation in that only 18% of students agreed or strongly agreed that they ask
questions during class lecture and 35% agreed or strongly agreed that they answer
questions during discussion. Conversely, observations revealed that students were
always on-task and highly engaged in laboratory activities and problem solving tasks
regardless of the lecture format that preceded it.
The flipped learning approach allowed more time for problem-solving and
laboratory activities in place of lecture time. As a result, more class periods were
described by the teacher and her colleagues as high interest during the flipped learning
treatment phase than during the traditional pretreatment phase. Student interest and
engagement during the traditional with TBFA treatment phase was mixed. When
traditional lecture was coupled with the interactive components of Pear Deck and Kahoot,
more students actively participated in class according to notes in the Daily Teacher
Journal. One student who was interviewed said, “I was more interested in class when we

27
did Kahoot and Pear Deck because of the enjoyment factor.” Another student attributed
her increased interest to the competitive aspect of the technology-based applications.
Teacher records and analytical data from Haiku were used to evaluate homework
completion over the pretreatment and treatment periods. Homework completion
percentages were similar during the traditional pretreatment phase and traditional with
TBFA treatment phase with 70% of students completing homework during the chemical
reactions pretreatment unit compared to 65% and 72% during the stoichiometry and
reaction kinetics units, respectively. Although there was a decline in homework
completion to 63% during the first flipped learning unit of thermochemistry, there was an
increase in homework completion for the second flipped learning unit of solutions to 84%
(Figure 10).
Figure 10. Average percentage of students completing homework, (N=49).
Student participation in classroom activities was tallied using observations
recorded in the Daily Teacher Journal. On a daily basis, the teacher asked an average of
0%
10%
20%
30%
40%
50%
60%
70%
80%
90%
100%
Chemical
Reactions
Stoichiometry Reaction Kinetics Thermochemistry Solutions
Hom
ework
Com
ple
tion (
%)
Content Unit
Traditional Traditional w/TBFA Flipped Learning

28
six questions during a typical class lecture that lasted from 15 to 30 minutes during the
traditional pretreatment phase. On average, 12% of the students would volunteer to
verbally answer per question during the pretreatment phase. In addition, two clarification
questions were asked during or after each lecture on average, and a probing question was
asked on occasion. The average active participation in class and lab activities that
followed class lectures was 97%.
During the traditional with TBFA treatment phase, the averages remained consistent with
the averages from the pretreatment phase unless Pear Deck or Kahoot was used as the
TBFA tool. When these tools were used, the teacher asked an average of 10 questions
which 90% of students answered using the interactive applications. The average number
of clarification and probing questions asked and the average active participation in class
and lab activities remained consistent with the pretreatment phase (Table 6).
Table 6
Comparison of Participation among Treatment Phases
Traditional
Phase
Traditional with
TBFA Phase
using Interactive
Applications
Flipped Learning
Phase
Number of questions
asked 6 10 10
Percentage of students
who volunteer to answer 12% 90% 27%
Number of clarification
questions asked by
students
2 2 3
Number of probing
questions asked by
students
>1 >1 >1
Percentage of active
participation in class/lab
activities
97% 97% 96%

29
A number of students wrote on the Post-Treatment Survey that they enjoyed
participating in both Kahoot and Pear Deck. One student interviewed said, “When we
did Pear Deck, it was fun to move the dot or answer questions so I participated where I
wouldn’t have raised my hand to answer in class.”
Participation in the online video lectures was determined using the analytical data
amassed from Haiku. During the flipped learning units, students watched the videos
when they were assigned with 76% participation on average. Eighty-four percent of
students watched the videos regularly while sometimes missing one or two video
assignments. Sixteen percent of students never watched the videos. Students completed
the coupled online formative assessments with 92% participation indicating that students
who never watched the videos did participate in the formative assessments. This is
supported by Post-Treatment Survey data in which 90% of students agreed or strongly
agreed that they participated in Haiku assessments.
During the flipped learning treatment phase, each class period began with a
discussion highlighting the content of the video lectures. Participation data was tallied
using the Daily Teacher Journal. The teacher asked an average of 10 questions during the
10 to 15 minute discussion. On average, 27% of students volunteered to verbally answer.
The average number of clarification and probing questions asked and the average active
participation in class and lab activities remained consistent with the traditional
pretreatment phase (Table 6). Of the eight students interviewed, 63% agreed that
watching the videos prior to class resulted in their increased participation. One student
said, “I definitely participate more after watching the videos because it makes it easier to

30
answer the questions since I learned it at home and it had time to sink in.” However, for
some the flipped approach had no effect on their participation. A student who was
interviewed explained, “I liked learning online but it didn’t translate to more participation
in class because I just don’t like to talk.”
INTERPRETATION AND CONCLUSION
The data analyzed in this classroom research project suggested that student
academic achievement remained consistent throughout the pretreatment and treatment
phases for the overall population of students involved. However, a positive effect on
student achievement was observed upon isolating achievement data from students with an
IEP and historically low-performing students who fully participated in the flipped
learning activities. The results of this project also suggested that student engagement and
interest in chemistry increased over the treatment period. Furthermore, students actively
participated in classroom discussion more as a result of the flipped learning approach.
Considering the academic achievement of the entire population, median content
test scores improved for each unit regardless of instructional method, and mean
normalized gains were medium for all units as well. The comparison of summative test
scores did not demonstrate a substantial difference in scores either. However, the
traditional pretreatment unit produced the highest median scores and highest mean
normalized gain for both the Pre- and Post-Content Tests and the summative test.
Looking at the content test data, particularly the normalized gains, one could
conclude that the traditional lecture approach during the pretreatment phase afforded the
students the greatest academic success. Being that this is a classroom research project,

31
however, it is important to look at the content and the difficulty of the units that were
compared. The traditional pretreatment unit was chemical reactions. Evidenced by the
high pre-test scores, students had more prior knowledge in this content area than the
others. The unit consisted of identifying reaction types and predicting products of
chemical reactions. Most importantly, the only mathematical component of this chapter
was balancing equations.
The subsequent units had a significant mathematical component to the content. In
addition, students had been introduced to very little of the content in middle school or
first-year biology other than a superficial knowledge of solutions. This was evident from
the low pre-test scores on the content tests. For these reasons, I was comfortable
concluding that utilizing the flipped learning approach in my chemistry classroom had
neither a positive or negative impact on student achievement overall despite higher
median scores and mean normalized gains for the traditional unit.
An argument can be made that use of the flipped learning method coupled with
technology-based formative assessment had a positive effect on student achievement for
two groups of students. Students with an IEP and historically low performing students
who participated in the flipped learning activities earned better test scores in the
treatment units than in the traditional pretreatment unit when qualitatively compared. I
singled out these two groups based on student interviews with one student from each
group. Both students preferred the flipped learning model and the use of technology-
based formative assessments.

32
Students with an IEP achieved equal or better scores on their summative tests for
the treatment units compared to the traditional pretreatment unit. Considering the
difficulty factor and the math component of the treatment units, it could be argued that
the flipped learning approach and use of TBFA had positive impact on their performance.
The student who was interviewed from this group believed she learned best from the
flipped learning approach. She stated that watching the videos at home allowed the
content to sink in before having to apply it in class. She also preferred it because I was
available to help while she was applying the concepts. Additionally, she thought that the
interactive component of the technology-based formative assessments agreed with her
learning style. Although each student in this group had a different IEP, they each
required extra support. The flipped learning approach provided that extra reinforcement
with the availability of content lectures on video and the teacher support during problem
solving and application.
Low performing students who fully participated in the flipped learning activities
also achieved better summative test scores for the treatment units compared to the
traditional pretreatment unit. In addition, the mean normalized gains for the pre- and
post-content tests were highest for the flipped learning units and lowest for the traditional
pretreatment unit. This data implied that the flipped learning approach had a positive
impact on student achievement for this group of students. The student who was
interviewed from this group also believed that he learned best with the flipped learning
approach. He stated that learning from the videos at home worked for him because he
was often tired during our class meetings and not retaining anything from the class

33
lectures. He also said that the TBFA helped him learn because he participated in class
without having to speak aloud. Although each student in this group had a different reason
for low previous academic achievement, this student’s experience illustrated how the
flipped learning approach could lead to improved academic achievement for those whom
the traditional classroom model does not work.
The impact of the flipped learning approach and technology-based formative
assessments on student engagement and participation was measured by students’ interest
in chemistry, comfort with pace of the lecture component, perceived level of
preparedness, confidence, interest and involvement during class activities, and homework
completion. Results suggested that my students were more interested and confident in
chemistry at the conclusion of the treatment units. This may have been attributed to
increased comfort with the pace of the lecture component. Interviewed students cited that
the most beneficial part of the video lectures was the ability to pause, rewind and watch
the videos over. This enabled students to control the pace of their learning. Students
who fully participated in the process also felt equally prepared to engage in class
activities like problem solving and lab work. When students were able to understand the
content enough to apply it, it followed that they were more interested and confident in the
content.
Technology-based formative assessments like Kahoot and Pear Deck were useful
and fun additions to both the traditional lecture approach and the flipped learning
approach. Students were clearly more engaged in the class lectures that included these
technology-based formative assessments. However, their use did not translate into

34
increased student participation in class discussion. The flipped learning approach, on the
other hand, did result in higher participation in class discussion. Again, students were
prepared and more confident to answer questions due to their prior exposure to the
content.
Although students had greater interest in chemistry after the flipped learning
units, it was not watching videos itself that made it more engaging. In fact, several of the
students interviewed liked the videos but felt that it was the quantity of labs and
classroom activities that we did in place of the lecture that made class more engaging.
The data shows that my students were equally interested and involved in classroom
activities and labs regardless of the approach used. Therefore, the element that made
chemistry more interesting after the flipped learning treatment was the time that flipped
learning provided to do more of high interest classroom activities and labs.
Although most of my students preferred the technology-based formative
assessments, not all of my students were on board with the flipped learning approach.
They struggled at first adjusting to watching videos for homework. The homework
completion data showed a decrease in homework completion for the first flipped unit.
Informal discussions with my students during that unit revealed that some did not take the
homework assignment seriously at first while others did not like being introduced to
content without their teacher present to answer their questions. I made some adjustments
based on their feedback for the second flipped unit including providing some guided
notes sheets for them to complete while watching the videos and making the online

35
formative assessments on the video content more straightforward. They responded with
increased homework completion percentages.
This treatment was a disruption to the routine of the students. The small gains
realized during the treatment may have been magnified if the flipped learning approach
coupled with technology-based formative assessments had been integrated into the
classroom routine at the onset of the school year. Although most of my students
eventually accepted the change, there were some who participated fully but still did not
prefer flipped learning. It is possible that they may have had a different opinion if it were
integrated slowly and methodically from the beginning of the course.
VALUE
After all of the videos were made, the lessons were taught, the data was analyzed,
and the conclusions were drawn, the answer to whether the flipped learning approach was
worth introducing and pursuing in my chemistry classroom came from one interview with
one student who did not prefer it. In her interview, she told me that when she watched
the videos she often had questions. She would visit other websites or explore her
textbook to clarify some of the video content so that she was prepared for what we were
going to do in class the next day. Then, she said that she really didn’t like that because
she liked it when the teacher told her what she needed to know and gave her steps to
solve related problems. It was at that moment that the value of this approach was
revealed to me. I was no longer the disseminator of knowledge. Instead, I became the
mentor and coach that Bergman and Waddell (2012) described.

36
Our objective as educators is to teach students not what to learn but how to learn.
In a test-driven atmosphere, students often only want to know what they need to know
while we want them to appreciate and understand the content of what we teach so that
they can apply it. We want to engage with our students during the “understand and
apply” part of the learning process. I think that using the flipped learning approach
during this classroom project provided me this type of engagement with my students as
well as more time to engage with them.
I am looking forward to incorporating the flipped learning model and technology-
based formative assessment tools into my chemistry courses next year. Small
improvements in academic achievement and confidence for students with an IEP and low
performing students validated that this approach is a tool that could make a difference in
helping teachers reach students who otherwise may be left behind. I think it would be
worthwhile to collect data to determine if and how these students benefit from learning
chemistry from the flipped approach for the entire year.
As previously stated, I think that the flipped learning approach should be infused
into the classroom routine from the beginning of the course and will be using what I
learned through this classroom research project to thoughtfully incorporate it next year. I
also think that the video lectures are just a piece to the flipped learning approach. I do
believe that they enhance content discovery, but I believe that students should also be
asked to read, research, and explore simulations as part of the flipped learning
experience. Ultimately, I would like to use the flipped learning approach as a model for

37
my students of how to become independent learners who are responsible for their own
knowledge.
As I reflect on my evolution as a teacher from my first year out of college to
today, there has not been a year in which I have grown more than this year. There are
several factors that I can attribute for this growth, a new school atmosphere, the
supportive, innovative colleagues with whom I work, my different perspective as a
parent, and this action research project. In my practice, I have always attempted to
relinquish the control that a teacher-centered approach provides. I would strive to create
that activity-based atmosphere where students were guided to discover knowledge rather
than led. I always fell short though, and I often reverted back to my comfort zone as the
disseminator of knowledge. Trying the flipped learning approach was a leap of faith that
was unnerving for me. It was a leap that I am glad that I took. Providing my students
with videos and other resources to guide their learning so that class time could be spent
on activities and labs created a balance of teacher control and student exploration with
which I felt comfortable. For the first time, I allowed my students to fail and struggle
before pointing them in the direction of success for them to realize on their own.
Implementing this flipped approach wasn’t easy for me. One of my strengths as a
teacher is that I connect with my students and create trust. When I began the flipped
learning approach, my students were wary, and I could feel the connection and trust that I
had waiver. Through the observations that I made each day for my action research, I
could see the changes though. I could feel the life in my classroom as they were
constantly engaged in one activity or another. As the connection and trust was restored,

38
the classrooms found a rhythm as my students adjusted to my new expectations for them
of how they were going to learn. Through this process, I earnestly began my evolution
into the teacher that I always wanted to become.

39
REFERENCES CITED

40
Bergmann, J., & Sams, A. (2014). Flipped learning: gateway to student engagement:
there's more to flipped learning than just asking students to watch videos at home
and complete worksheets in class. Find out how to use the flipped model to take
your teaching--and your students--to new places. Learning & Leading with
Technology, 41(7), 18-23.
Bergmann, J. & Waddell, D. (2012). To flip or not to flip? Learning & Leading with
Technology: International Society for Technology in Education (ISTE), 39(8), 6-
7.
Finkel, E. (2012). Flipping the Script in K12: ‘Flipped classrooms’ gain ground, as
students watch lectures on video, mostly at home, then do what would be
‘homework’ in class. District Administration, 48(10), 28-30, 32,34.
Flipped Learning Network (FLN). (2014). The Four Pillars of F-L-I-P™. Retrieved
October 11, 2015, from http://flippedlearning.org/cms/lib07/VA01923112/
Centricity/Domain/46/FLIP_handout_FNL_Web.pdf.
Fulton, K. (2012). The Flipped Classroom: Transforming Education at Byron High
School. T H E Journal, 39(3), 18-20.
Goodwin, B. & Miller, K. (2013). Research says evidence on flipped classrooms is still
coming in. Educational Leadership, 70(6), 78-80.
Johnson, L., Adams Becker, S., Estrada, V., and Freeman, A. (2015). NMC Horizon
Report: 2015 Higher Education Edition. Austin, Texas: The New Media
Consortium.
Kim, K.K., Kim, S.O., Khera, O., & Getman, J. (2014). The experience of three flipped classrooms in an urban university: an exploration of design principles. The Internet and Higher Education, 22, 37-50.
Lage, M. J., Platt, G. J., & Treglia, M. (2000). Inverting the Classroom: A Gateway to
Creating an Inclusive Learning Environment. Journal of Economics Education,
31(1), 30-43.
Marlowe, C. A. (2012). The effect of the flipped classroom on student achievement and
stress. (Unpublished Professional Paper). Montana State University, Bozeman,
Montana.
Millard, E. (2012). 5 Reasons Flipped Classrooms Work: Turning lectures into
homework to boost student engagement and increase technology-fueled creativity.
University Business, 15(11), 26.

41
Milman, N. B. (2012). The flipped classroom strategy: what is it and how can it best be
used? Distance Learning, 9(3), 85+. Retrieved December 5, 2015, from
http://go.galegroup.com/ps/i.do?id=GALE%7CA305660562&v=2.1&u=monash
&it=r&p=AONE&sw=w&asid=83eb2cb972cfc092f59ad15b94e4f337#.
National Center for Educational Statistics. (2015). Search for Public Schools – School
Detail for West Morris Central High School. Retrieved December 6, 2015, from
http://nces.ed.gov/ccd/schoolsearch/school_detail.asp?Search=1&SchoolID=3417
55004550&SchoolType=1&SchoolType=2&SchoolType=3&SchoolType=4&Spe
cificSchlTypes=all&IncGrade=-1&LoGrade=-1&HiGrade=-
1&ID=341755004550.
National Research Council. (2012). A Framework for K-12 Science Education: Practices,
Crosscutting Concepts, and Core Ideas. Committee on a Conceptual Framework
for New K-12 Science Education Standards. Board on Science Education,
Division of Behavioral and Social Sciences and Education. Washington, DC: The
National Academies Press.
NGSS Lead States. (2013). Next Generation Science Standards: For States, By States.
Washington, DC: National Academies Press.
Sams, A. & Bergman, J. (2013). Flip Your Students’ Learning. Educational Leadership,
70(6), 16-20.
Schultz, D., Duffield, S., Rasmussen, S., & Wageman, J. (2014). Effects of the Flipped
Classroom Model on Student Performance for Advanced Placement High School
Chemistry Students. Journal of Chemical Education, 91(9), 1334-1339.
Sparks, S.D. (2011). “Flip for Lesson Model Promoted by Khan Academy. Education
Week, 31(5), 12-14.
West Morris Central High School. (2015). 2015 – 2016 School Profile. Retrieved
December 6, 2015, from http://central.wmrhsd.org/WWW_FILES/Guidance/
Profile%20for%202015-2016.pdf.

42
APPENDICES

43
APPENDIX A
INSTITUTIONAL REVIEW BOARD EXEMPTION

44

45
APPENDIX B
CHEMICAL REACTIONS CONTENT TEST

46
Chemical Reactions Content Test
1. Given the equation: 2Na +Cl2 2NaCl, which of the following is a reactant in the
equation?
a. Na b. NaCl c. 2 d.
2. Given the equation: 2Na +Cl2 2NaCl, which of the following is a product in the
equation?
a. Na b. NaCl c. 2 d.
3. Given the equation: 2Na +Cl2 2NaCl, if 46 grams of Na are reacted with 71 grams
of Cl2, how many grams of NaCl will be formed?
a. 46 grams d. 234 grams
b. 71 grams e. It will vary
c. 117 grams
4. Given the equation: 4Ca(OH)2, which is true?
a. 4 is the coefficient and 2 is the subscript
b. 4 is the subscript and 2 is the coefficient
c. Both numbers are subscripts.
d. Both numbers are coefficients.
5. Which balanced equation represents a double replacement reaction?
a. Mg + 2AgNO3 Mg(NO3)2 + 2Ag
b. 2Mg + O2 2MgO
c. MgCO3 MgO + CO2
d. MgCl2 + 2AgNO3 2AgCl + Mg(NO3)2
6. Which balanced equation represents a single replacement reaction?
a. Mg + 2AgNO3 Mg(NO3)2 + 2Ag
b. 2Mg + O2 2MgO
c. MgCO3 MgO + CO2
d. MgCl2 + 2AgNO3 2AgCl + Mg(NO3)2
7. Which balanced equation represents a decomposition reaction?
a. Mg + 2AgNO3 Mg(NO3)2 + 2Ag
b. 2Mg + O2 2MgO
c. MgCO3 MgO + CO2
d. MgCl2 + 2AgNO3 2AgCl + Mg(NO3)2
8. Which balanced equation represents a synthesis reaction?
a. Mg + 2AgNO3 Mg(NO3)2 + 2Ag
b. 2Mg + O2 2MgO
c. MgCO3 MgO + CO2
d. MgCl2 + 2AgNO3 2AgCl + Mg(NO3)2

47
9. Given the activity series below, which element will be able to replace magnesium in
the compound, MgCl2?
a. chromium c. iron
b. calcium d. hydrogen
10. Which set of numbers will correctly balance the following reaction:
____ KBr + ____ Na2S ____ K2S + _____ NaBr
a. 1:1:1:1 c. 2:1:1:2
b. 1:2:2:1 d. 1:2:1:2
11. Which set of numbers will correctly balance the following reaction:
____ FeS2 + ____ O2 ____ Fe2O3 + ____ SO2
a. 2:8:1:4 c. 4:7:2:8
b. 2:11:1:4 d. 4:11:2:8
12. What is the precipitate in the following reaction?
MgCl2(aq) + 2AgNO3(aq) 2AgCl(s) + Mg(NO3)2(aq)
a. MgCl2 c. AgCl
b. AgNO3 d. Mg(NO3)2

48
APPENDIX C
STOICHIOMETRY CONTENT TEST

49
Stoichiometry Content Test
1. How many copper atoms are there in 1.00 mole?
a. 29 b. 63.5 c. 6.02 x 10²³ d. 1.05 x 10²³
2. Which of the following is equal to one mole of carbon?
a. 1.00 gram c. 12.0 grams
b. 6.02 grams d. 6.02 x 10²³ grams
3. What is the percentage of sodium in NaCl?
a. 39.3% b. 50.0% c. 60.7% d. 64.5%
4. The molar mass of potassium bromide is
a. 110.0 g/mole c. 158.0 g/mole
b. 119.0 g/mole d. 199.0 g/mole
5. Given the equation: 2Na + Cl2 → 2NaCl, how many moles of sodium chloride are
created from 4 moles of chlorine?
a. 1 mole b. 2 moles c. 4 moles d. 8 moles
6. For the following reaction: 2KClO3(s) → 2KCl(l) + 3O2(g), what is the molar ratio of
potassium chlorate to oxygen?
a. 1:1 b. 2:2 c. 2:3 d. 3:2
7. Assume ideal stoichiometry in the reaction CH4 + 2O2 → CO2 + 2H2O. If you know
the mass of CH4, what can you calculate?
a. Only the mass of CO2 produced
b. Only the mass of O2 reacting
c. Only the mass of CO2 and H2O produced
d. The mass of O2 reacting and the masses of CO2 and H2O produced
8. For the reaction C3H4(g) + 4O2(g) → 3CO2(g) + 2H2O(l), how many grams of water
are produced if 80.0 grams of C3H4 react?
a. 18 grams of H2O c. 72 grams of H2O
b. 40 grams of H2O d. 160 grams of H2O
9. The Haber process for producing ammonia commercially is represented by the
equation N2(g) + 3H2(g) → 2NH3(g). How many moles of H2 are required to produce
18 moles of NH3?
a. 12 moles of H2 c. 27 moles of H2
b. 18.0 moles of H2 d. 36 moles of H2

50
10. If a chemical reaction involving substances A and B stops when B is completely used
up, then B is referred to as the ____.
a. excess reactant c. limiting reactant
b. primary reactant d. primary product
11. If a chemist calculates the maximum amount of product that could be obtained in a
chemical reaction, she is calculating the ____.
a. percentage yield c. theoretical yield
b. mole ratio d. actual yield
12. For the equation: 2Al + 3Cl2 → 2AlCl3, what is the maximum number of moles of
AlCl3 that can be produced from 5.0 moles of Al and 6.0 moles of Cl2?
a. 2.0 moles of AlCl3 c. 5.0 moles of AlCl3
b. 4.0 moles of AlCl3 d. 6.0 moles of AlCl3

51
APPENDIX D
REACTION KINETICS CONTENT TEST

52
Reaction Kinetics Content Test
1. The sequence of steps that occurs in a reaction process is called the
a. order of the reaction c. overall reaction
b. rate law d. reaction mechanism
2. One factor that cannot be adjusted in order to improve a reaction rate is
a. temperature c. nature of the reactant
b. surface area d. concentration
3. A species that changes the rate of reaction but is neither consumed nor changed is
a. a catalyst c. an intermediate
b. an activated complex d. a reactant
4. Two molecules cannot react if there is not enough
a. kinetic energy c. time
b. pressure d. volume
5. In a graph of how energy changes with reaction progress, the activated complex
appears at the
a. left end of the curve c. bottom of the curve
b. right end of the curve d. peak of the curve
6. To be effective, a collision requires
a. enough energy only.
b. a favorable orientation.
c. enough energy and a favorable orientation.
d. a reaction mechanism.
7. Which of the following equations represents an endothermic reaction?
a. N2O4 + 59kJ → 2NO2
b. 2H2 + O2 → 2H2O + 572 kJ
c. 2BrCl - 29.3kJ → Br2 + Cl2
d. 2H2 + O2 → 2H2O H = -572 kJ
8. Which energy diagram represents an exothermic reaction?
a. b.

53
9. If
the concentration of reactants is higher,
a. the reaction rate of the forward reaction is generally higher.
b. the reaction rate of the forward reaction is generally lower.
c. the reaction rate is generally not affected.
d. the reverse reaction is favored.
10. What impact does an increase in temperature generally have on the rate of reaction?
a. It decreases it. c. It increases it.
b. It has no impact. d. There is no way to measure it.
11. Consider the following energy diagram:
What is amount of activation energy required for the forward reaction?
a. 40 kJ b. 60 kJ c. 80 kJ d. 100 kJ
12. Referring to the energy diagram in the previous question, what is the heat of reaction
( H) for this reaction?
a. 20 kJ b. 80 kJ c. -20 kJ d. -80 kJ

54

55
APPENDIX E
THERMOCHEMISTRY CONTENT TEST
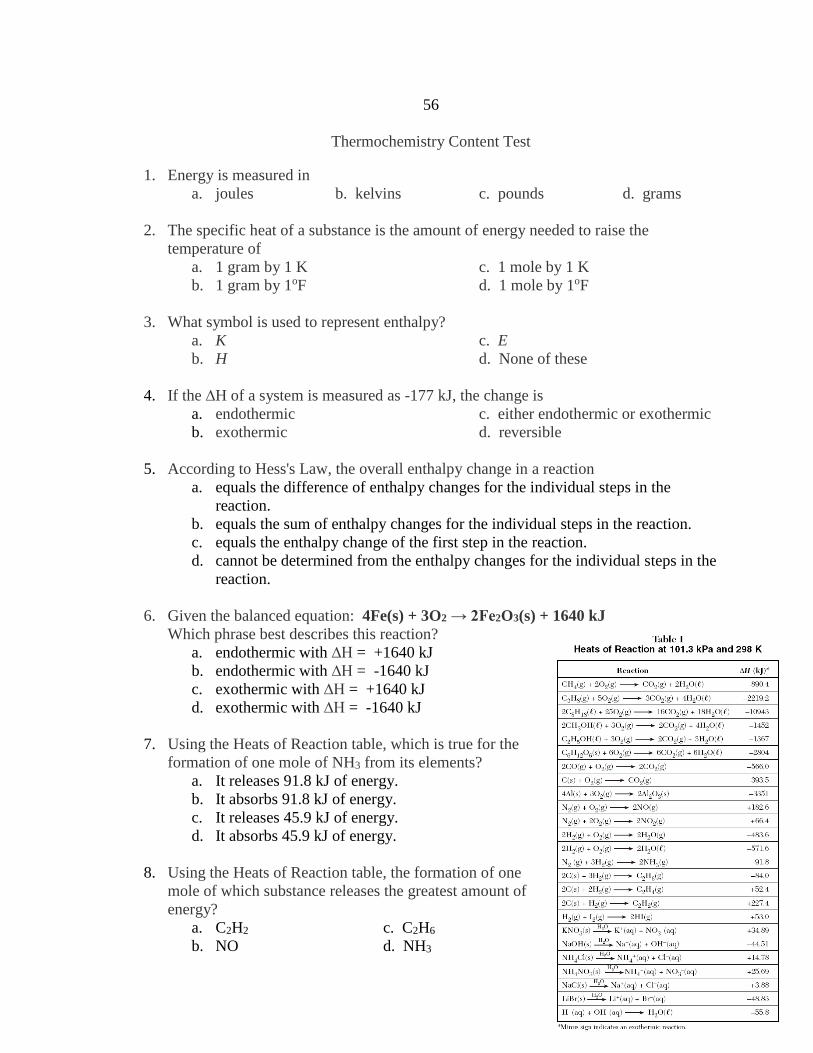
56
Thermochemistry Content Test
1. Energy is measured in
a. joules b. kelvins c. pounds d. grams
2. The specific heat of a substance is the amount of energy needed to raise the
temperature of
a. 1 gram by 1 K c. 1 mole by 1 K
b. 1 gram by 1oF d. 1 mole by 1oF
3. What symbol is used to represent enthalpy?
a. K c. E
b. H d. None of these
4. If the ∆H of a system is measured as -177 kJ, the change is
a. endothermic c. either endothermic or exothermic
b. exothermic d. reversible
5. According to Hess's Law, the overall enthalpy change in a reaction
a. equals the difference of enthalpy changes for the individual steps in the
reaction.
b. equals the sum of enthalpy changes for the individual steps in the reaction.
c. equals the enthalpy change of the first step in the reaction.
d. cannot be determined from the enthalpy changes for the individual steps in the
reaction.
6. Given the balanced equation: 4Fe(s) + 3O2 → 2Fe2O3(s) + 1640 kJ
Which phrase best describes this reaction?
a. endothermic with ∆H = +1640 kJ
b. endothermic with ∆H = -1640 kJ
c. exothermic with ∆H = +1640 kJ
d. exothermic with ∆H = -1640 kJ
7. Using the Heats of Reaction table, which is true for the
formation of one mole of NH3 from its elements?
a. It releases 91.8 kJ of energy.
b. It absorbs 91.8 kJ of energy.
c. It releases 45.9 kJ of energy.
d. It absorbs 45.9 kJ of energy.
8. Using the Heats of Reaction table, the formation of one
mole of which substance releases the greatest amount of
energy?
a. C2H2 c. C2H6
b. NO d. NH3

57
9. When two moles of KNO3(s) is dissolved in water the heat of solution is
+34.89. What happens to the temperature of the water?
a. It increases as 34.89 kJ of energy is released.
b. It increases as 69.78 kJ of energy is released.
c. It decreases as 34.89 kJ of energy is absorbed.
d. It decreases as 69.78 kJ of energy is absorbed.
10. Which of the following is not needed to calculate the energy required to increase the
temperature of a substance?
a. the mass of the substance c. the molar mass of the substance
b. the specific heat of the substance d. the temperature change
11. Use Hess's Law to calculate the enthalpy of reaction:
XeF2(s) + F2(g) → XeF4(s) , ∆H = ?
Given the following enthalpy changes,
Xe(g) + F2(g) → XeF2(s) , ∆H = -123 kJ
Xe(g) + 2F2(g) → XeF4(s), ∆H = -262 kJ
a. -385 kJ b. -139 kJ c. +139 kJ d. +385 kJ
12. How much energy is absorbed when 100.0 grams of CaO reacts according to the
equation below?
CaO + 3C → CaC2 + CO, ∆H = +464.8 kJ
a. 260 kJ b. 464.8 kJ c. 830 kJ d. 929.6 kJ

58
APPENDIX F
SOLUTIONS CONTENT TEST

59
Solutions Content Test
1. All homogeneous solutions have all of the following properties except
a. the dissolved particles are molecular in scale (size).
b. the particles are evenly distributed.
c. the particles do not settle to the bottom.
d. the final physical state is a liquid.
2. A solution that contains as much solute as possible under a given set of conditions is
called
a. saturated c. concentrated
b. soluble d. miscible
3. Polar solids best dissolve in solvents that are
a. immiscible c. nonpolar
b. transparent d. polar
4. The rate at which a solid solute dissolves in a solvent is affected by all of the
following except
a. temperature c. pressure
b. stirring d. crushing
5. Colligative properties of solutions depend on the
a. chemical nature of the solute c. number of moles of solvent
b. chemical nature of the solvent d. concentration of solute particles
6. Referring to the solubility curve, what happens to a saturated solution of NaNO3 at
30oC when it is heated to 50oC?
a. It is unchanged.
b. It becomes unsaturated.
c. It becomes supersaturated.
d. Excess solute precipitates out of solution.
7. Referring to the solubility curve, how many grams of
KNO3 would be needed to make a saturated solution in
100 g of water at 40oC?
a. 42 grams c. 68 grams
b. 10.5 grams d. over 100 grams
8. Referring to the solubility curve, how many grams of
KClO3 needs to be dissolved in 50 g of water to have a
saturated solution at 80oC?
a. 21 grams c. 42 grams
b. 10.5 grams d. 84 grams

60
9. When the energy released by forming solvent-solute attractions is greater than the
energy absorbed by overcoming solute-solute and solvent-solvent attractions, a
dissolving process
a. has a negative heat of solution
b. has a positive heat of solution
c. decrease the temperature of the solution
d. is endothermic
10. The concentration of a solution can be quantitatively measured by calculating
a. molarity c. both of these
b. molality d. neither of these
11. Which of the following types of compounds is most likely to be a strong electrolyte?
a. a polar compound c. a covalent compound
b. a nonpolar compound d. an ionic compound
12. How many moles of NaOH are contained in 2.5 L of a 0.010 M solution?
a. 0.010 moles b. 1.0 moles c. 0.025 moles d. 0.40 moles

61
APPENDIX G
STUDENT PRE-TREATMENT SURVEY

62
Student Pre-Treatment Survey
Participation in this research survey is voluntary and participation or non-participation
will not affect student’s grades or class standing in any way.
Directions: Read each statement and check the box that best reflects your feelings about
the statement.
Strongly
Agree Agree Disagree
Strongly
Disagree
I am interested in chemistry.
During class lectures, the pacing is too
slow.
During class lectures, the pacing is
adequate.
During class lectures, the pacing is too
fast.
During class lectures, it is easy for me
to listen and take notes at the same
time.
I often ask questions during a class
discussion.
I often offer to answer questions that
my teacher asks during a class
discussion.
I feel prepared to participate in
classroom activities as a result of a
class lecture.
I feel prepared to participate in
laboratory activities as a result of a
class lecture.
I fell prepared to complete my
homework practice as a result of a
class lecture.
I complete all of my chemistry
homework assignments.
I watch video lectures when they are
assigned.
I only watch a video lecture when it is
necessary to complete a homework
assignment or assessment.
I take notes on my own while I watch
video lectures.

63
I watch video lectures to prepare for
tests and quizzes.
I feel more prepared for class after
viewing a video lecture.
I feel that I control the pace of my
learning when I utilize the video
lectures.
I participate in Haiku assessments
even when they are not graded.
I feel that completing the Haiku
assessments helps me to learn
chemistry.
I often retake the Haiku assessments
when I do not answer most of the
questions correctly.
I am responsible for my own learning
in chemistry.
I am responsible for my own success
in chemistry.

64
APPENDIX H
STUDENT POST-TREATMENT SURVEY

65
Student Post-Treatment Survey
Participation in this research survey is voluntary and participation or non-participation
will not affect student’s grades or class standing in any way.
Directions: Read each statement and check the box that best reflects your feelings about
the statement.
Strongly
Agree Agree Disagree
Strongly
Disagree
I am interested in chemistry.
During video lectures, the pacing is
too slow.
During video lectures, the pacing is
adequate.
During video lectures, the pacing is
too fast.
During video lectures, it is easy for me
to listen and take notes at the same
time.
I often ask questions during a class
discussion.
I often offer to answer questions that
my teacher asks during a class
discussion.
I feel prepared to participate in
classroom activities as a result of a
video lecture.
I feel prepared to participate in
laboratory activities as a result of a
video lecture.
I fell prepared to complete my
homework practice as a result of a
video lecture.
I complete all of my chemistry
homework assignments.
I watch video lectures when they are
assigned.
I only watch a video lecture when it is
necessary to complete a homework
assignment or assessment.

66
I take notes on my own while I watch
video lectures.
I watch video lectures to prepare for
tests and quizzes.
I feel more prepared for class after
viewing a video lecture.
I feel that I control the pace of my
learning when I utilize the video
lectures.
I participate in Haiku assessments
even when they are not graded.
I feel that completing the Haiku
assessments helps me to learn
chemistry.
I often retake the Haiku assessments
when I do not answer most of the
questions correctly.
I am responsible for my own learning
in chemistry.
I am responsible for my own success
in chemistry.

67

68
APPENDIX I
POST-TREATMENT STUDENT INTERVIEW

69
Post Treatment Student Interview
Participation in this research survey is voluntary and participation or non-participation
will not affect student’s grades or class standing in any way.
1. How do you think you learn best? Do you think that traditional classroom lecture,
traditional lecture with Haiku assessments, or online video lectures and Haiku
assessments support your preferred method of learning?
2. What was most and least beneficial to you about the video lectures? Why?
3. What was most and least beneficial to you about the Haiku assessments? Why?
4. Did you only view the video lectures when they were assigned? If not, when and for
what purpose did you re-watch them?
5. How do you think watching the videos affected your engagement (participation,
interest, confidence) in chemistry class?
6. How do you think completing the Haiku assessments affected your engagement
(participation, interest, confidence) in chemistry class?
7. Can you suggest any changes or improvements to the format or content of the Haiku
assessments for next time? Please provide reasoning.
8. Can you suggest any changes or improvements to the format or content of the videos
for next time? Please provide reasoning.
9. Is there anything else that you would like me to know about in this blended learning
(online and classroom) environment?

70
APPENDIX J
DAILY TEACHER JOURNAL

71
Daily Teacher Journal Date __________
Haiku Participation:
Number of students who viewed video lecture: ______
Number of students who attempted online assessment: ______
Number of students who completed online assessment to mastery level: ______
Classroom Participation:
Number of questions asked by teacher: ______
Average number of students who volunteer to answer: ______
Tally here:
Number of students on-task in classroom activity/lab: ______
Number of clarification questions asked during classroom activity/lab: ______
Number of probing questions asked during classroom activity/lab: ______
Approximate time spent on each classroom activity:
Teacher Notes & Reflection:
Describe the engagement/interest level of students today.
Memorable/thoughtful comments and questions by students.
Did the use of the video lectures and assessments enhance today’s class?