Experimentally supported mathematical modeling of ... - CORE
217
General rights Copyright and moral rights for the publications made accessible in the public portal are retained by the authors and/or other copyright owners and it is a condition of accessing publications that users recognise and abide by the legal requirements associated with these rights. • Users may download and print one copy of any publication from the public portal for the purpose of private study or research. • You may not further distribute the material or use it for any profit-making activity or commercial gain • You may freely distribute the URL identifying the publication in the public portal If you believe that this document breaches copyright please contact us providing details, and we will remove access to the work immediately and investigate your claim. Downloaded from orbit.dtu.dk on: Dec 20, 2017 Experimentally supported mathematical modeling of continuous baking processes Stenby Andresen, Mette; Løje, Hanne; Adler-Nissen, Jens Publication date: 2013 Document Version Publisher's PDF, also known as Version of record Link back to DTU Orbit Citation (APA): Stenby Andresen, M., Løje, H., & Adler-Nissen, J. (2013). Experimentally supported mathematical modeling of continuous baking processes. Kgs. Lyngby: Technical University of Denmark (DTU).
-
Upload
khangminh22 -
Category
Documents
-
view
5 -
download
0
Transcript of Experimentally supported mathematical modeling of ... - CORE

General rights Copyright and moral rights for the publications made accessible in the public portal are retained by the authors and/or other copyright owners and it is a condition of accessing publications that users recognise and abide by the legal requirements associated with these rights.
• Users may download and print one copy of any publication from the public portal for the purpose of private study or research. • You may not further distribute the material or use it for any profit-making activity or commercial gain • You may freely distribute the URL identifying the publication in the public portal
If you believe that this document breaches copyright please contact us providing details, and we will remove access to the work immediately and investigate your claim.
Downloaded from orbit.dtu.dk on: Dec 20, 2017
Experimentally supported mathematical modeling of continuous baking processes
Stenby Andresen, Mette; Løje, Hanne; Adler-Nissen, Jens
Publication date:2013
Document VersionPublisher's PDF, also known as Version of record
Link back to DTU Orbit
Citation (APA):Stenby Andresen, M., Løje, H., & Adler-Nissen, J. (2013). Experimentally supported mathematical modeling ofcontinuous baking processes. Kgs. Lyngby: Technical University of Denmark (DTU).

Experimentally supportedmathematical modeling ofcontinuous baking processes
Mette Stenby AndresenPhD Thesis2013


Experimentally supportedmathematical modeling ofcontinuous baking processes
Mette Stenby AndresenPhD Thesis
Division of Industrial Food ResearchNational Food InstituteTechnical University of Denmark
June 2013
Supervisors
Professor, dr.techn. Jens Adler-Nissen, Division of Industrial Food ResearchAssistant professor, PhD Hanne Løje, Division of Industrial Food Research


Preface
This thesis is based on research carried out as a PhD project at the Division of IndustrialFood Research, National Food Institute at the Technical University of Denmark, fromDecember 15, 2008, to June 20, 2013. The overall scope of the research has been toinvestigate the influence of industrial baking process conditions on the quality of bakeryproducts.
The PhD project is part of a larger project supported by the Danish Ministry of Food,Agriculture and Fisheries titled “Continuous baking: New opportunities for control ofproduct quality in the tunnel ovens of the future for the bakery industry”1. Financialsupport was granted in March 2009 under the Innovation Law with the project number:3414-08-02280.
The PhD project was prolonged for a total of eight months due to leaves of absence. Theseperiods were primarily used to plan and teach the advanced DTU course “hygienic designi the food industry” in the fall of 2010 and 2011.
It is my hope that the present work will help researchers and students in future studiesof the effect of oven conditions on bakery product quality.
Mette Stenby AndresenJune 2013
1DK title: Kontinuerlig bagning: Nye muligheder for styring af produktkvalitet i fremtidens tunnelovnetil bageriindustrien
v


Acknowledgments
I am very grateful to my supervisors professor, dr.techn. Jens Adler-Nissen and assistantprofessor, PhD Hanne Løje. Your advice, help, ideas, and support have been invaluablethroughout this project.
Through the good collaboration with Haas-Meincke A/S I have had the pleasure of work-ing with many friendly and competent people. Especially I would like to thank KjeldRasmussen, Brian Nielsen, and Lars Guldager. I greatly appreciate how you have sup-ported my project and helped whenever needed.
In some aspects associate professor Jørgen Risum has supported my project as an addi-tional supervisor. His incredible knowledge of everything related to food technology andphotography has saved the day more than once. For valuable discussions of modeling,equations, and simulations I thank my good colleague Dr. Aberham Hailu Feyissa, andhis thesis on heat and mass transfer in solid foods is highly recommended for furtherreading. Thanks to all my colleagues in the Division I, and especially the FPE group, fora positive and supportive atmosphere. I am thankful to Peter Stubbe for his invaluabletechnical assistance with the oven.
My family has been the most encouraging and loving support I could ever wish for. Annie,Erling, Peter, and Henrik I love you and appreciate all your help throughout my life, andthis project. Special thanks to Hanne Andresen for proof reading the manuscript.
I would like to thank Løgumkloster Refugium for supporting my work through a weekof immersion and contemplation. For financial support I thank the Danish Ministry ofFood, Agriculture and Fisheries.
vii


Summary
The scope of the PhD project was to increase knowledge on the process-to-product inter-actions in continuous tunnel ovens. The work has focused on five main objectives. Theseobjectives cover development of new experimental equipment for pilot plant baking ex-periments, mathematical modeling of heat and mass transfer in a butter cookie product,and evaluation of quality assessment methods.
The pilot plant oven is a special batch oven designed to emulate continuous convectiontunnel oven baking. The design, construction, and validation of the oven has been part ofthe project and is described in this thesis. The oven was successfully validated against a10 m tunnel oven. Besides the ability to emulate the baking conditions in a tunnel oven,the new batch oven is designed and constructed for experimental research work. In thedesign options to follow the product continuously (especially weight and temperature)and control the process (air flow, temperature, and humidity) are therefore emphasized.The oven is furthermore designed to work outside the range of standard tunnel ovens,making it interesting for manufacturers of both baking products and baking equipment.
A mathematical model describing the heat and mass transfer in butter cookies duringbaking was formulated. The model was solved numerically by the use of a finite elementmethod. Model optimization and validation was successfully carried out against experi-mental data obtained in the new pilot plant oven. The effect of the baking tray on masstransfer was examined through comparison of different modeling set-ups and experimentaldata. It was found that while the baking tray is likely to reduce the evaporation from thebottom surface, it is not correct to assume that no evaporation takes place at the coveredsurface.
Parallel to the construction of the pilot oven an advanced multi-spectral imaging methodwas investigated as a method for quality assessment of butter cookies. The ability ofthe method to assess multiple quality aspects from one image was the main focus of thestudy. The system was able to predict both the surface browning and the water contentin butter cookies.
ix


Resumé
Det grundlæggende formål med ph.d.-projektet har været at undersøge proces-til-produktinteraktioner i kontinuerte tunnelovne. Arbejdet i projektet har været centreret omkringfem primære målsætninger. Disse omfatter udvikling af en ny eksperimentel pilot plantovn, matematisk modellering af energi- og massetransport i et småkageprodukt samtevaluering af metoder til kvalitetsbestemmelse af småkager.
Pilot plant ovnen er en batchovn specielt bygget til at efterligne kontinuert konvektions-bagning i tunnelovne. Design, konstruktion og validering af ovnen var en del af projektetog er beskrevet i denne afhandling. Ovnen blev succesfuldt valideret mod en 10 m tun-nelovn. Udover ovnens evne til at efterligne bagebetingelserne i en tunnelovn er dendesignet og bygget til brug i forskningsforsøg. Der er derfor lagt stor vægt på at produk-tet kan følges kontinuert (især vægt og temperatur), samt at processen kan kontrolleresog varieres (luftflow, temperatur og fugtighed). Ovnen er desuden bygget til at fungereuden for det normale procesvindue for den undersøgte type af tunnelovne.
En matematisk model der beskriver energi- og massetransport i en småkage er blevet ud-viklet. Modellen er løst numerisk med en finite element metode. Optimering og valideringaf modellen blev udført ved brug af eksperimentelle måleresultater fra den nye pilot plantovn. Bagepladens effekt på fordampning i småkager blev undersøgt gennem forskelligemodelleringsopsætninger og sammenligninger med data fra pilot plant ovnen. Under-søgelserne viste at selvom bagepladen ser ud til at mindske fordampningen fra undersidenaf småkagen, er det ikke korrekt at antage at den forhindrer al fordampning fra denneoverflade.
Foruden udviklingen af den nye pilot plant ovn blev en avanceret multi-spektral billede-analysemetode undersøgt med henblik på kvalitetsbestemmelse af småkager. Metodensevne til at bestemme flere kvalitetsparametre fra et billede var det primære fokus i denneundersøgelse. Metoden viste sig at kunne forudsige både overfladebruning og vandind-holdet i de undersøgte småkager.
xi


Contents
List of symbols 1
1 Introduction 31.1 Scientific contributions . . . . . . . . . . . . . . . . . . . . . . . . . . . . . 51.2 Structure of the PhD thesis . . . . . . . . . . . . . . . . . . . . . . . . . . 7
2 Background and hypothesis 92.1 Industrial baking ovens
- from batch to continuous production . . . . . . . . . . . . . . . . . . . . 92.1.1 The investigated oven type . . . . . . . . . . . . . . . . . . . . . . . 10
2.2 Bakery products . . . . . . . . . . . . . . . . . . . . . . . . . . . . . . . . . 112.2.1 Investigated product groups . . . . . . . . . . . . . . . . . . . . . . 12
2.3 State of the art . . . . . . . . . . . . . . . . . . . . . . . . . . . . . . . . . 142.3.1 Heat and mass transfer modeling . . . . . . . . . . . . . . . . . . . 142.3.2 Laboratory and pilot scale ovens for research and model validation . 182.3.3 State of the art summary . . . . . . . . . . . . . . . . . . . . . . . . 22
2.4 Project hypotheses . . . . . . . . . . . . . . . . . . . . . . . . . . . . . . . 25
3 Mechanistic description of baking processes 273.1 Ingredients and dough preparation . . . . . . . . . . . . . . . . . . . . . . 273.2 The baking process . . . . . . . . . . . . . . . . . . . . . . . . . . . . . . . 29
3.2.1 Bread baking . . . . . . . . . . . . . . . . . . . . . . . . . . . . . . 293.2.2 Biscuit baking . . . . . . . . . . . . . . . . . . . . . . . . . . . . . . 32
3.3 Complexity and modeling . . . . . . . . . . . . . . . . . . . . . . . . . . . 33
4 Quality assessment methods for bakery products 354.1 Objective quality assessment . . . . . . . . . . . . . . . . . . . . . . . . . . 35
4.1.1 Quality assessment methods in academic literature . . . . . . . . . 36
xiii

4.1.2 Evaluation of physical dimensions . . . . . . . . . . . . . . . . . . . 374.1.3 Evaluation of appearance . . . . . . . . . . . . . . . . . . . . . . . . 384.1.4 Texture evaluation . . . . . . . . . . . . . . . . . . . . . . . . . . . 394.1.5 Product composition . . . . . . . . . . . . . . . . . . . . . . . . . . 40
4.2 Choosing assessment methods for the present work . . . . . . . . . . . . . 404.3 Multi-spectral image analysis as a quality assessment method . . . . . . . . 434.4 Summary for assessment methods . . . . . . . . . . . . . . . . . . . . . . . 45
5 Design and construction of a specialized batch oven 475.1 The general design of the batch oven . . . . . . . . . . . . . . . . . . . . . 495.2 Process control . . . . . . . . . . . . . . . . . . . . . . . . . . . . . . . . . 49
5.2.1 Temperature measurements . . . . . . . . . . . . . . . . . . . . . . 495.2.2 Heating systems . . . . . . . . . . . . . . . . . . . . . . . . . . . . . 515.2.3 Air humidity . . . . . . . . . . . . . . . . . . . . . . . . . . . . . . 54
5.3 The inlet air flow . . . . . . . . . . . . . . . . . . . . . . . . . . . . . . . . 555.4 Product monitoring . . . . . . . . . . . . . . . . . . . . . . . . . . . . . . . 58
5.4.1 Product weight . . . . . . . . . . . . . . . . . . . . . . . . . . . . . 585.4.2 Product temperature . . . . . . . . . . . . . . . . . . . . . . . . . . 595.4.3 Visual inspection . . . . . . . . . . . . . . . . . . . . . . . . . . . . 59
5.5 Summary of oven design . . . . . . . . . . . . . . . . . . . . . . . . . . . . 60
6 Validation of the batch oven 616.1 Quality parameters for the validation experiments . . . . . . . . . . . . . . 616.2 Uniform heating and baking in the batch oven . . . . . . . . . . . . . . . . 63
6.2.1 Estimating the heat transfer coefficient . . . . . . . . . . . . . . . . 636.2.2 Baking experiments for uniform browning . . . . . . . . . . . . . . 666.2.3 Results for heating and baking uniformity . . . . . . . . . . . . . . 67
6.3 Comparison between batch and tunnel ovens . . . . . . . . . . . . . . . . . 686.3.1 Results of comparative experiments . . . . . . . . . . . . . . . . . . 69
6.4 Influence of inlet air velocity on butter cookies quality . . . . . . . . . . . . 716.4.1 Experimental work . . . . . . . . . . . . . . . . . . . . . . . . . . . 716.4.2 Results and discussion . . . . . . . . . . . . . . . . . . . . . . . . . 72
6.5 Summary of validation . . . . . . . . . . . . . . . . . . . . . . . . . . . . . 73
7 Mathematical-physical models and model parameters 77

7.1 Heat and mass transfer . . . . . . . . . . . . . . . . . . . . . . . . . . . . . 777.1.1 Heat transfer . . . . . . . . . . . . . . . . . . . . . . . . . . . . . . 787.1.2 Mass transfer . . . . . . . . . . . . . . . . . . . . . . . . . . . . . . 80
7.2 Parameters for the simulations . . . . . . . . . . . . . . . . . . . . . . . . . 827.2.1 Product properties . . . . . . . . . . . . . . . . . . . . . . . . . . . 827.2.2 Water transport and evaporation . . . . . . . . . . . . . . . . . . . 857.2.3 Process properties . . . . . . . . . . . . . . . . . . . . . . . . . . . . 87
8 Numerical solution of heat and mass transfer equations 898.1 Numerical solution methods . . . . . . . . . . . . . . . . . . . . . . . . . . 89
8.1.1 Finite element method . . . . . . . . . . . . . . . . . . . . . . . . . 908.2 Present approach . . . . . . . . . . . . . . . . . . . . . . . . . . . . . . . . 90
8.2.1 Geometry . . . . . . . . . . . . . . . . . . . . . . . . . . . . . . . . 918.2.2 Meshing . . . . . . . . . . . . . . . . . . . . . . . . . . . . . . . . . 938.2.3 Water evaporation and temperature . . . . . . . . . . . . . . . . . . 938.2.4 Assumptions and simplifications . . . . . . . . . . . . . . . . . . . . 94
8.3 Simulation results and validation . . . . . . . . . . . . . . . . . . . . . . . 958.3.1 Experiments for validation . . . . . . . . . . . . . . . . . . . . . . . 958.3.2 Initial simulations . . . . . . . . . . . . . . . . . . . . . . . . . . . . 978.3.3 Improving simulation results by optimizing the mass transfer and
diffusion coefficients . . . . . . . . . . . . . . . . . . . . . . . . . . . 988.4 Discussion of the numerical simulations . . . . . . . . . . . . . . . . . . . . 102
9 Influence of the baking tray on heat and mass transfer 1059.1 Optimized coefficients . . . . . . . . . . . . . . . . . . . . . . . . . . . . . 1079.2 Simulation results and comparisons . . . . . . . . . . . . . . . . . . . . . . 1089.3 Model and prediction . . . . . . . . . . . . . . . . . . . . . . . . . . . . . . 1129.4 Summary . . . . . . . . . . . . . . . . . . . . . . . . . . . . . . . . . . . . 116
10 Discussion 11910.1 Product and quality assessment methods . . . . . . . . . . . . . . . . . . . 11910.2 Construction and validation of the new batch oven . . . . . . . . . . . . . 12010.3 Modeling butter cookie baking . . . . . . . . . . . . . . . . . . . . . . . . . 122
10.3.1 Modeling results . . . . . . . . . . . . . . . . . . . . . . . . . . . . 123
11 Conclusions 125

12 Future perspectives 127
Bibliography 128
Appendices 141
A Article: Quality assessment of butter cookies applying multi-spectralimaging 143
B Abstract and poster: A mechanistic approach to baking process-productinteractions 153
C Poster: Design and construction of a batch oven for investigation ofindustrial continuous baking processes 157
D Article: Design and construction of a batch oven for investigation ofindustrial continuous baking processes 159
E Abstract: Investigating the influence of air velocity on the quality ofbutter cookies 171
F Abstract: Investigation of uneven mass transfer in butter cookies com-bining experimental work and finite element modeling 173
G Literature search for state of the art articles 191G.1 Search targeted towards mathematical modeling in bakery products . . . . 191G.2 Search for experimental ovens . . . . . . . . . . . . . . . . . . . . . . . . . 192
H Literature review for quality assessment 193
I ANOVA testing influence of air flow 195
J Parameters and variables for COMSOL simulations 199

Symbol Description UnitA Area m2
a∗ Color coordinate (red/green) -aw Water activity -b∗ Color coordinate (blue/yellow)Bi Biot numbercp Specific heat J/(kg·K)D Diffusion coefficient m2/sD Diameter mkT Thermal conductivity W/(m·K)kc Mass transfer coefficient m/shT Heat transfer coefficient W/(m2·K)L∗ Lightness (0 - 100) -m Mass kgM Molar weight kg/molen Normal direction mr Radial direction mR Radius mRe Reynold’s number -t Time sT Temperature K or ◦CV Volume m3
x Mass fraction kg/kgX Water concentration, wet basis kgw/kgproduct
Y Water concentration, dry basis kgw/kgdry matter
z Vertical direction mε Error -µ Viscosity Pa·sρ Density kg/m3
Subscriptss Surrounding0 Initialw Watera Airav AverageAbbreviationsCFD Computational Fluid DynamicsCIE Commission Internationale d’EclairageFDM Finite difference methodFEM Finite element methodFVM Finite volume methodSD Standard deviation
1

2

Chapter 1
Introduction
Baking is one of the oldest known methods for food processing. Over time the productsand design of ovens have changed, but the basic combinations of chemical and physicalprocesses, induced by heat transfer and transforming dough into bakery products, are stillof great importance to food manufactures and researchers. Although the individual tran-sition processes taking place during baking are well understood, the design of industrialbaking processes is still highly empirical today.
According to oven manufacturers and the baking industry an important limitation fortechnology development is incomplete knowledge of the connections between productquality and the physical environment in the oven chamber during baking1. Improvedquantitative understanding of the connections between process and product propertieswill create a more rational foundation for future oven design and process control. Thisagain will open new opportunities for development and optimization of industrial contin-uous baking processes and ovens.
The presented research on baking processes is to a large extend based on mathematicalmodeling. It is the hope that mathematical models will enable manufacturers of bak-ing equipment and bakery products to develop more cost efficient production processes.Better understanding of the process-to-product interactions improves process control andplanning. This will result in fewer discarded products, reduced energy consumption, andhopefully better product quality. Clarifying connections between processing conditionsand formation of undesired by-products is also the basis for reducing the formation ofundesirable components such as acrylamide (Jensen et al., 2008).
One of the top priorities for equipment manufactures and end users alike, is to decreaseenergy consumption in food production processes. Baking, a process with high energyconsumption, is no exception. Better understanding of the baking processes and theproduct development during baking, will help improve energy efficiency in the productionprocess.
1Based on personal communications with staff at Haas-Meincke A/S and Lantmännen Unibake.
3

Before applying mathematical models for prediction and optimization it is important thatthey are adequately validated against representative experimental data. Such data canbe difficult to come by, when the focus of the models is large scale industrial processes.Experimental work is difficult to carry out in full scale industrial ovens and will requiremuch energy and product waste. Pilot scale equipment is of great value for model devel-opment and process understanding, especially if it is constructed to reproduce the bakingconditions in industrial ovens and allows for product monitoring.
The initial goals of the present PhD project were to develop pilot equipment for advancedbaking experiments and establish descriptive mathematical models of the heat and masstransfer processes during continuous baking. The combination of experimental work andmathematical models should then result in computer simulations of the investigated bak-ing process. The formulations of the project goals and the design of an advanced pilot ovenwere conducted in collaboration with one of the world’s leading manufacturers of bakeryequipment, Haas-Meincke A/S, Skovlunde, Denmark. The motivation for initiating theentire project was Haas-Meincke A/S’ aspiration to learn more about the interactionsbetween baking processes and product quality.
The PhD project is a core part of a larger research project, “Continuous baking: Newopportunities for control of product quality in the tunnel ovens of the future for the bakeryindustry”2, for which financial support was granted in March 2009 by the Ministry of Food,Agriculture and Fisheries of Denmark. Haas-Meincke A/S contributed to the project withtheir wast knowledge and great experience within the field, along with the mechanicalconstruction of a new pilot oven. The oven is designed to emulate continuous bakingprocesses, focusing on the convective system found in Haas Meincke A/S’ convectiontunnel ovens, and allows for continuous monitoring of the product during baking. Theoven is furthermore constructed to allow for experimental work outside the normal rangesof the industrial ovens.
The delivery of the pilot oven was initially planned in the fall of 2009. Unfortunately theproduction was affected by the global financial crisis and severely delayed. The pilot ovendid not arrive at DTU until the beginning of 2011, and was not fully functional until thespring of 2011. Combined with my 4 months’ leave of absence in the fall of 2011 less thana year was available for validation and experimental work with the new oven.
The severe delay of the pilot oven resulted in some restructuring of the PhD project.Initial experimental work was carried out in an existing standard convection oven. Onepurpose of the initial work was to investigate different quality assessment methods forbakery products. This work resulted in a journal article combining baking conditions andimage analysis as a quality monitoring method, expanding the area of the project intothe field of product quality assessment methods. The original plan for the experimentalwork in the pilot oven included investigations of several products and investigations ofa range of baking conditions. Because of the delay and subsequent problems with the
2DK title: Kontinuerlig bagning: Nye muligheder for styring af produktkvalitet i fremtidens tunnelovnetil bageriindustrien
4

pilot oven, the experimental work was limited to one product and an initial series ofexperiments with varying baking conditions. The selected product is a butter cookie,belonging to the biscuit group of products. It is a simple, representative product for thegroup. It has a light surface enabling browning evaluation, no additives such as nuts,chocolate, or different flour types, allowing for easy evaluation of the heating and dryingprocesses during baking. Similar to the major part of biscuit products it is a thin productundergoing the basic transitions from moist dough to a finished, dry product with a longshelf-life seen for standard biscuit products, as described later in this thesis.
The modeling work performed in this project is validated against experiments in the pilotoven, and experimental data from the pilot oven is used to examine and improve themathematical model. The proposed model is in accordance with the current state of theart for heat and mass transfer modeling of the investigated type of products.
1.1 Scientific contributions
The PhD project has resulted in several scientific contributions that are communicatedin the form of this PhD thesis, journal articles, and conference presentations. To dateone journal article has been published, a second is accepted for publication, and a thirdmanuscript is submitted for publication. Additionally work has been presented at threeconferences, twice as poster presentations and once as an oral presentation. All presen-tations were given by me, and I am also the first or the only author on the manuscripts.The contributions, other than the thesis, are described by topic in the following.
Based on the initial work performed in a standard kitchen batch oven a research studywas carried out to investigate the possibilities of using multi-spectral imaging for qualityevaluation of bakery products. The work was conducted in collaboration with anotherPhD student showing the validity of applying advanced imaging analysis in the field ofbakery production. In the study it was found that multi-spectral imaging is applicable asa method to evaluate the surface browning of butter cookies and simultaneously estimatethe water content. An initial form of the work was presented as a technical report inthe PhD thesis by Dr. Bjørn S. Dissing. Subsequently a manuscript was written basedon the technical report including re-calculations of some of the results. The idea behindthe study and the work was carried out in collaboration, as can be seen by the co-authorstatement. The resulting manuscript "Quality Assessment of Butter Cookies ApplyingMulti-spectral Imaging", was accepted for publication in Food Science & Nutrition, April21, 2013, and published online June 12, 2013. The latest version of the manuscript isavailable in Appendix A.
Prior to the arrival of the new pilot oven, further work was performed regarding mech-anisms in baking of bread products. The results were presented as a poster at the 2010Food Factory conference, Gothenburg, Sweden, July 2010. The title of the poster was"A mechanistic approach to baking process-product interactions". The study investigated
5

the influence of water vapor and oven temperature during the initial part of baking, onthe center temperature of bread rolls. Through experimental work it was shown that ifwater vapor is introduced in the initial phase of bread roll baking, comparable productsare obtained with initial oven temperatures of 140◦C and 220◦C. The water vapor wasexhausted after 3 minutes at which point the oven temperature was set of 180◦for theremaining 17 minutes of baking. The submitted abstract and final poster are included asAppendix B.
The design of the new pilot oven, including a few initial validation experiments, waspresented as a poster and short conference article at the 11th International Congress onEngineering and Food, Athens, Greece, May 2011. Later, the conference article was ex-tended, introducing additional validation work and experiments, to a full journal article.The oven was designed and constructed with the main purpose of emulating continuous,convection tunnel ovens. The main focus is on the complex convective system, and en-abling of continuous product and process monitoring during baking. The main monitoringoptions include visual access, air and product temperatures, product weight, and the airhumidity. The air flow and the baking process were validated against a tunnel oven, us-ing butter cookies as the test product. The manuscript, "Design and Construction of aBatch Oven for Investigation of Industrial Continuous Baking Processes", was acceptedfor publication in the Journal of Food Process Engineering on January 17, 2013. Thepresented poster is shown in Appendix C and the early-view version of the journal articleis included as Appendix D.
One of the main features of the pilot oven is the option to vary the inlet air velocity.Results from investigation of this feature were presented as an oral presentation at theConference of Food Engineering, Leesburg, VA, USA, April 2012. The presentation wasrewarded with the Graduate Student Presentation Award at the conference. The studyis considered an additional validation of the functionality of the new pilot oven, showingthat it is possible to experimentally detect variations in mass transfer and browning rateswhen changing the air velocity in the batch oven. The abstract from the conference isfound as Appendix E.
The latest results from mathematical modeling of heat and mass transfer in butter cook-ies, combined with experimental validation applying the pilot oven, are presented in themanuscript "Investigation of uneven mass transfer in butter cookies combining experimen-tal work and finite element modeling". The manuscript has been submitted for publicationin International Journal of Food Engineering, June 17, 2013. Focus is on the influence ofthe baking tray on the evaporation during baking. Different modeling scenarios for theevaporation across the product surfaces were examined and compared to experimentaldata. Of the three investigated scenarios the best agreements were found when assumingeither a limited, but not inhibited, evaporation from the bottom surface, or complete masstransfer symmetry for all boundaries. The assumption of no evaporation from the bottomsurface did not provide an acceptable simulation result. The manuscript is included asAppendix F.
6

1.2 Structure of the PhD thesis
The thesis is divided into a number of chapters which are grouped by topic. The topicsare either introductory, linked to one or more of the basic objectives for the project, orpart of the final project discussion and conclusion.
Chapters 1 to 3: These chapters introduce the reader to the field of the PhD project.The first chapter is a general introduction to the project. The second chapter includes anintroduction to baking ovens, bakery products, and a section describing state of the artfor heat and mass transfer modeling in baking products and experimental equipment formodel validation and advanced baking experiments. The third chapter covers a mecha-nistic description of the main changes in bakery products during baking.
Chapter 4: The chapter is concerned with quality assessment methods. The chaptercovers a literature study of methods applied in research to evaluate the quality of bakeryproducts and a study from the present PhD work evaluating a new method for qualityassessment of butter cookies. The new quality assessment method is further described inthe article included as Appendix A. Chapter 4 is related to the fifth objective listed inSection 2.4.
Chapters 5 and 6: These chapters describe a new experimental batch oven, designed andconstructed to emulate continuous baking processes. Chapter 5 describes the design ofthe oven, and Chapter 6 the validation of the oven. These chapters are considered anelaboration on the article found in Appendix D. These chapters are related to the firstand second objectives listed in Section 2.4.
Chapters 7 to 9: Focus in these three chapters is modeling of heat and mass transferin a cookie product during baking in a forced convection oven. In Chapter 7 the modelis explained. In Chapter 8 the applied method for numerical solving is explained andsimulation results presented. Chapter 9 extends the model to include the effect of thebaking tray on the evaporation during baking, additional results are presented in thischapter. Parts of all three chapters are included in the submitted manuscript shown inAppendix F. The chapters are related to the third and fourth objectives listed in Section2.4.
Chapters 10 to 12: These three chapters summarize and conclude the thesis. The mainresults are reviewed and discussed in Chapter 10. The project conclusion is found inChapter 11, and future perspectives for the presented work are described in Chapter 12.
7

8

Chapter 2
Background and hypothesis
2.1 Industrial baking ovens- from batch to continuous production
Baking is the main transition step in the production of bakery products. In the oven thedough is transformed from raw dough to the final edible product. This section gives ashort summary of the development in oven design, mainly industrial continuous ovens, upto today.
The first ovens were holes dug in the ground and heated by coal or warm stones. Thefood to be prepared (meat or bread) was placed in the hole and left to roast or bake.From this actual oven constructions were invented. Over time the construction materialhas changed starting with clay ovens and ovens made from hollow rocks, to ovens buildfrom bricks or iron, the latter was especially popular in the 19th century (Pomeranz andShellenberger, 1971).
While baking is an old craft, the application of continuous oven systems is a fairly newinvention. Until the introduction of continuous ovens, all baking processes were batchoperations: Dough is placed in a heated area and then removed after a certain amount oftime as a final product. An example of a batch oven for large scale industrial productionfrom the American company Baker Perkins (1892) is shown in Figure 2.1(a) (Perkins,2012).
With the increased level of automation following the industrial revolution, ovens wereoptimized to accommodate the wish for continuous bakery products. Though the firstBritish continuous oven in 1810 was not a great success, the continuous oven was thestandard in British biscuit bakeries from the middle of the 19th century (Manley, 2011).In the first continuous ovens the bakery product was transported on individual trayscarried through the oven by a chain system (traveling plate ovens). These traveling ovenswere somewhat similar to the idea in reel ovens, which were the standard in the USA untilthe 1930s. In the reel oven trays are rotated inside a big oven chamber, an illustration is
9

shown in Figure 2.1(b) (Pomeranz and Shellenberger, 1971).
(a) Draw plate batch oven (b) Continuous reel oven
Figure 2.1: (a) A batch oven, in form of a draw plate oven from the manufacturer BakerPerkins 1892 (Perkins, 2012). (b) A continuous reel oven where the product is rotated inone big oven chamber (Pomeranz and Shellenberger, 1971).
During the 1950s rolled steel bands became available substituting the individual traysand resulting in longer and wider tunnel ovens. Some ovens today are longer than 100 mand wider than 4 m (Manley, 2011; Haas Meincke A/S, 2012).
Today three main groups of continuous ovens are produced. The choice of oven typemainly depends on the produced product. The oven types are: Directly fired ovens,indirectly fired radiation ovens, and forced convection ovens (either directly or indirectlyheated).
In directly fired ovens gas or oil flames inside the oven chamber heat the product byradiation and natural convection. Indirectly fired radiation ovens are equipped with panelsor tubes through which heated air is circulated thus baking the products by radiation andnatural convection. In the forced convection ovens hot air passes over the product at ahigh air velocity controlled by a ventilator system.
Many continuous ovens are build as tunnels, which are separated into zones. In eachzone the temperature and humidity are controlled individually. It is possible to buildovens that comprise different zone types. For example, cream biscuits need a high initialtemperature, where after the temperature can be decreased. For this a directly fired zonecould be used followed by indirectly heated zones (Mowbray, 1981).
2.1.1 The investigated oven type
The ovens in focus for this work are indirectly heated, forced convection tunnel ovens.These ovens are comprised of zones, to increase the control over the baking environment.A schematic illustration of one zone from an indirectly heated, forced convection oven
10

is shown in Figure 2.2. This is the type of tunnel oven used in the experimental workdescribed in this thesis.
Figure 2.2: Schematic illustration of one zone of an indirectly fired convection oven.The baking band would be between the inlet air ducts but is not included in the illustration(Haas Meincke A/S, 2012).
The air is heated indirectly by passing hot tubes and then distributed above and belowthe baking band through round nozzels (Haas Meincke A/S, 2012). Each zone has 700inlet nozzles above and below the baking band, and the target inlet air velocity is givento 12 m/s by the manufacturer. It is possible to adjust the inlet air distribution betweenthe top and bottom air ducts, controlling the degree of top or bottom heating. A benefitof indirectly fired convection ovens is that most types of fuel can be used. For directlyfired ovens only gas or light oil should be used to ensure the product is not affected bythe fuel.
2.2 Bakery products
Large variations are seen across the world regarding types, recipes, and traditions forbakery products. Due to the short shelf-life of most bakery products, many have notspread across countries. Some products might only be known in particular regions. Asa result there is no general, world-wide taxonomy for bakery products. Some productnames even mean different things in countries otherwise having similar languages such asGreat Britain and the USA. Two examples, biscuits and muffins, are illustrated by Figure2.3.
In this work bakery products are divided into three main groups: cakes, bread, andbiscuits. Cakes are sweet savory products, the batter is liquid, and the product bakedin molds. During baking a soft crumb is obtained and a thin crust may be seen at thesurface. Bread is a bakery product obtained from a semi-liquid dough, often with theaddition of yeast to enhance bubble formation and volume expansion. During baking the
11

(a) American biscuit (b) British biscuits
(c) American muffin (d) English muffin
Figure 2.3: Biscuits: (a) The American breakfast course biscuit and gravy (All-recipes.com, 2012). (b) British biscuit products with tea (The Guardian, 2012). Muffins:(c) An American blueberry muffin (Starbucks, 2012). (d) An English muffin turkey sand-wich (Orograin Bakeries Products, Inc., 2012).
dough is transformed into a soft crumb and a crisp to hard outer crust. Biscuit productscover a range of sweet to semi-sweet thin products. The dough is semi-liquid and thefinal product dry. The drying allows for a long shelf-life and a crisp, crunchy, or crumblytexture.
2.2.1 Investigated product groups
Two product groups were used for the research presented in this thesis, namely bread andbiscuit (British translation). With the specific products investigated being a bread rolland a butter cookie. Short introductions to bread and biscuits are given in the followingsections.
Bread
Bread is one of the most important staple food-products in the world today. The firstbread was most likely produced on hot stones by the fire, creating a bread similar to theMiddle Eastern flat bread of today (Cauvain and Young, 2007).
12

Archaeological findings indicate that the cultivation of pre-historic grain species beganapproximately 11000 years ago. The findings show that grain, or processed grain, was usedas food products (Skaarup, 2011). Leavened bread is a much newer discovery. The oldestarchaeological finding of leavened bread is approximately 5500 years old from Switzerland(Skaarup, 2011) and the oldest records of bread baking date back to ancient Egypt.Some of the oldest papyri appear to be bread recipes (Edwards, 2007). It was also inthe ancient Egyptian society that bakeries were first organized and baking considered aspecialized craft (Pomeranz and Shellenberger, 1971). In Figure 2.4 a painted panel fromapproximately 1200 BC shows bakers at the court of Ramses III.
Figure 2.4: Illustration describing an Egyptian bakery around 1200 BC (Pomeranz andShellenberger, 1971).
Bread can be produced from few ingredients. The main ingredients are flour, water, and ifa leavened bread is desired, yeast or sourdough. While the ingredients are very basic thesame is not the case for the physical and chemical transformations during mixing, proving,and baking. A description of the transformation during baking is given in Chapter 3.
Biscuits
The word biscuit originates from the Latin words panis biscoctus meaning twice baked(Manley, 2011). The name is a reference to the original production method. The productwas first baked in a hot oven, then moved to a lower temperature for a final drying step.In this way a dry product with a long shelf-life was produced. The process is still usedtoday for some biscuits, for example the Italian biscotti is produced in a two-step bakingprocess, maintaining the original meaning of the name.
The term biscuit is old and encountered in works such as the Shakespeare play “As youlike” (circa 1600) and in Dr. Samuel Johnsons dictionary from 1755. In the latter it isdefined as “a kind of hard dry bread, made to be carried to sea” (Manley, 2011). Inthe first biscuits, intended for sea travel (sea biscuits), the shelf-life was more importantthan the taste. It is not until later that biscuits have transformed into more common andsavory food products.
Over the years biscuits have developed into a number of different products. Today the(British) meaning of the word biscuit includes such subgroups as crackers, cookies, sweet
13

biscuits, semi-sweet biscuits, and wafers. In contrast to bread these products are notstaple foods. They are eaten mainly for pleasure, as a side dish, desserts or snacks. Thismeaning of biscuits is applied through this work.
2.3 State of the art
In this section the current state of the art for heat and mass transfer modeling andinitiatives for experimental ovens is reviewed. The focus is primarily on work publishedin the last decade (approximately 2000 - 2013). A short description of the literaturesearch criteria forming the base of the reviews is included in Appendix G. The modelingpart of the review has been product specific, limiting the search to "bread, cookie, biscuit,cracker, and cake". Models considering these products are therefore the main focus in thereview.
For modeling to make sense, experimental validation of the modeling work is of the ut-most importance. The ability to verify and test the models in a controlled environment,monitoring the products, is crucial for the scientific and practical applications of devel-oped models. This section is divided into two parts. The first concerning modeling workand different approaches to modeling of bakery products. The second section consideringmethods and equipment applied to experimentally validate mathematical models alongwith equipment build for pure experimental investigation of baking processes. The focusin the second section is on special experimental set-ups designed to improve the under-standing of baking and baking process conditions. Experimental equipment designed forinvestigations of both laboratory and industrial scale is included.
Scientific articles explicitly aimed at describing experimental equipment for understandingor optimizing baking processes are scarce. The approach in the following section wastherefore to include the methods described for baking experiments for model validationand not solely focus on work explicitly describing experimental set-ups. In most cases theovens or baking processes applied for validation will include some degree of modificationor redesign compared to commercially available equipment.
2.3.1 Heat and mass transfer modeling
Based on published work, modeling of bakery products may roughly be divided into twocategories: The purpose of modeling is either to characterize and quantify the degreeof browning during baking or to describe the mechanisms of heat and mass transferprocesses during baking. The browning models are mainly focused on the kinetics ofcolor development and often empirical in nature (Purlis, 2011; Zanoni et al., 1995), whilethe heat and mass transfer models are generally derived from mechanistic descriptions ofthe physical processes taking place during baking.
14

In the following the heat and mass transfer models are in focus, as this is the investigatedaspect of baking in the present work. An important consideration for the heat and masstransfer modeling is, how many physical aspects to include when translating the physicalunderstanding to applicable mathematical equations. From a mechanistic point of viewan increasing knowledge of baking allows for more and more detailed models, while thechallenge of determining the included parameters may be a limitation, when solving andvalidating the obtained models.
Different characteristics are relevant for modeling of different bakery product groups.The bakery products most widely used as model products for heat and mass modelingare bread, cakes and thin products like biscuits and cookies. While these products aredistinctively different in nature the mathematical models describing the basic heat andmass transfer are generically similar. Also they are applied in modeling of other foodproducts such as meat and vegetables (Chen, 1999; Ni and Datta, 1999; Sterner et al.,2002).
The most widely used description for mass (or water) transport is diffusion inside theproduct and evaporation on the surface. The energy transport is generally described byconduction inside the product and radiation, conduction, and convection to the productfrom the heating element. Of course exceptions are found; especially in porous productswhere evaporation is seen inside the product during baking. This results in additionalheat transfer by Watt’s principle of evaporation-condensation and mass transfer by acombination of liquid and gas. The following overview shows how different approacheshave been applied for bakery products.
Heat transfer
Heat transfer is the primary transport phenomenon in baking processes. A hot ovenchamber is used to transform the product from dough to the final product. Dependingon the design of the oven chamber and the positioning of the product, different means ofheat transfer will dominate the baking process. In traditional baking processes, these willbe conduction, radiation, and convection.
Heat is transferred to the product where it travels through the surface, increasing theproduct temperature. Depending on the product characteristics, different approaches areapplied when modeling the temperature increase through the product. For sufficientlythin products the temperature increase is assumed uniform through the product due to avery small temperature gradient. An example is modeling of a thin layer of cake (Putrantoet al., 2011). In larger products, or products with a high resistance to heat transfer, asignificant temperature gradient is created through the product. Of these two approachesthe latter is most often applied for bakery products, increasing the complexity of themodels.
Heat propagating through a solid body is generally described by conduction in heat trans-
15

fer models (Bird et al., 2002). In baking products an additional factor in the heat transferprocess is the simultaneous evaporation of water. Water evaporation demands energy andthereby decreases the energy available for pure heat transfer. Different approaches areapplied to include the water evaporation. Evaporation may be considered solely at thesurface boundary, thereby limiting the energy transferred into the product and appliedfor heating (Ferrari et al., 2012; Feyissa, 2011; Mondal and Datta, 2010; Olszewski, 2006;Purlis, 2012). Other studies include the evaporation as a term in the equation describ-ing the internal heat transfer (Huang et al., 2007; Ousegui et al., 2010; Sakin-Yilmazeret al., 2012; Thorvaldsson and Janestad, 1999; Zhang et al., 2005), and a third approachis to include evaporation both in the boundary conditions and as an internal phenomenon(Ploteau et al., 2012; Zhou, 2005).
In the first approach water evaporation is simplified so that it only takes place explicitlyat the outer surface. The two other approaches emphasize the presence of an evaporationfront moving through the product as it is heated. From a mechanistic point of viewevaporation will take place both at the surface and inside the product during baking.The models with a moving evaporation front may, however, be difficult to asses. For thepurpose of a given study a simplified model can provide an adequate simulation of theprocess. Which approach to select depends on the product and the over-all purpose ofthe study.
Models describing the heat transfer inside baking products may include additional physicaldetails. For example the phenomenon of water evaporating in the warm end of an air cell(or bubble) and condensing on the inner and cooler wall, is included in some models(Hadiyanto et al., 2007; Thorvaldsson and Janestad, 1999). Compared to conductionthis evaporation-condensation mechanisms will increase the heat transfer rate inside theproduct. With a continuous pore structure, connected to the outside environment, theinfluence of this mechanism will be small, as the evaporated water will diffuse away fromthe product.
Mass transfer
Transport of water through and away from the product is the main cause of mass transferin baking processes. During baking the product is heated, resulting in a drying processas water evaporates. Additional mass transfer included in baking processes will often bediffusion of CO2 either released from baking soda or produced by yeast.
Water transport is often described as a diffusion process. In some studies the watertransport is separated into liquid water and water vapor transport described by separateequations (Feyissa, 2011; Hadiyanto et al., 2007; Huang et al., 2007; Lostie et al., 2004;Ploteau et al., 2012; Ousegui et al., 2010; Thorvaldsson and Janestad, 1999; Zhang et al.,2005; Zhou, 2005). Other models describe a combination of liquid and gaseous watertransport in bread, with liquid water diffusion in the crumb and gaseous water diffusionin the crust (Purlis, 2012). An alternative approach is to consider all water transfer under
16

one, for example as the total mass loss or by an effective diffusion coefficient (Broyartand Trystram, 2002; Demirkol et al., 2006b; Ferrari et al., 2012; Mondal and Datta, 2010;Putranto et al., 2011; Sakin-Yilmazer et al., 2012; Wählby, 2002).
In most of the investigated models with more than one water transport mechanism thediffusion of CO2 is also included along with the porosity of the product (Feyissa, 2011;Hadiyanto et al., 2007; Huang et al., 2007; Lostie et al., 2004; Ploteau et al., 2012; Ouseguiet al., 2010; Zhang and Zhang, 2007). The porosity influences both the heat transferand the mass transfer. The heat transfer through evaporation-condensation mechanisms,increasing the heat flux towards the product center. Gaseous mass transfer will increasethrough a continuous porous media while it may decrease the mobility for liquid water asthe solid matrix is expanded.
Which model to apply will depend on the purpose of the study. When the moisture dis-tribution through the product is of high interest a more precise model, including multiplemass transfer phenomena, would be a good choice. For a study of the drying mechanismsand the overall water content a more generic, or lumped, model is preferable. In bothsituations it is important to consider what parameters can be estimated with a sufficientaccuracy, whether the model can be solved with available software, and if the modelout-put can be validated though experimental work (Datta, 2008; Trystram, 2012).
Investigated products
The defining characteristics, such as appearance, texture, size, and moisture content,vary significantly between different groups of bakery products. The three main groups ofbakery products covered by the investigated scientific studies are bread, soft cakes, andthin crisp products such as cookies and biscuits.
During baking, bread and soft cake products develop a dry crust and a soft, moist crumb.In the initial phase of baking the dough or batter can be seen as a semi-solid or liquidmaterial with a number of small air bubbles. During baking the air bubbles will firstexpand, and when sufficiently heated, form a continuous porous network through theinterior of the product (change from a foam to a sponge structure) (Mills et al., 2003).This transition is further elaborated in Chapter 3. At the surface, evaporation is initiatedwhen the product reaches approximately 100◦C, where after the water inside the productevaporates, causing expansion of the product along with an initial aided heat transfertowards the center of the product.
The development of biscuit products during baking is in some ways comparable to thedevelopment of bread and cake products. In the initial phase of the baking process asimilar transition from a foam to a sponge structure is observed. However, contrary tothe bread products the final part of biscuit baking is primarily a drying process (Mowbray,1981). The sponge structure allows for evaporation from the entire product, resulting ina dry final product. The final moisture content in a bread crumb is approximately 40%
17

(w/w) while the final moisture content in biscuit products is as low as 0.5-3.5% (w/w).
The product group which is most widely used in the investigated models or review articlesis bread (Hadiyanto et al., 2007; Huang et al., 2007; Mondal and Datta, 2010; Ploteauet al., 2012; Ousegui et al., 2010; Purlis, 2012, 2010; Therdthai, 2003; Thorvaldsson andJanestad, 1999; Wählby, 2002; Wählby et al., 2000; Zhang et al., 2005; Zhou, 2005).Most of the modeling studies investigating bread baking apply the more complex modelstreating liquid water and water vapor transport in different equations. For cake bakingthe applied models are more diverse. Some studies include porosity and multiple masstransfer mechanisms (Hadiyanto et al., 2007; Lostie et al., 2004), while others simplify themodels to an average mass transfer consideration (Putranto et al., 2011; Sakin-Yilmazeret al., 2012; Sakin et al., 2007b,a). In all but one case, the models used to describemass transfer in biscuit products include a lumped mass transfer approach (Broyart andTrystram, 2002; Demirkol et al., 2006b; Ferrari et al., 2012). In one case the same modelsare used for all three groups of product (biscuits, cakes, and bread) (Hadiyanto et al.,2007).
Considering the structure of the products, and their development during baking, theobserved division in modeling approaches is reasonable. While it is interesting to modelthe thickness of the dry bread or cake crust, the over-all drying is more interesting forbiscuit products. Additionally, bread and cake products are generally larger than biscuitproducts and more information of the internal mass transfer properties can be obtainedand validated.
In the present work, studying a biscuit product, a lumped mass transfer approach isapplied and validated against the total mass loss. Furthermore, a heat transfer approachwith evaporation included only at the outer boundaries is implemented. The choice ofheat transfer model is consistent with comparable studies of biscuit products (Demirkolet al., 2006b; Ferrari et al., 2012).
2.3.2 Laboratory and pilot scale ovens for research and modelvalidation
In the following sections equipment and measuring methods applied to investigate bakingprocesses, or validate mathematical models, in laboratory or pilot plant scale are de-scribed. Few articles are found, describing baking equipment as the main purpose of thestudy. Most of the methods and set-ups described in the following are indirectly describedin the modeling work included in the previous sections.
Methods for model validation
Most ovens applied for validating the investigated mathematical heat and mass trans-fer models are standard household or laboratory ovens (Broyart and Trystram, 2003;
18

Demirkol et al., 2006b,c,a; Purlis, 2012, 2011; Purlis and Salvadori, 2007; Putranto et al.,2011; Sakin-Yilmazer et al., 2012; Sakin et al., 2007b,a; Thorvaldsson and Janestad, 1999;Zhang et al., 2005). The most frequently measured product properties are the producttemperature (Broyart and Trystram, 2003, 2002; Demirkol et al., 2006a; Fahloul et al.,1994; Ferrari et al., 2012; Feyissa, 2011; Lostie et al., 2004, 2002b; Mondal and Datta, 2010;Ploteau et al., 2012; Purlis, 2012; Putranto et al., 2011; Sakin-Yilmazer et al., 2012; Sakinet al., 2007b,a; Thorvaldsson and Janestad, 1999; Wählby, 2002; Zhang et al., 2005) andthe product mass loss or moisture content (Broyart and Trystram, 2003, 2002; Demirkolet al., 2006b,c; Fahloul et al., 1994; Ferrari et al., 2012; Feyissa, 2011; Lostie et al., 2004,2002b; Mondal and Datta, 2010; Purlis, 2012; Putranto et al., 2011; Sakin-Yilmazer et al.,2012; Sakin et al., 2007b,a; Thorvaldsson and Janestad, 1999; Wählby, 2002; Zhang et al.,2005). The temperature is generally logged continuously during baking, while the massloss is only measured continuously in one specially build experimental oven, which is alsoapplied in investigated modeling work (Lostie et al., 2002a,b, 2004). In the main part ofthe studies the air temperature in the oven chamber is logged continuously.
Additional measurements include the air humidity (Broyart and Trystram, 2003, 2002;Fahloul et al., 1994), the product volume (Lostie et al., 2004; Purlis, 2010; Sakin et al.,2007a; Zhang et al., 2005), and product color (Broyart and Trystram, 2003; Purlis, 2010;Wählby, 2002). The air humidity is recorded continuously during baking by sensors placedinside the baking chamber. The product volume is either based on direct measurements onthe product (Sakin et al., 2007a) or continuous video recordings, from which informationon the product development is extracted (Lostie et al., 2004; Purlis, 2010; Zhang et al.,2005). Different methods were used to estimate the product color. In one series of studiesthe baking was interrupted, pictures taken of the products, where after the baking processwas continued (method described in Purlis and Salvadori (2009)). In other studies thecolor or reflectance was measured on products removed from the oven during baking(Broyart and Trystram, 2003; Wählby, 2002).
Depending on the investigated models different measurements are relevant in the valida-tion process. Most of the investigated studies apply the simplification that the volumeexpansion is neglected in the modeling work (e.g. (Ferrari et al., 2012; Mondal and Datta,2010; Ousegui et al., 2010; Purlis, 2011)). In such cases it is evidently redundant to mea-sure the product volume. From the high number of experimental set-ups measuring theproduct temperature, and either the moisture content or the mass loss, it is clear that theinvestigated studies were found because they focus on heat and mass transfer modeling.
For the validation experiments in standard household or laboratory batch ovens differ-ent types of externally connected thermocouple systems are used to measure the productand oven air temperatures. Some batch ovens are modified or constructed specially for re-search purposes, including sensors or special features for process investigation. In one casea standard household batch oven was modified to accommodate a specialized impinge-ment heating process to investigate the effect of impingement baking versus traditionalconvection baking (Wählby, 2002). The focus of the study was on process control and
19

the influence of the air flow during baking. A special glass tube oven (Grenier et al.,2008) in which the air pressure is controllable and the product can be followed visuallyduring baking. The oven applied in a modeling investigation of crust-less bread (Mondaland Datta, 2010) is constructed to the purpose. The oven has a water spraying deviceenabling a controlled water dosage during baking to inhibit crust formation. The oven isexplicitly described in a newer article (Mondal and Datta, 2011).
A specially constructed radiation heated pilot oven is described by Lostie et al. (2002a).The oven has several options for monitoring the product continuously during baking. Inthe "modeling group" of investigated studies, it is the only equipment allowing continuousweight measurements. The oven is also capable of measuring the product temperature, theair temperature, and estimate the volume expansion through video recordings during bak-ing. It is applied in at least two subsequent modeling studies (Lostie et al., 2004, 2002b).Compared to the process investigated in the present work, the oven described by Lostieet al. (2002a) is not constructed to emulate a continuous baking process. Additionally itis a radiation based oven, without the option for forced convection baking.
Some studies focus on continuous baking processes. Fahloul et al. (1994) apply a continu-ous pilot plant oven in the experimental work, and this data is also used in later modelingwork presented by Broyart and Trystram (2002). The investigated biscuit product isbaked in a 15m indirectly heated tunnel oven. During baking the product temperatureis measured continuously, and the product weight is measured at six positions along theoven length by removal of products through hatches at the side of the oven. In McFar-lane (2006) experimental work is carried out in two continuous tunnel ovens. The scopeof the study is to investigate available methods to control the final moisture content incontinuously baked products, the model product is a semi-sweet biscuit.
The main part of the investigated studies does not focus on continuous baking processes,but rather generic heat and mass transfer phenomena during baking. It is seen thatvariations in temperature, baking time, and in a few cases the humidity, have been mostwidely investigated.
The air flow has also been a source of process variation and the objective of modelingwork. The group of modeling work studying on air flow is often applying computationalfluid dynamics (CFD) to simulate the air flow and heat transfer in the oven chamber.For baking in continuous ovens this has been the main focus in articles published byTherdthai (2003, 2004b,a). The air flow around a heat flux sensor in a specialized pilotoven presented by Zareifard et al. (2006) (introduced in Section 2.3.2) was presented inBoulet et al. (2010). CFD simulation is a valuable tool to extend modeling of bakingproducts beyond the boundary of the product itself. Today the computational power tobuild 3D simulations of advanced flow patterns is becoming more readily available, whichis likely to increase the number of studies, including the surroundings, when modelingbaking processes. Similar to all other modeling work, the validation step is still important,and even advanced modeling should not stand alone.
20

Specialized pilot scale ovens for investigation of baking processes
Besides the ovens listed in the previous section, which are used in relation to experimentalvalidation of mathematical heat and mass transfer models, additional pilot or laboratorybaking equipment is described in the scientific literature. The research ovens are oftenbuild for a specific purpose, for which a standard baking oven is not suitable. Such ovensare described in the following.
A special "MRI-oven", described by Wagner et al. (2008), was constructed without anymetal component, so that it can be placed in a low-field MRI scanner during bread baking.The experimental work was carried out by placing oil micro-capsules in the dough priorto baking and follow their movement during baking by the use of the MRI-images.
Another oven build to investigate a specific baking method is presented by Pace et al.(2011). This oven is constructed as a combined micro-wave/jet-impingement oven, withthe purpose of investigating the effect of combining these two heating mechanisms onheating of a moist food product (potato in the described experimental work).
An oven specially developed to bake crust-less bread is described by Mondal and Datta(2011), and additionally applied in modeling work (Mondal and Datta, 2010). The ovenconsists of a baking oven chamber equipped with a water spray system allowing for wettingthe product surface during baking, thereby preventing crust formation on the productsurface.
The listed ovens are all constructed to investigate special baking methods or allow for aspecial product monitoring method. Other pilot scale ovens are constructed to investigatethe general mechanisms and transformations taking place during baking.
One such oven is described by Fehaili et al. (2010). It is build with the purpose of havingan oven chamber in which the thermal environment is fully characterized. The controlledenvironment is applied to characterize the kinetics of thermally induced reactions in asponge cake. During baking the air and product temperatures are measured. The air andcenter temperatures, by separate thermocouples; and the product surface temperature, byan infrared thermometer equipped with a cooling jacket and placed into the oven chamberdirectly above the product. During baking the air is recirculated by an adjustable faninside the oven chamber, resulting in a convective heating environment (its operationwindow given as 25 - 50 Hz).
Another oven constructed to monitor baking processes is a batch oven described in Som-mier et al. (2005) and applied in at least two subsequent studies (Sommier et al., 2011,2012). The oven described by Sommier et al. (2005) is a modified conventional, convec-tion batch oven. Due to the modifications it enables extensive continuous monitoring ofthe process and product including temperatures, product weight, visual recoding of theproduct, and humidity measurements. In contrast to the oven presented in this thesisthe oven described by Sommier et al. (2005) is not constructed with the initial scope toemulate continuous baking processes. In later studies the oven was used to study differ-
21

ences in pilot and industrial baking ovens (Sommier et al., 2011) and to characterize theconvection baking of a sponge cake (Sommier et al., 2012).
In the investigated literature only one discontinuous pilot oven has been constructed withthe purpose of emulating continuous baking processes (Zareifard et al., 2006). The ovendescribed by Zareifard et al. (2006) is designed to reproduce industrial baking processes.The baking area in the pilot oven is 1.27 m x 1.17 m, resulting in a large baking area, andthe need for a sliding table to load products into the baking chamber. This constructiondoes not allow for a high degree of product monitoring during baking (temperature andhumidity control) and the options to vary the baking process are limited. From thedescription of the convective system it appears that the air is externally heated and theair flow parallel to the baking tray. The ability of the oven to heat evenly is validated witha special heat flux measuring system and by browning of a light cake during baking. Theheat flux measuring system is applied to compared the total heat flux across the bakingtray and between different baking settings. In subsequent studies the heat flux measuringsystem is used to compare the effect of radiation and convection when maintaining aconstant total heat flux (Zareifard et al., 2009), and CFD simulations of the air flow areinvestigated in relation to temperature distribution in the oven chamber (Boulet et al.,2010).
2.3.3 State of the art summary
The review of modeling contributions from recent years shows that advanced models havebeen developed. The degree of complexity was generally found to be higher for bread andcake products than for biscuit products. While similar heat and mass transfer phenomenaare seen in the different products, the effect of processes such as CO2 expansion, bubbleformation, and to some degree porosity are more pronounced for bread and cake products.These products consist of a soft, airy crumb and a dry outer crust. In the initial phaseof biscuit baking the products undergo a transition similar to the soft bakery products,however, the final phase of biscuit baking is a drying of the entire product. The finaldrying is characteristic for the biscuit group and the final uniformity of the product isprobably the reason for the successful use of lumped mass transfer descriptions in themathematical models.
Similar to most modeling studies of biscuit baking the model formulated in Chapter 7is based on a lumped approach to describe the mass transfer. The scope of the presentwork has been to establish a mathematical model of the biscuit baking process in thepilot oven.
In addition to the investigated studies of biscuit product modeling (Broyart and Trystram,2002; Demirkol et al., 2006b; Ferrari et al., 2012; Hadiyanto et al., 2007), elements froma model of meat patty frying are also used for my modeling work (Chen, 1999). Themeat patty has a similar geometry to the investigated biscuit product. It is also cookedin a convection oven resulting in a similar modeling set-up with comparable boundary
22

conditions.
The focus in the present work has been on the boundary conditions related to masstransfer. No published work was found to explicitly discuss the influence of coveredsurfaces on the mass transfer during baking of biscuit products.
In some studies a model with equal boundary conditions on all outer surfaces is used,neglecting any possible effect of a mold or baking tray. In this way equal evaporationis obtained in all directions away from the product center (Ferrari et al., 2012; Purlis,2012). In the modeling results obtained by Ferrari et al. (2012) a poor correlation isseen between the measured mass loss and the simulation. The product was placed in aperforated mold during baking, and by assuming uniform evaporation the effect of themold appears to be underestimated. The assumption of asymmetric evaporation is alsofound, for example for products such as biscuits, cakes, and pancakes. In these studieswater removal is only included from the free surfaces, assuming no evaporation takesplace from the covered surfaces to the surroundings (Demirkol et al., 2006b; Feyissa,2011; Olszewski, 2006; Sakin et al., 2007a). Sakin-Yilmazer et al. (2012) model the heatand mass transfer in ring cake baking. They included the effect of the mold covering theside and bottom surfaces of the product by lowering the mass transfer at these surfacescompared to the free surfaces. Although a discussion or evaluation of the chosen masstransfer coefficients was not included, the study was inspiring for the modeling workpresented in the last part of the present thesis. Here the effect of the baking tray on theevaporation in butter cookies is investigated by varying the boundary conditions.
The reviewed studies show that baking equipment for experimental work and model val-idation has not been a thoroughly investigated area within baking technology research.Most modeling oriented studies appear to use standard kitchen scale ovens, which are notspecially designed for model validation. The applied oven conditions are included in themodels through the boundary conditions, for example by including several parallel heattransfer mechanisms. The best attempts to quantify differences between baking processeswere found to be measurements and comparisons of total heat flux in pilot and continuousovens (Sommier et al., 2011; Zareifard et al., 2009).
Ovens build to investigate specific aspects of baking or specialized baking processes aredescribed in the literature. Additionally, a few ovens allowing for controlled process vari-ations were found. Through the literature search it has not been possible to identify otherpilot scale ovens, constructed to emulate a continuous baking process and continuouslymonitor the product visually and by weight during baking. One unique feature of theoven presented in this thesis, is its ability to emulate the air flow pattern found in theinvestigated type of convection tunnel ovens.
Besides emulating the air flow found in convective tunnel ovens, a vital objective for thecollaboration with Haas-Meincke A/S was to construct a pilot oven working outside thenormal operation range of tunnel ovens. A feature which has not been described in any ofthe reviewed articles. The ability to vary process conditions, such as the humidity, tem-
23

perature, and air velocity, is an interesting area of research, and requested by researchersand oven manufacturers:
"An interesting alternative to bread manufacturers would be specializedovens that allow adjusting the heat transfer coefficient. Therefore, in addi-tion to the improved efficiency sought by oven builders, versatility in terms ofdesign, optimization, and control of the baking process would be delivered tobaking industry." - Purlis (2012)
In the new pilot oven this is one of the wishes that has been fulfilled. Adjusting the inletair velocity will create variations in the over all heat transfer coefficient. Additionally, itis possible to change the distribution of air entering the oven chamber above or below theproduct, along with the distance between the baking tray and the inlet nozzles.
The ability to vary inlet air velocity and the distance from inlet nozzles to the bakingproducts is not available in the industrial tunnel ovens of interest. These features enableexperimental work, and model validation, outside normal operation range in the industry.
It is clear from the present review that improvements are still needed in mathematicaldescriptions of heat and mass transfer in bakery products. The present thesis contributesto advancement in this field. The main contributions are the construction of the pilotoven, enabling complex validation and experimental conditions, and the modeling work,investigating the effect of the baking tray on the mass transfer properties in a biscuitproduct.
24

2.4 Project hypotheses
The research question establishing the foundation of the present work is:
How do process conditions influence characteristics of products during baking in a contin-uous, convection tunnel oven?
In the project this question is investigated through a number of specific objectives coveringexperimental and theoretical work. A goal of the present work is to obtain increasedunderstanding of the influence of baking conditions on the product quality through pilotplant experimental work and mathematical modeling. Experimental work in full-scalecontinuous ovens is resource demanding, and the options for monitoring the product andmodifying the process conditions are very limited. Therefore the following hypothesis hasbeen the basis for the presented work:
It is possible to construct a pilot batch oven capable of emulating continu-ous baking processes as seen in a common type of industrial oven. This pilotoven will allow for controlled and monitored experimental work, enabling in-creased knowledge and understanding of industrial baking processes, that canbe applied for the improvement of mathematical modeling of the investigatedprocesses.
The hypothesis is evaluated through a number of specific objectives. Working with theseobjectives the goal was to either verify or reject the hypothesis. The objectives are listedbelow and they are considered the aims of this project:
1. To design and construct a pilot batch oven which can emulate the process conditionsin convection tunnel ovens as designed by Haas-Meincke A/S.
2. To validate the pilot oven. The validation is separated into two steps, first: ensuringeven heating in the baking area and second: examining the oven’s ability to emulatea continuous tunnel oven.
3. To describe the baking process through a mathematical model that can be solvednumerically.
4. To apply experimental data from the pilot oven to improve the mathematical modeland show that the combination of experimental data and modeling can increaseknowledge and understanding of the investigated baking process.
Due to the delay in the pilot oven production an additional objective was added to thelist:
5. To review the methods applied for objective quality assessment of bakery products,and examine the prospects of a new method for bakery product evaluation.
25

26

Chapter 3
Mechanistic description of bakingprocesses
In this chapter the changes, which a product undergoes during baking, are described.The overall transformations in the dough are described along with the main physicalchanges. For a thorough chemical description of baking and the associated reactions,such as Maillard reactions and starch gelatinization, the author refers to other morecomprehensive works such as (Davidek and Davidek, 2004).
The chapter covers baking of two quite different types of bakery products, bread andbiscuits. Bread is a moist and spongy product with a final crumb moisture content around40%. Biscuit are dry and crumbly products with a final moisture content below 5%. Thebaking process is described stepwise for each of the two product groups. Although themain focus in the project has been on biscuit baking, the mechanisms in bread bakingare included for comparison and to give a thorough introduction to the mechanisms inbaking products.
3.1 Ingredients and dough preparation
The first step when baking is to select the right ingredients, in the right quality. In thissection the most common ingredients in bread and biscuits are given.
The most basic ingredients in all bread products are flour and water. Where the water isworking as a binding agent to help disperse soluble ingredients throughout the dough. Inbread products the water content in the dough is high, around 40% (w/w) in the recipeused by this author (cf. the work presented in Appendix B). The water content in biscuitdough is much lower, 15% (w/w) in the recipe used in this work, and generally consideredto be between 10-40% (w/w) (Mowbray, 1981).
For both bread and biscuit baking the protein content of flour is very important. A hightotal protein content is often equivalent to a high concentration of the protein gluten.
27

When kneaded, gluten forms a strong network which results in the spongy structure ofbread crumb. Therefore a high protein content is desirable for bread baking. The proteincontent for bread flour is generally between 12-13% (w/w) (Cauvain and Young, 2006).In biscuits on the other hand a low gluten content is desirable to maintain a crumbletexture in the products, the protein for such products should be 9-11% (w/w) (Manley,2011; Cauvain and Young, 2006).
The type of biscuit studied in this work falls in the biscuit category of short-dough biscuits(Manley, 2011). For these biscuits two additional ingredients are especially important forthe sensory (taste and texture) experience: Sugar and fat.
Fat (or shortening) stabilize bubble formation in the dough, and prevents gluten networksfrom forming (Cauvain and Young, 2006; Manley, 1998a).
Sugar does not only contribute to the biscuit with a sweet taste. It is also important forthe structure of the biscuit, and the surface browning reactions. The surface browning isfor a large part due to caramelization and Maillard reactions between reducing sugars, e.g.glucose, galactose, and maltose, and amino acids (Davidek and Davidek, 2004; Broyartet al., 1998; Capuano et al., 2008). Main sources of amino acids for Maillard reactionsare ingredients such as milk, milk powder, or eggs.
In most products some degree of rise or formation of air bubbles is desired. Leaveningagents are either chemical, e.g. bicarbonate of soda, or biological, such as yeast or sour-dough. While exceptions are seen, most biscuits are leavened by chemical agents andmost bread products by yeast or sour-dough.
Additional ingredients are often included in bakery products, either for the texture, tasteor appearance including eggs, salt, savory ingredients (chocolate chips, nuts, dried fruits),and enhancing ingredients (enzymes, ascorbic acid, emulsifiers) (Cauvain and Young,2006).
The ingredients are mixed according to a given recipe. Then biologically leavened productsare left to rise for a certain amount of time. The chemically leavened dough might be leftfor a short pause to allow the ingredients to set, and flavors to fully dissolve in the doughmatrix.
After rest or rise the products are shaped. A number of different methods exist to shapebiscuits, such as wire cutting, sheeting, extrusion or molding, all giving different propertiesand shape characteristics to the final product. Bread is shaped by different rolling andshaking mechanisms. After shaping biologically leavened products are proved at increasedair humidity and temperature. Finally the products are placed in or transported throughthe oven chamber.
The oven type will vary in type, depending on the desired final product. For breadproducts radiation or directly fired ovens are often used (Pedersen, 2009). Biscuit productsare mainly baked in convection or directly fired ovens (Pedersen, 2009), depending on thespecific biscuit product.
28

3.2 The baking process
Overall baking processes can be separated into two main phases: a heating phase anda drying phase. During the initial heating phase the product temperature is elevatedto a point where water begins to evaporate from the surface. When this temperature isreached the main portion of the transfered energy will be used to evaporate water, andonly a small part will be used to heat the bulk product. The processes taking place inbread products and biscuits are slightly different and the baking process in the two groupsare therefore treated in two different sections.
3.2.1 Bread baking
The bread baking process is illustrated schematically in Figure 3.1. In the figure theprocess is divided into five steps, whereof the first four are the actual baking.
Figure 3.1: Overview of the steps in the bread baking process.
Oven spring: When the cold dough is placed in or enters the oven chamber, energy istransfered to the surfaces of the bread. Energy transfer takes place by radiation fromthe oven chamber walls and the baking band, conduction through the baking band, andconvection from air movement. Additionally water vapor may be used in bread baking to
29

increase the initial heat transfer rate and create a shiny crust. Water vapor will condenseon the cold surface of the product increasing the heat transfer process.
From the product surface, energy will move inwards towards the colder center. Thiswill happen both by conduction along the solid dough matrix and by water evapora-tion/condensation in the small air pockets formed by kneading and fermentation (McGee,2004).
The air entrapped in the dough, in small air cells, will start to expand as they are heated.When heated, the dough becomes softer allowing the air expansion to increase the prod-uct volume. This process is called the oven spring with the total oven spring being thedifference in height between the unbaked and the final product (Cauvain and Young,2006). The limiting factor for the oven spring is solidification of the bread surface, orcrust formation (McGee, 2004). The crust is formed when water evaporates from thesurface leaving the outer layer of the product dry and inflexible.
Crumb structure (foam to sponge): Water will primarily evaporate from the surface,leaving the internal water concentration constant throughout baking. Measurements madeby the author showed that the water content in dough is the same as the water contentin the final bread crumb (gwater/gsample), in the investigated case approximately 40%.
During baking the bread crumb still undergoes a transformation. In the beginning ofbaking the dough contains a number of separate cells, which can be compared to a foamstructure. The starch molecules gelatinize as they absorb water and the proteins denaturedue to the heat (McGee, 2004). These transitions will create an increasingly inflexiblestructures around the cells. In the cells water vapor and air will expand as the product isheated. As the cell walls becomes rigid they will start to break. In this way a continuousnetwork is formed through the product, transforming the crumb from a foam to a spongelike structure (Mills et al., 2003).
The foam to sponge process is illustrated schematically in Figure 3.2(a) and on the pic-tures in Figure 3.2(b). The pictures are taken by the author showing bread rolls whichwere steam-baked at 95◦C. The low temperature with additional steam injection was cho-sen to assure no crust formation as only the crumb development was of interest and thebread rolls should be easy to cut.
Final baking: The crust is formed at the surface as moisture evaporates. One of theappealing features of bread crust is the brown color and aroma components formed bysugar caramelization and the Maillard reactions. These reactions require a high tem-perature and intermediate to low water activity (Capuano et al., 2008; Purlis, 2010).Investigation of the browning reactions in crackers showed that browning was initiated inthe temperature interval of 105-115◦C (Broyart et al., 1998).
If steam is added in the initial phase of baking, resulting in water condensation on the
30

(a) Transition from foam to sponge in bread dough, schematically (Mills et al.,2003).
(b) Picture of bread rolls steam-baked for different periods of time. Photo: byauthor, January 2010.
Figure 3.2: Illustrations of the crumb transition from foam to sponge during breadbaking.
surface, a shiny crust can be obtained. This happens because the water helps gelatinizethe starch forming a glossy surface. The difference between steam and no-steam can beseen in Figure 3.3.
Figure 3.3: Crust difference on bread rolls baked with steam (left) and in dry air (right).Photo: by author, March 2010.
31

3.2.2 Biscuit baking
Biscuit baking can be divided into two stages (Mowbray, 1981). First the developmentstage, similar to the oven spring for bread, then the drying and coloration stage. Anoverview of the physico-chemical processes taking place in each step is shown in Figure3.4.
Figure 3.4: Schematic illustration of the steps in biscuit baking. The two lines rep-resenting the biscuit surface and interior body, respectively. Illustration adapted from(Mowbray, 1981).
Development stage: In the first stage the same processes as in bread take place through-out the biscuit. When observing biscuits with a high fat content, such as butter cookies,this first phase is seen as a whitening of the surface. The appearance of the biscuit be-comes softer and the edges rounder. A certain oven spring occurs as CO2 is formed bythe chemical leavening agent and water vapor expands in the soft dough. This expansionresults in a foam to sponge process as seen in bread products. As the dough transformsfrom foam to sponge it allows for water vapor to move through the now porous product(Manley, 2011). The transport of vapor is faster than that of liquid water transported by
32

diffusion in the solid biscuit matrix.
Drying and coloring stage: When the surface temperature exceeds 100◦C the waterbegins to evaporate. The water evaporation dries the surface and browning from theMaillard reactions and caramelization of sugar is initiated.
The drying step is the longest of the two phases. Opposite bread products, the wholebiscuit is dried to obtain a long shelf-life and the desired texture. For the butter cookiesinvestigated in Chapter 8 the water content decreases from approximately 15% to 0.5-3.5% depending on the baking time. A stagnation in biscuit body temperature is seenwhen evaporation is initiated. In the beginning of the evaporation step the moisturewill be freely available for evaporation slowing down the heating of the biscuit body. Asthe freely available water is evaporated, the temperature of the biscuit dry matter willincrease. The more tightly bound water is now evaporated by slow diffusion drying.
Most biscuits are still soft when removed from the oven. The full setting of the biscuitstructure does not occur until the biscuit is sufficiently cooled. During baking the sugarin the biscuit has formed a syrup. When cooled the sugar in the syrup will transformto a glass state. The glass transition process, possibly combined with hydrogen bondsformed between proteins and starch molecules, result in the final crisp and brittle textureof biscuits (Chevallier, 2002; Pareyt and Delcour, 2008).
During storage the texture of the biscuit changes as the dry product starts to absorb mois-ture from the air. Moisture absorbed from the air will change the structure in the biscuitfrom glassy to rubbery as moisture causes the sugar’s glass transition temperature todrop below room temperature (Martinez-Navarrete et al., 2004). To protect the productsand obtain the longest possible shelf-life with a good sensory quality biscuits are oftenpackaged air tight using materials with controlled water permeability (such as coated cel-lophane films, polypropylene films, films coated with aluminum foil or metallized films)(Manley, 1998b).
3.3 Complexity and modeling
This chapter has given an overview of the major changes happening in two types of bakeryproducts during baking, with focus on the physical-structural changes. A full descriptionof a baking process, including all changes and parameter interactions would comprise avery large and complex work in its own right. The final goal in this work is a quantitativemodel, suitable for simulations of varying process parameters in baking processes. Thecomplex baking process must thus be appropriately simplified while still maintaining asufficient degree of accuracy.
The main processes included in the simulation are the heat and mass transfer. Thesetwo processes are not necessarily complicated to model, depending on the assumptions.
33

If the product is assumed to have a uniform temperature and constant physico-chemicalproperties throughout the process, the heat and mass transfer modeling can be calculatedeasily. However, in the case of biscuit baking this would lead to a poor model, unable togive a representative approximation to the real process.
A full model including all factors and purely based on the physics of the process wouldbe considered a white box model. This type of models are not only heavy in regard tocalculations they might also be difficult to obtain as all the needed information may notbe readily available. The opposite approach to model building is to base the descriptionpurely on experimental data. This approach is called black box or empirical modeling.
Between these two approaches there is a gray area of white box models supplemented byempirically obtained descriptions (Hadiyanto et al., 2007). In this work the “gray box”approach will be used for the mathematical descriptions of the baking process in Chapters7 - 9.
34

Chapter 4
Quality assessment methods forbakery products
This chapter is concerned with a study of typical methods for objective evaluation ofbakery product quality. The focus of the study is mainly on methods applied in academicwork. Therefore the study, its results, and conclusions are based on findings in theacademic literature.
The main target of the work described in this chapter is to create an overview of the mostwidely applied methods. Additionally the methods tested and applied in the present workare considered in relation to the experimental work.
4.1 Objective quality assessment
When looking at a product we instantly have a feeling of whether we will like the productor not, but how do we know this? And more importantly for the manufacturer of theproduct, how can this knowledge be quantified?
Often people talk about “quality”, saying that a certain product is either good or badquality. We may have the feeling that we know what they mean, and either agree ordisagree. However, this kind of undefined quality is highly subjective and two differentpeople may feel completely opposite when talking about likes and dislikes based on theirpersonal preferences and their history with a given product. The science of turning sub-jective preferences or evaluations of food products into a quantifiable measure is sensoryanalysis, and is a whole field of study in itself.
For industrial day-to-day production it is important to have processes with a high degreeof consistency and predictability. The properties of the product should not change fromday to day or batch to batch. A relevant quality parameter in this case will show thereproducibility of the product. This is also the case if a product is produced aroundthe world. Then reproducibility as a quality parameter will demand that it is possible
35

to produce the same product at different sites independently of local variations in rawmaterials, climate, personnel, or equipment.
In the following, objective and quantitative quality assessment methods used to evaluatebakery products are investigated. A full investigation of quality assessment methodsfor all bakery products is out of the scope for this project. The specific product groupinvestigated is therefore limited to biscuits (as defined in Section 2.2.1). The main focus ison methods applied in published scientific work to quantify the quality of different biscuitproducts. Sensory analysis is not included in the following study. These methods requiretime and specially trained personnel to give objective quality assessment results.
Quality assessment methods are in the following divided into four different categories tosimplify the overview and descriptions. The following categories have been used to groupthe investigated research: Product appearance, physical dimensions, texture measure-ments, and evaluation of the product composition.
4.1.1 Quality assessment methods in academic literature
To create an overview of the most commonly used assessment methods a targeted lit-erature review was performed. The literature was found in the article database of theTechnical Information Center of Denmark. The search resulted in 6341 hits for journalarticles. Covering articles (in some cases only titles and abstracts) from 1910 to the springof 2012. Not all were relevant or describing quality assessment of baked biscuit products.For the present study 42 full-text articles were selected going back to 1936 and mainlycovering the recent years of research. The distribution over year of publishing, along withan overview of the categories of assessment methods used in each article, are found inAppendix H.
The overall distribution between the chosen quality assessment categories is shown inTable 4.1. Based on this distribution the most widely applied group is evaluation of oneor more physical dimension (height, width, length and/or diameter). In this group thespread ratio (diameter or length divided by height) is often used. The appearance, mainlythe surface color measured as CIE L∗a∗b∗-values, was the second most applied method.For texture measurements mainly the hardness (the peak force at a break) was measured.
In several of the investigated studies more than one method was used to evaluate theproducts. For example all groups are applied in (Mamat et al., 2010); measuring thewidth, length, thickness, and volume (dimensions), the hardness (texture), the color (ap-pearance), and the water content (composition).
Interestingly few authors explain their choice of quality evaluation methods. One of thefew examples is by Perrot et al. (Perrot et al., 1996). A short explanation is given thatthe surface color is measured as the “operators have an important task in the evaluation of
1June 5th, 2012
36

Table 4.1: Overview of the division between the quality groups in the 42 investigatedarticles, more than one group may be used in the same study.
Appearance 16Dimensions 34Texture 16Chemical/composition (incl. moisture and aw) 15
product qualities, specifically color” (Perrot et al., 1996). The goal of that specific projectwas to substitute the operator by an automated assessment method.
In the majority of studies the assessment method is simply stated with no further expla-nation. It is thus up to the reader to deduce whether the applied method would mainlybenefit research interests, process development, the consumer, or the manufacturer.
The following sections contain a short overview of the most widely used methods withineach assessment category. These are followed by a short discussion of the methods appliedin the present project, focusing on the butter cookies investigated in relation to validationof the batch oven and the following modeling work.
4.1.2 Evaluation of physical dimensions
In more than 80% of the investigated studies the dimensions of the product were includedto describe the quality of the product. In 31 studies the width (diameter or length) of theproduct was given as a quality property. The diameter or width divided by the height ofthe biscuit (called the spread or spread ratio), was additionally calculated in 11 cases.
A probable reason for many researchers to apply geometrically based assessment methodsare standards for flour quality assessment published by the AACC (AACC, 2012; Bettgeand Kweon, 2009). In these standardized methods the width, height, and spread ratioare used. According to the description of these methods there is a relation between thequality and the cookie geometry. A high quality flour will result in a larger diameter andlower thickness than a poor flour quality.
In the investigated articles the spread ration with reference to AACC methods was pri-marily used to evaluate differences in baking quality when varying the product recipe(e.g. sugar types and amounts (Bettge and Kweon, 2009; Nishio et al., 2009), additionof cumin and ginger powders (Abdel-Samie et al., 2010), and flour composition and fibercontent (Özboy Özbas et al., 2010)).
Other properties included in the physical dimension category were: volume, weight, poros-ity, and absorption. Of which the last two were only seen in one study (Latimer and Watts,1936) from 1936.
37

Figure 4.1: The CIE L∗a∗b∗ coordinate system (HunerLab, 2012).
4.1.3 Evaluation of appearance
The most widely used assessment method for appearance is the surface color measured inL∗a∗b∗-coordinates with colorimeters, for example Minolta Chroma Meters. The Commis-sion Internationale d’Eclairage (CIE) developed the internationally applied L∗a∗b∗-systemfor color measurements in 1976 (Yam and Papadakis, 2004; Dansk Standard, 2011). TheCIE L∗a∗b∗-values give a 3D representation of the color of an object based the threeaspects.
The L∗-values represent lightness in the interval 0 - 100, from absence of light (black) at0 to complete lightness (white) at 100. The a∗-value indicates the position between redand green and the b∗-value the position between blue and yellow. The a∗- and b∗-valuesare prefixed ± depending on the dominating quality of the color. The coordinate systemis illustrated in Figure 4.1. Amongst the investigated articles 12 applied assessmentsof L∗a∗b∗-measurements (Broyart et al., 1998; Purlis, 2010; Mamat et al., 2010; Perrotet al., 1996; Abdel-Samie et al., 2010; Özboy Özbas et al., 2010; Manohar et al., 1999;Ozturk et al., 2009; Seker et al., 2009; Stevenson et al., 2010; Goldstein and Seetharaman,2011; Romani et al., 2012). In the studies measuring L∗a∗b∗-values the L∗-value is oftencorrelated with browning. The lower the L∗-value the darker the surface, and thus thehigher the degree of browning on the bakery product surface (Purlis, 2010).
Other appearance evaluation methods include whiteness (Manohar et al., 1999) or dig-ital capture methods such as photography or image analysis (Stevenson et al., 2010;HadiNezhad and Butler, 2009a). The photographic method applied in one study wasused to evaluate the dimensions of the biscuits during baking (Bettge and Kweon, 2009),comparing different cutting methods. In another study a camera was used to evaluate thevisual coarseness of the product surface (HadiNezhad and Butler, 2009a). None of theinvestigated articles were concerned with methods such as near infra-red spectrometry ormore advanced imaging systems.
38

4.1.4 Texture evaluation
The experience when biting a biscuit is of great importance for the consumer’s experienceof biscuit quality. A soft, chewy, or spongy feeling is rarely an indicator of good biscuitquality. Crisp, crumbly, or brittle are more desirable descriptors of the biscuit texture.Descriptors such as these are used in sensory analyzes of biscuits. In such analyzes trainedpanels of judges evaluate the products and assign them with specific characteristics. How-ever, sensory evaluations are laborious and need more preparation than what is generallydesirable for fast quality evaluations, especially in a production situation.
Alternatively objective texture measuring methods may be used. 16 of the investigatedstudies included some form of texture analysis. 15 of these reported a breaking or pen-etration force (Mamat et al., 2010; Abdel-Samie et al., 2010; Özboy Özbas et al., 2010;Latimer and Watts, 1936; Manohar et al., 1999; Seker et al., 2009; HadiNezhad and But-ler, 2009a,b; Jacob and Leelavathi, 2007; Kweon et al., 2011; Maache-Rezzoug et al., 1998;Pareyt et al., 2010; Saha et al., 2011; Sindhuja et al., 2005; Zoulias et al., 2000), and onethe product brittleness (Grizotto et al., 2010). One study supplemented the breakingforce measurement with the breaking distance, indicating the elasticity of the product(Zoulias et al., 2000).
Figure 4.2: Force as a function of time for a double compression texture analysis profile(Mochizuki, 2001).
Most texture assessment methods are based on force measurement when a probe compressor penetrate the investigated sample. The measurements are carried out in specializedmachines, texture analyzers. Different probes and rigs exist for measurements of differentproperties of different food products. From the measurements the result is given as agraph showing the force as a function of either time or length. From the obtained data a
39

number of characteristic properties for the product are found, such as the maximum force(hardness), the first break in the product (fracturability), and the work needed for thecompression by integration of the positive area under the graph when the force is a functionof distance (Mochizuki, 2001; Bourne, 2004). An example of a double compression, textureprofile analysis or TPA, mimicking the first two bites into a food product is shown inFigure 4.2.
4.1.5 Product composition
The main aspect of product composition investigated in the examined articles was thecontent or availability of water. The water content or water activity was used as a measurefor the product quality in 12 of the 15 articles in this category (Broyart et al., 1998; Mamatet al., 2010; Goldstein and Seetharaman, 2011; Romani et al., 2012; Kweon et al., 2011;Pareyt et al., 2010; Zoulias et al., 2000; Grizotto et al., 2010; Akingbala et al., 2011;Arogba, 2002; Hong et al., 1996; Wade, 1987).
The water content and activity are relevant parameters regarding the shelf life and eatingexperience of crisp products such as biscuits. When measuring the water content directlyit is also a way of evaluating the degree of drying and thus mass transfer that has takenplace during baking.
In relation to research and understanding of the mechanisms of baking the water contentis an important aspect. The same is the case in quality assurance and when implementingchanges in the production process. For the average consumer on the other hand, the watercontent as a quality assessment aspect is a more hidden characteristic of the product.
Besides the water content other investigated aspects of the product composition weremore related to health issues. These included content such as following: fiber content(Seker et al., 2009; Akingbala et al., 2011), the protein content (Pareyt et al., 2010), andthe presence of allergens (Monaci et al., 2011).
4.2 Choosing assessment methods for the present work
When choosing an assessment method it is important that it renders the desired informa-tion. Thus the underlying reason for wanting to perform quality measurements must beclear. For example when investigating changes in the process conditions, it is beneficialto consider the following questions:
• Which aspects of the product could be influenced by the change?
• Which of these aspects are crucial for the rest of the production, or in themselvesvital product characteristics?
40

When this is clarified a suitable assessment method may be selected.
In the present work, the focus is on predicting the effect of the baking oven conditions, onthe quality, or properties, of the bakery product. In the modeling work the heat and masstransfer during baking is examined. The assessment method applied for model validationmust therefore reflect the investigated aspects. Therefore measurements reflecting theheat and mass transfer are applied.
The results obtained from the mathematical models are the water concentration and thetemperature in the product. The water concentration is evaluated as the weight lossduring baking. This is based on the assumption that all mass loss during baking is due towater evaporation. The temperature is measured inside the product. The temperature isnot a typical quality assessment parameter. However, as it is applied for the purpose ofmodel validation it is included in this section.
Additional studies of the influence of different baking times, temperatures, and air veloci-ties were conducted (Section 4.3 and Chapter 6). For these studies additional assessmentmethods were considered compared to the model validation. In the experimental workthe applied quality indicators should preferably show a change if the process conditionswere changed. This was desirable when validating the batch oven against the tunnel oven.
Physical dimension measurements were tested. The diameter was measured, however nocorrelation was found to the applied process variations. The spread was not investigatedin this work. Generally the spread has mostly been associated to changes in the productcomposition, therefore its dependency on process variations could be interesting to study.
Initial experiments using texture analysis were carried out using a TA.XT2 Texture An-alyzer (Texture Technologies Corp. and by Stable Micro Systems (Texture Technologies,2012)). An example of the breaking force for a three-by-three experiment, varying the bak-ing time and oven temperature, analyzed by a three point bend rig (Martinez-Navarreteet al., 2004) is shown in Figure 4.3. An example of a three point bend rig (the showncookie is smaller than those for model validation) is shown in Figure 4.4.
The reproducibility of the texture measurements was low and no differences were seen forthe investigated oven settings. Therefore this method was not used to evaluate the buttercookie quality.
In the following studies mass loss measurements are supplemented by assessments fromthe group of appearance evaluation methods. A total of four methods were applied in thestudies; one of which has been categorized as a sensory method.
In Section 4.3 a study examining an image analysis method for quality evaluation ispresented. From the image a browning score is extracted along with the water content inthe investigated butter cookies. This method, while easy to use and covering the wholesurface of the cookies, has a large demand for data analysis, also the equipment was notreadily available throughout the project period.
41

300 350 400 450 500 550 600 65010
15
20
25
30
35
40
45
50
Baking time (s)
Co
oki
e h
ard
nes
s (N
)
Toven
= 160°C
Toven
= 180°C
Toven
= 200°C
Figure 4.3: Results from a breaking test of butter cookies, three replicas were carriedout at each time/temperature combination.
Figure 4.4: Example of a three point bend rig. Photo: by author, March 2009
In Chapter 6 the initial validation of the pilot oven was based on a 6 step browning scalealong with mass loss measurements. The advantage of the browning scale is that the entiresurface is included and the evenness of browning considered in the evaluation. The evalu-ation was visual and could be seen as a sensory evaluation. When the article manuscriptdescribing the new oven (Appendix D) was submitted for publication a more quantitativemethod was required by the reviewers. Therefore an additional method is included. Frompictures of the cookies L∗-values from across the surface were extracted for comparisonof the two ovens. In the final part of the the oven validation (Section 6.4) the effect ofchanging the inlet air velocity inside the oven chamber is investigated. In this study themass loss and is combined with the use of L∗a∗b∗ (Minolta colorimeter) measurements onthe product surface. Besides the categorization all the applied assessment methods were
42

chosen to obtain quantitative measures for the variation in the products.
4.3 Multi-spectral image analysis as a quality assess-ment method
A multi-spectral image analysis method was evaluated as an assessment method for buttercookies. The work was carried out in close collaboration with my colleague Dr. BjørnSkovlund Dissing. The data processing was primarily performed by Dr. Bjørn SkovlundDissing, and the experimental work and evaluation of the results in relation to foodproduction were primarily my contributions. An article based on the work has beenpublished online in Food Science & Nutrition, June 12, 2013. The work is considered anovel and important part of the PhD project contributions. Due to the different scientificfocus in the thesis only a short summary is included in this chapter. For additionalinformation on the study the reader is directed to the full version of the article which isincluded as Appendix A.
In multi-spectral imaging an image of an object is captured using light in a range ofspecific wavelengths in a controlled set-up. The reflectance from the object is capturedby a camera producing one image per wavelength. Through image analysis informationabout the characteristics of the object is thereby obtained. A thorough description of theapplied multi-spectral imaging system (VideometerLab) is presented by Carstensen et al.(2006).
In the present study the option to obtained information on two different product qualityaspects was evaluated. The investigated quality aspects were the surface browning andthe average water content in the cookies. The application of an advanced imaging systemas the VideometerLab for surface browning determination could be considered exagger-ated due to the availability of cheaper methods which are already applied in the bakeryindustry. However, in combination with determining the water content in the productthe method would be very desirable. In McFarlane (2006) methods for product moisturedetermination are discussed, and an online method with no need for product contact isindicated to be the most desirable method. None of the methods presented in the studywere found to adequately measure the moisture.
The idea to use the VideometerLab for both surface color evaluation and water contentestimation is based on previous studies of the equipment. The applied VideometerLab hasbeen used to quantify the amount of the red colored astaxanthin in salmonids (Dissinget al., 2011), to measure the water content or degree of agglutination in continuously friedminced meat (Dissing et al., 2009; Daugaard et al., 2010), and as a method to evaluatequality changes in stored wok fried vegetables (Clemmesen et al., 2012). Additionally it isused for product sorting e.g. color sorting of mink fur (Kopenhagen Fur) and monitoring
43

of shape- and texture-distribution of bulk granule samples (Ferring Pharmaceuticals)2.
The investigated product was the same type of butter cookies as used in oven validationand the modeling work. For the application on butter cookies the surface browning wasevaluated as a browning score presented as a quadratic response surface. The brown-ing score was calibrated against sensory evaluations of the surface browning, indicatingwhether the cookies were under baked, adequately baked or over baked. The browning scorewas translated into a function of the oven temperature (160-200◦C) and the baking time(4 - 16 min) shown in (4.1) and Figure 4.5.
y = 0.32− 0.12x1[min−1]− 0.13x2[◦C−1] + 0.008x1x2[(min ·◦ C)−1] (4.1)+0.02x2
1[min−2] + 0.02x22[◦C−2]
In (4.1) x1 is the baking time in minutes and x2 the oven temperature in ◦C.
Figure 4.5: The browning score evaluated for the cookie surface as a function of bakingtime and oven temperature. The zones indicate areas created by the sensory evaluation,corresponding to under, adequate and over baked appearance.
The developed model to estimate the water content was based on water content measure-ments of baked and cooled cookies which were compared to surface images of the samecookies. Through a principal components analysis of the images sufficient variation wasfound to predict the water content with good precision. The water prediction model wasfound to correctly estimate the average water content with an absolute error of 0.22%.
Statistical analysis showed that the most significant wavelengths for browning predictionswere in the interval 400–700 nm and the wavelengths significant for water prediction wereprimarily located in the near-infrared spectrum.
2www.videometer.com, June 12th 2012
44

It was shown that it is possible to use multi-spectral imaging to asses both the browningand the water content of butter cookies. Furthermore, the method was used to evaluatethe browning and water content across the surface of the cookies, giving an indicationof the evenness of the process and the produced products. In a production setting, onlythe relevant wavelengths would be used for monitoring, making image capturing and dataprocessing possible during online production.
4.4 Summary for assessment methods
From the literature study of quality assessment methods evaluation of the product ap-pearance and geometry were found to be the most widely applied methods for biscuitproducts. These methods are generally fast and easy to perform, and from a manufac-turer point of view they are good applicable methods as they may be done online or bythe production line. For researchers quantitative version of these methods are preferred,enabling modeling and coupling of mathematical models and the quality of a certainproduct.
Methods such as dry matter or weight loss measurements are considered more relevantfor research or product development than as a tool for quality control. Traditional drymatter measurements is a slow method and not suitable for rapid quality estimates by theproduction line. Faster methods such as water activity measurements or deduced watercontent estimates, for example by image analysis, are alternative ways for fast evaluationof the product drying. For online measurements the proposed VideometerLab solutioncould be a possibility, as it does not require direct product contact.
Through experimental work and measurements it is possible to find a number of cor-relations between measurements and various changes in the product. However, thesecorrelations are not necessarily representations of causality between measurements andinvestigated quality aspects. For all quality assessments evaluations of the relevance, theconnection to the investigated problem, and a suitable data acquisition method shouldbe carried out. "An inappropriate test procedure will give poor correlations with sensoryassessment and be worthless" Malcolm Bourne on the use of texture analysis (Bourne,2004).
In the present work heat and mass transfer has been investigated for a biscuit product.To evaluate these processes, and enable comparison to modeling work, the weight loss,center temperature, and in some studies, surface browning, have been selected as qualityassessment methods.
45

46

Chapter 5
Design and construction of aspecialized batch oven
The work described in this chapter is an elaboration of the first part of the manuscript "De-sign and Construction of a Batch Oven for Investigation of Industrial Continuous BakingProcesses" (Appendix D), accepted for publication in Journal of Food Process Engineering.
A significant milestone in the PhD project was design and construction of a specializedbatch oven. The intention of the oven was to create a pilot scale environment capable ofbaking at similar conditions as found in large continuous tunnel ovens, with the option ofproduct and process monitoring during baking.
Compared to a standard batch baking process the multi-zone tunnel oven offers morefreedom for controlling the baking process (Baik, 2000; Mirade et al., 2004). Optimizationof continuous baking processes are traditionally performed by trial-and-error, as trainedoperators use their experience adjusting the process parameters to achieve the desiredquality and productivity (Manley, 2011). For both oven manufactures and industrialbakeries, there is a need to gain more systematic knowledge on the impact of the physicalconditions in tunnel ovens on both process mechanisms and product quality. Only onestudy has been found that describes a pilot scale oven designed to reproduce continuousbaking processes (Zareifard et al., 2006). This oven is further described in Section 2.3.
The design and construction of the new batch oven was carried out in close collaborationwith the manufacturer of large scale equipment for the bakery industry Haas-Meincke A/S,Skovlunde, Denmark. Haas-Meincke A/S is one of the world’s leading manufacturers ofcontinuous tunnel ovens and has a great interest in the relations between oven design, theenvironment in the oven, and the final product quality.
The specifications for the oven were discussed amongst the project partners. The ovenshould be capable of baking bread, biscuit, and cake products. Based on conversationsand discussions at design meetings the following is seen as a rough list of specificationsfor the oven:
47

• The oven environment must emulate baking conditions in continuous tunnel ovenswithin a normal range of temperatures, humidity, and air velocities applied for theinvestigated products in industrial bakeries.• It should be possible to vary relevant baking conditions: Temperature, air velocity,
air humidity, the distance between convective inlet and the product, and bakingtray materials.
• Options to vary between convection and radiation heating, and a combination ofthese, should be available.• Monitoring of the baking products must be possible: Product weight, visual inspec-
tion, and product temperature.• Monitoring of the baking process must be possible: Air temperature, air flow, and
air humidity.• Additionally it should be possible to:
– Varying the baking conditions outside the ranges normally applied in the in-dustry.
– Enable fast changes of baking conditions (temperature, air velocity, and airhumidity), simulating the different baking conditions experienced by a producttraveling through a zone divided tunnel oven.
Based on the list of desired functions for the oven, options for the design were discussed.The decision phase was mainly carried out as group brainstorm meetings between DTUand Haas-Meincke A/S. My personal inputs at the brainstorm meetings were focused onthe desire for versatility of the oven, the requirements for wide temperature ranges, andthe need to switch between radiation and convection heating. Between meetings my mainfocus was on the air flow pattern along with Haas-Meincke A/S’ R&D manager at thetime Mr. Søren Skovlund. This work is presented in Section 5.3 introducing the air flowpattern in tunnel ovens, standard batch ovens, and the new experimental batch oven.
The over-all research project, aiming towards a better understanding of tunnel oven bakingprocesses, was initially divided into two phases. The first phase including this PhD workand the construction of the batch oven. The second comprised an expansion of themodeling work, and included an additional pilot scale oven. The future oven has beenplanned as an approximately 4 - 6 m continuous tunnel oven, with good options for processcontrol and monitoring similar to the initial batch oven. While different design optionswere discussed for the first pilot oven, its basic nature as a batch oven was a fixed decision.
In the investigated tunnel ovens the product moves through different zones, normally witha length of 2 - 6 m. Each zone has a heating system and the temperature, air humidity, anddistribution between top and bottom heating is regulated on zone basis. When productstravel through the tunnel oven, different environments may be encountered. Incorporationof the continuous change in baking environment was one of the objectives for the pilotoven design. The convective system and its combination of dampers is estimated to havethe capacity to ensure these changes. A full validation of this design objective have notyet been fully investigated.
48

In the following sections different aspects of the oven design and features are describedand discussed.
5.1 The general design of the batch oven
The largest part of the oven is the air heating and recirculation system for the convectionheating system. The oven chamber is constructed as a large box in which the baking trayand the heating system are installed. The baking tray is placed on four legs traversingthe bottom of the box and placed on a scale. Above and below the baking tray frameworkair ducts are installed for the convection heating system. The air ducts are placed on atrolley moving from side to side emulating the movement of products through a tunneloven. In the back of the oven chamber steam may be injected.
The front of the baking chamber box is removable and allows for interior cleaning andmaintenance, including adjustment of the distance from the convection inlet holes to thebaking tray. In the front panel an oven door is installed. Through this door the bakingtray can be placed in the baking chamber and sensors for product temperature logginginserted.
The electric parts of the oven are connected to a control box and controlled either manu-ally at the box or through a computer. The utilized control program, Pjerrot, is speciallywritten for the oven (Mr. Peter Stubbe, DTU Food). It is possible to adjust the temper-ature in the baking chamber, the movement of the air duct trolley, the humidity in theexhaust air, and the setting of the dampers in the convective air system. The air velocityis controlled manually through a frequency converter connected to the air ventilator. Theinlet air setting is manually controlled on a step-less scale from 0 to 10. In Figure 5.1 theinterior and exterior of the batch oven are shown from different angles.
5.2 Process control
Three main aspects of the baking process is controllable in the batch oven: The airtemperature in the system, the air flow, and the humidity. In this section the possibilitiesfor controlling and following these process properties are discussed and compared to theinitial aspirations for the process control in the batch oven.
5.2.1 Temperature measurements
The temperature is measured at three points through the system. In the air heating unit,between the heating unit and the baking chamber, and inside the baking chamber. Twoof these measuring points are important for the process: The temperature measurements
49

(a) Front of the oven (b) Control panel, display on the humiditysensor and air duct trolley motor
(c) Interior of the oven chamber (d) Side view of the oven
(e) Ventilation system (f) Back of the oven
Figure 5.1: Pictures of the batch oven. (a) shows the front of the baking chamber. Thescale for weight measurements and the oven door are visible. (b) show the control box andthe motor moving the air duct trolley. (c) shows the inside of the baking chamber whenthe front panel is removed, the initial wires for radiation heating are seen on the lower airducts between the inlet holes. (d) shows the window at the side of the oven, and the clampsfor removal of the front panel of the oven chamber. (e) shows the ventilation system andthe air heating unit. (f) shows the back of the oven, it is seen how the convection air flowis divided into two inlet air streams with individual dampers for flow control to the left,in the center of the picture the exhaust air pipe is seen along with the end of the pipe forsteam injection. The connection box for radiation heating is seen to the right.
50

in the heating unit to avoid over heating and the temperature measured in the bakingchamber as this is used as the set-point for baking procedures.
The maximum allowed temperature in the heating unit is set to 600◦C, if this temperatureis exceeded an automated feedback mechanisms will switch off the heating element.
The temperature inside the baking chamber is measured a few centimeters above thebaking tray. The sensor is placed opposite the oven door minimizing the effect of cold airinlet when the oven door is opened or closed.
5.2.2 Heating systems
One of the initial goals for the oven was to enable multiple heating systems, ideally withoptions for alternating and simultaneous heating. Besides the conduction from the bakingtray, arising from a heated baking environment, radiation and convection heating is tobe implemented in the batch oven. The convective heating system is working and it ispossible to bake with varying air velocity and alternating top:bottom inlet air impact.However, a radiative heating system is not yet functional due to unexpected materialrelated complications. Both systems are described in the following sections, with mainfocus on the convection system.
Convective heating
The construction of the convective system is modeled around the systems found in Haas-Meincke’s indirectly fired convection ovens, a schematic view of this tunnel oven is seenin Figure 5.2 (Haas Meincke A/S, 2012).
Figure 5.2: Schematic illustration of a standard indirectly heated convection oven (re-peated from Chapter 2), (Haas Meincke A/S, 2012).
The main difference between continuous ovens and standard batch ovens regarding airflow is the external heating and air circulation system. In the examined tunnel ovens theair is heated indirectly by passing heated tubes, hereafter the air is distributed in the airducts above and below the product in each zone.
51

The inlet air volume per zone is 8000 m3/h. This volume is distributed between the topand bottom air ducts running parallel to the baking band. Each air duct has 700 inletnozzles per zone. The diameter of the nozzles is 13 mm, resulting in an average linearvelocity of 12 m/s when the volumetric airflow is divided by the total inlet area. Theinlet nozzles are holes in a stainless steel plate, with a slight curve.
In the new batch oven the air is heated by passing an electric heating element and entersthe baking chamber through air ducts above and below the baking tray. Two air exhaustareas are positioned along the front and back of the top air duct. Figure 5.3 shows aschematic illustration of the air ventilation system along with a picture of the bakingchamber seen from the side.
(a) (b)
Figure 5.3: (a) A photography of the baking area in the oven chamber. (b) A schematicillustration of the batch oven. The left part (A) is seen from the side, while the rest of theillustration (B - G) is seen from above. H is the height of the oven chamber, L the lengthof oven chamber and air system, W the width of the oven chamber and air systems. A -oven chamber, B - humidity sensor, C - fresh air inlet, D - ventilator, E - air exhaust, F- heating unit, G - ducts adjusting top and bottom inlet air.
The air duct nozzles are positioned in a staggered pattern based on the tunnel oven design.The number of inlet nozzles per zone is constant and independent on the zone length. Thenumber of nozzles in the batch oven correspond to approximately 5 % of a tunnel ovenzone. The pattern would thus be suitable in an oven zone approximately 5 m long and1.5 m wide. The pattern and dimensions for the batch oven are shown in Figure 5.4.
To avoid spot burning and to simulate the movement of the baking band through thetunnel oven, the air ducts are movable. The movement (left-to-right) may be up to 0.1 min each direction, equaling the distance between two nozzles on the same horizontal line.For the product this distance of oscillation will correspond to traveling through a tunneloven giving a uniform exposure to the hot inlet air across the baking tray.
The differences in the product movement in a tunnel oven and the batch oven wereconsidered. In the batch oven the movement will be oscillating, while the movement inthe tunnel oven will be continuous in one direction. In other studies, such as (Baik andMarcotte, 2003) the air velocity around the product has been expressed as a "relative
52
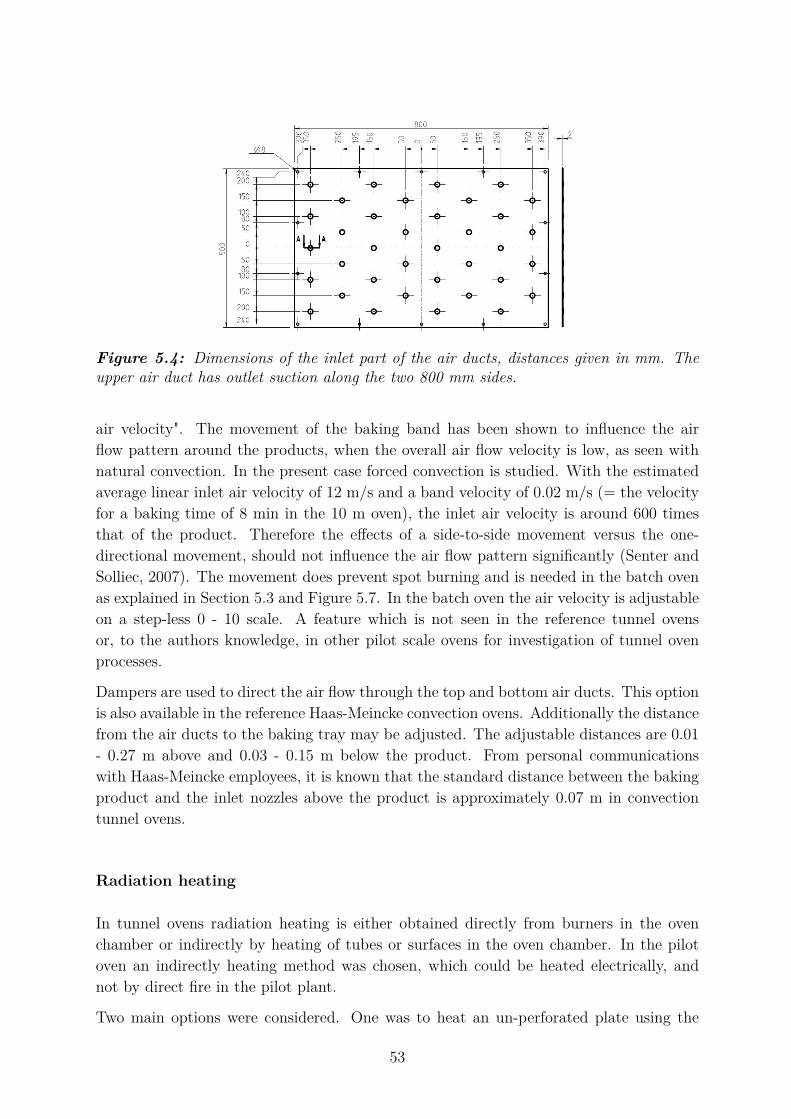
Figure 5.4: Dimensions of the inlet part of the air ducts, distances given in mm. Theupper air duct has outlet suction along the two 800 mm sides.
air velocity". The movement of the baking band has been shown to influence the airflow pattern around the products, when the overall air flow velocity is low, as seen withnatural convection. In the present case forced convection is studied. With the estimatedaverage linear inlet air velocity of 12 m/s and a band velocity of 0.02 m/s (= the velocityfor a baking time of 8 min in the 10 m oven), the inlet air velocity is around 600 timesthat of the product. Therefore the effects of a side-to-side movement versus the one-directional movement, should not influence the air flow pattern significantly (Senter andSolliec, 2007). The movement does prevent spot burning and is needed in the batch ovenas explained in Section 5.3 and Figure 5.7. In the batch oven the air velocity is adjustableon a step-less 0 - 10 scale. A feature which is not seen in the reference tunnel ovensor, to the authors knowledge, in other pilot scale ovens for investigation of tunnel ovenprocesses.
Dampers are used to direct the air flow through the top and bottom air ducts. This optionis also available in the reference Haas-Meincke convection ovens. Additionally the distancefrom the air ducts to the baking tray may be adjusted. The adjustable distances are 0.01- 0.27 m above and 0.03 - 0.15 m below the product. From personal communicationswith Haas-Meincke employees, it is known that the standard distance between the bakingproduct and the inlet nozzles above the product is approximately 0.07 m in convectiontunnel ovens.
Radiation heating
In tunnel ovens radiation heating is either obtained directly from burners in the ovenchamber or indirectly by heating of tubes or surfaces in the oven chamber. In the pilotoven an indirectly heating method was chosen, which could be heated electrically, andnot by direct fire in the pilot plant.
Two main options were considered. One was to heat an un-perforated plate using the
53

convective air system for heating, the other to install a grill-like wire system between thenozzles for convection heating. The first option have the advantages of an evenly heatedsurface, resulting in a nearly uniform radiation, and the option to have a measurableand controllable radiation temperature. However, the disadvantage of not being ableto quickly switch to convection heating or baking with a combination of radiation andconvective heating, resulted in this solution being discarded.
An electric wire system was chosen and installed in the oven. Metal wires with a diameterof approximately 3 mm were placed on the air ducts between the inlet nozzles. In Figure5.3(a) one may see the small hooks used to hold the wires in place.
Before the batch oven was moved from Haas-Meincke A/S’ construction facility to DTUit was unfortunately discovered that the material used for the wire connection was notcompatible with the air duct movements from side to side. At present the system hasnot yet been rendered functional and it has not been possible to conduct any bakingexperiments with radiative heating.
Considering the future prospects of the oven a system utilizing the already existing con-vection system should still be considered. A rack-like system for movable plates could beinstalled above and below the convection nozzles. While changing between convection andradiation would require the oven door to be opened which will disturb the temperatureand humidity, the system would be better controlled compared to wire heating. Due tothe nature of radiation heating, the temperature of the wires is important in order toestimate the impact on the baking product. Measuring the air temperature in the bakingchamber alone would not give sufficient information on the relation between radiationheating and the product quality. If an indirect radiation system, utilizing the convectivesystem was implemented the air temperature at the radiation plate would correspond tothe temperature of the plate. Hopefully a solution will be found in the future so thatthe oven will be able to fulfill more of its original purposes, and allow a broader range ofexperiments.
5.2.3 Air humidity
The air humidity is measured in the exhaust air collected at the sides of the top air duct.A Yokogawa High Temperature Humidity Analyzers type ZR22G-040 (Japan) is installedimmediately after the oven chamber. The signal is recorded on the control computer.
At the back of the baking chamber an inlet pipe is placed, enabling steam injectioninto the oven chamber. The steam injection is controlled through the control systemso that a specific level of air humidity is maintained during baking. As is the case forthe temperature regulation a pre-designed humidity program can be applied, for examplestarting the baking process with a high level of humidity and then finalizing the bakingin a dry environment.
The steam injection system was not ready to use when the main baking experiments
54

related to this work were conducted. Later experimental work with Swiss roll cakes haveshown a good ability to keep an even air humidity, even though the oven was found tohave many leaks (Møller, 2012).
Air humidity is an important aspect in many baking processes and for the purpose ofunderstanding continuous baking processes the steam injection system is a vital additionto the batch oven.
5.3 The inlet air flow
The inlet air ducts in the batch oven have been specially designed to simulate the air flowfound in convection tunnel ovens. For comparison I made CFD simulations showing theair flow in a standard laboratory convection oven, a tunnel oven, and the new pilot batchoven. The CFD simulations of the laboratory oven and the single inlet nozzle are made inthe finite volume simulation program Fluent 6.3 (Ansys). The CFD simulation of the newpilot oven is made in the finite element program COMSOL Multiphysics 4.3 (COMSOL,2012), applying the k-ω turbulence model. Finite element modeling is further describedin Section 8.2.
The standard laboratory batch oven has an internal heating element and a fan creatinga convection air flow by recirculation. Due to the fan the air flow patter is constant andthe air moves horizontally across the baking tray (right to left in the illustration), seeFigure 5.5(a). The air velocity was measured at the left side of the chamber with ananemometer. The linear average velocity of several measurements was used as the inletboundary conditions.
The CFD simulation of the tunnel oven includes the air flow from a single nozzle Figure5.5(b). The flow conditions above the inlet nozzle in the air duct is partly included in thesimulation. The inlet air boundary conditions are based on volumetric air flow, resultingin an average inlet velocity of 12 m/s through the nozzle.
Figure 5.6 shows half the cross sectional area of the pilot oven at a position with five inletnozzles in a row. In the simulation the inlet air velocity is set to 12 m/s at the nozzles.In order to run the simulation simplifications of the oven geometry were necessary: Thenozzle is designed as a hole in the surface above the product, in the actual oven thenozzle as a small curvature (as seen in the simulation of the tunnel oven nozzle); the airflow in the above air duct is not included; and the outlet is simplified to constitute thewhole right side of the illustration, instead of being positioned at the top right side nextto the outer inlet nozzle. Even with the simplifications the simulation is considered agood indication of the air flow in the pilot oven when the air ducts are stationary. Thesimulation shows how the air flow reacts around three cookies positioned on the bakingtray. The dominating flow close to the cookies is mostly parallel to the upper surface,some turbulence and varying local velocities are seen around the edges of the cookies. Thelatter showing that further work with CFD modeling may improve the understanding of
55

(a) Air flow in standard batch oven.
(b) Simulation of the air flow through one inlet nozzle in the tunnel oven.
Figure 5.5: (a) Air velocity and directions in a 3D simulation of the air flow patternin a standard batch oven for production kitchens (Rational CCC oven) (by Mette StenbyAndresen, 2008). (b) A 2D simulation of the inlet air flow through one nozzle in a tunneloven (by Mette Stenby Andresen, 2009).
local heat and mass transfer properties.
During baking the air flow will vary perpendicular to the plane of the illustration, as theair ducts move from side to side. From this movement and the staggered pattern of the
56

Figure 5.6: A 2D simulation of the inlet air velocity in half the cross sectional area ofthe pilot oven. The colors indicate the air velocity the arrows the air flow direction. Theoutlet is set as the entire right side of the domain to simplify the calculations (by MetteStenby Andresen, 2013).
inlet holes (varying from 4 to 5 per row, Figure 5.4) an even air flow is achieved across theproducts. An example of a sheet of cookie dough baked with no movement is shown inFigure 5.7. The need for side to side movement is clear from the resulting "spot burning"below the inlet nozzles.
Figure 5.7: A section of a sheet of butter cookie dough baked in the pilot oven withno movement of the air ducts. The horizontal distance between the center of the spots isapproximately 0.1 m.
The simulations of the tunnel and pilot ovens show that the inlet air flow from the nozzleshave some of the qualities associated with jet flow. Jets can be divided into three regions,a free jet region in which the air jet is behaving as a free jet, a stagnant zone, where thejet meets the surface and a radial spread zone on the surface itself (Sarkar and Singh,2003). However, considering the simulation of the batch oven, a clear jet behavior is onlyseen below the center inlet nozzle. Below the two adjacent nozzles the air flow is curvingtowards the outlet.
57

The additional disturbance created by the side-to-side or forward movement is not in-cluded in the simulations. Considering both the simulated air flow patterns and theproduct or air duct movement the air flow is considered a convective air flow, but not animpingement or jet dominated flow.
Compared to the laboratory oven the air flow in the pilot oven is highly adjustable. In thepilot oven the distribution between the top and bottom air ducts is adjustable as is thevelocity of the inlet air. The effect of varying the inlet air velocity is further investigatedin Chapter 6.4.
Further understanding and accuracy of the simulations will be obtained when an air flowmeasuring system is installed in the oven. Air velocity values presented in this work areeither based on estimates from Haas-Meincke A/S or measurements with an anemometerby the inlet nozzles. Installation of a pitot tube or similar system in the convective systemwill provide valuable information about the air flow, and provide more accurate estimatesof the inlet air velocity.
5.4 Product monitoring
During baking the product and its development may be followed on several levels. Theproduct weight is recorded continuously, the product temperature can be measured by theuse of external additional temperature sensors, and visual inspection is possible throughthe window in the side of the baking chamber and the baking chamber door.
In the following sections the possibilities available today by using these monitoring optionsare described and discussed.
5.4.1 Product weight
The baking tray and its support structure is placed on a scale, Signum Suprime level 1(Germany), with a capacity and precision of 35 kg ± 0.1 g. The relative high capacityof the scale is chosen so that it is possible to bake with different tray materials. Thiswill enable future projects investigating the effect of the baking tray material on bakeryproduct development. For example to study the difference between baking on a stonesurface contra ceramic coated stainless steel has been discussed as a possible area ofinterest.
During baking the air ducts are moved from side to side on a trolley inside the ovenchamber. The track for the trolley is not completely even and at the end-points, especiallyin one side, the trolley causes the baking tray to lift. Along with the effects from theconvection air system this creates noise on the product weight measurements. Figure 5.8shows measurements from a 8 min baking at medium air velocity. In Figure 5.8(a) allmeasuring points are included in Figure 5.8(b) only the measurements between 3.45 - 3.50
58

kg are shown (the weight measure is for 12 cookies and the baking tray).
(a) All measurements (b) Measurements between 3.45 - 3.50 kg
Figure 5.8: Weight measurements from the new batch oven (cf. this is one of the datasets show in Figure 8.3).
It is seen that it is possible to follow the loss during baking even with a few samples. Theinitial weight of 12 butter cookies is approximately 150 g. Although the steering of thetrolley needs further work, continuously obtained data is used in the presented modelingwork to validate and improve the mathematical model of the baking process (Chapters 8and 9).
5.4.2 Product temperature
Grooves are milled in the oven door frame to allow easy passage of sensor cords. In thepresented work the temperatures of butter cookies were logged through an additional com-puter due to the number of sensors needed. If only a few sensors are needed, it is possibleto use sockets attached to the control computer. The measurements are then included inthe same output file as the oven temperature, air humidity, and weight measurements.
In this work sensors have been used to measure temperatures in two cases; for estimationof heat transfer coefficients and for validation of the mathematical model.
5.4.3 Visual inspection
Through the window at the side of the baking chamber it is possible to follow the productvisually during baking. The window is installed to allow for fixed installations for videoor photography capturing equipment. The window is one layer glass which minimizesthe distortion in a picture. However, having only one layer of glass also results in a highsurface temperature, which should be considered when choosing and setting up a visualrecording system.
59

The experimental work have not yet included visual quality measurements during thebaking process. The task of setting up a suitable visual recording system, ensure correctlight, and doing the final image analysis was outside the scope of this PhD project.
5.5 Summary of oven design
The oven is considered a valuable tool for controlled experiments with flexible optionsfor following the product during baking. The design was made in collaboration betweenDTU and Haas-Meincke A/S with the scope of fulfilling the specifications listed in thebeginning of this chapter. Solutions for all the specifications were included in the initialdesign. Only the option to vary the heating mechanism between convection and radiationheating has yet to be implemented.
In contrast to other experimental pilot ovens the new oven is constructed to fulfill twospecific goals. It is possible to emulate continuous baking processes, and it is possible tofollow the product closely during baking. The option of continuous weight measurementhas only been found in two published studies describing pilot ovens (Lostie et al., 2002a;Sommier et al., 2005). In Lostie et al. (2002a) a scale is positioned above the bakingchamber and connected to wires holding the product inside the oven chamber. Thissolution has also been attempted at DTU in the old laboratory convection oven, however,with limited success, due to disturbances from the air movement. The solution selected inthe present work with the scale positioned outside the baking chamber, under the bakingtray, allows for moving air ducts and the necessary convection air flow. Some noise hasbeen unavoidable due to steering problems with the air duct trolley (cf. measurementsshown in Section 5.4.1, Figure 5.8(a)). Hopefully new wheels and better steering willimprove the accuracy of the weight measurements of bakery products during baking.
After the oven was assembled at DTU in the early spring of 2011 the validation processwas initiated. Validation of the oven’s ability to heat and bake evenly, to bake productssimilarly to a tunnel oven, and to vary the inlet air velocity is described in Chapter 6.
60

Chapter 6
Validation of the batch oven
The work described in this chapter is an elaboration of the last part of the manuscript "De-sign and Construction of a Batch Oven for Investigation of Industrial Continuous BakingProcesses" (Appendix D), accepted for publication in Journal of Food Process Engineering.Additional experimental work examining the impact of varying the inlet air velocity withinthe available range of the oven is presented. These results were presented at the 11th Con-ference of Food Engineering, Leesburg VA (USA), arranged by VirginiaTech, Tuesday the3rd of April 2012.
The initial validation of the batch oven focus on two main elements. The first elementis related to the batch oven itself, investigating its ability to heat and bake evenly acrossthe baking tray. The second element is a comparison study between the batch oven and aconvection tunnel oven. The validation work related to these two elements is presented inthis chapter along with the applied methods. The investigation of even heating and bak-ing was carried out by the author, and some of the experimental baking work consideringcomparison between the batch oven and a tunnel oven was carried out in collaborationwith two internship exchange students (Bram Schellekens and Harold Verhulst, HAS DenBosch).
6.1 Quality parameters for the validation experiments
The product quality parameters applied in the baking tests are product color and weightloss. These two quality parameters were chosen as they represent both the heat and themass transfer processes taking place during baking. The mass loss is further investigatedin the modeling section of this thesis. While the build-in scale is used in the later ex-perimental work for the modeling this was not possible in the validation studies. Off-lineweight measuring was used because of the lack of online weight measuring in the tunneloven. In the validation experiments the weight loss was found as the total loss consideringboth baking and cooling.
61

In the first two steps of the validation the color was evaluated both visually and by imageanalysis of the surface color. The visual evaluation system is based on comparison topictures of cookies representing a 6 step scale (1 - 6) showing increasing degrees of brown-ing (Figure 6.1). If a cookie was assessed between two categories it was systematicallyassigned the lowest value. Cookies which are ranked below 1 are not baked through. Cat-egories 1 through 5 indicates increasingly browning cookie surfaces. Cookies in category6 are starting to scorch, these are considered not-acceptable.
Figure 6.1: Standard grading of cookies, according to the degree of browning. Cookiesbaked less than group 1 are not considered baked through and cookies darker than group 6are considered burned.
The subjective categorization of the products is a fast and global evaluation method.Similarly to the objective image analysis method described in Section 4.3 the whole surfaceof the product is taken into account. In the initial phase of the validation work only thecategorization was applied for quality assessment of the browning, due to the methodbeing both fast and including the impression of the whole product surface. In the reviewprocess of the manuscript “Design and Construction of a Batch Oven for Investigation ofIndustrial Continuous Baking Processes” (Appendix D) an objective method was added.Fortunately pictures had been captured of some of the butter cookies in question alongwith a reference color matrix. Photographs of the cookies used for comparison of thebatch and the tunnel oven were available for image analysis.
For the objective photographic method the L∗-value in the CIE L∗a∗b∗ system was used.This measure for browning has been widely applied by other researchers (Baik, 2000;Ahrne et al., 2007; Zanoni et al., 1995; Purlis and Salvadori, 2009). Using Adobe Photo-shop Lightroom 4 and Picture Windows Pro v. 6.0.9, by Digital Light & Color, correctionswere made for the lightning and a blur was laid across the cookie surface. The averageL∗-value of 9 pixels was measured at 4 points at a distance of approximately 1/3 of theway from the edge to the center, and at the center. The image analysis was carried outby associate professor Jørgen Risum, DTU Food. The average of these 5 points gives ameasure for the surface lightness and the standard deviation a measure for the variationacross the surface for each cookie. The measurements were obtained in points acrossthe surface to try to incorporate the effect arising from uneven browning of the cookiesurfaces.
In the experimental work considering changes in the inlet velocity the surface lightness wasmeasured as the L∗-value with a CR-200 colorimeter, Minolta (Japan). The lightness wasmeasured as the average of three points on the surface of the cookies, the measurementspoints are shown in Figure 6.2. An average value is chosen to represent the whole surface
62

as the browning takes place from the edge towards the center.
Figure 6.2: Positions for lightness measurements.
6.2 Uniform heating and baking in the batch oven
The oven’s ability to heat and bake evenly was investigated in two steps:
1. Measurements of the local heat transfer coefficients across the baking tray.
2. The browning of cookies across the baking tray.
6.2.1 Estimating the heat transfer coefficient
The average heat transfer coefficient was used to examine the uniformity of the air flow andthereby the convective baking conditions across the baking tray. The heat transfer from afluid to a solid body is a function of the air velocity around the body, the thermo-physicalproperties of the air, and the geometry of the body (including the surface roughness).This relation is conventionally expressed through the dimensionless Nusselt’s number(Nu), the Reynold’s number (Re) and the Prandtl’s number (Pr). The Nusselt’s numbercan be seen as a dimensionless expression for the heat transfer coefficient. Expressionsfor the Nusselt’s number, the Reynold’s number, and the Prandtl’s number are given in(6.1)-(6.3).
Nu = hTDh
kf
(6.1)
Re = vDhρ
µ(6.2)
Pr = Cpµ
kf
(6.3)
63

where hT
[W
m2K
]is the heat transfer coefficient, Dh [m] the characteristic length of the
investigated body, kf
[W
mK
]the thermal conductivity of the fluid, v the air velocity
[ms
],
ρ, µ, and cp are the density[
kgm3
], viscosity [Pa · s] and heat capacity of the air
[J
kgK
],
respectively.
The general form of Nusselt’s relations for gas heating of an object by forced convectioncan be written as Nu = k(Re)n(Pr)m, where k, m, and m are empirically determinedconstants depending on the air flow properties. A relation for gas cross-flow around acylinder is given in (6.4) (Rathore and Kapuno, 2011). This relation shows how theNusselt’s number, and thereby the heat transfer coefficient, can be calculated from theReynold’s and Prandtl’s numbers.
Nu = 0.19Re0.6Pr0.3 (6.4)
Due to local turbulence in processes with complex air flow it is very difficult to estimate thelocal air velocity by the product accurately through experimental measurements (Carsonet al., 2006). Instead a lumped capacitance model can be used to calculate an averageheat transfer coefficient. This method does not directly measure the air velocity, insteadthe flow properties and the heat transfer coefficient are deduced from the experimentallyobtained temperature data. The method is described below.
The governing hypothesis in the lumped capacitance model is that the temperaturethrough a body with a Biot number (hT Dh
kp, kp is the thermal capacity of the product[
WmK
]) below 0.1 (preferably <0.01) is uniform. In this situation (6.5) can be used to
calculate the heat transfer coefficient (Carson et al., 2006; Mills, 1995; Nitin and Karwe,2001; Sakin et al., 2009).
hT = −ln(Ts − TTs − T0
)mcp
At(6.5)
where Ts is the temperature of the surroundings [K], T the product temperature [K], T0
the initial temperature [K], m the mass of the disc [kg], cp the specific heat capacity ofthe disc material
[J
kgK
], A the surface area [m2], and t the heating time [s].
For the cylindrical butter cookies used as experimental product the characteristic lengthis the diameter. The thermal conductivity is in the area of 0.2 W
mK(based on dough
composition (Choi and Okos, 1986)). The Biot number of the cookies will exceed 0.1when the heat transfer coefficient is higher than 0.44 W
m2K. This values is far below
values for still air, in which heat transfer coefficients in the range of 5-10 Wm2K
are usuallyreported (Singh and Heldman, 2009). The heat transfer coefficient in the investigatedprocess will be much higher than 0.44 W
m2K. Therefore a significant temperature gradient
will be present in the cookies during baking, and they cannot be used to estimate theheat transfer coefficient by use of the lumped capacitance model.
The thermal properties of an object does not influence the average heat transfer coefficient.Therefore a different material with a high thermal conductivity can be used to calculate
64

the average heat transfer coefficient. The substitute material in the following is aluminumwhich have proven a good material for heat transfer studies (Nitin and Karwe, 2001). Thethermal conductivity of aluminum is approximately 170 W
mK, thus the Biot number is below
0.01 as long as the heat transfer coefficient does not exceed 230 Wm2K
, and the conditionsfor (6.5) are fulfilled. To keep the conditions as similar as possible to the actual bakingprocess the standard baking tray was used without insulation or other modifications. Thebaking tray was cooled before the measurements in order to minimize excess heat transferfrom a pre-heated baking tray. The average heat transfer coefficient was measured at 24points across the baking tray.
With the intention of maintaining the dimensions of the original product for heat transferestimation small aluminum discs were made with a diameter of 45 mm and a height of6 mm. Unfortunately this geometry resulted in a too rapid heating. During the timeneeded for the oven to reach steady state the temperature of the cookie shaped aluminumincreased almost to that of the oven air. For the lumped capacity model to be valid theoven temperature must be constant. Therefore another solution had to be found.
Compromising on the total dimensions larger cylinders were produced, with a diameter of40 mm and a height of 60 mm. The larger cylinders did not reach the oven temperaturebefore a steady state air temperature was reached. The results were used to estimatethe overall heat transfer coefficients for the validation work, and applied in the followingmodeling work (Chapter 8). For a flow pattern which is roughly perpendicular to thecylinder, the characteristic length is the diameter of the cylinder. Because the character-istic lengths of the high cylinders (40 mm) and the cookies (45 mm) are approximately thesame, the estimated heat transfer coefficient was used in the modeling work. It is possiblethat the determination of the values could be improved with a closer geometric similarityor a different measuring method, possibly heat flux measurements on the baking tray orby simulation (e.g. computational fluid dynamics) of the air flow in the oven chamber.For the validation work the point of interest is the evenness of heating across the bakingtray, differences in the geometry of the investigated objects do not influence the validityof this work.
A linear regression of the logarithmic temperature difference against the time is used (seeFigure 6.3). The present oven needs time to adjust the temperature after the door hasbeen opened. Therefore the model should only be applied to the measurements obtainedwhen the oven is in steady state. For the data shown in Figure 6.3 this is the case at t ≥300 s.
The air velocity in the pilot oven is adjustable, as described in Chapter 6.4. It is knownthat the air velocity influences the heat transfer coefficient (Nitin and Karwe, 2001). Inorder to get an impression of the oven’s window of operation the heat transfer coefficientsover a range of air velocity settings were found.
Initially the batch oven settings were adjusted so that the center setting matched a 10 mtunnel oven used for other comparison experiments. The air velocity in the batch oven is
65

0 100 200 300 400 500 600 700−1.5
−1
−0.5
0
Time (s)
ln((
Ta−T
)/(T
a−T0))
Experimental dataLinear regression
Figure 6.3: Example of experimental results combined with the calculated linear regres-sion based on Equation (6.5) for t≥300 s.
adjustable on a stepless scale form 0 - 10. In the present experiment setting 5 was used asthe reference point to the tunnel oven. The average heat transfer coefficients were foundfor velocity settings 1, 3, 5, 7, and 9. Three measurements were carried out at each airvelocity. The found heat transfer coefficients are shown in Table 6.1 along with standarddeviations over the three repetitions. In the present work the value found at setting 5 isapplied in the simulation work.
The relation between velocity settings and volumetric flow is not known until a volumet-ric measuring system is installed in the oven (cf. Section 5.3). When this relation isestablished it will be possible to calculate a proper Nusselt’s relation based on these andadditional measurements.
Table 6.1: Heat transfer coefficients calculated for the batch oven at 5 different inlet airvelocity settings.
Velocity setting hT
(W
m2K
)SD
(W
m2K
)1 50 13 57 25 63 17 69 19 72 2
6.2.2 Baking experiments for uniform browning
Butter cookies were baked in 24 different position across the baking tray, after bakingthe uniformity of browning was evaluated as described in Section 6.1. The cookies wereprepared following the recipe given in Table 6.2. The positions of the cookies were the
66

same as those used to find the heat transfer coefficients.
Table 6.2: Composition and mixing procedure for 1.7 kg cookie dough.
Ingredients Mass (g)Icing sugar 333Margarine 500Vanilla extract 3.3
Mix until even textureWhole egg 33.3Skimmed milk powder 12.5Salt 3.3Sodium bicarbonate 0.4Water 8.3
Mix until even textureCorn starch 167Wheat cake flour 667Mix until an even textured dough is obtained
Finish by gathering the dough by handTotal weight 1728
The oven settings for both the investigation of even heating and the browning experimentswere: Equal top:bottom inlet air distribution, with dampers opened to 50%, air temper-ature at 170◦C, and for the baking experiments a baking time of 8 min. After baking thebrowning was evaluated based on the 6 step scale only. The distance from the upper inletnozzles to the product was set to 15.4 cm, and the distance from the lower inlet nozzles tothe baking tray was 8.2 cm. The distances from the inlets to the baking tray were chosenbased on the distances in the tunnel oven used for the comparison experiments.
6.2.3 Results for heating and baking uniformity
The average heat transfer coefficient measured with the lumped capacity method from the24 measuring points across the baking tray was 62 W
m2Kwith a relative standard deviation
of 4.5%. An overview of the values as they are distributed across the baking tray is shownin Figure 6.4(a). The total variation is small and indicates uniform heating across thebaking tray; no systematic variations were seen over the measured area.
Cookies baked in the same positions and under the same conditions as used for the heattransfer coefficient measurements are shown in Figure 6.4(b). The investigated cookieswere ranked in category 2. The category based results are thereby in agreement with theheat transfer coefficient measurements. It is found that the small variations measured forthe heat transfer coefficients do not reflect in the browning of cookies across the bakingtray.
67

(a) Heat transfer coefficient values (b) Butter cookies from the batchoven
Figure 6.4: (a) The measured heat transfer coefficients (W/(m2K)). The orientation inthe oven is given as “front/back”, “left/right” and the positions of the window and thedoor are indicated. (b) Cookies baked in the batch oven at the same positions as the heattransfer coefficients are measured.
6.3 Comparison between batch and tunnel ovens
When similar settings are used in the batch oven and a tunnel oven, comparable productqualities must be obtained. Butter cookies, prepared as described in Section 6.2.2 wereused for the comparison experiments. The oven parameters used as set-points were: Thetemperature by the band or baking tray, the inlet air velocity, the distribution betweentop:bottom inlet air, the air duct to band distances, and the baking time. Browning andthe total weight loss were used as product quality parameters and measured as describedin Section 6.1.
The robustness of the reproducibility was tested by changing one of the processing pa-rameters, the air temperature. The investigated temperatures were 160◦C, 170◦C , 190◦C,and 200◦C.
A 10 m indirectly fired convection tunnel oven was used as reference oven. The two zonesof the oven were set at the same temperature and inlet air distribution in all the reportedbaking experiments. It was possible to measure the temperature just above the bakingband during processing. This was done through a hatch halfway down the length of theoven. Measuring the air velocity was more complicated. It was not possible to reach asufficient number of inlet nozzles through the hatch, therefore two maintenance panelsneeded to be removed to gain sufficient access and the measurements were carried out atroom temperature. The change in temperature will only affects the flow pattern slightly(Marcroft et al., 1999). Accordingly, the velocity adjustments in the batch oven were doneat room temperature.
When the air enters the baking chamber through the inlet nozzles the air flow pattern be-
68

comes diffuse and does not follow a fully developed flow pattern. Two types of anemometersensors were tested in the pre-experimental work, a rotating vane and a pitot tube con-nected to a Testo 400 logging unit, Testo AG, Germany. To focus the inlet air stream aplastic tube was used to frame the inlet hole during measurements. While the distancebetween the band and the inlet nozzles did not allow for the flow to be fully developed,it increased the accuracy of the velocity measurements.
While good reproducibility was seen between the different nozzles and repetitions at thesame nozzle (see Section 6.3.1), there was a clear difference between the results from thetwo sensors. The measurements with the vane probe only showed an average inlet velocityaround 2 m
swhile the pitot tube showed an average inlet velocity of approximately 7.5
ms. According to Haas-Meincke the inlet air velocity is approximately 12 m
s, as stated in
Section 5.2.2. Therefore the pitot tube with the plastic tube was chosen as the velocitymeasurement system for the comparison work. For the comparison the average inletvelocities were measured in 16 nozzles both in the batch oven (1 repetition) and in thetunnel oven (2 repetition). Each measurement is found as the average value obtained over10 seconds with a sample rate of 1 s−1.
6.3.1 Results of comparative experiments
The air velocities measured in the tunnel oven are shown in Table 6.3 along with thebest match obtained in the batch oven. A two-side student’s t-test showed no significantdifference between the mean values for either top or bottom air ducts (p = 0.12).
Table 6.3: The air velocities (m/s) with ovens set to a 50:50 distribution between topand bottom inlet air ducts, standard deviations are given after the average values. Numberof measurements: n = 32 in the tunnel oven and n = 16 in the batch oven.
Tunnel oven (m/s) Batch oven (m/s)Inlet area Average Average
Top 7.1 (0.7) 6.8 (0.2)Bottom 7.8 (0.5) 8.0 (0.2)
Based on the used quality parameters good reproducibility was seen (Tables 6.4 and 6.5,rows for T = 170◦C). Even with the evident differences between a batch and a tunneloven, the baking process is reproducible in the new oven.
The average measured L∗-values on cookies from the tunnel oven was 65 (standard de-viation 3.2), and the average value in the batch oven 69 (standard deviation 2.8). Onlypictures of 5 or 6 cookies were possible to use for the objective analysis from each oven,therefore further statistical analysis is not performed. For the visual analysis all cookieswere evaluated as belonging in the second of the six browning categories (Figure 6.1).
The average water loss was found as the total mass loss per cookie due to slight variationsin the cookie height (± 0.5 mm). 5 cookies were measured for the tunnel oven, 6 for the
69

batch oven (Tables 6.4 and 6.5), the average values were found to be 1.2 g/cookie in thetunnel oven and 1.3 g/cookie in the batch oven.
Comparison when varying the oven settings
Using the air speed, inlet air distribution and baking time of 8 min from the previousexperiments the effects of changing the temperature on the product quality was testedboth in the batch oven and the tunnel oven. The additionally tested temperatures were:160◦C, 190◦C and 200◦C. The product and quality parameters were the same as in theinitial experiments. The color ranking and the L∗-values are shown in Table 6.4, andthe weight loss data in Table 6.5, both including the results from the initial comparisonexperiments.
Table 6.4: Data for validation experiment, comparing the batch oven with the tunneloven, standard deviations are shown after average values. The color categories are shownfor all cookies. n = 5 cookies for the tunnel oven or and n = 6 cookies for the batch oven.
Color evaluation Lightnesscategories (average L∗ values)
Temperature (◦C) Tunnel Batch Tunnel Batch160 1, 1, 1, 1, 1 2, 1, 2, 1, 1, 1 65 (5.2) 72 (1.5)170∗ 2, 2, 2, 2, 2 2, 2, 2, 2, 2, 2 65 (3.2) 69 (2.8)190 4, 4, 4, 4, 4 4, 4, 4, 4, 3, 4 54 (4.2) 53 (5.7)∗∗
200 5, 5, 5, 5, 5 5, 5, 5, 5, 6, 5 41 (5.7) 45 (4.6)∗Results from the initial comparison experiments. ∗∗ Only 5 of the 6 cookies were available for thismeasurement.
Table 6.5: The weight loss for each cookie (g/cookie) is shown followed by the averagevalue.
Weight loss (g/cookie)Temperature (y) Tunnel Batch
160 1.2, 1.2, 1.2, 1.1, 1.1 (1.2) 1.2, 1.2, 1.2, 1.2, 1.2, 1.2 (1.2)170* 1.2, 1.2, 1.2, 1.3, 1.2 (1.2) 1.3, 1.3, 1.3, 1.2, 1.2, 1.3 (1.3)190 1.4, 1.4, 1.4, 1.4, 1.3 (1.4) 1.3, 1.5, 1.5, 1.4, 1.3, 1.4 (1.4)200 1.5, 1.5, 1.5, 1.5, 1.5 (1.5) 1.3, 1.5, 1.2, 1.6, 1.5, 1.5 (1.4)
*Results from the initial comparison experiments.
Considering the L∗-values the cookies baked in the batch oven appear slightly lighterthan those from the tunnel oven. The ranking indicates that the overall impression ofthe cookies was the opposite. This small contradiction might be a result of the L∗-value measuring points, not including the outer rims of the cookies which will brownfirst. This hypothesis will also explain why cookies baked in the tunnel oven at 160◦Cwere all evaluated as category 1 cookies and all baked at 170 ◦C as group 2, despite the
70

similar average L∗ values. The weight loss data (Table 6.5) show little differences betweenthe treatments. For both ovens a clear trend of increasing weight loss with increasingtemperatures is observed.
The overall quality changes when varying the air temperature were similar in the twoovens. However, the quality parameters further indicate that work is needed to enhancethe uniformity of baking across the baking tray in the batch oven at higher temperatures.The small contradictions between L∗-values and browning categories call for a betterevaluation method of the global browning impression of cookies, possibly an integrationof L∗-values at the upper surface could be used. It would be interesting to apply theVideometerLab method described in Section 4.3 to obtain overall browning scores for thecookie surfaces.
6.4 Influence of inlet air velocity on butter cookiesquality
The study presented in this section is a description of the first work utilizing the abilityof the batch oven to work outside normal process settings. In the previous sections it isdescribed how the temperature is varied and the results are compared to those obtained ina tunnel oven. In this section the inlet air velocity is the variable parameter. Due to thedesign of a traditional tunnel oven with only one air velocity setting, the results obtainedin this work cannot be validated against the available tunnel oven. The measurable effectwhen changing between five inlet air velocity settings are investigated. The center settingwas adjusted to match the tunnel oven, as described in Chapter 6. The scope of thispart of the validation work was to ensure that the option to vary the inlet air velocity issufficiently pronounced to result in a measurable variation in product quality.
6.4.1 Experimental work
Butter cookies, as described in Section 6.2.2 were used in the experimental work. Afterbaking the lightness was measured in three positions on the cookie surface using a CR-200colorimeter, Minolta (Japan). The weight loss was measured after baking with a LE6202sscale (resolution of 0.01 g), Sartorius (Germany). The weight loss is presented as the finalmass fraction, found by dividing the final product weight with the initial weight. Twoexperimental series were carried out:
1. Cookies were baked at five different air velocity settings (1, 3, 5, 7, 9), all for 8 minat 180◦C. Three batches of six cookies were baked at each setting.
2. Cookies were baked at three different air velocity settings (3, 5, 7) at different bakingtimes (2 - 14 min with 2 min intervals), all at 180 ◦C. One batch of six cookies wasbaked at each combination of baking time and inlet air setting.
71

The first series of experiments was used to investigate the quality influence of the inletair velocity at a constant, reasonable baking time. The purpose of the second series wasto investigate the influence of the inlet air flow on the progress of the baking process.
Due to the complex flow pattern (Section 6.3) and the available measurement methodsthe air velocity was not quantitatively measured in this study.
6.4.2 Results and discussion
Constant baking time
The final mass fraction and the lightness as L∗-values after 8 min of baking at different inletair settings are shown in Tables 6.6 and 6.7 along with the relative standard deviation1.18 measurements were obtained at each inlet air velocity. The results were evaluatedthrough a one-way ANOVA test. The mass fraction data and average L∗-values for the 18measurements are shown in Appendix I along with the ANOVA test schemes. Significantdifference on a 95% level was found between the inlet air setting groups for both qualityaspects.
Table 6.6: The final mass fractions for the first series of experiments are shown withstandard deviation and the relative error. All cookies were baked for 8 min. n=18 at eachinlet air setting.
Velocity setting Final mass fraction Relative standard deviation (%)1 0.8729 1.93 0.8672 1.55 0.8658 3.47 0.8627 1.49 0.8610 1.5
Table 6.7: The average lightness as L∗ for the first series of experiments are shown withthe standard deviation and the relative error. All cookies were baked for 8 min. n=18 ateach inlet air setting.
Velocity setting Lightness (L∗) Relative standard deviation (%)1 79 0.73 77 1.35 76 1.77 75 1.79 73 2.3
When increasing the air velocity a systematic increase in evaporation was seen after 8 minof baking. The total dry matter content in the cookies was measured to approximately86%, showing that the cookies are almost entirely dried after the 8 min baking time at the
1Relative standard deviation = standard deviation / measured average · 100 %
72

highest air velocity. The browning, estimated by lightness measurements, shows a similardevelopment. When increasing the air velocity the lightness is decreasing. It is seen thatat a fixed baking time the oven is capable of producing air flow conditions resulting insignificantly different products.
Varying velocity and baking time
The results from the second series of experiments are shown graphically in Figure 6.5.The lightness could not be measured after a baking time of only 2 min. At this shortbaking time, the cookies are completely soft, and few maintained a cookie shape witheven measurable surfaces when transferred from the oven to the scale.
Introductory experiments and literature studies show that the lightness of cookies willincrease during the development phase (Broyart et al., 1998). When the drying is initiatedthe lightness begins to decrease. Figure 6.5(a) show that a threshold must be crossedbefore the browning process starts. From the results this point is found between 6 and 8min of baking for the investigated processes.
Following the experiments with constant baking time, it was not surprising that the high-est air velocity resulted in the fastest browning and product drying. The measurementsshow that systematic differences are seen through the main part of the baking processes.When the baking time approaches 14 min the differences are decreasing. The final massfraction is almost the same for all three groups of products.
The mass flux, calculated as the difference in evaporated water between two measuringpoints ((gwater/ginitialweight) · s−1), is shown in Figure 6.5(c). The initial evaporation rateis highest at the highest air velocity. After the peak rates around 200 s the evaporationrate decreases fastest for the highest air velocity. After 480 s of baking the evaporationrates decrease to similar values for all three air settings. This indicates that evaporationof the free water is completed and the slower drying of harder bound water is initiated.
It is seen that the water evaporates freely in the beginning of the baking process, whereafter the evaporation rates decrease as the surface dries out and stronger bound water isevaporated by diffusion drying. The evaporation was seen to follow the air velocity. Witha high air velocity the initial evaporation rate is fast. This results in a fast drying of theproduct surface, followed by a slower evaporation rate as the stronger bound water beginsto evaporate. Over-all this pattern was as expected, and it is a success criterion for theversatility of the batch oven, that it is possible to obtain this pattern.
6.5 Summary of validation
The experimental results show that the new batch oven is promising for research in varyingprocess conditions. Considering the inlet air velocity and the heat transfer coefficient
73

(a) Average surface lightness
(b) Average mass fractions
(c) Change in mass loss
Figure 6.5: (a) Average cookie lightness as a function of baking time at three differentinlet air velocities. (b) Average cookie mass loss (calculated as the mass fraction) as afunction of baking time at three different inlet air velocities. (c) The change in mass lossas a function of time (∆m(g/g)/∆t).
74

measurements, low variation was seen across the baking area. An improved estimate ofeither the inlet air velocity or the velocity near the product should be further investigated.The variation in the heat transfer coefficients across the baking tray is small and random.
Comparison experiments show that it is possible to bake butter cookies of comparablequality in the batch oven and a tunnel oven. In the future more repetitions could bebeneficial to improve this validation process. Also more than one product group shouldbe examined.
The final validation step was an experimental investigation of the ability of the oven tocreate significantly different baking conditions through the build-in options for processvariation. Besides the basic ability to vary air temperature the option of varying theinlet air velocity is the most prominent feature in the oven. Therefore this was chosen forthe first validation experiments. The experimental work showed significant dependencybetween changes in the inlet air flow setting and the mass loss and surface browning. Theprogress of both browning and drying was found to differ when the inlet air settings werevaried.
The oven shows promising potential in regard to investigating baking processes out-sidethe normal range of tunnel ovens. Additional features are available and will increase theprospects of the oven in the future.
75

76

Chapter 7
Mathematical-physical models andmodel parameters
The work described in Chapters 7,8, and 9 is an elaboration of the work presented inthe manuscript "Investigation of uneven mass transfer in butter cookies combining exper-imental work and finite element modeling" (Appendix F), submitted for publication in theInternational Journal of Food Engineering, June 2013.
7.1 Heat and mass transfer
One goal of the new batch oven is to help in the development of mathematical modelsdescribing the relations between baking process conditions and baking product quality.The scope is to use experimental data from the batch oven to predict the outcome in fullscale industrial tunnel ovens.
This and the following chapters focus on formulating and solving mathematical modelsto calculate the heat and mass transfer in bakery products during baking. The resultsobtained from the models are compared to and optimized against experimental data fromthe new batch oven.
In the present work the focus is on biscuit baking, specifically on a butter cookie product.The main focus for modeling of bakery products has traditionally been on leavened breadproducts, but relevant work is also reported considering biscuit products. A general reviewof modeling work, covering different bakery products, is presented in Section 2.3. Someexamples of modeling work focusing on heat and mass transfer in continuous baking ofbiscuits, focusing on the oven conditions are presented by Savoye et al. (1992) and Broyartand Trystram (2002). Studies of the governing mechanisms and properties related to masstransfer in biscuit products is presented by Demirkol et al. (2006b) and McFarlane (2006).
77

Some of the background knowledge and model parameter comparison is obtained in re-lation to studies of bread baking and roasting or frying of meat. The latter due to thesimilar physical process, geometry, and basic physical mechanisms.
7.1.1 Heat transfer
Energy transfer from the surroundings to the product and from the surface to the insideof the product are the two main aspects of energy movement in the baking of biscuits.The heating of the product causes physio-chemical changes in the dough and dries theproduct by evaporation of water.
The heat transfer through the product is described as conduction, following Fourier’slaw. The temperature difference between the heated surface and the colder center isconsidered as the driving force for energy transport through the system. This descriptionfor heat transfer is generally used in modeling of thermal treatment of food products(Purlis, 2010; Wählby, 2002; Demirkol et al., 2006b; Mondal and Datta, 2008; Sablaniet al., 1998; Sakin-Yilmazer et al., 2012; Thorvaldsson and Janestad, 1999; Chen, 1999;Feyissa et al., 2011).
The geometry of the cookie product is considered a finite cylinder. Thus the Fourierequation for a two dimensional cylindrical coordinate system is used to describe the energytransfer inside the biscuits as shown in (7.1) (Bird et al., 2002).
ρcp∂T
∂t= kT
(1r
∂
∂r
(r∂T
∂r
)+ ∂2T
∂z2
)(7.1)
where ρ is the density of the product[
kgm3
], cp the specific heat capacity
[J
kgK
], T the
temperature [K], t the time [s], kT the thermal conductivity[
WmK
], r the radial direction
[m], z the axial direction [m]. The nomenclature is also given in Table 7.1 for the equationsand boundary conditions.
The initial conditions are as follows in (7.2), specifying that the temperature throughoutthe product is uniform when baking is initiated.
T (r, z)|t=0 = T0 (7.2)
While the internal heat transfer may be generally described as heat conduction, the energytransfer from the surroundings to the product depends on the process conditions. Heattransfer from the surroundings to the product is generally described by one or more ofthe following: conduction, radiation, and convection.
Conduction is the dominating source of energy transfer in the case of contact baking(Feyissa et al., 2011; Sterner et al., 2002) where the energy is transferred to the productby direct contact between surfaces. Radiation is the transfer of energy from one surface
78

to another with no direct contact and no carrying medium besides the electromagneticradiation. Radiative heating depends on the temperature and color of both surfaces. Inbaking processes typical simplifications are to assume that the oven walls emit black bodyradiation and the emissivity of the product has a constant value; for example 0.9 for breadproducts (Purlis, 2010; Thorvaldsson and Janestad, 1999). Convection heating is heattransfer by a moving medium such as air or water, and is either free or forced in nature. Inthe case of “pure” radiation heating, changes in the air density will result in air movementcreating an added heat transfer by free convection. Free convection results in a heattransfer coefficient in the range of 5 - 25 ( W
m2K) depending on the specific process (Singh
and Heldman, 2009). Increasing the air speed by the use of fans or ventilation systemsresults in forced convection. Due to the increased air velocity forced convection will leadto higher heat transfer coefficients compared to free convection (cf. Nusselt’s relations inSection 6.2.1). The heat transfer coefficient for forced convection is approximately in therange of 10 - 200 ( W
m2K) for food production processes (Singh and Heldman, 2009).
The investigated baking process is based on indirectly fired convection tunnel ovens. Inthis oven the hot air enters the oven chamber above and below the baking band andcreates a forced convection environment. The oven type is further described in Section2.1.
Besides forced convection heating, some degree of radiation and conduction heat transferwill take place in the oven. However, in the present modeling work the contribution fromradiation or conduction is not included. Future measurements of the relation betweenheat flux from radiation and convection heating should be considered, for example usinga data logger system such as Scorpion R©, Reading Thermal, United Kingdom 1 which isavailable with assistance from Haas-Meincke A/S.
Water evaporates during baking. The energy consumption for evaporation is included inthe present model through the equations describing the boundary conditions. The energyavailable for product heating is the total energy transferred to the product minus theenergy needed for water evaporation. Different ways to include the evaporation in themodel are discussed in Section 2.3. In this work the evaporation is solely included at thesurface boundaries and not in the diffusion equation (Chen, 1999; Ferrari et al., 2012;Feyissa, 2011; Mondal and Datta, 2010; Olszewski, 2006; Purlis, 2012). The boundaryconditions are given in (7.3).
kT∂T
∂n
∣∣∣∣∣surface
=
hT (Ta − T ) , T < Tvap,w
hT (Ta − T ) +∆HvapρD∂xw
∂n
∣∣∣surface
, T ≥ Tvap,w(7.3)
where n is the direction normal to the surface [m], hT the heat transfer coefficient[
Wm2K
],
Ta the air temperature [K], Tvap,w the initiation temperature for water evaporation [K],∆Hvap the enthalpy of evaporation for water
[J
kgwater
], ρ density of the product
[kgm3
], D
the diffusion coefficient[
m2
s
], xw the water content
[kgwater
kgproduct
].
1http://www.readingthermal.com/scorp-data.html
79

In related studies the density of the water or an unspecified density is included in theevaporation term (Mondal and Datta, 2008; Thorvaldsson and Janestad, 1999). In thepresent study the density of the product is used ensuring correct units and dimensions.
The left-hand side accounts for the energy being transported into the bakery product. Theterms on the right-hand side is the heat transfer to the product by convection and thenthe energy needed to evaporate water. The latter is found by applying the mass transfermechanism of diffusion, as described in Section 7.1.2. It is important to notice thatthe applied heat and the mass transfer boundary conditions are not directly codependent.The temperature boundary conditions depend on results from the mass transfer equations,while the opposite is not the case. The limiting factor for the mass transfer boundarycondition is a fixed, predefined temperature. When this temperature is exceeded theevaporation term is included, and evaporation is set to a constant rate. The constant rateis an average of the total mass loss during baking calculated from, and optimized against,experimental data. This is further described in Section 7.2.2 (cf. (7.12) and (7.13)).
In the presented model the energy transfer through the product is assumed to take placeby conduction. For a dense material this is generally an adequate description of theenergy transport. It should be noted that the investigated cookies are increasingly porousproducts. While the porosity is not included as a factor in the following modeling ofthe heat and mass transfer it will influence the experimental data. Two main effectsmight be seen from the porosity in relation to the energy transfer. In the first phase ofbaking air bubbles incorporated in the cookie dough may result in a lower actual thermalconductivity than the theoretically calculated value. When the temperature is sufficientlyhigh for water to evaporate, larger bubbles are formed in the product. In these bubblesWatts principle will increase the heat transfer (Thorvaldsson and Skjoldebrand, 1998). Inthe final stages of baking the water may evaporate faster than anticipated from the modeldue to evaporation inside the product and rapid diffusion through the continuous porousnetwork of the cookie.
7.1.2 Mass transfer
In biscuit products mass transfer will take place both through the product and from thesurface to the surroundings in form of evaporation during baking. The main product beingtransferred is water, either as liquid water or water vapor. Additionally a small amountof CO2 will be formed from the NaHCO3. While this will result in some expansion and asmall contribution to the overall mass transfer it is not included in this study.
In larger bread products, where the final product consists of a soft crumb center and hardouter crust, water transport has been observed both towards the product center and awayfrom the product by evaporation (Thorvaldsson and Skjoldebrand, 1998). The transfertowards the center is a result of the temperature difference between the heated outersurface and the colder interior of the product. The inwards transport is due to Watt’sprinciple and the evaporation due to surface heating (Thorvaldsson and Skjoldebrand,
80

1998; Hadiyanto et al., 2007).
Thin biscuit products are comparable to bread crust for the purpose of heat and masstransfer. During baking of biscuits there is some resemblance to the development inbread products. The mechanisms include moisture transport towards the center, followedby formation of a continuous network. However the variation through the product isestimated to be much smaller in biscuit products compared to bread products, and withthe available measuring equipment it has only been possible to measure the overall watercontent in the investigated products.
The water transport is modeled as a diffusion process. Similarly to other studies of biscuitproducts the model is simplified by combining the water transport into an average masstransfer, combining the transport of liquid water and water vapor (Broyart and Trystram,2002; Demirkol et al., 2006b; Ferrari et al., 2012). The diffusion and the mass transfercoefficients are therefore considered apparent values. These are based on the total masstransfer and should not be linked solely to either liquid water or water vapor transport.However, considering the porous structure of the final product the values for the apparentcoefficients are expected to be closest to values for vapor transfer.
Based on the concentration gradient created by the evaporation at the surface the moistureconcentration through the product is determined by diffusion and a concentration gradientfollowing Fick’s second law (Bird et al., 2002). For mass transfer in the height and radialdirections the equation for diffusion is given in (7.4).
∂xw
∂t= D
(1r
∂
∂r
(r∂xw
∂r
)+ ∂2xw
∂z2
)(7.4)
With the initial conditions given in (7.5).
xw(r, z)|t=0 = xw0 (7.5)
where xw0 is the initial water content[
kgwater
kgproduct
].
The boundary conditions at the surfaces describe the evaporation process. While a smalldegree of evaporation will take place from the initiation of baking, due to the high tem-perature and low relative humidity in the oven, the main evaporation begins when thesurface reaches a temperature close to 100◦C. A more precise temperature is determinedfrom experimental work, measuring a combination of temperature and mass loss duringbaking. In the present work the temperature at which a plateau in the temperatureincrease is found, is used as the evaporation initiation temperature.
Following there are two possible situations for the mass transfer as described by thismodel, either no evaporation from the surface or evaporation depending on the surfacemoisture concentration gradient, and a constant mass transfer coefficient (7.6).
81

D∂xw
∂n={
0, T < Tvap,w
kc (xw,a − xw) , T ≥ Tvap,w(7.6)
where kc the average mass transfer coefficient[
ms
], xw,a is the water fraction in the air[
kgwater
kgair
], and Tvap,w the initiation temperature for water evaporation [K].
The use of a constant mass transfer coefficient is discussed in Demirkol et al. (2006b)along with a water content dependent mass transfer coefficient. An average mass transfercoefficient is found as the integrated mass loss over the baking time divided with the totalbaking time (Demirkol et al., 2006b) (cf. Section 7.2.2). As the mass loss is not linearthrough the baking process changes in baking time will change the average mass transfercoefficient. In the present work a constant average mass transfer coefficient is applied inorder to simplify the model. The initial mass transfer coefficient is calculated from thetotal evaporation in a 14 min baking process, based on (7.13) (Demirkol et al., 2006b).The experimental work and calculations are described in Section 7.2.2.
7.2 Parameters for the simulations
Before the presented model can be solved a number of parameters are required. In thefollowing the parameters are divided into three groups. The first group (Section 7.2.1)includes the parameters related to the product’s physical properties. Besides the productcomposition these are density, specific heat capacity, and the thermal conductivity. Thesecond group (Section 7.2.2) concerns the evaporation of water. This groups includesthe diffusion and mass transfer coefficients. The mass transfer coefficient is dependenton both the product composition and the process conditions. In this work it is foundas an average value from experimental work, this is described in more details in Section7.2.2. The third group (Section 7.2.3) are parameters describing the process. This groupprimarily includes the oven temperature and the heat transfer coefficient.
During baking the temperature and the water content change affecting the product proper-ties. The applied models for the three groups of parameters are described in the following.
7.2.1 Product properties
Initially the cookie dough is compact and semi-solid. During baking the dough is trans-formed to a porous brittle structure. It is evident that the real physical properties of thefinal product will differ from the properties of the dough, and change depending on thewater content, the temperature, and structure of the solid product matrix. The estimatedphysical properties are changing according to the water content of the cookies. They arecalculated using the equations described in the following. Changes in porosity and volumeare not included in the present model.
82

Table 7.1: Symbols and subscripts used in the heat and mass transfer equations. Whererelevant the origin of the value is indicated.
Symbol Description Unit OriginT Temperature K Measured or calculatedx Mass fraction kg
kgMeasured or calculated
t Time sr Radial distance[0;R] mz Height distance mn Direction normal to the surface m
Thermal propertiesρ Density kg
m3 Measuredcp Specific heat capacity J
kgKCalculated (Choi and Okos, 1986)
kT Thermal conductivity WmK
Calculated (Choi and Okos, 1986)hT Heat transfer coefficient W
m2KCalculated (Choi and Okos, 1986)
Mass transfer propertieskc Mass transfer coefficient m
s(Demirkol et al., 2006b) and calculations
D Diffusion coefficient m2
s(Demirkol et al., 2006b) and calculations
∆Hvap Enthalpy of evaporation (water) Jkg
(Chen, 1999)
Subscripts0 Initial valuea Airvap Evaporationw Water
When solving the model the volume of the product is kept constant. Measurements onimages in Section 4.3 showed an average diameter of approximately 4.7 cm. The deviationin radius is thus small, less than 5%.
In the following the applied values and equations for the product properties are described.In equations based on the composition of the product the word "component" refers toconstituents such as protein, carbohydrates, fat, water, and ash.
The densityThe density is calculated as the time dependent product weight divided by the initialproduct volume. It is assumed that the volume remains constant throughout the bakingprocess. In preliminary investigations the density equation given by Choi and Okos (1986)was applied. However, it was found that this method did not yield a realistic prediction of
83

the actual change in the product density. This is likely because the method suggested byChoi and Okos is purely related to the composition of the product, and does not includethe increasing porosity of the cookie as water evaporates while the volume is increasingor unchanged. For this reason the approach was changed to a more direct method: Theinitial dough density was found from the average weight of 90 cookies, this weight wasdivided by the initial volume of the cookies (diameter = 45 mm, height = 6 mm). In thesimulations the time dependent density is found as the initial weight minus the evaporatedwater divided by the volume. The resulting equation is given in (7.7).
ρcookie = mdough −mw,evap
V(7.7)
where m is the initial dough-cookie weight, V the volume, mm,evap the mass of evaporatedwater.
The average dough density was 1299 kg/m3 and the initial water content 1.74 g/cookie,determined by dry matter measurements on the cookie dough.
The specific heat capacityFollowing the work presented by Choi and Okos (1986) the specific heat capacity may becalculated from (7.8) as a function of the water concentration.
cp =∑
xwi cp,i (7.8)
where the xwi is the mass fraction of the ith component and cp,i is the specific heat capacity
of the ith component. Based on the cookie dough composition (7.9) was applied as avariable in the simulation work, xw is the water mass fraction in the cookie. The “i’th”components are generally protein, fat, carbohydrate, water, and ash. Inserting all butthe water content in (7.8) the following expression for cp is obtained, (7.9), for the buttercookies.
cp = 1.5 kJ
kgK+ xw · 4.2
kJ
kgK(7.9)
The thermal conductivityBased on the product composition and the equations presented by Choi and Okos (1986)the thermal conductivity is calculated from (7.10).
kT =∑
xVi ki (7.10)
xVi is the volume fraction and ki the thermal conductivity of the ith component. Values
based on the dough composition, maintaining a constant cookie volume (7.11), are ob-tained for the investigated product. These are used in the simulations to calculate kT asa function of water concentration. In (7.11) the applied expression for kT is shown.
84

kT = 0.21 W
mK+ 0.62 W
mK· xw
6.69 · 10−4 · ρw + xw
(7.11)
where ρw is the density of water.
7.2.2 Water transport and evaporation
The governing parameters for water transport is the diffusion and mass transfer coeffi-cients. Water transport and evaporation dependent on a number of product and processconditions. For example the surface temperature, the relative air humidity, the air ve-locity at the product, the product porosity, and moisture concentration in the product.Considering (7.6) not all of these factors are included. Instead the diffusion and masstransfer coefficients represent some of these aspects of the process. Initial values are es-timated for the two coefficients. To incorporate the many aspects of the coefficients theinitial estimates are optimized to obtain apparent coefficients. This is further describedin Section 7.2.2.
The diffusion coefficientIn the present work an average apparent diffusion coefficient is applied. A time-dependentdiffusion coefficient would increase over time even if the porosity is not explicitly includedin the model. In the present model there will be a risk of the diffusion coefficient over-estimating the diffusion in the beginning of the baking process.
Water on liquid and gaseous form is transported through the product during baking. Forbread products it has been shown that water is both transported towards the center due tothe temperature gradient and towards the outer surface due to the concentration gradientarising from evaporation (Hadiyanto et al., 2007; Thorvaldsson and Skjoldebrand, 1998).While different mechanisms are responsible for these opposite transport phenomena, andthe liquid and gaseous water is transported at different rates, an average apparent diffusioncoefficient is applied in the present work.
The initial guess for a value of D is 3.6·10−8 m2
s, which is an empirically found diffu-
sion coefficient obtained for biscuits baked at 190◦C with forced convection (Demirkolet al., 2006b). Other works divide the diffusion coefficient between the transport of liquidwater and water vapor. For example for bread products (Thorvaldsson and Janestad,1999) reports the following values Dliquid water = 1.35 · 10−10 m2
sand Dvapor = 8 · 10−7 m2
s.
For biscuit baking the diffusion coefficient for liquid water does not appear to change,while the diffusion coefficient for water vapor strongly increases (Hadiyanto et al., 2007):Dliquid water = 1.1 · 10−10 m2
sand Dvapor = 2.10 · 10−5 m2
s. Generally liquid water diffusion
through the solid matrix is slow, while the transport of water vapor through the openstructure is considerably faster.
85

The mass transfer coefficientBased on the work presented in (Demirkol et al., 2006b) an initial kc value was found,from the equation given in (7.12).
kc(t) = −VA
dY (t)dt
1Y0
(7.12)
where Y0 and Y (t) are the initial and time dependent water concentrations (on dry matterbasis, (kgwater/kgdry matter)). According to (7.12) kc can be calculated from the mass lossduring baking, the geometry of the product, and the initial water content (on dry matterbasis) in the cookie (Demirkol et al., 2006b; Markowski, 1997). In the present work anaverage kc value for the baking process was calculated from (7.13).
kc,av =∫ t
0 kc(t)dtt
(7.13)
The water concentration was found to decrease exponentially following (7.14) when theoven settings were set to mimic the conditions in a 10 m tunnel oven (cf. Chapter 6). Theexperimental results and graph for the exponential regression are shown in Figure 7.1.
Y (t)exp = 0.1628e−3.8·10−3·t (7.14)
From (7.13) and (7.14) kc,av for a 14 min baking period was 2.7·10−6 m/s. Similar tothe diffusion coefficient this literature based value was used as an initial guess in thesimulation work, where optimized values are estimated from comparison to experimentaldata.
Figure 7.1: • Experimental measuring points. − Regression line for an exponentialapproximation to the evaporation. Measurements of the water content on dry matter basisto determine the evaporation rate for calculation of kc.
86

7.2.3 Process properties
The process properties used to characterize the baking process in this work are the oventemperature and the average heat transfer coefficient at the product. The oven tempera-ture is measured by a thermo sensor a few centimeters above the baking tray, and besidesbeing used for feedback control of the process it is logged continuously during baking.
Heat transfer coefficientThe method and measured values for the heat transfer coefficient are described in Section6.2.1. The average heat transfer coefficient determined by the use of aluminum cylindersis applied in the modeling work. As stated in the previous section cylinders of the sameshape as the cookies were found to heat too quickly for the oven to reach a steady statetemperature. Therefore aluminum cylinders with a diameter of 40 mm and a height of 60mm were used instead.
The characteristic length of the cylinders is the diameter, since the air flow close to thecookies is parallel to the baking tray. The values of the diameters are close to each other,but the larger height of the aluminum cylinders may increase the average heat transfercoefficient compared to the actual heat transfer experienced by the cookies. On the otherhand the uneven surface of the cookies will result in an increased local turbulence, andhence higher heat transfer, compared to the smooth aluminum surface. The substitutionof the cookie geometry with the aluminum cylinders is considered an acceptable approx-imation for obtaining a heat transfer coefficient for the modeling work. The air flowsettings were similar to those used in the baking experiments for validation. The appliedaverage heat transfer coefficient is 63 W
m2K.
87

88

Chapter 8
Numerical solution of heat and masstransfer equations
The work described in Chapters 7,8, and 9 is an elaboration of the work presented inthe manuscript "Investigation of uneven mass transfer in butter cookies combining exper-imental work and finite element modeling" (Appendix F), submitted for publication in theInternational Journal of Food Engineering, June 2013.
This chapter explains how the equations from Chapter 7 are solved numerically by theuse of a finite element method. The model is improved and validated by comparison toexperimentally obtained data from the pilot oven.
8.1 Numerical solution methods
For differential equations analytical solutions give the most accurate results. However,analytical solutions are not always the most efficient way to solve more complex systemsof differential equations or may not be available at all (Martins et al., 2008). In such casesnumerical solutions are applied. Numerical solutions are obtained by discretization of thedifferential equations to systems of difference equations, which are solved for a number ofpoints and summed (Tijskens et al., 2001). The change from an analytical to a numericalapproach also changes the solution from exact to approximate.
Different numerical methods are used to solve differential equations in the fields of foodscience and technology such as the finite difference methods (FDM), finite volume method(FVM), and finite element method (FEM)(Martins et al., 2008; Tijskens et al., 2001). Theoldest of these discretization methods is the FDM, described by Euler as early as 1768(Tijskens et al., 2001). Following this method the investigated geometry is divided intoa number of evenly spaced and sized cells, for each cell the derivatives in the governingequation are approximated by differences over a length equal to the size of the cell. If the
89

size of the cells is decreased the accuracy of the approximation increases. As an examplethe governing second order differential equation for heat transfer (Equation (7.1)) is shownin (8.1) applying the backward Euler method and central difference formula (Tijskenset al., 2001).
∂Ti,j
dt= ∆t kT
ρcp
(1ri
Ti,j − Ti−1,j
ri − ri−1+ Ti+1,j − 2Ti,j + Ti−1,j
(ri − ri−1)2 + Ti,j+1 − 2Ti,j + Ti,j−1
(zi − zi−1)2
)(8.1)
Where ∆t = (ti−ti−1), ∆r = (ri−ri−1) and ∆z = (zi−zi−1). FDM is a good and low costmethod with regard to computational demands, however it is not suited for simulationsof complex food products or complex geometries (Wang and Sun, 2003).
With the FVM the geometry is divided into cells consisting of smaller volumes. Eachvolume has constant physical and chemical properties. The value of one volume affectsthe value in the next volume (Jensen et al., 2003). For example energy flux leaving onevolume is equal to the flux entering the following volume, thus conserving the total energyin the system. The finite volume method is widely used in computational fluid dynamicsprograms (e.g. Fluent and Star-CD), mainly because the solvers have traditionally beenmore suited for turbulence modeling than FEM. FEM is applied in the present work anddescribed in the following Section 8.1.1.
8.1.1 Finite element method
For FEM the investigated geometry is divided into a finite number of small elements.These elements are connected by node points. In each element the governing equation isapproximated by a low order polynomial. The overall solution is thus found by combiningall the unique solutions at the node points (Tijskens et al., 2001). Different methods canbe used to determine the low order polynomials mainly divided into two groups, eitherthe variational method or methods of weighted residuals (such as Galerkin’s methodor equidistant collocation) (Tijskens et al., 2001; Villadsen and Michelsen, 1978), morethorough descriptions of such methods can be found in the literature and falls outside thescope of this thesis (Martins et al., 2008; Villadsen and Michelsen, 1978).
8.2 Present approach
In the present work the commercially available FEM solver COMSOL Multiphysics 4.3(COMSOL, 2012) (hereafter simply referred to as COMSOL) is used. The solver appliedin COMSOL for the present study is a multifrontal massively parallel sparse direct solver(MUMPS). The application of COMSOL for numerical solving of heat and mass transferprocesses have been successfully applied in other studies for different food products. A
90

few examples: contact baking (Feyissa, 2011), bread baking (Mondal and Datta, 2010;Ploteau et al., 2012; Purlis, 2012), chicken patties (Chen, 1999), and other bakery productssuch as biscuits and cakes (Ferrari et al., 2012; Hadiyanto et al., 2007). An overview ofthe main steps for FEM simulation with COMSOL is shown in Box 8.1 (adapted from(Feyissa, 2011)).
Box 8.1: The main steps for COMSOL modeling (Feyissa, 2011).Step 1 - Geometry: The first step is to build the geometry for the simulation, thisincludes the type of geometry (dimension) and simplification by utilization of relevantsymmetries.Step 2 - Meshing: The geometry is divided into node points forming a mesh. The shapeand size of the mesh elements are important for the accuracy of the simulation and thetotal simulation time.Step 3 - The model: Relevant physical models are selected (e.g. heat transfer, masstransfer, chemical reactions). The initial and boundary conditions are given along withmaterial properties, parameters and when needed user specified functions.Step 4 - Solving the model: When all information is filled into the program the modelsare solved either as stationary or time dependent problems.Step 5 - Post processing: After solving the models the results can be exported tofurther processing or directly visualized as plots or used to calculate average propertiesor other output values of interest.Step 6 - Validation: A numerical solution should never stand alone. When the simula-tions are carried out it is important to validate whether the obtained results are actuallyrealistic outside the computer environment.
The investigated cookies are modeled as cylinders of 6 mm in height and 45 mm indiameter. This geometry can be represented in COMSOL in different ways. The fullvolume can be implemented in a 3D simulation, the cross-sectional area can be investigatedalone, or, as done is this work a combination of these two methods a 2D axis symmetricaldesign can be used. With this method the geometry is build in cylindrical coordinatesand rotated around the z-axis giving a 3D volume. The model is thereby solved for a2D surface, but the result can be directly obtained for the whole volume. Figure 8.1(a)shows the full geometry when rotated around the z-axis, Figure 8.1(b) shows the halfcross-section area after meshing (the mesh is described in Section 8.2.2).
8.2.1 Geometry
In cases where the heat and mass transfer is the same through both the top and bottomsurfaces only one quarter of the cross-sectional area is needed (Chen, 1999). While thefirst part of the present work is based on this assumption, the half cross-sectional area isused. This is done to enable comparison to the following work, investigating the effectof asymmetrical mass transfer boundary conditions. During baking it is likely that thebaking tray will reduce the evaporation from the bottom surface and influence on the heattransfer, the limiting effect on the mass transfer is described in Chapter 9.
91

(a) Geometry
(b) Mesh
Figure 8.1: (a) The full geometry, when rotated around the z-axis. (b) The half cross-sectional area with the applied triangular mesh and 4 rows of boundary layer.
Figure 8.2: Different mesh shapes commonly used in FEM, adapted from (Martins et al.,2008).
92

8.2.2 Meshing
The mesh is the grid dividing the geometry into finite elements. Different mesh geometriescan be used in FEM. The most common are shown in Figure 8.2 for 1D, 2D, and 3Dgeometries. Depending on the process simulated and the available processing power,different mesh geometries and element sizes are desirable (Martins et al., 2008). Increasingthe number of elements in the mesh will increase the accuracy of the solution at thecost of an increased computer processing requirement. In COMSOL linear triangular orquadrilateral elements are available for meshing.
In the present work a 2D mesh consisting of triangular elements was applied. The elementsize was set using the predefined extra fine element size. The resolution of the solutionby the outer edges was enhanced through a boundary layer with 4 rows and a growthfactor of 1.2. The final number of elements was 2642. To ensure the mesh elements weresufficiently small a test simulation with the predefined element size extremely fine (totalelements 8482) was performed. In the test simulation the initial kc and D values wereapplied for the mass transfer. Comparing the calculated values for the center temperatureand the average mass fraction the largest deviation, found for the center temperature att = 100 s, is 0.32 % and the average deviations for the center temperature and massfraction respectively are: 0.04 % and 2.4·10−5 % covering a 480 s simulation time. Withthis very small difference in the results the extra fine mesh was considered an acceptableresolution for the simulation work. The mesh is shown in Figure 8.1(b).
8.2.3 Water evaporation and temperature
Heat transfer during baking can be separated into steps: initial heating, water evaporation(drying), and if the baking process is continued for sufficiently long time, a final heatingstep to the oven air temperature. The model in Chapter 7 describes the heating processeswith evaporation as a function of the surface temperature.
The mass flux described in (7.6) is restricted by the surface temperature. If the surfacetemperature is lower than the evaporation temperature the mass transfer coefficient iszero. For computational reasons this is done through a build-in step function in COMSOL.The step function increases from zero to one over a defined temperature interval. Fromcenter temperature measurements a plateau, indicating the initiation of evaporation wasfound close to 105◦C. This value is in good concordance to findings described by Mowbray(1981) reporting that a plateau is generally observed around 103◦C in biscuit baking.The used step function includes the evaporation gradually in the temperature interval105-110◦C.
93

8.2.4 Assumptions and simplifications
Models are only approximations to reality. Therefore assumptions and approximationswill always be part of modeling work. The important step is to find the balance betweensimplification by approximations and sufficient complexity to describe reality. The modelequations presented in Chapter 7 show one way to represent the reality of baking.
The following assumptions and simplifications were applied when solving the model:
• Heat transfer: An average heat transfer coefficient is used on the entire surface ofthe product. In the actual baking process the baking tray and local variations in airflow result in varying heat transfer coefficients around the bakery product. Thesevariations are difficult to measure accurately and would furthermore only affect e.g.local water content, while the loss in total water content should be reasonably wellcharacterized by an average heat transfer coefficient. Only convection heating isincluded in the model. Due to the highly reflective stainless steel surfaces inside theoven and the light color of the product the contribution from radiation is neglected.The low thickness (1.3 mm) of the steel baking tray results in fast heat transferthrough the baking tray, and a low transverse conduction rate, this contribution isnot included in the heat transfer equations.
• Mass transfer: The water transport is modeled as a diffusion process. To simplify themodel only average mass transfer parameters are included, combining the transportof liquid water and water vapor. The diffusion coefficient and the mass transfercoefficient should therefore be considered as apparent coefficients.
• Volume and porosity: During baking CO2 and water vapor will expand the productvolume. Additionally water evaporation and solidification of the cookie matrix willchange the structure from dense to porous. In the simulations both the volume andthe porosity are kept constant. The lumped effect of the changes in volume andporosity is indirectly included in the solutions since the diffusion and mass transfercoefficients are optimized using experimental data.
• Physical properties: The physical properties are calculated throughout the simula-tions as functions of the water content; all other ingredient properties and relativecontents are kept constant.
In this chapter all effects from the baking tray are ignored. However, it will not only resultin a small amount of conduction heating. The baking tray may also limit evaporation fromthe bottom surface of the product. In Chapter 9 the consequences of this simplificationis further investigated.
94

8.3 Simulation results and validation
An overview of all parameters and variables applied in the COMSOL simulations is shownin Appendix J. From the simulation results two values were extracted. The cookie centertemperature and the average mass fraction. The mass fraction is calculated as the finalweight divided by the initial weight. The center temperature was found from the build-infunction point evaluation, giving the desired value in a specific point. The mass fractionwas found using the build-in function volume average calculating the average of the desiredvalue for the investigated 3D rotation of the investigated domain.
The two values were chosen because they both provide information related to the solvedequations, and are possible to validate through experimental data. The mass fraction isa good indicator for the weight loss as it is independent of the initial product weight andthereby robust regarding small variations in the initial cookie weight.
8.3.1 Experiments for validation
Validation of simulation results is extremely important. Though most well presentedsimulations will look convincing, they might not actually be accurate. In the present workbaking of butter cookies is studied. The baking process is possible to monitor as describedin Chapter 5. For the validation experiments the product weight and temperature aremeasured.
The cookie dough is prepared following the recipe in Table 6.2. Separate experimentswere carried out to obtain the two product quality indicators. The mass loss was recordedcontinuously during baking. The cookies for this experiment were prepared as describedin Chapter 6 (diameter = 45 mm, height = 6 mm). The center temperature was measuredfrom separate experiments in which the cookies were shaped somewhat differently.
For weight loss investigations three rounds of 12 cookies were baked for approximately 8min. The cookies were baked with medium air velocity (setting 5), with even top:bottomdistribution of air (both dampers set to 50%) and with the air temperature regulation setat 180◦C. As described in Section 5.4.1 the trolley moving the air ducts from side to sidesometimes touches and lifts the baking tray disturbing the weight measurements. Dataobtained for the three baking processes are shown in Figures 8.3(a) and 8.3(b). The finalmass fraction was found to be close to 0.88 after 8 min of baking. At the time when theexperiments were carried out it was thought that the disturbances from the trolley weretoo severe for the online obtained measurements to be used. Only the before and aftertemperature of 6 of the 12 cookies were registered at the time of the experiment. However,the data was logged, and the measurements applied in the present work. Therefore theinitial cookie weight is estimated as two times the weight of the 6 measured cookies.While this estimate will result in a small error when calculating the total mass loss,this method is preferred to the off-line method. Measuring the weight after baking will
95

include additional evaporation from the cookies during cooling and does not show theactual evaporation progress during baking. The scale was not tared systematically, thusthe baking tray weight cannot simply be subtracted from the obtained measurements andthe approximated mass fraction is applied.
(a) All measured weight data given as massfractions.
(b) Abridged weight data given as mass frac-tions.
Figure 8.3: Weight measurements from the batch oven. The measurements are normal-ized against the first 15 measurements in each data set. One of the data sets is shown inFigure 5.8(a).
For center temperature measurements the process of shaping the cookies was differentfrom the standard cookies. Two thin slabs of dough with heights of 3 mm and diametersof 45 mm were prepared. The thermo-sensor tip was placed between the two as closeto the center as possible, creating one cookie of 6 mm in height similar to the standardcookies. Temperature data was obtained from six repetitions of three cookies baked underthe same conditions as the cookie in the weight loss experiments. Three measurementswere discarded due to disturbances in the measurement equipment.
One series of measurements was discarded because the sensor moved through, and out ofthe cookie surface during baking. Pictures of cookies for temperature measurements areshown in Figure 8.4. For the validation work the average of 14 measurements is applied.
Observations during the experimental work show two main factors which are likely toinfluence the precision of the center temperature measurements: The thickness of thehalf cookies, the weight was measured of each half and showed some variation meaningthat the top and bottom halves were not completely identical in all cookies; and therisk of sensor movement inside the cookie during baking, while the dough is firm at roomtemperature, heating will melt the fat in the dough and soften the structure. In Figure 8.5the temperature measurements are shown, both the raw data from the 14 measurementsand the calculated average.
96

(a) Two layer cookie after baking (b) Two layer cookie after baking, thesensor has perforated the top half
Figure 8.4: Cookies used for the temperature measurements after 15 min of baking. In(a) the two layers are seen along with a small hole left by the sensor wire. (b) shows acase of a sensor which has perforated the cookie during baking.
(a) All measurements (b) Average
Figure 8.5: Center temperature measurements. (a) All the 14 measurements are shown.(b) The average center temperature ±one standard deviation.
8.3.2 Initial simulations
Results from simulations using the initial values for kc (2.7·10−6 m/s) and D (3.6·10−8 m2
s)
are shown in Figure 8.6 along with experimental results. The two initial values aredescribed in Section 7.2.1.
The initial simulations show almost no evaporation and no temperature increase over105◦C. These results are clearly inconsistent with the actual physical behavior of theproduct. The heat and mass transfer equations are linked by the mass transfer coefficientand the diffusion coefficient. Directly by the diffusion coefficient which is found in bothboundary equations, and indirectly through the mass transfer coefficient which influencesthe water concentration gradient at the surface, and thus the evaporation term. Consid-ering the boundary equations (7.3) and (7.6) it is seen that the concentration gradient
97

(a) Initial simulation of the center temperature (b) Initial simulation of the mass fraction
Figure 8.6: Simulation results with the initial diffusion coefficients and experimentalresults. (a) shows the center temperature and (b) the mass fraction.
may be expressed as (8.2) during the evaporation phase.
∂xw
∂n= kc
D︸︷︷︸constant
(xw,a − xw) (8.2)
The relation between kc and D is important for the magnitude of the concentration gra-dient (left side of (8.2)). From a mechanistic point of view kc describes how much vaporleaves the surface, while D describes how fast it moves to the surface from the cookieinterior. Even with a high mass transfer coefficient the evaporation will not take place ifthe diffusion is not fast enough to supply water for evaporation at the surface boundary.In the present model such an unbalance may result in a high concentration gradient. Thiswill result in a too high estimate of the energy needed for evaporation in the temperatureboundary conditions.
For improved simulations it was estimated that a higher diffusion coefficient was neededand possibly a higher mass transfer coefficient. Using parameter sweeps, as described inSection 8.3.3, the mass transfer and diffusion coefficients were optimized for subsequentsimulations.
8.3.3 Improving simulation results by optimizing the mass trans-fer and diffusion coefficients
The most uncertain parameters in the governing equations are the mass transfer anddiffusion coefficients. In order to obtain a balanced result with both heat and masstransfer similar to the experimental data these parameters are to be optimized. Theoptimization processes in this work are based on comparisons between the experimentaldata and matrices of 100 simulations. The 100 simulations are combinations of 10 kc and
98

10 D values. In COMSOL this is generated as a "parameter sweep" with two variables.
The initial guess for D was 3.6·10−8 m2
s. For liquid water transport this value is in the
high end of the expected range, while it is in the lower end of water vapor diffusioncoefficients (Hadiyanto et al., 2007; Thorvaldsson and Janestad, 1999). The optimiza-tion intervals were chosen based on results from simulations narrowing the possible op-timum for each parameter value. The investigated values for were evenly distributedon a logarithmic scale in the following intervals: kc ⊂ [1.78 · 10−6 : 5.62 · 10−5]m/s andD ⊂ [3.16 · 10−5 : 1 · 10−4]m2/s. Based on published values for diffusion coefficients it isseen that the optimization interval for the diffusion coefficient indicates predominantlywater vapor diffusion (Hadiyanto et al., 2007; Thorvaldsson and Janestad, 1999).
The results obtained from the 100 simulations were compared to the experimentally mea-sured mass fractions and the average center temperature. For the baking times at whichboth experimental and simulation results are obtained the error is calculated from Equa-tion (8.3).
ε =N∑
n=1(xn,sim − xn,exp)2 (8.3)
where xsim is the simulated value, xexp is the experimental value and N the number oftime steps. The mass fraction error was calculated using all three repetitions. At timesteps with more than one repetition the error average value was calculated and includedin the total error sum. For the temperature measurements the average temperature forthe 14 measurements was used in the error calculations.
The surface plots in Figure 8.7 show the logarithm to the total errors for the temperatureand mass fraction, respectively, for all 100 simulations. Figure 8.7(c) shows the logarithmto the product of the error estimate found by (8.4).
εcombined = log(εMF · εCT ) (8.4)
where εcombined is the combined error including the mass fraction error, εMF , and the centertemperature error, εCT .
The smallest errors are obtained at the following parameters for the three different set-ups(best fit for mass loss, best fit to temperature, and best fit combined):Min. error for mass fraction: kc = 1.21·10−5 m
s, D = 5.27·10−5 m2
s
Min. error for temperature: kc = 5.62·10−6 ms, D = 4.08·10−5 m2
s
Min. combined error: kc = 8.25·10−6 ms, D = 4.64·10−5 m2
s
Results from simulations applying the optimized parameters are shown in Figure 8.8along with the experimentally measured data. Compared to the initial simulation it isclear that all three simulations provide better descriptions of the baking process. For thetemperature profile the step and following increase in temperature is seen in all threeoptimized cases. The mass loss appear more realistic with a visible drop in mass fractionfor all three set-up.
99

(a) Error for mass fraction.
(b) Error for center temperature.
(c) Sum of errors.
Figure 8.7: Visualization of the errors between measured data and simulation results.
Comparing to published values for comparable products the obtained values for kc andD appear reasonable. The mass transfer coefficient reported by Demirkol et al. (2006b)is 6.19·10−6 m
s, which is within one order of magnitude compared to the obtained values
100

(a) Center temperatures simulations
(b) Mass fractions simulations
Figure 8.8: Optimized simulation results. (a) shows the simulation results for the centertemperature along with the experimental results. (b) shows simulation results and mea-surements of the mass fractions. The solutions obtained after the first optimization areshown with red dots.
101

considering best fit for temperature and the combined error.
The applied model does not differentiate between the transfer of liquid or gaseous watertransport. An overall diffusion coefficient is found. The found value is very high comparedto values for liquid water transport and the initial value. Water diffusion coefficientsare generally reported in the order of 10−10 m2
s(Hadiyanto et al., 2007; Thorvaldsson
and Janestad, 1999; Zanoni et al., 1994). The obtained values strongly indicate thatthe mass transfer is primarily water vapor moving through the porous structure of thecookies. Diffusion coefficients reported for water vapor are close to the calculated values:Thorvaldsson and Janestad (1999) reports a diffusion coefficient of 8·10−7 m2
sfor bread
products, and Hadiyanto et al. (2007) the more related diffusion coefficient for watervapor in biscuits of 2·10−5 m2
s. The latter is close to the results obtained in the present
work.
8.4 Discussion of the numerical simulations
The simulations using the FEM tool resulted in good simulations of both the temper-ature and water evaporation. The initial mass transfer and diffusion coefficients wereoptimized by the use of experimental data obtained in the new pilot oven. The optimizeddiffusion coefficients are close to values for water vapor diffusion through biscuit products(Hadiyanto et al., 2007). The initial mass transfer coefficient was within one order ofmagnitude from the optimized values.
The work presented by Sakin-Yilmazer et al. (2012) also includes mass transfer coeffi-cients inspired by the work of Demirkol et al. (2006b). The values obtained for ring cakebaking are seen to exceed the values for butter cookies. Considering the higher watercontent in cake batter this is expected. The optimized values were between 5.62·10−6 m
s
and 1.21·10−5 mscorresponding well to the value obtained by Demirkol et al. (2006b) of
6.19·10−6 msfor 100% convection at 190◦C for a biscuit product.
The optimized diffusion coefficients were close to the water vapor diffusion coefficientspresented by Hadiyanto et al. (2007), and higher than the values presented in Demirkolet al. (2006b). The apparent diffusion coefficient will depend on the structure of theproduct and its development during baking. Considering the butter cookies the obtainedvalues seem realistic as the porous structure of the product is likely to enable a fast watervapor transport through the product.
In the present case there are known uncertainty aspects attached to both the temperatureand weight loss measurements. The weight measurements were influenced by noise fromthe movement of the trolley and the exact initial weight of the cookies was not known.The temperature sensors may have moved inside the cookies or could have been placedoff-center. In future experimental studies alternative temperature measuring methodsmay need to be considered. Alternative solutions could be a small rig, fixing temperaturesensors in predefined positions (Ferrari et al., 2012; Feyissa, 2011), or the sensor cord
102

could be attached to the underside of the baking tray, then go through a hole in the tray,and allow for an adjustable length of the sensor tip, e.g. half the cookie height (Broyartand Trystram, 2003; Demirkol et al., 2006a). Placing the cookies with the center point onthe sensor tip would then enable a more robust center temperature measurement, withoutadditional equipment disturbing the air flow or heat transfer.
The scope of the model is to have a robust description of the heat and mass transferduring baking. Future applications of a robust model could be the optimization of prod-ucts and/or energy consumption. The simple optimization with two varying parametersimproved the simulation of the baking process. A sensitivity study should be consid-ered, as this could disclose any correlations between parameters (Feyissa et al., 2012).The present connection between the heat and mass transfer models is not fully capableof handling the actual physical processes taking place. This would be improved if themass transfer coefficient and the diffusion coefficients were expressed as functions of themoisture concentration and the temperature.
Based on the results, and investigated published works, water vapor transport appearsto be the main mass transfer mechanism inside the cookie during baking. In order tounderstand the mechanisms of water vapor movement inside the cookies a reasonablefuture improvement of the model would be to include the porosity. A high degree ofporosity forming a continuous network inside the product would facilitate water vaportransport. Additionally the incorporation of air bubbles in the dough may also influencethe initial heating of the product. Air from the dough mixing step may decrease thethermal conductivity.
The model gives good results for both heat and mass transfer. An attempt to furtherimprove the model is made by investigating the influence of the baking tray on the massloss. The simulations in this chapter assume equal evaporation from all surfaces of thebutter cookie, and though a good fit is obtained it should be investigated if the modelcan be improved by including the effect of the solid baking tray surface. In the workpresented by Sakin-Yilmazer et al. (2012) different mass transfer coefficients are used atdifferent surfaces due to the degree of coverage by the cake mold.
103

104

Chapter 9
Influence of the baking tray on heatand mass transfer
The work described in Chapters 7,8, and 9 is an elaboration of the work presented inthe manuscript "Investigation of uneven mass transfer in butter cookies combining exper-imental work and finite element modeling" (Appendix F), submitted for publication in theInternational Journal of Food Engineering, June 2013.
This chapter is focused on optimizing the model for heat and mass transfer describedin Chapters 7 and 8. The target of the optimization is the mass transfer boundary con-ditions, in which the effect of the solid baking tray is taken into account. This is done inthe numerical simulation set-up by changing the mass flux from the bottom surface. Thesimulations from Chapter 8 include symmetrical mass transfer boundary conditions. Inthis chapter the mass flux from the bottom surface is decreased compared to the side andtop surfaces.
It is expected that an adjustment of the mass flux boundary conditions from a symmetricalto an asymmetrical set-up will result in a better representation of the heat and masstransfer.
After baking, the top and bottom surfaces of butter cookies show differences with regardto browning and surface topography. An example of a butter cookie, baked in a 10 mtunnel oven (described in Chapter 6) for 6 min at 170◦C is shown in Figure 9.1. Bubblesare observed on the bottom surface, which is also darker and more evenly browned thanthe top surface. The most likely mechanism describing these bubbles is that they arisefrom water evaporating on the bottom surface when leaving the product. The water vaporthen moves along the bottom surface, toward the outer edges, and away from the product.It is interesting to investigate how this evaporation at the bottom surface influences theover-all heat and mass transfer in the product.
In the present work the scope is to develop a robust model, which is sufficiently simple toenable easy modeling, but still complex enough to give a good description of the inves-
105

(a) Upper surface of butter cookie (b) Bottom surface of butter cookie
Figure 9.1: Upper and bottom surfaces of a cookie baked at 170◦C for 6 min in the 10m tunnel oven described in Chapter 5.
tigated product parameters. The focus is on heat and mass transfer, and the validationof the model is made by comparison with the mass loss and center product temperaturedata described in Chapter 8.
During baking the baking tray will influence the baking process in two ways: Heat istransferred along the baking tray, adding conduction to the heat transfer at the bottomsurface of the cookies. Additionally the baking tray will influence the evaporation ratefrom the bottom surface. The solid baking tray underneath the cookies will limit evapo-ration compared to the uncovered top and sides. Different approaches to the influence ofbaking trays and molds are found in published studies, as described in Section 2.3.3. Thetwo studies of main relevance for the present investigation are those presented by Ferrariet al. (2012) and Sakin-Yilmazer et al. (2012).
The simulation results obtained by Ferrari et al. (2012) clearly show a consequence of notincluding the limiting effect of a evaporation barrier. An illustration of the simulationcompared to the measurements, as given in the article, is shown in Figure 9.2.
Sakin-Yilmazer et al. (2012) include different values for the mass transfer coefficient de-pending on the degree of coverage by the baking mold. In their modeling work the ratiobetween the mass transfer coefficients applied for the side and top surfaces is 0.65, and 0.7between the bottom and top surfaces. The top surface mass transfer coefficient appearsto be calculated based on Demirkol et al. (2006b).
The changes are included in the boundary conditions for the mass transfer through theconstant C. The boundary conditions for the bottom surface is thus written as shown in(9.1).
D∂xw
∂n={
0, T < Tvap,w
C · kc (xw,a − xw) , T ≥ Tvap,w(9.1)
106

Figure 9.2: Comparison of simulated and measured mass loss for biscuit baking (Ferrariet al., 2012). Caption as given in Ferrari et al. (2012): "Development of biscuit moistureduring baking. Solid line corresponds to the model and dots to experimental (%wet basis)."
A total of three different boundary condition scenarios are compared: A symmetricalset-up with 100% (C = 1.0) evaporation from the bottom surface, an extreme case with0% (C = 0.0) evaporation from the bottom surface, to include a large variation acrossthe surface, and an intermediate set-up with 60% (C = 0.6) evaporation from the bottomsurface. All percentages are given relative to the evaporation rate from the top and sidesurfaces.
9.1 Optimized coefficients
First the case with no mass transfer from the bottom surface (C = 0.0) was investigated.Similarly to the parameter optimization work described in Section 8.3.3 a parametersweep was carried out with 10 values for each kc and D. Compared to the symmetri-cal case the investigated interval for D was changed after a few preliminary simulationsto include higher values. The mass transfer from the free surfaces will be higher thanin the symmetrical case in Chapter 8, therefore higher values are included in the pa-rameter sweep. The investigated intervals were: kc ⊂ [5.62 · 10−6 : 1 · 10−4]m/s andD ⊂ [3.16 · 10−5 : 1 · 10−4]m2/s.
For the C = 0.0 set-up the three combinations of kc and D resulting in the smallestaverage deviations, considering the mass fraction (εMF ), center temperature (εCT ), andthe combined minimum error (εcomb) were:
Min. error for temperature: kc = 2.78·10−5 ms, D = 4.64·10−5 m2
s
Min. error for mass fraction: kc = 2.02·10−5 ms, D = 6.81·10−5 m2
s
Min. combined error: kc = 2.78·10−5 ms, D = 4.64·10−5 m2
s
In all three cases the kc and D values are within the same order of magnitude. Thecombinations of kc and D are the same for εCT and εcombi. Of the ten investigated values
107

of D the same optimum is found for εCT and εcombi as was seen for εcombi in the C = 1.0set-up.
For the C = 0.6 set-up the optimum values must be in the range spanned by the set-upsfor C = 1.0 and C = 0.0. The intervals ranging from the smallest value of the threeoptimal combination in any of the two set-ups to the maximum value from either of thesix combinations were:kc = 5.62·10−6 to 2.78·10−5m/s
D = 4.08·10−5 to 6.81·10−5m2/s
From a 10 by 10 parameter sweep over these intervals the following three optimizedcombinations were found:Min. error for temperature: kc = 8.00·10−6 m
s, D = 4.17·10−5 m2
s
Min. error for mass fraction: kc = 1.62·10−5 ms, D = 5.17·10−5 m2
s
Min. combined error: kc = 9.55·10−6 ms, D = 4.40·10−5 m2
s
These results show smaller kc values than in the C = 0.0 set-up. The D values are stillin the same order of magnitude. For the C = 0.6 set-up three different combinations ofkc and D were found. Simulation results along with the experimental data are shown inFigures 9.3 and 9.4.
9.2 Simulation results and comparisons
For each set-up kc and D have been optimized with respect to the mass fraction, thecenter temperature, and the combined error. Besides the error itself it is important toevaluate the simulated and measured mass fraction and center temperature over time, i.e.during the baking process.
Optimum based on the mass fraction, C = 0.0 set-up
The modeling results optimized with regard to the mass fraction (εMF ) follows the valuesof the measured data throughout the baking process. The development of the centertemperature follows only the trend of the experimental data (see Figure 9.3). The simula-tion results are higher than the measurements, but the evaporation plateau is reached atsimilar baking times and the general pattern in temperature increase is also comparable.
Optimum based on the center temperature, C = 0.0 set-up
The simulation results corresponding to the smallest εCT do not provide a good repre-sentation of the measured temperature values (Figure 9.3(a)). The impact of removingevaporation completely from the bottom surface results in a too high temperature increasein the center of the cookie. This combination also results in a poor fit for the mass fraction
108

(a) Center temperatures, simulations with 0% evaporation from bottom surface
(b) Mass fractions, simulations with 0% evaporation from bottom surface
Figure 9.3: Identical optimization results were obtained for the center temperature andthe combined error, therefore only two simulation results are visible in the figures.The center temperature (average, plus and minus one standard deviation) (a) and massfraction (b) are shown as functions of the baking time. Both the experimental data andthe simulations results are shown in the figures.
109

(a) Center temperatures, simulations with 60% evaporation from bottom surface
(b) Mass fractions, simulations with 60% evaporation from bottom surface
Figure 9.4: The center temperature (average, plus and minus one standard deviation)(a) and mass fraction (b) are shown as functions of the baking time. Both the experimentaldata and the simulations results are shown in the figures. The mass transfer from thebottom surface is set to 60% of the top and side surfaces.
110

development (Figure 9.3(b)). The simulation shows insufficient evaporation compared tothe experimental data.
Regarding εcombi the optimum combination of parameters is the same as for the centertemperature. The poor fit for the center temperature is likely to pull the εcombi towardsthe values resulting in the minimum error for the center temperature.
Comparison of results
For C = 0.6 a good fit is seen for the temperature development considering all threecombinations of kc and D (see Figure 9.4). The mass fraction results are quite similarto those obtained with C = 1.0 (Chapter 8), showing a high dependency on changes inkc and D. The kc and D values given in Table 9.1 were found to give the best fit forthe three investigated set-ups. For each set-up three sets of values are given. The firsttwo corresponding to the smallest errors comparing simulation and experimental datafor the temperature and the weight loss measurements (εmin,T and εmin,MF ), calculatedfrom (8.3), and the third set corresponding to the smallest combined error (εmin,combi),calculated from (8.4). The smallest calculated errors are also given in the table.
Table 9.1: Error, kc, and D values corresponding to the lowest temperature, mass fractionor combined error for each of the three set-ups (the C value indicates the factor introducedin (9.1)).
C = 1.0ε value kc (m/s) D (m2/s)
εmin,T 5.50·10−3 5.62·10−6 4.08·10−5
εmin,MF 4.97·10−2 1.21·10−5 5.27·10−5
εmin,combi 4.57·10−4 8.25·10−6 4.64·10−5
C = 0.6ε value kc (m/s) D (m2/s)
εmin,T 4.20·10−3 8.00·10−6 4.17·10−5
εmin,MF 4.98·10−2 1.62·10−5 5.17·10−5
εmin,combi 3.68·10−4 9.55·10−6 4.40·10−5
C = 0.0ε value kc (m/s) D (m2/s)
εmin,T 2.11·10−2 2.78·10−5 4.64·10−5
εmin,MF 4.97·10−2 2.02·10−5 6.81·10−5
εmin,combi 2.04·10−3 2.78·10−5 4.64·10−5
The simulations show that for all three set-ups the model is capable of describing thetotal mass loss over time. Good agreement is seen between the center temperature mea-surements and the simulations for C = 1.0 and 0.6. For C = 0.0 the model does not resultin a good simulation of the center temperature.
Regarding the average errors for the mass fraction the smallest values are found at C =0.0 and C = 1.0, however, all minimum errors are very close when the model is optimized
111

with regard to the mass fraction measurements.
Considering the graphs in Figures 8.8(b), 9.3(b), and 9.4(b) the differences between theinvestigated parameters are clear. The graphs show that the simulation results optimizedwith regard to the mass fraction are in good agreement with the average trend in themeasured data for all three cases.
Moisture and temperature distribution through the cookies
Figures 9.5 and 9.6 show the temperature profile and mass fractions through the cookieafter 300 s for C = 1.0 and C = 0.0. For the temperature the cross-sectional plots show aclear asymmetry for the case with no evaporation from the bottom surface. In this casethe temperature at the bottom surface is highest and the lowest temperature is found atthe top and side surfaces at which energy is used both for heating and evaporation.
In the set-up with limited mass transfer some of the calculated temperatures are high,above 140◦C, at the bottom surface. The high diffusion coefficient and small mass fractiongradient is likely allowing for a sufficient diffusion drying of the lower surface to reachthese temperatures. Considering the pictures of the top and bottom surfaces of cookiesbaked in a tunnel oven shown in Figure 9.1, the bottom surface is clearly more brownthan the top surface. The differences in browning are in agreement with the simulationresults with a higher temperature at the bottom surface.
9.3 Model and prediction
A drawback in the simulation-validation work is that the results for validation are alsoused in the optimization process. The final model’s ability to predict the heat and masstransfer in cookies should also be validated against new data, which is not used for opti-mization. The experimental work described in Chapter 6.4 is used for this purpose. Theseexperiments did not make use of the ovens function of continuous weight measurement.The water loss was measured after the cookies were removed from the oven. Knowingthis, the mass loss data is still a way to estimate the predictive capability of the model.Unfortunately no additional temperature measurements were available for comparison.
Because the mass loss was not recorded continuously in the oven during baking the mea-sured evaporation will be higher than the data used to optimize the model. The excessevaporation happens between reaching the desired baking time to the cookie weight ismeasured. Since the evaporation rate is higher in the first part of the baking the error isexpected to decrease with increasing baking time (cf. evaporation rates shown in Figure6.5(c)). The comparison is shown in Figure 9.7.
The simulation results are shown for the minimum εMF with the C = 0.6 set-up. Theexperimental data points are average values from 6 butter cookies (except at 8 minutes,
112

Figure 9.5: Cross-sectional plots of the temperature through the product after 300 s.Upper: With equal mass flux from all surfaces. Lower: Evaporation from only the top andthe side surfaces. Note that the color scales are not similar for the two illustrations.
113

Figure 9.6: Cross-sectional plots of the mass fraction after 300 s. Upper: With equalmass flux from all surfaces. Lower: Evaporation from only the top and the side surfaces.Note that the color scales are not similar for the two illustrations.
114
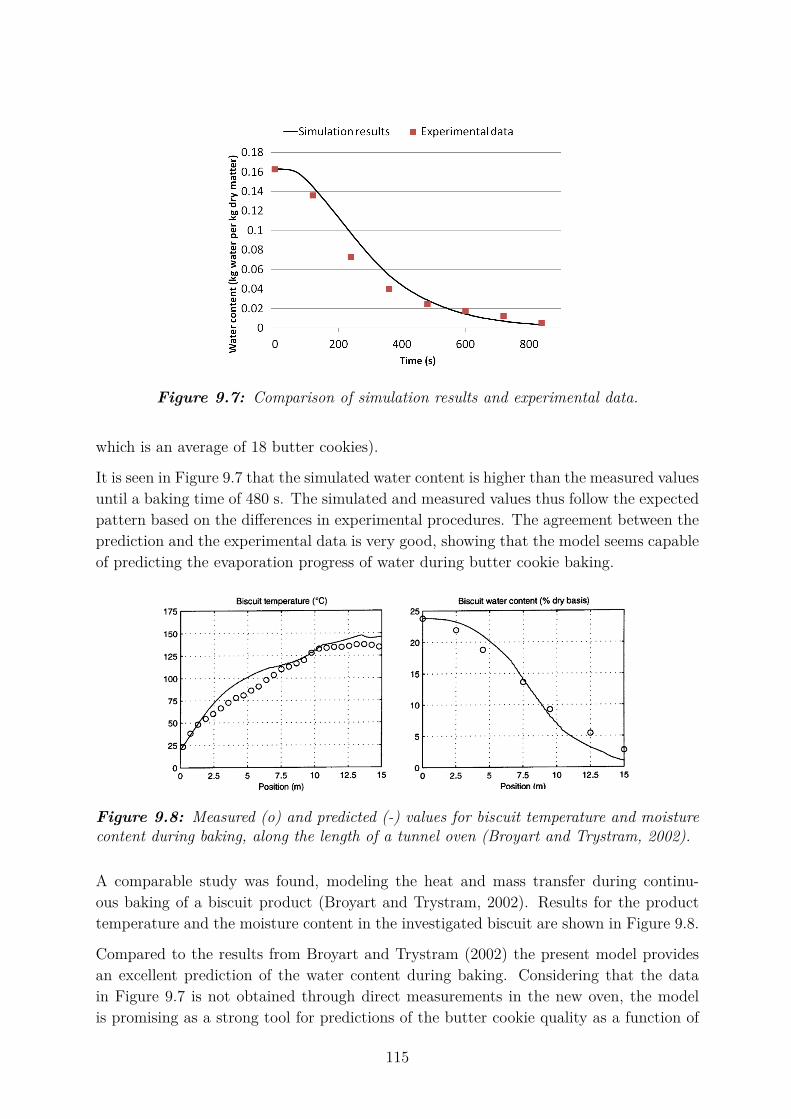
Figure 9.7: Comparison of simulation results and experimental data.
which is an average of 18 butter cookies).
It is seen in Figure 9.7 that the simulated water content is higher than the measured valuesuntil a baking time of 480 s. The simulated and measured values thus follow the expectedpattern based on the differences in experimental procedures. The agreement between theprediction and the experimental data is very good, showing that the model seems capableof predicting the evaporation progress of water during butter cookie baking.
Figure 9.8: Measured (o) and predicted (-) values for biscuit temperature and moisturecontent during baking, along the length of a tunnel oven (Broyart and Trystram, 2002).
A comparable study was found, modeling the heat and mass transfer during continu-ous baking of a biscuit product (Broyart and Trystram, 2002). Results for the producttemperature and the moisture content in the investigated biscuit are shown in Figure 9.8.
Compared to the results from Broyart and Trystram (2002) the present model providesan excellent prediction of the water content during baking. Considering that the datain Figure 9.7 is not obtained through direct measurements in the new oven, the modelis promising as a strong tool for predictions of the butter cookie quality as a function of
115

baking time.
9.4 Summary
The effect of the baking tray on the evaporation was investigated by changing the massflux from the bottom surface in butter cookie simulations. Besides the original set-updescribed in Chapter 8, two additional set-ups were simulated. The original set-up wassymmetrical with equal evaporation from all surfaces of the cookie. In the two additionalset-ups the evaporation from the bottom surface was 0% (C = 0.0) and 60% (C = 0.6) ofthe top and side surfaces, respectively.
The model was seen to give a qualitatively good representation of the baking process.Comparing the three set-ups it was concluded that the symmetrical set-up (C = 1.0),with equal evaporation from all surfaces is an acceptable description when heat and masstransfer inside the product is considered. The intermediate set-up (C = 0.6) with limitedevaporation from the bottom surface provided a slightly better over-all result comparedto the symmetrical case. The set-up with no evaporation from the bottom surface (C =0.0) did not give a good representation of the temperature development. When optimizedwith regard to the mass loss all three set-ups showed good agreement between simulationsand measurement data.
When the mass transfer parameters are optimized with regard to mass loss data, accept-able results for the temperature development are obtained with C = 1.0 and 0.6, but notfor C = 0.0. Calculations of the mass loss, based on parameters optimized with regardto the center temperature, do not render acceptable results in any of the three set-ups.Considering the measured product properties (center temperature and mass loss), opti-mization using the applied scheme should focus on reaching a good agreement betweenthe simulated and measured mass loss data.
Of the investigated set-ups C = 0.6 would be a good initial estimate for further improve-ment of the model. Similarly to the C = 0.0 set-up the bottom surface temperature washigher than at the top and side surfaces. This result is consistent with the higher degree ofbrowning observed on the bottom surface of the butter cookies. For simulations of waterevaporation modeling results, using C = 0.6, are good when compared to data which wasnot used in the parameter optimization.
The good agreement regarding the mass loss may be connected to the high diffusion coef-ficients. These will minimize the effect of the covered surface on the overall transport ofwater. The good agreement between the symmetrical simulation set-up and the experi-mental measurements indicates a small effect of the baking tray on the over-all mass loss.While further investigation of other characteristics of the product are needed, the centertemperature and total mass loss are not likely to be affected by baking on a perforatedor meshed baking tray, compared to the investigated steel sheet plate.
116

The complexity level of the model is kept relatively simple. The physico-chemical prop-erties are calculated from the dough composition and the transient water content. Themass loss is considered as a lumped process and the porosity is not included. Comparedto similar models used to simulate baking of biscuits the obtained simulation results aregood. Ferrari et al. (2012) do not obtain a similarly good agreement for the total massloss (Figure 9.2), but do get a good fit between the measured and calculated productcenter temperature. The model applied by Broyart and Trystram (2002) appears to reachcomparable agreement between measurements and simulations as the new model (Figure9.8).
More advanced models are primarily applied for cake and bread products. No generalmeasure for the error or quality of presented models have been found. Therefore it iscomplicated to evaluate modeling results for different products and models in relationto each other. Good results appear to be obtained by Purlis and Salvadori (2009) formodeling bread baking. The crust and crumb temperature as well as the moisture contentare calculated in close agreement with the presented measurements. This model includesan evaporation front moving through the product as it reaches 100◦C and influencingthe physical properties. Whether this could improve the description for the investigatedbutter cookies is difficult to evaluate from the simulations. It is likely that the additionalterms and assumptions needed to increase the physical resolution of the present modelwill in fact decrease its total accuracy.
The model presented by Zanoni et al. (1994) includes the surface partial pressure as a limitfor evaporation, evaporation is only assumed to take place from the free upper surface of abread product in a mold. However when comparing the experimental data the best fit forthe model with this assumption is obtained to data from a mold with a mesh structure.The model presented by Putranto et al. (2011) for baking of a thin layer of cake couldbe interesting for future comparison. While the highest applied baking temperature is160◦C and few measuring points are included, this model appears to give good simulationresults.
The results of my work show good agreement between the continuous measurements andthe FEM simulations. For future work the applicability of the model could be broadenedand refined in order to capture the full influence of the covered surfaces on the productproperties and quality. This could be implemented through additional optimization usingdata sets containing information such as surface browning.
117

118

Chapter 10
Discussion
In the following sections the results of the thesis are revised. The three main topicsrelated to the objectives are discussed. The topics are treated in the same order as theyare presented in the thesis.
10.1 Product and quality assessment methods
Based on a literature study, different methods for product quality assessment were re-viewed. A new method was investigated in-depth, and the methods selected for qualityassessment in the experimental work were presented. Based on the literature review themost frequently applied methods for quality assessment of biscuit products were meth-ods evaluating the appearance and the geometry of the product. For the purpose of thepresent work one of the most popular methods was selected along with another widelyapplied measurement: Surface browning and mass loss during baking. Assuming that allmass loss is due to evaporation the total mass loss can be used to calculate the watercontent in the final product. Additionally, the temperature of the product was measuredfor the purpose of model validation.
Drying is considered a good parameter for comparison between the simulation results andthe experimental data. The experimental procedure is straight forward. The method isnon-destructive and the cookie can be used for further evaluation after the weight measure-ments. The continuous weight measuring system in the new pilot oven was successfullyapplied in the project.
Evaluation of surface browning was performed in several of the baking experiments. Mea-suring the surface color is a fast, non-destructive, and intuitive way to evaluate bakeryproduct quality. It is a widely applied approach enabling comparison between differ-ent research studies (further references on studies applying surface color evaluation arepresented in Section 4.1.3).
Different methods for surface color measurements were used in the presented work: A
119

categorization, manual colorimeter measurements, extraction of L∗a∗b∗ values from digitalphotography, and image analysis using the VideometerLab system. Which method tochoose in future studies would depend on the purpose of the study.
The center temperature was measured for model validation. It is not as such a qualityparameter, but can be used to follow the physical development of the product duringbaking. The measurements were subject to a relatively high uncertainty and some mea-surements were discarded due to displacement of the temperature sensor. A more reliabletemperature measurement system with a better system to fixate the temperature sen-sors in the product would improve the certainty of these measurements. Such a systemwould preferably measure the temperature at one or several fixed positions in the product(Broyart and Trystram, 2003; Demirkol et al., 2006a; Ferrari et al., 2012; Feyissa et al.,2011).
The possibilities of a multi-spectral image analysis system for quality assessment of buttercookies have been investigated. The obtained results and the prospects of this methodwere discussed in relation to, and compared with, more traditional analytical methods.
The method was used to evaluate two different product quality aspects based on oneimage. Both the surface browning and the product water content were evaluated. Abenefit of the multi-spectral imaging method is that it has already shown promisingresults in assessment studies of other food products (Dissing et al., 2011; Daugaard et al.,2010; Clemmesen et al., 2012).
Good results were not only obtained for browning evaluation. The average water contentwas determined from the multi-spectral images with an absolute error of 0.22%. The goodresults for water content predictions are interesting. The option to use one measuringmethod for multiple quality assessments is relevant for online process control systems,and for this purpose the procedure is considered a promissing solution.
10.2 Construction and validation of the new batchoven
Two of the main objectives in this project were 1) the design and construction of a pilotbatch oven able to emulate continuous tunnel oven baking, and 2) validation of that oven.The oven was build to emulate continuous, convection baking and simultaneously allowfor product and process monitoring. The oven design, construction, and validation carrythe weight of the main hypothesis for the project, namely that it is possible to constructa pilot oven with the desired ability to emulate continuous baking processes. In orderto prove the hypothesis the first step was to design the oven in close collaboration withemployees from Haas-Meincke A/S, including their knowledge of the continuous ovens inthe design of the pilot oven. The main focus area of the new oven has been the convectivesystem.
120

A 10 m tunnel oven located at Haas-Meincke A/S’test bakery in Skovlunde, Denmark,was used for the validation work. The main purpose of the performed validation workwas to ensure that the batch oven is capable of providing a comparable air flow to thetunnel oven and to produce products similar to those baked in the tunnel oven. Thereforetwo stages of validation were carried out. The first focusing on the oven settings and thesecond on product quality. It was found that similar products were obtained in the twoovens covering a range of oven temperatures.
The purpose of the oven was to create an experimental platform and this influenced thedesign greatly. Controllable process settings include air velocity, air humidity, air temper-ature, flexibility regarding baking tray material, and movable air ducts with adjustabledistance to the baking tray. The weight of the baking tray is continuously measured, awindow for observation was installed, the air humidity, and temperature are continuouslylogged. Connections for sensors to measure the product temperature are also available.All the logged information is collected in the control computer for further data processing.
The batch oven was constructed to enable experimental work outside normal processingconditions. This was used to investigate the relation between changes in the air flow andthe product quality. The oven inlet air flow is adjustable at settings between 0 and 10.Setting 5 was calibrated to the tunnel oven in the validation process. Changes in the inletair flow were reflected in both browning and weight loss for butter cookies. When theinlet air flow was increased the degree of browning and mass loss were also increased. Theresults as such are expected, the ability of the oven to produce baking conditions thatresult in distinctive products is important to validate. The results are very promising forfuture quantitative studies of the connections between oven settings and bakery productquality.
From the literature study presented in Section 2.3 it is clear that few studies focusingon experimental baking equipment are available, especially concerning continuous bakingprocesses. Ovens combining all three aspects of the new pilot batch oven (controlledbaking environment, product monitoring, and emulating tunnel oven baking) were notfound elsewhere. Compared to experimental ovens described as a tool for model validationor constructed with the purpose of increasing understanding about baking processes, thenew pilot oven is unique. Considering published articles from the last two decades only oneoven is described focusing specifically on emulating continuous baking processes (Zareifardet al., 2006).
The oven described by Zareifard et al. (2006) appears to have been through a comprehen-sive validation process. The validation of that oven against continuous ovens is based onheat flux measurements, resulting in detailed information about the processes. A similarvalidation would be of great interest for the new batch oven. In the present case thefoundation for the validation was the product appearance, point-wise temperature mea-surements in the tunnel oven, and inlet air velocity measurements. In order to increasethe basis of the validation it would also be relevant to characterize additional tunnel ovensfor comparison.
121

Furthermore, a method to characterize the process conditions in the new oven wouldbe expansion of the current CFD simulations of the air flow. Simulations presented byFerrari et al. (2012) include a larger part of the oven chamber, allowing for simulationswhich combine the air flow and the heat and mass transfer modeling. CFD simulationsof full scale ovens will also enable a more thorough comparison of the expected bakingconditions. CFD simulations (both 2D and 3D) of the air flow in continuous ovens werepresented in Therdthai (2003, 2004b). The main challenge for such simulations is to findan appropriate level of simplification, both in relation to available computer power for thesimulation work and for the investigated process.
The oven presented in this project will provide new opportunities regarding process un-derstanding and options for product monitoring. Some work is still needed to improvethe design and functionality of the oven, in order to get the full benefit of the equipment.Especially incorporation of radiation heating and an air flow measuring system will con-tribute to the possibilities for further research. In this project the concept of the oven hasbeen proven to work and the results obtained in the oven have been used to validate andimprove a mathematical model of the baking process.
10.3 Modeling butter cookie baking
Two of the objectives for the project were directly linked to mathematical modeling.Firstly to describe the baking process through a mathematical model that can be solvednumerically, and secondly to apply experimental data from the new pilot oven to improvethe mathematical model. The second objective furthermore includes that the combinationof experimental data and modeling can increase knowledge and understanding of theinvestigated baking process.
The batch oven was designed and constructed as an experimental platform for validationof models, without the need for industrial experiments in a full scale industrial oven. Withrobust, applicable models, process planning and re-design of existing processes should befacilitated by minimizing trial-and-error experiments.
The modeling work presented in Chapters 7, 8, and 9 is based on the heat and masstransfer in a two dimensional system. The boundary conditions were chosen to matchthe investigated process. The heat transfer boundary conditions included a term forevaporation of water when a specified temperature is reached. The mass transfer boundaryconditions were equal to zero, until the evaporation temperature was reached, hereafterthe evaporation was determined by a constant mass transfer coefficient and the gradientbetween the water content in the product and the water content in the surrounding air.
122

10.3.1 Modeling results
The simulation results showed good agreement with the measured data. The resultsindicate that the model can be used to predict the temperature and water content in buttercookies baked in the new batch oven. The investigated set-up with a 60% evaporationrate from the bottom surface compared to the top and side surfaces (C = 0.6) resulted inexcellent simulation results for both the temperature and the mass loss. The deviationsfor the temperature simulations were small, within one standard deviation compared tothe measurements, and the simulation results were in good agreement with the mass lossdata.
The model was not only applied on the data to which it was fitted. Applying the modelto prediction of evaporation for a new data set provided accurate results. The modelingresults in this work are good when compared qualitatively to predictions in other publishedstudies on modeling of biscuits products baked in continuous ovens.
Compared to similar studies the obtained simulations resulted in as good or better agree-ment between experimental data and calculated values. Works including more advancedmodels did not necessarily give better results than those obtained with the relative simplemodel in this study (Purlis and Salvadori, 2009; Thorvaldsson and Janestad, 1999; Lostieet al., 2004). Addition of more physical terms, such as the porosity or an evaporationfront through the product, would be interesting to investigate. However, it is possiblethat the determination of such values or terms would complicate the model unnecessarilydue to increased parameter uncertainty. Before additional terms are added to the modelits robustness should be validated against additional experimental data including varyingprocess conditions.
In the present model much attention was placed on the properties determining the masstransfer properties. The mass transfer and the diffusion coefficients were initially esti-mated from work presented by Demirkol et al. (2006b). The initial mass transfer coeffi-cient was calculated from an equation given in Demirkol et al. (2006b) and experimentaldata from the investigated process. The initial average mass transfer coefficient was notfar from the optimized values. The average mass transfer value presented in the reference,when baking at 190◦C and with forced convection, was in the lower end of the optimizedrange of mass transfer coefficients found in the present study. Sakin-Yilmazer et al. (2012)also use the work from Demirkol et al. (2006b) to estimate mass transfer coefficients, com-bined with experimental or estimated values. Their values are differentiated across thecake surface taking the mold into account. The values found in their study are generallyhigher than the values for the butter cookies, which can be explained by the differentwater content in the products. The simulation results obtained by Sakin-Yilmazer et al.(2012) describe the progress of the baking process, but there is no description of attemptsto optimize the applied mass transfer parameters in order to improve the fit. The masstransfer coefficient depends both on the composition of the product and highly on theprocess conditions. From the equation given by Demirkol et al. (2006b) continuous mass
123

loss measurements and knowledge of the product geometry is considered a good way todetermine the mass transfer coefficient.
The diffusion coefficient was not directly calculated in the present work. The initial es-timate was based on results presented by Demirkol et al. (2006b). However, the finalvalue was found to be much closer to the value presented by Hadiyanto et al. (2007) forwater vapor transport in biscuit products. The phase transition of water from liquid tovapor is only explicitly considered in the boundary conditions for the outer surfaces. Thediffusion coefficient cannot be easily measured inside the product. Thus the values for thisparameter are fitted to the experimental data. The obtained values indicate that a largefraction of the water is present as vapor inside the product. In the study of the influenceof the baking tray on mass transfer it is seen that all the obtained optimum values forthe diffusion coefficient are very similar (Table 9.1), also they are slightly higher thanthe value presented by Hadiyanto et al. (2007) for water vapor diffusion. The high diffu-sion coefficients, combined with the simulation of the moisture distribution in the buttercookies (Figure 9.6), indicate that there is almost no concentration gradient through theproduct. For larger products such as bread or thick biscuits such gradients have beendetermined experimentally (Ferrari et al., 2012; Thorvaldsson and Skjoldebrand, 1998;Wagner et al., 2008). The investigated cookies are thin compared to these products, andmoisture gradients will be difficult to detect during or after baking due to the uniformnature of the product and its small dimensions.
The consideration of increasing the complexity of the model is two fold. An acceptablemodel must have a sufficient level of detail to describe the investigated process. Also themodel must be possible to apply for different products and at different process conditionswith a minimum of adjustments and additional measurements. The model presented inthis work appears to have a sufficient level of complexity to calculate the investigatedproperties for the process of interest. Changes such as the differentiated mass flux wasshown to slightly increase the accuracy of the model. Based on the current knowledgeand level of model validation no further increase in complexity is suggested before themodel is assessed against other products and processing conditions.
124

Chapter 11
Conclusions
The initial research question creating the foundation for the present work was: How doprocess conditions influence characteristics of products during baking in a continuous,convection tunnel oven? This question is very broad and impossible to answer completelyin one PhD project. What has been answered in this project is a part of this question,based on the project hypothesis. The test of the hypothesis has two parts: 1) verifyingthat a pilot batch oven can emulate production in a continuous tunnel oven, and 2) theexperimental data obtained in the oven can be used to increase understanding of theinvestigated baking process through mathematical modeling.
The two parts of the hypothesis were studied through a number of specific objectivescarried out in the project. The first two objectives were focused on the design, construc-tion, and validation of the new pilot batch oven. The results obtained with the oven arepromising. Some work is still needed with regard to construction and modification of theoven, a flow measuring system and radiation heating should be included in the designto increase the functionality of the oven. While additional validation experiments couldimprove the verification of the ovens abilities, the conclusion so far is that the oven is ca-pable of emulating continuous baking processes. It is capable of reproducing a convectivebaking environment and produce a product quality comparable to that from a convectiontunnel oven at similar processing conditions. The option of changing the air velocity wasinvestigated, with the purpose of ensuring that the available range is sufficient to obtainsignificant changes in the investigated product. This was confirmed, as both the degreeof browning and water content were found to vary depending on the inlet air velocity.
After verifying that the batch oven is indeed able to emulate continuous tunnel oven bakingthe second part of the hypothesis was investigated. This part is related to the third andfourth project objectives. A mathematical model was formulated describing the heat andmass transfer during baking of butter cookies. The model was solved numerically by FEM,and parameters, which were not directly available, were optimized against experimentaldata from the batch oven. The model was found to give excellent simulations of the heatand mass transfer in the butter cookies.
125

The model was further used to examine the effect of the baking tray on the evaporationfrom the butter cookies. The results showed that while the baking tray is likely to reducethe evaporation from the bottom surface, it is not correct to assume that no evaporationtakes place at the covered surface. The influence of the baking tray on the browningwas not directly investigated, but increased temperature was seen at this surface in thesimulation results. From the large number of mass transfer parameter optimizationsincluded in the modeling work, it was found that the optimum diffusion coefficients were ofsimilar magnitude. They were all within the range of water vapor diffusion coefficients forbiscuits found in published studies. This information indicates that the main mechanismof water transport in the butter cookies is water vapor diffusion and that this is a rapidprocess. The consequence of the high diffusion coefficient is a small moisture gradientthrough the product. This corresponds well to the uniform structure of the final productand is interesting in relation to understanding the product development process.
One final objective was added because of a severe delay in production of the batch oven.This objective is related to reviewing and investigating quality assessment methods appliedfor bakery products. From the review it was found that the most widely used assessmentmethods are the surface browning, the geometry of the product, and the changes in watercontent. A new visual quality assessment method was studied in-depth. The multi-spectral vision system enables simultaneous evaluation of the surface browning and thewater content. An automated system based on the presented framework would present apromising system for automated online quality control. The limitation for the system isthe need for calibration to each new product.
The work carried out in this project has improved the possibilities for understanding andresearching continuous tunnel oven baking. From the project results the project hypothesishas been validated. A better understanding of the influence of the process conditions andbaking equipment on the product quality has been obtained through experiments andmathematical modeling.
126

Chapter 12
Future perspectives
The baking industry is highly energy intensive. It is a big industry with a high productflow. Cost savings in either energy consumption or by increasing the production capacityare therefore important competitive parameters. The work presented in this project mayhelp two different operators in the baking industry, being the product manufacturer andthe oven manufacturer.
It has been shown that models can reproduce and predict the performance of baking inthe batch oven. This knowledge has the potential to be used for control and optimizationof existing processes as well as design of new baking equipment. From the present workboth the empirical response surface model based on multi-spectral image analysis (section4.3) and the more advance physical based mathematical model (Chapter 7) could be usedby biscuit or oven manufacturers. Models can be used to find the optimum combinationof process conditions for a specific product. Using modeling work it is possible that aoptimum product quality could be obtained with a shorter baking time or lower oventemperature than used today.
For the baking industry it is important to know which quality aspects are relevant andhow they are best evaluated. For a production facility looking for an online quality controlsystem, a multi-spectral image analysis method is expected to be a good solution basedon our results.
Even though the main focus of the baking industry is to produce savory products, moreand more focus is put on health issues such as acrylamide1 formation in bakery products.By studying the combination of drying, surface temperature, and browning, predictionsfor the amount of produced acrylamide can be obtained from knowledge of its formationprocess (Ahrne et al., 2007; Zhang and Zhang, 2007; De Vleeschouwer et al., 2008).
The oven manufacturer has been in focus from the beginning of the project. Emphasishas been on the process to product interactions, the design of tunnel ovens, and thepossibilities of improving oven design. The pilot batch oven can be used to investigate
1Carcinogenic product in the Maillard reactions.
127

new oven design. For example the distance between the inlet air nozzles and the productmight be optimized. A higher air flow may increase the heat transfer, and thereby enablea shorter baking time. Experimental work, followed by modeling, as demonstrated in thisproject, is now possible. This can be further exploited with the new oven.
For successful optimization all aspects discussed in this project are important, both themechanical construction of pilot scale equipment and the mathematical modeling. Soundexperimental settings providing controlled experimental conditions are needed. Robustmodels, describing the process, validated against the experiments are desirable. Fromthese a modeling environment can be developed, minimizing the need for trial-and-error,and facilitating the process and product optimization.
128

Bibliography
AACC (2012). AACC, www.aaccnet.org, July 2012.
Abdel-Samie, M. A.-S., Wan, J., Huang, W., Chung, O. K., and Xu, B. (2010). Effects ofCumin and Ginger as Antioxidants on Dough Mixing Properties and Cookie Quality.Cereal Chemistry, 87(5):454–460.
Ahrne, L., Andersson, C., Floberg, P., Rosen, J., and Lingnert, H. (2007). Effect ofcrust temperature and water content on acrylamide formation during baking of whitebread: Steam and falling temperature baking. LWT - Food Science and Technology,40(10):1708–1715.
Akingbala, J. O., Falade, K. O., and Ogunjobi, M. A. (2011). The Effect of Root Maturity,Preprocess Holding and Flour Storage on the Quality of Cassava Biscuit. Food andBioprocess Technology, 4:451–457.
Allrecipes.com (2012). allrecipes.com, www.allrecipes.com/recipe/bills-sausage-gravy,July 22nd, 2012.
Arogba, S. S. (2002). Quality characteristics of a model biscuit containing processedmango (Mangifera Indica) kernel flour. International Journal of Food Properties,5(2):249–260.
Baik, O. (2000). Cake baking in tunnel type multi-zone industrial ovens Part II. Evalua-tion of quality parameters. Food Research International, 33(7):599–607.
Baik, O. and Marcotte, M. (2003). Modeling the moisture diffusivity in a baking cake.Journal of Food Engineering, 56(1):27–36.
Bettge, A. D. and Kweon, M. (2009). Collaborative Study on Updated Method 10-52:Baking Quality of Cookie Flour-Micro Method (Sugar-Snap Cookie). Cereal FoodsWorld, 54(2).
Bird, R., Stewart, W., and Lightfoot, E. (2002). Transport Phenomena. Wiley Interna-tional edition. John Wiley & Sons.
Boulet, M., Marcos, B., Dostie, M., and Moresoli, C. (2010). CFD modeling of heattransfer and flow field in a bakery pilot oven. Journal of Food Engineering, 97(3):393–402.
129

Bourne, M. (2004). Relation between texture and mastication. Journal of Texture Studies,35(2):125–143.
Broyart, B. and Trystram, G. (2002). Modelling heat and mass transfer during thecontinuous baking of biscuits. Journal of Food Engineering, 51(1):47–57.
Broyart, B. and Trystram, G. (2003). Modelling of heat and mass transfer phenomena andquality changes during continuous biscuit baking using both deductive and inductive(neural network) modelling principles. Trans IChemE, 81(December):316–326.
Broyart, B., Trystram, G., and Duquenoy, A. (1998). Predicting Colour Kinetics DuringCracker Baking. Journal of Food Engineering, 35:351–368.
Capuano, E., Ferrigno, A., Acampa, I., Ait-Ameur, L., and Fogliano, V. (2008). Char-acterization of the Maillard reaction in bread crisps. European Food Research andTechnology, 228(2):311–319.
Carson, J., Willix, J., and North, M. (2006). Measurements of heat transfer coefficientswithin convection ovens. Journal of Food Engineering, 72(3):293–301.
Carstensen, J. M., Hansen, M. E., Lassen, N. K., and Hansen, P. W. (2006). Creatingsurface chemistry maps using multispectral vision technology. In 9th Medical ImageComputing and Computer Assisted Intervention (MICCAI). IMM-Technical Report-2006-17.
Cauvain, S. and Young, L. (2006). Baked Products: Science, Technology And Practice.Blackwell Pub.
Cauvain, S. and Young, L. (2007). Technology of Breadmaking. Springer.
Chen, H. (1999). Modeling coupled heat and mass transfer for convection cooking ofchicken patties. Journal of Food Engineering, 42(3):139–146.
Chevallier, S. (2002). Structural and Chemical Modifications of Short Dough DuringBaking. Journal of Cereal Science, 35(1):1–10.
Choi, Y. and Okos, M. R. (1986). Effects of temperature and composition on the thermalproperties of foods, chapter 9, pages 93–101. Food Engineering and Process Appli-cations: Proceedings of the Fourth International Congress on Engineering and FoodHeld Between 7 and 10 July at Edmonton, Alberta, Canada. Elsevier Applied SciencePublishers.
Clemmesen, L. H., Dissing, B. S., Hyldig, G., and Løje, H. (2012). Multispectral Imagingof Wok-Fried Vegetables. Journal of Imaging Science and Technology, 56.
COMSOL (2012). COMSOL A/S, www.comsol.dk.
Dansk Standard (2011). "ds/en iso 11664-4 kolorimetri - del 4: L*a*b* - farverum ihenhold til cie 1976". Technical report, ISO.
130

Datta, A. K. (2008). Status of Models in the Design of Food Products , Processes , andEquipment. Comprehensive Reviews in Food Science and Food Safety, 7:121–129.
Daugaard, S. B., Adler-Nissen, J., and Carstensen, J. M. (2010). New vision technologyfor multidimensional quality monitoring of continuous frying of meat. Food Control,21(5):626–632.
Davidek, T. and Davidek, J. (2004). Chemistry of the maillard reaction in foods. InTomasik, P., editor, Chemical and Functional Properties of Food Saccharides, Chemicaland Functional Properties of Food Components Series, page Chp. 18. CRC Press.
De Vleeschouwer, K., Van der Plancken, I., Van Loey, A., and Hendrickx, M. E.(2008). Investigation of the influence of different moisture levels on acrylamide for-mation/elimination reactions using multiresponse analysis. Journal of agricultural andfood chemistry, 56(15):6460–70.
Demirkol, E., Erdogdu, F., and Palazoglu, T. K. (2006a). A Numerical Approach withVariable Temperature Boundary Conditions to Determine the Effective Heat Trans-fer Coefficient Values During Baking of Cookie. Journal of food Process Engineering,29:478–497.
Demirkol, E., Erdogdu, F., and Palazoglu, T. K. (2006b). Analysis of mass transferparameters (changes in mass flux, diffusion coefficient and mass transfer coefficient)during baking of cookies. Journal of Food Engineering, 72(4):364–371.
Demirkol, E., Erdogdu, F., and Palazoglu, T. K. (2006c). Experimental determination ofmass transfer coefficient: moisture content and humidity ratio driving force approachesduring baking. Journal of Food Process Engineering, 29(2):188–201.
Dissing, B. S., Ersbøll, B. K., and Adler-Nissen, J. (2009). Monitoring water contentusing multispectral imaging and nir in a minced. In Abstract from 14th InternationalConference on Near Infrared Spectroscopy (NIR 2009), Bangkok, Thailand.
Dissing, B. S., Nielsen, M. E., Ersbøll, B. K., and Frosch, S. (2011). Multispectral imagingfor determination of astaxanthin concentration in salmonids. PloS one, 6(5):e19032.
Edwards, W. (2007). The Science of Bakery Products. Rsc Paperbacks Series. RoyalSociety of Chemistry.
Fahloul, D., Trystram, G., Duquenoy, A., and Barbotteau, I. (1994). Modeling Heatand Mass-Transfer in Band Oven Biscuit Baking. Lebensmittel-Wissenschaft und -Technologie, 27:119–124.
Fehaili, S., Courel, M., Rega, B., and Giampaoli, P. (2010). An instrumented oven forthe monitoring of thermal reactions during the baking of sponge cake. Journal of FoodEngineering, 101(3):253–263.
131

Ferrari, E., Marai, S. V., Guidetti, R., and Piazza, L. (2012). Modelling of Heat andMoisture Transfer Phenomena During Dry Biscuit Baking by Using Finite ElementMethod. International Journal of Food Engineering, 8(3).
Feyissa, A. (2011). Robust Modelling of Heat and Mass Transfer in Processing of SolidFoods. Phd thesis, DTU National Food Institute, Technical University of Denmark.
Feyissa, A. H., Gernaey, K. V., and Adler-Nissen, J. (2012). Uncertainty and sensitivityanalysis: Mathematical model of coupled heat and mass transfer for a contact bakingprocess. Journal of Food Engineering, 109(2):281–290.
Feyissa, A. H., Gernaey, K. V., Ashokkumar, S., and Adler-Nissen, J. (2011). Modellingof coupled heat and mass transfer during a contact baking process. Journal of FoodEngineering, 106(3):228–235.
Goldstein, A. and Seetharaman, K. (2011). Effect of a novel monoglyceride stabilizedoil in water emulsion shortening on cookie properties. Food Research International,44(5):1476–1481.
Grenier, D., Vanin, F., and Lucas, T. (2008). Multiphysics During Bread Making :Numerical Modelling and Technological Teachings from Simulations. In ISHS ActaHorticulturae 802: IV International Symposium on Applications of Modelling as anInnovative Technology in the Agri-Food-Chain: Model-IT, pages 147–154.
Grizotto, R. K., Rufi, C. R. G., Yamada, E. A., and Vicente, E. (2010). Evaluation ofthe quality of a molded sweet biscuit enriched with okara flour. Ciência e Tecnologiade Alimentos, 30:270–275.
Haas Meincke A/S (2012). Haas-Meincke, www.haas.com.
HadiNezhad, M. and Butler, F. (2009a). Association of Glutenin Subunit Compositionand Dough Rheological Characteristics with Cookie Baking Properties of Soft WheatCultivars. Cereal Chemistry, 86(3):339–349.
HadiNezhad, M. and Butler, F. (2009b). Effect of flour type and dough rheological prop-erties on cookie spread measured dynamically during baking. Journal of Cereal Science,49(2):178–183.
Hadiyanto, Asselman, A., Straten, G. V., Boom, R., Esveld, D., and Boxtel, A. V. (2007).Quality prediction of bakery products in the initial phase of process design. InnovativeFood Science & Emerging Technologies, 8(2):285–298.
Hong, S. W., Yan, Z. Y., Otterburn, M. S., and McCarthy, M. J. (1996). Magnetic reso-nance imaging (MRI) of a cookie in comparison with time-lapse photographic analysis(TLPA) during baking process. Magnetic Resonance Imaging, 14(7/8):923–927.
Huang, H., Lin, P., and Zhou, W. (2007). Moisture transport and diffusive instabilityduring bread baking. Siam Journal of Applied Mathematics, 68(1):222–238.
132

HunerLab (2012). HunterLab, www.hunterlab.com/appnotes/an07_96a.pdf, June 7,2012.
Jacob, J. and Leelavathi, K. (2007). Effect of fat-type on cookie dough and cookie quality.Journal of Food Engineering, 79(1):299–305.
Jensen, B., Friis, A., and Adler-Nissen, J. (2003). Hygienic Design of Closed ProcessingEquipment by use of Computational Fluid Dynamics. BioCentrum-DTU.
Jensen, B. B., Lennox, M., Granby, K., and Adler-Nissen, J. (2008). Robust modellingof heat-induced reactions in an industrial food production process exemplified by acry-lamide generation in breakfast cereals. Food and Bioproducts Processing, 86(3):154–162.
Kweon, M., Slade, L., and Levine, H. (2011). Development of a Benchtop Baking Methodfor Chemically Leavened Crackers. I. Identification of a Diagnostic Formula and Pro-cedure. Cereal Chemistry, 88(1):19–24.
Latimer, H. L. and Watts, A. S. (1936). The influence of drying treatment and biscuitstorage atmosphere on the physical properties of a semiporcelain body. Journal of theAmerican ceramic society, 19:121–126.
Lostie, M., Peczalski, R., and Andrieu, J. (2004). Lumped model for sponge cake bakingduring the "crust and crumb" period. Journal of Food Engineering, 65(2):281–286.
Lostie, M., Peczalski, R., Andrieu, J., and Laurent, M. (2002a). Study of sponge cakebatter baking process . Part I : Experimental data. Journal of Food Engineering,51:131–137.
Lostie, M., Peczalski, R., Andrieu, J., and Laurent, M. (2002b). Study of sponge cakebatter baking process. II. Modeling and parameter estimation. Journal of Food Engi-neering, 55(4):349–357.
Maache-Rezzoug, Z., Bouvier, J.-M., Allaf, K., and Patras, C. (1998). Effect of PrincipalIngredients on Rheological Behaviour of Biscuit Dough and on Quality of Biscuits.Journal of Food Engineering, 35:23–42.
Mamat, H., Abu Hardan, M. O., and Hill, S. E. (2010). Physicochemical properties ofcommercial semi-sweet biscuit. Food Chemistry, 121(4):1029–1038.
Manley, D. (1998a). Biscuit, Cookie, and Cracker Manufacturing, Manual 2: Doughs.Number vb. 1 in Biscuit, Cookie and Cracker Manufacturing Manuals. Woodhead.
Manley, D. (1998b). Biscuit Packaging and Storage. Number vb. 6 in Biscuit, Cookie andCracker Manufacturing Manuals. Woodhead.
Manley, D. J. R. (2011). Manley’s Technology of Biscuits, Crackers and Cookies. Wood-head Publishing Series in Food Science, Technology and Nutrition. Woodhead Publish-ing, 4th edition.
133

Manohar, R. S., Rao, P. H., Manohar, R. S., and Rao, P. H. (1999). Effect of mixingmethod on the rheological characteristics of biscuit dough and the quality of biscuits.European Food Research and Technology, 210(1):43–48.
Marcroft, H. E., Chandrasekaran, M., and Karwe, M. V. (1999). Flow field in a hot airjet impingement oven - part II: Multiple impingement jets. Journal of food processingpreservation, 23(732):235–248.
Markowski, M. (1997). Air Drying of vegetables: evaluation of mass transfer coefficient.Journal of Food Engineering, 34:55–62.
Martinez-Navarrete, N., Moraga, G., Talens, P., and Chiralt, A. (2004). Water sorp-tion and the plasticization effect in wafers. International Journal of Food Science andTechnology, 39(5):555–562.
Martins, R. C., Lopes, V. V., Vicente, A. A., and Teixeira, J. A. (2008). NumericalSolutions: Finite Element and Finite Volume Methods, pages 1–13. ContemporaryFood Engineering. CRC Press.
McFarlane, I. (2006). Control of final moisture content of food products baked in contin-uous tunnel ovens. Measurement Science and Technology, 17(2):241–248.
McGee, H. (2004). On Food and Cooking: The Science and lore of the Kitchen. Scribner.
Mills, A. (1995). Basic heat and mass transfer. The Richard D. Irwin series in heattransfer. Irwin.
Mills, E., Wilde, P., Salt, L., and Skeggs, P. (2003). Bubble formation and stabilizationin bread dough. Food and Bioproducts Processing, 81(3):189 – 193.
Mirade, P., Daudin, J., Ducept, F., Trystram, G., and Clement, J. (2004). Characteriza-tion and CFD modelling of air temperature and velocity profiles in an industrial biscuitbaking tunnel oven. Food Research International, 37(10):1031–1039.
Mochizuki, Y. (2001). Texture Profile Analysis. Current Protocols in Food AnalyticalChemistry. John Wiley and Sons, Inc.
Møller, C. G. (2012). The influence of temperature and humidity during baking on thequality of swiss roll cakes. Bachelor Thesis, Technical University of Denmark, NationalFood Institute.
Monaci, L., Brohée, M., Tregoat, V., and van Hengel, A. (2011). Influence of baking timeand matrix effects on the detection of milk allergens in cookie model food system byELISA. Food Chemistry, 127(2):669–675.
Mondal, A. and Datta, A. K. (2008). Bread baking - A review. Journal of Food Engi-neering, 86(4):465–474.
134

Mondal, A. and Datta, A. K. (2010). Two-dimensional CFD modeling and simulation ofcrustless bread baking process. Journal of Food Engineering, 99(2):166–174.
Mondal, A. and Datta, A. K. (2011). Investigation of the Process Parameters UsingResponse Surface Methodology on the Quality of Crustless Bread Baked in a Water-Spraying Oven. Journal of Food Process Engineering, 34(6):1819–1837.
Mowbray, W. R. (1981). Technology of the "hot box". Food Manufacture, 56(10):27–30.
Ni, H. and Datta, A. (1999). Heat and moisture transfer in baking of potato slabs. DryingTechnology, 17(10):2069–2092.
Nishio, Z., Oikawa, I. H., Haneda, I. T., Seki, I. M., Tabiki, T., Yamauchi, I. H., andMiura, H. (2009). Influence of Amylose Content on Cookie and Sponge Cake Qualityand Solvent Retention Capacities in Wheat Flour. Cereal Chemistry, 86(3):313–318.
Nitin, N. and Karwe, M. V. (2001). Heat transfer coefficient for cookie shaped objects ina hot air jet impingement oven. Journal of Food Process Engineering, 24:51–69.
Olszewski, E. A. (2006). From baking a cake to solving the diffusion equation. AmericanJournal of Physics, 74(6):502.
Orograin Bakeries Products, Inc. (2012). Thomas’ English Muffins,www.thomasbagels.com, July 22nd, 2012.
Ousegui, A., Moresoli, C., Dostie, M., and Marcos, B. (2010). Porous multiphase ap-proach for baking process - explicit formulation of evaporation rate. Journal of FoodEngineering, 100(3):535–544.
Özboy Özbas, O., Seker, I. T., and Gökbulut, I. (2010). Effects of resistant starch, apricotkernel flour, and fiber-rich fruit powders on low-fat cookie quality. Food Science andBiotechnology, 19(4):979–986.
Ozturk, S., Ozbas, O. O., Javidipour, I., and Koksel, H. (2009). Effects of zero-transinteresterified and non-interesterified shortenings and brewer’s spent grain on cookiequality. Journal of Food Lipids, 16:297–313.
Pace, M., De Bonis, M. V., Marra, F., and Ruocco, G. (2011). Characterization of acombination oven prototype: Effects of microwave exposure and enhanced convectionto local temperature rise in a moist substrate. International Communications in Heatand Mass Transfer, 38(5):557–564.
Pareyt, B., Brijs, K., and Delcour, J. A. (2010). Impact of Fat on Dough and CookieProperties of Sugar-Snap Cookies. Cereal Chemistry, 87(3):226–230.
Pareyt, B. and Delcour, J. a. (2008). The role of wheat flour constituents, sugar, and fatin low moisture cereal based products: a review on sugar-snap cookies. Critical reviewsin food science and nutrition, 48(9):824–39.
135

Pedersen, S. (2009). Baking consultant, personal communication.
Perkins (2012). Baker Perkins, "Baker Perkins in the bakery industry", www.bphs.net,July 24nd, 2012.
Perrot, N., Trystram, G., Le Guennec, D., and Guely, F. (1996). Sensor Fusion for RealTime Quality Evaluation of Biscuit during Baking. Comparison between Bayesian andFuzzy Approaches. Journal of Food Engineering, 29:301–315.
Ploteau, J. P., Nicolas, V., and Glouannec, P. (2012). Numerical and experimental char-acterization of a batch bread baking oven. Applied Thermal Engineering, 48.
Pomeranz, Y. and Shellenberger, J. (1971). Bread science and technology. (Avi Books).Avi Pub. Co.
Purlis, E. (2010). Browning development in bakery products - a review. Journal of FoodEngineering, 99(3):239–249.
Purlis, E. (2011). Bread baking: Technological considerations based on process modellingand simulation. Journal of Food Engineering, 103(1):92–102.
Purlis, E. (2012). Baking process design based on modelling and simulation: Towardsoptimization of bread baking. Food Control, 27(1):45–52.
Purlis, E. and Salvadori, V. O. (2007). Bread browning kinetics during baking. Journalof Food Engineering, 80(4):1107–1115.
Purlis, E. and Salvadori, V. O. (2009). Bread baking as a moving boundary problem.Part 1: Mathematical modelling. Journal of Food Engineering, 91(3):428–433.
Putranto, A., Chen, X. D., and Zhou, W. (2011). Modeling of baking of thin layer of cakeusing the lumped reaction engineering approach (L-REA). Journal of Food Engineering,105(2):306–311.
Rathore, M. and Kapuno, R. (2011). Engineering Heat Transfer. Jones & Bartlett Learn-ing.
Romani, S., Balestra, F., Angioloni, A., Rocculi, P., and Rosa, M. D. (2012). Physico-chemical and electronic nose measurements on the study of Biscuit Baking kinetics.Italian Journal of Food Science2, 24:32–41.
Sablani, S., Marcotte, M., Baik, O., and Castaigne, F. (1998). Modeling of SimultaneousHeat and Water Transport in the Baking Process. LWT - Food Science and Technology,31(3):201–209.
Saha, S., Gupta, A., Singh, S., Bharti, N., Singh, K., Mahajan, V., and Gupta, H. (2011).Compositional and varietal influence of finger millet flour on rheological properties ofdough and quality of biscuit. LWT - Food Science and Technology, 44(3):616–621.
136

Sakin, M., Kaymak-Ertekin, F., and Ilicali, C. (2007a). Modeling the moisture transferduring baking of white cake. Journal of Food Engineering, 80(3):822–831.
Sakin, M., Kaymak-Ertekin, F., and Ilicali, C. (2007b). Simultaneous heat and masstransfer simulation applied to convective oven cup cake baking. Journal of Food Engi-neering, 83(3):463–474.
Sakin, M., Kaymak-Ertekin, F., and Ilicali, C. (2009). Convection and radiation combinedsurface heat transfer coefficient in baking ovens. Journal of Food Engineering, 94(3-4):344–349.
Sakin-Yilmazer, M., Kaymak-Ertekin, F., and Ilicali, C. (2012). Modeling of simultane-ous heat and mass transfer during convective oven ring cake baking. Journal of FoodEngineering, 111(2):289–298.
Sarkar, A. and Singh, R. P. (2003). Spatial Variation of Convective Heat Transfer Coef-ficient in Air Impingement Applications. Journal of Food Science, 68(3):910–916.
Savoye, I., Trystram, G., Brunet, P., and Marchin, F. (1992). Heat and Mass TransferDynamic Modelling of an Indirect Biscuit Baking Tunnel-Oven . Part I : ModellingPrinciples. Food Engineering, 16:173–196.
Seker, I. T., Özboy Özbas, O., Gökbulut, I., Öztürk, S., and Köksel, H. (2009). Ef-fects of Fiber-rich Apple and Apricot Powders on Cookie Quality. Food Science andBiotechnology2, 18(4):948–953.
Senter, J. and Solliec, C. (2007). Flow field analysis of a turbulent slot air jet impingingon a moving flat surface. International Journal of Heat and Fluid Flow, 28(4):708–719.
Sindhuja, A., Sudha, M. L., and Rahim, A. (2005). Effect of incorporation of amaranthflour on the quality of cookies. European Food Research and Technology, 221(5):597–601.
Singh, R. and Heldman, D. (2009). Introduction to Food Engineering. Food Science andTechnology Series. Academic Press.
Skaarup, B. (2011). Bag brødet: dansk brød og bagning gennem 6.000 år. Gyldendal.
Sommier, A., Anguy, Y., Dumoulin, E., Rojas, J., and Vignolle, M. (2011). On the useof combined heat flux measurements and image analysis procedures for the change ofscale between industrial and pilot ovens. Procedia Food Science, 1(Icef 11):1165–1172.
Sommier, A., Chiron, H., Colonna, P., Valle, G. D., and Rouillé, J. (2005). An in-strumented pilot scale oven for the study of french bread baking. Journal of FoodEngineering, 69(1):97 – 106.
Sommier, A., Dumoulin, E., Douiri, I., and Chipeau, C. (2012). Characterization of spongecake baking in an instrumented pilot oven. International Journal of Food Studies, 1(2).
137

Starbucks (2012). Starbucks, www.starbucks.com/menu/food/bakery, July 22nd, 2012.
Sterner, D., Sundén, B., and Skjöldebrand, C. (2002). Predictive modelling of heat andmass transfer in hamburger patties. In Seventh International Conference on AdvancedComputational Methods in Heat Transfer. Heat Transfer VII ., pages 283 – 292.
Stevenson, S. G., Fok, P. Y., and Edwards, N. M. (2010). Evaluating Sugar-Snap CookieQuality Using Digital Image Analysis. Cereal Chemistry, 87(2):137–140.
Texture Technologies (2012). Texture Technologies Corp, www.texturetechnologies.com.
The Guardian (2012). The Guardian, www.guardian.co.uk/lifeandstyle/2012/jun/06/crunch-time-britain-loves-biscuits, July 22nd, 2012.
Therdthai, N. (2003). Two-dimensional CFD modelling and simulation of an industrialcontinuous bread baking oven. Journal of Food Engineering, 60(2):211–217.
Therdthai, N. (2004a). Simulation of starch gelatinisation during baking in a travelling-tray oven by integrating a three-dimensional CFD model with a kinetic model. Journalof Food Engineering, 65(4):543–550.
Therdthai, N. (2004b). Three-dimensional CFD modelling and simulation of the tem-perature profiles and airflow patterns during a continuous industrial baking process.Journal of Food Engineering, 65(4):599–608.
Thorvaldsson, K. and Janestad, H. (1999). A model for simultaneous heat, water andvapour diffusion. Journal of Food Engineering, 40(3):167–172.
Thorvaldsson, K. and Skjoldebrand, C. (1998). Water Diffusion in Bread During Baking.Lebensmittel-Wissenschaft und-Technologie, 31:658–663.
Tijskens, L., Hertog, L., and Nicolaï, B. (2001). Food Process Modelling. WoodheadPublishing Series in Food Science and Technology. Woodhead.
Trystram, G. (2012). Modelling of food and food processes. Journal of Food Engineering,110(2):269–277.
Villadsen, J. and Michelsen, L. (1978). Solution of Differential Equation Models by Poly-nomial Approximation. Prentice-Hall international series in the physical and chemicalengineering sciences. Prentice-Hall.
Wade, P. (1987). Biscuit Baking by Near-infrared Radiation. Journal of Food Engineering,6:165–175.
Wagner, M. J., Loubat, M., Sommier, A., Le Ray, D., Collewet, G., Broyart, B., Quintard,H., Davenel, A., Trystram, G., and Lucas, T. (2008). MRI study of bread baking:experimental device and MRI signal analysis. International Journal of Food Science &Technology, 43(6):1129–1139.
138

Wählby, U. (2002). Heat and Mass Transfer in Impingement Cooking Aspects of FoodQuality. Phd thesis, Chalmers University of Technology.
Wählby, U., Skjöldebrand, C., and Junker, E. (2000). Impact of impingement on cookingtime and food quality. Journal of Food Engineering, 43:179–187.
Wang, L. and Sun, D.-W. (2003). Recent developments in numerical modelling of heat-ing and cooling processes in the food industry - a review. Trends in Food Science &Technology, 14(10):408–423.
Yam, K. L. and Papadakis, S. E. (2004). A simple digital imaging method for measuringand analyzing color of food surfaces. Journal of Food Engineering, 61(1):137–142.
Zanoni, B., Peri, C., and Bruno, D. (1995). Modelling of browning kinetics of bread crustduring baking. Lebensmittel-Wissenschaft und-Technologie, 28(6):604–609.
Zanoni, B., Pierucci, S., and Peri, C. (1994). A study of the Bread-Baking Process. II.Mathematical Modelling. Journal of Food Engineering, 23:321–336.
Zareifard, M., Boissonneault, V., and Marcotte, M. (2009). Bakery product characteristicsas influenced by convection heat flux. Food Research International, 42(7):856–864.
Zareifard, M., Marcotte, M., and Dostie, M. (2006). A method for balancing heat fluxesvalidated for a newly designed pilot plant oven. Journal of Food Engineering, 76(3):303–312.
Zhang, J., Datta, A. K., and Mukherjee, S. (2005). Transport processes and large defor-mation during baking of bread. AIChE Journal, 51(9):2569–2580.
Zhang, Y. and Zhang, Y. (2007). Formation and reduction of acrylamide in Maillardreaction: a review based on the current state of knowledge. Critical reviews in foodscience and nutrition, 47(5):521–42.
Zhou, W. (2005). Application of FDM and FEM in solving the simultaneous heat andmoisture transfer inside bread during baking. International Journal of ComputationalFluid Dynamics, 19(1):73–77.
Zoulias, E. I., Oreopoulou, V., and Tzai, C. (2000). Effects of fat mimetis on physical,textural and sensory properties of cookies. International Journal of Food Properties,3(3):385–397.
139

140

Appendices
The following appendices are included:
Appendix A: Article: Quality assessment of butter cookies applying multi-spectralimaging
Appendix B: Abstract and poster: A mechanistic approach to baking processes
Appendix C:Poster: Design and construction of a batch oven for investigation of indus-trial continuous baking processes
Appendix D: Article: Design and construction of a batch oven for investigation ofindustrial continuous baking processes
Appendix E: Abstract: Investigating the influence of air velocity on the quality of buttercookies
Appendix F: Article manuscript: Investigation of uneven mass transfer in butter cookiescombining experimental work and finite element modeling
Appendix G: Literature search for state of the art articles
Appendix H: Literature review for quality assessment
Appendix I: ANOVA testing influence of air flow
Appendix J: Parameters and variables for COMSOL simulations
141

142

Appendix A
Article: Quality assessment of buttercookies applying multi-spectralimaging
This appendix contains the article “Quality assessment of butter cookies applying multi-spectral imaging” published in Food Science & Nutrition, June 12, 2013.
143

ORIGINAL RESEARCH
Quality assessment of butter cookies applying multispectralimagingMette S. Andresen, Bjørn S. Dissing & Hanne Løje
National Food Institute, Technical University of Denmark, Søltofts Plads 227, DK-2800 Kongens Lyngby, Denmark
Keywords
Baking, browning, cookie, food technology,
food quality, multispectral imaging, water
content
Correspondence
Mette S. Andresen, National Food Institute,
Technical University of Denmark,
Søltofts Plads 227, DK-2800 Kongens
Lyngby, Denmark.
Tel: +45 45 25 29 56; Fax: +45 45 93 96 00;
E-mail: [email protected]
Funding Information
This study was supported by the Danish
Ministry of Food, Agriculture and Fisheries.
Received: 4 March 2013; Revised: 2 April
2013; Accepted: 21 April 2013
doi: 10.1002/fsn3.46
Abstract
A method for characterization of butter cookie quality by assessing the surface
browning and water content using multispectral images is presented. Based on
evaluations of the browning of butter cookies, cookies were manually divided
into groups. From this categorization, reference values were calculated for a sta-
tistical prediction model correlating multispectral images with a browning
score. The browning score is calculated as a function of oven temperature and
baking time. It is presented as a quadratic response surface. The investigated
process window was the intervals 4–16 min and 160–200°C in a forced convec-
tion electrically heated oven. In addition to the browning score, a model for
predicting the average water content based on the same images is presented.
This shows how multispectral images of butter cookies may be used for the
assessment of different quality parameters. Statistical analysis showed that the
most significant wavelengths for browning predictions were in the interval 400–700 nm and the wavelengths significant for water prediction were primarily
located in the near-infrared spectrum. The water prediction model was found
to correctly estimate the average water content with an absolute error of 0.22%.
From the images it was also possible to follow the browning and drying propa-
gation from the cookie edge toward the center.
Introduction
In cookie production, visual quality is of very high impor-
tance. To ensure that the quality is constantly in accor-
dance with the specifications, it is inspected regularly
throughout the production day, so that the process can be
adjusted immediately if needed. Traditionally, such con-
trol and quality checking is done by human expert ope-
rators. Even though it can be advantageous to have expert
human operators placed directly at the production line,
there are also some disadvantages. Besides being labor
intensive, manual inspectors might evaluate the products
slightly different, they are also by nature subjective, and
their evaluations may be inconsistent so that they vary
over time, even for the same expert (Little 1973). There-
fore, alternative fast and objective control systems are
desirable and it is not surprising that the development of
fast nondestructive methods for food product quality
monitoring is a rapidly evolving field. A few examples can
be found in Jha et al. (2011), Telis-Romero et al. (2011),
Liao et al. (2012), Oto et al. (2012), discussing such
methods as UV spectra, electrical properties, ultrasound,
and near-infrared (NIR) spectroscopy for online product
quality assessment.
The surface color is one of the first impressions con-
sumers get of a bakery product (Clydesdale 1991), giving
the surface browning of cookies high importance as a
quality parameter. The surface color of bakery products
depends both on the physicochemical characteristics of
the raw dough, such as water content, pH, reducing sug-
ars, and amino acid content, and on the operating condi-
tions during processing, mainly the final baking (Purlis
2011). During baking, the temperature, time, air velocity,
and relative humidity can influence the browning of
cookies.
Equally important, but harder to evaluate by online
methods, is the water content of the cookie. If the water
content is too high the shelf life of the product will be
impaired (Manley and Clark 2011). During baking, water
is transported through and away from the product. Evap-
oration takes place at the surfaces, and water migrates
through the product toward the lower concentration at
ª 2013 The Authors. Food Science & Nutrition published by Wiley Periodicals, Inc. This is an open access article under the terms of
the Creative Commons Attribution License, which permits use, distribution and reproduction in any medium,
provided the original work is properly cited.
1

the surface. A low water activity is a prerequisite for
browning. While the water activity is not identical to the
water content, as water activity is a measure of free water
and water content is the total amount of water in the
product, the two are closely related (Cauvain and Young
2000). For the purpose of this study, the water content
has been used. To some extent, the water content might
be deducted from the degree of browning; however, the
opposite is not always the case, as a low water content
can be obtained without browning at low surface
temperatures (approximately below 115°C) (Broyart et al.1998).
The purpose of this work was to investigate the use of
multispectral image analysis to assess multiple quality
aspects of bakery products from the same image. The
investigated product is a butter cookie, and the investi-
gated quality parameters are the surface browning and the
water content after cooling. The developed browning
score is based on sensory evaluation, distributing cookies
in different browning categories. Combining surface
browning with sensory evaluations, forming a single
browning score, which is modeled as a function of the
baking time and oven temperature has, to the knowledge
of the authors, not been presented in previous academic
papers. The ability to quantify the water content from the
same multispectral images is furthermore investigated,
showing that it is possible to assess different quality
parameters from the same multispectral image and
thereby saving time compared to the process of obtaining
the information through visual observations or laboratory
work.
In this work, the investigation is focused on the influ-
ence of baking time and oven temperature on browning
and moisture content. A similar study of biscuits was pre-
sented in Carstensen (2012). In this work, a browning
index was considered, along with the average water con-
tent. Additionally, a glazing index was obtained. The abil-
ity to predict the water content was found to be 0.14%
root mean squared error of prediction (RMSEP) (see
eq. 2). This study investigated industrially produced
biscuits, limiting the investigated water content range to
1–3%. The browning index was built using endpoints,
these being conforming and nonconforming areas of
biscuits. A Fischer’s discriminant analysis (FDA) was then
used to map biscuits into a scale between these endpoints.
In the present work, a range of processing conditions
(varying the time and temperature) were investigated.
Compared to the study investigating biscuits produced in
an industrial setting without variations, the present study
investigates a broader window of applicability for the
method. In the present work, the browning of the butter
cookies ranged from underbaked to overbaked and the
average water content ranged from 1.1% to 9.4%.
Materials and Methods
The present work is focused on two cookie data sets. The
first set, Set 1, was prepared and used for sensory evaluation
and model development with regard to the browning score.
The second set, Set 2, was used to validate the browning
model, build the browning response surface model, and to
build and validate the water content model. The degree of
browning was estimated on the second baking set, based on
the model developed from Set 1. The water content was
measured and estimated for Set 2. For water content evalu-
ation, Set 2 was split into two groups, a modeling and an
evaluation group. In the following, the baking procedure,
the evaluation of browning, the method for water content
measurements, the multispectral image capturing equip-
ment, and the data processing methods are described.
Baking procedure
The examined butter cookies were prepared following the
recipe in Table 1, provided by Haas-Meincke A/S1 as an
example of a typical industrial cookie product. The ingredi-
ents were mixed using a Varimixer Teddy (5L) mixer, (A/S
Wodschow & Co., Broendby, Denmark) and rolled using a
Rollmatic manual sheeter (Rollmatic Srl, Schio, Italy). The
dough was rolled to a height of 6 mm (�0.5 mm) and the
cookies were cut to a diameter of 45 mm. The same cutter
was used for all cookies. Between shaping and baking, the
cookies were stored cool (5°C) and covered by plastic film
to avoid dehydration of the surface. The cookies were
baked in a Rational Combi CCC convection oven (Rational
AG, Landsberg a. Lech, Germany).
The experimental part of the work was centered around
the construction of two independent data sets. The first
data set (Set 1) was created both as a training set for the
multispectral imaging device and to be used in a sensory
evaluation of the appearance of the cookies. Three cookies
were used for imaging for each baking time. These images
were used to create a browning score which indicates the
stage of browning of a specific cookie. The cookies in this
set were baked at a fixed temperature (180°C) varying the
baking time to produce a range of browning.
The second data set (Set 2) was used to build a
response surface describing how the time and temperature
affects the browning score. The cookies for this set were
baked at different oven temperatures and with varying
baking times. Triplicates were made of all imaged cookies.
All cookies in Set 1 were baked at 180°C varying the
baking time to obtain varied degrees of browning. The
baking times were: 4, 6, 7, 8, 9, 10, 12, 14, 16, and
1Haas Meincke A/S, www.haas.com.
2 ª 2013 The Authors. Food Science & Nutrition published by Wiley Periodicals, Inc.
Quality Assessment by Multi-Spectral Imaging M. S. Andresen et al.

20 min. Previous experiments by the authors had shown
that the degree of browning moved from covering only
the edge of the cookie to the whole surface at baking
times between 6 and 9 min. Therefore, 1 min intervals
were applied in this range.
The cookies in Set 1 were baked at different air tem-
peratures (150, 160, 170, 180, and 200°C) and at different
baking times (4, 6, 8, 10, 12, 14, and 16 min). These
parameters were chosen to cover a wide range of surface
browning.
Other parameters such as dough composition, product
dimension, cooling time, and oven settings (air humidity
and air speed) were kept constant for all baking experi-
ments.
Evaluation of browning
In the current work, the goal was to link a sensory evalu-
ation to a calculated browning score for the butter cook-
ies. A panel consisting of six untrained persons was used
to assess the degree of browning. In a production plan-
ning, a larger or trained panel might be used for a full-
scale sensory analysis. In the present work, the objective
of the analysis was to demonstrate a principle. Therefore,
the smaller panel is well suited.
The panelists were in their mid-20s to mid-30s of Dan-
ish decent with a good knowledge of food production
processes and food quality. The cookies from Set 1 were
presented to the panel without information on the objec-
tives of the study or the variations in baking times. Each
panelist was asked to group the cookies into three catego-
ries, independently from the other members in the panel,
using a form. The only criterion for separation was the
appearance of the cookies with regard to browning. The
evaluation was done in a daylight setting. The panelists
were asked to divide the cookies into the following three
groups: underbaked, adequately baked, and overbaked.
Each cookie could only be assigned to one category.
Water content
The water content was determined for Set 2. The average
water content was found in the cookies after baking and
cooling. The weight of the cookies was recorded before
and after the cookies were placed in a drying cabinet at
105°C for 48 h (or until no further changes were regis-
tered in the weight). The mass loss during drying is
assumed to be equal to the total water content in the
baked cookie before drying. The final weight is seen as
the dry matter (DM) content of the cookie.
In this work the water content is reported as the aver-
age water content or percentage of water per cookie. The
fraction water per total cookie weight (X) is calculated as
seen in equation (1):
X ¼ mwatermDM þmwater
¼ minitial �mdriedminitial
(1)
where m is the weight of a given component in the coo-
kie – either DM, water, or the initial or dried weight of
the cookie.
VideometerLab
The imaging data was acquired using a VideometerLab
(Carstensen et al. 2006). The VideometerLab captures
multispectral images at 19 different wavelengths ranging
from 385 to 970 nm. The system records the surface
reflections with a standard monochrome charged coupled
device chip, nested in a Point Grey Scorpion camera
(Point Grey Research GmbH, Ludwigsburg, Germany).
A schematic illustration of the whole setup is shown in
Figure 1. The item of interest is placed inside a sphere
with a matte white coating, an integrating or so called
Ulbricht sphere. Inside the sphere light-emitting diodes
(LED) are placed side by side in a pattern distributing the
LEDs of each wavelength evenly across the whole perime-
ter to avoid shadows and specular reflections. During data
acquisition, the diodes are strobing successively resulting
in a 1280 9 960 image for each wavelength. Before data
acquisition is commenced, the system is calibrated both
radiometrically and geometrically followed by a light
setup, to obtain the optimal dynamic range for all LEDs,
as well as minimizing the distortions in the lens and
thereby pixel correspondence across the spectral bands
(Carstensen and Folm-Hansen 2003). The system is devel-
oped to guarantee the reproducibility of collected images,
Table 1. Composition and mixing procedure for 1.7 kg cookie
dough.
Ingredients Mass (g)
Icing sugar 333
Margarine 500
Vanilla extract 3.3
Mix until Even texture
Whole egg 33.3
Skimmed milk powder 12.5
Salt 3.3
Sodium bicarbonate 0.4
Water 8.3
Mix until Even texture
Corn starch 167
Wheat cake flour 667
Mix until an even Textured dough is obtained
Finish by gathering The dough by hand
Total weight 1728
ª 2013 The Authors. Food Science & Nutrition published by Wiley Periodicals, Inc. 3
M. S. Andresen et al. Quality Assessment by Multi-Spectral Imaging

which means that it can be used in comparative studies of
time series, or across a large variety of different samples.
In other recent studies, the VideometerLab setup was
applied for quality studies of food products, as a fast
method to quantify the amount of the red colored
astaxanthin in salmonids (Dissing et al. 2011), to measure
the degree of agglutination in continuously fried minced
meat (Daugaard et al. 2010), and as a method to evaluate
quality changes in stored wok fried vegetables (Clemmesen
et al. 2012). According to the company Videometer A/S2 the
VideometerLab is currently implemented in industrial quality
control lines including color sorting of mink furs (Kopenha-
gen Fur, Copenhagen, Denmark) and monitoring shape
and texture distribution of bulk granule samples (Ferring
International Center S.A., Saint-Prex, Switzerland).
Calculation of browning score
Multispectral images were treated to first remove the
background, leaving only pixels with cookie surface. This
was done using simple adaptive thresholding techniques.
The browning score based on multispectral images and
sensory evaluations is created using FDA (Hastie et al.
2001). The images in Set 1 were divided into categories
by the sensory panel. Based on this division, the images
were transformed to multivariable data matrices contain-
ing only pixel values from the surface of the cookies.
The within-group and between-group scattering matrices
used in the FDA were estimated based on all pixel values
across the cookie surfaces. Using the two scattering
matrices, an optimal projection vector was found so that
each group, when projected onto the vector, contracted
so that the three groups were scattered as much as possi-
ble. In this way, the separation between the categories
within the browning score space (which we call the
space, in which the cookies are projected into) was
maximized.
Estimating water content from images
In addition to the browning index, it was investigated
whether the available NIR spectrum may be used to esti-
mate the water content in the cookies. NIR imaging has
in other studies proved to be a good method for estima-
tion of water content in food products, such as minced
meat (Dissing et al. 2009), breaded chicken nuggets (Yav-
ari et al. 2011), and water-related qualities, such as drip
loss (Barbin et al. 2012). Multispectral imaging is capable
of detecting water shifts in the NIR area of the electro-
magnetic spectrum, disregarding the surface color. The
brown color on the surface of the products is known to
have high absorbance properties in the UV and visual
areas (Kim and Lee 2009), which are well separated from
the water peaks at 970, 1440, and 1930 nm.
To investigate the relation between the measured water
content and the recorded spectra, a prediction model was
created based on the mean spectra of cookies in Set 2,
and the corresponding measured average water content
(as given in eq. 1). A partial least squares regression
(PLSR) was used to build the prediction model based on
2/3 of the available data, and tested on the remaining
third of the data set (Wold et al. 2001). Parameters were
estimated from a fivefold cross-validation scheme using
the larger group of the data set. The accuracy of the
model is given as the RMSEP, calculated as shown in
equation (2) (Esbensen et al. 2002):
RMSEP ¼ffiffiffiffiffiffiffiffiffiffiffiffiffiffiffiffiffiffiffiffiffiffiffiffiffiPn
i ðyi � yiÞ2n
s(2)
where yi is the predicted average water content per cookie,
y is the average measured water content, and n is the
number of samples.
Results and Discussion
The results for the investigations of browning and mois-
ture content are presented separately in the following
sections. The first presented results are concerned with
the browning and the browning model, the subsequent
sections deal with the moisture content, the prediction
model, and the results.
Figure 1. Schematic illustration of the Videometerlab setup showing
the Ulbricht sphere, light-emitting diodes (LEDs), and camera positions
(Dissing et al. 2011).
2www.videometer.com, 12 June 2012.
4 ª 2013 The Authors. Food Science & Nutrition published by Wiley Periodicals, Inc.
Quality Assessment by Multi-Spectral Imaging M. S. Andresen et al.

Multispectral images
A clear correlation was seen between the baking time and
mean spectra for the cookies (Fig. 2). The spectra are
plotted as spectral reflectance values as a function of
wavelength; they are colored according to the baking
time. Light colors denote short baking times, dark colors,
long baking times. The reflectance of the spectra decreases
with baking time. This indicates that the lightness of the
cookies is decreasing. The reflectance differences are larg-
est between 400 and 700 nm (the visible wavelengths),
while they are smaller in the NIR area. Decreasing steps
in reflectance are seen in the short wave (400–500 nm)
end of the spectrum. It is known that melanoids, the
brown components formed from the Maillard reactions,
have absorption properties in this area, specifically at
420 nm (Kim and Lee 2009).
Browning evaluation and score
Results from the sensory evaluation of Set 1 are shown in
Figure 3a. Cookies from each baking time were evaluated
by each individual panelist; the evaluation shows that the
adequate baking state is reached after 6 min.
The panel generally agreed that baking times lower
than 6 min resulted in underbaked cookies. Cookies
baked from 6 to 10 min were considered adequately
baked; cookies baked for more than 1 min were consid-
ered overbaked. No cookies were evaluated as belonging
to all three classes. Neither were any cookies evaluated as
belonging to both the under and overbaked categories.
This indicates a sufficiently clear separation between the
categories for the purpose of this study. The clear separa-
tion is also seen in Figure 3b quantifying the browning
stages. In the figure a large gap between the extreme clas-
ses is shown as Euclidean distances based on the calcu-
lated browning scores. Figure 4 shows the two most
significant projection vectors from the FDA.
The most significant wavelengths in the first loading
are 395 and 525 nm, both of which are seen to contribute
largely to the variance in Figure 2. Each box in Figure 3b
contains mean score values of the cookies used to train
the FDA model together with the mean score values of
the two other repetitions. The spread of the values is rela-
tively low, while the development over time shows a
significant decrease in the overall browning score. The
limits between the classes were calculated as the mean
between the browning scores for 4 and 6 min baking, and
Figure 2. Spectra of training data. Each spectrum represents the
mean spectral shape of all cookie pixels in a multispectral image. The
shapes show a clear correlation with the baking time.
(a)
(b)
Figure 3. (a) Sensory evaluation. Each person classified a set of
cookies into each of the stages underbaked, adequately baked, and
overbaked. The histogram shows a normalized frequency for each
group as a function of time in the oven. (b) Box-plot of mean values
of browning score. Each box contains three samples. The background
is shaded according to the classes defined by the sensory panel. The
limits between the groups have been calculated as the mean
euclidean distance between border boxes.
ª 2013 The Authors. Food Science & Nutrition published by Wiley Periodicals, Inc. 5
M. S. Andresen et al. Quality Assessment by Multi-Spectral Imaging

between 10 and 12 min. The browning score can be
applied to multispectral recordings of new cookies to pre-
dict which stage of browning they are in. Examples are
shown in Figure 5.
To check the uniformity of the browning on the
surface of the cookies, pixel-wise browning scores were
calculated. The result reveals how the browning propa-
gates from the edge of the cookie toward the center dur-
ing baking. Underbaked areas were only detected in
cookies baked for 4 min; this corresponded well to the
sensory evaluation. An overall browning score may be cal-
culated for each cookie by taking the average of all the
pixel-wise browning scores across the cookie.
The average browning scores were calculated for all
cookies in Set 2 to assess the browning when varying
both the baking time and the oven temperature. A qua-
dratic surface was found to give the best description of
the relation between browning and both oven tempera-
ture and baking time, without overfitting the data.
Equation (3) was fitted to the browning scores, where x1is the time (min) and x2 is the temperature (°C). The
browning score value is 0 for no browning at the surface
and decreases with increasing browning as shown in
Figure 6.
y ¼ 0:32� 0:12x1½min�1� � 0:13x2½�C�1�þ 0:008x1x2½ðmin � �CÞ�1� þ 0:02x21½min�2�þ 0:02x22½�C�2� (3)
From the response surface, it is seen that a 1 min
increase of the baking time will have approximately the
same effect as increasing the baking temperature with
10°C. The results are valid within the investigated range
of temperatures (150–200°C) and baking times
(4–16 min), using the setup described in the Materials
and Methods section. For other processes, new models
should be developed, as the process equipment and setup
influence the browning development strongly. The maxi-
mum baking time in the response surface was set to
16 min. Cookies were baked for longer baking times; up
to 0 min, these are considered as extreme cases and are
therefore not included in this part of the study.
Determining water content
A total of 99 cookies were used for building and evaluat-
ing the model for average water content. Based on the 18
spectra obtained for each cookie surface, a mean value
was calculated. A principal components analysis, which
reveals the primary latent variance in the extracted fea-
tures, is shown in Figure 7a. Each dot is a score value
representing a cookie, color coded by its water content.
Especially, PC 1 provides a good description of the devel-
opment in the average water content. This variation was
related to the measured water content using a partial
least squares regression model. In order to build the
model, 66 cookies were selected randomly and used in a
fivefold cross-validation scheme for parameter estimation.
Using the spectral means for training the model, PLSR
components were calculated. From the model, the water
content in the remaining 33 cookies was predicted.
A plot of the predicted versus the measured values for
both the training and the test cookies is seen in Fig-
ure 7b. This shows a very good approximation. Summing
all the residuals, a RMSEP of 0.16% is obtained for the
training set and 0.22% is obtained for the test set. The
range of average water content in the data set spans from
1.13% to 9.39% (kg water per kg cookie). As expected,
loadings from the model revealed that the short wave
NIR area of the electromagnetic spectrum was highly cor-
related with the measured water content. The spatial dis-
tribution of water on the surface of each cookie was
assessed by projecting each recorded spectrum of the coo-
kie surface (one per pixel) with the calculated model. Fig-
ure 8 shows the spatial predictions on cookies baked at
150°C at different baking times. In Table 2, measure-
ments and predicted values for the water content are
shown for cookies baked at an oven temperature of
150°C and different baking times.
Conclusion
The used vision system records multispectral images in
the visible and the first part of the NIR areas of the elec-
tromagnetic spectrum. An acceptance score was developed
using FDA, based on the evaluation of cookies by a
Figure 4. The loadings from the canonical discriminant analysis used
to create the browning score. It is clearly seen how the area from
400 to 550 plays a significant role in the transformation vectors.
6 ª 2013 The Authors. Food Science & Nutrition published by Wiley Periodicals, Inc.
Quality Assessment by Multi-Spectral Imaging M. S. Andresen et al.

sensory panel. According to the sensory panel, cookies
baked for 4 min were underbaked, while cookies baked
for 6–10 min were adequately baked; longer baking times
resulted in overbaked cookies. This evaluation was purely
based on the visual appearance of the cookies, thus by the
color and visual perception of texture.
The discriminant analysis revealed that the main wave-
lengths when creating the acceptance score were 395 and
525 nm, corresponding very well to the absorption
properties of melanoids. From the acceptance score, a
response surface was created, building a model which
relates the influence of time and temperature to brown-
ing. The change in surface browning was comparable
when changing the baking time with 1 min or the oven
temperature with 10°C. A broad acceptance band was
found, corresponding well to the sensory evaluations. A
demonstration of the browning distribution on the sur-
face of the cookies was presented showing how the
browning starts from the edges of the cookie and works
its way toward the center.
(a) (b)
(c) (d)
(e) (f)
Figure 5. Pseudo-RGB representations of the multispectral images of cookies taken at different baking times. For each RGB image, a classified
image is shown where pixels have been classified to one of the three browning stages. The predicted images were smoothed with a Gaussian
filter before thresholding in order to remove noise. When observing the images from the top and down it is seen how the browning of the
cookies starts from the edges and progress toward the center. Only the first cookie (4 min) contains areas of underbaked surface.
ª 2013 The Authors. Food Science & Nutrition published by Wiley Periodicals, Inc. 7
M. S. Andresen et al. Quality Assessment by Multi-Spectral Imaging

Besides assessing the surface browning, the water con-
tent in the cookies was evaluated. An approach similar to
that of the acceptance score was used. The loading vector
revealed that in order to map spectra to water content,
the NIR area was of most importance. Having the NIR
area in a water prediction model was expected due to the
Figure 6. The surface browning score as a function of time and
temperature for butter cookies. The zones indicate areas created by
the sensory evaluation, corresponding to underbaked, adequately
baked, and overbaked appearance.
(a) (b)
Figure 7. (a) Loadings of the water prediction model. The near-infrared area shows significant peaks together with the area around 470 nm.
(b) Values of standard error of prediction calculated in a bootstrap procedure. The average of the squared error of prediction (SEP) values is
calculated to 13.6, meaning that on average the prediction method has an error rate of 13.6%.
Figure 8. Water content for five cookies has been predicted for each pixel on the cookie surface and smoothed to remove noise. The average
water prediction for the five cookies has been calculated and presented in Table 2. The color map used in the visualization of the five surfaces is
the same where blue values correspond to low water content and red values correspond to high water content.
Table 2. Average real and predicted water content for the cookies
the surfaces of which are shown in Figure 8. The real values have
been measured using a drying cabinet while the predicted values were
calculated as average values of all pixels on the surface.
Time
(min) Temperature (°C) Measured (%) Predicted (%) Deviation
4 150 9.17 9.18 0.01
6 150 6.40 6.30 �0.10
8 150 4.72 4.44 �0.28
10 150 3.57 3.60 0.03
12 150 2.38 2.75 0.37
14 150 2.07 2.24 0.17
8 ª 2013 The Authors. Food Science & Nutrition published by Wiley Periodicals, Inc.
Quality Assessment by Multi-Spectral Imaging M. S. Andresen et al.
water peak around 970 nm. The water content was well
estimated with a RMSEP of 0.22%.
It was shown that it is possible to use multispectral
imaging to asses both the browning and the water content
of butter cookies. Furthermore, the method was used to
evaluate the browning and water content across the cook-
ies surface, giving an indication of the evenness of the
process and the produced products. In a production set-
ting, only the relevant wavelengths would be used for
monitoring, making image capturing and the following
data processing possible during online production.
Acknowledgments
The authors thank the Danish Ministry of Food, Agricul-
ture and Fisheries for grants supporting this research
(J.no. 3414-08-02280 and J.no. 3304-FVFP-06066001).
Conflict of Interest
None declared.
References
Barbin, D. F., G. ElMasry, D.-W. Sun, and P. Allen. 2012.
Predicting quality and sensory attributes of pork using
near-infrared hyperspectral imaging. Anal. Chim. Acta
719:30–42.
Broyart, B., G. Trystram, and A. Duquenoy. 1998. Predicting
color kinetics during cracker baking. J. Food Eng. 35:351–368.
Carstensen, J. 2012. Biscuit quality assessment by spectral
imaging in Proceedings of the Third Annual Hyperspectral
Imaging Conference, Istituto Nazionale di Geofsica e
Vulcanologia, Rome, Italy.
Carstensen, J. M., and J. Folm-Hansen. 2000. An apparatus
and a method of recording an image of an object. European
Patent EP1051660. Granted Nov. 2003.
Carstensen, J. M., M. E. Hansen, N. K. Lassen, and P. W.
Hansen. 2006. Creating surface chemistry maps using
multispectral vision technology. Pp. 19–28 in Proceedings of
the MICCAI (Medical Image Computing and Computer
Aided Intervention) 2006 workshop on biophotonics
imaging, 6 October, Copenhagen. ISBN 87-643-0116-8.
Cauvain, S. P., and L. S. Young. 2000. Bakery food
manufacture and quality – water control and effects.
Blackwell Science Ltd., Oxford, U.K.
Clemmesen, L. H., B. S. Dissing, G. Hyldig, and H. Løje. 2012.
Multispectral imaging of wok-fried vegetables. J. Imaging
Sci. Technol. 56:20404-1-6.
Clydesdale, F. M. 1991. Color perception and food quality.
J. Food Qual. 14:61–74.
Daugaard, S. B., J. Adler-Nissen, and J. M. Carstensen. 2010. New
vision technology for multidimensional quality monitoring of
continuous frying of meat. Food Control 1:626–632.
Dissing, B. S., B. K. Ersbøll, and J. Adler-Nissen. 2009.
Monitoring water content using multispectral imaging and
NIR in minced meat in Abstract from 14th International
Conference on Near Infrared Spectroscopy (NIR 2009),
Bangkok, Thailand.
Dissing, B. S., M. E. Nielsen, B. K. Ersbøll, and S. Frosch.
2011. Multispectral imaging for determination of
astaxanthin concentration in salmonids. PLoS One 6:e19032.
Esbensen, K., D. Guyot, F. Westad, and L. Houmøller. 2002.
Multivariate data analysis in practice: an introduction to
multivariate data analysis and experimental design. Camo
Process AS, Oslo, Norway.
Hastie, T., R. Tibshirani, and J. Friedman. 2001. Elements of
statistical learning: data mining inference and prediction.
2nd ed. Springer, Berlin, Germany.
Jha, S. N., K. Narsaiah, A. L. Basediya, R. Sharma, P. Jaiswal,
R. Kumar, et al. 2011. Measurement techniques and
application of electrical properties for nondestructive quality
evaluation of foods: a review. J. Food Sci. Technol. 48:
387–411.
Kim, J.-S., and Y.-S. Lee. 2009. Enolization and racemization
reactions of glucose and fructose on heating with amino-acid
enantiomers and the formation of melanoidins as a result of
the Maillard reaction. Amino Acids 36:465–474.
Liao, Y., Y. Fan, and F. Cheng. 2012. On-line prediction of pH
values in fresh pork using visible/near-infrared spectroscopy
with wavelet de-noising and variable selection methods.
J. Food Eng. 109:668–675.
Little, A. C. 1973. Color evaluation of foods, correlation of
objective facts with subjective impressions. Pp. 109–127
in Sensory valuation of appearance of materials: a
symposium, Issue 545. American Society for Testing and
Materials, West Conshohocken, PA.
Manley, D., and H. Clark. 2011. Secondary processing of
biscuits. Pp. 511–546 in D. Manley, ed. Manley’s technology
of biscuits, crackers and cookies, Ch. 41. 4th ed. Woodhead
Publishing Limited, Cambridge.
Oto, N., S. Oshita, S. Kawagishi, Y. Makino, Y. Kawagoe,
M. Al-Haq, et al. 2012. Non-destructive estimation of ATP
contents and plate count on pork meat surface by UV-Vis
reflectance spectrum analysis. J. Food Eng. 110:9–17.
Purlis, E. 2011. Bread baking: technological considerations
based on process modelling and simulation. J. Food Eng.
103:92–102.
Telis-Romero, J., H. Vaquiro, J. Bon, and J. Benedito. 2011.
Ultrasonic assessment of fresh cheese composition. J. Food
Eng. 103:137–146.
Wold, S., M. Sj€ostrom, and L. Eriksson. 2001. PLS-regression:
a basic tool of chemometrics. Chemometr. Intell. Lab. Syst.
58:109–130.
Yavari, A., A. Heshmati, M. Hamedi, and S. Haghbin. 2011.
VISjNIR hyper-spectroscopy technique for the measurement
of moisture and fat contents of breaded-fried chicken
nuggets. Food Chem. 127:645–650.
ª 2013 The Authors. Food Science & Nutrition published by Wiley Periodicals, Inc. 9
M. S. Andresen et al. Quality Assessment by Multi-Spectral Imaging

Appendix B
Abstract and poster: A mechanisticapproach to baking process-productinteractions
This appendix contains an abstract and corresponding poster “A mechanistic approachto baking process-product interactions” presented at the 2010 Food Factory conference,Gothenburg, Sweden.
Recipe for the bread rolls:
Table B.1: Ingredients for bread rolls based on 1 kg of flour.
Ingredients Mass (g)Flour 1000Water 550Salt 16Sugar 16Oil 16
Dry yeast 12
The ingredients are shown in Table B.1. Water, oil, salt, sugar and dry yeast were mixeduntil the dry yeast was dissolved. The flour was added to the dough. Before shaping thedough was left to rise for 35 min. Each bread roll was shaped from 100 g of dough. Beforebaking the bread rolls were proved in a cabinet with increased humidity at approximately35◦C for 45min. Six bread rolls were baked at two different oven settings for a total of 20min. The used oven was a Rational CCC Combisteamer, Rational, Germany.
153

A Mechanistic Approach to Baking Process-Product Interactions
Name(s) and Affiliation (s): M. Stenby1,Jens Adler-Nissen1, Søren Skovlund2.
1National Food Institute, Food Production Engineering, Technical University of Denmark 2DFE Meincke
e-mail: [email protected] Bread baking is a highly energy demanding process. Besides heating the product, a large fraction of the energy is used to heat the oven and is lost to the surroundings. A way to minimize this fraction is a better understanding of the mechanisms behind the physical changes arising from the process-product interactions. Complex heat and mass transfer equations exist, but are not easily applicable when planning a production. The goal of this work has been to formulate a mechanistic model describing what is happening in the dough and bread during the baking process, and additionally the significance of changes in chosen physical parameters (air velocity, humidity, temperature) near the product. Experiments have shown that as a first approximation the process can be divided into two separate steps. First the dough is heated and expands. After some time the crumb temperature reaches a uniform temperature of 100°C, due to the high porosity and rapid heat transfer from evaporation and condensation of water. At this point the crust formation and coloration is initiated as the surface starts to dry. During crust formation the surroundings can be considered as constant with the oven conditions on the outside and the crumb structure at 100°C on the inside. The crust will thicken as water is transported from the crumb to the surface and evaporates. These findings indicate that it might be possible to implement alternative heating methods to focus the initial heating of the dough, and thus shorten the total process time. The extent to which the crust quality is affected by the initial process parameters is yet to be finally determined through model validation. An important step towards validation of the mechanistic model has been taken as a special prototype oven is currently under construction. The new oven is a batch oven build to simulate continuous baking processes. This is done by enabling fast changing of baking temperature (up and down), controlled air velocity and flow pattern, and the possibility of quick changes between radiative and convective heating. Furthermore, the oven is designed so that general information can be obtained about baking. This is done by continuous measurements of the product weight, and the chamber humidity; sensors can easily be connected for temperature measurements, and windows and mirrors are installed so that the product can be followed visually throughout the processing.

A Mechanistic Approach to Baking ProcessesThe Initial Oven Temperature
Mette Stenby1*,Jens Adler-Nissen1, Søren Skovlund2
1National Food Institute, Food Production Engineering, Technical University of Denmark. 2DFE Meincke A/S.*Contact: [email protected]
Abstract Our approach is to evaluate the baking processes step-wise and link the physical changes in the bread to the surrounding
physical parameters (air velocity, humidity, temperature). This is a step-by-step way to minimize energy consumption and optimize the
process parameters during baking. In the following considerations for the first step are described.
Cooling
Water evaporates
Final Baking
Coloration and aroma formation
Final water content Final crumb temperature
Foam to Sponge
Air cells are dried and breakContinuous sponge structure is
created
Crumb Structure
Gluten proteins cross-link Water migrates into starch granules
Oven Spring
Air expansion Surface starch gelatinization
Hypothesis – The Initial Baking Process
An overview of the baking process is given in Figure 1. Traditionally
the baking process starts at a high temperature (typically 220-240°C)
during the first period of baking. This is combined with addition of
vapor. The vapor is added to obtain a shiny crust, as it condenses on
the bread surface resulting in starch gelatinization.
As long as water condenses on the surface, the surface temperature
will not exceed 100°C. This indicates that the temperature difference
between the surface and the center of the bread does not depend on
the oven air temperature in the initial baking phase.
The tested hypothesis is: lowering of the temperature during the initial
baking step will not influence the final baking result. Validation of this
theory could lead to water and energy savings in the baking industry.
The hypothesis is tested by comparing the temperature profiles near
the crumb center and the volume of the bread rolls.
Experimental Set-up
Two set-ups with different initial temperatures were tested. The oven
set-tings are shown in Table 1, the initial temperatures differed by
80°C and were both 40°C from the final baking temperature. The
vapor addition was at a high setting in the used Rational Combi-
steamer. The temperature was measured with T-type thermocouples
in the bread rolls. Six bread rolls were used for each method. A
French bread type was used as the model product, the dough recipe
can be found in [1].
Figure 2. Comparison of the crumb structure for the two baking processes.
ResultsCrumb and Volume
The pictures in Figure 2 show the crumb structures for the two baking
procedures. The crumbs are baked through in both cases and the air
bubble structures are comparable. The volumes of the bread rolls
were not significantly different (mean±SD): 199±16cm3 and
194±23cm3 for low and high initial oven temperatures, respectively.
Temperature Profiles
The average values for the temperature measurements can be seen
in the graph (Figure 3). The standard deviations are shown for the
crumb temperatures. The time needed to reach 95°C [2] is used as a
comparison between the baking processes, as the crumb will be
baked through at this temperature. The time needed to reach 95°C is
not significantly different for the two methods. This is also clear from
the graph where both average curves are within one standard
deviation of each other throughout the baking process.
Conclusion and PerspectivesThe results show that the temperature profile for the crumb is not
significantly affected by the initial oven temperature when vapor is
added. These results indicate that energy can be saved by lowering
the oven temperature during the first step of baking when vapor is
used. The next step will be to use a more controlled system, and then
look at additional quality parameters such as the crust formation.
Process Time to reach 95°C (s)
High Initial Oven Temperature 759 ± 46
Low Initial Oven Temperature 769 ± 31
Process First 3 min Last 17 min
High Initial Oven Temperature 220°C + vapor 180°C
Low Initial Oven Temperature 140°C + vapor 180°C
Figure 1. Steps and changed during the baking process.
Figure 3. Average oven and crumb temperatures during baking. HI = high initial
oven temperature, LI = low initial oven temperature. The average crumb
temperatures are shown ± one standard deviation (n=6).
Table 2. The average times needed to reach 95°C ± one standard deviation.
Low initial oven temperature High initial oven temperature
Table 1. The oven settings in the two tested baking processes.
References:
[1] Skjöldebrand, C. & Andersson, C., 1989. A Comparison of Infrared bread Baking and Conventional Baking . Journal of Microwave Power and Electromagnetic Energy. 24 (2). pp.91-101.
[2] Wiggins, C. & Cauvain, S. P., 2007. Proving, Baking and Cooling. In:.Cauvain, S. P & Young, L. S.. 2007. Technology of Bread Making. USA: Springer Science + Business Media. Ch. 5.
0 200 400 600 800 1000 12000
50
100
150
200
Time - [s]
Tem
pera
ture
- [C
]
Crumb and Oven Temperatures with Different Initial Oven Temperatures
Oven HI
Oven LI
Crumb Avr. - HI
Crumb Avr. - LI
SD - Crumb HI
SD - Crumb LI
Figure B.1: Poster presented at the 2010 Food Factory conference, Gothenburg, Sweden.155

156

Appendix C
Poster: Design and construction of abatch oven for investigation ofindustrial continuous bakingprocesses
This appendix contains the poster “Design and construction of a batch oven for investi-gation of industrial continuous baking processes”, presented at the International Congresson Engineering and Food, Athens, Greece, May 2011.
157

Batch Oven for Investigation of Industrial
Continuous Baking Processes Mette Stenby1, Brian Nielsen2, Jørgen Risum1
1)National Food Institute, Technical University of Denmark, Kgs. Lyngby, Denmark ([email protected]), 2) Haas-Meincke A/S, Skovlunde, Denmark.
Abstract
A new convection batch oven has been constructed to simulate baking as in industrial continuous tunnel ovens. In the oven, the following
parameters can be controlled: The air temperature, the air humidity, and the air velocity. To enhance modelling work the following data is logged
continuously: The oven chamber temperature, the product temperature, the product weight, and the air humidity. Moreover, the product can be
inspected visually through a window. Baking experiments have shown good resemblance to cookies baked in a tunnel oven. Validation of the
oven’s evenness of baking, using cookie browning, air velocity, and heat transfer coefficients as markers, show a good ability to bake uniformly.
Background
As part of an ongoing research project,
investigating the influence of oven settings on
baking product quality, a unique experimental
batch oven has been build to mimic the
environment in tunnel ovens. The oven, the
baking chamber, and a schematic of the
convective system are shown in Figure 1.
Control and Data Collection
To simulate continuous ovens, the following
parameters are controlled: Air temperature, air
humidity, and the distribution between top and
bottom air inlets. For modelling purposes the
following is logged continuously during baking:
The air temperature by the product, the air
humidity, and the product weight. Additionally a
window is installed to monitor the product
visually throughout baking.
Conclusion
A new unique batch oven has been constructed
to help modeling industrial tunnel ovens. This is
possible due to the extensive monitoring during
baking. Experiments have shown that it is
possible to reproduce cookies baked in a tunnel
oven. Uniformity of baking conditions across the
baking area was investigated. Both inlet air
velocities and browning was seen to be uniform.
A small variation was found for the heat transfer
coefficients. This did not show on the degree of
browning, but will be examined further.
Figure 3. Calculated heat trasfer coefficients (W/(m2K)),
determined at the positions of the cookies baked to test
the uniformity of browning.
Figure 2. Cookies baked for comparison of the batch
and a tunnel oven, using similar oven settings. Tunnel
oven (A+B). Batch oven (C+D).
Oven type Tunnel Batch
Initial dough weight (g)1 22 ±0.7 21 ± 0.5
Baking loss (%)1 12 ± 0.4 12 ± 0.4
Final dry matter content after
cooling (%)2 96 ± 0.5 96 ± 0.1
Lightness (L*) top surface3 59 ±1.4 59 ± 2.2
Lightness (L*) bottom surface4 41 ±1.1 48 ± 3.1
Table 1. Overview of the comparison between tunnel
and batch baked cookies.
Tested quality Average
Velocity (36 holes)1 – top (m/s) 3.3 ± 0.2
Velocity (36 holes) 1 – bottom (m/s) 2.2 ± 0.2
Heat transfer coefficient2 (W/(m2·K) 62 ± 3.8
Table 2. Results of investigation of the variations for
the inlets and the baking area.
Tunnel oven
Batch oven
1) All cookies (n = 6). 2) 2 from each group (n = 2). 3) Three measurements
on each cookie (n = 18), 4) One measurement on each cookie (n = 6).
1 )The velocity at the inlet holes was measured twice, all measurements are
used when calculating the average (n=72). 2) The heat transfer was
measured in 24 position on the baking tray.
Experimental work
Comparing with a Tunnel Oven
Comparisons were made with cookies baked in
a 10m tunnel oven, using the same temperature
and air velocities. Comparisons were made for:
The mass loss, the dry matter content, and the
lightness (Table 1). The only difference was a
slightly darker colour on the bottom of the
cookies baked in the tunnel oven (Figure 2).
This is most likely due to the pre-heating of the
baking band in the tunnel oven.
Uniformity Across the Baking Tray
The uniformity across the baking area was
tested at the same settings as the comparative
baking tests. The investigated markers were:
Inlet air velocity, heat transfer coefficients, and
cookie browning.
Results for the velocities and heat transfer
coefficients measurements are shown in Table
2. Cookies, and heat transfer coefficients found
in the same positions, are shown in Figure 3.
No significant variations were seen for the
velocities or the browning. Dividing the baking
tray into to 6 groups of 4 cookies (2x2), showed
a significant difference for the upper right group
compared to the rest of the baking area. The
effect and nature of the difference will be further
investigated.
A
Figure 1. Left: Exterior pictures of the oven. Right:
Overview of the air exchange system. A) The baking
area in the chamber, seen through the window. B)
Humidity sensor. C) Fresh air intake. D) Ventilator. E)
Air exhaust. F) Heating element. G) Top/Bottom inlet
air.

Appendix D
Article: Design and construction of abatch oven for investigation ofindustrial continuous bakingprocesses
This appendix contains the article “Design and construction of a batch oven for investi-gation of industrial continuous baking processes”, accepted for publication in Journal ofFood Process Engineering on January 17th, 2013. An early-view version published onlineon April 17, 2013 is included.
159

DESIGN AND CONSTRUCTION OF A BATCH OVENFOR INVESTIGATION OF INDUSTRIAL CONTINUOUSBAKING PROCESSESMETTE STENBY ANDRESEN1, JØRGEN RISUM and JENS ADLER-NISSEN
Division of Industrial Food Research, National Food Institute, Technical University of Denmark (DTU), Søltoftsplads 227, Kongens Lyngby 2800,Denmark
1Corresponding author. TEL: +4545257516;FAX: 4593-9600; Email: [email protected]
Received for Publication April 10, 2012Accepted for Publication January 17, 2013
doi:10.1111/jfpe.12012
ABSTRACT
A new batch oven has been constructed to mimic industrial convection tunnelovens for research and development of continuous baking processes. The processparameters (air flow, air temperature, air humidity, height of baking area and thebaking band velocity) are therefore highly controllable and adjustable over a widerange of settings. It is possible to monitor the product weight and temperaturecontinuously during baking. The simultaneous measuring of mass and a windowallowing for visual (e.g., by video recording) control is unique for this experimen-tal batch oven. Two validation steps have been carried out. The uniformity ofheating in the oven was assessed by measurements of local heat transfer coeffi-cients and confirmed by baking tests. The methods showed that the oven is able toheat and bake uniformly across the baking area. Hereafter, the oven was validatedagainst a commercial 10-m tunnel oven, with a butter cookie as the test product.The investigated quality parameters for the butter cookies were mass loss andsurface browning, where the uniformity of browning was evaluated subjectivelyagainst a scale of standards and objectively by L* value measurements. Goodreproducibility of the baking was documented over a range of temperatures (160Cto 190C).
PRACTICAL APPLICATIONS
The purpose of this paper is to describe a new specially designed pilot scale batchoven. The batch oven is designed and constructed to imitate the baking processesin continuous tunnel ovens with forced convection. Experimental work in the newbatch oven will increase knowledge of how the environment and baking condi-tions influence the quality of bakery products in continuous tunnel ovens.
INTRODUCTION
Industrial baking in large scale is often carried out in con-tinuous multi-zone tunnel ovens. The division of the ovenchamber into different zones, which can be regulated inde-pendently, makes it possible to expose the products to dif-ferent baking conditions while they move through the oven.Compared to baking in a batch oven, the multi-zone tunneloven gives more freedom for optimizing and controlling thebaking process (Baik 2000b; Mirade et al. 2004). This opti-mization is traditionally performed by trial and error, astrained operators use their experience adjusting the processparameters to achieve the desired quality and productivity
(Manley 2000). This dependency on empirical and oftentacit knowledge of the baking process is not an ideal basisfor a rational optimization of processes and equipment.
For both oven manufactures and industrial bakeries,there is a need to gain more systematic knowledge on theimpact of the physical conditions in tunnel ovens on bothprocess mechanisms and product quality. While manystudies have focused on the influence of recipe formulationon product quality, a few recent examples are changing theflour type from wheat to barley (Frost et al. 2011), usingpectin as fat replacements (Min et al. 2010) and evaluatingthe overall impact of the sugar and fat contents (Pareyt et al.2009), less work has been published regarding the impact of
bs_bs_banner
Journal of Food Process Engineering ISSN 1745-4530
1Journal of Food Process Engineering •• (2013) ••–•• © 2013 Wiley Periodicals, Inc.

the process conditions on the product quality in continuousbaking processes.
The baking conditions in industrial tunnel ovens are con-siderably different from standard batch ovens. Tunnel ovenseither heated directly or by radiation often have varyingtemperature profiles through the oven chamber, while thetemperature is kept constant in most batch oven processes(Baik 2000b). In convection-heated tunnel ovens, the airflow pattern is very different from that of a convectionbatch oven for professional use. Standard professional batchovens have the heating element inside the oven chamberwhere the air is circulated by ventilators creating an air flowhorizontally across the products from one side. Tunnelovens have a separate heating unit from which hot air is ledthrough air ducts into the baking chamber. The air ducts aresituated above and below the moving baking band. The airmoves down, across the product and out through exhaustsplaced along the sides of the upper air ducts. In this way, auniform down- and sideways air flow is created over theproducts as they move through the oven.
In collaboration with a leading manufacturer of indus-trial tunnel ovens, Haas-Meincke A/S, Denmark, the authorsare engaged in a joint research project, which aims atincreasing the quantitative knowledge of tunnel ovenbaking processes. The overall scope of the project is todevelop robust product–process models for baking in con-vective tunnel ovens, in this way, enabling prediction ofproduct quality variations based on changes in the processconditions. A crucial step in this work is to construct a spe-cially designed experimental pilot scale batch oven. Thespecial batch oven described in this work is build with threemain objectives:(1) The new oven must be constructed so that the environ-ment inside the oven chamber emulates that found in con-tinuous tunnel ovens.(2) The oven is designed for research purposes and shouldtherefore allow for continuous recording of the productresponse to the process conditions. The main productproperties followed during baking, the mass loss andvisual changes such as color formation. Normally, suchmeasurements are impossible to perform continuouslyin an industrial tunnel oven (Manley 2000), which is asignificant obstacle to systematic studies of continuousbaking processes.(3) The third important purpose of the new oven will be toconduct experiments in which the oven conditions areoutside normal standard settings. For example, baking athigher or lower temperatures, pulsating air velocities orvarying air humidity can be examined. This is needed inorder to investigate options for future optimizations.
Several types of continuous ovens are commerciallyavailable and used in the bakery industry, differing withregard to the heating type, the heating method and the
overall chamber design. The target oven type in this work isindirectly fired convection-based tunnel ovens, and theexperimental batch oven is therefore designed to reproduceconditions found in such ovens. Data for process monitor-ing and control is acquired from temperature sensors and ahumidity sensor at relevant positions in the oven chamberand air duct system. Additionally, the product weight isfollowed continuously during baking. The changes indimensions and appearance (color) can be inspected visu-ally or recorded by photography through a window in theside of the oven chamber.
To the authors’ knowledge, only two batch ovens have sofar been constructed with the specific goal of investigatingcontinuous tunnel ovens (Sommier et al. 2005; Zareifardet al. 2006). The oven described by Zareifard et al. (2006) isdesigned to reproduce industrial baking processes. Amongother things, it has been used to investigate the influence ofthe relation between radiative and convective heating whilekeeping the total heat flux constant (Zareifard et al. 2009).The oven shows good reproductions of industrially bakedproducts. However, the baking chamber does not allow forthe same product monitoring during baking as this newexperimental batch oven. The other pilot scale oven forinvestigation of continuous baking processes (Sommieret al. 2005) is more similar to the present described batchoven. This oven enables extensive continuous monitoring ofthe process and product including temperatures, productweight, visual recoding of the product and humidity mea-surements. The main difference between the oven describedby (Sommier et al. 2005) and the pilot batch oven describedin this work is the design of the convective system. The ovendescribed by (Sommier et al. 2005) is a modified conven-tional batch oven, while the new oven is specially designedto have an air flow pattern similar to that found in continu-ous tunnel ovens. As discussed, the air flow pattern in atunnel oven is distinctly different from that of a conven-tional batch oven for professional use.
For the new batch oven, baking trays of 0.45 ¥ 0.45 m areused, which are significantly smaller than the 1.27 ¥ 1.17 mbaking areas described in (Zareifard et al. 2006). Thesmaller area does limit the number of products per batch;however, it enables weight recording during baking. Fur-thermore, the small baking chamber, combined with thespecially designed inlet air system has proven to provideeven baking and good flexibility for process parametervariations.
MATERIALS AND METHODS
Design of the Batch Oven
The investigated type of industrial ovens are multi-zone,convective, indirectly fired tunnel ovens. A schematic illus-
BATCH OVEN FOR INVESTIGATION OF CONTINUOUS BAKING M.S. ANDRESEN, J. RISUM and J. ADLER-NISSEN
2 Journal of Food Process Engineering •• (2013) ••–•• © 2013 Wiley Periodicals, Inc.

tration of one zone from the oven type in question is seenin Fig. 1. The length varies from 10 m up to over 100 m, andthe width of the baking band range from 0.8 to 4.2 m. Theovens are built of consecutive zones, each having its ownheating unit. The length of a zone normally varies from 6 to16 m. The temperature, the inlet air distribution (top : bot-tom) and the air humidity can be controlled independentlyfor each zone.
In the investigated type of oven, the rate of air exchangeis fixed at 8,000 m3/h/zone. In order to obtain a uniform airflow and heating pattern, the manufacturer, Haas-MeinckeA/S, has designed the ovens with perforated air ducts aboveand below the product, parallel to the baking band, eachwith 700 inlet nozzles per zone. The diameter of the nozzlesis 13 mm, resulting in an average linear velocity of 12 m/swhen the volumetric air flow is divided by the total inletarea. At this velocity, the Reynolds number is ª 4,700 for theair flow through the nozzles giving a turbulent flow (Sarkaret al. 2004). Air jets, like the ones in the oven, are impingingjets as they are focused on a solid surface. This kind ofjet can be divided into three regions, a free jet region inwhich the air jet is behaving as a free jet, a stagnant zone,where the jet meets the surface and a radial spread zone onthe surface itself (Sarkar and Singh 2003). Different combi-nations of inlet velocity and nozzle design will result incomparable Reynold’s numbers but might result in non-comparable flow patterns. According to the oven manufac-turer, the choice of the design parameters is largely basedon long-time experience and gradual improvements of thebasic design.
In this work, the air velocity in the free jet zone was mea-sured as a step in validation of the new batch oven com-pared to a tunnel oven. Due to the turbulence of the air flowthrough the nozzles, the used anemometer probe was notable to measure the maximum velocity of 12 m/s (this pointis further elaborated later). The measured values were
reproducible and are used in the following. For modelingwork, a more suitable method should be used, as forexample, particle image velocimetry (Senter and Solliec2007).
The exhaust air can be recirculated or exchanged for freshair if lower humidity or cooler air is needed. The ability toseparate the relative inlet air volume flow into the top andbottom air ducts adds flexibility to the control of theprocess conditions.
In the present work, a 10-m tunnel oven was used forvalidation of the new batch oven. The oven has two zonesand for the reported experiments, the same conditions wereused in the two zones. This oven is placed at Haas-MeinckeA/S’s production facility in Skovlunde, Denmark. Its mainuse is as a test facility for costumers testing new products orprocesses. According to Haas-Meincke A/S, products bakedin this oven are considered representative for productsbaked in larger tunnel ovens with similar settings.
The Batch Oven. The main feature in the new oven is itsconvective system. The system has the same options forcontrol as the tunnel ovens, such as the air temperature andthe top : bottom inlet air distribution. Additionally, the airvelocity can be regulated. The convective system is shownschematically in the Fig. 2.
The hot inlet air enters the baking chamber through13 mm nozzles in the air ducts. The nozzles are positionedin a staggered pattern and the air jets are guided by therounded rim of the nozzles. The batch oven pattern anddimensions are shown in Fig. 3.
To avoid spot burning and to simulate the movement ofthe baking band through the tunnel oven, the air ducts(above and below the products) are movable. A movement(left to right) of 0.1 m equals half the distance between twonozzles on the same horizontal line. For the product, thisdistance of oscillation will correspond to traveling througha tunnel oven giving a uniform exposure to the inlet air.
The differences in the product movement in a tunneloven and the batch oven were considered early in the designprocess. In the batch oven, the movement will be slowlyoscillating, while the movement in the tunnel oven will becontinuous in one direction. In other studies, such as Baikand Marcotte 2003, the air velocity around the product hasbeen expressed as the “relative air velocity.” In tunnel ovens,the movement of the baking band has been showed to influ-ence the air flow pattern around the products, when thetotal air flow is low. Low air flow is normally seen withnatural convection, e.g., caused by direct or radiationheating. In the present study, forced convection was applied.With the stated average linear inlet air velocity of 12 m/s, orthe measured velocities of 7–8 m/s, and a band velocity of0.02 m/s (= the velocity for a baking time of 8 min in the
FIG. 1. A SCHEMATIC OF AN INDIRECTLY FIRED CONVECTIVETUNNEL OVEN (ONE ZONE IS SHOWN IN THE FIGURE)The baking band is not included in the figure. It would be situated atan appropriate distance between the two inlet air ducts. The wide(orange) arrow show the exhaust and recirculation system for the air(Haas-Meincke A/S ©).
M.S. ANDRESEN, J. RISUM and J. ADLER-NISSEN BATCH OVEN FOR INVESTIGATION OF CONTINUOUS BAKING
3Journal of Food Process Engineering •• (2013) ••–•• © 2013 Wiley Periodicals, Inc.

10 m oven), the inlet air velocity is around 600 (or 350)times that of the product. Therefore, the effects of side-to-side movement versus the one-directional movement do notsignificantly influence the air flow pattern compared to astationary or a steadily moving band (Senter and Solliec2007).
An additional feature of the air ducts is an option toadjust the distance from the inlet nozzles to the baking tray.The adjustable distances are 0–0.27 m above and 0.03–0.15 m below the product.
Measuring and Control Equipment. In the batchoven, the product weight is measured continuously duringbaking. The baking tray is placed on a scaffold with fourlegs passing through holes in the bottom of the ovenchamber and resting on a scale, Signum Suprime level 1,Sartorius (Goettingen, Germany). It has a maximum loadcapacity of 35 kg with an accuracy of 0.1 g. The high capac-ity of the scale is chosen to allow for experiments with dif-ferent tray thicknesses and materials. Air humidity is
measured with a Yokogawa High Temperature HumidityAnalyzers type ZR22G-040 (Tokyo, Japan) in the outlet air.Steam can be injected directly into the oven chamber, con-trolled by a feedback control system from the humiditysensor. The air temperature is measured by two stationarytemperature sensors. The sensors are placed in the airstream between the heating element and the bakingchamber and in the baking chamber above the baking tray,respectively. The oven is designed so that installation ofadditional sensors is possible if needed at a later time. Awindow is placed in the side of the baking chamberenabling visual and possible photographic observations ofthe products during baking.
The Test Product. In the validation experiments, the testproduct was a butter cookie. The recipe, shown in Table 1,was provided by Haas-Meincke A/S as an example of atypical cookie product baked in convection tunnel ovens.After rolling the dough to a height of 6 mm (� 0.5 mm),the cookies were cut with a circular cutter with a diameter
FIG. 2. LEFT: A PICTURE OF THE BAKING AREA IN THE OVEN CHAMBER. RIGHT: A SCHEMATIC ILLUSTRATION OF THE BATCH OVENThe left part (A) is seen from the side, while the rest of the illustration (B–G) is seen from above. H is the height of the oven chamber, L the lengthof oven chamber and air system, W the width of the oven chamber and air systems. A, oven chamber; B, humidity sensor; C, fresh air inlet;D, ventilator; E, air exhaust; F, heating unit; G, ducts adjusting top and bottom inlet air.
FIG. 3. DIMENSIONS OF THE INLET PART OFTHE AIR DUCTS, DISTANCES GIVEN IN MMThe upper air duct has outlet suction alongthe two 800 mm sides.
BATCH OVEN FOR INVESTIGATION OF CONTINUOUS BAKING M.S. ANDRESEN, J. RISUM and J. ADLER-NISSEN
4 Journal of Food Process Engineering •• (2013) ••–•• © 2013 Wiley Periodicals, Inc.

of 45 mm. The same cutter was used for all cookies.Between shaping and baking, the cookies were stored cold(5C), covered by plastic film to avoid dehydration of thesurface. The ingredients were mixed using a Varimixer BearTeddy (5 L) mixer (Varimixer, Charlotte, NC) and rolledusing a Rollmatic manual sheeter (Rollmatic, Schio, Italy).
Validation of the Batch Oven
A two-step validation process was carried out. The first stepwas focused only on the batch oven itself. The second stepon reproducing tunnel oven products. The product qualityparameters in the comparison tests are the product colorand the weight loss during baking.
These two quality parameters were chosen as they repre-sent both the heat and the mass transfer processes takingplace during baking. The weight loss is the total loss forbaking and cooling measured with 0.1 g accuracy.
The color of the cookies was evaluated by visual compari-son and by objective measurements of the surface. Thevisual evaluation was based on comparison with pictures ofcookies representing a six-step scale (1–6), in increasingdegree of browning (Fig. 4). If a cookie was assessed to bebetween two categories, it was systematically assigned thelowest value. Cookies ranked below 1 are not completely
baked. Cookies in categories 1 through 5 are increasinglybrowned, but still acceptable, and cookies in category 6 arestarting to scorch at the sides.
While the subjective categorization of the products is afast and global method of evaluation, taking the wholesurface into account, a more objective way of evaluationwas also investigated. For this, the L* value in the CIEL*a*b* system was used. Using the L* value as a measurefor the degree of browning is a widely accepted methodapplied by other researchers such as (Zanoni et al. 1995;Broyart et al. 1998; Baik 2000a; Ahrne et al. 2007; Purlisand Salvadori 2009). After baking and cooling, photo-graphic pictures were taken of the cookies together with areference color matrix. Using Adobe Photoshop Lightroom4 (Adobe Systems Incorporated, San Jose, CA) and PictureWindows Pro v. 6.0.9 by Digital Light & Color (DigitalLight & Color, Cambridge, MA), corrections were made forthe lighting and a blur was laid across the cookie surface.The average L* value of 9 pixels was measured at fourpoints at a distance of approximately 1/3 of the way fromthe edge to the center, and at the center. The average ofthese five points gives a measure for the surface lightnessand the standard deviation a measure for the variationacross the surface for each cookie. Determination of the L*value: an area with standard gray value was used for expo-sure compensation of the singular exposures (R = 90%;G = 90% and B = 90%). Then, the relevant RGB values wereread at the cursor position at specified points on the surfaceof the samples. The recorded values were transformed toXYZ values and further to CIE L*a*b* – values with stan-dard illuminant D65. The calculations were performed usingan online calculator (http://www.easyrgb.com).
Uniform Heating and Baking
The oven’s ability to heat and bake evenly was investigatedin two steps:(1) Measurements of the local heat transfer coefficientsacross the baking tray.(2) Browning of cookies across the baking tray.
Measurements of the local heat transfer coefficients wereused to examine whether the air flow and baking conditionsare uniform across the baking plate. The heat transfer coef-ficient from air to a solid body is a function of the air veloc-ity around the body, the thermophysical properties of theair, and the geometry of the body (including surface rough-ness). This is conventionally expressed as different relationsbetween the dimensionless Nusselt’s number (Nu), theReynold’s number (Re) and the Prandtl’s number (Pr) TheNusselt’s number given in Eq. (1) is a function of the heattransfer coefficient, h [W/(m2K)], the characteristic lengthof the investigated body, Dh (m) and the thermal conductiv-ity of the fluid, kf (W/[m·K]):
TABLE 1. COMPOSITION AND MIXING PROCEDURE FOR 1.7 KGCOOKIE DOUGH
Ingredients Mass (g)
Icing sugar 333Margarine 500Vanilla extract 3.3Mix until even textureWhole egg 33.3Skimmed milk powder 12.5Salt 3.3Sodium bicarbonate 0.4Water 8.3Mix until even textureCorn starch 167Wheat cake flour 667Mix until an even textured dough is obtainedFinish by gathering the dough by handTotal weight 1,728
FIG. 4. STANDARD GRADING OF COOKIES, ACCORDING TO THEDEGREE OF BROWNINGCookies baked less than group 1 are not considered baked throughand cookies darker than group 6 are considered burned.
M.S. ANDRESEN, J. RISUM and J. ADLER-NISSEN BATCH OVEN FOR INVESTIGATION OF CONTINUOUS BAKING
5Journal of Food Process Engineering •• (2013) ••–•• © 2013 Wiley Periodicals, Inc.

Nuh D
k= ⋅ h
f
(1)
Equations for the Reynold’s and Prandtl’s numbers aregiven in Eqs (2a) and (2b).
Re v D= ⋅ ⋅h ρ μ (2a)
Pr C k= ⋅p fμ (2b)
v is the air velocity (m/s), r, m and Cp are respectively thedensity (kg/m3), viscosity (Pa s) and heat capacity of the air(J/[kg K]).
As appears, Nu and hence h is independent of the thermalproperties of the solid body heated or cooled by convectiveheat transfer (Achenbach 1977).
For a flat plane geometry, the Nusselt relation is given inEq. (3) (Carson et al. 2006).
Nu Re Pr= 0 6651
2
1
3. (3)
Experimentally, it is very difficult to estimate the local airvelocity by the product accurately as it is disturbed by localturbulence (Carson et al. 2006). Therefore, the experimen-tally based lumped capacitance model is usually appliedinstead. This method is described in the following.
The governing hypothesis in the lumped capacitancemodel is that a body with a Biot number (h·Dh/kp) below 0.1(preferably <0.01), is subject to a uniform temperature dis-tribution, where kp is the thermal capacity of the product.When this is the case, Eq. (4) can be used to calculate theheat transfer coefficient (Mills 1995; Nitin and Karwe 2001;Carson et al. 2006; Sakin et al. 2009):
hT T
T T
mc
At= − −
−⎛⎝⎜
⎞⎠⎟ln s
s
p
0
(4)
where Ts is the temperature of the surroundings (K), T isthe product temperature (K), T0 is the initial temperature(K), m is the mass of the disk (kg), cp is the specific heatcapacity of the disk material (J/[kg K]), A is the surface area(m2), and t is the heating time (s).
With the characteristic length of the cookies being halfthe height and a thermal conductivity at approximately 0.2W/(m·K) (based on dough composition and Choi and Okos1986) the Biot number will exceed 0.1 at h > 6.7 W/(m2K).This value is estimated to be below the investigated range.Therefore, the cookies must be substituted by a materialwith a higher thermal conductivity. Following the work of(Nitin and Karwe 2001) and (Sakin et al. 2009), aluminumis used for the temperature measurements. Cylinders(height 6 cm, diameter 4 cm) were used and the local heattransfer coefficients were measured at 24 different positionsacross the baking tray.
Using k = 170 W/(m·K) for aluminum, it can be calcu-lated that the Biot number is below 0.01 as long as the heattransfer coefficient does not exceed 230 W/(m2K) (whichwould be an extremely high value for convection heating byair), thus the conditions for using Eq. (4) are fulfilled. Tokeep the conditions as similar as possible to the actualbaking process, the standard baking tray was used withoutinsulation or other modifications. The baking tray wascooled before the measurements to minimize excess heattransfer from a preheated baking tray.
Cookies were baked in different position across thebaking tray and evaluated for even browning. The cookieswere prepared following the recipe in Table 1. The cookiepositions were the same as those used in the heat transfermeasurements.
The oven settings for both experiments were equal top :bottom inlet air distribution, with dampers opened to 50%,air temperature of 170C and a baking time of 8 min. Afterbaking, the browning was evaluated based on the seven-stepscale only. The distance from the inlet nozzles to theproduct was 15.4 cm.
Comparison to Tunnel Oven Products
When similar settings are used in the batch and tunneloven, comparable product qualities must be obtained. Thedescribed butter cookies were used for comparison tests.The oven parameters used as set points were the tempera-ture by the band or baking tray, the inlet air velocity, the dis-tribution between top : bottom inlet air, the air duct to banddistances and the baking time. Browning and the totalweight loss were used as product quality parameters andmeasured as described.
The robustness of the reproducibility was tested bychanging one of the initial processing parameters, the airtemperature. All the tested temperatures were 160C, 170C,190C and 200C.
A 10-m indirectly fired convection tunnel oven was usedas reference oven. The two zones of the oven were set tothe same temperature and inlet air distribution in all thereported baking experiments. It was possible to measure thetemperature just above the baking band during processing.This was done through a hatch halfway down the length ofthe oven. Measuring the air velocity was more complicated.It was not possible to reach a sufficient number of inletnozzles through the hatch; therefore, two maintenancepanels needed to be removed to gain sufficient access andthe measurements were carried out at room temperature.The change in temperature will only affects the flow patternslightly (Marcroft and Karwe 1999). Accordingly, the veloc-ity adjustments in the batch oven were done at roomtemperature.
BATCH OVEN FOR INVESTIGATION OF CONTINUOUS BAKING M.S. ANDRESEN, J. RISUM and J. ADLER-NISSEN
6 Journal of Food Process Engineering •• (2013) ••–•• © 2013 Wiley Periodicals, Inc.

When the air enters the baking chamber through the inletnozzles, the air flow pattern becomes diffused and is farfrom a fully developed flow as discussed previously in TheBatch Oven. Two types of anemometer sensors were testedin the pre-experimental work, a rotating vane and a pitottube connected to a Testo 400 logging unit, Testo AG, (Len-zkirch, Germany). To focus the inlet air stream, a plastictube was used to frame the inlet hole during measurements.While the distance between the band and the inlet nozzlesdid not allow for the flow to be fully developed, it increasedthe accuracy of the velocity measurements.
While good reproducibility was seen between the differ-ent nozzles and repetitions at the same nozzle, there was adifference between the two sensors. The measurements withthe vane probe only showed an average inlet velocity around2 m/s while the pitot tube showed an average inlet velocityof approximately 7.5 m/s. The oven manufacturer reportsthe mean linear velocity to be 12 m/s; therefore, the pitottube with the plastic tube was chosen as the velocity mea-surement system. The measurements were used solely toadjust the batch oven and not for further calculations. Theaverage inlet velocities were measured once in 16 nozzles inthe batch oven and twice in the tunnel oven. Each of thesemeasurements is an average value obtained over 10 s with asample rate of 1/s.
RESULTS AND DISCUSSION
Even Heating and Baking in the Batch Oven
The average heat transfer coefficient measured with thelumped capacity method from the 24 measuring pointsacross the baking tray was 62 W/(m2K) with a relative stan-dard deviation of 4.5%. The total range covering 57 to 68 W/(m2K). An overview is shown in Fig. 5. The variation is small
and indicates uniform heating across the baking tray; nosystematic variations were seen over the measured area.
Following the observation that no significant differenceswere seen for the heat transfer coefficients across the bakingtray, it was investigated if the browning of cookies was like-wise uniform across the baking tray. Cookies were baked inthe same positions and under the same conditions as usedfor the heat transfer measurements. A picture of a batch ofcookies can be seen in Fig. 6. All cookies were ranked in cat-egory 2. The results indicate that with the measured varia-tion in heat transfer coefficients, the browning, whenevaluated as in this work, does also not vary significantly.
As discussed previously, the measured heat transfer coef-ficients are not directly applicable to the cookies because ofdifferences in geometry and surface roughness between alu-minum cylinders and cookies. However, for cookies ofsimilar size and surface roughness, the ratio between theNusselt’s number of the aluminum cylinders and the Nus-selt’s number of the cookies must be a constant. Thus,uniform values of the measured heat transfer coefficientsimply that the heat transfer coefficients of the cookies arealso uniform across the baking tray. This is in accordancewith the observation that the browning of the cookies isuniform.
Comparison of Baking in the Batch and aTunnel Oven
Air Velocities. The air velocities measured in the tunneloven are shown in Table 2 along with the best match
FIG. 5. THE MEASURED HEAT TRANSFER COEFFICIENTS (W/[M2K])The orientation in the oven is given as “front/back,” “left/right” andthe positions of the window and the door are indicated.
FIG. 6. COOKIES BAKED IN THE BATCH OVEN
M.S. ANDRESEN, J. RISUM and J. ADLER-NISSEN BATCH OVEN FOR INVESTIGATION OF CONTINUOUS BAKING
7Journal of Food Process Engineering •• (2013) ••–•• © 2013 Wiley Periodicals, Inc.

obtained in the batch oven. A two-side Student’s t-testshowed no significant difference between the mean valuesfor either top or bottom air ducts (P = 0.12).
Results of Comparisons. Based on the used qualityparameters, good reproducibility was seen (Tables 3 and 4,rows for T = 170C). Even with the evident differencesbetween a batch and a tunnel oven, the baking processappears to be reproducible in the new oven.
The average measured L* values were for cookies fromthe tunnel oven 65 and 69 for cookies baked in the batchoven, with standard deviations of 3.2 and 2.8, respectively.Having only 5 or 6 cookies from each oven further statisticalanalysis is not performed. When comparing to the six cat-egories, the cookies were all in category 2.
The average water loss was found as the total mass lossper cookies due to slight variations in the cookie height(� 0.5 mm). Five cookies were measured for the tunneloven, six for the batch oven (Tables 3 and 4); the average
values were found to be 1.2 g/cookie in the tunnel oven and1.3 g/cookie in the batch oven.
Varying the Oven Settings
Using the air speed, inlet air distribution and baking timeof 8 min from the previous experiments, the effects ofchanging the temperature on the product quality was testedboth in the batch and tunnel ovens. The additional testedtemperatures were 160C, 190C and 200C. The product andquality parameters were the same as in the previous experi-ments. The color ranking and the L* values are shown inTable 3, and the weight loss data in Table 4, both includingthe results from the initial comparison experiments.
Considering the L* values, the cookies baked in the batchoven appear slightly lighter than those from the tunneloven. The ranking indicates that the overall impression ofthe cookies was the opposite. This small contradictionmight be a result of the L* value measuring points, notincluding the outer rims of the cookies, which will brownfirst. The weight loss data (Table 4) show little differencesbetween the treatments. For both ovens, a clear trend ofincreasing weight loss with increasing temperatures isobserved.
The quality changes when varying the air temperaturewere overall seen to be similar in the two ovens. However,the quality parameters further indicate that work is neededto enhance the uniformity of baking across the baking trayin the batch oven at higher temperatures. The small contra-dictions between L* values and browning categories callfor a better evaluation method of the global browning
TABLE 2. THE AIR VELOCITIES (M/S) WITH OVENS SET TO A 50:50DISTRIBUTION BETWEEN TOP AND BOTTOM INLET AIR DUCTS,STANDARD DEVIATIONS ARE GIVEN AFTER THE AVERAGE VALUES
Inlet areaTunnel oven (m/s) Batch oven (m/s)Average Average
Top 7.1 (0.7) 6.8 (0.2)Bottom 7.8 (0.5) 8.0 (0.2)
Number of measurements: n = 32 in the batch oven and n = 16 in thebatch oven.
TABLE 3. DATA FOR VALIDATIONEXPERIMENT, COMPARING THE BATCH OVENWITH THE TUNNEL OVEN, STANDARDDEVIATIONS ARE SHOWN AFTER AVERAGEVALUES
Temperature (C)
Color evaluation (categories) Lightness (average L* values)
Tunnel Batch Tunnel Batch
160 1, 1, 1, 1, 1 2, 1, 2, 1, 1, 1 65 (5.2) 72 (1.5)170* 2, 2, 2, 2, 2 2, 2, 2, 2, 2, 2 65 (3.2) 69 (2.8)190 4, 4, 4, 4, 4 4, 4, 4, 4, 3, 4 54 (4.2) 53 (5.7)†200 5, 5, 5, 5, 5 5, 5, 5, 5, 6, 5 41 (5.7) 45 (4.6)
The color categories are shown for all cookies. n = 5 cookies for the tunnel oven or and n = 6cookies for the batch oven.* Results from the initial comparison experiments.† Only 5 of the 6 cookies were available for this measurement.
TABLE 4. THE WEIGHT LOSS FOR EACHCOOKIE (G/COOKIE) ARE SHOWN FOLLOWEDBY THE AVERAGE VALUETemperature (C)
Weight loss (g/cookie)
Tunnel Batch
160 1.2, 1.2, 1.2, 1.1, 1.1 (1.2) 1.2, 1.2, 1.2, 1.2, 1.2, 1.2 (1.2)170* 1.2, 1.2, 1.2, 1.3, 1.2 (1.2) 1.3, 1.3, 1.3, 1.2, 1.2, 1.3 (1.3)190 1.4, 1.4, 1.4, 1.4, 1.3 (1.4) 1.3, 1.5, 1.5, 1.4, 1.3, 1.4 (1.4)200 1.5, 1.5, 1.5, 1.5, 1.5 (1.5) 1.3, 1.5, 1.2, 1.6, 1.5, 1.5 (1.4)
* Results from the initial comparison experiments.
BATCH OVEN FOR INVESTIGATION OF CONTINUOUS BAKING M.S. ANDRESEN, J. RISUM and J. ADLER-NISSEN
8 Journal of Food Process Engineering •• (2013) ••–•• © 2013 Wiley Periodicals, Inc.

impression of cookies, possibly an integration of L* valuesat the upper surface could be used.
Besides a more thorough investigation and possiblyrevalidation of the uniformity of heating in the batch oven,future work should include a flow measuring system. Thiswill enable a more controlled air flow and help in futurework with modeling of the heat and mass transfer in bakeryproducts. A relative wide-ranging browning category scalewith all acceptable degrees of browning was applied. If onlya small range of browning was to be evaluated in futurework, two of the categories could be selected and furtherdivided into smaller intervals for a more precise estimate ofthe degree of browning.
In the future, the oven will be used to characterize theeffect of varying process parameters on the product quality.Especially, process parameters, which are not easily changedin a full-scale tunnel oven, can be investigated. An examplemight be the effect of changing the inlet air velocity, andthus, the heat transfer coefficient, on the product quality.
CONCLUSION
A new experimental batch oven has been designed and con-structed to simulate baking in continuous tunnel ovens.Especially, the convective inlet air system has been con-structed as close to the investigated tunnel oven as possible,with the addition of adjustable air velocity. It has beenshowed that heating and baking are uniform across thebaking surface in the new oven. Furthermore, it is possibleto reproduce baking processes as seen in continuous con-vective tunnel ovens. Butter cookies were used as a modelproduct to investigate the reproducibility.
ACKNOWLEDGMENTS
The authors would like to thank the Danish Ministry ofFood, Agriculture and Fisheries for grants supporting thisresearch (J.no. 3414-08-02280). We would also like to thankthe staff at Haas-Meincke for assistance and good collabora-tion throughout this project.
REFERENCES
ACHENBACH, E. 1977. The effect of surface roughness on theheat transfer from a circular cylinder to the cross flow of air.Int. J. Heat Mass Transf. 20, 359–369.
AHRNE, L., ANDERSSON, C., FLOBERG, P., ROSEN, J. andLINGNERT, H. 2007. Effect of crust temperature and watercontent on acrylamide formation during baking of whitebread: Steam and falling temperature baking. LWT-Food Sci.Technol. 40(10), 1708–1715.
BAIK, O. 2000a. Cake baking in tunnel type multi-zoneindustrial ovens Part I. Characterization of baking conditions.Food Res. Int. 33(7), 587–598.
BAIK, O. 2000b. Cake baking in tunnel type multi-zoneindustrial ovens Part II. Evaluation of quality parameters.Food Res. Int. 33(7), 599–607.
BAIK, O. and MARCOTTE, M. 2003. Modeling the moisturediffusivity in a baking cake. J. Food Eng. 56(1), 27–36.
BROYART, B., TRYSTRAM, G. and DUQUENOY, A. 1998.Predicting colour kinetics during cracker baking. J. Food Eng.35, 351–368.
CARSON, J.K., WILLIX, J. and NORTH, M.F. 2006.Measurements of heat transfer coefficients within convectionovens. J. Food Eng. 72, 293–301.
CHOI, Y. and OKOS, M.R. 1986. Effects of temperature andcomposition on the thermal properties of foods. In FoodEngineering and Process Applications: Proceedings of the FourthInternational Congress on Engineering and Food (held between7 and 10 July at Edmonton, Alberta, Canada), pp. 93–101,Elsevier Applied Science Publishers.
FROST, D.J., ADHIKARI, K. and LEWIS, D.S. 2011. Effect ofbarley flour on the physical and sensory characteristics ofchocolate chip cookies. J. Food Sci. Technol. 48(5), 569–576.
MANLEY, D. 2000. Technology of Biscuits, Crackers and Cookies,3rd Ed., p. 51, Woodhead Publishing Limited, Cambridge,UK.
MARCROFT, H.E. and KARWE, M.V. 1999. Flow field in a hotair jet impingement oven – part I: A single impinging jet.J. Food Process. Preserv. 23, 217–233.
MILLS, A.F. 1995. Heat and Mass Transfer, pp. 29–33, Richard D.Irwin, Inc, Homewood, IL.
MIN, B., BAE, I.Y., LEE, H.G., YOO, S. and LEE, S. 2010.Utilization of pectin-enriched materials from apple pomace asa fat replacer in a model food system. Bioresour. Technol.101(14), 5414–5418.
MIRADE, P., DAUDIN, J., DUCEPT, F., TRYSTRAM, G. andCLEMENT, J. 2004. Characterization and CFD modelling ofair temperature and velocity profiles in an industrial biscuitbaking tunnel oven. Food Res. Int. 37(10), 1031–1039.
NITIN, N. and KARWE, M.V. 2001. Heat transfer coefficient forcookie shaped objects in a hot air jet impingement oven.J. Food Process Eng. 24, 51–69.
PAREYT, B., TALHAOUI, F., KERCKHOFS, G., BRIJS, K.,GOESAERT, H., WEVERS, M. and DELCOUR, J.A. 2009.The role of sugar and fat in sugar-snap cookies: Structuraland textural properties. J. Food Eng. 90(3), 400–408.
PURLIS, E. and SALVADORI, V.O. 2009. Modelling thebrowning of bread during baking. Food Res. Int. 42(7),865–870.
SAKIN, M., KAYMAK-ERTEKIN, F. and ILICALI, C. 2009.Convection and radiation combined surface heat transfercoefficient in baking ovens. J. Food Eng. 94, 344–349.
SARKAR, A. and SINGH, R.P. 2003. Spatial variation ofconvective heat transfer coefficient in air impingementapplications. J. Food Sci. 68, 910–916.
M.S. ANDRESEN, J. RISUM and J. ADLER-NISSEN BATCH OVEN FOR INVESTIGATION OF CONTINUOUS BAKING
9Journal of Food Process Engineering •• (2013) ••–•• © 2013 Wiley Periodicals, Inc.

SARKAR, A., NITIN, N., KARWE, M.V. and SINGH, R.P. 2004.Fluid flow and heat transfer in air jet impingement in foodprocessing. J. Food Sci. 69(4), 113–122.
SENTER, J. and SOLLIEC, C. 2007. Flow field analysis of aturbulent slot air jet impinging on a moving flat surface. Int.J. Heat Fluid Flow 28, 708–719.
SOMMIER, A., CHIRON, H., COLONNA, P., DELLA VALLE, G.and ROUILLÉ, J. 2005. An instrumented pilot scale oven forthe study of French bread baking. J. Food Eng. 69(1), 97–106.
ZANONI, B., PERI, C. and BRUNO, D. 1995. Modelling ofbrowning kinetics of bread crust during baking. Lebensm.Wiss. Technol. 28(6), 604–609.
ZAREIFARD, M.R., MARCOTTE, M. and DOSTIE, M. 2006.A method for balancing heat fluxes validated for a newlydesigned pilot plant oven. J. Food Eng. 76(3), 303–312.
ZAREIFARD, M.R., BOISSONNEAULT, V. and MARCOTTE,M. 2009. Bakery product characteristics as influenced byconvection heat flux. Food Res. Int. 42(7), 856–864.
BATCH OVEN FOR INVESTIGATION OF CONTINUOUS BAKING M.S. ANDRESEN, J. RISUM and J. ADLER-NISSEN
10 Journal of Food Process Engineering •• (2013) ••–•• © 2013 Wiley Periodicals, Inc.

170

Appendix E
Abstract: Investigating the influenceof air velocity on the quality ofbutter cookies
This appendix contains the abstract “Investigating the influence of air velocity on thequality of butter cookies”, the results were presented as an oral presentation at the Con-ference of Food Engineering, Leesburg, VA, USA, April 2012.
171

Investigating the influence of air velocity on the quality of butter cookies
Mette Stenby and Jens Adler-Nissen
Technical University of Denmark, National Food Institute, Kgs. Lyngby, Denmark.
In the baking industry the operators’ knowledge of the products and the processing
equipment is important for the daily operations. This is, however, not the ideal basis for a
rational optimization of processes and equipment. Together with a manufacturer of
industrial tunnel ovens the authors are engaged in a joint research project which aims at
increasing the quantitative knowledge of baking processes. The overall scope of the
project is to develop robust product-process models for baking in convective tunnel
ovens. These models should be able to predict changes in the product quality based on
changes in the process conditions. The present work is concerned with both the relation
between the heat transfer coefficient and the mass loss, and the influence of the air
velocity in the oven on these factors.
The test product in this work is a simple butter cookie. The quality parameters used to
estimate the effects of changing the air velocity are the average lightness (L*) on the
surface of the cookie (correlated to browning), and the overall product mass loss during
baking. The surface browning is mainly a result of Maillard reactions. These reactions do
not occur until the surface is sufficiently dry and have a sufficiently high temperature.
Both quality parameters are functions of the heat and mass transfer at the surface, and are
therefore considered to be good indicators for the effects of changing the air velocity.
The experimental work was done in a specially designed pilot plant batch oven, where the
air system has been designed to mimic the air flow in industrial convection tunnel ovens.
The air temperature, the air velocity, and the distance from air ducts to product are
adjustable along with the type of the baking tray, as different designs and materials are
used for baking bands in the industry. The batch oven is equipped with temperature
sensors, a humidity sensor, and the ability to measure the product weight continuously
during baking. Especially the product weight was used to characterize the baking process
when preparing the butter cookies. From the experimental work it was found that it is
possible to estimate the effect on the quality parameters from changes in air velocity. A
good correlation was found between the convective heat transfer coefficient and the mass
loss. The mathematical model was tested against cookies baked in a tunnel oven, and the
quality parameters were well predicted when the heat transfer coefficient was known
from separate measurements.

Appendix F
Abstract: Investigation of unevenmass transfer in butter cookiescombining experimental work andfinite element modeling
This appendix contains the manuscript “Investigation of uneven mass transfer in buttercookies combining experimental work and finite element modeling”. The manuscript wassubmitted to International Journal of Food Engineering, June 17, 2013.
173

1
Investigation of uneven mass transfer in butter cookies combining experimental work and finite element modeling
Abstract During baking of cookies, the baking tray is assumed to influence evaporation and thus the product properties. However, the magnitude and importance of this influence is not well understood. The purpose of this work is to improve this understanding through numerical modeling combined with experimental data. The influence of the barrier created by the baking tray on the overall water evaporation and the product temperature is examined. During baking the mass loss and the center temperature are continuously measured for butter cookies. Heat and mass transfer equations are subsequently solved numerically and optimized against the experimental data. Three simulation set-ups are investigated. 1) Symmetrical mass transfer, with equal boundary conditions for all surfaces, 2) an asymmetric set-up with decreased mass transfer from the bottom surface, compared to the top and side surfaces, and 3) an asymmetric set-up with no evaporation from bottom surface, in contact with the baking tray. The experimental work is carried out in a specially designed pilot plant batch oven. The oven is a unique experimental oven constructed to emulate the conditions in an indirectly heat continuous convection tunnel oven. Good agreement is obtained between simulations and measurements for the over-all mass loss the three simulation set-ups. However comparing the simulated and measured development in the center temperature it is found that an assumption of no evaporation from the bottom surface seems unrealistic; thus, evaporation through the bottom surface of the cookie is important for combined heat and mass transfer of cookie products.
Introduction Work aiming at increasing the knowledge of the relation between baking process conditions and the properties of the bakery products is of high interest and value for both equipment suppliers and the bakery industry. Such work can help optimize the baking process, through improved process planning, oven design, and construction. In the present work new data from a unique pilot scale batch oven is combined with finite element modeling to explore mass transfer during baking of cookies. The oven is constructed to emulate continuous tunnel oven baking and data is continuously recorded during the entire baking process (1). This type of data is scarce and detailed modeling will require even more data in the future.
Mathematical simulations of heat and mass transfer in bakery products during baking are widely used to explain and understand the product and quality changes taking place in the transition from dough to finished product (2-9). The focus of the present study is to incorporate the effect of covered surfaces, such as the bottom surface of a cookie against a baking tray, on the product mass transfer mechanisms during baking.
Different approaches are seen for heat and mass transfer modeling in food products. Bakery products may be simplified so that they are simulated as infinite slabs (10), infinite cylinders (11), or finite cylinders (7,12). The first two have heat and mass transfer in one direction only, while the latter consider transport processes in two dimensions through the product.
In some cases the effect of a mould or baking tray is not included, and the model is set up having equal boundary conditions at all outer surfaces. In this way an equal evaporation is obtained in all directions away from the product center (11,12). In other cases, for example for products such as biscuits, cakes, and pancakes the water removal may be assumed to

2
happen only from the free product surfaces. In this case no evaporation is included from the covered surfaces to the surroundings (2,10,13,14).
A model for the heat and mass transfer in ring cake baking is presented by Sakin-Yilmazer et al. (7). They include the effect of the mould covering the side and bottom surfaces of the product by lowering the mass transfer. In their presented modeling work the ratio between the mass transfer coefficients applied for the side and top surfaces is 0.65, and 0.7 between the bottom and top surfaces (7).
Figure 1. Bottom surface of butter cookie. Bubbles caused by water vapor are seen across the surface.
On the bottom surface of butter cookies, the product used as a model in this work, bubble formation is clearly observed as seen in Figure 1. The most likely mechanism describing these bubbles is that they arise from water evaporating on the bottom surface when leaving the product. The water vapor then moves along the bottom surface, toward the outer edges, and away from the product. It is interesting to investigate how this evaporation at the bottom surface influences the over-all heat and mass transfer in the product. Some bakery products are baked on steel plates while others on perforated plates or steel meshes. This study can help clarify if the choice of tray design influences the heating and drying of the product during baking, assuming the heat transfer is not affected by the thickness or material of the baking tray. Thick baking trays or stone surfaces will influence the heat transfer and are not considered in the present work. The mass flux is examined as the relative evaporation rate between the free and covered surfaces.
In the present work the scope is to develop a robust model, which is sufficiently simple to enable easy modeling, but still complex enough to give a good description of the investigated product parameters. The focus is on heat and mass transfer, and the validation of the model is made by comparison with the measured mass loss and center product temperature during baking. Three set-ups are investigated: a symmetrical case with equal mass transfer boundary conditions, an asymmetrical set-up with no mass transfer from the bottom surface, and an intermediate set-up with a finite mass transfer coefficient at the bottom surface lower than that of the free surfaces.
In the present work physically based mathematical models, with empirically determined or calculated parameters, are solved numerically for heat and mass transfer during baking of butter cookies. The numerical solution method is by use of a finite element method (FEM) with the commercial software COMSOL 4.3. This method has been successfully applied in other studies solving heat and mass transfer equations for different food products, a few examples are: contact baking (2), bread baking (11,15,16), chicken patties (17), and other bakery products such as biscuits and cakes (3,12).
The purpose of this work is to investigate the influences of the baking tray on the mass flux, through comparison of modeling work and experimental data obtained from a unique batch oven specially designed to emulate continuous tunnel oven baking processes (1). The

3
oven was designed and constructed in collaboration with the company Haas-Meincke A/S1, manufacturers of equipment for the bakery industry, including continuous tunnel ovens. The control parameters used for comparison are the product center temperature and the overall evaporation of water.
Materials and Methods Batch oven The butter cookies were baked in a specially designed batch oven. The interior of the oven chamber and its convective system are shown in Figure 2. In order to avoid spot burning the air ducts, with inlet air holes above and below the baking tray, move from side to side during baking, thus simulating the conditions of a baking band moving relatively to the stationary air ducts in a tunnel oven.
Figure 2 2a: A picture taken through a side window in the oven, showing the inlet air nozzles above and below the baking tray. 2b: A schematic illustration of the oven and the convective system. The left part of the schematic (A) is seen from the side, while the rest of the illustration (B - G) is seen from above. H is the height of the oven chamber, L the length of oven chamber and air system, W the width of the oven chamber and air systems. A - oven chamber, B - humidity sensor, C - fresh air inlet, D - ventilator, E - air exhaust, F - heating unit, G - ducts adjusting top and bottom inlet air.
In the present work the ability of the oven to continuously measure the product weight is of special importance in relation to validation of the mathematical model. The baking tray and its support structure are placed on a scale, Signum Suprime level 1 with a capacity and precision of 35 kg ± 0.1 g (Germany). Removable sensors may be used to measure the product temperature, as described below. Measuring the product center temperature The center temperature of the cookies was measured by placing the thermocouple sensors (Type T) between two round slabs of dough. Each of these having the same diameter (45 mm) and half the thickness of the cookies used for the weight measurement experiments (3 mm), creating a cookie with a total height of 6 mm. The thermocouple sensors were placed as close to the center as possible. A total of 14 measurements were obtained from cookies baked at 180°C for 840 s. Due to the possible influence of the thermocouples on the weight and weight measurements, the temperature and product weight were not measured in the same experiments. Weight loss measurements Cookies for the weight loss measurements were shaped with a diameter of 45 mm and rolled to a height of 6 mm. The cookies were baked at 180°C for 480 s. During baking the weight of the cookies was measured continuously. The weight loss was measured as the average of 12 cookies with three repetitions. In the following the weight loss is given as a mass fraction 1 Haas-Meinck A/S, www.haas.com

4
(MF), corresponding to the time dependent weight divided by the initial weight of the cookies as shown in Equation (1).
MF (1)
Where m(t) is the time dependent weight of the cookies and is the initial weight of the cookies. Periodic disturbances were observed when the air ducts were moving from side to side in the oven. These disturbances resulted in extreme weight measurements. In the present work measurements outside the mass fractional interval [0.860:1.035] are considered outliers and have been removed from the dataset. The limits are determined based on an empirical assessment of the datasets. Butter cookie recipe The examined butter cookies were prepared following the recipe in Table 1, provided by Haas-Meincke A/S as an example of a typical industrial cookie product. The ingredients were mixed using a Varimixer Teddy (5L) mixer, and rolled using a Rollmatic manual sheeter. The dough was rolled to a height of either 3 or 6 mm (± 0.5 mm) and cookies were cut with a diameter of 45 mm. The same cutter was used for all cookies. Between shaping and baking the cookies were stored cool (5°C), covered by plastic film to avoid dehydration of the surface. The air temperature was set to 180°C. The investigated baking time was 480 s for studies of the weight loss and 840 s for the center temperature measurements. Table 1. Recipe for butter cookies.
Ingredients Mass (g) Icing sugar 333 Margarine 500
Vanilla extract 3.3 Mix until even texture
Whole egg 33.3 Skimmed milk powder 12.5
Salt 3.3 Sodium bicarbonate 0.4
Water 8.3 Mix until even texture
Corn starch 167 Wheat cake flour 667
Mix until an even textured dough is obtained Finish by gathering the dough by hand
Total Weight 1728.1
Mathematical modeling and numerical solution During baking heat is applied to the product causing physical changes and evaporation of water. Water evaporation begins at the product surfaces when the temperature is sufficiently elevated. Hereafter water is transported towards the surface, both as liquid water by diffusion and gaseous water through pockets and holes in the structure. From the surfaces the water evaporates to the surroundings resulting in drying of the product.
Energy is transferred by radiation from the oven walls, conduction through the baking tray, and convection by the air movement around the product. In the present work a forced convection oven is used for baking. In the modeling work only the convective heat transfer is included. Due to the highly reflective surfaces inside the oven and the light color of the product the contribution from radiation can be neglected. Due to the low thickness (1.3 mm) of the steel baking tray, the transversal conduction is not included in the heat transfer

5
equations. The conduction across the baking tray is sufficiently high to assume equivalent heat transfer as for the free surfaces, corresponding to convective heat transfer. The heat and mass transfer processes are shown schematically in Figure 3. Additional assumptions and simplifications for the modeling work are described in the following.
Figure 3. Heat and mass transfer included in the modeling work.
Assumptions and simplifications in the modeling work The following assumptions and simplifications were applied in the modeling work:
Heat transfer: An average heat transfer coefficient is used on the entire surface of the product. In the actual baking process the baking tray and local variations in air flow result in varying heat transfer coefficients around the bakery product. These variations are difficult to measure accurately and would furthermore only affect e.g. local water content, while the loss in total water content should be reasonably well characterized by an average heat transfer coefficient.
Mass transfer: The water transport is modeled as a diffusion process. To simplify the model only average mass transfer parameters are included, combining the transport of liquid water and water vapor. The diffusion coefficient and the mass transfer coefficient should therefore be considered as apparent coefficients.
Volume and porosity: During baking CO2 and water vapor will expand the product volume. Additionally water evaporation and solidification of the cookie matrix will change the structure from dense to porous. In the simulations both the volume and the porosity are kept constant. The lumped effect of the changes in volume and porosity is indirectly included in the solutions since the diffusion and mass transfer coefficients are optimized using experimental data.
Physical properties: The physical properties are calculated throughout the simulations as functions of the water content; all other ingredient properties and relative contents are kept constant.
Governing equations The heat and mass transfer inside the butter cookie and between the product and the baking chamber were calculated from the following equations and their boundary conditions. Similar to general modeling of heat transfer, the heating of the product is described by conduction following Fourier’s law, considering temperature differences in the product as the driving force for energy transport (2,6,7,9,13,17-20).
The cookies are considered as flat finite cylinders and the equations are given in spherical coordinates. The heat transfer equation is shown in Equation (2), with the initial conditions (I.C.) specified in Equation (3) and boundary conditions (B.C.) shown in Equations (4a-c). Due to axial symmetry the heat and mass transport in the angular direction is negligible compared to the transfer in the radial and axial directions.

6
(2)
I.C.
, | (3) B.C.
| Δ | (4a)
| Δ | (4b)
| Δ | (4c)
where ρ is the density of the product [kg/m3], the specific heat [J/(kgK)], T the temperature [K], the initial temperature [K], the temperature of the air [K], t the time [s], the thermal conductivity [W/(mK)], the thermal conductivity [W/(m2K)], Δ the enthalpy of evaporation for water [J/kg], D the diffusion coefficient [m2/s], xw the water content [kg / kg ], r the radial direction [m], R the radius of the product [m], the axial direction [m], Z the height of the product [m]. The water transport is modeled as a diffusion process following Fick’s second law with the concentration gradient in the product considered as the driving force for water transfer (20,21). Mass transfer in the axial and radial directions the equation for diffusion is given in Equation (5). The initial conditions are given in Equation (6) and the boundary conditions in Equations (7a-c).
(5)
I.C. , | (6)
B.C.
|0, ,
, , , (7a)
|0, ,
, , , (7b)
|0, ,
, , , (7c)
where kc is the average mass transfer coefficient [m/s], xw,a is the water fraction in the air [kg /kg ], C, a constant between 0 and 1, describing the effect of the baking tray on the evaporation rate, and , the initiation temperature for water evaporation [K].
In this work three values of C are investigated in the simulation work and compared to the experimental data: A symmetrical set-up in which C = 1.0, meaning that the mass flux is equal through all outer boundaries, and two asymmetric set-ups with C = 0.6 and 0, respectively.
When C = 0.0 a set-up is obtained where the solid baking tray inhibits all evaporation from the bottom surface. With C = 0.6 the mass flux through, and away from, the bottom surface is 60% of the mass flux through the side and top boundaries. The intermediate set-up with C = 0.6 is chosen to obtain a situation with some, but not full, evaporation from the bottom surface, as inspired by the work of Sakin-Yilmazer et al. (7). This value is considered as a working estimate to include an intermediate set-up between full symmetrical evaporation and no evaporation from the bottom surface in the present work.

7
Parameters for the simulations Properties for the dough, the heat transfer coefficient and the mass transfer properties were determined from standard empirical equations and measurements. The methods are described in this section. Product properties The physical properties of product needed for the calculations are: density, specific heat capacity, thermal conductivity, and the diffusion coefficient. All properties were calculated through the simulation based on the changing water content; the properties and content of other constituents (protein, carbohydrates, fat etc.) were kept constant throughout the baking process.
The density was calculated based on the product weight and the assumed constant volume. The average initial weight of 90 un-baked cookies was used as the initial product weight. The density representation in the simulations was as given in Equations (7a-c). , (8)
where is the initial product weight [kg], , is the mass of evaporated water [kg], and V the cookie volume [m3]. The specific heat capacity was calculated based on the cookie dough composition and equations presented in (22), shown in Equation (9). ∑ , (9) where the xi
w is the mass fraction of the ith component and cp,i is the specific heat capacity of the ith component. The thermal conductivity is calculated from a parallel model Equation (10), based on the cookie dough components and their volume fractions (22,23). ∑ (10) where the is the volume fraction of the ith component and is the thermal conductivity of the ith component. The three initial values for the physical properties are shown in Table 2. Table 2. Initial physical properties for the baking process. Subscript 0 indicates the initial value.
Property [unit] Value
ρ0 [kg/m3] 1300
cp,0 [J/(kgK)] 2100
kT,0 [W/(mK)] 0.32
Mass transfer properties For the diffusion coefficient a starting value for the modeling was the experimentally found diffusion coefficient presented by Demirkol et al. (13) for biscuits baked at 190°C with forced convection heating, D = 3.6·10-8 m2/s. The initial value was subsequently optimized against the experimental data.
Water evaporation is dependent on the surface temperature, the relative air humidity, the air velocity by the product, the diffusion of water inside the product towards the surface, and the surface humidity. In Equation (5) these properties are grouped into a mass transfer coefficient representing these aspects in the model. In the present work the mass transfer coefficient is optimized similarly to the diffusion coefficient. An initial value is estimated and subsequently optimized against the experimental data.
Based on the work presented by Demirkol et al. (13) an initial value was found, from the equation given in Equation (11).
, (11)

8
where , is the average mass transfer coefficient over the investigated process [m/s], V is the product volume [m3], A the total surface area [m2], Y0 and Y(t) are the initial and time dependent water concentrations (on dry matter basis).
Figure 4. • Experimental measuring points. – Regression line for an exponential approximation to the evaporations. Measurements of the water content on dry matter basis to determine the evaporation rate for calculation of kc.
Y(t) was empirically estimated as a function of time from initial experimental work measuring the mass loss after different baking times (see Figure 4). The equation is given in Equation (12) on dry matter basis, with the value of found to be 0.1628 kg /kg from measurements on the unbaked cookie dough.
0.1628 . (12) From Equations (11) and (12) the initial value was found to be kc = 2.7·10−6 m/s for a 14 min baking process, with the total surface area being 8.48·10−4 m2 and the cookie volume 9.54·10−6 m3. Heat transfer coefficient The heat transfer coefficient was estimated experimentally by the use of the lumped capacitance model (24). When the physico-chemical properties, the air temperature, and the product temperature are known the heat transfer coefficient of an object with a very low Biot
number ( < 0.1 and preferably < 0.01) can be calculated from Equation (13),
see (24-26).
(13)
The thermal properties of an object do not influence the average heat transfer coefficient. Therefore a different material with no evaporation and a high thermal conductivity can be used to calculate the average heat transfer coefficient. The substitute material in this work was aluminum which has proven a good material for heat transfer studies (26). Still for convective heating the heat transfer coefficient is affected by the flow pattern, influenced by factors such as the geometry and surface roughness (27).
Cylinders in the exact shape of the cookies were found to heat too quickly for the oven to reach a steady state temperature and thus for the model to be valid. Therefore aluminum cylinders with a diameter of 40 mm and a height of 60 mm were used instead. The characteristic length of the two geometries is the diameter, since the air flow close to the cookies is mainly parallel to the baking tray and thus transverse across the cylinders. The values of the diameters are close to each other, but the larger height of the aluminum cylinders may increase the average heat transfer coefficient compared to the actual heat transfer experienced by the cookies. On the other hand the uneven surface of the cookies will result in increased local turbulence, and hence higher heat transfer compared to the smooth

9
aluminum surface. The substitution of the cookie geometry with the aluminum cylinders is therefore considered an acceptable approximation for obtaining heat transfer coefficients.
The same oven settings were applied when measuring the overall average heat transfer coefficient as in the baking experiments. From a triplicate of measurements an average heat transfer coefficient of 63 W/(m2K), with a standard variation of 1 W/(m2K), is found.
Solving the heat and mass transfer equations The heat and mass transfer equations were solved by the use of numerical finite element method (FEM). The mass transfer and diffusion coefficients were optimized through comparisons between the simulation results and the experimental data. The procedures are described below. Finite element modeling When applying FEM the investigated geometry is divided into a finite number of small elements. These elements are connected by node points. In each element the governing equation is approximated by a low order polynomial. The overall solution is thus found by combining all the unique solutions at the node points (28).
In the present work the commercially available FEM solving program COMSOL Multiphysics 4.3 (COMSOL, Sweden) was used, hereafter referred to as COMSOL. In the simulations the multifrontal massively parallel sparse direct solver MUMPS was applied.
A 2D axisymmetric geometry was applied. The 3D rotation of the geometry and the applied mesh is shown in Figure 5 and Figure 6. A 2D mesh consisting of triangular elements was applied on the investigated geometry.
Figure 5. 3D rotation of the 2D axial symmetric geometry.
Figure 6. Mesh on the investigated geometry.
The element size was set using the predefined extra fine element size. To increase the resolution of the solution a boundary layer was added to the mesh with 4 rows and a growth

10
factor of 1.2. The final number of elements was 2642. To ensure the mesh elements were sufficiently small a test simulation with the standard element size extremely fine (total elements 8482) was performed with the initial and D value and equal boundary conditions for the mass flux. Comparing the calculated values for the center temperature and the average mass fraction the largest deviation, found for the center temperature at t = 100s, is 0.32% and the average deviations for the center temperature and mass fraction respectively are: 0.04% and 2.4·10-5 %. With this very small variation the extra fine mesh was considered an acceptable resolution for the simulation work.
A build-in step function was used to incorporate a smooth transition from no-evaporation to evaporation at the boundaries. From the center temperature measurements (Figure 7) a plateau, indicating the initiation of evaporation is found close to 105°C. This value is in good concordance to findings described by (29) reporting that a plateau is generally observed around 103°C in biscuit baking. The utilized step function increases from 0 to 1 over a pre-defined interval, initiating the mass flux at the boundaries. In the present work the applied transition interval was 105-110°C.
Optimizing the mass transfer and diffusion coefficients The mass transfer and diffusion coefficients are only known approximately. Through optimization by comparison to the experimental data plausible and realistic values for these coefficients are found. The optimization scheme is based on comparisons between the experimental data and matrices of 100 simulations. The 100 simulations are combinations of 10 and 10 D values. In COMSOL these simulations are generated through a "parameter sweep" with two variables. The and D values were distributed evenly on a logarithmic scale within the intervals given in Error! Reference source not found.. Table 3. Investigated intervals for kc and D.
Intervals
C kc (m/s) D (m2/s)
1.0 1.78∙10−6 : 5.62∙10−5 3.16∙10−5 : 1.00∙10−4
0.6 5.62∙10−6 : 2.78∙10−5 4.08∙10−5 : 6.81∙10−5
0.0 5.62∙10−6 : 1.00∙10−4 3.16∙10−5 : 1.00∙10−4
The error between the measurements and the simulation results are found as the total
squared error for each simulation added for all the measuring points following Equation (14). Error values are calculated for the center temperature and the mass loss, respective. Additionally combined errors were found following Equation (15).
∑ , , (14) where , is the simulated value, , is the experimental value and N the number of time steps.
(15) where is the combined error for both the center temperature and the mass loss,
the total error for the mass loss, and the total error for the center temperature. Following this optimization scheme three values are calculated for each combination of and D values. Three optimum combinations of and D are thus available for each simulation set-up.
Results and Discussion Experimental work
A total of 14 valid datasets were obtained for the center cookie temperature. The temperature measurements are shown in Figure 7 along with the average value plus and

11
minus one standard deviation. The mass loss is shown as the mass fraction for the three averages of 12 cookies in Figure 8.
Figure 7. 7a: All 14 center temperature measurements. 7b: The average center temperature plus and minus one standard deviation.
Figure 8. Mass fraction measurements.
Simulation results The initial simulations were made for the symmetrical set-up with C = 1.0 in Equation (7b). Due to an unacceptable poor fit of the initial simulations the mass transfer and diffusion coefficients were optimized as described. The initial simulations showed close to no evaporation and no temperature increase over 105°C, showing inconsistent physical behavior of the model with the applied parameters. For improved simulations it was estimated that a higher diffusion coefficient was needed and possibly a higher mass transfer coefficient. Using parameter sweeps the mass transfer and diffusion coefficients were optimized in the subsequent simulations as described above.
The and D intervals applied in each of the three parameter sweeps are shown in Error! Reference source not found.. The intervals for the symmetrical simulation were based on values reported for comparable bakery products and a number of test simulations. For biscuit products diffusion coefficients around 2·10-5 m2/s for water vapor and 1.1·10-5 m2/s for liquid water were reported by Hadiyanto et al. (3), for bread products a water vapor

12
diffusion coefficient of 8 10 m2/s and a liquid water diffusion coefficient of 1.35·10-10 m2/s were reported by (20). Based on the initial simulation results with D = 3.6·10-8 m2/s, it was found that a diffusion coefficient in the range of water vapor for biscuit products is the most likely description for the mass transfer in the investigated butter cookies.
The investigated interval for the mass transfer coefficient was selected to include values both above and below the initial estimate of = 2.7·10-6 m/s.
For the C = 0.0 set-up the diffusion coefficient interval was maintained from the symmetrical case (C = 1.0), and the kc interval expanded to maintain a constant total mass loss through the smaller evaporation area.
For the C = 0.6 set-up the intervals were chosen based on the best fits obtained in the two preceding set-ups, which were used to narrow the investigated intervals.
The kc and D values given in Table 4 were found to give the best fit for the three investigated set-ups. For each set-up three sets of values are given, the first two corresponding to the smallest errors comparing simulations and experimental data for the temperature and the weight loss measurements ( , and , ), calculated from Equation (13), and the third set corresponding to the smallest combined error ( , ), calculated from Equation (14). The smallest calculated errors are also given in the table. Table 4. kc and D values corresponding to the lowest temperature, mass fraction or combined error for each of the three set-ups (the C value indicates the factor introduced in Equation (7b)).
C = 1.0 C = 0.6 C = 0.0
ε value kc (m/s) D (m2/s) ε value kc (m/s) D (m2/s) ε value kc (m/s) D (m2/s)
εmin,T 5.50∙10−3 5.62∙10
−6 4.08∙10
−5 4.20∙10
−3 8.00∙10
−6 4.17∙10
−5 2.11∙10
−2 2.78∙10
−5 4.64∙10
−5
εmin,M 4.97∙10−2 1.21∙10−5 5.27∙10−5 4.98∙10−2 1.62∙10−5 5.17∙10−5 4.97∙10−2 2.02∙10−5 6.81∙10−5
εmin,combi 4.57∙10−4 8.25∙10−6 4.64∙10−5 3.68∙10−4 9.55∙10−6 4.40∙10−5 2.04∙10−3 2.78∙10−5 4.64∙10−5
The results show that for all three set-ups the model is capable of describing the total mass loss over time. Good agreement was seen between the center temperature measurements and the simulations for C = 1.0 and 0.6. For C = 0.0 the model did not provide a good simulation of the center temperature. These results are supported by the error values shown in Error! Reference source not found..
Comparing to the literature values reported above the optimized values for and D appear reasonable. The values for increase as the evaporation from the bottom surface are decreased. This is consistent with a higher mass flux from the free surfaces as the total evaporation is maintained. The D values indicate a high degree of water vapor transport inside the product, and are close to the value presented by Hadiyanto et al. (3) of 2·10-5 m2/s for water vapor transport in biscuits. In the optimization step the parameters are either optimized against the temperature measurements or the mass-loss data. The simulations optimized with regard to e.g. the center temperature are compared to the mass-loss data, and vice versa (the comparisons are shown in the graphs in Figure 9). The simulations, optimized with regard to the center temperature, did not result in acceptable agreement with the mass-loss data. However the solution optimized with regard to the mass-loss data provided acceptable simulations of the temperature in the C = 1.0 and C = 0.6 set-ups. In these two set-ups the center temperature was within or very close to one standard deviation from the average measured values throughout the baking process. For future work, optimization based on mass-loss data followed by validation against temperature measurements, may be a suitable method for parameter estimation.

13
a
b
c
d
e f Figure 9. 9a and 9b: Simulation results for the symmetrical case (C = 1.0). 9c and 9d: Simulation results for the asymmetrical case with some mass transfer from the bottom surface (C = 0.6). 9e and 9f: Simulation results for the asymmetrical case with no mass transfer from the bottom surface (C = 0). The simulation results corresponding to best fit for the temperature, the mass fraction, and the smallest combined error are shown in each graph.

14
Conclusion A unique advanced pilot batch oven was used to continuously measure the center temperature and the mass loss of butter cookies during baking, emulating the process conditions of an industrial tunnel oven. The data were then combined with a FEM physically based model for the heat and mass transfer during baking.
The model was seen to give a qualitatively good representation of the baking process. Comparing three set-ups it was concluded that the symmetrical set-up (C = 1.0), with equal evaporation from all surfaces is an acceptable description when heat and mass transfer inside the product is considered. The intermediate set-up (C = 0.6) with limited evaporation from the bottom surface provided a slightly better result compared to the symmetrical case. The set-up with no evaporation from the bottom surface (C = 0.0) did not give a good representation of the temperature development. However it was possible with all three set-ups to obtain good agreement between the simulated and measured over-all mass loss.
Calculating the development in temperature with parameters optimized to over-all mass loss leads to acceptable results for C = 1.0 and 0.6, but not for C = 0.0. While mass-loss calculations based on the parameters optimized with regard to the center temperature do not render acceptable results in any of the three set-ups. Thus of the two measured product properties, optimization with the applied scheme should focus on reaching good agreement between the simulated and measured mass-loss data.
From the parameter optimization the values of the diffusion coefficients indicate a high degree of water vapor transport inside the cookie product during baking. The high diffusion coefficients are interesting with regard to the interior transport mechanisms. For all investigated set-ups good results were obtained for the average mass loss. This may be connected to high diffusion coefficients minimizing the effect of covered surfaces on the overall movement and removal of water. The good agreement between the symmetrical simulation set-up and the experimental measurements indicates a small effect of the baking tray on the over-all mass loss. While further investigation of other characteristics of the product are needed, the center temperature and over-all mass-loss is not likely to be affected by baking on either a perforated or meshed baking tray, compared to a steel sheet plate.
The results show good agreement between the continuously obtained measurements and simulations using an advanced modeling tool. For future work the applicability of the model could be broadened and refined in order to capture the full influence of the covered surfaces on the product properties and quality. This could be implemented through additional optimization using datasets containing information such as surface browning or surface temperature.
Acknowledgements The authors would like to thank the Danish Ministry of Food, Agriculture and Fisheries for financially supporting the presented research (J.no. 3414-08-02280).

15
References: 1. Andresen MS, Risum J, Adler-Nissen J, Design and construction of a batch oven for
investigation of industrial continuous baking processes. J. Food Process Eng. Accepted for publication 2012.
2. Feyissa AH, Gernaey KV, Ashokkumar S, Adler-Nissen J. Modelling of coupled heat and mass transfer during a contact baking process. J. Food Eng. 2011;106(3):228-35.
3. Hadiyanto, Asselman A, Straten GV, Boom RM, Esveld DC, Boxtel, AJBV. Quality prediction of bakery products in the initial phase of process design. Innovative Food Sci. Emerging Technol.2007,8(2):285-298.
4. Purlis E, Salvadori V. Bread Baking as a Moving Boundary Problem. Part 1: Mathematical Modelling. J. Food Eng. 2009; 91: 428-33.
5. Purlis E, Salvadori V. Bread Baking as a Moving Boundary Problem. Part 2: Model Validation and Numerical Simulation. J. Food Eng. 2009; 91: 434-42.
6. Sablani S, Marcotte M, Baik O, Castaigne F. Modeling of Simultaneous Heat and Water Transport in the Baking Process. LWT-Food Sci. Technol. 1998; 31: 201-9.
7. Sakin-Yilmazer M, Kaymak-Ertekin F, Ilicali C. Modeling of simulateneous heat and mass transfer during convection oven ring cake baking. J. Food Eng. 2012; 111: 289-98.
8. Thorvaldsson K, Skjöldebrand C. Water diffusion in bread during baking. Lebensm.-Wiss. Technol. 1998; 31: 658-63.
9. Wählby U. Heat and mass transfer in impingement cooking aspects of food quality [dissertation]. Chalmers Tekniska Högskola; 2002.
10. Sakin M, Kaymak-Ertekin F, Ilicali C. Modeling the moisture transfer during baking of white cake. J. Food Eng. 2007; 80(3): 822-831.
11. Purlis E. Baking Process Design Based on Modelling and Simulation: Towards Optimization of Bread Baking. Food Control. 2012; 27(1): 45-52.
12. Ferrari E, Marai SV, Guidetti R, Piazza L. Modelling of Heat and Moisture Transfer Phenomena During Dry Biscuit Baking by Using Finite Element Method. Int. J. Food Eng. 2012;8(3): 2326.
13. Demirkol E, Erdogdu F, Palazoglu T. Analysis of mass transfer parameters (changes in mass flux, diffusion coefficient and mass transfer coefficient) during baking of cookies. J. Food Eng. 2006;72:364-71.
14. Olszewski EA. From Baking a Cake to Solving the Diffusion Equation. Am. J. Phys. 2006; 74(6): 502-9.
15. Mondal A, Datta AK. Two-Dimensional CFD Modeling and Simulation of Crustless Bread Baking Process. J. Food Eng. 2010; 99(2): 166-74.
16. Ploteau JP, Nicolas V, Glouannec P. Numerical and Experimental Characterization of a Batch Bread Baking Oven. Appl. Therm. Eng. 2012; 48: 289-95.
17. Chen H. Modeling coupled heat and mass transfer for convection cooking of chicken patties. J. Food Eng. 1999;42:139-46.
18. Mondal A, Datta AK. Bread baking - A review. J. Food Eng. 2008;86:465-74. 19. Purlis E. Browning development in bakery products - a review. J. Food Eng. 2010;
99(3): 239-49. 20. Thorvaldsson K, Janestad H. A model for simulateneous heat, water and vapour
diffusion. J. Food Eng. 1999; 40: 167-172. 21. Bird R, Stewart W, Lightfoot E. Transport phenomena, 2nd ed. John Wiley & Sons;
2002. 22. Choi Y, Okos MR. Effects of temperature and composition on the thermal properties
of foods. Food Eng. and Proc. App. Proceedings of the 4th int. cong. on Eng. and Food at Edmonton Alberta Canada, Elsevier Applied Science Publishers. 1986;93-101.

16
23. Fricke BA, Becker BR. Evaluation of Thermophysical Property Models for Foods. HVAC&R Res. 2001;7(4):311-30.
24. Carson J, Willix J, North M. Measurements of heat transfer coefficients within convection ovens. J. Food Eng. 2006;72:293-301.
25. Mills A. Basic heat transfer, The Richard D. Irwin series in heat transfer. Irwin; 1995. 26. Nitin N, Karwe MV. Heat transfer coefficient for cookie shaped objects in a hot air jet
impingement oven. J. Food Process Eng. 2001; 24: 51-69. 27. Achenbach E. The effect of surface roughness on the heat transfer from a circular
cylinder to the cross flow of air. Int. J. Heat Mass Transfer. 1977;20(4):359-69. 28. Thorvaldsson K, Janestad H. A model for simulateneous heat, water and vapour
diffusion. J. Food Eng. 1999; 40: 167-172. 29. Mowbray WR. Technology of the "hot box". Food Manuf. 1981; 56: 27-30.

190

Appendix G
Literature search for state of the artarticles
In the following a short summary of the search criteria used to identify state of the artarticles is presented. The two focus areas of the literature search were heat and masstransfer modeling and experimental ovens.
G.1 Search targeted towards mathematical modelingin bakery products
Three combinations of keywords were used to find articles on heat and mass transfermodeling in bakery products. The investigated groups of bakery products were specifiedto include bread, cookies, biscuits, crackers, and cakes. Using the Boolean operator ORall articles including one or more of these products in combination with the remainingkeywords will appear in the search results. The three search criteria and number of resultsobtained through DTU Library are summarized in the following:
• Search 1: heat AND mass AND baking AND (bread OR cookie OR biscuit ORcracker OR cake); Results in 183 hits1. Some hits recommended by ChristinaSkjoldebrand are found around 2002-2003.
• Search 2: (modelling OR modeling) AND baking AND (bread OR biscuit OR crackerOR cake); Results in 358 hits2. It is difficult from a quick overview to see if there isa significant distinction between the relevant hits within these results compared toSearch 1. From the results in Search 1 the second search does not seem necessary.A wide selection of examples of heat and mass transfer modeling in bakery productsare found from Search 1.
1May 3rd, 20132May 3rd, 2013
191

• Search 3: “baking AND oven AND continuous” ; results in 208 results3. In contrastto Search 1 and 2 this search was focused on continuous baking processes.
As a double check that the most important articles were found the same combinationsof keywords were used to search in the database Web of Science. The same or fewerresults were obtained through Web of Science, e.g. the search on Web of Science: “bakingAND oven AND continuous” results in 29 results4, of which all were found through DTULibrary.
A 4th search combination was carried out for the keywords “experimental AND controlledAND baking” . This combination did not result in additional relevant results.
G.2 Search for experimental ovens
From the different combinations of search words which have been used, it was foundthat it is difficult to locate experimental ovens applied for model validation. Thereforewider search criteria were used to identify articles about experimental ovens. From thesearch with the keywords: "baking AND (experimental OR experiment OR pilot) ANDoven" a total of 206 results were found5. When recurrences and irrelevant articles wereremoved a total of 96 articles were left. From these 96 articles only 9 were found toinclude a reference to pilot or experimental ovens in the title (due to language barriers6 were acquired and studied for further evaluation). Additionally a number of articleswere relevant for the study of improving baking conditions in continuous tunnel ovensand comparison between tunnel and batch ovens. In total 9 of the 206 results could bedirectly linked to either optimization of industrial tunnel ovens, scaling between pilot andfull scale ovens, or describing experimental equipment considering the title of the articlealone.
Articles including experimental ovens were indirectly found from the search consideringmodeling work. The ovens presented in these articles along with articles known to presentovens for experimental work, even though they did not appear in the search results, areincluded in the state of the art review for experimental baking equipment (Section 2.3.2).
3May 3rd, 20134May 7th, 20135May 3rd, 2013
192

Appendix H
Literature review for qualityassessment
In this appendix an overview of the investigated articles used in Chapter 4 is given. FigureH.1 shows how the articles are distributed by year of publishing. In Table H.1 more detailsare given, specifying which quality assessment groups have been used in each article.
Figure H.1: Distribution of investigated articles by publishing year.
193

Table H.1. Overview of the articles related to quality assessment.
194

Appendix I
ANOVA testing influence of air flow
This chapters shows the results of the ANOVA used for testing variations in mass lossand browning when baking at five different inlet air velocities in the new batch oven (cf.Chapter 6). 18 repetitions were carried out at each of the five inlet air settings.
195

Data and ANOVA test for weight loss after 8 min of baking at five different inlet air settings.
Mass fraction Repetitions Set = 1 Set = 3 Set = 5 Set = 7 Set = 9
1 0.8881 0.8850 0.8799 0.8796 0.8789 2 0.8879 0.8825 0.8827 0.8791 0.8782 3 0.8851 0.8824 0.8832 0.8815 0.8784 4 0.8865 0.8833 0.8818 0.8788 0.8779 5 0.8892 0.8829 0.8840 0.8813 0.8798 6 0.8904 0.8846 0.8894 0.8799 0.8788 7 0.8895 0.8851 0.8784 0.8802 0.8780 8 0.8873 0.8817 0.8756 0.8776 0.8752 9 0.8869 0.8822 0.8750 0.8793 0.8815
10 0.8910 0.8825 0.8808 0.8790 0.8762 11 0.8848 0.8831 0.8810 0.8806 0.8762 12 0.8875 0.8824 0.8796 0.8804 0.8776 13 0.8865 0.8804 0.8880 0.8788 0.8771 14 0.8878 0.8792 0.8871 0.8767 0.8764 15 0.8861 0.8813 0.8853 0.8762 0.8784 16 0.8855 0.8832 0.8785 0.8776 0.8767 17 0.8853 0.8835 0.8817 0.8813 0.8805 18 0.8845 0.8848 0.8840 0.8793 0.8781
Anova: Single Factor
SUMMARY Groups Count Sum Average Variance
Set = 1 18 15.9699 0.8872 3.65E-06 Set = 3 18 15.8901 0.8828 2.44E-06 Set = 5 18 15.8760 0.8820 1.56E-05 Set = 7 18 15.8272 0.8793 2.34E-06 Set = 9 18 15.8039 0.8780 2.54E-06
ANOVA
Source of variance SS df MS F P-value F crit Between Groups 0.00092 4 0.00023 43.28222 9.27E-20 2.479015 Within Groups 0.000452 85 5.31E-06
Total 0.001372 89

Data and ANOVA test for L* values after 8 min of baking at five different inlet air settings.
Average L*
Repetition Set = 1 Set = 3 Set = 5 Set = 7 Set = 9 1 79 78 77 73 74 2 78 76 76 74 73 3 79 77 76 75 73 4 79 78 77 73 72 5 78 77 77 75 73 6 78 77 75 75 74 7 79 78 76 76 72 8 79 76 77 76 69 9 79 76 76 74 69 10 79 78 74 74 72 11 79 79 77 75 73 12 78 78 78 78 73 13 79 78 77 74 73 14 78 76 74 73 73 15 79 77 74 74 73 16 79 77 76 74 73 17 78 79 76 75 74 18 79 78 78 76 76
Anova: Single Factor
SUMMARY Groups Count Sum Average Variance
Set = 1 18 1416.85 78.71 0.3008321 Set = 3 18 1391.83 77.32 1.01670752 Set = 5 18 1372.64 76.26 1.59549386 Set = 7 18 1344.47 74.69 1.63187393 Set = 9 18 1309.68 72.76 2.76739477
ANOVA
Source of variance SS df MS F P-value F crit Between Groups 384.830317 4 96.2075793 65.7847399 3.1329E-25 2.479015 Within Groups 124.309137 85 1.46246044
Total 509.139454 89

198

Appendix J
Parameters and variables forCOMSOL simulations
The constant and variable parameters used in the COMSOL simulations are listed inTable J.1.
199

Table J. Overview of parameters used in COMSOL simulations, the values correspond tothe limited mass transfer case described in Chapter 9.
200