Analysis for Natural Gas and Similar Gaseous Mixtures by Gas ...
48
Analysis for Natural Gas and Similar Gaseous Mixtures by Gas Chromatography Adopted as a Standard 1964 Revised 2019 GPA Midstream Association Sixty Sixty American Plaza, Suite 700 Tulsa, Oklahoma 74135 GPA Midstream Standard 2261-19
-
Upload
khangminh22 -
Category
Documents
-
view
3 -
download
0
Transcript of Analysis for Natural Gas and Similar Gaseous Mixtures by Gas ...
Analysis for Natural Gas and Similar Gaseous Mixtures by Gas Chromatography
Adopted as a Standard 1964 Revised 2019
GPA Midstream Association Sixty Sixty American Plaza, Suite 700
Tulsa, Oklahoma 74135
GPA Midstream Standard 2261-19

i
DISCLAIMER GPA Midstream Association publications necessarily address problems of a general nature and may be used by anyone desiring to do so. Every effort has been made by GPA Midstream to assure accuracy and reliability of the information contained in this publication. Each person who uses or refers to this publication will need to make their own decisions based on consideration of their own internal best practices, recommendations, and engineering judgment. GPA Midstream and its members do not guarantee the accuracy, completeness, efficacy, timeliness, or correct sequencing of such information, including without limitation, the reference material and information of the various other industry associations that may be provided herein. Use of the information provided in this publication is voluntary, and reliance on it should only be undertaken after an independent review of its accuracy, completeness, efficacy, timeliness, and consideration of the applicability of any local, state, and federal laws and regulations. It is not the intent of GPA Midstream to assume the duties of employers, manufacturers, or suppliers to warn and properly train employees, or others exposed, concerning health and safety risks or precautions. Reference herein to any specific commercial product, process, or service by trade name, trademark, service mark, manufacturer, or otherwise does not constitute or imply endorsement, recommendation, or favoring by GPA Midstream. GPA Midstream makes no representation, warranty, or guarantee in connection with this publication and hereby expressly disclaims any liability or responsibility for loss or damage resulting from its use or for the violation of any federal, state or municipal regulation with which this publication may conflict, or for any infringement of letters of patent regarding apparatus, equipment, or method so covered.
“Copyright© 2019 by GPA Midstream Association. All rights reserved. No part of this Report may be reproduced without the written consent
of GPA Midstream Association

ii
FOREWARD
GPA 2261 provides the gas processing industry a method for determining the chemical composition of natural gas and similar gaseous mixtures using a Gas Chromatograph (GC).
The precision statements contained in this standard are based on the statistical analysis of round-robin laboratory data obtained by the GPA Midstream Analysis, Test Methods and Product Specifications Committee (Analysis Committee).
This standard was developed by the cooperative efforts of many individuals from industry under the sponsorship of GPA Midstream Analysis Committee.
Throughout this publication, the latest appropriate GPA Standards are referenced.

1
Analysis for Natural Gas and Similar Gaseous Mixtures by Gas Chromatography
1. SCOPE 1.1 This standard covers the determination of the chemical composition of natural gas
and similar gaseous mixtures within the ranges listed in Table 1, using a Gas Chromatograph (GC). The three columns represent the original Table 1, but separate the values to three distinct groups. The first group is concentrations lower than the data obtained from the round-robin project (RR-188). The second group is concentrations used in the round-robin project (RR-188). The equations listed in the precision statement in this standard cover the range listed in the middle column, after outliers were removed. The third group is concentrations higher than the data obtained from the round-robin project (RR-188).
The precision statement in this standard utilizes equations derived from a regression of the data in RR-188 and is detailed in GPA TP-31. The precision statement criterion applies only to values listed in Section 10, Table 6.
1.2 Components sometimes associated with natural gases, i.e., helium, hydrogen
sulfide, water, carbon monoxide, hydrogen and other compounds are excluded from the main body of the method. These components may be determined and made a part of the complete compositional data. Refer to Appendix C.
Table 1
Ranges of Natural Gas Components Covered
Component Lower Region
Round Robin
Higher Region
Nitrogen 0.01 - 0.1 0.1 - 30 > 30 Methane 0.01 - 40 40 - 100 N/A Carbon Dioxide 0.01 – 0.1 0.1 - 30 > 30 Ethane 0.01 - 0.1 0.1 - 10 > 10 Propane 0.01 - 0.1 0.1 - 10 > 10 Isobutane 0.01 - 0.25 0.25 - 4 > 4 n-Butane 0.01 - 0.25 0.25 - 4 > 4 Isopentane 0.01 - 0.12 0.12 - 1.5 > 1.5 n-Pentane 0.01 - 0.12 0.12 - 1.5 > 1.5 *Hexanes Plus 0.01 - 0.1 0.1 - 1.5 > 1.5 *Heptanes Plus 0.01 - 0.1 0.1 - 1.5 > 1.5
*Data from round –robin was only obtained for Hexanes Plus
Table Note: Uncertainty in the Lower region can easily be ten times greater and in the higher region two to three times greater than the center column.

2
NOTE 1 - Components not listed in Table 1 may be determined by procedures outlined in Appendix C or other applicable analytical procedures. Refer to Appendix C. 2. SUMMARY OF METHOD
2.1 Components to be determined in a gaseous sample are physically separated by gas chromatography and compared to calibration data obtained under identical operating conditions. A fixed volume of sample in the gaseous phase is isolated in a suitable inlet sample system and entered onto the column.
2.2 The full range analysis of a gaseous sample may require multiple runs to properly
determine all components of interest. The primary run is on a partition column to determine air, methane, carbon dioxide, ethane and heavier hydrocarbons. When oxygen/argon content is critical in the unknown sample, or is suspected as a contaminant, a secondary run should be made to determine oxygen/argon and nitrogen in the air peak on the partition column. When carbon dioxide content in the unknown sample does not fall within the calibrated range on the partition column, a secondary run should be made to determine carbon dioxide content. When helium and/or hydrogen content are critical in the unknown sample, a secondary run should be made to determine helium and/or hydrogen.
2.2.1 These analyses are independent and may be made in any order, or may be made
separately to obtain less than the full range analysis. The configuration can consist of a single or multiple GC’s to accomplish this. Refer to Appendix C.
2.3 Response factors or response curves derived from calibration data are essential to
accurately determine the composition of an unknown sample. The reference standard blend and the unknown samples must be run using identical GC operating conditions.
3. APPARATUS
3.1 Chromatograph - Any Gas Chromatograph may be used as long as the specifications for repeatability and reproducibility stated in Section 10 within the round-robin test component ranges listed in Table 1 are met or exceeded. The equipment described in this section has been proven to meet the above requirements; however other configurations including portable and online may be acceptable.
3.1.1 Detector - The Thermal Conductivity Detector (TCD) has proven to be a
reliable and universal detector for this method.
3.1.2 Sample Inlet System - A gas sampling valve capable of introducing sample volumes of up to 0.500 ml may be used to introduce a fixed volume into the carrier gas stream at the head of the analyzing column. The sample volume should be repeatable such that successive runs meet the precision requirements of Section 10.

3
NOTE 2 -The sample size limitation of 0.500 ml or smaller is selected relative to linearity of detector response and efficiency of column separation. Larger samples may be used to determine low-quantity components in order to increase measurement accuracy.
3.1.3 Chromatographic Columns
3.1.3.1 Partition Column - This column must separate nitrogen (air), carbon dioxide, and the hydrocarbons methane through n-Pentane. (or n-Hexane when a C7 plus analysis is performed). Silicone DC 200/500, 30% by weight on 80/100 mesh Chromosorb P, acid washed, packed into 30’ x 1/8” SS tubing has proven to be satisfactory for this purpose.
3.1.3.2 Precut Column – A backflush column similar to the partition
column described in 3.1.3.1. This column must be of the same diameter and long enough to clearly separate the hexanes plus or heptanes plus fraction from the lighter components. Figure 1A shows an example chromatogram of a natural gas mixture using the precut column for grouping the hexanes and heavier (heptanes and heavier in Figure 1B).
3.1.3.3 Pressure buffer Column - A lightly loaded column placed between
the detector inlet and the column switching/sampling valve (Figure 2A, Column 3) may help to position the hexanes and heavier peak to provide better resolution. This column is usually 1 wt% Silicone 200/500 between 12” and 40” long. (Figures 2A and 2B show a typical column switching/sampling valve arrangement).
NOTE 3 -The arrangements of columns, detectors and valves depicted in Figure 2A and 2B have been determined to meet or exceed the performance criteria of this standard. (See Section 10, “Precision”.)
3.1.4 Temperature Control -The chromatographic columns and the detector should be maintained at temperatures consistent enough to provide repeatable peak retention times and compositional precision within the limits described in Section 10 during the reference standard and corresponding sample runs.
3.2 Carrier Gas - The contaminants in the carrier gas must be limited to levels that are
known not to interfere with the analysis or cause maintenance problems with the GC. Refer to manufacturer for recommendations regarding carrier gas quality.
3.2.1 Pressure and Flow Control Devices - These devices should maintain flow
rate consistent enough to provide repeatable peak retention times and compositional precision within the limits described in Section 10 during the reference standard and corresponding sample runs. Two Stage regulators with stainless steel diaphragms have been shown to be satisfactory for this purpose.

4
Figure 1A
Chromatogram of Early Backflush of Hexanes and Heavier (C6+)
Figure 1B Chromatogram of Early Backflush of Heptanes and Heavier (C7+)

5
3.3 Sample Conditioning Systems - GPA 2166 gives guidance for proper design and use of sample conditioning systems. The sample conditioning system should not cause the GC precision to fall outside the requirements in Section 10.
NOTE 4 - Valves and sample introduction system must be maintained at a temperature above the hydrocarbon dew point of the calibration blend and unknown samples. Supplemental heating may be required to accomplish this. Refer to GPA 2166 for guidance.
3.4 Integration System - The integration system should be configured to properly integrate all peaks of interest. Integration systems cannot correct for inadequate component separation. The integration system should not cause the GC precision to fall outside the requirements in Section 10.
Figure 2A
Two Six Port Valves Used for Sample Injection and Precut Backflush
Figure 2B One Ten Port Valve Used for Sample Injection and Precut Backflush

6
4. NATURAL GAS QUALITY ASSURANCE
4.1 Determination of Linear Range - GPA 2198 describes procedures to establish the linear range of a GC system. This process is necessary to determine the proper calibration and analytical procedures for each instrument.
4.2 Fidelity Plot - GPA 2198 describes the procedure to create a Fidelity Plot. The
Fidelity Plot is a tool that can be used to monitor the validity of calibration standards and performance of GC systems.
4.3 Control Charts - GPA 2198 describes the use of Control Charts. Control Charts can
be used to monitor each component in the calibration blend and the GC performance over time.
4.4 Precision Test - Section 10 of this document establishes the precision requirements
of this standard. 5. SAMPLE INTRODUCTION
5.1 Sample Introduction -The sample introduction must be performed in the same
manner for calibration and subsequent unknown samples. It is acceptable to either perform a purged or evacuated introduction. Successive runs must be repeatable and not contain contamination from the previous injection. Refer to Appendix A for discussions on linearity, calibration and other related topics.
5.1.1 Purged Introduction - Determine the rate and duration of the purge. Perform
alternate injections using a suitable reference blend and instrument carrier gas. Perform alternate injections of each material at various purge rates and purge durations. Note the rate and duration of each purge test and the component concentrations from each run. Repeatability of each component must meet the criteria listed in Section 10, “Repeatability” on the sample runs for the purge rate to be acceptable. Results from the carrier gas blank run must not contain carryover (individual peaks) greater than 0.01 un-normalized mol % from the previous injection of sample for the duration to be sufficient. Once this has been established, this rate and duration should be used for all calibration and analytical runs.
5.1.2 Evacuated Introduction - Evacuate the sample entry system and observe the
vacuum gage or manometer for pressure changes indicating a leak. Leaks must be repaired before proceeding. Determine the pressure to be used for injections. Perform alternate injections of a suitable reference blend and carrier gas. Make replicate runs at the selected pressure. Repeatability of each component must meet the criteria listed in Section 10, “Repeatability”. Use this pressure for calibration and analytical runs. Results from the carrier gas blank run must not contain carryover (individual peaks) greater than 0.01 un-normalized mol % from the previous injection of sample.
5.1.3 Equilibration - All sample injections must be performed in the same manner
for known and unknown sample compositions. The sample introduction

7
system must be allowed to equilibrate prior to operation of the gas sample valve.
5.2 Preparation and Introduction of Sample – Samples must be properly conditioned
prior to analysis. GPA 2166 gives guidance on proper heating of sample containers and sampling systems. Refer to GPA 2166.
NOTE 5 - To ensure representative samples are obtained in the field, refer to GPA Publication 2166.
5.2.1 Sample connections and tubing used in the sample entry system of the GC must be composed of material that does not cause sample distortion. Stainless Steel and Nylon 11 have proven to perform in this manner. Rubber and other plastic tubing must not be used since these materials readily absorb hydrocarbons.
6. CALIBRATION PROCEDURE
6.1 Calibration
6.1.1 Response factors for the components of interest are determined in accordance with the calculations discussed in Section 8. This can be accomplished by various means. Either single level calibration(s) using one or more certified reference blend(s) or a multi-level calibration using at least three certified reference blends is acceptable.
6.1.2 Procedures discussed in Section 4 and the calibration type will determine the
calibrated range. All components in the unknown samples should lie within the calibrated range for a specific GC. (See Section 10, “Precision”.)
6.1.3 Calibration should be verified on a set frequency. Verifications can utilize a
single blend or multiple blends. At least two runs should be made to verify repeatability. If the calculated concentrations deviate by more than the precision requirements for repeatability listed in Section 10, or the un-normalized total deviates by more than 1% from 100 %, instrument maintenance or recalibration may be necessary. First verify the calibration blend is valid, then verify the instrument is operating properly (repair as required), and then recalibrate if necessary.
6.1.4 Fidelity plots and Control Charts, as described in GPA 2198, are excellent
tools to monitor instruments and calibration blends.
6.2 Calibration types
6.2.1 – Single Level Calibration(s)
6.2.1.1 One or more certified gas reference standard blends of known composition are used to determine response factors for anticipated component ranges in the unknown samples. The results from the

8
“Linearity Check” and the response factors determined for each component can be used to identify the calibrated range for concentrations anticipated in the unknown samples.
6.2.1.2 One gas reference standard blend of known composition may be
used to determine response factors for each component. Unknown samples are analyzed and the results determined from the response factors derived from the reference standard blend.
6.2.1.3 More than one gas reference standard blend of known composition
may be used to determine response factors for each component. The composition of these standards should cover the anticipated range of compositions in the unknown samples. Unknown samples are analyzed and the results determined from the certified reference blend more closely matching the unknown.
6.2.1.4 The calibrated range, when within the ranges listed in Section 10,
must meet the precision requirements listed in the column “Reproducibility”.
6.2.2 – Multi-level Calibration
6.2.2.1 Multi-level calibrations may be used for single components, select
components, or the full range of components in each standard. A multi-level calibration with three or more gas reference standard may be used to determine response factors for component(s) of interest. The results from the “Linearity Check” and response factors determined for each component can be used to identify the calibrated range for concentrations anticipated in the unknown samples.
6.2.2.2 The calibrated range, when within the ranges listed in Section 10,
must meet the precision requirements listed in the column “Reproducibility”.
NOTE 6- See Appendix A for more information on linearity, calibrations, and other related topics. 7. ANALYTICAL PROCEDURE
7.1 – Precut Backflush Method for Nitrogen, Carbon Dioxide, Methane, and Heavier Hydrocarbons - Using the same instrument conditions and sample introduction technique that were used in the calibration run(s) for the unknown sample, obtain a chromatogram through n-pentane with hexanes and heavier eluting as the first peak in the chromatogram.
7.1.1 – This is accomplished by the GC system configured as shown in Figures 2A
and 2B.

9
7.1.2 – The sample is loaded into the sample loop as determined in Section 5 and allowed to equilibrate. The sample is injected by valve actuation. The lighter components, including n-pentane, move through the pre-column and into the analytical column. Column switching must occur before hexanes and heavier material exit the pre-column. The exact valve timing must be determined for each GC system.
7.1.3 – The pre-column is initially in series upstream of the analytical column to
isolate the hexanes plus. After the valve switch the pre-column is in series downstream of the analytical column, with flow reversed to back-flush the hexanes plus into a single peak. See Figure 1A.
7.1.4 – This recommended approach to the hexanes and heavier separation has two
distinct advantages: (1) better precision of measuring the peak area, and (2) a reduction in analysis time over the non-precut (single) column approach.
7.1.5 – To perform this procedure as a heptanes plus analysis the valve timing
must be adjusted so that the valve switch occurs after the elution of normal hexane from the pre-column onto the analytical column. See Figure 1B.
7.1.6 – In order to reduce the pressure disturbance from the valve actuation on the
plus fraction peak, a delay or buffer column may be utilized. A column between 12” and 40”, with 1% DC 200/500 on Chomosorb P has been found effective.
8. CALCULATIONS
8.1 Determine the peak areas of each component for the reference standard blend and unknown sample.
8.2 Response factors are calculated for each component using peak areas from the
reference standard blend in accordance with the following relationship: K = Ms / Ps where: K - Response factor Ms – Mol % of component in reference standard Ps -Peak area in arbitrary units for reference standard 8.3 Concentrations are calculated for each component in accordance with the following
relationship: Mu = Pu x K where: Mu - Mol% of component in unknown Pu- Peak area of each component in unknown sample K - Response factor as determined in 8.2.
8.4 Weight percent (Wt. %) concentrations for each component are calculated with the
following relationship: Lbs./Mole = (Mole % / 100) x Mole Wt. Mole % - Normalized Unrounded Mole %

10
Mole Wt. = Molecular weight from GPA 2145 (latest revision) Unnormalized Wt. % = (Lbs./Mole / Sum(Lbs./Mole)) x 100
Lbs./Mole - Lbs./Mole per component as determined above Sum(Lbs./Mole)) – Sum of Lbs./Mole values of all components
Table 2 Example of Response Factors Determined
from Reference Standard Blend
Component Mole % Area Response Factor Nitrogen 2.03 3140 0.0006465 Methane 89.75 106874 0.0008398 Carbon Dioxide 0.53 1174 0.0004514 Ethane 3.08 6389 0.0004821 Propane 1.90 4944 0.0003843 Isobutane 0.97 2962 0.0003275 n-Butane 0.97 3038 0.0003193 Isopentane 0.30 1053 0.0002849 n-Pentane 0.29 1098 0.0002641 Hexanes Plus 0.18 749 0.0002403
Total 100.00
Table 3
Calculation of Molar Concentration in Unknown Sample Using Response Factors
Component Area Response Factor
Unnormalized Mole %
Normalized Unrounded
Mole %
Normalized Rounded Mole %
Normalized Adjusted Mole %
Nitrogen 1050 0.0006465 0.68 0.68 0.68 0.68 Methane 95153 0.0008398 79.91 79.82 79.82 79.81 Carbon Dioxide 1255 0.0004514 0.57 0.57 0.57 0.57 Ethane 21470 0.0004821 10.35 10.34 10.34 10.34 Propane 13623 0.0003843 5.24 5.23 5.23 5.23 Isobutane 2253 0.0003275 0.74 0.74 0.74 0.74 n-Butane 4324 0.0003193 1.38 1.38 1.38 1.38 Isopentane 1398 0.0002849 0.40 0.40 0.40 0.40 n-Pentane 1321 0.0002641 0.35 0.35 0.35 0.35 Hexanes Plus 2080 0.0002403 0.50 0.50 0.50 0.50
Total 100.12 100.01 100.01 100.00
11
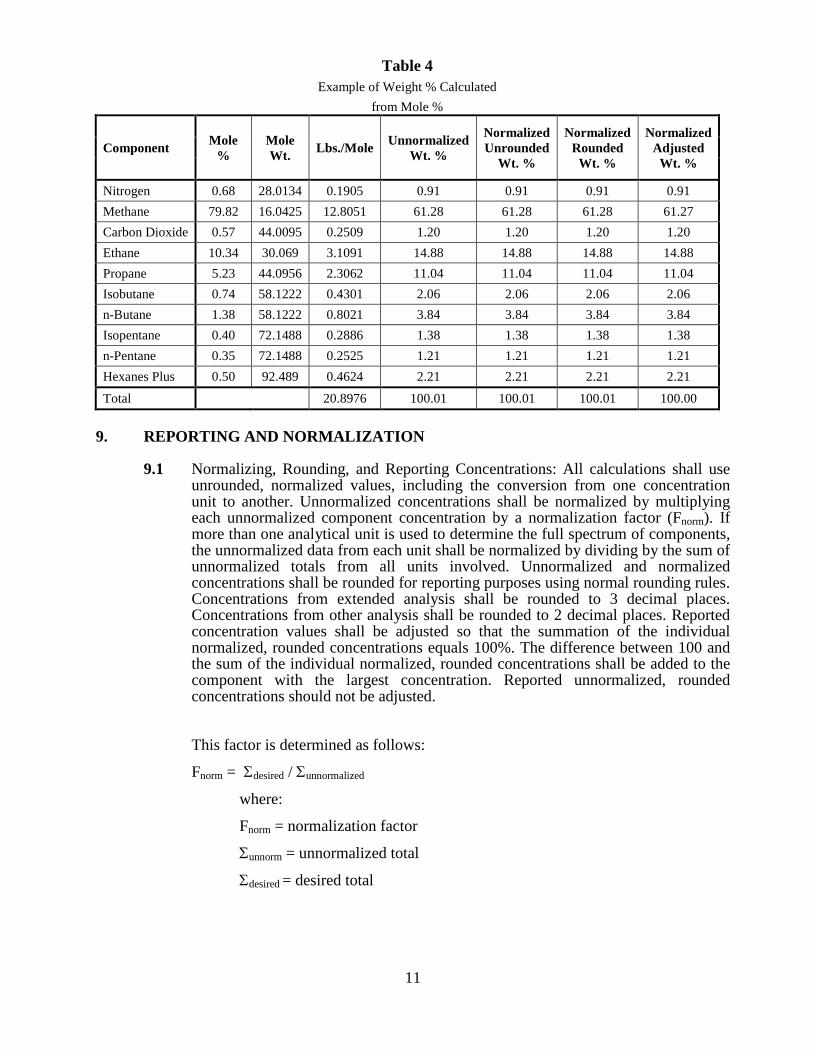
Table 4 Example of Weight % Calculated
from Mole %
Component Mole %
Mole Wt. Lbs./Mole Unnormalized
Wt. %
Normalized Unrounded
Wt. %
Normalized Rounded
Wt. %
Normalized Adjusted
Wt. %
Nitrogen 0.68 28.0134 0.1905 0.91 0.91 0.91 0.91 Methane 79.82 16.0425 12.8051 61.28 61.28 61.28 61.27 Carbon Dioxide 0.57 44.0095 0.2509 1.20 1.20 1.20 1.20 Ethane 10.34 30.069 3.1091 14.88 14.88 14.88 14.88 Propane 5.23 44.0956 2.3062 11.04 11.04 11.04 11.04 Isobutane 0.74 58.1222 0.4301 2.06 2.06 2.06 2.06 n-Butane 1.38 58.1222 0.8021 3.84 3.84 3.84 3.84 Isopentane 0.40 72.1488 0.2886 1.38 1.38 1.38 1.38 n-Pentane 0.35 72.1488 0.2525 1.21 1.21 1.21 1.21 Hexanes Plus 0.50 92.489 0.4624 2.21 2.21 2.21 2.21
Total 20.8976 100.01 100.01 100.01 100.00
9. REPORTING AND NORMALIZATION
9.1 Normalizing, Rounding, and Reporting Concentrations: All calculations shall use unrounded, normalized values, including the conversion from one concentration unit to another. Unnormalized concentrations shall be normalized by multiplying each unnormalized component concentration by a normalization factor (Fnorm). If more than one analytical unit is used to determine the full spectrum of components, the unnormalized data from each unit shall be normalized by dividing by the sum of unnormalized totals from all units involved. Unnormalized and normalized concentrations shall be rounded for reporting purposes using normal rounding rules. Concentrations from extended analysis shall be rounded to 3 decimal places. Concentrations from other analysis shall be rounded to 2 decimal places. Reported concentration values shall be adjusted so that the summation of the individual normalized, rounded concentrations equals 100%. The difference between 100 and the sum of the individual normalized, rounded concentrations shall be added to the component with the largest concentration. Reported unnormalized, rounded concentrations should not be adjusted.
This factor is determined as follows:
Fnorm = Σdesired / Σunnormalized
where:
Fnorm = normalization factor
Σunnorm = unnormalized total
Σdesired = desired total

12
9.2 Normally the desired total is 100%, except in cases such as secondary analyses such as those described in Appendix A, Section A-1.2. Refer to Appendix A and Table 5 below.
Table 5
Calculation of Concentration in Unknown Sample Using Response Factors
Component Area Resp. Factor
Unnormalized without H2S
Mole %
Unnormalized with H2S Mole %
Normalized Unrounded
Mole %
Normalized Rounded Mole %
Normalized Adjusted Mole
%
Nitrogen 1050 0.0006465 0.68 0.68 0.68 0.68 0.68 Methane 95153 0.0008398 79.91 79.91 79.77 79.77 79.77 Carbon Dioxide 1255 0.0004514 0.57 0.57 0.57 0.57 0.57
Ethane 21470 0.0004821 10.35 10.35 10.33 10.33 10.33 Hydrogen Sulfide 0.05 0.05 0.05 0.05
Propane 13623 0.0003843 5.24 5.24 5.23 5.23 5.23 Isobutane 2253 0.0003275 0.74 0.74 0.74 0.74 0.74 n-Butane 4324 0.0003193 1.38 1.38 1.38 1.38 1.38 Isopentane 1398 0.0002849 0.40 0.40 0.40 0.40 0.40 n-Pentane 1321 0.0002641 0.35 0.35 0.35 0.35 0.35 Hexanes Plus 2080 0.0002403 0.50 0.50 0.50 0.50 0.50
Total 100.12 100.17 100.00 100.00 100.00
Hydrogen Sulfide from other analytical determination is 0.05 mole %. This an example of normalization with external data supplied.
9.3 Reporting is commonly to two decimal places due to limitations on equipment.
TCD detectors typically have a linear dynamic range of 10,000:1. Numbers are calculated to three decimal places and then rounded up when the third digit is 5 or higher.
10. PRECISION
10.1 The repeatability and reproducibility statements for this standard are from the statistical data obtained in a GPA RR-188. The testing program included ten samples comprised of ten components analyzed by six laboratories. The standard as revised has been statistically evaluated under ISO and ASTM protocols. The documentation of the statistical evaluation may be found in GPA TP-31.
10.2 To determine the precision for any component at a specific concentration, use the
formulae shown in Table 6 and substitute the mole percent of the component for x.
10.3 Repeatability is the expected precision within a laboratory using the same equipment and same analyst. Repeatability is the difference in analyzed values between two sequential runs. Reproducibility is the expected precision when the

13
same method is used by different laboratories using different equipment and different analysts. Reproducibility is the difference between two analyzed values. Neither value represents the difference between an analyzed value and the certified value listed on a blend. (Refer to 10.6 and 10.7).
TABLE 6
Component Ranges for Precision Limits
Component Range Repeatability Reproducibility Nitrogen .02 – 15 0.039x1/4 0.158x1/2 Methane 50 – 100 0.0079x1/3 91000x-3 Carbon Dioxide .02 – 15 0.0042x1/3 0.11x3/7 Ethane .02 – 15 0.0124x1/3 0.019x2/7 Propane .02 – 15 0.0084x1/8 0.026x1/2 Isobutane .02 – 8 0.01x1/5 0.018x1/2 n-Butane .02 – 8 0.0117x2/5 0.033x1/2 Isopentane .02 – 4 0.009x1/4 0.025x1/4 n-Pentane .02 – 4 0.01x1/5 0.026x1/3 Hexanes Plus .02 – 2 0.0135x1/4 0.051x1/2
10.4 The following example calculations show the repeatability and reproducibility for
two different blends. The Ranges from the previous precision statement are used in the two examples. Example 1 lists the lower concentration from the original precision statement range of each component and Example 2 lists the higher concentration from the original precision statement range for each component along with the repeatability and reproducibility calculated for those values.
10.5 The values shown in these calculations are in mol percent. These values are the mol
% of the component plus or minus the value determined from the appropriate equation. That is to say, if the value is 1.00 and the precision value is 0.02, results that are between 0.98 and 1.02 are acceptable and values that are above or below that range are not acceptable and fail to meet the precision criteria of this standard. When the result is less than 0.01, use 0.01 as the lowest precision value.

14
Example 1 GPA 2261 Precision for Minimum Scope Values
Component Mole % Repeatability Reproducibility Nitrogen 1.00 0.04 0.16 Methane 71.60 0.03 0.25 Carbon Dioxide 0.14 0.01 0.05 Ethane 4.90 0.02 0.03 Propane 2.30 0.01 0.04 Isobutane 0.26 0.01 0.01 n-Butane 0.60 0.01 0.03 Isopentane 0.12 0.01 0.01 n-Pentane 0.14 0.01 0.01 Hexanes Plus 0.10 0.01 0.02
Example 2
GPA 2261 Precision for Maximum Scope Values Component Mole % Repeatability Reproducibility Nitrogen 7.70 0.06 0.44 Methane 86.40 0.03 0.14 Carbon Dioxide 7.90 0.01 0.27 Ethane 9.70 0.03 0.04 Propane 4.30 0.01 0.05 Isobutane 1.00 0.01 0.02 n-Butane 1.90 0.02 0.05 Isopentane 0.45 0.01 0.02 n-Pentane 0.42 0.01 0.02 Hexanes Plus 0.35 0.01 0.03
10.6 Performance evaluations commonly use the repeatability and reproducibility of
laboratory results compared to a certified blend. This precision statement is based on the data contained in GPA RR-188 and the statistical evaluation described in GPA TP-31. This treatment of data compared laboratory results independent of the certified blend values. Therefore, performance evaluations must either compare the laboratory results in the same manner by using the reproducibility values described in Table 6 and subsequent example calculations, or use the Performance Evaluation Acceptance Criteria listed below.
10.7 The ability of an instrument to match the certified values from a gravimetric blend
referred to as is the Performance Evaluation Acceptance Criteria. The blend uncertainty must be known to use this approach. The reproducibility and the uncertainty of the calibration blend are used to determine the Performance Evaluation Acceptance Criteria.

15
𝑃𝑃𝑃𝑃 = 𝐶𝐶𝐶𝐶𝐵𝐵 ± �𝑈𝑈𝐵𝐵2 + 𝑅𝑅2
Where: CVB is the certified value of component in blend PE is the Acceptance Criteria for component R is the method reproducibility for component UB is the blend uncertainty of component
In Example 3, we use the blend from Example 2, with a 1% Certified Reference Blend used in an audit. For more information, refer to Section 11, “Definitions”.
Example 3 Lab Precision using Blend Uncertainty
Component Mole % Stated Uncertainty UB Reproducibility �𝑈𝑈𝐵𝐵2 + 𝑅𝑅2
Nitrogen 2.03 1% 0.0068 0.23 0.23 Methane 89.75 1% 0.7981 0.13 0.91 Carbon Dioxide 0.53 1% 0.0057 0.08 0.08 Ethane 3.08 1% 0.1034 0.03 0.04 Propane 1.90 1% 0.0523 0.04 0.04 Isobutane 0.97 1% 0.0074 0.02 0.02 n-Butane 0.97 1% 0.0138 0.03 0.03 Isopentane 0.30 1% 0.0040 0.02 0.02 n-Pentane 0.29 1% 0.0035 0.02 0.02 Hexanes Plus 0.18 1% 0.0050 0.02 0.02
From the example above, if the laboratory result for methane is between 88.84 and 90.66mol % it would be deemed acceptable. For hexanes plus, a result between 0.18 and 0.20 mol % would be acceptable.
10.8 If the Blend Uncertainty is not known, this approach is not acceptable. Instead, compare the individual laboratory results to the robust mean of those results plus or minus the reproducibility of the method. Using the values from Example 2, if the mean result for methane is 89.75mol %, then acceptable results will be between 89.62 and 89.88 mol %. In example 2, if the hexanes plus mean result is 0.18, acceptable results will be between 0.16 and 0.20 mol %. Refer to TP-31.
11. DEFINITIONS Analytical Column – The column in the early backflush configuration that separates all compounds of interest except the “Plus” fraction. This is the longer of the two DC200/500 columns. Calibrated Linear Range – An experimentally determined range of concentrations for a component on a particular instrument. (Refer to GPA 2198)

16
Carrier Gas – The gas used to deliver the sample to the detector. Carrier Gas Blank Run – An analysis, on the gas chromatograph, of an injected sample of the carrier gas. Carryover – Components that are left in the GC system from a previous run. Column – The part(s) of the GC system used to separate components from each other. Detector – The device used to detect the presence and determine the amount of each component within a mixture. Effluent – A component that has exited the analytical column. Elute – The act of a component leaving the column. GC System – The equipment used in gas chromatography, including the sample inlet system, sample conditioning system, outlet tubing, analytical columns, carrier gas tubing, and detectors. Hydrocarbon Dew Point – The temperature (pressure) at a given pressure (temperature) at which a particular gaseous hydrocarbon mixture begins to condense into the liquid phase. Integration System – The hardware and software used to calculate peak areas. Linearity – The ability to obtain test results within the precision limits of the standard for components of interest, using a single response factor for each component. Linear Range – The range of concentrations where the peak area is proportional to the component mol % for a particular component. Linearity Check –A process that verifies the degree of nonlinearity for an analytical instrument (Refer to GPA 2198) Molecular Sieve – A device used to separate a particular component from the rest of a mixture. Normalized Mol % – The sum of mol % determined for a mixture, adjusted to 100 %. Partition Column – A column that separates by liquid partitioning, gas-liquid chromatography, such as the DC200/500. Peak Windows – The expected time period for a particular component to elute from the column. Performance Evaluation Acceptance Criteria – A range that acceptable instrument test result must fall within defined by the root sum square of the method reproducibility and uncertainties of the performance evaluation blend. Refer to GPA 2198.

17
Plus Fraction – A group of components that are lumped together after the last speciated component. In a “C6 Plus” analysis, this is all components that elute after normal pentane on frontal flow. Porous Polymer Column – A column that separates utilizing polymer beads, gas solid chromatography, such as Porapak Q or Hayesep Q. Pre-Column – The column in the early backflush configuration that lumps the “Plus” fraction components into a single peak. This is the shorter of the two DC200/500 columns. Retention Time – The amount of time between sample introduction and elution for a particular component. Repeatability – The expected precision for a test result when the same method is used utilizing the same equipment and analyst. Values for “Repeatability” can be found in Section 10, “Precision”. Reproducibility – The expected precision for a test result when the same method is used utilizing different equipment and/or analysts. Values for “Reproducibility” can be found in Section 10, “Precision”. Response Factor – The response factor is calculated by dividing the peak area for a particular component by the corresponding mol % of the reference standard blend. This factor is then used to determine the mol % of the component in an unknown gas sample. Robust Mean – The statistical mean of a set of values after outliers have been removed. Refer to TP-31 for guidance on outlier rejection. Sample/Calibration Run – The act of analyzing a gaseous mixture, from sample introduction to elution. Sample Conditioning System – The portion of the sample system that removes contaminants from the sample. Sample Inlet/Entry System – The portion of the sample system where the sample is received from a sample container. Sample System – The equipment used to prepare and introduce a sample onto the pre-column, including the sample inlet/entry system and the sample conditioning system Thermal Conductivity Detector (TCD) – A detector that may use a wheat-stone bridge to determine the amount of each component. The carrier gas passes over an element with a current running through it, and the sample stream passes over a similar element with the same current running through it. The resistance of each element is measured and the difference between the two coupled with expected retention times is used to determine the amount of each component present. Un-Normalized Mol % - Un-normalized mol % is the sum total mol % of the components determined for a mixture. (See Normalized Mol %.)

18

19
APPENDIX A - Calibrations A-1 Linearity
Section 4, Appendix C and GPA 2198 discuss Linearity and list procedures to determine the linear range and calibration requirements of GC systems. When it is anticipated that the range of concentrations of components in the unknown samples will not fall in the linear calibrated range of the instrument, it is necessary to make corrections for this. Two means of accomplishing this are through multi-level calibration (calibration curve) or secondary analysis.
A-1.1 Calibration Curves (Multi-level Calibration)
A-1.1.1 Calibration Curves Using Multiple Calibration Blends
Once linearity has been determined for a GC, as described in Section 4, and the linear range is found to be inadequate for the range of unknown sample concentrations anticipated, calibration curves for any component may be determined by using multiple calibration blends. Duplicate injections of at least three concentration levels for the desired component should be made. If the values on duplicate runs agree within the tolerances in Section 10, “Repeatability”, the response factor should be calculated as follows for each concentration level:
K= Cn An where K = Response factor Cn = Concentration of component n An = Peak area in arbitrary units of component n
Calibration curves may now be developed by plotting response factors versus concentration. Any program capable of generating a polynomial curve fit may be used.
A-1.1.2 Calibration Curves Using Partial Pressures of Pure Components
Once linearity has been established for the instrument as described in Section 4, calibration curves for any component to be measured in the unknown sample may be determined by using pure components. Attach the pure component to the sample entry system and evacuate the entry system to less than 1 mm of mercury. Using the partial pressure range suggested in Table A-l, inject at least three partial pressures in duplicate and capture data including Barometric Pressure at the time of the injection. When concentrations on duplicate runs meet the criteria listed in Section 10, “Repeatability”, calculate the response factor as follows:

20
K= (Pi) (100) (Po) (A) Where K = Response factor Pi = Partial pressure of pure component in mm of mercury to nearest 0.5
mm Po = Barometric pressure in mm of mercury to nearest 0.5 mm A = Peak area of pure component in arbitrary units
Calibration curves can now be developed by plotting response factors versus concentration. Most integration software packages have this feature built-in, but if this feature is not available, other programs capable of generating a polynomial curve fit may be used.
Table A-1
Component Mole % Stated Uncertainty PE
Oxygen 100 750 13.33 Nitrogen 100 750 13.33 Methane 500 750 66.67 Carbon Monoxide 100 750 13.33 Carbon Dioxide 100 (650)* 750 13.33 Ethane 200 (450)* 750 26.67 Propane 100 (200)* 750 13.33
Isobutane 100 (100)* 750 13.33
n-Butane 100 (100)* 750 13.33
Isopentane 50 (50)* 750 6.67
n-Pentane 50 (50)* 750 6.67
*Partial Pressures in parentheses are the maximum pressures to be used to determine response factors. Exceeding these pressures could result in low response factors caused by compressibility of the pure component.
A-1.2 Secondary Analyses Secondary analyses may be used instead of calibration curves (as in the case of Carbon Dioxide on a Porous Polymer column.) or for determination of compounds not determined by the partition column run. The secondary analysis or run may occur separately or simultaneously to the primary analysis or run. When more than one component is determined, add all component concentrations and normalize to 100%. When a single component is determined, it is acceptable to keep that component concentration whole as described below:
Fnorm= 100- Cn
100 Where Fnorm = Normalization Factor Cn = Concentration of component n

21
All components determined in the primary analyses or run are then multiplied by Fnorm, and the single component held whole.
A-1.3 Other Documentation – Instrument logbooks, Maintenance logbooks, User
Manuals, Calibration Records, QA/QC records, Analytical Methods and SOP’s are documents that form the analytical audit trail. These documents may either be maintained electronically or in written form.

22
APPENDIX B – Linearity Discussion An ideal GC detector will provide a linear response across all sample component concentrations. In this case, a calibration standard with any concentration of the component of interest could be run and a calibration response factor could be determined: Example: A calibration standard has 80 Mole % Methane. When the sample is run on the GC, it generated a peak area of 80,000. The response factor for Methane at 80% concentration is:
Kmethane = Mole % Methane ÷ Peak Area = 80 ÷ 80,000 = 0.001 When the detector was perfectly linear, and an unknown sample was run and generated a peak area for Methane of 40,000, the Methane concentration in Mole % would be:
Peak Area x Kmethane = 40,000 x 0.001 = 40 Mole % Methane A graph of Mole % concentration to peak area would be linear (a straight line):
Linear Methane Response
0
20000
40000
60000
80000
100000
120000
0 20 40 60 80 100 120
Mole% Methane
Pea
k A
rea

23
However, many chromatograph detectors are not linear in their response. A graph of Mole % concentration to peak area would not be linear: In this example, Calibrating to 80 Mole % would yield the following response factor:
KMethane = Mole % Methane ÷ Peak Area Methane = 80 ÷ 96,000 = 0.000833
Using the above calibration factor to analyze a sample with 40% Methane would yield the following result:
Mole% Methane = Peak Area Methane * KMethane = 64,000 * 0.000833 = 53.333 Mole % Methane
Since the difference between the actual value (40%) and the reported value from calibration to 80% Methane (53.333%) exceeds the reproducibility limits established in Section 10 it would be necessary to have separate calibration standards for samples containing 80% Methane and samples containing 40% Methane. The linearity check is used to determine the number of calibration standards that are needed to analyze all the expected sample compositions. When more than one calibration is required, this can be achieved by having a separate calibration method for each expected sample composition, a multi-level calibration for all components or a multi-level calibration for the components that are not linear. Whether a GC detector is linear for a component or not linear for a component is determined by whether it can be analyzed within the reproducibility limits outlined in Section 10.
Non - Linear Methane Response
0
20000
40000
60000
80000
100000
120000
0 20 40 60 80 100 120
Mole% Methane
Pea
k A
rea

24
Linearity curves can be established by running multiple calibration standards of various compositions. In this case, the actual Mole% is plotted against the peak area. Linearity curves can also be established by running the same calibration standard under various partial pressures. In this case, the Mole% value is determined by the following formula (see Appendix A, A-1.1.2): Partial Pressure Mole % Equivalent = Mole % x Inj P / Max P Where: Max P = the normal sample loop pressure that samples are injected in absolute pressure Inj P = the sample loop pressure that the sample was injected in absolute pressure
Notes: The above calculation does not take compressibility into account. To be accurate, the compressibility factor should be included in the calculation. Max P and Inj P must be expressed in the same absolute pressure units. Refer to GPA 2198 for more detailed instruction in calibrating with non-linearity in mind.

25
APPENDIX C – Supplementary Procedures C-1 Run Analysis for Nitrogen, Methane, Carbon Dioxide, and Ethane
The porous polymer column must completely separate methane, carbon dioxide and ethane to baseline as shown in the example chromatogram. The linearity of this system must be determined to be linear to be an acceptable alternative to the calibration curve technique described in Appendix B. This system can be used as part of a multi-column GC, as in the case of some portable GC’s.
C-2 Determination of Carbon Monoxide
This component is encountered in association with oxygen, nitrogen, carbon dioxide and the conventional hydrocarbons in the effluent streams from combustion processes such as insitu combustion, manufactured gas and many varied types of stack gases. No extra equipment is necessary to determine carbon monoxide since it elutes shortly after methane on the molecular sieve run. If a calibration gas is available containing carbon monoxide, obtain a response factor as for methane on the molecular sieve column. However, should a gas blend not be available, a calibration curve should be developed using pure carbon monoxide to determine the extent of the nonlinearity, if present.
C-3 Determination of Hydrogen and Helium
When hydrogen is to be separated from helium, a 20’ molecular sieve 5A column using nitrogen or argon as a carrier gas may be used. Low temperature, 40°C (104°F) or less is necessary to effect this separation. When hydrogen is present, it will elute on the standard molecular sieve run, using helium as a carrier gas, just before oxygen. The hydrogen response is downscale (negative) rather than upscale (positive). Signal polarity must be reversed for the hydrogen peak to be recorded upscale. The sensitivity and precision of measurement will be poor under these conditions due to similar thermal conductivity values for hydrogen and helium. If a calibration gas blend is available containing hydrogen and helium, it should be used to obtain response factors however, if this is not the case, the pure components, hydrogen and helium, may be used to develop response factors in the manner set forth in Appendix A, A-1.
C-4 Determination of Hydrogen Sulfide
As indicated earlier in this text, to be absolutely sure of the hydrogen sulfide content of a gas, determinations should be made at the sample source. However, in the case where a field measurement has not been made and although corrosion of the sample bottle may have resulted in some loss of hydrogen sulfide, a measurement of the in-place component may be made by gas chromatography. It is necessary to charge a sample of pure hydrogen sulfide to the column prior to charging the unknown gas. As soon as the pure hydrogen sulfide has cleared the column, the unknown gas should be charged. (All calibrations should be done the same way, that is, each partial pressure charge of pure hydrogen sulfide must be preceded by a full sample loop of pure hydrogen sulfide.) A column that has proved satisfactory for this type of analysis is the Silicone 200/500 column. It is most convenient since this is the recommended column for determining the hydrocarbons in a

26
natural gas analysis. Hydrogen sulfide elutes between ethane and propane with good resolution.
CAUTION - Extreme care must be taken when working with hydrogen sulfide due to the very toxic nature of the gas. The best ventilation possible must be maintained in the laboratory. The Maximum Allowable Concentration that a person may be exposed to without approved respiratory protection equipment is 10 ppm for an eight hour working period. When the exposure lasts through the working day, concentrations as low as 15 ppm may cause severe irritation to the eyes and respiratory tract. Exposure of 800 to 1,000 ppm may be fatal in a few minutes. The nose must not be depended upon to detect the presence of hydrogen sulfide, as 2-15 minutes of exposure will cause the loss of smell. C-5 Determination of Extended Hydrocarbon Fractions through a Specified Plus Fraction
In some applications, it is beneficial to further define the heavier components within a Natural Gas sample. This is performed by fully eluting all of the components within the sample, as opposed to performing a back flush which elutes the plus fraction as a single peak. The fully eluted compounds do not need to be individually resolved. However, the hydrocarbon fractions shall be defined by the straight chain (normal) hydrocarbons and they must be resolved sufficiently to provide clear identification and separation of each fraction. Each fraction shall include all chromatographic peaks, starting with the first peak which elutes after the straight chain hydrocarbon of the previous fraction and ending just after and including the straight chain hydrocarbon of the desired fraction (e.g. the C7’s fraction shall encompass all peaks from after n-Hexane to just after n-Heptane). All chromatographic peaks within each fraction shall be summed and quantitated as a single value. The plus fraction shall include all chromatographic peaks, starting with the first peak which elutes after the straight chain hydrocarbon of the previous fraction and ending with the last peak which elutes. The procedures and apparatus detailed within this standard shall apply, with the exception of the use of a backflush for plus fraction separation.

27
APPENDIX D – Portable Gas Chromatograph Standard Operating Procedures
1.0 Purpose
This document outlines the procedures for the operation of a Portable Gas Chromatograph (GC) for in the field gas measurement. The portable gas chromatograph separates and measures the individual gas components in a natural gas mixture. The following properties can be determined from this measurement: • Composition • Specific gravity • Heating value • Hydrocarbon liquids, gallons per 1,000 cubic feet of gas (GPM) • Liquid petroleum gases (LPG), gallons per 1,000 cubic feet of gas (propane and
butane) • Compressibility
This Standard Operating Procedure (SOP) requires the use of a historical verification software program for validating sample results to ensure an accurate and representative sample was collected before the analyst leaves the location.
This SOP utilizes the following industry guidance standards: • GPA Standard 2166 - Obtaining Natural Gas Samples for Analysis by Gas
Chromatography • API Manual of Petroleum Measurements Standards Chapter 14.1 - Natural Gas Fluids
Measurement - Collecting and Handling of Natural Gas Samples for Custody Transfer
• GPA Standard 2261 - Analysis for Natural Gas and Similar Gaseous Mixtures by Gas Chromatography
• GPA Standard 2145 - Table of Physical Properties for Hydrocarbons and Other Compounds of Interest to the Natural Gas Industry
• GPA Standard 2172 - Calculation of Gross Heating Value, Relative Density, Compressibility and Theoretical Hydrocarbon Liquid Content for Natural Gas Mixtures for Custody Transfer
• GPA Standard 2198 - Selection, Preparation, Validation, Care and Storage of Natural Gas and Natural Gas Liquids Reference Standard Blends

This SOP contains the following sections: 2.0 Portable GC Checklist 3.0 Attaching the Helium Carrier Gas 4.0 Start-Up 5.0 Shut-Down 6.0 In the Field Sample Analysis 7.0 Calibration and Validation 8.0 Calibration Gas Standard Specification and Validation 9.0 Sampling System Validation 10.0 Miscellaneous
2.0 Portable GC Checklist 2.1 Daily Responsibilities:
1. Ensure Helium carrier gas is of adequate pressure for model of gas chromatograph and the regulator is functioning properly. (No lower than 200 psig cylinder pressure). (Refer to Section 3.0 Attaching the Helium Carrier Gas).
2. Purge the sample hose with sample gas, standard gas, or UHP Helium prior to analyzing the first samples of the day and prior to analyzing the first sample at each location (between 16 and 20 psig for a minimum of 2 minutes). A multi-port valve at the sample / calibration gas inlets of the chromatograph will allow for purging the sample line without detaching it from the instrument, thus reducing the potential for ambient infiltration.
3. Ensure the sampling system is heated to a minimum of 30º F above hydrocarbon dewpoint of the gas being sampled.
4. Keep a cap or plug on the sampling end of the heated line and the filter/regulator assembly when they are not in use to ensure foreign objects do not enter the system.
5. Do not lie anything on top of the heated hose while being stored. Keep it loose, coiled, and free from chafing. Do not kink the hose which will break the heat tape and pinch the sample tubing within.
6. Discard the first run of the day. 7. Check the un-normalized totals (should be between 97.0% and 103.0%) and verify
the heating value, specific gravity, and individual mole% concentrations with historical data prior to accepting and processing any and all analyses into the measurement accounting system and/or entering values into the meter (refer to Section 6.0 In the Field Sample Analysis).
8. When analyzing high H2S wells, it is recommended that the sample system be purged with UHP Helium in-between locations (this will help clear the system of H2S contamination).

2.2 Weekly Responsibilities:
1. Perform validation / calibration procedures, ensure the all required documentation is saved and maintained in accordance with company’s best practices (refer to Section 7.0 Calibration and Validation).
2. Monitor the calibration gas pressure and temperature. a. All calibration gases shall be maintained in accordance with GPA 2198. b. The temperature of each cylinder should be maintained at a minimum of 30º F
above hydrocarbon dewpoint. i. Each cylinder should be heated for a minimum of 24 hours prior to use.
3. Check for leaks in the entire system (do not use leak detection liquids on the Helium fitting on the back of the GC).
4. Ensure integrity of the heated hose (inspect for cuts, cold spots, kinks, etc.). Replace as necessary.
2.3 Monthly Responsibilities:
1. Verify the cleanliness of the sampling system by flowing UHP Helium through the entire sampling system and analyzing it on the chromatograph, clean as necessary (refer to Section 9.0 Sampling System Validation). a. More frequent cleaning of the sampling system may be required depending on the
locations sampled. Monitor the types of field gas sampled throughout the month and increase cleaning frequency as necessary.
2.4 Annual Responsibilities:
1. Update historical sample verification database from the Measurement Validation and Accounting system. a. More frequent updates may be required, depending on the variability of the
samples being analyzed. 3.0 Attaching the Helium Carrier Gas
Note: It is recommended that Helium carrier gas cylinders be mounted inside the cab of the vehicle due to the extreme temperature fluctuations the cylinder may be exposed to during the winter and summer months. Super cooling and super heating can cause a wide range of chromatographic issues and irregularities. The chromatograph should always be OFF when carrier gas is not flowing (full Shut-Down and Start-Up procedures should be followed when installing a new carrier gas bottle).
1. Verify the carrier gas being used is Ultra High Purity (UHP) Helium. UHP is defined
as 99.999% pure. 2. Ensure any regulators and tubing being used for carrier gas are clean and dedicated.
Never use regulators or tubing that has been used for any other purpose. a. A 2μm in-line filter should be installed between the chromatograph and carrier
gas tubing to ensure no particulate enters the instrument. Contaminants and/or particulate in the carrier gas can cause chromatographic issues and potentially damage the instrument.

b. A moisture trap can also be installed between the chromatograph and carrier gas tubing to ensure no moisture enters the instrument. Moisture vapor in the carrier gas can cause chromatographic issues and potentially degrade the columns.
3. Check the Helium carrier gas bottle for proper operating pressures. The cylinder pressure should be above a minimum of 200 psig.
4. Prior to attaching the carrier gas tubing to the chromatograph, the regulator and tubing should be purged. With the tubing disconnected from the instrument, open the Helium cylinder and increase (clockwise) the pressure to approximately 5 psig. Allow the Helium to bleed into the atmosphere for approximately 60 seconds.
5. With the Helium still flowing at approximately 5 psig, connect the carrier gas tubing to the inlet port of the instrument. Tighten the fitting but do not use a liquid leak detector to test for leaks on the GC.
6. Very slowly increase (clockwise) the regulator pressure setting from 5 psig to the manufacturer recommended setting. This process should take an average of 1-2 minutes to perform. Check the regulated pressure setting daily. As it bounces down the road in the vehicle, the setting can change. a. Each Helium carrier gas cylinder regulator shall be designed for the proper
pressure range. UHP Helium cylinders typically have 2200 to 2600 psig when new. Portable gas chromatographs typically require between 55 and 95 psig. The delivery side of the regulator should have a max setting of no more than 300 psig. Regulators with higher settings are not as accurate at 95 psig and below. Delivering too much pressure can severely damage the instrument.
7. In order to avoid the buildup of potentially hazardous Helium concentrations within the cab of the vehicle, the carrier gas cylinder valve should be closed when the GC is to remain unused for an extended period of time, such as nights and weekends.
8. Validation of Helium carrier gas is to be performed prior to new cylinder attachment to the GC. a. Verify that there are no gas components trapped within the GC prior to the
verification process by running the Ultra High Purity Helium validation gas through the GC several times to establish a base line.
b. Use a piece of clean or new nylon 11 tubing with clean or new fittings and a clean regulator for connection between the GC and cylinder, not the heated sample line and/or filter/regulator assembly.
c. Purge the tubing and regulator to clear the system of Oxygen and Nitrogen (thoroughly purge the regulator several times), prior to attaching them to the instrument.
d. Regulate the Helium gas inlet pressure to the GC between per manufacturer specifications.
e. Perform several analyses until it is verified that the GC has no residual components (refer to Section 9.0 Sampling System Validation). Un-normalized concentrations for each component should be non-detectable.
f. Once the GC is verified to be free of residual components, connect the new Helium carrier gas cylinder.
g. Purge the tubing and regulator to clear the system of Oxygen and Nitrogen (thoroughly purge the regulator several times), prior to attaching them to the inlet of the instrument.

h. Regulate the Helium gas inlet to the GC between per manufacturer recommendations.
i. Perform 3 analyses. Un-normalized concentrations for each component should be non-detectable.
j. Another GC may be used for confirmation purposes, running the same test and using the same parameters as listed above.
9. If the new cylinder is not within the specified limits, notify the vendor for replacement.
10. If the carrier gas passes, it may be placed in service using the connection procedures at the beginning of this section, Steps 1-7. a. Do not use leak detection liquids on the Helium carrier gas system.
4.0 Start-Up
1. Ensure the verified UHP Helium carrier gas is attached and on. Carrier gas should always be turned on prior starting the instrument (refer to Section 3.0 Attaching the Helium Carrier Gas).
a. Carrier gas should always be the first thing on and the last thing off. 2. Ensure the appropriate communication cable is plugged into both the chromatograph
and computer. 3. Turn the gas chromatograph power on. 4. Turn on the heated sampling system. 5. Power up the computer (computer can be powered up prior to powering up the
chromatograph). 6. Launch the GC operation software. 7. Launch the historical verification software. 8. Download/initiate the appropriate analytical method as necessary. 9. Allow the gas chromatograph to stabilize for approximately 45 minutes prior to first
analysis. 10. It is recommended that the first analysis of the day be discarded.
5.0 Shut-Down
1. When finished for the day, the power switch of the chromatograph can simply be turned off and software can be closed.
2. If the chromatograph is enclosed in a vehicle, the carrier gas should be turned off to reduce the potential for hazardous level build up.
6.0 In the Field Sample Analysis Note - Never analyze a sample stream which is not flowing. A sample stream should flow a minimum of 2 hours prior to sample analysis. If that is impossible (such as in plunger lift applications), allow as much time as practicable prior to sample analysis.
1. Vent the location sample point to ensure there are no standing liquids built up in the probe or valve.
2. Once the sampling point is free and clear of liquids, attach the filter/regulator assembly.

a. The following picture is an example filter/regulator assembly. b. The assembly should be heated and/or insulated in a manner which ensures it is
maintained at least 30º F above hydrocarbon dewpoint of the gas stream being analyzed.
i. Heat should be maintained on the system when traveling between sampling locations.
c. The filter/regulator assembly should be stored in a location which minimizes the opportunity for damage.
Figure D-1 Example Filter/Regulator Assembly
3. Set the regulator to deliver the sample gas to the gas chromatograph at the same pressure at which it was calibrated (refer to Section 7.0 Calibration and Verification).
4. Attach the heated line to the filter/regulator assembly. a. Ensure the entire sampling system has reached at least 30º F hydrocarbon dewpoint
prior to sampling. b. When possible, suspend the heated line to keep it off the ground (the cold ground
pull heat from the line rapidly).

5. Turn the sample valve at the chromatograph to the vent position. Vent sample gas through the sampling system for a sufficient period of time to ensure a representative sample prior to starting analysis.
6. Turn the sample valve at the chromatograph to the sample inlet position. 7. Start the injection and analytical process on the gas chromatograph.
a. When prompted, enter the appropriate identification into the system for sample tracking.
b. Enter all other relevant information as necessary and available. This may include, but is not limited to, the following:
i. Meter Number ii. Meter Name
iii. Description iv. Flowing Temperature v. Flowing Pressure
8. If this was the first run of the day, discard and return to Step 7. 9. Upon completion of the analysis, the historical verification software data entry page
will prompt the entry of additional information. a. Ensure the location identification number transferred correctly into the ‘Sample
Name’ field. i. The location identification number will need to be identical to that used in the
historical database to accurately compare the data. b. Enter all relevant data. This may include, but is not limited to, the following:
i. Meter Name ii. Sample Date
iii. Laboratory iv. Atmospheric Pressure v. Analyzer Type
vi. Analyzer Make and Model vii. Last Verification/Calibration Date
viii. Sampling Flow Rate ix. Ambient Temperature x. Sampling System Heat Tracing
xi. Type of Sample (Spot or Composite) xii. Sampling Method
xiii. Company Collecting Sample xiv. Hexanes Plus Split Ratio (if applicable) xv. Water Vapor Concentration (lbs/MMscf)
xvi. Injection Date xvii. Report Date
c. If H2S concentrations are collected by an analyzer or colorimetric tubes, enter the concentration in parts per million by volume (ppmv) into the appropriate ‘H2S’ field.
d. If water vapor concentrations are collected by an analyzer, enter the concentration in pounds per million cubic feet (lbs/mmcf) into the ‘Water Vapor’ field.
10. Process the sample results through the historical data verification software system.

a. The historical data verification software will verify the sample’s individual component concentrations, gross heating value, and relative density against historical results for that sample location. Any results which fall within the preset acceptance windows (typically two sigma) will be highlighted green. Any results which fall outside the preset acceptance windows will be highlighted red. It will also validate the un-normalized total is between 97.0% and 103.0%
i. The following is an example verification window with passing results.
Figure D-2 Example Historical Data Verification Window – All Parameters Passing
b. If all results fall within the acceptance parameters, they can be accepted and processed into the Measurement Accounting and Validation System.
i. The following is an example verification window with failing results.

Figure D-3 Example Historical Data Verification Window – Parameter Failure
a. If any results which fall outside the preset acceptance parameters, the following Steps
should be followed: i. Individual parameter failures, with the exception of un-normalized totals, do not
automatically indicate a bad sample. Failures indicate a potential issue and further evaluation and investigation should be performed to verify if the sample is good or bad. (1) If sample has high Nitrogen, turn the sample valve at the chromatograph to vent
and vent sample gas through the sampling system again. Return to Step 6. (a) If Nitrogen concentrations do not decrease to expected levels, inspect the
sampling system for leaks. Repair or replace as necessary. (2) If C6+ concentrations are high, it may be an indication of a contaminated
sampling system. (a) Re-analyze the sample to verify concentration. Return to Step 6.
(i) If C6+ concentrations remain higher than the acceptance limits, and it is due to contamination in the sampling system, clean the sampling system prior to performing any further analyses (Refer to Section 9.0 Sampling System Validation).
ii. If the un-normalized totals are outside of the 97.0% to 103.0% acceptance window, return to Step 9. (1) If after several analyses the un-normalized totals remain outside of the acceptance
window, re-calibrate the instrument before proceeding (refer to Section 7.0 Calibration and Validation).
(2) Note that ambient pressure and altitude can also affect un-normalized totals.

iii. If individual component concentrations, heating value, and/or specific gravity values do not fall within the preset acceptance criteria, return Step 6. (1) If the results do not come within the preset acceptance criteria on the secondary
analysis, determine if there are circumstances which would make that sample from that location different from past analyses. Such circumstances may include, but are not limited to, the following: (a) Difference in ambient temperatures between current and past analyses. (b) Well has not had flow in quite some time prior to analysis.
(i) Remember; never analyze a well that is not flowing. (c) Multiple wells flow into the stream being tested and each turns on and off at
various times. Note - There are many other circumstances which may lead to differences from past analyses.
(2) If there are circumstances which explain the failure, enter any explanation into the comments field and accept the results. (a) It is very important to enter the explanations for any failures into the
comments field because that information accompanies the data into the Measurement Accounting and Validation System and can be used for further validating and auditing. In addition, it will reduce the need for editors to contact technicians for confirmation.
iv. Most Historical Data Verification Software Systems require a minimum of 3 samples in the historical database to validate analyses. If there are less than 3 samples in the historical database, each individual result, with the exception of un-normalized totals, will be highlighted red. (1) The following is an example verification window with failing results due to
insufficient sample history.
Figure D-4 Example Historical Data Verification Window – Not Enough History

(2) If the un-normalized totals are within the 97.0% to 103.0% acceptance criteria, enter “Not Enough History” into the comments field and accept the results.
7.0 Calibration and Validation Note: Validation, and if necessary calibration, of the portable GC shall be done on a weekly basis, unless no samples are to be analyzed during a given week.
The calibration and validation procedures within this document utilize the GPA 2261 acceptance criteria for repeatability and reproducibility. Acceptance can be determined through the use of spreadsheets or though built-in comparisons within the historical verification software system.
Individual compound concentrations for the samples analyzed by a given gas chromatograph should be within ±50% of the certified standard concentrations used for calibration of that GC. If individual compound concentrations for the samples analyzed by a given gas chromatograph exceed ±50%, a multi-point calibration or multiple single-point calibrations shall be performed. Refer to manufacturer specification for multi-point calibrations.
7.1 Prior to Validation/Calibration:
1. The UHP carrier gas cylinder should be above a minimum of 200 psig pressure. Verify the carrier gas delivery pressure is set per manufacturer recommendations (refer to Section 3.0 Attaching the Helium Carrier Gas).
2. Ensure the calibration gas cylinder is above a minimum of 20 psig, or roughly 10% of the initial pressure of the cylinder at delivery to the asset. a. If not, a new cylinder should be used. Ensure it has been heated for a minimum of
24 hours prior to use and has been verified per GPA 2198 (refer to Section 8.0 Calibration Gas Standard Specifications).
3. Attach the filter/regulator assembly to the regulator of the calibration standard. a. Set the regulator to deliver the calibration sample at the manufacturer
recommended pressure. 4. Attach the heated sample line to the filter/regulator assembly.
a. Ensure the entire system is at least 30º F above hydrocarbon dewpoint prior to performing any analyses.
b. Suspend the heated line to keep it off the ground (the cold ground will pull heat from the line rapidly).
7.2 As-Found Verification: Note: The As-Found validation procedures assume that an initial calibration has already been performed. If it has not, skip the As-Found verification and proceed to section 7.3 Calibration.
1. Turn the sample valve at the chromatograph to vent. Vent calibration gas through the sampling system for sufficient time to ensure a representative sample is delivered to the gas chromatograph.
2. Turn the sample valve at the chromatograph to the sample inlet. 3. Analyze the calibration standard in duplicate. 4. Evaluate the compound concentrations of the two analyses against one another using
the GPA 2261-13 repeatability acceptance criteria.

a. If the analyses do not pass the repeatability acceptance criteria, analyze a third sample and compare the second and third analyses.
i. Note – Do not pick and choose analyses, only consecutive analyses should be compared for repeatability.
b. If the second and third analyses do not pass the repeatability acceptance criteria, inspect the gas chromatograph, sampling system, and calibration standard for discrepancies.
c. If an issue is found, repair as necessary and return to Step 1. d. In no issue is found, repeat Steps 1 through 4.
i. If the problem persists, remove the gas chromatograph and sampling system from service until the issues are determined and resolved, and the instrument can pass for repeatability.
5. If the two analyses pass the repeatability acceptance criteria, evaluate the compound concentrations of the second analysis against the certified concentrations of the calibration standard using the GPA 2261-13 reproducibility acceptance criteria.
a. If the analyses pass the reproducibility acceptance criteria, the gas chromatograph can be placed into service after completing Step 6.
b. If the analyses do not pass the reproducibility acceptance criteria, repeat Steps 1 through 5.
c. If the analyses still do not pass the reproducibility acceptance criteria, document as such and move on to instrument calibration.
6. Retain all documentation from the As-Found verification necessary to meet all contractual obligations, regulatory compliance, and company best practices.
Table D-1
Example As-Found Verification
7.3 Calibration: 1. Turn the sample valve at the chromatograph to vent. Vent calibration gas through the
sampling system for sufficient time to ensure a representative sample is delivered to the gas chromatograph.
2. If the gas chromatograph has a separate calibration stream, turn the sample valve to calibration gas input. If it does not, turn the sample valve at the chromatograph to the sample inlet.
3. If a different calibration gas cylinder is being used from the one the chromatograph was calibrated previously, the new certified values will need to be entered into the chromatograph and the historical verification software.
Run 2 1 Average StandardCompound Mole % Mole % Mole % MOLE %
Nitrogen 0.9570 0.9610 0.9590 0.0040 0.04 PASS 0.9690 0.0120 0.16 PASSMethane 85.5090 85.5100 85.5095 0.0010 0.04 PASS 85.4200 0.0890 0.15 PASSCarbon Dioxide 1.4480 1.4460 1.4470 0.0020 0.01 PASS 1.4710 0.0230 0.14 PASSEthane 5.8650 5.8630 5.8640 0.0020 0.03 PASS 5.9240 0.0590 0.06 PASSPropane 2.9630 2.9650 2.9640 0.0020 0.01 PASS 2.9560 0.0070 0.05 PASSIsobutane 0.7940 0.7940 0.7940 0.0000 0.01 PASS 0.7880 0.0060 0.02 PASSn-Butane 0.7920 0.7900 0.7910 0.0020 0.02 PASS 0.7980 0.0060 0.03 PASSIsopentane 0.5900 0.5910 0.5905 0.0010 0.01 PASS 0.5910 0.0010 0.03 PASSn-Pentane 0.5890 0.5900 0.5895 0.0010 0.01 PASS 0.5910 0.0020 0.03 PASSHexanes+ 0.4930 0.4900 0.4915 0.0030 0.02 PASS 0.4920 0.0010 0.04 PASSTOTAL 100.0000 100.0000 100.0000
According to GPA 2261-13Reproducibility
DeviationReproducibility
LimitsTestRepeatability
DeviationRepeatability
Limits Test

4. Process or re-process the calibration analysis as the chromatograph calibration. 5. Upon completion, verify the calibration results.
a. The normalized mole% values should match exactly those values on the calibration gas certification sheet.
i. If so, proceed to the As-Left verification after completing Step 6. ii. If not, return to Step 1.
iii. If it still does not match, contact support. 6. Retain all documentation from the calibration necessary to meet all contractual
obligations, regulatory compliance, and company best practices. 7.4 As-Left Validation:
1. Leave the sample valve at the chromatograph to calibration gas input or sample inlet, as appropriate for the instrument.
2. Analyze the calibration standard in duplicate. 3. Evaluate the compound concentrations of the two analyses against one another using
the GPA 2261-13 repeatability acceptance criteria. a. If the analyses do not pass the repeatability acceptance criteria, analyze a
third sample and compare the second and third analyses. i. Note – Do not pick and choose analyses, only consecutive analyses
should be compared for repeatability. b. If the second and third analyses do not pass the repeatability acceptance
criteria, inspect the gas chromatograph, sampling system, and calibration standard for discrepancies.
c. If an issue is found, repair as necessary and return to Step 1 of Calibration. d. In no issue is found, repeat Steps 1 through 4.
i. If the problem persists, remove the gas chromatograph and sampling system from service until the issues are determined and resolved, and the instrument can pass for repeatability.
4. If the two analyses pass the repeatability acceptance criteria, evaluate the average compound concentrations of the two analyses against the certified concentrations of the calibration standard using the GPA 2261-13 reproducibility acceptance criteria.
a. If the analyses pass the reproducibility acceptance criteria, the gas chromatograph can be placed into service.
b. If the analyses do not pass the reproducibility acceptance criteria, repeat Steps 1 through 5.
c. If the analyses still do not pass the reproducibility acceptance criteria, return to Step 1 of Calibration.
i. If the problem persists, remove the gas chromatograph and sampling system from service until the issues are determined and resolved, and the instrument can pass for reproducibility.
5. Retain all documentation from the As-Left verification necessary to meet all contractual obligations, regulatory compliance, and company best practices.

Table D-2 Example As-Left Verification
8.0 Calibration Gas Standard Specifications and Validation 8.1 Calibration Gas Standard Specifications:
1. Calibrations shall be performed using a Certified Natural Gas Reference Standard. 2. Standards shall be verified and handled in accordance with GPA 2198. 3. Verify the new cylinders have no loss of pressure during transport and storage.
a. Contact manufacturer for initial pressures. b. In the event of pressure loss, do not put the cylinder into use. Contact the
manufacturer.
4. Calibration gas standard cylinders shall be heated to a minimum of 30º F above hydrocarbon dewpoint. They shall be heated a minimum of 24 hours prior to use and stored in a vertical position. NEVER PULL GAS FROM A COLD CYLINDER. a. The temperature should be monitored on a regular basis, and especially prior to
pulling any gas from the cylinder for calibrations and validations. b. Approved heating devices should be used, such as heating blankets with hoods
and pads, heating cabinets, etc. Make sure all electrical codes and classifications are followed. Ensure any and all applicable safety guidelines are followed.
5. Install a two-stage regulator to regulate the calibration gas to the manufacturer recommended pressure for the inlet of the GC being used.
6. All fittings attached to the calibration cylinder should be leak tested initially and then periodically to maintain integrity of the calibration blend. The cylinder valve and the valve downstream of the regulator should be closed when the standard is not in use.
7. Each technician’s heated sample line may be used for calibrations and validations. Be aware that a contaminated line can bias calibration and/or validation results (refer to Section 9.0 Sampling System Validation).
8.2 Calibration Gas Standard Validation:
Calibration cylinders on occasion can be prepared incorrectly by the manufacturer. All new calibration standards should be verified for accuracy prior to being put into service.
Run 2 1 Average StandardCompound Mole % Mole % Mole % MOLE %
Nitrogen 0.9570 0.9610 0.9590 0.0040 0.04 PASS 0.9690 0.0120 0.16 PASSMethane 85.5090 85.5100 85.5095 0.0010 0.04 PASS 85.4200 0.0890 0.15 PASSCarbon Dioxide 1.4480 1.4460 1.4470 0.0020 0.01 PASS 1.4710 0.0230 0.14 PASSEthane 5.8650 5.8630 5.8640 0.0020 0.03 PASS 5.9240 0.0590 0.06 PASSPropane 2.9630 2.9650 2.9640 0.0020 0.01 PASS 2.9560 0.0070 0.05 PASSIsobutane 0.7940 0.7940 0.7940 0.0000 0.01 PASS 0.7880 0.0060 0.02 PASSn-Butane 0.7920 0.7900 0.7910 0.0020 0.02 PASS 0.7980 0.0060 0.03 PASSIsopentane 0.5900 0.5910 0.5905 0.0010 0.01 PASS 0.5910 0.0010 0.03 PASSn-Pentane 0.5890 0.5900 0.5895 0.0010 0.01 PASS 0.5910 0.0020 0.03 PASSHexanes+ 0.4930 0.4900 0.4915 0.0030 0.02 PASS 0.4920 0.0010 0.04 PASSTOTAL 100.0000 100.0000 100.0000
According to GPA 2261-13Reproducibility
DeviationReproducibility
LimitsTestRepeatability
DeviationRepeatability
Limits Test

1. Perform the full ‘As Found’, ‘Calibration’, and ‘As Left’ procedures (see Section 7 Calibration and Validation) using the almost depleted cylinder which is being replaced. a. Ensure the almost depleted cylinder has met all GPA 2198 specifications prior to
use. 2. Analyze the new calibration cylinder as an unknown. Make sure it has been heated to
at least 30º F above hydrocarbon dewpoint for a minimum of 24 hours prior to use and stored vertically (refer to Section 8.0 Calibration Gas Standard Specifications).
3. Set the regulator to the manufacturer recommended pressure for the sample inlet. 4. Attach heated line. Ensure the heated line is at least 30ºF above hydrocarbon
dewpoint before sampling. 5. Suspend the heated line to keep it off the ground (the cold ground will pull heat from
the line rapidly). 6. Turn the sample valve at the chromatograph to vent. Vent calibration gas through the
sampling system for sufficient time to ensure a representative sample is delivered to the gas chromatograph.
7. Turn the sample valve at the chromatograph to the sample inlet. 8. Analyze the calibration standard in duplicate. 9. Evaluate the compound concentrations of the two analyses against one another using
the GPA 2261-13 repeatability acceptance criteria. a. If the analyses do not pass the repeatability acceptance criteria, analyze a third
sample and compare the second and third analyses. i. Note – Do not pick and choose analyses, only consecutive analyses should be
compared for repeatability. b. If the second and third analyses do not pass the repeatability acceptance criteria,
attempt verification of the calibration cylinder on a different gas chromatograph. i. If the cylinder does not pass the criteria on a second instrument, contact the
calibration standard manufacturer. 10. If the two analyses pass the repeatability acceptance criteria, evaluate the average
compound concentrations of the two analyses against the certified concentrations of the calibration standard using the GPA 2261-13 reproducibility acceptance criteria. a. If the analyses pass the reproducibility acceptance criteria, the calibration gas
cylinder can be placed into service after completing Step 11. b. If the analyses do not pass the reproducibility acceptance criteria, repeat Steps 1
through 5. c. If the analyses still do not pass the reproducibility acceptance criteria, attempt
verification of the calibration cylinder on a different gas chromatograph. i. If the cylinder does not pass the criteria on a second instrument, contact the
calibration standard manufacturer. 11. Retain all documentation from the cylinder verification necessary to meet all
contractual obligations, regulatory compliance, and company best practices. 9.0 Sampling System Validation
1. Attach the filter/regulator assembly to the regulator on the UHP Helium cylinder (it may require an adaptor fitting).
2. Set the regulator to the manufacturer recommended pressure for the sample inlet.

3. Attach the heated line to the filter/regulator. Ensure the entire sampling system is hot. a. Although the UHP Helium has no hydrocarbon dewpoint, the heat is necessary to
ensure any residual hydrocarbons are liberated from the sampling system. 4. Turn the sample valve at the chromatograph to vent. Vent calibration gas through the
sampling system for sufficient time to ensure ambient air and any gases are purged from the system.
5. Turn the sample valve at the chromatograph to sample input. 6. Perform several analyses until it is verified that the sampling system has no residual
components. a. Continue analyses until the un-normalized concentrations for each component are
non-detectable. a. If un-normalized Nitrogen concentrations remain detectable, there may be a
leak in the sampling system (see note below). (1) Disconnect the sample system from the chromatograph (sample system
includes heated sample hose and filter/regulator assembly). (2) Cap the end of the heated line and pressurize the system to 50 psig and
check for leaks. Liquid leak detector may be used to check this part of the system.
(3) Repair leaks as necessary. (4) Re-assemble the system and return to Step 1.
Note: If using Helium of lesser quality than chromatographic Ultra High Purity (UHP) grade, 99.999% purity, trace amounts of Methane and/or Nitrogen may be present on the chromatogram. This will cause sampling system validations to not pass. In addition, the GC will be misstating Methane and/or Nitrogen concentrations on all field analyses and will fail Nitrogen concentration values during an audit.
b. If the sampling system shows residual hydrocarbons after several analyses and purging, the sampling system will need to be cleaned. i. Replace the membrane element as necessary.
b. Use wet steam or an alcohol to clean the membrane filter body. Thoroughly dry all components before assembly and use, using Helium or Nitrogen.
c. Replace the inner tubing in the sample line if it is designed to do so. d. If the sample line does not clean up and does not have a replaceable inner
line, a light soapy solution in warm water can be used. (1) Pump the solution through the entire sample line, with the sample
line on and warm, for 2 to 4 hours (the solution should not be pumped through the filter/regulator assembly or any part of the chromatograph).
(2) Pump clean water through the sample line, with the sample line on and warm, for approximately 4 hours.
(3) Pump air through the line for approximately 8 hours. Ensure the line is completely dry prior to re-attaching it to the chromatograph.
(4) Do not use any type cleaner or solvent to clean any part of the sampling system that contains petroleum distillates, toluene, or benzene.

c. Return to Step 1. 7. Validate the cleanliness of the sampling system at least monthly. Inspect membrane
element at least monthly for holes and discoloration. Replace membrane element as necessary.
Note: Inspection and replacement of the membrane may be required more frequently depending on the type of field gas sampled. It would not be an uncommon practice to replace the membrane filter on a weekly or daily basis if needed in order to keep the sampling system free of contamination.
8. Keep the end connection of the heated line and filter/regulator assembly capped when not collecting samples. This will keep dust and other contaminants from entering the line when not in use.
10.0 Miscellaneous
1. By using the filter/regulator assembly, contamination to the hose and GC will be held to a minimum.
2. If the sampling system (filter/regulator assembly or heated line) become contaminated during field-testing, remove them from service, clean, and then validate. Discontinue the use of the sampling system until clean. If contaminated, not only the GC is at risk, but the validity of any samples analyzed can be compromised and biased.
3. The heated line and heated filter/regulator assembly are integral parts of the inlet system to the GC. They are necessary to keep the sample gas in single phase. If at any time, these items cease to function properly, remove them from service and replace the affected parts.
4. It is recommended to purge the sample line with sample gas, standard gas, or UHP Helium regulated to the manufacturer recommended pressure for at least 2 minutes, to ensure the sampling system is dry and conditioned, before the initial sampling each day.

GPA Midstream Standard 2261 History
(Adoption and Revisions)
• 1961 – Adopted as Tentative Standard • 1964 – Revised and Adopted as a Standard • 1972 – Revised • 1986 – Revised • 1989 – Revised • 1990 – Revised • 1995 – Revised • 1999 – Revised • 2000 – Revised • 2013 – Revised • 2019 – Revised