Tracking Highly Similar Rat Instances under Heavy Occlusions
Similar CNV Neurodynamic Patterns between Sub - MDPI
14
brain sciences Article Similar CNV Neurodynamic Patterns between Sub- and Supra-Second Time Perception Mingming Zhang 1,2,† , Keye Zhang 3,† , Xing Zhou 1,2 , Bin Zhan 4,5 , Weiqi He 1,2, * and Wenbo Luo 1,2, * Citation: Zhang, M.; Zhang, K.; Zhou, X.; Zhan, B.; He, W.; Luo, W. Similar CNV Neurodynamic Patterns between Sub- and Supra-Second Time Perception. Brain Sci. 2021, 11, 1362. https://doi.org/10.3390/ brainsci11101362 Received: 22 August 2021 Accepted: 12 October 2021 Published: 16 October 2021 Publisher’s Note: MDPI stays neutral with regard to jurisdictional claims in published maps and institutional affil- iations. Copyright: © 2021 by the authors. Licensee MDPI, Basel, Switzerland. This article is an open access article distributed under the terms and conditions of the Creative Commons Attribution (CC BY) license (https:// creativecommons.org/licenses/by/ 4.0/). 1 Research Center of Brain and Cognitive Neuroscience, Liaoning Normal University, Dalian 116029, China; [email protected] (M.Z.); [email protected] (X.Z.) 2 Key Laboratory of Brain and Cognitive Neuroscience, Dalian 116029, China 3 School of Social and Behavioral Sciences, Nanjing University, Nanjing 210023, China; [email protected] 4 State Key Laboratory of Brain and Cognitive Science, CAS Center for Excellence in Brain Science and Intelligence Technology, Institute of Psychology, Chinese Academy of Sciences, Beijing 100101, China; [email protected] 5 Department of Psychology, University of Chinese Academy of Sciences, Beijing 100049, China * Correspondence: [email protected] (W.H.); [email protected] (W.L.) † These authors contributed equally to this work. Abstract: In the field of time psychology, the functional significance of the contingent negative variation (CNV) component in time perception and whether the processing mechanisms of sub- and supra-second are similar or different still remain unclear. In the present study, event-related potential (ERP) technology and classical temporal discrimination tasks were used to explore the neurodynamic patterns of sub- and supra-second time perception. In Experiment 1, the standard interval (SI) was fixed at 500 ms, and the comparison interval (CI) ranged from 200 ms to 800 ms. In Experiment 2, the SI was fixed at 2000 ms, and the CI ranged from 1400 ms to 2600 ms. Participants were required to judge whether the CI was longer or shorter than the SI. The ERP results showed similar CNV activity patterns in the two experiments. Specifically, CNV amplitude would be more negative when the CI was longer or closer to the memorized SI. CNV peak latency increased significantly until the CI reached the memorized SI. We propose that CNV amplitude might reflect the process of temporal comparison, and CNV peak latency might represent the process of temporal decision-making. To our knowledge, it is the first ERP task explicitly testing the two temporal scales, sub- and supra-second timing, in one study. Taken together, the present study reveals a similar functional significance of CNV between sub- and supra-second time perception. Keywords: temporal discrimination; sub-second time perception; supra-second time perception; contingent negative variation 1. Introduction Time perception is a fundamental part of the human experience. It is crucial for the survival of individual organisms and daily behaviors, including interpersonal communi- cation [1–3]. Moreover, different time interval ranges are implicated in different types of perceptions and behaviors [4]. For example, music recognition and dancing are generally associated with millisecond perception [4,5], while individual decision making often takes several seconds or more time [4,6,7]. Many studies have investigated the topic of sub- and supra-second time perception by using diverse experimental paradigms and technologies. However, no consensus exists regarding whether the information processing mechanisms involved in sub- and supra-second time perception are similar or different. Most studies posit that distinct processing mechanisms and neural systems are re- cruited to perceive the two types of intervals [4,8]. For example, in a direct comparison of sub- and supra-second timing in the human brain using functional imaging, Lewis and Miall [9] found that although many brain regions were involved in both sub- and Brain Sci. 2021, 11, 1362. https://doi.org/10.3390/brainsci11101362 https://www.mdpi.com/journal/brainsci
-
Upload
khangminh22 -
Category
Documents
-
view
0 -
download
0
Transcript of Similar CNV Neurodynamic Patterns between Sub - MDPI

brainsciences
Article
Similar CNV Neurodynamic Patterns between Sub- andSupra-Second Time Perception
Mingming Zhang 1,2,†, Keye Zhang 3,†, Xing Zhou 1,2, Bin Zhan 4,5, Weiqi He 1,2,* and Wenbo Luo 1,2,*
Citation: Zhang, M.; Zhang, K.;
Zhou, X.; Zhan, B.; He, W.; Luo, W.
Similar CNV Neurodynamic Patterns
between Sub- and Supra-Second Time
Perception. Brain Sci. 2021, 11, 1362.
https://doi.org/10.3390/
brainsci11101362
Received: 22 August 2021
Accepted: 12 October 2021
Published: 16 October 2021
Publisher’s Note: MDPI stays neutral
with regard to jurisdictional claims in
published maps and institutional affil-
iations.
Copyright: © 2021 by the authors.
Licensee MDPI, Basel, Switzerland.
This article is an open access article
distributed under the terms and
conditions of the Creative Commons
Attribution (CC BY) license (https://
creativecommons.org/licenses/by/
4.0/).
1 Research Center of Brain and Cognitive Neuroscience, Liaoning Normal University, Dalian 116029, China;[email protected] (M.Z.); [email protected] (X.Z.)
2 Key Laboratory of Brain and Cognitive Neuroscience, Dalian 116029, China3 School of Social and Behavioral Sciences, Nanjing University, Nanjing 210023, China;
[email protected] State Key Laboratory of Brain and Cognitive Science, CAS Center for Excellence in Brain Science and
Intelligence Technology, Institute of Psychology, Chinese Academy of Sciences, Beijing 100101, China;[email protected]
5 Department of Psychology, University of Chinese Academy of Sciences, Beijing 100049, China* Correspondence: [email protected] (W.H.); [email protected] (W.L.)† These authors contributed equally to this work.
Abstract: In the field of time psychology, the functional significance of the contingent negativevariation (CNV) component in time perception and whether the processing mechanisms of sub- andsupra-second are similar or different still remain unclear. In the present study, event-related potential(ERP) technology and classical temporal discrimination tasks were used to explore the neurodynamicpatterns of sub- and supra-second time perception. In Experiment 1, the standard interval (SI) wasfixed at 500 ms, and the comparison interval (CI) ranged from 200 ms to 800 ms. In Experiment 2, theSI was fixed at 2000 ms, and the CI ranged from 1400 ms to 2600 ms. Participants were required tojudge whether the CI was longer or shorter than the SI. The ERP results showed similar CNV activitypatterns in the two experiments. Specifically, CNV amplitude would be more negative when theCI was longer or closer to the memorized SI. CNV peak latency increased significantly until the CIreached the memorized SI. We propose that CNV amplitude might reflect the process of temporalcomparison, and CNV peak latency might represent the process of temporal decision-making. To ourknowledge, it is the first ERP task explicitly testing the two temporal scales, sub- and supra-secondtiming, in one study. Taken together, the present study reveals a similar functional significance ofCNV between sub- and supra-second time perception.
Keywords: temporal discrimination; sub-second time perception; supra-second time perception;contingent negative variation
1. Introduction
Time perception is a fundamental part of the human experience. It is crucial for thesurvival of individual organisms and daily behaviors, including interpersonal communi-cation [1–3]. Moreover, different time interval ranges are implicated in different types ofperceptions and behaviors [4]. For example, music recognition and dancing are generallyassociated with millisecond perception [4,5], while individual decision making often takesseveral seconds or more time [4,6,7]. Many studies have investigated the topic of sub- andsupra-second time perception by using diverse experimental paradigms and technologies.However, no consensus exists regarding whether the information processing mechanismsinvolved in sub- and supra-second time perception are similar or different.
Most studies posit that distinct processing mechanisms and neural systems are re-cruited to perceive the two types of intervals [4,8]. For example, in a direct comparisonof sub- and supra-second timing in the human brain using functional imaging, Lewisand Miall [9] found that although many brain regions were involved in both sub- and
Brain Sci. 2021, 11, 1362. https://doi.org/10.3390/brainsci11101362 https://www.mdpi.com/journal/brainsci
Brain Sci. 2021, 11, 1362 2 of 14
supra-second durations, there were differences in activation patterns, suggesting that dis-tinct components are involved in these two durations. Using a comprehensive, voxel-wisemeta-analysis, Wiener et al. [10] found that sub-second timing tasks showed a higherpropensity to recruit subcortical networks (e.g., the basal ganglia and cerebellum), whereassupra-second timing tasks were more likely to activate cortical structures (e.g., the supple-mentary motor area and prefrontal cortex). Hayashi et al. [4] provided neuroanatomicalevidence that the bilateral anterior cerebellum was implicated in the sub-second condition(700 ms), and the inferior parietal cortex was associated with the supra-second condition(3500 ms).
However, other studies posit the view that sub- and supra-second time perceptionshave a common mechanism [11]. Rammsayer and Ulrich [12] employed a dual-task ap-proach and sensory interference paradigm to assess whether qualitatively different timingmechanisms were involved in the processing of 100 ms and 1000 ms. Their results argueagainst two qualitatively distinct timing mechanisms but are consistent with attention-based cognitive models of human timing. Recently, Rammsayer and Troche [13] appliedconfirmatory factor analysis to investigate the internal structure of interval timing perfor-mance in sub- and supra-second ranges. Their results argue against the validity of thedistinct timing hypothesis. They also found that although a common timing mechanismmodel fitted the empirical data better than one based on the distinct timing hypothesis, theoutcome of their confirmatory factor analyses supported the notion of two functionallyrelated timing mechanisms underlying interval timing in sub- and supra-second ranges, re-spectively. Therefore, the mechanisms involved in sub- and supra-second time perceptionsneed to be explored more rigorously.
Event-related potential (ERP) technology has been used widely to measure the tempo-ral features of individual cognition processing. Numerous ERP studies on time processinghave found that the contingent negative variation (CNV), a slow cortical potential waveof negative polarity at fronto-central scalp locations, provides an on-line timing index.However, there is still disagreement about the cognitive function of the CNV componentin time perception. Many studies have assumed that CNV amplitude indexed stimulusduration and varied with the length of time perception; that is, larger CNV amplitudeswere observed in conditions with longer temporal stimulus and longer duration perception,reflecting the neural accumulator function during duration estimation [14–18]. However,some studies do not find these CNV amplitude results [19–21]. Additionally, the latencyof the CNV peak seems to be related to the target duration even when the current tempo-ral stimulus had a different duration. Specifically, several studies found that CNV peaklatency developed during signal presentation, peaked around the target duration, andthen declined when the current signal was longer than the target duration, providing amemory trace of the encoded target duration, which might be associated with the decision-making process [20,22–27]. In other words, the memory trace of the target duration mightdetermine both the participant’s decision and the time course of the CNV [20].
Most of these ERP studies focus on short or long temporal interval processing. Only afew have directly explored CNV component patterns during sub- and supra-second timeperception within one temporal scale [18,21]. For example, Zhang et al. [18] adopted a timebisection task to explore the difference between sub- and supra-second interval processing(400–1600 ms). Their results showed a significant hemispheric effect that CNV amplitudeof the right hemisphere was significantly higher than that of the left hemisphere in the400 ms condition, but not in the 1600 ms condition; a greater CNV amplitude was inducedby 400 ms than 1600 ms, but CNV activity was not reported in the other five conditions(i.e., 600 ms, 800 ms, 1000 ms, 1200 ms, and 1400 ms). Ng et al. [21] employed a similartask (800–3200 ms) to explore how representations of anchor durations were used to makecategorical decisions and found that CNV increased in amplitude up to the value of theshort anchor, remained at a constant level until about the geometric mean of the shortand long anchors, and then began to resolve. It is worth noting that these two studiesboth explored the ERP patterns of sub- and supra-second intervals in one experimental

Brain Sci. 2021, 11, 1362 3 of 14
procedure. If the two intervals were separated for exploration, would we obtain similar ordifferent results from previous studies? The present study, therefore, aimed to perform twoexperiments to investigate the functional meaning of CNV and similarities or differencesbetween the two types of time perception.
In addition, experimental paradigms commonly used in previous ERP studies includetemporal bisection, temporal generalization, and temporal discrimination tasks. In thegeneralization task, participants have to determine whether a presented duration is thesame as or different from the standard interval (SI) learned at the beginning of the experi-ment. In the bisection task, participants have to determine whether a presented duration iscloser than one of two previously learned short or long SIs. In these two paradigms, the SIis presented at the beginning of each block, and there may be a recruitment of long-termmemory so that there is an additional cognitive demand for participants [28]. Therefore,the current study adopted the temporal discrimination task in which each trial started withthe SI. This task is easier for participants to understand and execute.
The current study aimed to use the visual temporal discrimination task to explore thetemporal dynamics of sub- and supra-second time perception, as well as the similarities ordifferences between the two types of duration processing mechanisms. For this purpose,we adopted a SI of 500 ms for the sub-second task (Experiment 1) and 2000 ms for the supra-second task (Experiment 2) [29,30]. On the basis of previous ERP studies, we hypothesizedthat, regardless of its sub- or supra-second time perception, CNV amplitude would besignificantly more negative as the length of the current comparison interval (CI) increased,and that CNV peak latency would increase significantly and then stop when the currentduration reached the memorized SI. It should also be noted that because of a small butrobust difference in duration judgments between males and females [31–33], only maleparticipants were recruited for the present study.
2. Experiment 1: ERP Study of Sub-Second Temporal Discrimination2.1. Methods2.1.1. Participants
As paid volunteers, 23 male participants were recruited from the community aroundLiaoning Normal University. All participants were right-handed and had normal orcorrected-to-normal vision. They did not self-report any severe physical diseases or mentaldisorders. They signed the written informed consent before participating in this experiment.Two males were excluded because their half ERP trials in most conditions were cut off.Thus, 21 males were finally analyzed (aged 34.90 ± 4.55 years). The study was approved bythe Ethics Committee of Liaoning Normal University in accordance with the Declaration ofHelsinki (1991).
2.1.2. Procedure
A classical temporal discrimination task was used, and the procedure was establishedwith E-Prime 2.0 software (Psychology Software Tools, Inc., Sharpsburg, PA, USA). Partici-pants sat comfortably on a chair, 70 cm away from a 19-inch monitor screen (1440 × 900 pixels,60 Hz refresh rate) in a soft, soundproofed room. All stimuli and fixation were presentedin a central location on the computer screen with a black background.
At the beginning of each trial, a white fixation cross “+” was displayed for 300–600 ms.Subsequently, a ray ellipse (12 × 16 cm) appeared in the center of the screen for 500 ms(SI). After that, a white fixation cross “+” was presented between 600 ms and 800 ms (i.e.,ISI). Referring to previous studies [24,34], a variable ISI was used to weaken participants’expectation effect and keep the ERPs baseline stable. Then, participants were presentedwith a gray ellipse (12 × 16 cm) lasting 200 ms, 350 ms, 500 ms, 650ms, or 800 ms. When theCIs disappeared, a white exclamation mark “!” would appear. Participants were requiredto judge whether the second ellipse (CI) was longer or shorter than the first ellipse (SI)by pressing “F” or “J” on the keyboard, respectively. Responses with latencies less than1500 ms were considered valid, and the ITI was displayed for 50–1000 ms (see Figure 1).

Brain Sci. 2021, 11, 1362 4 of 14
The response key was counterbalanced across participants, and no feedback was provided.Besides, even though people generally cannot count or beat time properly during the veryshort intervals below one second, to avoid the potential influence of timing categories,in the instruction, all participants were told to view it passively and not to count or beattime during the whole procedure, if not, the results would be distorted [35]. All trialswere presented in a randomized order in 10 blocks of 30 trials (i.e., 60 trials for each CIcondition). Each block contained 6 repetitions of each CI condition. The participants took afull rest between the blocks.
Brain Sci. 2021, 11, x FOR PEER REVIEW 4 of 14
required to judge whether the second ellipse (CI) was longer or shorter than the first el-lipse (SI) by pressing “F” or “J” on the keyboard, respectively. Responses with latencies less than 1500 ms were considered valid, and the ITI was displayed for 50–1000 ms (see Figure 1). The response key was counterbalanced across participants, and no feedback was provided. Besides, even though people generally cannot count or beat time properly during the very short intervals below one second, to avoid the potential influence of tim-ing categories, in the instruction, all participants were told to view it passively and not to count or beat time during the whole procedure, if not, the results would be distorted [35]. All trials were presented in a randomized order in 10 blocks of 30 trials (i.e., 60 trials for each CI condition). Each block contained 6 repetitions of each CI condition. The partici-pants took a full rest between the blocks.
Figure 1. A depiction of the sub-second temporal discrimination task in Experiment 1. ISI: inter-stimulus interval. ITI: inter-trial interval.
To ensure that the participants had a good understanding of the task, a practice phase before the formal experiment would be conducted, in which each CI condition contained four trials, that is, 20 trials in total. Experiment 1 took approximately 30 min in total.
2.1.3. Behavioral Data Analysis The one-way repeated-measures analyses of variance (ANOVA) with five CIs was
performed to test the mean proportion of “Long”. p values were corrected using the Greenhouse–Geisser method. The further pairwise comparisons were performed using Bonferroni correction. All statistical analyses were conducted using SPSS 26.0 for Win-dows.
2.1.4. EEG Recording and Data Analysis The EEG was recorded from 64 scalp sites using the electrodes mounted on an elastic
cap (Brain Products, Munich, Germany) according to the standard 10–20 system, with a reference electrode of the left mastoid. The horizontal electrooculogram (EOG) was mon-itored from two electrodes situated 1 cm from the outer canthi of both eyes. The vertical EOGs were monitored from two electrodes positioned 1 cm above and below the right eye. The EEG and EOG signals were filtered with a band-pass of 0.01–100 Hz and all chan-nels were recorded with a sampling rate of 500 Hz. For all electrodes, impedances were kept below 5 kΩ.
Analyzer 2.0 software (Brain Products, Munich, Germany) and EEGLAB [36] for MATLAB (MathWorks, MA, USA) were used to analyze the offline EEG data. The bilat-eral mastoid process was used as an off-line reference. Major artifacts, such as ocular movement, eyeblinks, and muscle-related potentials, were corrected with independent component analysis. The data were then digitally filtered at 0.01–30 Hz and segmented from 200 ms before to 1200 ms after the second ellipse (i.e., CI) onset. After baseline cor-rection (−200 to 0 ms), trials with amplitudes exceeding ± 70 μV at any electrode were excluded from the average in order to eliminate the contamination of larger artifacts. This resulted in available trials in each CI condition for further analysis (M ± SE; 200 ms: 56.67 ± 0.91, 350 ms: 57.24 ± 0.97, 500 ms: 57.95 ± 0.86, 650 ms: 57.43 ± 0.68, 800 ms: 57.33 ± 0.93).
On the basis of previous studies [18,24,37] and the present total average waveform, CNV components were observed during the presentation of the CIs, and we selected a
Figure 1. A depiction of the sub-second temporal discrimination task in Experiment 1. ISI: inter-stimulus interval. ITI: inter-trial interval.
To ensure that the participants had a good understanding of the task, a practice phasebefore the formal experiment would be conducted, in which each CI condition containedfour trials, that is, 20 trials in total. Experiment 1 took approximately 30 min in total.
2.1.3. Behavioral Data Analysis
The one-way repeated-measures analyses of variance (ANOVA) with five CIs wasperformed to test the mean proportion of “Long”. p values were corrected using theGreenhouse–Geisser method. The further pairwise comparisons were performed usingBonferroni correction. All statistical analyses were conducted using SPSS 26.0 for Windows.
2.1.4. EEG Recording and Data Analysis
The EEG was recorded from 64 scalp sites using the electrodes mounted on an elasticcap (Brain Products, Munich, Germany) according to the standard 10–20 system, witha reference electrode of the left mastoid. The horizontal electrooculogram (EOG) wasmonitored from two electrodes situated 1 cm from the outer canthi of both eyes. Thevertical EOGs were monitored from two electrodes positioned 1 cm above and below theright eye. The EEG and EOG signals were filtered with a band-pass of 0.01–100 Hz andall channels were recorded with a sampling rate of 500 Hz. For all electrodes, impedanceswere kept below 5 kΩ.
Analyzer 2.0 software (Brain Products, Munich, Germany) and EEGLAB [36] forMATLAB (MathWorks, MA, USA) were used to analyze the offline EEG data. The bilateralmastoid process was used as an off-line reference. Major artifacts, such as ocular movement,eyeblinks, and muscle-related potentials, were corrected with independent componentanalysis. The data were then digitally filtered at 0.01–30 Hz and segmented from 200 msbefore to 1200 ms after the second ellipse (i.e., CI) onset. After baseline correction (−200to 0 ms), trials with amplitudes exceeding ± 70 µV at any electrode were excluded fromthe average in order to eliminate the contamination of larger artifacts. This resulted inavailable trials in each CI condition for further analysis (M ± SE; 200 ms: 56.67 ± 0.91,350 ms: 57.24 ± 0.97, 500 ms: 57.95 ± 0.86, 650 ms: 57.43 ± 0.68, 800 ms: 57.33 ± 0.93).
On the basis of previous studies [18,24,37] and the present total average waveform,CNV components were observed during the presentation of the CIs, and we selected afronto-central electrode cluster (i.e., Fz, F3, F4, FCz, FC3, FC4, Cz, C3, and C4) for furtheranalyses. Based on a visual inspection of the averaged waveforms, we used prior methodsto assess the peak latency and mean amplitude of CNV for each condition and eachparticipant [22,24]. Specifically, we calculated mean CNV amplitudes over 100-ms slidingtime windows with a midpoint ranging from 300 ms to 1000 ms, and the peak latencywas determined by the midpoint of the sliding window with the maximum amplitude. In

Brain Sci. 2021, 11, 1362 5 of 14
addition, the average amplitudes from 300 ms to peak latency under each condition werecalculated as the mean CNV amplitude.
Two-way repeated-measures ANOVA with 5 (CI duration: 200/350/500/650/800 ms)× 3 (hemisphere: left/middle/right) and three-way repeated-measures ANOVA with2 (category: short/long) × 2 (duration difference from SI: smaller/larger) × 3 (hemisphere:left/middle/right) were performed on CNV peak latency and CNV amplitude. p val-ues were corrected by using the Greenhouse–Geisser correction. Effect sizes were re-ported as partial eta squared (η2
p). All statistical analyses were conducted using SPSS 26.0for Windows.
2.2. Results2.2.1. Behavioral Results
The main effect of CI condition was significant [F (4, 80) = 123.21, p < 0.001, η2p = 0.86].
The further test revealed significant pairwise differences in the proportion of “Long” amongthe five CIs (M ± SE; 200 ms: 0.075 ± 0.024; 350 ms: 0.142 ± 0.030; 500 ms: 0.380 ± 0.038;650 ms: 0.729 ± 0.045; 800 ms: 0.853 ± 0.034; ps ≤ 0.015; see Figure 2), suggesting that theparticipants could make clear discrimination in the current sub-second time perception.
Brain Sci. 2021, 11, x FOR PEER REVIEW 5 of 14
fronto-central electrode cluster (i.e., Fz, F3, F4, FCz, FC3, FC4, Cz, C3, and C4) for further analyses. Based on a visual inspection of the averaged waveforms, we used prior methods to assess the peak latency and mean amplitude of CNV for each condition and each par-ticipant [22,24]. Specifically, we calculated mean CNV amplitudes over 100-ms sliding time windows with a midpoint ranging from 300 ms to 1000 ms, and the peak latency was determined by the midpoint of the sliding window with the maximum amplitude. In ad-dition, the average amplitudes from 300 ms to peak latency under each condition were calculated as the mean CNV amplitude.
Two-way repeated-measures ANOVA with 5 (CI duration: 200/350/500/650/800 ms) × 3 (hemisphere: left/middle/right) and three-way repeated-measures ANOVA with 2 (category: short/long) × 2 (duration difference from SI: smaller/larger) × 3 (hemisphere: left/middle/right) were performed on CNV peak latency and CNV amplitude. p values were corrected by using the Greenhouse–Geisser correction. Effect sizes were reported as partial eta squared (η2
p). All statistical analyses were conducted using SPSS 26.0 for Win-dows.
2.2. Results 2.2.1. Behavioral Results
The main effect of CI condition was significant [F (4, 80) = 123.21, p < 0.001, η2 p = 0.86].
The further test revealed significant pairwise differences in the proportion of “Long” among the five CIs (M ± SE; 200 ms: 0.075 ± 0.024; 350 ms: 0.142 ± 0.030; 500 ms: 0.380 ± 0.038; 650 ms: 0.729 ± 0.045; 800 ms: 0.853 ± 0.034; ps ≤ 0.015; see Figure 2), suggesting that the participants could make clear discrimination in the current sub-second time percep-tion.
Figure 2. Boxplots of proportion of “Long” response in Experiment 1. The black triangles indicate mean values.
2.2.2. ERP Results
CNV Amplitude Grand average ERPs induced by different CIs are shown in Figure 3. Two-way re-
peated-measures ANOVA analysis revealed a significant main effect of CI condition [F (4, 80) = 3.59, p = 0.016, η2
p = 0.15]. Further pairwise comparisons showed that CNV negative wave induced by 200 ms condition (M ± SE; −2.64 ± 0.42 μV) was the smallest and signifi-cantly smaller than the other four CI conditions (350 ms: −3.41 ± 0.38 μV; 500 ms: −3.43 ± 0.35 μV; 650 ms: −3.47 ± 0.34 μV; 800 ms: −3.24 ± 0.44 μV; ps < 0.05). Moreover, the differ-ences among CNV amplitudes induced by the other four CI conditions were not signifi-cant (ps > 0.05). In addition, the main effect of hemisphere was also significant [F (2, 40) =
Figure 2. Boxplots of proportion of “Long” response in Experiment 1. The black triangles indicatemean values.
2.2.2. ERP ResultsCNV Amplitude
Grand average ERPs induced by different CIs are shown in Figure 3. Two-wayrepeated-measures ANOVA analysis revealed a significant main effect of CI condition[F (4, 80) = 3.59, p = 0.016, η2
p = 0.15]. Further pairwise comparisons showed that CNVnegative wave induced by 200 ms condition (M ± SE; −2.64 ± 0.42 µV) was the smallestand significantly smaller than the other four CI conditions (350 ms: −3.41 ± 0.38 µV;500 ms: −3.43 ± 0.35 µV; 650 ms: −3.47 ± 0.34 µV; 800 ms: −3.24 ± 0.44 µV; ps < 0.05).Moreover, the differences among CNV amplitudes induced by the other four CI conditionswere not significant (ps > 0.05). In addition, the main effect of hemisphere was alsosignificant [F (2, 40) = 19.18, p < 0.001, η2
p = 0.49]. CNV amplitude in the left brain area(−2.61 ± 0.33 µV) was smaller than that in right (−3.31 ± 0.31 µV; p = 0.001) and middlebrain areas (−3.80 ± 0.46 µV; p < 0.001). CNV amplitude in the right brain area was smallerthan that in the middle brain area (p < 0.05). The interactive effect of CI condition andhemisphere was not significant [F (8, 160) = 1.00, p > 0.05, η2
p = 0.05].

Brain Sci. 2021, 11, 1362 6 of 14Brain Sci. 2021, 11, x FOR PEER REVIEW 7 of 14
Figure 3. Grand average ERPs induced by different comparison intervals in Experiment 1.
3. Experiment 2: ERP Study of Supra-Second Time Discrimination 3.1. Methods 3.1.1. Participants
As paid volunteers, 23 males (aged 35.35 ± 4.48 years) were recruited from the com-munity around Liaoning Normal University. Two of them were left-handed. All partici-pants had normal or corrected-to-normal vision. They did not self-report any severe phys-ical diseases or mental disorders. They signed the written informed consent before partic-ipating in this experiment. The study was approved by the Ethics Committee of Liaoning Normal University in accordance with the Declaration of Helsinki (1991).
3.1.2. Procedure The procedure of Experiment 2 was similar to that of Experiment 1 (see Figure 4).
Experiment 2 used a temporal discrimination task, but five supra-second intervals served as CIs. Specifically, the durations of fixation cross “+”, exclamation mark “!”, and the task remained unchanged; the first gray ellipse (SI) lasted 2000 ms, and the second gray ellipse (CI) lasted 1400 ms, 1700 ms, 2000 ms, 2300 ms, or 2600 ms. For Experiment 1, the response key was counterbalanced across participants. No feedback was provided. All trials were presented in a randomized order in ten blocks of 30 trials, with each block containing six repetitions of each CI condition. Participants took a full rest between the blocks. Further-more, participants carried out the practice experiment before the formal experiment. There was a total of 20 trials in the practice phase, with each CI condition containing four trials. Experiment 2 took approximately 45 min in total.
Figure 3. Grand average ERPs induced by different comparison intervals in Experiment 1.
Three-way repeated-measures ANOVA analysis showed a significant main effect ofcategory [F (1, 20) = 5.20, p < 0.05, η2
p = 0.21]. Compared with the CI condition shorter thanSI (M ± SE; −3.03 ± 0.37 µV), CNV amplitude induced by the CI condition longer than SI(−3.36 ± 0.37 µV) was more negative. The main effect of duration difference from SI wassignificant [F (1, 20) = 6.39, p < 0.05, η2
p = 0.24]. The CI condition with a smaller durationdifference from SI (−3.44 ± 0.34 µV) elicited a more negative CNV than the CI conditionwith a larger duration difference from SI (−2.94 ± 0.42 µV). Furthermore, there was asignificant main effect of hemisphere [F (2, 40) = 17.39, p < 0.001, η2
p = 0.47]. CNV amplitudein the left brain area (−2.57 ± 0.35 µV) was smaller than that in right (−3.26 ± 0.31 µV;p < 0.01) and middle brain areas (−3.74 ± 0.48 µV; p < 0.001), and CNV amplitude in rightbrain area was smaller than that in middle brain area (p = 0.05). No significant interactiveeffects were found (ps > 0.05).
CNV Latency
Two-way repeated-measures ANOVA analysis showed a significant main effect of CIcondition [F (4, 80) = 15.22, p < 0.001, η2
p = 0.43]. Specifically, CNV peak latency inducedby 200 ms (M ± SE; 426.82 ± 21.22 ms) was significantly shorter than the other four CIconditions (350 ms: 503.48 ± 9.16 ms; 500 ms: 549.02 ± 16.16 ms; 650 ms: 570.83 ± 19.31 ms;800 ms: 618.39 ± 37.98 ms; ps < 0.001). CNV peak latency induced by 350 ms was signifi-cantly shorter than that induced by 500 ms, 650 ms, and 800 ms (ps < 0.01). Additionally,the differences in CNV peak latency among 500 ms, 650 ms, and 800 ms were not significant(ps > 0.05). Furthermore, the main effect of hemisphere was significant [F (2, 40) = 7.92,p = 0.001, η2
p = 0.28]. CNV peak latency in right brain area (559.61 ± 16.41 ms) was signifi-cantly longer than CNV amplitude in left (525.16 ± 5.43 ms; p < 0.05) and middle brainareas (516.35 ± 18.93 ms; p < 0.001). CNV peak latency in the left brain area did not differ

Brain Sci. 2021, 11, 1362 7 of 14
from that in the middle brain area (p > 0.05). Their interactive effect was not significant[F (8, 160) = 1.10, p = 0.365, η2
p = 0.05].Three-way repeated-measures ANOVA analysis showed a significant main effect of
category [F (1, 20) = 36.17, p < 0.001, η2p = 0.64]. Compared with the CI condition shorter
than SI (M ± SE; 465.15 ± 13.37 ms), CNV peak latency induced by the CI conditionlonger than SI (594.61 ± 25.56 ms) was longer. There was a significant main effect ofhemisphere [F (2, 40) = 6.68, p < 0.01, η2
p = 0.25]. CNV peak latency in right brain area(556.60 ± 19.22 ms) was significantly longer than that in left (522.59 ± 17.10 ms; p < 0.05)and middle brain areas (510.45 ± 20.26 ms; p < 0.01). The difference between the leftand middle brain area was not significant (p > 0.05). Furthermore, the interactive effectof category and duration difference from SI was significant [F (1, 20) = 14.13, p = 0.001,η2
p = 0.41]. The further simple effect test results showed that, only in the CI conditionshorter than SI, CNV peak latency induced by the CI condition with a smaller durationdifference from SI (503.48 ± 9.16 ms) was significantly longer than the CI condition with alarger duration difference from SI (426.82 ± 21.22 ms; p < 0.01). The main effect of durationdifference from SI and other interactive effect was not significant (ps > 0.05).
3. Experiment 2: ERP Study of Supra-Second Time Discrimination3.1. Methods3.1.1. Participants
As paid volunteers, 23 males (aged 35.35 ± 4.48 years) were recruited from thecommunity around Liaoning Normal University. Two of them were left-handed. Allparticipants had normal or corrected-to-normal vision. They did not self-report any severephysical diseases or mental disorders. They signed the written informed consent beforeparticipating in this experiment. The study was approved by the Ethics Committee ofLiaoning Normal University in accordance with the Declaration of Helsinki (1991).
3.1.2. Procedure
The procedure of Experiment 2 was similar to that of Experiment 1 (see Figure 4).Experiment 2 used a temporal discrimination task, but five supra-second intervals servedas CIs. Specifically, the durations of fixation cross “+”, exclamation mark “!”, and thetask remained unchanged; the first gray ellipse (SI) lasted 2000 ms, and the second grayellipse (CI) lasted 1400 ms, 1700 ms, 2000 ms, 2300 ms, or 2600 ms. For Experiment 1, theresponse key was counterbalanced across participants. No feedback was provided. Alltrials were presented in a randomized order in ten blocks of 30 trials, with each blockcontaining six repetitions of each CI condition. Participants took a full rest between theblocks. Furthermore, participants carried out the practice experiment before the formalexperiment. There was a total of 20 trials in the practice phase, with each CI conditioncontaining four trials. Experiment 2 took approximately 45 min in total.
Brain Sci. 2021, 11, x FOR PEER REVIEW 8 of 14
Figure 4. A depiction of the supra-second temporal discrimination task in Experiment 2. ISI: inter-stimulus interval; ITI: inter-trial interval.
3.1.3. Behavioral Data Analysis The one-way repeated-measures ANOVA with five CIs was performed to test the
mean proportion of “Long”. p values were corrected using the Greenhouse–Geisser method. The further pairwise multiple comparisons were performed using Bonferroni correction. All statistical analyses were conducted using SPSS 26.0 for Windows.
3.1.4. EEG Recording and Data Analysis EEG recording and preprocessing steps were similar to that in Experiment 1. This
resulted in available trials in each CI condition for further analysis (M ± SE; 1400 ms: 47.30 ± 1.19; 1700 ms: 46.48 ± 1.67; 2000 ms: 47.83 ± 1.40; 2300 ms: 48.83 ± 1.30; 2600 ms: 49.00 ± 1.23). Additionally, we also assessed the peak latency and mean amplitude of CNV for each CI condition similar to Experiment 1. Mean CNV amplitudes over 100-ms sliding time windows with a midpoint ranging from 1000 ms to 3000 ms were calculated, and the peak latency was determined by the midpoint of the sliding window with the maximum amplitude. In addition, the average amplitudes from 1000 ms to peak latency under each condition were calculated as the mean CNV amplitude. Moreover, two-way repeated-measures ANOVA and three-way repeated-measures ANOVA were similar to that con-ducted in Experiment 1.
3.2. Results 3.2.1. Behavioral Results
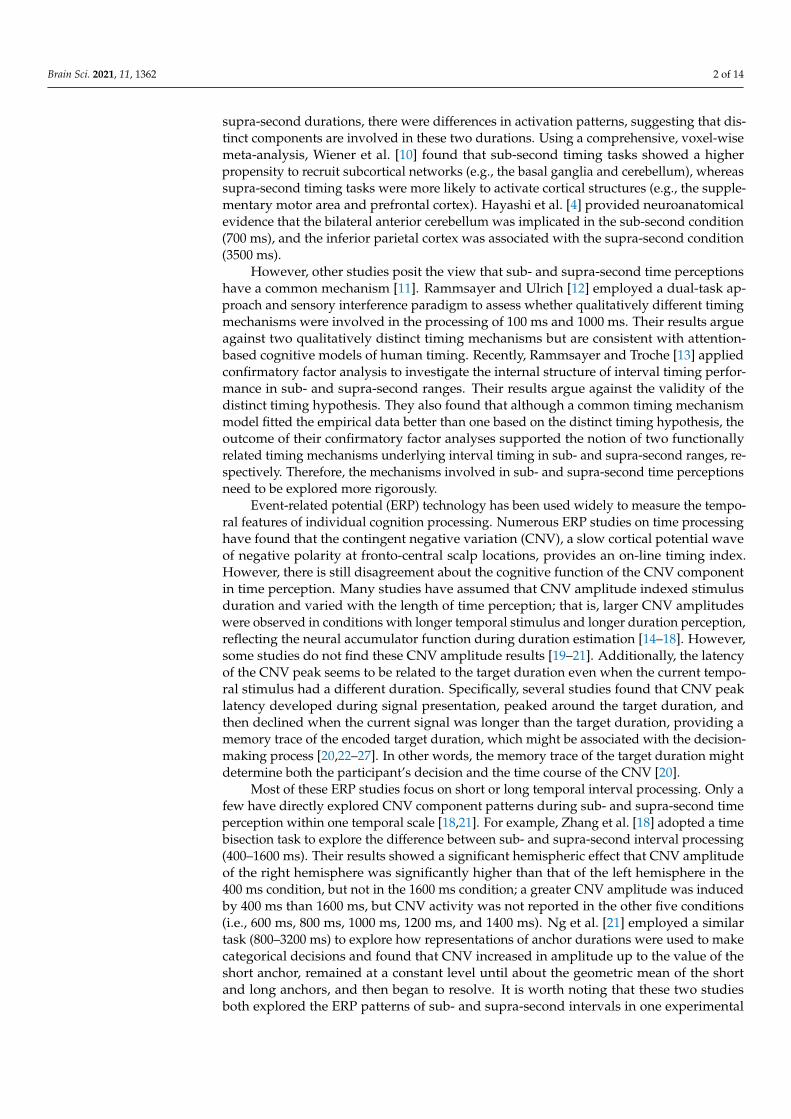
The main effect of CI condition was significant [F (4, 88) = 366.20, p < 0.001, η2 p = 0.943].
The further test revealed significant pairwise differences in the proportion of “Long” among the five CIs (M ± SE; 200 ms: 0.117 ± 0.018; 350 ms: 0.309 ± 0.023; 500 ms: 0.610 ± 0.019; 650 ms: 0.838 ± 0.018; 800 ms: 0.922 ± 0.016; ps < 0.001; see Figure 5), suggesting the participants could make clear discrimination in the current supra-second time perception.
Figure 5. Boxplots of proportion of “Long” response in Experiment 2. The black triangles represent mean values.
Figure 4. A depiction of the supra-second temporal discrimination task in Experiment 2. ISI: inter-stimulus interval; ITI: inter-trial interval.
3.1.3. Behavioral Data Analysis
The one-way repeated-measures ANOVA with five CIs was performed to test themean proportion of “Long”. p values were corrected using the Greenhouse–Geisser method.The further pairwise multiple comparisons were performed using Bonferroni correction.All statistical analyses were conducted using SPSS 26.0 for Windows.
Brain Sci. 2021, 11, 1362 8 of 14
3.1.4. EEG Recording and Data Analysis
EEG recording and preprocessing steps were similar to that in Experiment 1. Thisresulted in available trials in each CI condition for further analysis (M ± SE; 1400 ms:47.30 ± 1.19; 1700 ms: 46.48 ± 1.67; 2000 ms: 47.83 ± 1.40; 2300 ms: 48.83 ± 1.30;2600 ms: 49.00 ± 1.23). Additionally, we also assessed the peak latency and mean am-plitude of CNV for each CI condition similar to Experiment 1. Mean CNV amplitudesover 100-ms sliding time windows with a midpoint ranging from 1000 ms to 3000 ms werecalculated, and the peak latency was determined by the midpoint of the sliding windowwith the maximum amplitude. In addition, the average amplitudes from 1000 ms to peaklatency under each condition were calculated as the mean CNV amplitude. Moreover,two-way repeated-measures ANOVA and three-way repeated-measures ANOVA weresimilar to that conducted in Experiment 1.
3.2. Results3.2.1. Behavioral Results
The main effect of CI condition was significant [F (4, 88) = 366.20, p < 0.001, η2p = 0.943].
The further test revealed significant pairwise differences in the proportion of “Long” amongthe five CIs (M ± SE; 200 ms: 0.117 ± 0.018; 350 ms: 0.309 ± 0.023; 500 ms: 0.610 ± 0.019;650 ms: 0.838 ± 0.018; 800 ms: 0.922 ± 0.016; ps < 0.001; see Figure 5), suggesting theparticipants could make clear discrimination in the current supra-second time perception.
Brain Sci. 2021, 11, x FOR PEER REVIEW 8 of 14
Figure 4. A depiction of the supra-second temporal discrimination task in Experiment 2. ISI: inter-stimulus interval; ITI: inter-trial interval.
3.1.3. Behavioral Data Analysis The one-way repeated-measures ANOVA with five CIs was performed to test the
mean proportion of “Long”. p values were corrected using the Greenhouse–Geisser method. The further pairwise multiple comparisons were performed using Bonferroni correction. All statistical analyses were conducted using SPSS 26.0 for Windows.
3.1.4. EEG Recording and Data Analysis EEG recording and preprocessing steps were similar to that in Experiment 1. This
resulted in available trials in each CI condition for further analysis (M ± SE; 1400 ms: 47.30 ± 1.19; 1700 ms: 46.48 ± 1.67; 2000 ms: 47.83 ± 1.40; 2300 ms: 48.83 ± 1.30; 2600 ms: 49.00 ± 1.23). Additionally, we also assessed the peak latency and mean amplitude of CNV for each CI condition similar to Experiment 1. Mean CNV amplitudes over 100-ms sliding time windows with a midpoint ranging from 1000 ms to 3000 ms were calculated, and the peak latency was determined by the midpoint of the sliding window with the maximum amplitude. In addition, the average amplitudes from 1000 ms to peak latency under each condition were calculated as the mean CNV amplitude. Moreover, two-way repeated-measures ANOVA and three-way repeated-measures ANOVA were similar to that con-ducted in Experiment 1.
3.2. Results 3.2.1. Behavioral Results
The main effect of CI condition was significant [F (4, 88) = 366.20, p < 0.001, η2 p = 0.943].
The further test revealed significant pairwise differences in the proportion of “Long” among the five CIs (M ± SE; 200 ms: 0.117 ± 0.018; 350 ms: 0.309 ± 0.023; 500 ms: 0.610 ± 0.019; 650 ms: 0.838 ± 0.018; 800 ms: 0.922 ± 0.016; ps < 0.001; see Figure 5), suggesting the participants could make clear discrimination in the current supra-second time perception.
Figure 5. Boxplots of proportion of “Long” response in Experiment 2. The black triangles represent mean values.
Figure 5. Boxplots of proportion of “Long” response in Experiment 2. The black triangles representmean values.
3.2.2. ERP ResultsCNV Amplitude
Grand average ERPs induced by different CIs are shown in Figure 6. Two-wayrepeated-measures ANOVA analysis showed a significant main effect of CI condition[F (4, 88) = 3.89, p < 0.01, η2
p = 0.15]. CNV induced by 1400 ms (M ± SE; −2.15 ± 0.25 µV)was the smallest and was significantly smaller than the other four CI conditions (1700 ms:−2.91 ± 0.35 µV; 2000 ms: −3.32 ± 0.27 µV; 2300 ms: −3.34 ± 0.39 µV; 2600 ms:−2.88 ± 0.40 µV; ps < 0.05). Moreover, the differences among CNV amplitudes inducedby the other four CIs were not significant (ps > 0.05). The main effect of hemisphere andinteractive effect of CI condition and hemisphere were not significant (ps > 0.05).

Brain Sci. 2021, 11, 1362 9 of 14Brain Sci. 2021, 11, x FOR PEER REVIEW 10 of 14
Figure 6. Grand average ERPs induced by different comparison intervals in Experiment 2.
4. Discussion The present study aimed to investigate the neurodynamics of sub- and supra-second
time perception using the visual temporal discrimination paradigm, as well as similarities between the two types of duration processing mechanisms. We found that CNV compo-nent activity patterns of sub- and supra-second were largely similar.
Interestingly, some studies have argued that CNV amplitude varies with stimulus duration and length of time perception. Usually, the longer the temporal stimulus, the longer the time perception, and the larger CNV amplitude [14–16,18]. However, the ERP results in neither Experiment 1 nor Experiment 2 revealed this profile. Specifically, alt-hough CNV amplitude induced by the “longer CI condition” was indeed more negative than the “shorter CI condition”, the results of the main effect of the CI condition showed that CNV amplitude was not more negative with the increase in comparison during the stimulus. In other words, CNV amplitude does not directly reflect the unfolding of time [19]. Some previous studies do not find an association between CNV amplitude and per-ceived duration. For example, Macar and Vidal [20] used a temporal generalization task with a 2-s SI, and the analysis as a function of signal duration revealed no differences in CNV amplitude. Kononowicz and van Rijn [19] adopted the same duration reproduction paradigm used by Macar et al. [15] and did not find any related effects on CNV amplitude, even using more powerful linear-mixed effect analyses. Furthermore, the main effect of duration difference from SI suggests that the smaller the temporal difference in interval length, the more difficult the processing, and the more negative the amplitude of CNV.
Figure 6. Grand average ERPs induced by different comparison intervals in Experiment 2.
Three-way repeated-measures ANOVA analysis showed a significant main effect ofcategory [F (1, 22) = 4.51, p < 0.05, η2
p = 0.17]. Compared with the CI condition shorter thanSI (M ± SE; −2.53 ± 0.25 µV), CNV amplitude induced by the CI condition longer thanSI (−3.11 ± 0.35 µV) was more negative. Moreover, the main effect of duration differencefrom SI was significant [F (1, 22) = 5.33, p < 0.05, η2
p = 0.20]. The CI condition with a smallerduration difference from SI (−3.13 ± 0.32 µV) elicited a more negative CNV than the CIcondition with a larger duration difference from SI (−2.51 ± 0.29 µV). The main effectof hemisphere and interactive effect of CI condition and hemisphere were not significant(ps > 0.05).
CNV Latency
Two-way repeated-measures ANOVA analysis showed a significant main effect ofCI condition [F (4, 88) = 10.13, p < 0.001, η2
p = 0.32]. CNV peak latency induced by1400 ms (M ± SE; 1400 ms: 1735.55 ± 56.67 ms) was significantly shorter than the otherfour CI conditions (1700 ms: 1830.55 ± 55.78 ms; 2000 ms: 1963.34 ± 59.75 ms; 2300 ms:2050.37 ± 75.66 ms; 2600 ms: 2094.52 ± 62.53 ms; ps < 0.05). CNV peak latency induced by1700 ms was significantly shorter than CNV peak latency induced by 2000 ms, 2300 ms,or 2600 ms (ps < 0.05). Additionally, the differences among CNV peak latency inducedby 2000 ms, 2300 ms, and 2600 ms were not significant (ps > 0.05). Furthermore, the maineffect of hemisphere was significant [F (2, 44) = 3.54, p = 0.037, η2
p = 0.14]. CNV peak latencyin right brain area (2019.34 ± 51.39 ms) was significantly longer than that in middle brain

Brain Sci. 2021, 11, 1362 10 of 14
area (1876.75 ± 56.57 ms; p < 0.05) and was not significantly longer than that in the leftbrain area (1908.51 ± 60.78 ms; p > 0.05). The difference between the left and middle brainareas was not significant (p > 0.05). The interactive effect of CI condition and hemispherewas not significant [F (8, 176) = 0.85, p = 0.52, η2
p = 0.04].Three-way repeated-measures ANOVA analysis showed a significant main effect
of category [F (1, 22) = 21.71, p < 0.001, η2p = 0.50]. Compared with the CI condition
shorter than SI (M ± SE; 1783.05 ± 52.03 ms), CNV peak latency induced by the CIcondition longer than SI (2072.44 ± 61.13 ms) was longer. There was a significant maineffect of hemisphere [F (2, 44) = 3.70, p < 0.05, η2
p = 0.14]. CNV peak latency in the rightbrain area (2012.31 ± 54.05 ms) was significantly longer than that in the middle brain area(1858.45 ± 59.11 ms; p < 0.05) and longer than that in the left brain area (1912.48 ± 60.45 ms;p > 0.05). The difference between the right and middle brain area was not significant(p > 0.05). Moreover, the interactive effect of category and duration difference from SI wassignificant [F (1,22) = 6.34, p < 0.05, η2
p = 0.22]. The further simple effect test results showedthat, only in the CI condition shorter than SI, CNV peak latency induced by the CI conditionwith a smaller duration difference from SI (1830.55 ± 55.78 ms) was significantly longerthan that in the CI condition with a larger duration difference from SI (1735.55 ± 56.67 ms;p < 0.05). The main effect of duration difference from SI and other interactive effects wasnot significant (ps > 0.05).
4. Discussion
The present study aimed to investigate the neurodynamics of sub- and supra-secondtime perception using the visual temporal discrimination paradigm, as well as similaritiesbetween the two types of duration processing mechanisms. We found that CNV componentactivity patterns of sub- and supra-second were largely similar.
Interestingly, some studies have argued that CNV amplitude varies with stimulusduration and length of time perception. Usually, the longer the temporal stimulus, thelonger the time perception, and the larger CNV amplitude [14–16,18]. However, theERP results in neither Experiment 1 nor Experiment 2 revealed this profile. Specifically,although CNV amplitude induced by the “longer CI condition” was indeed more negativethan the “shorter CI condition”, the results of the main effect of the CI condition showedthat CNV amplitude was not more negative with the increase in comparison duringthe stimulus. In other words, CNV amplitude does not directly reflect the unfolding oftime [19]. Some previous studies do not find an association between CNV amplitude andperceived duration. For example, Macar and Vidal [20] used a temporal generalization taskwith a 2-s SI, and the analysis as a function of signal duration revealed no differences inCNV amplitude. Kononowicz and van Rijn [19] adopted the same duration reproductionparadigm used by Macar et al. [15] and did not find any related effects on CNV amplitude,even using more powerful linear-mixed effect analyses. Furthermore, the main effect ofduration difference from SI suggests that the smaller the temporal difference in intervallength, the more difficult the processing, and the more negative the amplitude of CNV.Therefore, we consider that CNV amplitude do not conform to the so-called “pacemaker-accumulator hypothesis” [17,38], and it is more likely to reflect the process of comparing thecurrent CI with the memorized SI. The greater the attention resource is paid to the intervalstimulus, the greater CNV amplitude [26]. Specifically, when the current CI is longer, andthe difference between its interval length and the memorized SI is small, participants needattentional effort to complete the task accurately, so the CNV amplitude would also belarger and more negative. Additionally, increased negativity of CNV might also representstructured activity or increased mutual information between the processing of CI and SI.Thus, it could indicate that CI is closer to SI in working memory, suggested by increasedmutual information.
Both Experiments 1 and 2 showed that CNV peak latencies induced by the threelonger CIs (500/650/800 ms and 2000/2300/2600 ms, respectively) were not significantlydifferent. These results are in line with the study by Kononowicz and van Rijn [34] who

Brain Sci. 2021, 11, 1362 11 of 14
found that CNV peak latency increased significantly until the current CI reached thememorized SI. This also supports the viewpoint that CNV peak latency is an index ofdecision making [20,26]. Specifically, in temporal paradigms, the decision is based on acomparison between a current elapsing duration and a memorized target [20]. When the CIis shorter than the SI, participants could make a judgment and a decision at the end of theCI in their minds. Therefore, CNV peak latencies induced by the two shorter CI conditions(200/350 ms, 1400/1700 ms) are significantly shorter than the “CI condition equal to orlonger than the SI”. However, this is not the case when the CI is longer than the SI. Ratherthan peaking at the end of the current CI, CNV peaks earlier. That is, when the intervallength of the presented CI reaches the SI in memory, participants could produce a mentaldistinction between the two durations before the end of the current temporal stimuluspresentation and then make a decision. Therefore, in these instances, CNV peak latencycorresponds to the end of the comparison process and would not be significantly extendedwith an increase in the CI. Once the participant’s decision is taken, the last portion of thecurrent duration will not have to be timed.
An alternative explanation of the similarity of CNV component patterns between sub-and supra-second time perception in the present study might relate to some theories of thepsychological present. Fraisse [39] points out that psychological present has an upper limitof 5 s and has an average value of 2 s to 3 s. Pöppel [40,41] also proposes a hierarchicalmodel in which time perception is controlled by two separate processing mechanisms in thebrain. The first system is a high-frequency system with a period of 20–60 ms and an averageof 30 ms; it is the primary integrated unit of human processing information. The secondsystem is a low-frequency system that processes a series of events within a few seconds(2–3 s), integrating sequential events into units of perception and motion; it is the basis ofthe perceived present. A large number of studies are based on these views, revealing thatthere are different mechanisms for time processing below and above 3 s [42]. Specifically, itis not regulated by cognitive resources (attention and working memory) below 3 s and hascross-channel non-specificity. On the contrary, temporal processing above 3 s is regulatedby cognitive resources and has channel specificity. These findings have been observed inthe research using behavior [43–46], ERP [47], brain imaging [9], and nontraumatic brainstimulation [48,49]. In the present study, the duration of time perception ranged from200 ms to 2600 ms, and all conditions were below 3 s, which means that participants mightbe lying within the 3 s interval of present moment awareness, resulting in similar CNVneurodynamics in Experiments 1 and 2. Therefore, it is worth exploring the CNV patternsof longer intervals (above 3 s) in our future research.
Additionally, we analyzed the hemispheric effect of the CNV component; the resultsshowed that there were different hemispheric patterns between the two experiments.Regarding CNV amplitude, we found that there was a significant hemispheric effect in thesub-second condition (i.e., higher CNV amplitude in the right hemisphere than in the lefthemisphere), but not in the supra-second condition. This finding is consistent with that ofZhang et al. [18]. As for CNV peak latency, we also found a significant hemispheric effect.CNV peak latency of the right hemisphere was significantly longer than that of the lefthemisphere in the sub-second condition, but not in the supra-second condition, which isconsistent with the study of Pfeuty et al. [22]. The different hemispheric patterns betweensub- and supra-second time perception may be caused by the different roles of the leftand right frontal lobes in information processing. Some studies have shown that the rightfrontal lobe played an important role in time perception, while the left frontal lobe wasmore likely to be involved in general attention and memory processes [50]. When the timeperception task becomes more difficult and requires more attention resources, activation ofthe left hemisphere increases accordingly [18]. Consequently, the difference between theleft and right hemisphere in the supra-second experiment would be reduced.
Several limitations of this study should be mentioned. First, the participants werehomogenous. The results of our study should be verified among women. Second, we onlyadopted the temporal discrimination task to investigate the participants’ performance of

Brain Sci. 2021, 11, 1362 12 of 14
time perception. Further studies should investigate the differences or similarities betweensub- and supra-second time perception using different paradigms. Third, supra-secondtime perception in Experiment 2 ranged from 1.4 s to 2.6 s. Röhricht et al. [51] employedthe classic S1–S2 paradigm task, an implicit timing task, with filled intervals of 2.5 s, 5 s,7.5 s, and 10 s to investigate the maximum duration during which cortical CNV can bemaintained. They found that intervals between 7.5 s and 10 s represented the upperboundary of the late CNV activation, and the continuously negative waveform of CNVended at a point between 5 s and 7.5 s. Therefore, longer intervals (2.5–10 s) might berelevant to consciousness occurrence or information integration [52,53] and worth beingincluded in the future research.
5. Conclusions
The present study used the ERP technique to investigate and compare the temporaldynamic characteristics of sub- and supra-second time perception. The findings showedthat CNV component activity patterns of sub- and supra-second time perception werelargely similar. CNV amplitude was more likely to reflect the process of comparing thecurrent comparison interval with the memorized standard interval, and CNV peak latencymight be an index of temporal decision-making.
Author Contributions: Conceptualization, M.Z., W.H. and W.L.; methodology, M.Z. and K.Z.; valida-tion, M.Z., K.Z., W.H. and W.L.; formal analysis, M.Z., K.Z. and B.Z.; investigation, M.Z. and X.Z.; datacuration, M.Z. and K.Z.; writing—original draft preparation, M.Z. and K.Z.; writing—review andediting, M.Z., K.Z., W.H. and W.L.; visualization, M.Z. and K.Z.; supervision, W.H. and W.L.; fundingacquisition, W.L. All authors have read and agreed to the published version of the manuscript.
Funding: The work was supported by the National Natural Science Foundation of China (32020103008).
Institutional Review Board Statement: The work was approved by the Ethics Committee of Liaon-ing Normal University in accordance with the Declaration of Helsinki (1991).
Informed Consent Statement: Informed consent was obtained from all subjects involved inthe study.
Data Availability Statement: The data are available from the corresponding author uponreasonable requests.
Conflicts of Interest: The authors declare that they have no conflict of interest.
References1. Buhusi, C.V.; Meck, W.H. What makes us tick? Functional and neural mechanisms of interval timing. Nat. Rev. Neurosci. 2005, 6,
755–765. [CrossRef] [PubMed]2. Schirmer, A.; Meck, W.H.; Penney, T.B. The socio-temporal brain: Connecting people in time. Trends Cogn. Sci. 2016, 20, 760–772.
[CrossRef] [PubMed]3. Wittmann, M. The inner experience of time. Philos. Trans. R. Soc. Lond. B Biol. Sci. 2009, 364, 1955–1967. [CrossRef]4. Hayashi, M.J.; Kantele, M.; Walsh, V.; Carlson, S.; Kanai, R. Dissociable neuroanatomical correlates of subsecond and suprasecond
time perception. J. Cogn. Neurosci. 2014, 26, 1685–1693. [CrossRef]5. Phillips-Silver, J.; Trainor, L.J. Feeling the beat: Movement influences infant rhythm perception. Science 2005, 308, 1430. [CrossRef]6. Mauk, M.D.; Buonomano, D.V. The neural basis of temporal processing. Annu. Rev. Neurosci. 2004, 27, 307–340. [CrossRef]7. Wittmann, M.; Paulus, M.P. Decision making, impulsivity and time perception. Trends Cogn. Sci. 2008, 12, 7–12. [CrossRef] [PubMed]8. Mitani, K.; Kashino, M. Self-produced time intervals are perceived as more variable and/or shorter depending on temporal
context in subsecond and suprasecond ranges. Front. Integr. Neurosci. 2016, 10, 19. [CrossRef]9. Lewis, P.A.; Miall, R.C. Brain activation patterns during measurement of sub- and supra-second intervals. Neuropsychologia 2003,
41, 1583–1592. [CrossRef]10. Wiener, M.; Turkeltaub, P.; Coslett, H.B. The image of time: A voxel-wise meta-analysis. NeuroImage 2010, 49, 1728–1740. [CrossRef]11. Petter, E.A.; Lusk, N.A.; Hesslow, G.; Meck, W.H. Interactive roles of the cerebellum and striatum in sub-second and supra-second
timing: Support for an initiation, continuation, adjustment, and termination (ICAT) model of temporal processing. Neurosci.Biobehav. Rev. 2016, 71, 739–755. [CrossRef] [PubMed]
12. Rammsayer, T.; Ulrich, R. No evidence for qualitative differences in the processing of short and long temporal intervals. Acta.Psychol. 2005, 120, 141–171. [CrossRef] [PubMed]

Brain Sci. 2021, 11, 1362 13 of 14
13. Rammsayer, T.H.; Troche, S.J. In search of the internal structure of the processes underlying interval timing in the sub-second andthe second range: A confirmatory factor analysis approach. Acta. Psychol. 2014, 147, 68–74. [CrossRef] [PubMed]
14. Bendixen, A.; Grimm, S.; Schroger, E. Human auditory event-related potentials predict duration judgments. Neurosci. Lett. 2005,383, 284–288. [CrossRef]
15. Macar, F.; Vidal, F.; Casini, L. The supplementary motor area in motor and sensory timing: Evidence from slow brain potentialchanges. Exp. Brain Res. 1999, 125, 271–280. [CrossRef] [PubMed]
16. Wiener, M.; Kliot, D.; Turkeltaub, P.E.; Hamilton, R.H.; Wolk, D.A.; Coslett, H.B. Parietal influence on temporal encodingindexed by simultaneous transcranial magnetic stimulation and electroencephalography. J. Neurosci. 2012, 32, 12258–12267.[CrossRef] [PubMed]
17. Ng, K.K.; Penney, T.B. Probing interval timing with scalp-recorded electroencephalography (EEG). Adv. Exp. Med. Biol. 2014, 829,187–207. [CrossRef]
18. Zhang, Z.; Yuan, H.; Huang, X. The difference between sub- and supara-second interval processing: Evidence from an erp study(in Chinese). Psychol. Sci. 2006, 29, 87–90. (In Chinese) [CrossRef]
19. Kononowicz, T.W.; van Rijn, H. Slow potentials in time estimation: The role of temporal accumulation and habituation. Front.Integr. Neurosci. 2011, 5, 48. [CrossRef] [PubMed]
20. Macar, F.; Vidal, F. The CNV peak: An index of decision making and temporal memory. Psychophysiology 2003, 40,950–954. [CrossRef]
21. Ng, K.K.; Tobin, S.; Penney, T.B. Temporal accumulation and decision processes in the duration bisection task revealed bycontingent negative variation. Front. Integr. Neurosci. 2011, 5. [CrossRef]
22. Pfeuty, M.; Ragot, R.; Pouthas, V. When time is up: CNV time course differentiates the roles of the hemispheres in the discrimina-tion of short tone durations. Exp. Brain Res. 2003, 151, 372–379. [CrossRef]
23. Pfeuty, M.; Ragot, R.; Pouthas, V. Relationship between CNV and timing of an upcoming event. Neurosci. Lett. 2005, 382, 106–111.[CrossRef] [PubMed]
24. Li, B.; Chen, Y.; Xiao, L.; Liu, P.; Huang, X. Duration adaptation modulates eeg correlates of subsequent temporal encoding.NeuroImage 2017, 147, 143–151. [CrossRef] [PubMed]
25. Pouthas, V.; Garnero, L.; Ferrandez, A.M.; Renault, B. ERPs and PET analysis of time perception: Spatial and temporal brainmapping during visual discrimination tasks. Hum. Brain Mapp. 2000, 10, 49–60. [CrossRef]
26. Kononowicz, T.W.; Peey, T.B. The contingent negative variation (CNV): Timing isn’t everything. Curr. Opin. Behav. Sci. 2016, 8,231–237. [CrossRef]
27. Macar, F.; Vidal, F. Event-related potentials as indices of time processing: A review. J. Psychophysiol. 2004, 18, 89–104. [CrossRef]28. Bannier, D.; Wearden, J.; Le Dantec, C.C.; Rebai, M. Differences in the temporal processing between identification and categoriza-
tion of durations: A behavioral and erp study. Behav. Brain Res. 2019, 356, 197–203. [CrossRef] [PubMed]29. Wiener, M.; Lee, Y.S.; Lohoff, F.W.; Coslett, H.B. Individual differences in the morphometry and activation of time perception
networks are influenced by dopamine genotype. NeuroImage 2014, 89, 10–22. [CrossRef]30. Huang, S.; Liu, P.; Li, Q.; Chen, Y.; Huang, X. The influence of facial expressions of pain on subsecond and suprasecond time
perception. Psychol. Sci. 2018, 41, 278–284. (In Chinese) [CrossRef]31. Block, R.A.; Hancock, P.A.; Zakay, D. Sex differences in duration judgments: A meta-analytic review. Mem. Cognit. 2000, 28,
1333–1346. [CrossRef]32. Zhang, M.; Zhang, L.; Yu, Y.; Liu, T.; Luo, W. Women overestimate temporal duration: Evidence from Chinese emotional words.
Front. Psychol. 2017, 8, 4. [CrossRef] [PubMed]33. Zhang, M.; Zhao, D.; Zhang, Z.; Cao, X.; Yin, L.; Liu, Y.; Yuan, T.; Luo, W. Time perception deficits and its dose-dependent effect
in methamphetamine dependents with short-term abstinence. Sci. Adv. 2019, 5, eaax6916. [CrossRef]34. Kononowicz, T.W.; van Rijn, H. Decoupling interval timing and climbing neural activity: A dissociation between CNV and N1P2
amplitudes. J. Neurosci. 2014, 34, 2931–2939. [CrossRef]35. Rattat, A.C.; Droit-Volet, S. What is the best and easiest method of preventing counting in different temporal tasks? Behav. Res.
Methods 2012, 44, 67–80. [CrossRef]36. Delorme, A.; Makeig, S. Eeglab: An open source toolbox for analysis of single-trial eeg dynamics including independent
component analysis. J. Neurosci. Methods 2004, 134, 9–21. [CrossRef]37. Gibbons, H.; Rammsayer, T.H. Current-source density analysis of slow brain potentials during time estimation. Psychophysiology
2004, 41, 861–874. [CrossRef]38. Wearden, J.H. Decision processes in models of timing. Acta Neurobiol. Exp. 2004, 64, 303–318.39. Fraisse, P. Perception and estimation of time. Annu. Rev. Psychol. 1984, 35, 1–37. [CrossRef] [PubMed]40. Pöppel, E. A hierarchical model of temporal perception. Trends Cogn. Sci. 1997, 1, 56–61. [CrossRef]41. Pöppel, E. Pre-semantically defined temporal windows for cognitive processing. Philos. Trans. R. Soc. Lond. B Biol. Sci. 2009, 364,
1887–1896. [CrossRef]42. Yin, H.; Cui, X.; Bai, Y.; Cao, G.; Deng, J.; Li, D. The important time parameters and related evidences from dual perspectives of
temporal information processing and temporal processing of information. Adv. Psy. Sci. 2020, 28, 1853–1864. [CrossRef]43. Szelag, E.; Kowalska, J.; Rymarczyk, K.; Pöppel, E. Duration processing in children as determined by time reproduction:
Implications for a few seconds temporal window. Acta Psychol. 2002, 110, 1–19. [CrossRef]

Brain Sci. 2021, 11, 1362 14 of 14
44. Ulbrich, P.; Churan, J.; Fink, M.; Wittmann, M. Temporal reproduction: Further evidence for two processes. Acta. Psychol. 2007,125, 51–65. [CrossRef]
45. Droit-Volet, S.; Hallez, Q. Differences in modal distortion in time perception due to working memory capacity: A response with adevelopmental study in children and adults. Psychol. Res. 2019, 83, 1496–1505. [CrossRef]
46. Cester, I.; Mioni, G.; Cornoldi, C. Time processing in children with mathematical difficulties. Learn. Individ. Differ. 2017, 58,22–30. [CrossRef]
47. Elbert, T.; Ulrich, R.; Rockstroh, B.; Lutzenberger, W. The processing of temporal intervals reflected by CNV-like brain potentials.Psychophysiology 1991, 28, 648–655. [CrossRef]
48. Koch, G.; Oliveri, M.; Torriero, S.; Salerno, S.; Gerfo, E.L.; Caltagirone, C. Repetitive tms of cerebellum interferes with millisecondtime processing. Exp. Brain Res. 2007, 179, 291–299. [CrossRef]
49. Yin, H.Z.; Cheng, M.; Li, D. The right dorsolateral prefrontal cortex is essential in seconds range timing, but not in millisecondsrange timing: An investigation with transcranial direct current stimulation. Brain Cogn. 2019, 135, 103568. [CrossRef] [PubMed]
50. Monfort, V.; Pouthas, V.; Ragot, R. Role of frontal cortex in memory for duration: An event-related potential study in humans.Neurosci. Lett. 2000, 286, 91–94. [CrossRef]
51. Röhricht, J.; Jo, H.G.; Wittmann, M.; Schmidt, S. Exploring the maximum duration of the contingent negative variation. Int. J.Psychophysiol. 2018, 128, 52–61. [CrossRef] [PubMed]
52. He, B.J.; Raichle, M.E. The fMRI signal, slow cortical potential and consciousness. Trends Cogn. Sci. 2009, 13, 302–309.[CrossRef] [PubMed]
53. Northoff, G. Slow cortical potentials and “inner time consciousness”—A neuro-phenomenal hypothesis about the "width ofpresent". Int. J. Psychophysiol. 2016, 103, 174–184. [CrossRef]


![Synthesis and Characterization of LiFePO[sub 4] and LiTi[sub 0.01]Fe[sub 0.99]PO[sub 4] Cathode Materials](https://static.fdokumen.com/doc/165x107/631dae063dc6529d5d079742/synthesis-and-characterization-of-lifeposub-4-and-litisub-001fesub-099posub.jpg)