An unusual stratospheric ozone decrease in the Southern Hemisphere subtropics linked to isentropic...
10
Atmos. Chem. Phys., 6, 1927–1936, 2006 www.atmos-chem-phys.net/6/1927/2006/ © Author(s) 2006. This work is licensed under a Creative Commons License. Atmospheric Chemistry and Physics An unusual stratospheric ozone decrease in the Southern Hemisphere subtropics linked to isentropic air-mass transport as observed over Irene (25.5 ◦ S, 28.1 ◦ E) in mid-May 2002 N. Semane 1,* , H. Bencherif 2 , B. Morel 2 , A. Hauchecorne 3 , and R. D. Diab 4 1 Centre National de Recherches M´ et´ eorologiques, Direction de la M´ et´ eorologie Nationale, Casablanca, Morocco 2 Laboratoire de l’Atmosph` ere et des Cyclones, UMR CNRS 8105, Universit´ e de La R´ eunion, Reunion Island, France 3 Service d’A´ eronomie, UMR CNRS 7620, Paris, France 4 University of KwaZulu-Natal, Durban, South Africa * now at: Centre National de Recherches M´ et´ eorologiques, M´ et´ eo-France, Toulouse, France Received: 14 September 2005 – Published in Atmos. Chem. Phys. Discuss.: 7 December 2005 Revised: 7 February 2006 – Accepted: 18 April 2006 – Published: 2 June 2006 Abstract. A prominent ozone minimum of less than 240 Dobson Units (DU) was observed over Irene (25.5 ◦ S, 28.1 ◦ E), a subtropical site in the Southern Hemisphere, by the Total Ozone Mapping Spectrometer (TOMS) during May 2002 with an extremely low ozone value of less than 219 DU recorded on 12 May, as compared to the climatological mean value of 249 DU for May between 1999 and 2005. In this study, the vertical structure of this ozone minimum is exam- ined using ozonesonde measurements performed over Irene on 15 May 2002, when the total ozone (as given by TOMS) was about 226 DU. It is shown that this ozone minimum is of Antarctic polar origin with a low-ozone layer in the middle stratosphere above 625 K (where the climatological ozone gradient points equatorward), and is of tropical origin with a low-ozone layer in the lower stratosphere between the 400-K and 450-K isentropic levels (where the climatological ozone gradient is reversed). The upper and lower depleted parts of the ozonesonde profile for 15 May are then respectively at- tributed to equatorward and poleward transport of low-ozone air toward the subtropics in the Southern Hemisphere. The tropical air moving over Irene and the polar one passing over the same area associated with enhanced planetary-wave ac- tivity are successfully simulated using the high-resolution advection contour model of Ertel’s potential vorticity MI- MOSA. The unusual distribution of ozone over Irene dur- ing May 2002 in the middle stratosphere is connected to the anomalously pre-conditioned structure of the polar vortex at that time of the year. The winter stratospheric wave driving leading to the ozone minimum is investigated by means of the Eliassen-Palm flux computed from the European Center Correspondence to: N. Semane ([email protected]) for Medium-range Weather Forecasts (ECMWF) ERA40 re- analyses. 1 Introduction Tropical stratospheric ozone is a prominent actor in atmo- spheric chemistry and physics, and the southern tropical and subtropical latitudes are among locations where a possible recovery of the ozone layer may be detected. However, trop- ical ozone studies that rely only on satellite measurements are not able to neither resolve vertical-fine scale structures nor completely improve our understanding of both photo- chemical and dynamic processes that are operating in the at- mosphere and contributing to the ozone budget. The sparse- ness of in-situ measurements in the tropical and subtropical Southern Hemisphere has limited investigations of ozone dis- tribution and variability related to atmospheric dynamics and climate, e.g., the meridional transport, the varying position of the Intertropical Convergence Zone (ITCZ), the Quasi- Biennial Oscillation (QBO), the El Ni˜ no-Southern Oscilla- tion (ENSO) and La Ni ˜ na. Situated in the subtropical region of the Southern Hemi- sphere, Irene represents a location of major interest for the observation of low and high latitude influences attributed to transport processes. Thompson et al. (2003a, b) used 1100 SHADOZ radiosondes from 10 southern tropical and sub- tropical sites during the 1998–2000 period to characterize the seasonality and variability in ozone. They showed that the to- tal amount of ozone is generally low in the tropics in winter. Their data also show higher stratospheric ozone at Irene due to a greater frequency of mid-latitude air passing over the site Published by Copernicus GmbH on behalf of the European Geosciences Union.
-
Upload
univ-reunion -
Category
Documents
-
view
3 -
download
0
Transcript of An unusual stratospheric ozone decrease in the Southern Hemisphere subtropics linked to isentropic...

Atmos. Chem. Phys., 6, 1927–1936, 2006www.atmos-chem-phys.net/6/1927/2006/© Author(s) 2006. This work is licensedunder a Creative Commons License.
AtmosphericChemistry
and Physics
An unusual stratospheric ozone decrease in the SouthernHemisphere subtropics linked to isentropic air-mass transport asobserved over Irene (25.5◦ S, 28.1◦ E) in mid-May 2002
N. Semane1,*, H. Bencherif2, B. Morel2, A. Hauchecorne3, and R. D. Diab4
1Centre National de Recherches Meteorologiques, Direction de la Meteorologie Nationale, Casablanca, Morocco2Laboratoire de l’Atmosphere et des Cyclones, UMR CNRS 8105, Universite de La Reunion, Reunion Island, France3Service d’Aeronomie, UMR CNRS 7620, Paris, France4University of KwaZulu-Natal, Durban, South Africa* now at: Centre National de Recherches Meteorologiques, Meteo-France, Toulouse, France
Received: 14 September 2005 – Published in Atmos. Chem. Phys. Discuss.: 7 December 2005Revised: 7 February 2006 – Accepted: 18 April 2006 – Published: 2 June 2006
Abstract. A prominent ozone minimum of less than240 Dobson Units (DU) was observed over Irene (25.5◦ S,28.1◦ E), a subtropical site in the Southern Hemisphere, bythe Total Ozone Mapping Spectrometer (TOMS) during May2002 with an extremely low ozone value of less than 219 DUrecorded on 12 May, as compared to the climatological meanvalue of 249 DU for May between 1999 and 2005. In thisstudy, the vertical structure of this ozone minimum is exam-ined using ozonesonde measurements performed over Ireneon 15 May 2002, when the total ozone (as given by TOMS)was about 226 DU. It is shown that this ozone minimum is ofAntarctic polar origin with a low-ozone layer in the middlestratosphere above 625 K (where the climatological ozonegradient points equatorward), and is of tropical origin with alow-ozone layer in the lower stratosphere between the 400-Kand 450-K isentropic levels (where the climatological ozonegradient is reversed). The upper and lower depleted parts ofthe ozonesonde profile for 15 May are then respectively at-tributed to equatorward and poleward transport of low-ozoneair toward the subtropics in the Southern Hemisphere. Thetropical air moving over Irene and the polar one passing overthe same area associated with enhanced planetary-wave ac-tivity are successfully simulated using the high-resolutionadvection contour model of Ertel’s potential vorticity MI-MOSA. The unusual distribution of ozone over Irene dur-ing May 2002 in the middle stratosphere is connected to theanomalously pre-conditioned structure of the polar vortex atthat time of the year. The winter stratospheric wave drivingleading to the ozone minimum is investigated by means ofthe Eliassen-Palm flux computed from the European Center
Correspondence to:N. Semane([email protected])
for Medium-range Weather Forecasts (ECMWF) ERA40 re-analyses.
1 Introduction
Tropical stratospheric ozone is a prominent actor in atmo-spheric chemistry and physics, and the southern tropical andsubtropical latitudes are among locations where a possiblerecovery of the ozone layer may be detected. However, trop-ical ozone studies that rely only on satellite measurementsare not able to neither resolve vertical-fine scale structuresnor completely improve our understanding of both photo-chemical and dynamic processes that are operating in the at-mosphere and contributing to the ozone budget. The sparse-ness of in-situ measurements in the tropical and subtropicalSouthern Hemisphere has limited investigations of ozone dis-tribution and variability related to atmospheric dynamics andclimate, e.g., the meridional transport, the varying positionof the Intertropical Convergence Zone (ITCZ), the Quasi-Biennial Oscillation (QBO), the El Nino-Southern Oscilla-tion (ENSO) and La Nina.
Situated in the subtropical region of the Southern Hemi-sphere, Irene represents a location of major interest for theobservation of low and high latitude influences attributed totransport processes. Thompson et al. (2003a, b) used 1100SHADOZ radiosondes from 10 southern tropical and sub-tropical sites during the 1998–2000 period to characterize theseasonality and variability in ozone. They showed that the to-tal amount of ozone is generally low in the tropics in winter.Their data also show higher stratospheric ozone at Irene dueto a greater frequency of mid-latitude air passing over the site
Published by Copernicus GmbH on behalf of the European Geosciences Union.
1928 N. Semane et al.: An unusual subtropical stratospheric ozone decrease
in the lower stratosphere. Furthermore, recent observationalstudies have shown that in the southern subtropics, within theUTLS region, many dynamical processes, such as subtropi-cal tropopause breaks (Baray et al., 1998), and isentropic hor-izontal exchanges in the low stratosphere through the south-ern subtropical barrier (Bencherif et al., 2003; Portafaix etal., 2003) take place. Using a middle atmosphere circulationmodel, Horinouchi et al. (2000) showed that the transportbetween the tropics and the extratropics is strongly depen-dent on altitude and has geographic preferences in the lowerstratosphere. Calisesi et al. (2001) stressed the role of south-ward excursions of the polar vortex in the large episodic win-ter ozone perturbations observed in the mid-latitude middlestratosphere. Additionally, Koch et al. (2002, 2005) showedthat the extreme total ozone anomalies in the mid-latitudestratosphere are associated with meridional transport fromregions with climatologically low/high ozone concentrations.Riese et al. (2001) studied transport of tropical air southwardin association with a strong interaction of the South polarvortex with the subtropical barrier.
The present paper reports on an unusual stratosphericozone decrease recorded during May 2002 over Irene andhighlights its relationship with the early winter phase of theunusual Southern Hemisphere winter 2002 in which the firstmajor sudden stratospheric warming (SSW) was detectedsince regular monitoring began in the 1940s (Kruger et al.,2005). The exceptional SSW was followed by a split of theozone hole into two parts in September 2002 (World Me-teorological Organization (WMO), 2003). In fact, an un-usually weak polar vortex was an exceptional feature of theentire winter 2002 in the Southern Hemisphere, which pre-conditioned it for a progressive dilation. This was associatedwith distinctive persistent stratospheric vacillations startingaround 20 June 2002 (Scaife et al., 2005). This behavior ofthe wintertime polar vortex was considered to be the mainperquisite for the SSW of September 2002. This latter un-precedented event has been extensively analyzed (e.g., Jour-nal of the Atmospheric Sciences (JAS) Special Issue, 2005).Nevertheless, the 2002 early-winter pre-conditioning anoma-lies and their impact on the subtropics have been little docu-mented and studied.
Here the high-resolution advection model MIMOSA(Modelisation Isentrope du transport Meso-echelle del’Ozone Stratospherique par Advection), and the Eliassen-Palm flux computed from the European Center for Medium-range Weather Forecasts (ECMWF) ERA40 re-analyses, areused to investigate the basic dynamics behind the aforemen-tioned ozone decrease event observed over Irene in Mid-May2002.
The data and analytical tools used in this study are de-scribed in Sect. 2. In Sect. 3, we characterize the May 2002ozone anomaly using 7 years of Total Ozone Mapping Spec-trometer (TOMS) and ozonesonde data. The dynamical pro-cesses are investigated in Sect. 4. Conclusions are presentedin Sect. 5.
2 Data and analysis
In this section, a brief overview of the ozone and meteorolog-ical data along with the diagnostic tools used for the analysesis given.
2.1 Data description
2.1.1 Ozone data
The 1998-2005 ozone profiles for Irene (25.5◦ S, 28.1◦ E,Pretoria, South Africa) used in this study have been per-formed by the SAWS (South African Weather Service) andare archived on the SHADOZ (Southern Hemisphere Ad-ditional Ozonesondes) web site (http://croc.gsfc.nasa.gov/shadoz) (Thompson et al., 2003a, b). The ozonesonde usedis of Science Pump ECC6A type with 1% KI buffered solu-tion, and the meteorological sonde is of Vaisala RS80-15GEtype. For the present study, 178 profiles measured fortnightlybetween November 1998 and May 2005 were used. Moreprecisely, in order to examine the early winter state of strato-spheric ozone over Irene, we focused our analysis on theMay ozone concentration profiles measured during the pe-riod from 1999 to 2005. In addition, total ozone columnsover Irene for the same period were taken from the TOMSexperiment on board the Earth Probe satellite (Earth ProbeTOMS V.8 overpass data available at NASA/Goddard SpaceFlight Center web site: http://toms.gsfc.nasa.gov/ozone),which provides daily global distribution of ozone with a res-olution of 1◦ in latitude and 1.25◦ in longitude.
2.1.2 Meteorological data
Information about the dynamical evolution of the atmospherein the early southern winter 2002 is provided by the ERA-40re-analyses archived on the ECMWF web site (http://data.ecmwf.int/data/d/era40daily/). In this study, ECMWF hori-zontal winds and temperature were extracted on a 2.5◦
×2.5◦
grid from 1000 to 1 hPa (23 levels) at 00:00, 06:00, 12:00 and18:00 UT, for the period extending from 1 April to 31 May2002.
2.2 Diagnosis tools
2.2.1 The Ertel’s potential vorticity and the Eliassen-Palmflux
In this paper, the dynamical processes are investigated usingthe following diagnostic tools computed from the ECMWFdata: the isentropic Ertel’s potential vorticity (Epv) and theEliassen-Palm (E-P) flux.
First, the Epv on isentropic surfaces, which behaves as adynamical tracer in the absence of diabatic effects, is usedto study the isentropic transport across the dynamical barri-ers in the stratosphere: polar vortices or subtropical barriers(Hoskins et al., 1985; Holton et al., 1995; Bencherif et al.,
Atmos. Chem. Phys., 6, 1927–1936, 2006 www.atmos-chem-phys.net/6/1927/2006/

N. Semane et al.: An unusual subtropical stratospheric ozone decrease 1929
Figure 1. Daily total ozone column (in DU) for May, over Irene, as derived from TOMS/Earth
Probe Satellite overpass data for 2002 (solid line with ‘+’ symbols) and for 1999-2005 (‘*’).
The horizontal lines represent the corresponding monthly mean value (dashed line) ± σ
(dotted line).
15
Fig. 1. Daily total ozone column (in DU) for May, over Irene,as derived from TOMS/Earth Probe Satellite overpass data for2002 (solid line with “+” symbols) and for 1999–2005 (“∗”). Thehorizontal lines represent the corresponding monthly mean value(dashed line)±σ (dotted line).
2003). Here the Epv is evaluated from ECMWF horizontalwind and temperature fields interpolated onto isentropic sur-faces.
Second, the E-P flux vector (F ) and its divergence(div(F )) are used to obtain information about the planetary-wave activity and the possible wave-breaking regimes. Theorientation of the E-P flux vector indicates the direc-tion of planetary-wave propagation (Andrews et al., 1987).Planetary-wave activity in the mid-latitudes generally prop-agates from the winter troposphere up into the stratosphereand mesosphere and toward the equator (Eliassen and Palm,1961; Kanzawa et al., 1984). Planetary-wave breaking canbe recognized by the convergence of the E-P flux vectors(div(F )<0).
2.2.2 The MIMOSA advection transport model
We use the MIMOSA model in order to further investigatethe isentropic transport across the dynamical barriers in thestratosphere, and to evaluate the contribution of this (hori-zontal) transport mechanism in the vertical distribution ofozone over the subtropics. MIMOSA is a high-resolutionadvection contour model of Ertel’s potential vorticity, whichwas developed at the Service d’Aeronomie by Hauchecorneet al. (2002). The model runs on an orthogonal grid cover-ing the whole Southern Hemisphere with a resolution of 3grid points/degree. The Epv at each grid point is advectedwith a time step of 1 h using ECMWF ERA-40 wind fieldsand the advected Epv (denoted APV hereafter) fields are re-interpolated onto the original grid every 6 h. The diabaticevolution of the Epv field at large scales is extracted fromECMWF fields by applying a relaxation toward the ECMWFEpv field with a time constant of 10 days (Morel et al., 2005).
0 0.5 1 1.5 2 2.5 3 3.5 4 4.5 5 5.5250
300
350
400
450
500
550
600
650
700
750
800
850
Ozone Concentration x 1012 (mol/cm3)
Pote
ntia
l Tem
pera
ture
(K)
Figure 2. Ozone concentration profile as obtained from ozonesonde measurements over Irene
(25.5° S, 28.1° E) on May 15, 2002 (solid line) compared to the May profiles from 1999 to
2005 (in grey) and the corresponding mean profile (dashed line).
16
Fig. 2. Ozone concentration profile as obtained from ozonesondemeasurements over Irene (25.5◦ S, 28.1◦ E) on 15 May 2002 (solidline) compared to the May profiles from 1999 to 2005 (in grey) andthe corresponding mean profile (dashed line).
In the present study, the MIMOSA model is run for twomonths starting on 1 April 2002.
3 Ozone observations over Irene in May 2002
This section is designed to characterize an extreme ozoneevent in the stratosphere observed during May 2002 overIrene. The specific date of May 15 of our study is chosenby matching particularly low ozone events identified fromEarth Probe TOMS records with a coinciding ozonesondeflight over Irene.
Daily total ozone values derived from TOMS records foryears between 1999 and 2005 are depicted for the month ofMay in Fig. 1. As shown by the dashed horizontal line onthe figure, the monthly averaged total ozone over Irene lo-cation is 249±12 DU (at 1σ ). The absolute minimum totalozone (219 DU), which is about 30 DU less than the May cli-matological mean, is obtained on 12 May 2002. As for thecoincident day of ozonesonde flight (on 15 May), the corre-sponding total ozone (226 DU) is also significantly less thanthe climatological mean. In fact, one notices that the neg-ative anomaly of total ozone persists for more than a week(see Fig. 1).
The mid-May vertical distribution of stratospheric ozoneover Irene as obtained from ozonesonde measurements is il-lustrated in Fig. 2. It shows the ozone concentration profile(solid line) recorded on 15 May together with the monthlymean profile (dashed line). The later is obtained similarly asfor the TOMS total ozone mean, i.e. by averaging togetherall the May ozone profiles (over 16 ozonesondes flown fort-nightly from 1999 to 2005).
The ozone profile recorded on 15 May 2002 (Fig. 2, solidline) shows strong negative deviations in comparison with
www.atmos-chem-phys.net/6/1927/2006/ Atmos. Chem. Phys., 6, 1927–1936, 2006
1930 N. Semane et al.: An unusual subtropical stratospheric ozone decrease
Plate (a)
17
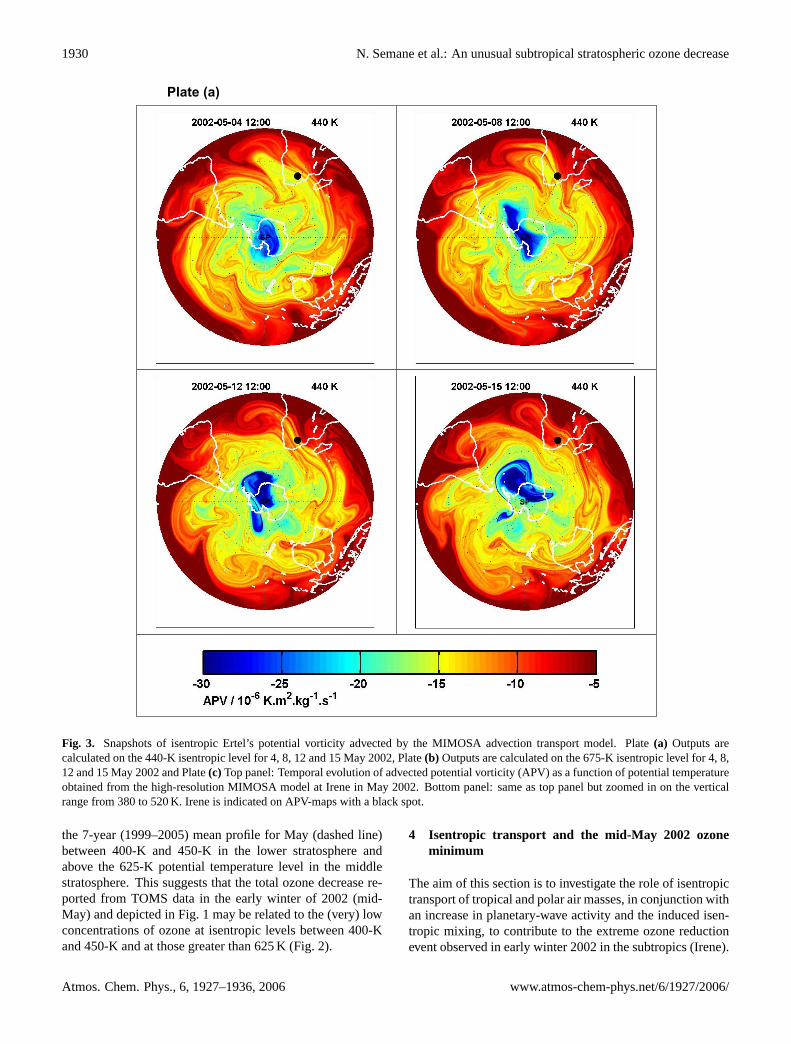
Fig. 3. Snapshots of isentropic Ertel’s potential vorticity advected by the MIMOSA advection transport model. Plate(a) Outputs arecalculated on the 440-K isentropic level for 4, 8, 12 and 15 May 2002, Plate(b) Outputs are calculated on the 675-K isentropic level for 4, 8,12 and 15 May 2002 and Plate(c) Top panel: Temporal evolution of advected potential vorticity (APV) as a function of potential temperatureobtained from the high-resolution MIMOSA model at Irene in May 2002. Bottom panel: same as top panel but zoomed in on the verticalrange from 380 to 520 K. Irene is indicated on APV-maps with a black spot.
the 7-year (1999–2005) mean profile for May (dashed line)between 400-K and 450-K in the lower stratosphere andabove the 625-K potential temperature level in the middlestratosphere. This suggests that the total ozone decrease re-ported from TOMS data in the early winter of 2002 (mid-May) and depicted in Fig. 1 may be related to the (very) lowconcentrations of ozone at isentropic levels between 400-Kand 450-K and at those greater than 625 K (Fig. 2).
4 Isentropic transport and the mid-May 2002 ozoneminimum
The aim of this section is to investigate the role of isentropictransport of tropical and polar air masses, in conjunction withan increase in planetary-wave activity and the induced isen-tropic mixing, to contribute to the extreme ozone reductionevent observed in early winter 2002 in the subtropics (Irene).
Atmos. Chem. Phys., 6, 1927–1936, 2006 www.atmos-chem-phys.net/6/1927/2006/

N. Semane et al.: An unusual subtropical stratospheric ozone decrease 1931
Plate (b)
18
Fig. 3. Continued.
4.1 Tropical and polar air mass advection toward the sub-tropics
In order to investigate tropical and polar air-mass transportstoward the subtropics, high resolution PV-maps on selectedisentropic surfaces were constructed for 4–15 May using theMIMOSA model.
Plate (a) and (b) of Fig. 3 show snapshots of Epv advectedby MIMOSA (APV) on the 440-K (lower stratosphere) and
on the 675-K (middle stratosphere) isentropic surfaces forselected days prior to and during the ozone minimum event.The tropical and polar air masses can be identified respec-tively by low and high absolute APV values. On each APV-map, the location of Irene is indicated by a black spot. On4 and 8 May (upper APV maps on plate (b) of Fig. 3), atthe 675-K isentropic surface, Irene is covered by air-massesof relatively low absolute APV values, while on 12 and 15May, a tongue with high absolute APV indicating air of polar
www.atmos-chem-phys.net/6/1927/2006/ Atmos. Chem. Phys., 6, 1927–1936, 2006

1932 N. Semane et al.: An unusual subtropical stratospheric ozone decrease
Plate (c)
Figure 3. Snapshots of isentropic Ertel’s potential vorticity advected by the MIMOSA
advection transport model. Plate (a) Outputs are calculated on the 440-K isentropic level for
May 4, 8, 12 and 15, 2002, Plate (b) Outputs are calculated on the 675-K isentropic level for
May 4, 8, 12 and 15, 2002 and Plate (c) Top panel: Temporal evolution of advected potential
vorticity (APV) as a function of potential temperature obtained from the high-resolution
19
Fig. 3. Continued.
origin is deformed and shifted away from the pole toward thesubtropics. It extends over the 15–120◦ E longitude and 20–40◦ S latitude range, covering a large area over the south partof Africa, including Irene. In parallel, on 4 and 8 May (up-per APV maps on plate (a) of Fig. 3), at the 440-K isentropicsurface, Irene is covered by air-masses of relatively high ab-solute APV values, while on 12 and 15 May, a tongue withlow absolute APV indicating air of tropical origin, has movedeastward and southward toward the subtropics.
Nearly the same transport situations are obtained from MI-MOSA outputs for selected isentropic surfaces in the 625–800 K range (not shown). Furthermore, Plate (c) of Fig. 3shows the time evolution of APV as a function of potentialtemperature over Irene during May 2002 in the stratosphere.During the mid-May period, the Irene site is under the in-fluence of polar air masses in the middle stratosphere (toppanel) and of tropical ones in the lower stratosphere (bottompanel). This is in agreement with the vertical extension ofthe negative deviation observed on the ozone concentrationprofile recorded on 15 May for isentropic levels higher than625 K and for those between 400 K and 450 K (see Fig. 2).
Because of polar vortex disturbances, MIMOSA analysesshow how polar air masses were injected into mid-latituderegions and sporadically into the subtropics. Moreover, thislarge latitudinal extension (from pole to subtropics) goes si-multaneously, in a reverse way, with isentropic transport oftropical air masses towards the mid-latitudes in the lowerstratosphere. This episode of horizontal exchange betweenthe tropical stratospheric reservoir and mid-latitudes is alsowell identified on MIMOSA APV-maps during the periodfrom 10–18 May (not shown). This is in agreement with thetime extension of the minimum of total ozone derived fromTOMS measurements (see Fig. 1).
Thus, the unusual reduction of total ozone observed overIrene by mid-May 2002 seems to be related to isentropictransport of air masses simultaneously in the lower and mid-dle stratosphere, respectively from the tropics to the mid-latitudes and from the pole to the subtropics.
It is a particularly interesting situation. In the lower strato-sphere (400–450 K) the ozone profile (Fig. 2) shows a tropi-cal influence. Indeed, ozone concentrations there are signif-icantly below climatological values and similar to the tropi-cal values in the lower stratosphere (Portafaix et al., 2003).In the middle stratosphere, the low concentrations of ozoneboth in the upper part of the profile (above 625 K) and onthe MIMOSA APV maps can be attributed to air-mass ad-vection from pole to tropics as the climatological ozone de-creases towards high latitudes in the middle stratosphere ofboth hemispheres (Koch et al., 2002; Godin et al., 2002).The mid-stratospheric ozone decrease observed over Ireneappears hence to be a local effect of the large-scale distur-bances occasionally affecting the polar stratospheric circula-tion as early as May 2002. Given its relationship to theselarge-scale features and their transient character, this mid-stratospheric ozone decrease is of purely dynamical origin.
4.2 Wave activity
A perturbed polar vortex is associated with enhancedplanetary-wave activity, which contributes to pull out ma-terial from the vortex and distribute filaments equatorward(Schoeberl et al., 1988, 1992). Moreover, in the stratospherenearby a subtropical barrier the isentropic mixing has beenlinked to disturbances occurring at the vicinity of the polarvortex in the winter hemisphere (Waugh, 1993). Accordingto Marchand et al. (2003), the transport of polar air towardmidlatitudes can occur through the extension of filament to-ward lower latitudes and through vortex intrusions. Thistransport can have different effects depending on whether itis reversible or irreversible. If reversible, the effect is to per-turb the ozone content at low latitudes for a limited period oftime. If irreversible, polar air is mixed with the surroundingair.
The rapid and irreversible deformation of Epv contourson the 675-K isentropic surface observed in plate (b) ofFig. 3 suggests a planetary-wave breaking linkage resulting
Atmos. Chem. Phys., 6, 1927–1936, 2006 www.atmos-chem-phys.net/6/1927/2006/
N. Semane et al.: An unusual subtropical stratospheric ozone decrease 1933
(a)
21
(b)
22
(c)
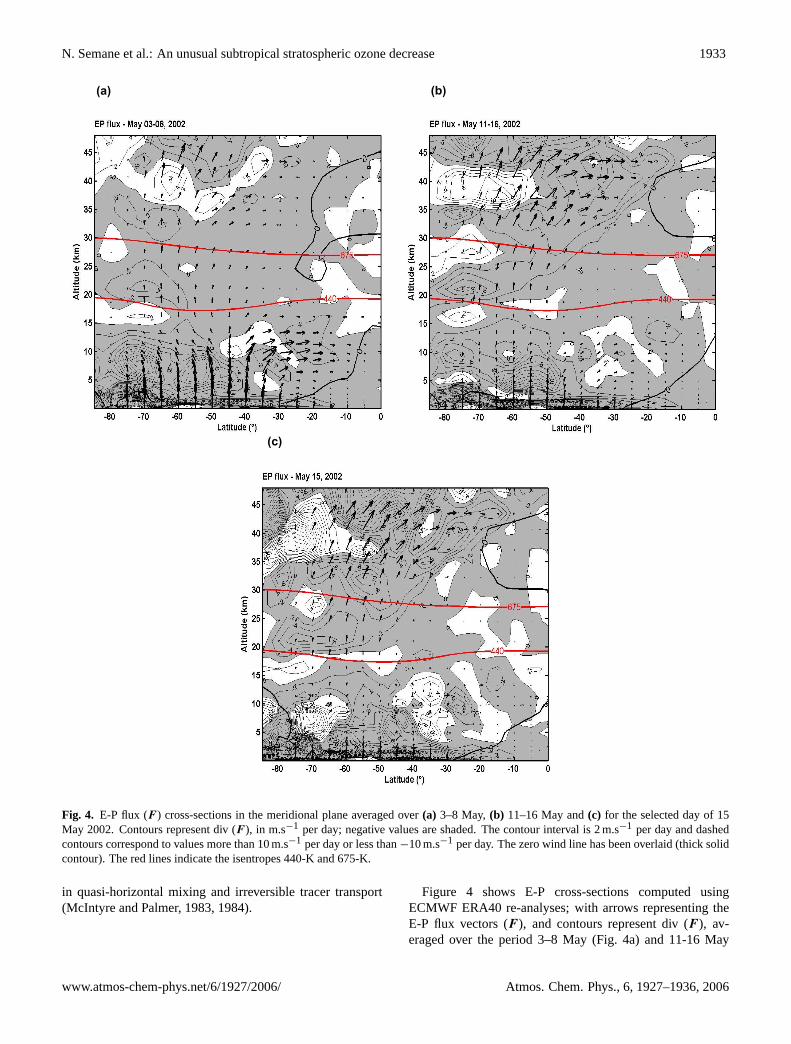
Figure 4. E-P flux (F) cross-sections in the meridional plane averaged over (a) May 3-8, (b)
May 11-16 and (c) for the selected day of May 15, 2002. Contours represent div (F), in m.s-1
per day; negative values are shaded. The contour interval is 2 m.s-1 per day and dashed
contours correspond to values more than 10 m.s-1 per day or less than -10 m.s-1 per day. The
zero wind line has been overlaid (thick solid contour). The red lines indicate the isentropes
440-K and 675-K.
23
Fig. 4. E-P flux (F ) cross-sections in the meridional plane averaged over(a) 3–8 May,(b) 11–16 May and(c) for the selected day of 15May 2002. Contours represent div (F ), in m.s−1 per day; negative values are shaded. The contour interval is 2 m.s−1 per day and dashedcontours correspond to values more than 10 m.s−1 per day or less than−10 m.s−1 per day. The zero wind line has been overlaid (thick solidcontour). The red lines indicate the isentropes 440-K and 675-K.
in quasi-horizontal mixing and irreversible tracer transport(McIntyre and Palmer, 1983, 1984).
Figure 4 shows E-P cross-sections computed usingECMWF ERA40 re-analyses; with arrows representing theE-P flux vectors (F ), and contours represent div (F ), av-eraged over the period 3–8 May (Fig. 4a) and 11-16 May
www.atmos-chem-phys.net/6/1927/2006/ Atmos. Chem. Phys., 6, 1927–1936, 2006

1934 N. Semane et al.: An unusual subtropical stratospheric ozone decrease
(Fig. 4b) and for the selected date of 15 May 2002 (Fig. 4c).Planetary-wave breaking is identified by the convergenceof the E-P flux (i.e. negative values in Fig. 4). Figure 4ashows enhanced wave activity in the troposphere for 3–8May, which has led to the increase of wave activity laterin the stratosphere. Indeed, the comparison between Figs.4a and 4b shows an increase in stratospheric wave activityduring the period from 11 to 16 May. In fact, strong up-ward wave propagation is located over high latitudes dur-ing that period of time (Fig. 4b). The E-P flux vectorsbend equatorward with height and generate a large regionof convergence over the subtropics in the stratosphere, wherethe wave driving reaches a minimum lower than−6 m.s−1.The wave activity is particularly strong on 15 May 2002(Fig. 4c) and is associated with a greater wave penetrationand an enhanced wave driving in the subtropical upper strato-sphere where the wave driving reaches a minimum lowerthan−10 m.s−1 per day. This analysis demonstrates that, byearly-winter 2002, planetary-wave activity has significantlyincreased during the mid-May period. It shows upward andequatorward planetary-wave propagation.
The southern stratospheric zonal circulation changed fromeasterlies to westerlies during the early winter of 2002, al-lowing the planetary waves to spread and bend equator-ward nearby the subtropics (as shown by EP-flux on Fig. 4).According to Newman and Nash (2005), the subtropicalzonal wind in the upper stratosphere in April 2002 (priorto any wave events) was anomalously easterly. Therefore,the anomalous easterlies in the mid-to-upper stratospherein April corroborated by a particular reversal to westerliesin early May, suggests that wave propagation was highlyanomalous during the early winter of 2002. The mecha-nism for this appears to be the dependence of planetary wavepropagation and breaking on the structure of the mean zonalwind (Brasseur et al., 1999). In fact, when the subtropicalwind is westerly, waves can propagate as far as toward theequator, and the surf zone is shifted to lower latitudes. Thus,the two anomalous features both in the zonal wind and inthe planetary-wave activity contribute to the increase in isen-tropic mixing over the subtropics by mid-May 2002. Thisis a result of mixing by planetary wave breaking in the surfzone.
Clearly, the early-winter dynamics of 2002 is directly re-sponsible for the unusual ozone reduction observed overIrene in mid-May 2002. The large-scale transport and mix-ing of polar air-masses explains the decrease of stratosphericozone over Irene and the strong negative deviations recordedin mid-May 2002 in Irene ozone profile when compared withthe 7-year (1999–2005) mean May profile. Indeed, the polarvortex in the early winter of 2002 was unusually disturbedso that enhanced planetary-wave activity easily eroded it intofilaments. This gave rise to large-scale transport of polar airtoward the subtropics in the middle stratosphere and con-tributed to the development of the low ozone episode of apurely dynamical origin over Irene in mid-May 2002.
5 Discussion and conclusion
In this paper, we investigated the ozonesonde dataset ob-tained at Irene, a South-African subtropical site operatingunder the SHADOZ project. The retrieved ozone concentra-tion profiles were supplemented by daily TOMS total ozonecolumns derived for the same location and covering the sameperiod, i.e., November 1998–May 2005.
A prominent ozone minimum has been reported in mid-May 2002 from the TOMS and ozonesonde datasets. Thecombination of these datasets suggests that the most signifi-cant contribution to the total ozone reduction is of dynamicalorigin and may be explained by low ozone concentrations ob-tained (1) at isentropic surfaces higher than 625 K in the mid-dle stratosphere and (2) at those between 400 K and 450 K inthe lower stratosphere. The absolute minimum of total O3(219 DU) was 30 DU (about 12%) less than the mean valuefor May.
It was found from MIMOSA APV-maps that the observedozone reduction over the subtropics (Irene) could be at-tributed to the transport of tropical and polar air masses. Thereversal to westerlies in the subtropics allows the planetarywaves (PWs) to propagate further to the equator, so that theycan break at the subtropical barrier. The propagation of thePWs can be seen in APV-maps in the middle stratosphere(polar tongue), whereas the breaking of PWs (see div (F ) inFig. 4) leads to erosion of the subtropical barrier.
The present study demonstrated that the early-winter dy-namics of 2002 was responsible for the unusual ozone re-duction over the subtropics through large-scale transport andmixing of tropical and polar air masses. In fact, the early-winter 2002 ozone minimum and its large extension up tothe subtropics represent an anomaly, which is connected tothe unprecedented state of the southern polar vortex distur-bances recorded during May 2002 and reported by Newmanand Nash (2005).
To summarize, a 8–12% decrease in total column of ozone,concomitant with low-ozone concentrations in the middlestratosphere at isentropic levels above 625 K and in the lowerstratosphere (400–450 K) observed over Irene in mid-May2002, is of dynamical origin. Indeed, it can be attributed re-spectively to ozone-poor air originally from the polar vortexand to ozone-poor air coming from tropics. This resulted inthe lowest ozone column recorded during the 7-years period(1998–2005). MIMOSA APV-maps representing the earlywinter 2002 period in the middle stratosphere highlighted anunusually high planetary-wave activity and a disturbed polarvortex with filament excursions and strong mixing up to thesubtropics in the middle stratosphere. In parallel, MIMOSAmodel simulated successfully the transport of a tropical poor-ozone air toward the subtropics in the lower stratosphere.
The exceptional presence of polar vortex air over the sub-tropics during May 2002 can be considered as the first signof the particular polar vortex disturbances, which after beingwell reinforced, contributed to the unprecedented behavior of
Atmos. Chem. Phys., 6, 1927–1936, 2006 www.atmos-chem-phys.net/6/1927/2006/

N. Semane et al.: An unusual subtropical stratospheric ozone decrease 1935
the Antarctic spring ozone hole observed during September2002.
Acknowledgements.The authors thank the editor H. Wernli andanonymous reviewers for very helpful reviews of an earlier ver-sion of this paper. Further, we are grateful to ECMWF for pro-viding the meteorological fields. The TOMS data were producedand provided by the NASA Ozone Processing Team at GoddardSpace Flight Center (http://toms.gsfc.nasa.gov/ozone). The ozonesoundings data were provided by the Southern Hemisphere Addi-tional Ozonesondes (SHADOZ) project (http://croc.gsfc.nasa.gov/shadoz).
The Laboratoire de l’Atmosphere et des Cyclones (LACy) is sup-ported by the French Centre National de la Recherche Scientifique(CNRS), the Institut National des Sciences de l’Univers (INSU), theConseil Regional de La Reunion and the European Community.
The present study is conjointly part of the SCOUT-O3 EuropeanProject and the 2005 French PNCA programme (ProgrammeNational de Chimie Atmospherique).
Edited by: H. Wernli
References
Andrews, D. G., Mahlman, J. D., and Sinclair, R. W.: Eliassen-Palm Diagnostics of Wave-Mean Flow Interaction in the GFDL“SKYHI” General Circulation Model, J. Atmos. Sci., 40(12),2768–2784, 1983.
Andrews, D. G., Holton, J. R., and Leovy, C. B.: Middle at-mosphere dynamics, International Geophysical Series, vol. 40,edited by: Dmowska, R. and Holton, J. R., Academic Press, SanDiego, CA, USA, 489 p., 1987.
Baray, J.-L., Ancellet, G., Taupin, V., Bessati, M., Baldy, S., andKeckhut, P.: Subtropical tropopause break as a possible strato-spheric source of ozone in the tropical troposphere, J. Atmos.Terr. Phys., 60 , 27–36, 1998.
Bencherif, H., Portafaix, T., Baray, J.-L., Morel, B., Baldy, S., Lev-eau, J., Hauchecorne, A., Keckhut, P., Moorgawa, A., Michaelis,M. M., and Diab, R.: LIDAR observations of lower strato-spheric aerosols over South Africa linked to large scale trans-port across the southern subtropical barrier, J. Atmos. Solar-Terrestrial Phys., 65(6), 707–715, 2003.
Brasseur, G. P., Orlando, J. J., and Tyndall, G. S.: AtmosphericChemistry and Global Change, Oxford University Press, NewYork, 1999.
Calisesi Y., Wernli H., and Kampfer, N.: Midstratospheric ozonevariability over Bern related to planetary wave activity during thewinters 1994–1995 to 1998–1999, J. Geophys. Res., 106(D8),7903–7916, 2001.
Eliassen, A., and Palm, E.: On the transfer of energy in stationarymountain waves, Geofys. Publ., 22, 1–23, 1961.
Godin, S., Marchand, M., Hauchecorne, A., and Lefevre,F.: Influence of Arctic polar ozone depletion on lowerstratospheric ozone amounts at Haute-Provence Observatory(43.92◦ N, 5.71◦ E), J. Geophys. Res., 107(D20), 8272,doi:10.1029/2001JD000516, 2002.
Hauchecorne, A., Godin, S., Marchand, M., Heese, B., andSouprayen, C.: Quantification of the transport of chemical con-
stituents from the polar vortex to midlatitudes in the lower strato-sphere using the high-resolution advection model MIMOSA andeffective diffusivity, J. Geophys. Res., 107(D20), 8289, doi:10.1029/2001JD000491, 2002.
Holton, J. R., Haynes, P. H., McIntyre, M. E., Douglass, A. R.,Rood, R. B., and Pfister, L.: Stratosphere troposphere exchange,Rev. Geophys., 33, 403–439, 1995.
Horinouchi, T., Sassi, F., and Boville, A.: Synoptic-scale waves andthe geographic distribution of lateral routes between the tropicsand the extratropics in the lower stratosphere, J. Geophys. Res.,105, 26 579–26 592, 2000.
Hoskins, B. J., McIntyre, M. E., and Robertson, A. W.: On the useand significance of isentropic potential vorticity maps, Q. J. Roy.Meteor. Soc., 111, 877–946, 1985.
Journal of the Atmospheric Sciences (JAS) Special Issue, Vol. 62,No. 3, p. 565–897, March 2005.
Kanzawa, H.: Four observed sudden stratospheric warmings diag-nosed by the Eliassen-Palm flux and refractive index, in: Dy-namics of the Middle Atmosphere, edited by: Holton, J. R. andMatsuno, T., Proceedings of a U.S.-Japan Seminar, Honolulu,Hawaii, 8–12 November, p. 307–331, 1982.
Koch, G., Wernli, H., Staehelin, J., and Peter, T.: A Lagrangiananalysis of stratospheric ozone variability and long-term trendsabove Payerne (Switzerland) during 1970-2001, J. Geophys.Res., 107(D19), 4373, doi:10.1029/2001JD001550, 2002.
Koch, G., Wernli, H., Schwierz, C., Staehelin, J., and Peter, T.: Acomposite study on the structure and formation of ozone mini-holes and minihighs over Central Europe, Geophys. Res. Lett.,32, L12810, doi:10.1029/2004GL022062, 2005.
Kruger, K., Naujokat, B., and Labitzke, K.: The unusual midwin-ter warming in the southern hemisphere stratosphere 2002: Acomparison to northern hemisphere phenomena, J. Atmos. Sci.,62(3), 603–613, 2005.
Marchand, M., Godin, S., Hauchecorne, A., Lefevre, F., Bekki, S.,and Chipperfield, M.: Influence of polar ozone loss on north-ern midlatitude regions estimated by a high-resolution chem-istry transport model during winter 1999/2000, J. Geophys. Res.,108(D5), 8326, doi:10.1029/2001JD000906, 2003.
McIntyre, M. E. and Palmer, T. N.: Breaking planetary waves in thestratosphere, Nature, 305, 593–600, 1983.
McIntyre, M.E. and Palmer, T.N.: The “surf zone” in the strato-sphere, J. Atmos. Solar-Terrestrial Phys., 46(9), 825–849, 1984.
Morel, B., Bencherif, H., Keckhut, P., Portataix, T., Hauchecorne,A., and Baldy, S.: Fine-scale study of a thick stratospheric ozonelamina at the edge of the southern subtropical barrier. Part II: Nu-merical simulations with coupled dynamics models, J. Geophys.Res., 110, D17101, doi:10.1029/2004JD005737, 2005.
Newman, P. A. and Nash, E. R.: The unusual Southern Hemi-sphere stratosphere winter of 2002, J. Atmos. Sci., 62(3), 614–628, 2005.
Portafaix, T., Morel, B., Bencherif, H., Baldy, S., Godin-Beekmann, S., and Hauchecorne, A.: Fine-scale study of athick stratospheric ozone lamina at the edge of the south-ern subtropical barrier, J. Geophys. Res., 108(D6), 4196,doi:10.1029/2002JD002741, 2003.
Riese, M., Franzen, A., Tie, X., and Offermann, D.: Tracer struc-tures in the southern hemispheric middle stratosphere observedby CRISTA-1, Adv. Space Res., 27, 10, 1623–1628, 2001.
Scaife, A. A., Swinbank, R., Jackson, D. R., Butchart, N., Thornton,
www.atmos-chem-phys.net/6/1927/2006/ Atmos. Chem. Phys., 6, 1927–1936, 2006
1936 N. Semane et al.: An unusual subtropical stratospheric ozone decrease
H., Keil, M., and Henderson, L.: Stratospheric vacillations andthe major warming over Antarctica in 2002, J. Atmos. Sci., 62(3),629–639, 2005.
Schoeberl, M. R.: Dynamics weaken the polar hole, Nature, 336,420–421, 1988.
Schoeberl, M. R., Lait, L. R., Newman, P. A., and Rosenfield, J.E.: The structure of the polar vortex, J. Geophys. Res., 97(D8),7859–7882, 1992.
Thompson, A. M., Witte, J. C., McPeters, R. D., Oltmans, S.J., Schmidlin, F. J., Logan, J. A., Fujiwara, M., Kirchhoff,V.W. J. H., Posny, F., Coetzee, G., Hoeger, B., Kawakami, S.,Ogawa, T., Johnson, B. J., Vomel, H., and Labow, G.: South-ern Hemisphere ADditional Ozonesondes (SHADOZ) 1998–2000 tropical ozone climatology. 1. Comparison with TOMS andground-based measurements, J. Geophys. Res., 108(D2), 8238,doi:10.1029/2001JD000967, 2003a.
Thompson, A. M., Witte, J. C., Oltmans, S. J., Schmidlin, F.J., Logan, J. A., Fujiwara, M., Kirchhoff, V.W. J. H., Posny,F., Coetzee, G., Hoeger, B., Kawakami, S., and Ogawa, T.:The 1998–2000 SHADOZ (Southern Hemisphere AdditionalOzonesondes) tropical ozone climatology. 2. Tropospheric vari-ability and the zonal wave-one, J. Geophys. Res., 108(D2), 8241,doi:10.1029/2002JD002241, 2003b.
Waugh, D. W.: Subtropical stratospheric mixing linked to distur-bances in the polar vortices, Nature, 365, 533–535, 1993.
World Meteorological Organization (WMO) Scientific Assessmentof Ozone Depletion: 2002, Global Ozone Research and Monitor-ing Project – Report No. 47, 498pp., Geneva, 2003.
Atmos. Chem. Phys., 6, 1927–1936, 2006 www.atmos-chem-phys.net/6/1927/2006/