An uncertainty parameter of historical earthquakes – the record threshold
12
Journal of Seismology 3: 351–362, 1999. © 1999 Kluwer Academic Publishers. Printed in the Netherlands. 351 An uncertainty parameter of historical earthquakes – the record threshold Rolf Gutdeutsch & Christa Hammerl Institute of Meteorology and Geophysics, University of Vienna, Althanstr. 14, A–1090 Vienna, Austria Received 30 June 1997; accepted in final form 20 January 1999 Key words: Carinthia, Friuli, historical earthquakes, perceptibility threshold, record threshold, seismicity, seismic scales Abstract In this study we use the term record threshold of a historical earthquake for the seismic intensity (EMS92) in an area where a given percentage P of the serial sources of places have recorded the event as been noticed there. The record threshold is understood as a limiting measure, below which warranted statements about the intensity cannot be given. P defines the acceptable uncertainty and can be chosen according to the demands of the special task, for instance, 10%. It is shown that the record threshold of historical earthquakes is not the same as the human perceptibility threshold of earthquakes of the 20th Century. The historical sources have to be selected using criteria such as completeness and homogenity of data. This demand is approximately met by inquiries for sources covering an area greater than the expected felt area of the historical earthquake.The Friuli event of 25 January 1348 is presented as an example. It is compared with the well known Friuli event of 6 May 1976 in order to calibrate its intensity. The record threshold of the 1348 event was probably IV or less than IV EMS92 for P =10%. The method, properly modified, can be applied to different cultural epochs and areas. This result throws a light on the possible error in determining the felt area of historical events. 1. Motivation After two decades of development of historical earth- quake research 1 the insight grows, that its resolution power in determining seismological parameters of his- torical events has a natural limit which is impossible to go beyond. This resolution power depends on the cultural epoch respective in which the event occurred, generally increasing towards the present, but it can vary with ups and downs. The generally recognized difficulty of the intensity estimation of historical earth- quakes is one aspect of this problem. It is due to unprecise and unreliable narrative sources, as well as to the incompleteness of information, typical of this kind of messages. The intensity of an earthquake was defined in this paper according to the MSK-scale (Medvedev– Sponheuer–Karník) (Sponheuer, 1965). The recently 1 In this text we will use the term ‘historical earthquake’ for events occured before the general installation of seismographic networks in Europe by 1900. elaborated European Seismological Scale EMS92 (Gruenthal, 1993) states clear definitions and rules on how to interpret the earlier MSK-scale. These rules, however, apply to contemporary earthquakes only. The EMS92 definitely regards historical earth- quakes as not being subjects to these rules. Instead, it gives some general guidelines of how to treat historical earthquake data. This study is focussed on questions related to the well-known incompleteness of historical earthquake data. If certain places in an area have narrative sources describing the earthquake, but other places in the same area do not, we have a special form of incompleteness. The more we have to rely on incomplete data, the more we are in danger of wrong interpretations. It would be a great help to have a quantitative measure to express this uncertainty. Hence the question: What is the prob- ability that a historical earthquake of a given intensity has been recorded by a contemporary writer?
Transcript of An uncertainty parameter of historical earthquakes – the record threshold

Journal of Seismology3: 351–362, 1999.© 1999Kluwer Academic Publishers. Printed in the Netherlands.
351
An uncertainty parameter of historical earthquakes – the record threshold
Rolf Gutdeutsch & Christa HammerlInstitute of Meteorology and Geophysics, University of Vienna, Althanstr. 14, A–1090 Vienna, Austria
Received 30 June 1997; accepted in final form 20 January 1999
Key words:Carinthia, Friuli, historical earthquakes, perceptibility threshold, record threshold, seismicity, seismicscales
Abstract
In this study we use the term record threshold of a historical earthquake for the seismic intensity (EMS92) in anarea where a given percentageP of the serial sources of places have recorded the event as been noticed there.The record threshold is understood as a limiting measure, below which warranted statements about the intensitycannot be given.P defines the acceptable uncertainty and can be chosen according to the demands of the specialtask, for instance, 10%. It is shown that the record threshold of historical earthquakes is not the same as thehuman perceptibility threshold of earthquakes of the 20th Century. The historical sources have to be selected usingcriteria such as completeness and homogenity of data. This demand is approximately met by inquiries for sourcescovering an area greater than the expected felt area of the historical earthquake.The Friuli event of 25 January 1348is presented as an example. It is compared with the well known Friuli event of 6 May 1976 in order to calibrateits intensity. The record threshold of the 1348 event was probably IV or less than IV EMS92 forP =10%. Themethod, properly modified, can be applied to different cultural epochs and areas. This result throws a light on thepossible error in determining the felt area of historical events.
1. Motivation
After two decades of development of historical earth-quake research1 the insight grows, that its resolutionpower in determining seismological parameters of his-torical events has a natural limit which is impossibleto go beyond. This resolution power depends on thecultural epoch respective in which the event occurred,generally increasing towards the present, but it canvary with ups and downs. The generally recognizeddifficulty of the intensity estimation of historical earth-quakes is one aspect of this problem. It is due tounprecise and unreliable narrative sources, as well asto the incompleteness of information, typical of thiskind of messages.
The intensity of an earthquake was defined inthis paper according to the MSK-scale (Medvedev–Sponheuer–Karník) (Sponheuer, 1965). The recently
1 In this text we will use the term ‘historical earthquake’ forevents occured before the general installation of seismographicnetworks in Europe by 1900.
elaborated European Seismological Scale EMS92(Gruenthal, 1993) states clear definitions and ruleson how to interpret the earlier MSK-scale. Theserules, however, apply to contemporary earthquakesonly. The EMS92 definitely regards historical earth-quakes as not being subjects to these rules. Instead, itgives some general guidelines of how to treat historicalearthquake data.
This study is focussed on questions related to thewell-known incompleteness of historical earthquakedata. If certain places in an area have narrative sourcesdescribing the earthquake, but other places in the samearea do not, we have a special form of incompleteness.The more we have to rely on incomplete data, the morewe are in danger of wrong interpretations. It would bea great help to have a quantitative measure to expressthis uncertainty. Hence the question: What is the prob-ability that a historical earthquake of a given intensityhas been recorded by a contemporary writer?
jose61.tex; 4/08/1999; 22:37; p.1
GSB/Prepr: JOSE 61 Pipsnr. 205989; Ordernr.: 702090-JM/DISK.WEB2C (josekap:bio2fam) v.1.1

352
Figure 1. Places, where the Verona earthquake of 3 January 1117 has been reported, after Boschi et al. (1995). The distribution does not includesources of type A and does not distinguish between sources of types B and C (see text). We have drawn a dashed line roughly enclosing thearea with reports.
2. The concept of therecord thresholdof historicalearthquakes
The problem shall be visualized with one example:On 31 January 1117, a great destructive earthquakestruck Verona, Venice and many places in North Italy.It was described in many towns throughout Europe.The CFT (Catalogo dei forti terremoti in Italia dal 461a. C. al 1980) (Boschi et al., 1995) associates it with
Imax = IX. It contains a comprehensive compilationof reports of this earthquake and refers to 85 placesin Europe, where the shock has been associated witheffects assigned withalphanumeric signs or intensit-ies (Boschi et al., 1995). These places taken from theCFT have been plotted in Figure 1. They cover an areaof approximately 3 000 000 km2. We have drawn adashed line enclosing the area with places mentionedin the CFT. Drawings like this one are sometimes used
jose61.tex; 4/08/1999; 22:37; p.2

353
when macroseismic data are poor. It helps the invest-igator to get a fast view of the affected area. But theopinions between seismologists about its value are notunanimous.
For good reasons it is difficult to decide, whetherit agrees with the felt area: Firstly, a catalogue – ingeneral – omits places, where the event hasnot beenmentioned by the investigated local source. This isa sound rule because it keeps the work in a definedframe. But if we want to determine the spatial in-tensity distribution of a historical event, we need justthese ‘not mentioning’ reports. Secondly, we have toobserve that the historical data come from sources ofdifferent value, for instance contemporary and non-contemporary texts. Many data have been taken fromserial sources2. These sources are regarded as reliable,but at many places they do not indicate clearly whetherthe message refers to the place of origin of the source,or to the place where it was annotated. Last but notleast, the CFT as well as other catalogues may con-tain interpretation and writing errors (see Alexandre,1990).
For our purpose it is enough to state, that earth-quake catalogues form an important starting point tolater investigators. But – for the reason stressed above– their importance is limited. That comes from the factthat the historical messages form an inhomogeneousand incomplete data set. It is up to the investigator touse them appropriately. It is not possible to determ-ine the felt area from historical data according to theEMS92 scale. Therefore, we prefer to use the termsrecording areafor historical earthquakes instead offeltarea.
The stronger the shaking of the earth, the greaterthe probability that one or more contemporaries foundit worth writing about. But not only the individualsensibility of a person against any kind of earth trem-bling makes him report about it. It is necessary thathe interprets the trembling as an earthquake. Anotheruncertain parameter is the motivation of the contem-porary to write. Many causes may play a role, but theyare important and dependent not only on the epochwhich shall not be discussed here in detail. It is im-portant to realize that the data related to historicalearthquakes do not follow from a systematical andexhaustive inquiry on the basis of questionnaires.
2 We use the termserial sourcesas a collection or series of ori-ginals or copies of texts, grouped not under the aspect of a specialobject or topics rather than the chronological ordering. Examplesof serial sources are, e.g., monastery or municipal annales andchronicles (Brandt, 1986).
As a first step we have to clearly distinguishbetween thephysical perceptibility thresholdof peopleliving in the 20th century and therecord thresholdof the writer who reports about a historical earth-quake. This difference is important to realize, becauseit contributes to intensity determination. We have goodreasons to assume, that the record threshold of histor-ical earthquakes of the 14th century was higher thanthe perceptibility threshold in the 20th century. Onecan expect that every historical earthquake has his ownrecord threshold, which defines a limiting level, belowwhich warranted statements about the intensity are nomore allowed. We feel that a parameter like this onecan be of great help for seismic hazard analysis. In thisstudy we will follow a precise way to find the recordthreshold of historical earthquakes. One of the basicfundamentals is the homogenity and completeness ofdata with respect to a defined property or criterium.
3. Definition of the record thresholdof historicalearthquakes
We regard the record threshold of a historical earth-quake as the minimum local shaking strength, whichmakes the contemporary writer at the place of theshaking report about it. If the writer knows about theearthquake only by news from other places, this wouldhave nothing to do with the respective place and hencewith the record threshold. Of course, the minimumlocal shaking strength has to be defined as a statist-ical measure. On the other hand it has to be relatedto an intensity level. In this study we use this term asfollows:
The record threshold of a historical earthquake isthe seismic intensity in a given isoseismal areawhere, say,P% of contemporary local sources ofthe same type have recorded the event as havingbeen noticed in this area.
P should be chosen with respect to the level of demandof the task for which the study is undertaken. For as-sessing the seismic hazard of highly populated areas,critical technical structures as nuclear power plantsetc.,P = 10% could be a good value. Of course, thisdefinition does not hold for earthquakes of the 20thcentury. Since 1900 the intensity of earthquakes aredetermined on the basis of complete and homogeneousinquiries by the national seismographic services. Thisstraightforward method has been developed with theaim to gain data having statistical relevance.
jose61.tex; 4/08/1999; 22:37; p.3

354
Figure 2. Theoretical example explaining the method of therecord threshold. In the first step a map of places is drawn,where the historical earthquake has been recorded (greatcircles) and places, where it has not been recorded by localsources (small circles). The isoseismals of the ‘modified com-parison earthquake’ have been added to the map of siteswhere the event has been recorded, in order to calibrate thehistorical event (see chapter 5.2). The distribution follows:
Intensity total number small circles great circles C
< VI 18 18 0 0%
VI 27 26 1 4%
VII 25 22 3 12%
VIII 9 7 2 ∼20%
IX 12 8 4 ∼30%
If the total number is< 10, C is given in rounded to integers often. In this theoretical example the record threshold is intensitybetween VI and VII.
Note, that the record threshold is related to aniso-seismal area.It is well known that the intensity isgiven by the mean value obtained from messages takenfrom several places inside this area. Theseismic in-tensityin this area is greater than the record thresholdif more thanP% of places recorded the event. If lessthan P% recorded it, the intensity is below the re-cord threshold. The method is sketched in Figure 2for P =10%: The figure represents the distribution
of places where the historical event has been noticed(great circles) and of places, where the event has notbeen mentioned (small circles). The intensity distribu-tion of the ‘comparison earthquake’ has been added tothe map of records. It ‘calibrates’ the historical event.In Chapter 5.2. we will discuss in detail the methodof comparison earthquakes. One can easily find bycounting the places where the event has been noticed,that the record threshold in this theoretical exampleis exceeded in the intensity VII area (3/25 = 12%)But in the area with intensity VI only 1/27∼4% ofplaces noticed the event, which is considerably below10%. Hence, the record threshold in this example isbetween VI and VII, possibly closer to VII than to VI.An accuracy problem becomes obvious: If the totalnumber of places in the area of a given intensity is toosmall, so that the 10% limit cannot be controlled, therecord threshold cannot be determined. But even thislimited information can be of importance for seismichazard estimations. The investigatedareamay includethe epicenter or not. A curiosity may happen: Eventhe epicentral intensity of a strong damaging historicalearthquake can drop below the record threshold. Thiscase may occur, if only one of a total of 11 inquiredplaces in the epicentral area give reports of a localeffect, say dropping of chimneys and tiles. One canconclude then, that the total of 11 places of sourcesinside the suspected epicentral zone was not suffi-ciant for identifying the earthquake as having beenrecorded. Here the concept of the record thresholdbecomes sound: The quantified poor confidence is ex-pressed by 1/11 = 0.09, thus 9%. This number doesnot touch a statement, whether the earthquake virtu-ally has happened. The only conclusion is that thedata are too poor for a seismological interpretation.This statement can be of fundamental importance inseismic hazard analysis.
Admittedly, this is an artifical example. But it visu-alizes the superiority of a quantified measure oversimple answers such as ‘probably yes’, ‘probablyno’ or ‘maybe’. The numerical value of the recordthreshold can be given only, if the data satisfy the basicconditions of completeness and homogeneity.
4. Demand for homogeneity and completeness ofthe data set
According to its statistical character the determinationof the record threshold requires a complete data set.
jose61.tex; 4/08/1999; 22:37; p.4

355
The study of Hammerl (1992) about the Friuliearthquake of 25 January 1348 applies tools of his-torical sciences in order to gain a data set of sourceswhich meet this demand as good as possible. Ob-viously, the demand for complete and homogeneousdata cannot be satisfied by historical sources in gen-eral. But if we restrict ourselves to a clearly definedkind of source material, much will be gained. We willnow interpret the applied historical methodology fromthe viewpoint of statistics: One aspect of complete-ness concerns the homogeneity of thegeographicaldistribution of data used, another one thetype ofsources.
(a) The homogeneity of the geographical distributionis controlled by the places, which the sources refer to.If these places are known, the degree of this inhomo-geneity can be seen directly by mapping. The inquiriesof sources have to be carried out in an area greaterthan the expected shattered area. This improves thechance to get a data set with geographical homogen-eity and completeness. In this case the area where theearthquake has been recorded, the recording area, isvisualized by simple mapping. We plot the places withdifferent symbols, 1. where the earthquake has beenreported according to the definition given above and2. those which do not meet this condition. The recordthreshold is exceeded inside the area where more than10% of the places are associated with messages of thefirst type. If the reported effects of the earthquake canbe associated with an intensity distribution, the recordthreshold is linked with that intensity, which is foundon the limiting line of the recording area.
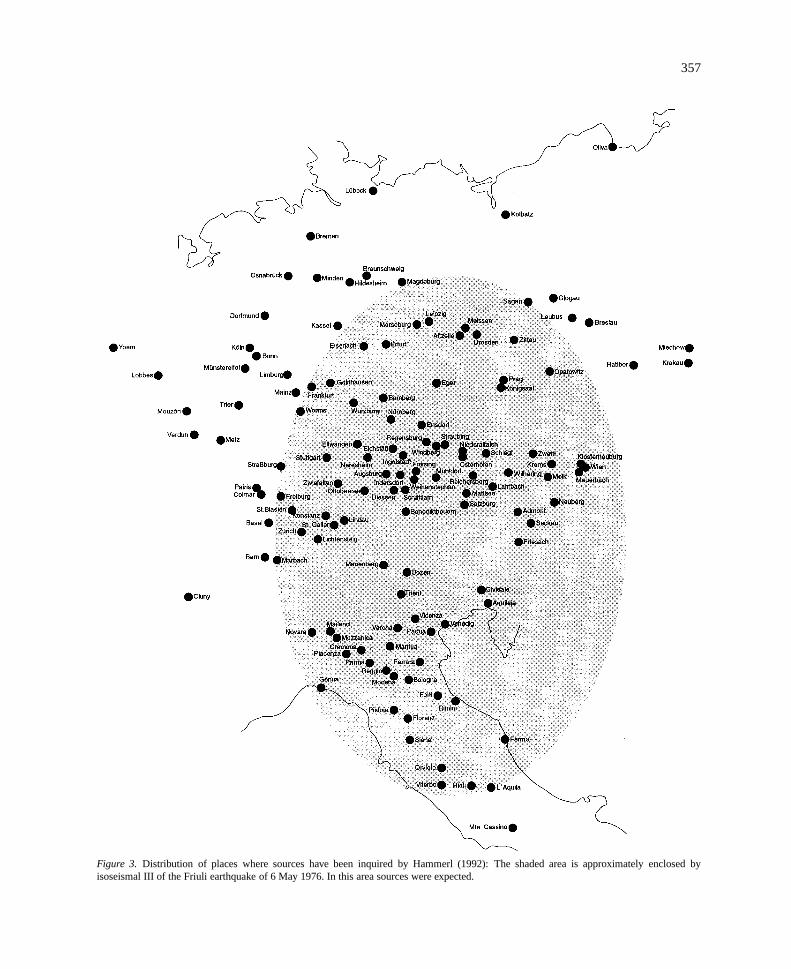
In Hammerl’s (1992) study the relation to theintensity has been performed as follows: it was pre-sumed that the 1348 event was not very different fromthe great destructive earthquake in Friuli on 6 May1976. Therefore, an area greater than the III-degreeisoseismal of that earthquake has been chosen, as itgives a rough idea of its extension. Inside this area acomplete data set has been compiled. Figure 4 showsthe places of serial sources inquired in the study byHammerl (1992). The problem of
(b) Homogeneity of source typecannot be solved so simply. The historical messagesof the middle ages are handed down by different typesof sources such as annals, chronicles, private and ad-ministrative letters, documents, inscriptions and more.Serial sources such as annals and chronicles of mon-asteries make up a special sort of basis material for
researchers, with advantages as follows: they covera given time span, and, in general the places, wherethey have been written down, are known. Many serialsources have been edited and published by histori-ans of later centuries, so that the data are availablein compiled form. Frequently these editions are sci-entifically of high quality. Finally, the advantage thatserial sources are available in libraries rather easily,should not be underestimated. All these criteria entitlethe serial sources as to be selected for our purpose.
We will confine the determination of the recordthreshold to serial sources.
5. The record threshold of the earthquake of 25January 1348
The historical Friuli earthquake of 25 January 1348caused lot of destruction and building damage in Friuliand Carinthia. The great number of sources referringto this event appears promising in order to apply to itthe method proposed in this study.
5.1. Classification of places with serial sources
We have divided the serial sources into three groups:(A) Places, where the inquired sources did not refer to
the earthquake.(B) Places, where the source mentions the earthquake,
but it is not clear enough, that it has been no-ticed just at the place. Example: The AnnalesParisienses (1335–1422) refer to Pairis/France andcontain the following text: “25. Jan. 1348: Annodomini 1348 factus est terre motus in Karinthea indie conversionis Pauli per totam terram, ab horavesperarum usque ad noctem 17 vicibus, ita quod17 castra per eundem terre motum ceciderunt, etcivitas, que vocatur Vilaco, cecidit, in qua perier-unt quinque milia hominum, et 25 ville submersesunt per predictum motum”, translated: “In 1348an earthquake in Carinthia on St. Paul’s conversionday affected the whole world, from the eveninghour until night for 17 times, where 17 castles weredestroyed by this earthquake, and a town, namedVillach, where five thousand people were killed,and 25 villages were destroyed by the earthquakementioned above. . .” (Hammerl, 1992). Pairisitself is not mentioned by this source.
(C) Places, where the source not only mentions theevent but also communicates directly or indirectlythat it has been noticed at this place. Example: In
jose61.tex; 4/08/1999; 22:37; p.5

356
the Chronicae S. Petri Erford. Cont.II the follow-ing sentence is found: “1348. Ian. 25. Eodem annoconversione sancti Pauli fuit terre motus magnusErfordie”, translated: “1348. On January 25 ofthis year on St. Paul’s conversion was a greatearthquake in Erfurt” (Hammerl, 1992).
The grouping, in principle, could be completed byplaces, where the writer definitely says that the earth-quake has not been noticed. This would be a truenegative message. Negative messages bear importantinformation for the application of the EMS92 scale.But such messages did not occur in our example.Therefore, we omit this group. The fact that negativemessages do not exist makes the difference betweenthe record threshold of a medieval earthquake andthe perceptibility threshold of earthquakes of the 20thcentury obvious.
An important evidence follows from sorting thesources into the groups A, B and C. If at least 10% ofplaces of an area can be associated with group C, thenthe record threshold was exceeded in that area. But thisstatement does not say too much without knowledgeof the intensity at the record threshold. In the next stepthe link between the record threshold and the intensitywill be performed.
Sources of type C taken from places given in Fig-ure 3 have been used for the interpretation. But a diffi-culty arose: the narrative texts describe the earthquakeeffects not precisely enough, so that an associationwith the EMS92 was not possible. In the presentedcase we decided to use an ordinal four-class systemJiwith i = 1, 2, 3, 4, which appropriatly fits the qualityof data (Gutdeutsch and Lenhardt, 1996)3 as follows:– J1 = I. Felt: corresponds to a general message
of the earthquake noticed at the place, where nodamage is reported
– J2 = II. Damage to buildings:corresponds to amessage, which expresses quite generally, thatdamage has occured at that place, without de-tails. We therefore suspect that the damage was notimpressive.
– J3 = III. Heavy building damage:General andundetailed notices of heavy damage (for instance‘The castle collapsed’). The description does notnecessarily mean complete collapse.
– J4 = IV. Total collapse: Message of a reliablewriter, that this has actually happened. The miss-ing information of the vulnerability class and dam-
3 We use the notationJ for the four-class system in order toavoid confusion with the intensityI of the EMS92.
Table 1.
4-class-system IntensityIij (EMS) and relative probabilitypiji Ji Ii,1 pi,1 Ii,2 pi,2 Ii,3 pi,3
1 I III 0.2 IV 0.4 V 0.4
2 II V 0.2 VI 0.4 VII 0.4
3 III VII 0.25 VIII 0.5 IX 0.25
4 IV IX 0.4 X 0.5 XI 0.1
age class make a broad range of intensities pos-sible for this class.
This wide-meshed scale has to be related to the intens-ity scale. The relation should take the uncertainty ofthe four-class-system into account. A simple 1:1 trans-lation from one into the intensity scale as a formula isnot possible, because the narrative sources have not thenecessary seismological resolution power. Thereforewe follow a concept similar to Rüttener’s (1995), whoinstead of a single but uncertain value of intensity con-siders a given probability distribution of intensities.We use the correspondence scheme in Table 1.
Herepij , with i = 1, 2, 3, 4 andj = 1, 2, 3 arethe relative a priori probabilities of intensityIi,j be-longing to theith cell of the four class systemJi . Thephilosopy behind this is that both the EMS92 and thefour-class system are ordinal scales. That is why thenotation in Roman letters is used forJi andIi,j . Theyare defined as integers and interpolation is not allowed.We make a reasonable assumption about the proba-bility distribution and use it instead of interpolation.Note, that the EMS92 scale overlaps the four-classsystem at
I1,3 = I2,1 = V, I2,3 = I3,1 = V II andI3,3 = I4,1 = IX.
The probability distribution of intensities in theEMS92 scale can easily be calculated fromJi . How-ever, the decision between two adjacent classes forJiwas sometimes difficult. Therefore, instead of simplyusing Ji an a priori probability distributionqk withk = 1, 2, 3 of the three class systemJi,k has beenintroduced as well (see Table 2). Then the respect-ive intensity distributions with probabilitiesrm have3 to 7 cellsIm. For example in Table 2 we find forArnoldstein
jose61.tex; 4/08/1999; 22:37; p.6
357
Figure 3. Distribution of places where sources have been inquired by Hammerl (1992): The shaded area is approximately enclosed byisoseismal III of the Friuli earthquake of 6 May 1976. In this area sources were expected.
jose61.tex; 4/08/1999; 22:37; p.7

358
Ji,1 = (II, III, IV), qk,1 = (0.5, 0.5, 0), hence herei = 2(omitted as subscript ofI)
r1 = q2p2,1 0.5∗0.2 = 0.1 I1 = Vr2 = q2p2,2 0.5∗0.4 = 0.2 I2 = VIr3 = q2p2,3 + q3p3,1 0.5∗0.4+0.5∗0.25 = 0.325 I3 = VIIr4 = = 0.25 I4 = VIIIr5 = = 0.125 I5 = IX
The message of Arnoldstein leads to a broad proba-bility distribution with 5 intensity cells. The uncer-tainty of the four-class-systemJ is transfered to theintensityI and makes clear how unsafe our historicalinformation actually is. Not only our reasonable as-sumptions but also our possible prejudice influence theweighting factorsqk and hence the intensity distribu-tion. Geographical coordinates,Jk andqk for all sitesk in our example are given in Table 2 (the first suffixof J andq has been omitted for simplicity reasons.
5.2. The comparison earthquake
In this study we will extend the idea of the com-parison earthquake (Hammerl, 1992) by introducingan analytical approach. The idea is to estimate theintensity distribution of the historical event by com-paring it with an earthquake of the 20th century whichoccured in the same area. One can say that the com-parison earthquake serves as a scale with which thehistorical earthquake is calibrated. The comparisonearthquake should be comparable to the historical one.This means that the differences of their focal paramet-ers should be so small, that slight extrapolation fromthe comparison- to the historical earthquake can beperformed using simple empirical relations4. The Fri-uli earthquake of 6 May 1976, withI0= X, h =5 km(after Giorgetti, 1976),λ0 = 13.22◦, φ0= 46.25◦ (afterISC, 1976) has been used. Its isoseismals (Giorgetti,1976) have been digitized in a two dimensional dataset of intensityI (1, A) as a function of epicentraldistance1 and azimuth A counted from the epicenter.The epicenter has been determined by a least square fitmethod similar to that developed in the investigation ofGutdeutsch and Lenhardt (1996) applied to the data ofHammerl (1992) in order to findλo andφo having thesmallest varianceσ 2 (Table 2).
σ 2 1N
N∑k=1
M(i)∑i=1
r(k)i (I
(k)comp− I (k)i )2, (1)
4 The method used by Papazachos et al. (1997) differs from oursas it makes use of empirical values of geometrical spreading andanelastic attenuation using data of 20th century earthquakes. Theyassume elliptical shapes of isomals.
with r(k)i = probability function of EMS92-intensity
I(k)i of thekth place withi = 1 to M; I (k)i = intensity
of the 1348 event, calculated from the distributionsTables 1 and 2;I (k)comp = intensity of the comparisonearthquake (Friuli, 1976) at thekth place;M = num-ber of weights of the intensity distribution;N = 46,number of places5.
The best fitting epicenter was found where
∂σ 2
∂λ0= ∂σ 2
∂φ0= 0. (2)
It has been shown that the historical epicenter of 1348was close to the that of 1976, but the error distribu-tion indicated that the focal depth was probably greater(Gutdeutsch and Lenhardt, 1996). Therefore, in a fur-ther step we took the focal depth into considerationand used the formula
I (k) = I0 − Cln(10){
αln
(√1+ 12
k
h2
)+ bh
(√1+ 12
k
h2
)}, (3)
with I (k) being the intensity dependent on epicentraldistance only.C =3 (after Sponheuer, 1960).
The least square fit has been carried out for vari-able focal depthsh, exponential decayb andα(h). Iohas been kept constant X (EMS92). Franke and Gut-deutsch (1974) estimated the geometrical spreadingfactor a from isoseismals of 48 East Alpine earth-quakes and found the empirical relation
a(h) = 0.992+ 0.0307h[km] for
3km≤ h ≤ 15km (4)
and maximum isoseismal radii of 250 km, wherebis a very small number. Under the sound assump-tion that this relation holds for the Southern Alps aswell, we made some computations with varying focaldepthsh hoping to minimise the mean errorsσ (h) =RMS(h), according to Equation (4). The result is givenin Table 3.
In this Tablem(h) is the mean value of O–Cdeviations
m(h) = 1N
N∑k=1
M(k)∑i=1
r(k)i (I (k) − I (k)i ) (5)
5 This number includes all kinds of contemporary sources, notonly serial sources.
jose61.tex; 4/08/1999; 22:37; p.8

359
Table 2.
k place latitude longitudeJ(i),j q(i),j
1 Aquileia 45.76 13.36 III, 0, 0, 1, 0, 0
2 Arnoldstein 46.55 13.73 II, III, 0, .5, .5, 0
3 Bologna 44.50 11.33 I, 0, 0, 1, 0, 0
4 Bolzano 46.50 11.35 II, III, 0, .5, .5, 0
5 Cividale 46.06 13.41 II, 0, 0, 1, 0, 0
6 Costozza 45.47 11.61 II, III, 0, .5, .5, 0
7 Erfurt 50.98 11.03 I, 0, 0, 1, 0, 0
8 Federaun 46.60 13.76 II, III, 0, .5, .5, 0
9 Feldkirchen 46.71 14.04 II, 0, 0, 1, 0, 0
10 Ferrara 44.83 11.61 I, 0, 0, 1, 0, 0
11 Flagogna 46.19 12.96 II,III, 0, .5, .5, 0
12 Freising 48.38 11.76 I, 0, 0, 1, 0, 0
13 Gemona 46.28 13.13 III 0, 0, 1, 0, 0
14 Hollenburg 46.46 14.26 II, III, IV, .25, .5,.25
15 Kellerberg 46.67 13.71 II, III, IV, .25, .5,.25
16 Krainburg 46.17 14.36 II, III, IV, .25, .5,.25
17 Krainegg 46.53 13.35 II, III, IV, .25, .5, .25
18 Liemberg 47.25 14.18 II, III, IV, .25, .5, .25
19 Mantova 45.15 10.8 I,II, 0, .5, .5, 0
20 Mozzanica 45.33 9.51 1, 0, 0, 1, 0, 0
21 Ortenburg 46.72 13.27 II, III, IV, .25, .5, .25
22 Ossiach 46.66 13.98 II, III, IV, .25, .5, .25
23 Osterberg 45.98 14.67 II, III, IV, .25, .5, .25
24 Padova 45.37 11.88 I, 0, 0, 1, 0, 0
25 Paluzza 46.52 13.05 II 0, 0, 1, 0, 0
26 Piacenza 45.05 9.7 I, 0, 0, 1, 0, 0
27 Pisa 43.72 10.4 I, 0, 0, 1, 0, 0
28 Ragogna 46.18 12.98 III, 0, 0, 1, 0, 0
29 Reifnitz 46.54 14.18 II, III, IV, .25, .5, .25
30 Rosegg 46.49 13.88 II, III, IV, .25, .5, .25
31 Sacile 45.95 12.5 III,IV, 0, .5, .5, 0
32 San Daniele 46.15 13.01 III, 0, 0, 1, 0, 0
33 Strassbourg 48.58 7.8 I 0, 0, 1, 0, 0
34 Straubing 48.88 12.71 I 0, 0, 1, 0, 0
35 Tolmezzo 46.4 13.01 III 0, 0, 1, 0, 0
36 Tolmin 46.18 13.73 II,III, 0, .5, .5, 0
37 Trento 46.06 11.11 II,III, 0, .5, .5, 0
38 Udine 46.06 13.23 III, 0, 0, 1, 0, 0
39 Venezia 45.43 12.33 III, 0, 0, 1, 0, 0
40 Venzone 46.33 13.13 III, 0, 0, 1, 0, 0
41 Verona 45.43 11 I, 0, 0, 1, 0, 0
42 Villach 46.6 13.83 III, 0, 0, 1, 0, 0
43 Waldenstein 46.88 14.66 II, III, IV, .25, .5,.25
44 Wallenberg 46.26 14.16 II, III, IV, .25, .5,.25
45 Wasserleonburg 46.55 13.5 II,III, 0, .5, .5, 0
46 Wildenstein 46.45 14.49 II, III, IV, .25, .5, .25
k = 1, . . . 46 = current number of place;J(i),j= intensitydistribution the ith element in the 4-class system withj = 3elements;q(i),j = a priori probability distribution ofJ(i) .
Table 3.
h(km) RMS(EMS) m(h)(EMS) λo φo
5 1.59 0.97 13.35 46.30
7.5 1.54 0.71 13.40 46.30
10 1.54 0.54 13.45 46.30
12.5 1.59 0.37 13.45 46.30
15 1.58 0.16 13.45 46.30
17.5 1.54 0.26 13.70 46.00
20 1.52 0.15 13.70 46.00
should be very small, after applying the least square fitapproximation.
This calculation uses 35 placesk with epicentraldistances less than 300 km. The RMS is high, dueto the low data quality. Its ranges between one andtwo degrees EMS. Note, that the mean valuem(h) de-creases with increasing focal depth and comes closeto zero ath = 15 km. At greater depths the calcula-tion gives unstable epicentral coordinates andm(h).Possibly relation (4) fails here. The data are so poorthat they do not allow a straightforward least squarefit approximation of parameterh. We should expectm(h) to be about zero. Thereforeh = 15 km is usedhere as the focal depth of our ‘modified comparisonearthquake’. The discussion, whether this value ofh
has a physical meaning, in particular whether it is themost probable focal depth of the 1348 event will beleft to a later study.
The next step consists in the calculation of the in-tensity distribution of the modified comparison earth-quake with the epicentre not far from Gemona earth-quake 1976, but withI0 = X, b = best fitted and focaldepth 15 km, which is different from that of the 1976eventhFriuli1976 = 5 km. Naturally, this step cannot betaken without sound assumptions.
We assume that Equation (4), derived for EastAlpine earthquakes, is valid for Southern Alpine earth-quakes as well. Under this assumption we can recon-struct the main part of the felt area of the modifiedcomparison earthquake.
In an earlier study the isoseismals of the 1976 eventhave been digitizes in a polar diagram with the epi-center as the center in azimuths A stepwise with1A= 30◦. (Gutdeutsch and Lenhardt, 1996). We usedEquations (2) and (3) for least square fits of segmentsdeliminated by two radiir with A + 30◦ and A –30◦in 30◦-steps of the azimuth A with respect to theepicenter. The distribution of sites with records of the
jose61.tex; 4/08/1999; 22:37; p.9

360
Table 4. Distribution of serial sources
NumberNk of sources of typek = A,B,C
Area of isoseismals NA NB NC NC/(NA+NB+NC)
between V◦ and VI◦ 3 7 6 ca. 40%
between IV◦ and V◦ 23 14 6 14%
< IV◦(incomplete) 36 12 2 4%
event of 1348 is very inhomogeneous, which makessmoothing of the data necessary. This provides partialoverlappings of areas with different values ofb, whichwe needed to calculate the best fitting intensity on thisr(A).
There is a gap of information in the area 60◦ <A <180◦. In the lack of better assumptions we usedinterpolated values ofb in Equation (3) between theradii with A = 60◦ and A = 180◦.
On the basis mentioned above the main part ofthe isoseismal field with intensity greater IV has beenreconstructed (Figure 4).
6. Results
Figure 4 shows a map with the isoseismals of the mod-ified comparison earthquake, derived from then 1976event withI0 = X, but with focal depthh = 15 kmthe best fitting epicenter. The original places of serialsources of the 1348 event have been inserted in theFigure. Inside the IV isoseismal we expect a completedata set of serial sources. If geographical gaps occur,they can be explained by inhomogeneous settlementdensity. Outside the IV isoseismal the data are notcomplete and conclusions from there have to be drawnunder this restriction. Counting the places inside andoutside the IV isoseismal yields Table 4.
The seismological interpreter finds himself in a di-lemma, when he discovers a source not mentioning theearthquake although the trembling should have beennoticed at the place of this source. Without any morebackground knowledge great reservation is advisable.The question arises whether information of this kindhas any seismological importance. Table 4 allows asignificant statement: if the intensity was between IVand V – which corresponds to a clearly perceptibletrembling – the probability is about 23/(23+14+6)≈50% that a serial source does not mention the earth-quake. Even in the area of stronger shaking withintensity between V and VI we come to a frequency
of 3/16≈ 20% that the event has not been recorded atall. But in the latter case the data set is too small fora significant statement. This unexpected result throwsa light on the sensitive problem of incompleteness ofhistorical data. We refer to the open question of thefelt areas of the 1117 earthquake discussed above. Therecommended method of complete data searching andthe comparison earthquake would probably lead toequivalent conclusions about the significance of theinvestigator’s presumption instead of simple yes/noanswers or vague suggestions.
There is no unanimous opinion among seismolo-gists about how to treat sources of type B which reportthe event but do not state that it has been felt at thatplace. Our investigation shows, that sources of thiskind occur in the area with intensity between IV andV with an unexpected high frequency of 28%.
Note, that approximately 20% of the sources in-side the area with intensity between V and VI are sovaluable that they can certainly be used as seismolo-gical information. This small percentage forces us tobe modest in our expectations.
Inside the area with intensity between IV and V14% of places have sources of type C, which meansthat the record threshold withP = 10% has beenslightly exceeded here. Table 4 shows 2% sources oftype C outside the IV-isoseismal, which is much lessthan the threshold level. Yet, one has to take intoaccount the possible incompleteness of data in thisarea.
With reservation in view of the incompleteness ofdata we conclude that according to the definition givenin section 3, the record threshold of the Friuli earth-quake of 25 January 1348 is almost IV. In the area withintensities less than IV the trustworthiness of conclu-sions defined by the levelP = 10% is not reached.Thus, isoseismals II and III cannot be warranted.
On the other hand, the perceptibiliy threshold ofearthquakes of the 20th century is of the order of in-tensity II. Of course, our result cannot be transferredsimply to other cultural epochs and areas. Anyway,the above result throws a light on possible misun-derstandings about the value of sources of differentkinds and consequently on the determination of thefelt area and the maximum intensity of historicalevents. The concept of the record threshold offers forhistorical earthquakes the equivalent to the percept-ibility threshold of earthquakes after introduction theintensity scales.
jose61.tex; 4/08/1999; 22:37; p.10

361
Figure 4. Reconstruction of isoseismals of the Friuli earthquake of 25 January 1348 based on the method of the comparison earthquake. Placeswith three kinds of sources A, B and C (see text) have been added.
jose61.tex; 4/08/1999; 22:37; p.11

362
7. Outlook
The method in this study has been developed for theFriuli earthquake of 25 January 1348 only. In otherepochs and areas other conditions may govern. Inmedieval times annals and chronicles of monaster-ies and municipal administrations are the main serialsources. Since the Enlightenment the importance ofnewspapers and journals increased. In modified formthe method can be applied to historical earthquakes ofdifferent epochs. But a good knowledge of the epoch isnecessary as a basis to find out, which kind of sourcesis suitable to obtain a homogeneous and complete dataset. Of course one needs a comparison earthquake.But in most cases it will be difficult to find a suitableone and one has to work with hypotheses. The recordthreshold is a parameter of statistical importance. Thisfact has to be kept in mind in view of many practicalproblems occurring in engineering seismology, whichcannot be answered by a simple Yes or No. We hopethat the concept of the record threshold can be of somehelp for seismic hazard analysis.
Acklowledgements
The authors are thankful to Dr Diethelm Kaiser (Han-nover), for critical reading the manuscript and for dis-cussions. They express their gratitude to Dr GottfriedGruenthal (GFZ Potsdam) Dr Wolfgang Lenhardt(Central Institute of Meteorology and Geodynamics,Vienna), Dr Roger Musson (British Geological Sur-vey, Edinburgh), and Dr Martin Steinwachs (Nieder-saechsisches Landesamt fuer Bodenforschung, Han-nover), for many helpful advices. The Austrian Na-tional Bank has supported this project by Grant Nr.6404 ‘Entwicklung der zeitgenössischen Aufzeich-nungsschwelle historischer Erdbeben am Beispiel vonKärnten’.
References
Alexandre, P., Les séismes en Europe occidentale de 394 à 1259Nouveau catalogue critique, Observatoire Royal de BelgiqueSérie Géophysique No Hors-Série, Bruxelles, 1990.
Annales Parisienses, August. In: Bernoulli (ed.), Basler Chroniken,edited by the Historische und Antiquarische Gesellschaft inBasel, V. 4 (Leipzig 1890), p. 376 f. (1335–1422).
Boschi, E., Ferrari, G., Gasperini, P., Guidoboni, E., Smriglio, G.and Valensise, G., 1995, Catalogo dei forti terremoti in Italia dal461 a. C. at 1980, CFT, Istituto Nazionale di Geofisica, SGAstoria geofisica ambiente, 00136 Bologna.
Brandt, A. v., 1958, Werkzeug des Historikers, p. 49ff.Continuatio Erfordensis. In: Monumenta Erphesfurtensia, hg.
Holder-Egger, Oswald (Hannover 1899)=MGH, SRG, Bd. 42(Hannover 1899), p. 394.
Franke, A. and Gutdeutsch. R., 1974, Makroseismische Ab-schätzungen von Herdparametern österreichischer Erdbeben ausden Jahren 1905–1973,J. Geophys.40, 173–188.
Giorgetti, F., 1976, Isoseismal map of the May 6, 1976 Friuliearthquake,Boll. Geof. Teor. Appl.72, V. XIX, 707–714.
Gruenthal, G. (ed.), 1993, EMS92 European Macroseismic Scale1992 (updated MSK-Scale 1992), European Seismological Com-misssion, Luxembourg.
Gutdeutsch, R. and Lenhardt, W., 1996, Reinterpretation of theSouth Alpine earthquake of January 25th 1348, extended ab-stract, XXV, General Assembly of the European SeismologicalCommission, Reykjavik, pp. 634–638.
Hammerl, Chr., 1992, Das Erdbeben vom 25. Jänner 1348, Disser-tation, Universität Wien.
ISC, Bulletin of the International Seismological Centre, Volume 13,Nr. 5, May, 1976.
Papazachos, B.C., Papanioannou, Ch.A., Papazachos, C.B. andSavvaidis, A.S., 1997, Atlas of isoseismal maps for strong shal-low earthquakes in Greece and surrounding area (426BC–1995),Publication Nr. 4, University of Thessaloniki, GeophysicalLaboratory.
Sponheuer, W., 1960, Methoden zur Herdtiefenbestimmung in derMakroseismik, Freiberger Forschungshefte C88, Akademiever-lag Berlin.
Sponheuer, W., 1965, Bericht über die Weiterentwicklung der seis-mischen Skala, Veröffentlichungen des Instituts für GeodynamikJena, Heft Nr. 8, Berlin.
Rüttener, E., 1995, Earthquake Hazard Evaluation for Switzerland,Schweizerischer Erdbebendienst.
jose61.tex; 4/08/1999; 22:37; p.12