An Investigation into the Influence of Experimental Conditions on In Vitro Drug Release from...
11
Research Article An Investigation into the Influence of Experimental Conditions on In Vitro Drug Release from Immediate-Release Tablets of Levothyroxine Sodium and Its Relation to Oral Bioavailability Ivana Kocic, 1,4 Irena Homsek, 1 Mirjana Dacevic, 1 Jelena Parojcic, 2 and Branislava Miljkovic 3 Received 5 July 2010; accepted 30 June 2011; published online 12 July 2011 Abstract. The aim of this study was to investigate the influence of experimental conditions on levothyroxine sodium release from two immediate-release tablet formulations which narrowly passed the standard requirements for bioequivalence studies. The in vivo study was conducted as randomised, single- dose, two-way cross-over pharmacokinetic study in 24 healthy subjects. The in vitro study was performed using various dissolution media, and obtained dissolution profiles were compared using the similarity factor value. Drug solubility in different media was also determined. The in vivo results showed narrowly passing bioequivalence. Considering that levothyroxine sodium is classified as Class III drug according to the Biopharmaceutics Classification System, drug bioavailability will be less sensitive to the variation in its dissolution characteristics and it can be assumed that the differences observed in vitro in some of investigated media probably do not have significant influence on the absorption process, as long as rapid and complete dissolution exists. The study results indicate that the current regulatory criteria for the value of similarity factor in comparative dissolution testing, as well as request for very rapid dissolution (more than 85% of drug dissolved in 15 min), are very restricted for immediate-release dosage forms containing highly soluble drug substance and need further investigation. The obtained results also add to the existing debate on the appropriateness of the current bioequivalence standards for levothyroxine sodium products. KEY WORDS: bioequivalence; dissolution; immediate release; levothyroxine sodium; solubility. INTRODUCTION Levothyroxine sodium (L-Na) is a drug used as the replacement therapy in primary hypothyroidism (1). It is commercially available from a number of sources, but ther- apeutic equivalence and interchangeability of various brands remain questionable even if bioequivalence is proven (2). One of the main obstacles for determining L-Na products bioequi- valence is that exogenous levothyroxine cannot be distin- guished from the endogenously produced hormone. Current European Medicines Agency guideline for drug bioequiva- lence studies states that for endogenous substances, the sampling schedule should allow characterization of the endog- enous baseline profile for each subject in each period (3). Often, a baseline is determined from two to three samples taken before the drug products are administered. The phar- macokinetic evaluation should be performed using baseline correction so that the calculated pharmacokinetic parameters refer to the additional concentrations provided by the treat- ment. Administration of supra-therapeutic doses can be considered in bioequivalence studies of endogenous drugs, provided that the dose is well tolerated, so that the exogenous concentrations over baseline provided by the treatment may be reliably determined. Rarely, baseline correction may not be needed if substantial increases over baseline endogenous levels are obtained (4). The Food and Drug Administration (FDA) issued the guidance for in vivo pharmacokinetic and bioavailability studies and in vitro dissolution testing of L-Na tablets in 2000 (5). However, the adequacy of the proposed bioequivalence standards for levothyroxine products has been discussed in a number of reports (6–8). The limitations refer to the fact that: (1) levothyroxine is endogenous substance and the administered drug is not the only source of the hormone measured; (2) its concentration is regulated by the dynamic feedback system via the hypothalamic–pituitary–thyroid gland axis; (3) lack of sensitivity of the analytical techniques available and (4) the need for high dose administration associated with the inherent risk for the development of adverse reactions. There are also reports indicating that therapeutic inequivalence of L-Na products resulted from an inadequate drug content and/or dissolution from the dosage form; it has been observed that the therapeutic failures resulting from the generic levothyroxine product administration were caused by its content being 25–30% less than that of labelled drug (9–11). Being an extremely low-dose drug, levothyroxine tablets were reported to exhibit lot-to-lot 1 Galenika ad, Batajnicki drum BB, Belgrade, Serbia. 2 Department of Pharmaceutical Technology, Faculty of Pharmacy, University of Belgrade, Belgrade, Serbia. 3 Department of Pharmacokinetics, Faculty of Pharmacy, University of Belgrade, Belgrade, Serbia. 4 To whom correspondence should be addressed. (e-mail: ivana_ [email protected]) AAPS PharmSciTech, Vol. 12, No. 3, September 2011 ( # 2011) DOI: 10.1208/s12249-011-9660-8 1530-9932/11/0300-0938/0 # 2011 American Association of Pharmaceutical Scientists 938
Transcript of An Investigation into the Influence of Experimental Conditions on In Vitro Drug Release from...
Research Article
An Investigation into the Influence of Experimental Conditions on In Vitro DrugRelease from Immediate-Release Tablets of Levothyroxine Sodiumand Its Relation to Oral Bioavailability
Ivana Kocic,1,4 Irena Homsek,1 Mirjana Dacevic,1 Jelena Parojcic,2 and Branislava Miljkovic3
Received 5 July 2010; accepted 30 June 2011; published online 12 July 2011
Abstract. The aim of this study was to investigate the influence of experimental conditions onlevothyroxine sodium release from two immediate-release tablet formulations which narrowly passed thestandard requirements for bioequivalence studies. The in vivo study was conducted as randomised, single-dose, two-way cross-over pharmacokinetic study in 24 healthy subjects. The in vitro study was performedusing various dissolutionmedia, and obtained dissolution profiles were compared using the similarity factorvalue. Drug solubility in different media was also determined. The in vivo results showed narrowly passingbioequivalence. Considering that levothyroxine sodium is classified as Class III drug according to theBiopharmaceutics Classification System, drug bioavailability will be less sensitive to the variation in itsdissolution characteristics and it can be assumed that the differences observed in vitro in some ofinvestigated media probably do not have significant influence on the absorption process, as long as rapidand complete dissolution exists. The study results indicate that the current regulatory criteria for the valueof similarity factor in comparative dissolution testing, as well as request for very rapid dissolution (morethan 85% of drug dissolved in 15 min), are very restricted for immediate-release dosage forms containinghighly soluble drug substance and need further investigation. The obtained results also add to the existingdebate on the appropriateness of the current bioequivalence standards for levothyroxine sodium products.
KEY WORDS: bioequivalence; dissolution; immediate release; levothyroxine sodium; solubility.
INTRODUCTION
Levothyroxine sodium (L-Na) is a drug used as thereplacement therapy in primary hypothyroidism (1). It iscommercially available from a number of sources, but ther-apeutic equivalence and interchangeability of various brandsremain questionable even if bioequivalence is proven (2). Oneof the main obstacles for determining L-Na products bioequi-valence is that exogenous levothyroxine cannot be distin-guished from the endogenously produced hormone. CurrentEuropean Medicines Agency guideline for drug bioequiva-lence studies states that for endogenous substances, thesampling schedule should allow characterization of the endog-enous baseline profile for each subject in each period (3).Often, a baseline is determined from two to three samplestaken before the drug products are administered. The phar-macokinetic evaluation should be performed using baselinecorrection so that the calculated pharmacokinetic parametersrefer to the additional concentrations provided by the treat-
ment. Administration of supra-therapeutic doses can beconsidered in bioequivalence studies of endogenous drugs,provided that the dose is well tolerated, so that the exogenousconcentrations over baseline provided by the treatment maybe reliably determined. Rarely, baseline correction may not beneeded if substantial increases over baseline endogenouslevels are obtained (4). The Food and Drug Administration(FDA) issued the guidance for in vivo pharmacokinetic andbioavailability studies and in vitro dissolution testing of L-Natablets in 2000 (5). However, the adequacy of the proposedbioequivalence standards for levothyroxine products has beendiscussed in a number of reports (6–8). The limitations refer tothe fact that: (1) levothyroxine is endogenous substance andthe administered drug is not the only source of the hormonemeasured; (2) its concentration is regulated by the dynamicfeedback system via the hypothalamic–pituitary–thyroid glandaxis; (3) lack of sensitivity of the analytical techniques availableand (4) the need for high dose administration associated withthe inherent risk for the development of adverse reactions.
There are also reports indicating that therapeuticinequivalence of L-Na products resulted from an inadequatedrug content and/or dissolution from the dosage form; it hasbeen observed that the therapeutic failures resulting fromthe generic levothyroxine product administration werecaused by its content being 25–30% less than that oflabelled drug (9–11). Being an extremely low-dose drug,levothyroxine tablets were reported to exhibit lot-to-lot
1 Galenika ad, Batajnicki drum BB, Belgrade, Serbia.2 Department of Pharmaceutical Technology, Faculty of Pharmacy,University of Belgrade, Belgrade, Serbia.
3 Department of Pharmacokinetics, Faculty of Pharmacy, Universityof Belgrade, Belgrade, Serbia.
4 To whom correspondence should be addressed. (e-mail: [email protected])
AAPS PharmSciTech, Vol. 12, No. 3, September 2011 (# 2011)DOI: 10.1208/s12249-011-9660-8
1530-9932/11/0300-0938/0 # 2011 American Association of Pharmaceutical Scientists 938
content variability because of poor homogenisation. Con-sequently, a more tightened potency range has been recentlyapproved by the FDA (12).
L-Na is an amphoteric molecule with three pKa values:2.2, 6.7 and 10.1 (13). Solubility of L-Na is pH dependent, andthe reported solubility of L-Na in water at 25°C is 0.15 mg/mL(14,15). There are no literature data for the pH-solubilityprofile of L-Na at 37°C in aqueous media important for theBiopharmaceutics Classification System (BCS) class determi-nation, but it can be found in several works that L-Na isclassified as Class III—high-solubility and low-permeabilitydrug (16,17). In accordance with the concept of the BCS,there are regulatory guidelines recommending that in certainsituations, similarity of in vitro dissolution profiles demon-strated in three different pH media could be used as the invitro surrogate for the in vivo bioequivalence testing of BCSClass I and Class III drugs (3,18,19). Thus, the use of reliableand discriminatory dissolution test is of major importance.Interestingly, shortly after the revision of bioequivalencerequirements, also the United States Pharmacopoeia (USP)dissolution specification for levothyroxine sodium tablets wasrevised in 2002: previously used USP phosphate buffer pH 7.4was substituted by 0.01MHClwith 0.2% sodium lauryl sulphate(SLS), and the recommended paddle rotation speed was alteredfrom 100 to 50 rpm (20,21). The USP 32 gives more flexiblerecommendations involving the use of both 50 and/or 75 rpmpaddle speed, 0.01 M HCl with or without surfactant and either500 or 900 mL media, depending on the drug dosage (22).
The aim of the present study was to evaluate the effect ofvarious experimental conditions on levothyroxine release fromtwo drug products which passed the standard requirements forthe bioequivalence study. In order to give an improvement inthe biopharmaceutical characterization of this drug, the pH-solubility profile of L-Na at 37°C, obtained in aqueous mediaover the pH range of 1.2–7.4 is also presented in this study.
MATERIALS AND METHODS
Materials
Two immediate-release tablet formulations, containing100 μg of L-Na, were evaluated throughout the study. Testformulation was Tivoral® tablets (Galenika ad., Serbia, batch2696, expiry date September 2011) and the referenceformulation was Euthyrox® tablets (Merck, Germany, batch5543502, expiry date December 2010). L-Na drug substancewas obtained from Peptido GmbH, Germany.
Drug release media and buffers for solubility determi-nation were prepared using potassium chloride (JT Baker,The Netherlands), hydrochloric acid (Merck), glacial aceticacid (Merck), potassium dihydrogenphosphate (JT Baker),sodium acetate (JT Baker), sodium hydroxide (Merck) andsodium lauryl sulphate (Sigma, USA). All chemicals used inHPLC analysis were analytical or HPLC reagent grade.
In Vivo Study
Patients and Study Design
The in vivo study was designed as an open-label,randomised, single-dose, two-way cross-over bioequivalence
study performed on 24 healthy subjects of both genders. Atotal of 22 subjects completed the study. Their ages rangedfrom 24 to 56 years (33.33±9.70; mean±SD) and their bodymass index from 19.53 to 33.46 kg/m2 (24.59±3.73; mean±SD). Two subjects decided not to continue the study due toheadache just after the drug administration in the first periodof the study. The study was performed in accordance with theprinciples enunciated in the Declaration of Helsinki(Edinburgh 2000) and the ICH harmonised tripartiteguideline regarding Good Clinical Practice (23). Theprotocol was approved by the Ethics Review Board. Allsubjects gave consent to participate in the study by signing theinformed consent form. In each period of the study, subjectswere housed from the 12-h pre-drug administration till the12-h blood sampling. The reference and the test drugs weregiven in a single oral dose of 600 μg (six 100 μg tablets),according to the randomization list, with the washout periodof 35 days. The tablets were given under fasting conditions,orally, with 240 mL of water. Blood samples were taken atthe following intervals: 30 min, 15 min and immediatelybefore dosing, 0.33, 0.67, 1, 1.33, 1.67, 2, 2.5, 3, 4, 6, 9, 12, 24and 48 h after dosing.
Analytical Method
The serum concentrations of levothyroxine and triiodo-thyronine were determined through the use of commercialchemiluminescent competitive immunoassay (Immulite 2000Total T4 and Immulite 2000 Total T3, Siemens MedicalSolutions Diagnostics, Los Angeles, CA, USA). The calibra-tion ranges for the measurement of levothyroxine andtriiodothyronine were 10 to 240 ng/mL and 0.4 to 6.0 ng/mL,respectively. The intra-assay coefficients of variation (CVs) fortwo levothyroxine quality control samples (theoretical con-centration of 82.4 and 124 ng/mL) were 4.2% and 8.0%,respectively. The corresponding inter-assay CVs were 5.0%and 5.5%. The intra-assay CVs for two triiodothyroninequality control samples (theoretical concentration of 1.6 and3.4 ng/mL) were 4.9% and 5.3%, respectively, while the inter-assay CVs were 5.6% and 6.9%. The analytical sensitivity forlevothyroxine was 3.0 ng/mL and for triiodothyronine was0.2 ng/mL.
Pharmacokinetic and Statistical Analysis
Pharmacokinetic analysis was performed according tothe requirements for bioequivalence studies (3). Differencesbetween the obtained and the pre-dose concentrations (theaverage value of the first three samples) for each subject,sampling time and formulation were used as a basis for thecalculations of the main pharmacokinetic parameters andstatistical analysis. As the level of levothyroxine started torise in about half of the subjects as a consequence of thephysiological response, the time limit for the analysis was 9 hpost-administration. The following parameters were derivedfrom the serum concentrations time profiles: the area underthe serum concentration vs. time curve up to sampling time(AUC0–t), the area under the serum concentration vs. timecurve to infinity (AUC0–∞), the maximum serum concentra-tion (Cmax), the time at which the maximum serum concen-tration is attained (Tmax), the half time of elimination (T1/2)
939Discriminatory Dissolution Testing: Levothyroxine
and the elimination rate constant (Kel). The Cmax and Tmax
were determined from the concentration–time profile. TheAUC0–t was calculated using the trapezoidal rule from point 0up to 9 h. The AUC0–∞ was calculated from the equation:AUC0–∞=AUC0–t+Cn/Kel, where Cn is the last serum sampleconcentration, and T1/2 was calculated from the equationT1/2=ln2/Kel. The bioavailability comparison was carriedout on AUC0–t, AUC0–∞ and Cmax (primary pharmacokineticparameters). The bioequivalence acceptance interval was set to80–125% as justified in the protocol of the study. The 90%confidence intervals (CI) for the ratio between drug formula-tions least squares means were derived from the analyses of thelog-transformed parameters AUC0–t, AUC0–∞ and Cmax. Allpharmacokinetic and statistical analyses were performed usingthe EquivTest 2.0 statistical programme.
Solubility Measurement
The solubility of L-Na was determined in USP hydrochloricacid buffer pH 1.2, USP acetate buffers pH 4.5 and pH 5.5 andUSP phosphate buffers pH 6.8 and pH 7.4. An excess of L-Nadrug substancewas added into 10mLof themedium in glass vials.The sealed vials were shaken continuously for 24 h in shakingwater bath (Haake, Germany) at 37±1°C and then stored for afurther 24 h without agitation. In each case, sediment on thebottom of the vial was observed and separated by centrifugation.The supernatants were filtered through the glass microfiber filters(Macherey-Nagel, Germany). The L-Na concentration in thesaturated solution was determined by HPLC analysis.
In Vitro Study
The dissolution tests were performed with both test andreference formulations that had been used in the bioequiva-lence study. The studies were conducted using rotating paddleand rotating basket method (Erweka DT 80, Germany). Thefollowing media were used: USP hydrochloric acid bufferpH 1.2, USP acetate buffer pH 4.5 and USP phosphate bufferpH 6.8. The medium volume used was 500 mL. The rotatingspeed was 100 rpm in the rotating basket apparatus, 50 rpmand 75 rpm in the rotating paddle apparatus. The influence ofagitation intensity was tested in pH 6.8 dissolution medium.The dissolution tests were also carried out according to the
USP 32 monograph for L-Na tablets (22), with 50 rpm rotatingpaddle apparatus and 500 mL of 0.01 M HCl with 0.2% SLSand according to the USP 24 monograph for L-Na tablets (20),with 100 rpm rotating paddle apparatus and 500 mL ofphosphate buffer pH 7.4. All tests were performed with 12tablets of each formulation, and the results presented here aretheir mean values. The 15.0-mL aliquots were withdrawn at 10,15, 20, 30, 45 and 60 min from the beginning of the tests andreplaced with the same volume of the fresh medium.
Analytical Method
The percent of L-Na dissolved in samples was deter-mined by HPLC analysis with an HP1100 chromatograph(Agilent Technologies, Palo Alto, CA, USA) equipped withHP1100 binary pump, UV–visible detector and autosampler.Data were acquired with Agilent Chemstation software. Thedeterminations were done on Zorbax SB-C18 analyticalcolumn (250×4.6 mm, macropore size 5 μm). The mobilephase was a mixture of 0.34% (m/v) tetrabutylammoniumhydrogen sulphate aqueous solution and acetonitrile, startingwith 35% of acetonitrile for the first 10 min and with the flowrate 1.0 mL/min and then increasing acetonitrile level to 70%till the end of analysis. The wavelength of the detector was setto 225 nm. The injection volume was 100 μL. The method waslinear over L-Na concentration range of 0.10–0.31 μg/mL, andthe coefficient of correlation was 0.995%. RSD values forintra-day and for inter-day precision were less than 2%.
The L-Na release profiles obtained in vitro in various testconditions were compared according to the similarity factorvalue (f2) (24).
RESULTS
In Vivo Study
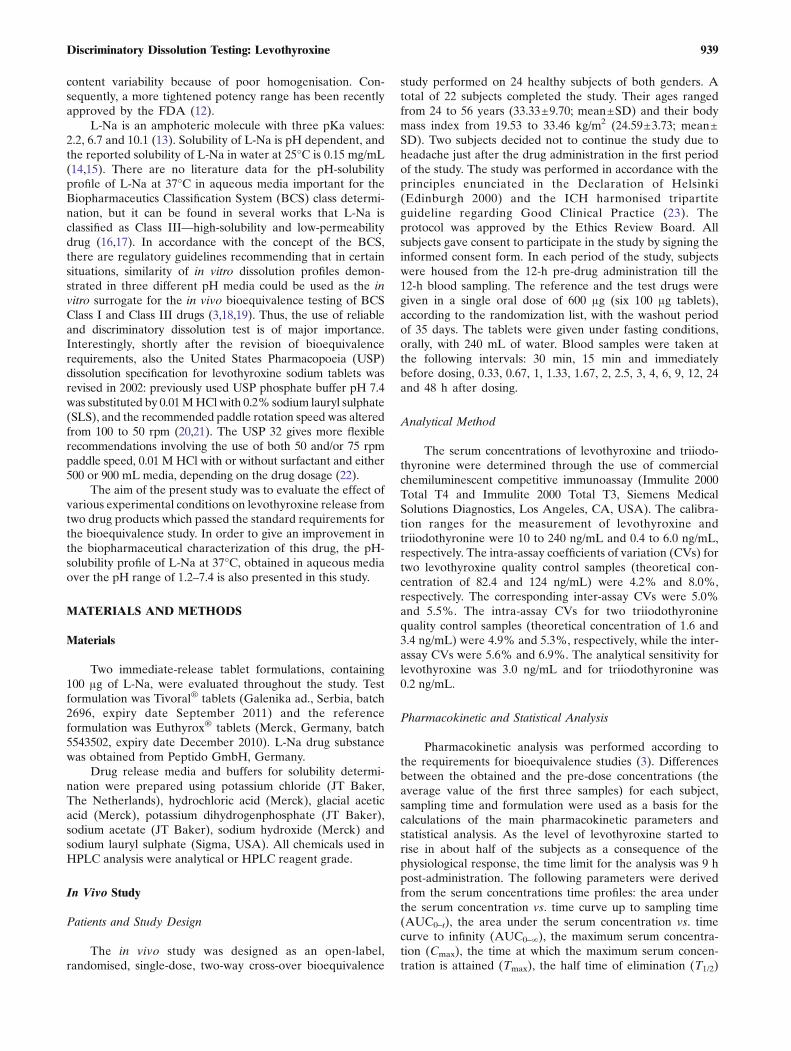
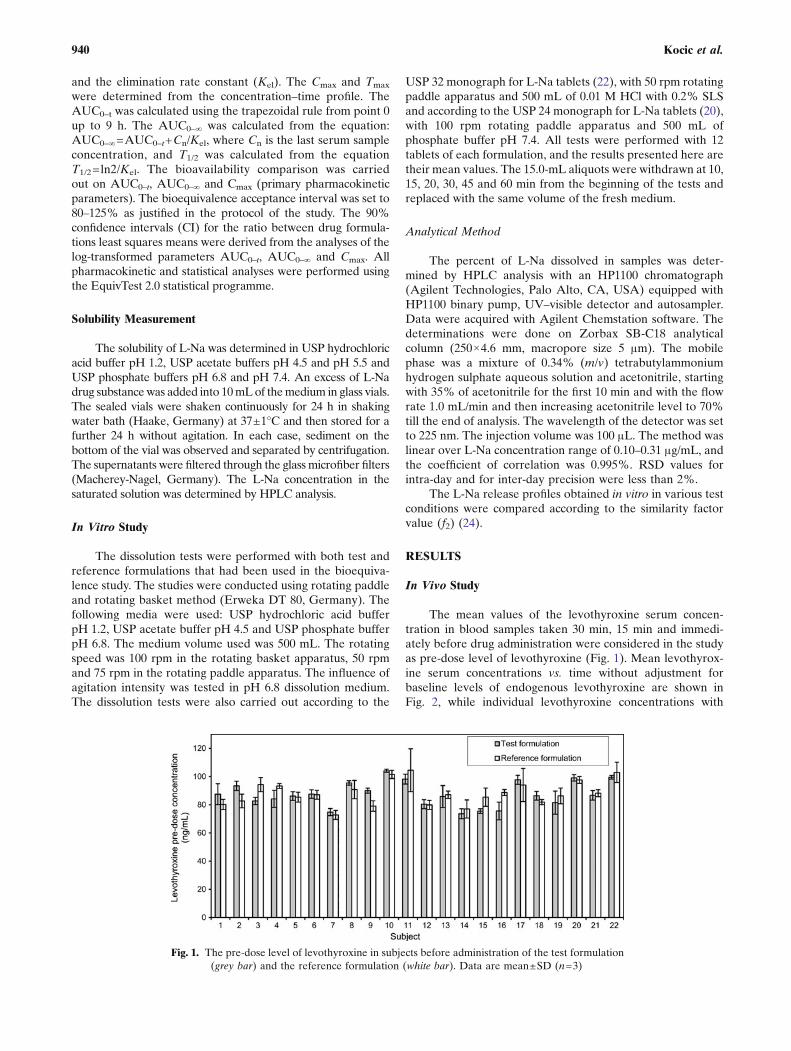
The mean values of the levothyroxine serum concen-tration in blood samples taken 30 min, 15 min and immedi-ately before drug administration were considered in the studyas pre-dose level of levothyroxine (Fig. 1). Mean levothyrox-ine serum concentrations vs. time without adjustment forbaseline levels of endogenous levothyroxine are shown inFig. 2, while individual levothyroxine concentrations with
Fig. 1. The pre-dose level of levothyroxine in subjects before administration of the test formulation(grey bar) and the reference formulation (white bar). Data are mean±SD (n=3)
940 Kocic et al.
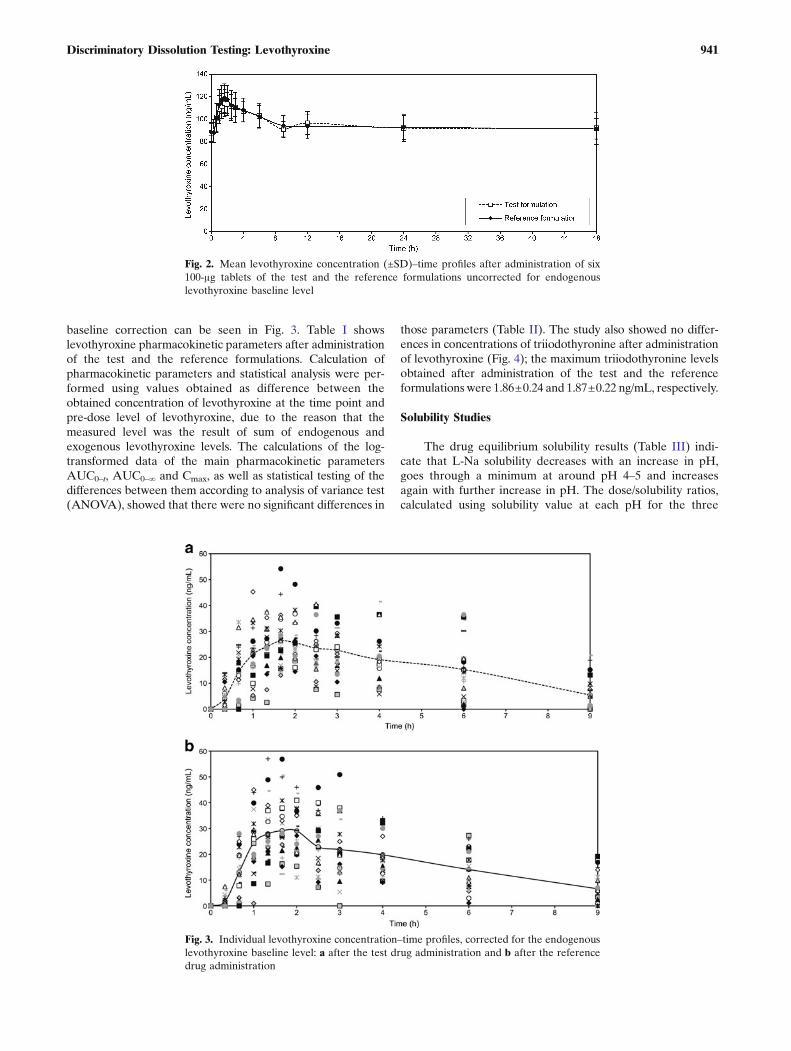
baseline correction can be seen in Fig. 3. Table I showslevothyroxine pharmacokinetic parameters after administrationof the test and the reference formulations. Calculation ofpharmacokinetic parameters and statistical analysis were per-formed using values obtained as difference between theobtained concentration of levothyroxine at the time point andpre-dose level of levothyroxine, due to the reason that themeasured level was the result of sum of endogenous andexogenous levothyroxine levels. The calculations of the log-transformed data of the main pharmacokinetic parametersAUC0–t, AUC0–∞ and Cmax, as well as statistical testing of thedifferences between them according to analysis of variance test(ANOVA), showed that there were no significant differences in
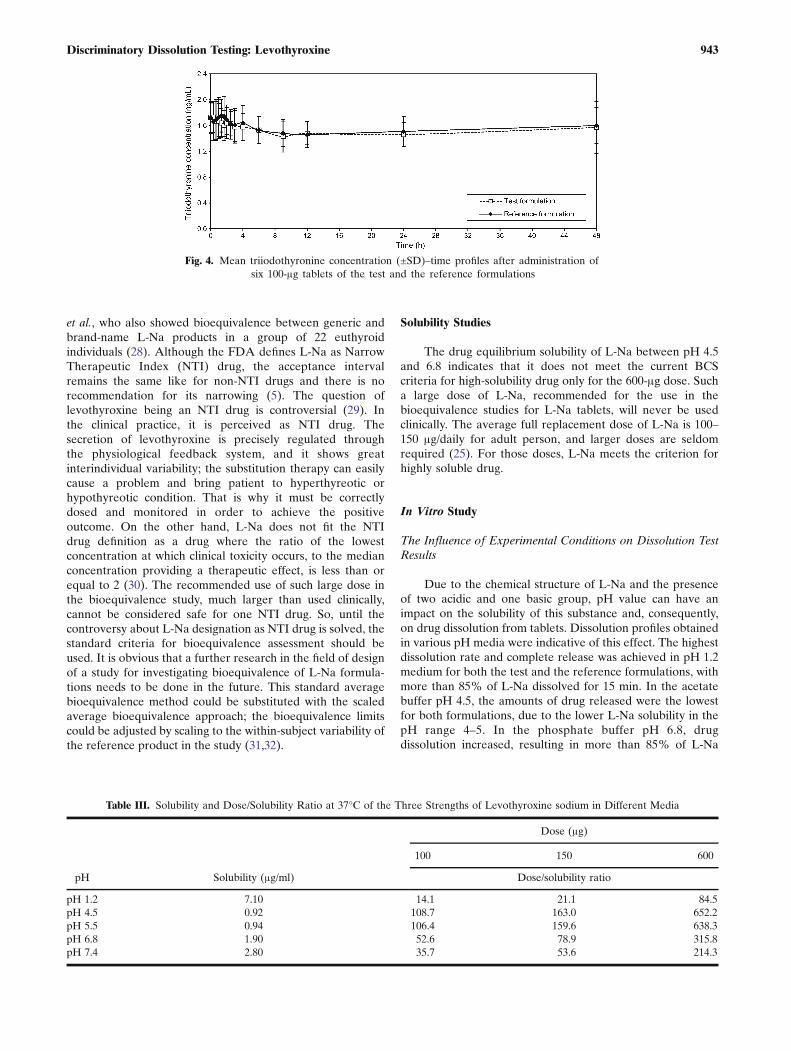
those parameters (Table II). The study also showed no differ-ences in concentrations of triiodothyronine after administrationof levothyroxine (Fig. 4); the maximum triiodothyronine levelsobtained after administration of the test and the referenceformulations were 1.86±0.24 and 1.87±0.22 ng/mL, respectively.
Solubility Studies
The drug equilibrium solubility results (Table III) indi-cate that L-Na solubility decreases with an increase in pH,goes through a minimum at around pH 4–5 and increasesagain with further increase in pH. The dose/solubility ratios,calculated using solubility value at each pH for the three
Fig. 2. Mean levothyroxine concentration (±SD)–time profiles after administration of six100-μg tablets of the test and the reference formulations uncorrected for endogenouslevothyroxine baseline level
Fig. 3. Individual levothyroxine concentration–time profiles, corrected for the endogenouslevothyroxine baseline level: a after the test drug administration and b after the referencedrug administration
941Discriminatory Dissolution Testing: Levothyroxine
doses of L-Na, show that L-Na fails to meet the dose/solubility ratio criterion of below 250 ml for drug substanceto be classified as highly soluble only for the 600 μg dosebetween pH 4.5 and pH 6.8 (3,18).
In Vitro Study
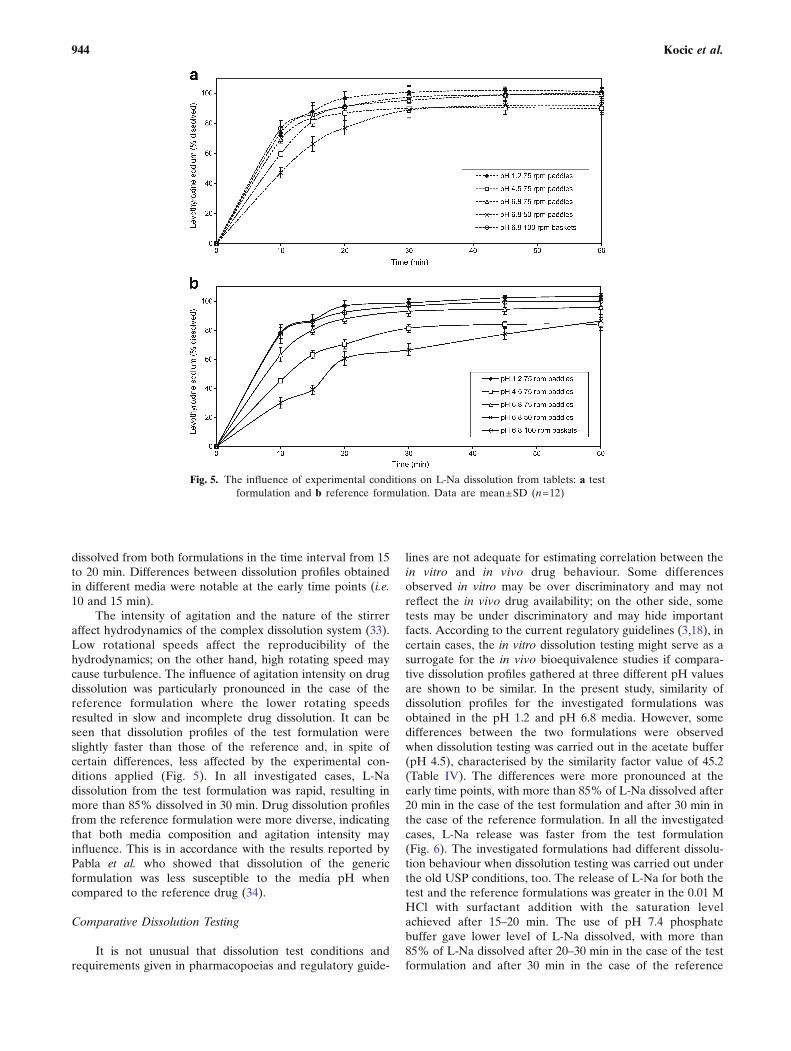
The dissolution profiles of the investigated formulationsobtained under various experimental conditions are pre-sented in Fig. 5a, b. For both drug formulations, the fastestdissolution was obtained in pH 1.2 medium, using the rotatingpaddle apparatus at 75 rpm. The slowest drug dissolution wasobserved in the phosphate buffer pH 6.8, using the rotatingpaddle apparatus at 50 rpm. Comparative dissolution data forthe test and the reference formulations in media with differentpH values, as well as under the compendially recommendedexperimental conditions given in the USP 24 (old method) andin the USP 32 (new method), are given in Figs. 6 and 7.Relevant similarity factor (f2) values are given in Table IV.
DISCUSSION
In Vivo Study
This bioequivalence study was conducted in accordancewith the current bioequivalence guidelines (3,5). After oraladministration of both formulations under fasting conditions,levothyroxine underwent rapid absorption from the gastro-intestinal tract. The highest concentration both for the testand the reference formulations was observed in the majorityof subjects 1.66 h after administration. The activation of thestrong physiological feedback system which regulates thesecretion of the endogenous levothyroxine was seen about 9 hafter drug administration: levothyroxine values began to rise.Therefore, in the pharmacokinetic and statistical analysis,only first 9 h was taken into account because only during this
time period, the levels of levothyroxine corresponded to theadministered formulation (Fig. 3). The serum concentrationsof triiodothyronine, the main active metabolite of levothyr-oxine (25), after administration of the test formulation werecomparable to those obtained after administration of thereference product and did not show significant statisticaldifferences. Taking into consideration the baseline level oflevothyroxine in the pharmacokinetic and statistical analysisand correcting the observed values with its pre-dose level arediscussed by many authors (4,6,26). The endogenous levels oflevothyroxine in our subjects were variable and higher thanpresented in the bioequivalence study of Di Girolamo et al.(26). The closer the baseline level to the total concentrationof levothyroxine, the greater its influence on the estimation ofbioequivalence. The relatively high baseline level of levothyr-oxine observed in our study could cover the differencesbetween studied formulations, so correcting for baselineimproved the sensitivity of bioequivalence assessment. Even-tually, it might be possible to explore by means of populationpharmacokinetics the influence of the baseline level oflevothyroxine on the kinetic parameters in order to choosesubjects with lower, but still physiological, endogenous levels.This will also result with fewer adverse reactions. The FDA-recommended dose of 600 μg for levothyroxine bioequiva-lence studies is much higher than therapeutic dose, but it isrecommended due to the opinion that lower doses, withrelatively high baseline levels, result in greater variation anddifficulties in proving bioequivalence (4). The observed Cmax
values in our study were similar to those presented in otherbioequivalence studies for L-Na tablets (26,27). The 90% CIfor the log-transformed main pharmacokinetic parameterspassed the standard requirements for bioequivalence studies,but it was on the lower limit of acceptability for AUC0–t andAUC0–∞. The bioequivalence was demonstrated in 22 healthysubjects (two subjects did not complete the study), which isin accordance with the previously published report by Dong
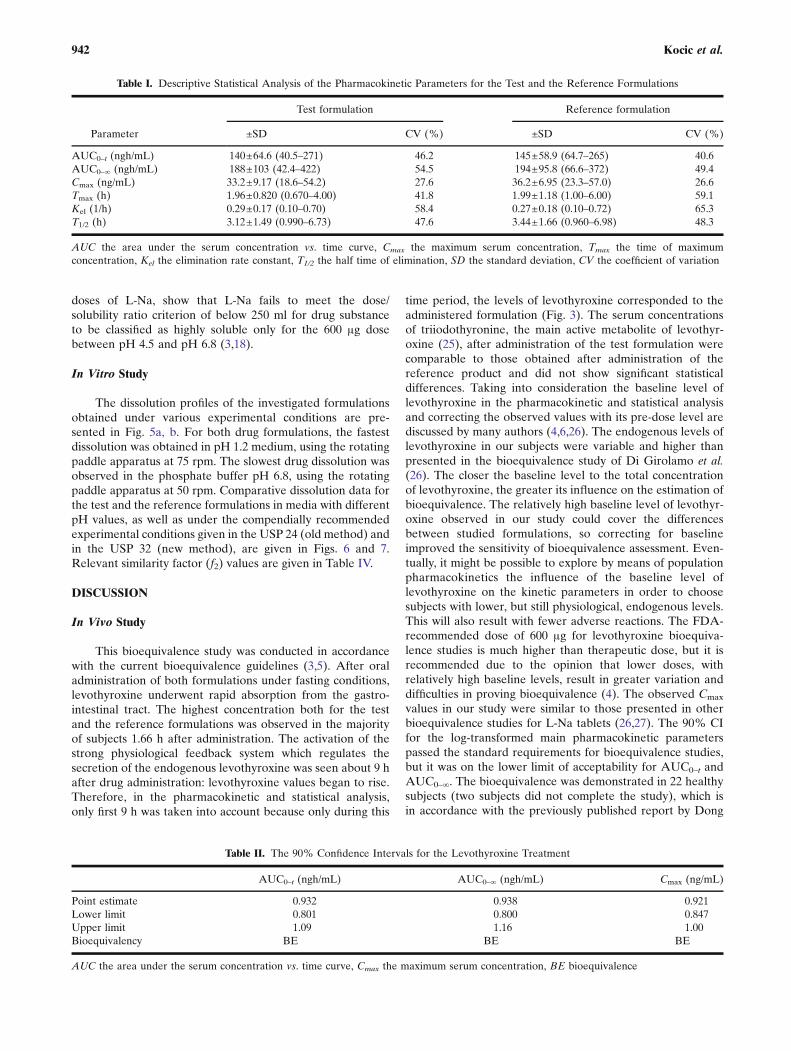
Table I. Descriptive Statistical Analysis of the Pharmacokinetic Parameters for the Test and the Reference Formulations
Parameter
Test formulation Reference formulation
±SD CV (%) ±SD CV (%)
AUC0–t (ngh/mL) 140±64.6 (40.5–271) 46.2 145±58.9 (64.7–265) 40.6AUC0–∞ (ngh/mL) 188±103 (42.4–422) 54.5 194±95.8 (66.6–372) 49.4Cmax (ng/mL) 33.2±9.17 (18.6–54.2) 27.6 36.2±6.95 (23.3–57.0) 26.6Tmax (h) 1.96±0.820 (0.670–4.00) 41.8 1.99±1.18 (1.00–6.00) 59.1Kel (1/h) 0.29±0.17 (0.10–0.70) 58.4 0.27±0.18 (0.10–0.72) 65.3T1/2 (h) 3.12±1.49 (0.990–6.73) 47.6 3.44±1.66 (0.960–6.98) 48.3
AUC the area under the serum concentration vs. time curve, Cmax the maximum serum concentration, Tmax the time of maximumconcentration, Kel the elimination rate constant, T1/2 the half time of elimination, SD the standard deviation, CV the coefficient of variation
Table II. The 90% Confidence Intervals for the Levothyroxine Treatment
AUC0–t (ngh/mL) AUC0–∞ (ngh/mL) Cmax (ng/mL)
Point estimate 0.932 0.938 0.921Lower limit 0.801 0.800 0.847Upper limit 1.09 1.16 1.00Bioequivalency BE BE BE
AUC the area under the serum concentration vs. time curve, Cmax the maximum serum concentration, BE bioequivalence
942 Kocic et al.
et al., who also showed bioequivalence between generic andbrand-name L-Na products in a group of 22 euthyroidindividuals (28). Although the FDA defines L-Na as NarrowTherapeutic Index (NTI) drug, the acceptance intervalremains the same like for non-NTI drugs and there is norecommendation for its narrowing (5). The question oflevothyroxine being an NTI drug is controversial (29). Inthe clinical practice, it is perceived as NTI drug. Thesecretion of levothyroxine is precisely regulated throughthe physiological feedback system, and it shows greatinterindividual variability; the substitution therapy can easilycause a problem and bring patient to hyperthyreotic orhypothyreotic condition. That is why it must be correctlydosed and monitored in order to achieve the positiveoutcome. On the other hand, L-Na does not fit the NTIdrug definition as a drug where the ratio of the lowestconcentration at which clinical toxicity occurs, to the medianconcentration providing a therapeutic effect, is less than orequal to 2 (30). The recommended use of such large dose inthe bioequivalence study, much larger than used clinically,cannot be considered safe for one NTI drug. So, until thecontroversy about L-Na designation as NTI drug is solved, thestandard criteria for bioequivalence assessment should beused. It is obvious that a further research in the field of designof a study for investigating bioequivalence of L-Na formula-tions needs to be done in the future. This standard averagebioequivalence method could be substituted with the scaledaverage bioequivalence approach; the bioequivalence limitscould be adjusted by scaling to the within-subject variability ofthe reference product in the study (31,32).
Solubility Studies
The drug equilibrium solubility of L-Na between pH 4.5and 6.8 indicates that it does not meet the current BCScriteria for high-solubility drug only for the 600-μg dose. Sucha large dose of L-Na, recommended for the use in thebioequivalence studies for L-Na tablets, will never be usedclinically. The average full replacement dose of L-Na is 100–150 μg/daily for adult person, and larger doses are seldomrequired (25). For those doses, L-Na meets the criterion forhighly soluble drug.
In Vitro Study
The Influence of Experimental Conditions on Dissolution TestResults
Due to the chemical structure of L-Na and the presenceof two acidic and one basic group, pH value can have animpact on the solubility of this substance and, consequently,on drug dissolution from tablets. Dissolution profiles obtainedin various pH media were indicative of this effect. The highestdissolution rate and complete release was achieved in pH 1.2medium for both the test and the reference formulations, withmore than 85% of L-Na dissolved for 15 min. In the acetatebuffer pH 4.5, the amounts of drug released were the lowestfor both formulations, due to the lower L-Na solubility in thepH range 4–5. In the phosphate buffer pH 6.8, drugdissolution increased, resulting in more than 85% of L-Na
Fig. 4. Mean triiodothyronine concentration (±SD)–time profiles after administration ofsix 100-μg tablets of the test and the reference formulations
Table III. Solubility and Dose/Solubility Ratio at 37°C of the Three Strengths of Levothyroxine sodium in Different Media
pH Solubility (μg/ml)
Dose (μg)
100 150 600
Dose/solubility ratio
pH 1.2 7.10 14.1 21.1 84.5pH 4.5 0.92 108.7 163.0 652.2pH 5.5 0.94 106.4 159.6 638.3pH 6.8 1.90 52.6 78.9 315.8pH 7.4 2.80 35.7 53.6 214.3
943Discriminatory Dissolution Testing: Levothyroxine
dissolved from both formulations in the time interval from 15to 20 min. Differences between dissolution profiles obtainedin different media were notable at the early time points (i.e.10 and 15 min).
The intensity of agitation and the nature of the stirreraffect hydrodynamics of the complex dissolution system (33).Low rotational speeds affect the reproducibility of thehydrodynamics; on the other hand, high rotating speed maycause turbulence. The influence of agitation intensity on drugdissolution was particularly pronounced in the case of thereference formulation where the lower rotating speedsresulted in slow and incomplete drug dissolution. It can beseen that dissolution profiles of the test formulation wereslightly faster than those of the reference and, in spite ofcertain differences, less affected by the experimental con-ditions applied (Fig. 5). In all investigated cases, L-Nadissolution from the test formulation was rapid, resulting inmore than 85% dissolved in 30 min. Drug dissolution profilesfrom the reference formulation were more diverse, indicatingthat both media composition and agitation intensity mayinfluence. This is in accordance with the results reported byPabla et al. who showed that dissolution of the genericformulation was less susceptible to the media pH whencompared to the reference drug (34).
Comparative Dissolution Testing
It is not unusual that dissolution test conditions andrequirements given in pharmacopoeias and regulatory guide-
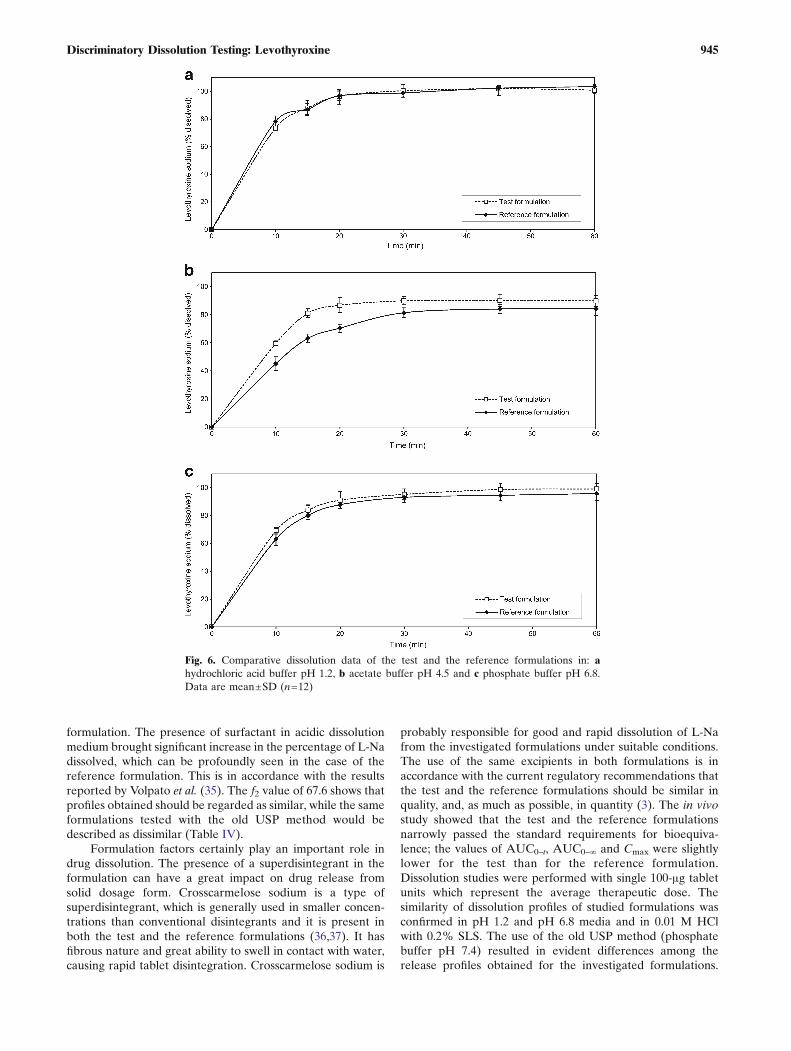
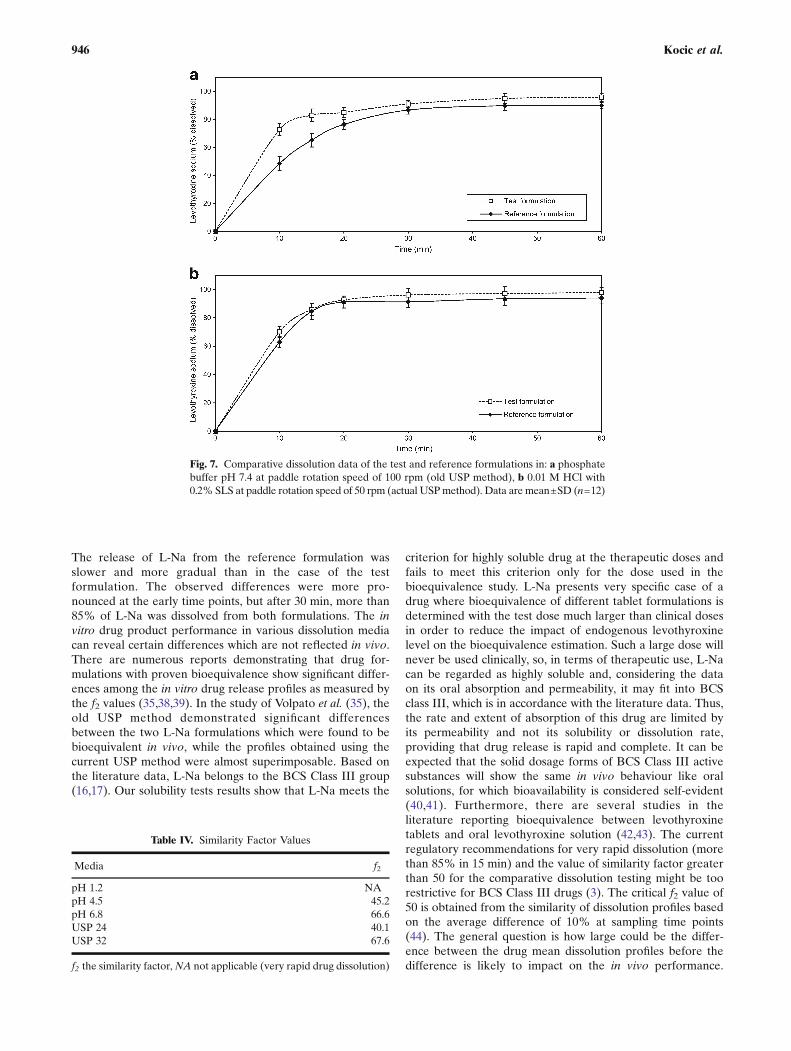
lines are not adequate for estimating correlation between thein vitro and in vivo drug behaviour. Some differencesobserved in vitro may be over discriminatory and may notreflect the in vivo drug availability; on the other side, sometests may be under discriminatory and may hide importantfacts. According to the current regulatory guidelines (3,18), incertain cases, the in vitro dissolution testing might serve as asurrogate for the in vivo bioequivalence studies if compara-tive dissolution profiles gathered at three different pH valuesare shown to be similar. In the present study, similarity ofdissolution profiles for the investigated formulations wasobtained in the pH 1.2 and pH 6.8 media. However, somedifferences between the two formulations were observedwhen dissolution testing was carried out in the acetate buffer(pH 4.5), characterised by the similarity factor value of 45.2(Table IV). The differences were more pronounced at theearly time points, with more than 85% of L-Na dissolved after20 min in the case of the test formulation and after 30 min inthe case of the reference formulation. In all the investigatedcases, L-Na release was faster from the test formulation(Fig. 6). The investigated formulations had different dissolu-tion behaviour when dissolution testing was carried out underthe old USP conditions, too. The release of L-Na for both thetest and the reference formulations was greater in the 0.01 MHCl with surfactant addition with the saturation levelachieved after 15–20 min. The use of pH 7.4 phosphatebuffer gave lower level of L-Na dissolved, with more than85% of L-Na dissolved after 20–30 min in the case of the testformulation and after 30 min in the case of the reference
Fig. 5. The influence of experimental conditions on L-Na dissolution from tablets: a testformulation and b reference formulation. Data are mean±SD (n=12)
944 Kocic et al.
formulation. The presence of surfactant in acidic dissolutionmedium brought significant increase in the percentage of L-Nadissolved, which can be profoundly seen in the case of thereference formulation. This is in accordance with the resultsreported by Volpato et al. (35). The f2 value of 67.6 shows thatprofiles obtained should be regarded as similar, while the sameformulations tested with the old USP method would bedescribed as dissimilar (Table IV).
Formulation factors certainly play an important role indrug dissolution. The presence of a superdisintegrant in theformulation can have a great impact on drug release fromsolid dosage form. Crosscarmelose sodium is a type ofsuperdisintegrant, which is generally used in smaller concen-trations than conventional disintegrants and it is present inboth the test and the reference formulations (36,37). It hasfibrous nature and great ability to swell in contact with water,causing rapid tablet disintegration. Crosscarmelose sodium is
probably responsible for good and rapid dissolution of L-Nafrom the investigated formulations under suitable conditions.The use of the same excipients in both formulations is inaccordance with the current regulatory recommendations thatthe test and the reference formulations should be similar inquality, and, as much as possible, in quantity (3). The in vivostudy showed that the test and the reference formulationsnarrowly passed the standard requirements for bioequiva-lence; the values of AUC0–t, AUC0–∞ and Cmax were slightlylower for the test than for the reference formulation.Dissolution studies were performed with single 100-μg tabletunits which represent the average therapeutic dose. Thesimilarity of dissolution profiles of studied formulations wasconfirmed in pH 1.2 and pH 6.8 media and in 0.01 M HClwith 0.2% SLS. The use of the old USP method (phosphatebuffer pH 7.4) resulted in evident differences among therelease profiles obtained for the investigated formulations.
Fig. 6. Comparative dissolution data of the test and the reference formulations in: ahydrochloric acid buffer pH 1.2, b acetate buffer pH 4.5 and c phosphate buffer pH 6.8.Data are mean±SD (n=12)
945Discriminatory Dissolution Testing: Levothyroxine
The release of L-Na from the reference formulation wasslower and more gradual than in the case of the testformulation. The observed differences were more pro-nounced at the early time points, but after 30 min, more than85% of L-Na was dissolved from both formulations. The invitro drug product performance in various dissolution mediacan reveal certain differences which are not reflected in vivo.There are numerous reports demonstrating that drug for-mulations with proven bioequivalence show significant differ-ences among the in vitro drug release profiles as measured bythe f2 values (35,38,39). In the study of Volpato et al. (35), theold USP method demonstrated significant differencesbetween the two L-Na formulations which were found to bebioequivalent in vivo, while the profiles obtained using thecurrent USP method were almost superimposable. Based onthe literature data, L-Na belongs to the BCS Class III group(16,17). Our solubility tests results show that L-Na meets the
criterion for highly soluble drug at the therapeutic doses andfails to meet this criterion only for the dose used in thebioequivalence study. L-Na presents very specific case of adrug where bioequivalence of different tablet formulations isdetermined with the test dose much larger than clinical dosesin order to reduce the impact of endogenous levothyroxinelevel on the bioequivalence estimation. Such a large dose willnever be used clinically, so, in terms of therapeutic use, L-Nacan be regarded as highly soluble and, considering the dataon its oral absorption and permeability, it may fit into BCSclass III, which is in accordance with the literature data. Thus,the rate and extent of absorption of this drug are limited byits permeability and not its solubility or dissolution rate,providing that drug release is rapid and complete. It can beexpected that the solid dosage forms of BCS Class III activesubstances will show the same in vivo behaviour like oralsolutions, for which bioavailability is considered self-evident(40,41). Furthermore, there are several studies in theliterature reporting bioequivalence between levothyroxinetablets and oral levothyroxine solution (42,43). The currentregulatory recommendations for very rapid dissolution (morethan 85% in 15 min) and the value of similarity factor greaterthan 50 for the comparative dissolution testing might be toorestrictive for BCS Class III drugs (3). The critical f2 value of50 is obtained from the similarity of dissolution profiles basedon the average difference of 10% at sampling time points(44). The general question is how large could be the differ-ence between the drug mean dissolution profiles before thedifference is likely to impact on the in vivo performance.
Fig. 7. Comparative dissolution data of the test and reference formulations in: a phosphatebuffer pH 7.4 at paddle rotation speed of 100 rpm (old USP method), b 0.01 M HCl with0.2% SLS at paddle rotation speed of 50 rpm (actual USPmethod). Data are mean±SD (n=12)
Table IV. Similarity Factor Values
Media f2
pH 1.2 NApH 4.5 45.2pH 6.8 66.6USP 24 40.1USP 32 67.6
f2 the similarity factor,NA not applicable (very rapid drug dissolution)
946 Kocic et al.
Considering that L-Na is BCS Class III high-solubility andlow-permeability drug, it is probable that small differencesobserved in the in vitro drug release do not have significantlinkage to the in vivo performance, providing that drugrelease is sufficiently rapid. Considering that all calculated f2values were greater than 40, opportunity might therefore existto utilise less restrictive criteria in assessing the similaritybetween formulations. Our results raise the debate on thevalidity of using current f2 criteria for the comparativedissolution testing of rapidly dissolving immediate-releasedosage forms. Substantial additional data will however needto be gathered for a range of drugs and formulations beforethe reality of this opportunity can truly be assessed.
CONCLUSION
The test formulation met the standard regulatory criteriafor bioequivalence to the reference formulation when thebioequivalence study was conducted according to the currentguidelines, although the results narrowly passed bioequivalencelimits. On the in vitro side, both drug products exhibited rapiddrug dissolution under the majority of experimental conditionsstudied. Drug dissolution from the test formulation was lesssusceptible to the effect of experimental conditions whencompared to the reference formulation. The investigated drugproducts were shown to be similar under the experimentalconditions currently recommended by the USP, as well as in thepH 1.2 and pH 6.8 dissolution media, while the differencesbetween products were observed in the acetate buffer pH 4.5and under the old USP experimental conditions. The resultsobtained indicate that the current regulatory recommendationsfor very rapid dissolution (more than 85% of drug dissolved in15min) and the f2 value greater than 50may be too restrictive forbiowaiver application in the case of immediate-release dosageforms containing highly soluble drug substance and need to beadditionally discussed. The results of this study also contribute tothe existing debate on the appropriateness of the currentbioequivalence standards for levothyroxine sodium products.
ACKNOWLEDGEMENTS
This study was conducted as a part of the projects (OI175023 and TR 23015) funded by the Ministry of Science andTechnological Development, Republic of Serbia.
REFERENCES
1. Green WL. New questions regarding bioequivalence of levothyr-oxine preparations: a clinician’s response. AAPS J. 2005;7:E54–8.
2. Hennessey JV. Levothyroxine dosage and the limitations ofcurrent bioequivalence standards. Nat Clin Pract EndocrinolMetab. 2006;2:474–5.
3. European Medicines Agency. Guideline on the investigation ofbioequivalence. CPMP/EWP/QWP/1401/98. Rev.1, January2010. London: European Medicines Agency; 2010.
4. Bolton S. Bioequivalence studies for levothyroxine. AAPS J.2005;7:E47–53.
5. FDA. Guidance for industry: levothyroxine sodium tablets—invivo pharmacokinetic and bioavailability studies and in vitrodissolution testing. U.S. Department of Health and HumanServices, CDER/FDA; 2000.
6. Blakesley VA. Current methodology to assess bioequivalence oflevothyroxine sodium products is inadequate. AAPS J. 2005;7:E42–6.
7. Baskin HJ, Cobin RH, Duick DS, Gharib H, Guttler RB, KaplanMM, et al. American Association of Clinical Endocrinologistsmedical guidelines for clinical practice for the evaluation andtreatment of hyperthyroidism and hypothyroidism. Endocr Pract.2002;8:457–69.
8. Eisenberg M, Distefano JJ. TSH-based protocol, tablet insta-bility, and absorption effects on L-T4 bioequivalence. Thyroid.2009;19:103–10.
9. Sawin CT, Susks MI, London M, Ranganathan C, Larsen PR.Oral thyroxine: variation in biological action and tablet content.Ann Intern Med. 1984;100:641–5.
10. Dong BJ, Brown CH. Hypothyroidism resulting from testlevothyroxinefailure. J Am Board Fam Pract. 1991;4:167–70.
11. Copeland PM. Two cases of therapeutic failure associated withlevothyroxine brand interchange.AnnPharmacother. 1995;29:482–5.
12. FDA: Levothyroxine sodium product information. http://www.fda.gov/Drugs/DrugSafety/PostmarketDrugSafetyInformationforPa-tientsandProviders/ucm161257.htm (2010). Accessed 24 Apr 2010
13. Pierres C, Gaugain-Hamidi A: Concentrated liquid thyroid hor-mone composition, US Patent application number: 20090270507.http://www.faqs.org/patents/app/20090270507 (2010). Accessed 13May 2010.
14. Won CM. Kinetics of degradation of levothyroxine in aqueoussolution and in solid state. Pharm Res. 1992;9:131–7.
15. Budavari S. The Merck Index. 13th ed. Whitehouse Station:Merck&Co; 2001. p. 1678.
16. Lindenberg M, Kopp S, Dressman JB. Classification of orallyadministered drugs on the World Health Organization model listof essential medicines according to the Biopharmaceutics Clas-sification System. Eur J Pharm Biopharm. 2004;58:265–78.
17. Pabla D, Akhlaghi F, Zia H. Intestinal permeability enhancementof levothyroxine sodium by straight chain fatty acids studied inMDCK epithelial cell line. Eur J Pharm Sci. 2010;40:466–72.
18. FDA. Guidance for industry: waiver of in vivo bioavailability andbioequivalence studies for immediate-release solid oral dosageforms based on a Biopharmaceutics Classification System. U.S.Department of Health and Human Services, CDER/FDA; 2003.
19. FDA. Guidance for industry: dissolution testing of immediaterelease solid oral dosage forms. U.S. Department of Health andHuman Services, CDER/FDA; 2003.
20. USP 24. The United States Pharmacopoeia 24th ed. Rockville:The United States Pharmacopoeial Convention, Inc; 2000, p. 969.
21. USP 25. The United States Pharmacopoeia. 25th ed. Rockville: TheUnited States Pharmacopoeial Convention, Inc; 2002, p. 1002.
22. USP 32. The United States Pharmacopoeia. 32nd ed. Rockville:The United States Pharmacopoeial Convention, Inc; 2003,p. 2779.
23. ICH. Note for guidance on good clinical practice. CPMP/ICH/135/95; 2002.
24. Moore JW, Flanner HH. Mathematical comparison of curveswith an emphasis on in vitro release profiles. Pharm Tech.1996;20:64–74.
25. Sweetman S, editor. Martindale: the extra pharmacopoeia. 36thed. London: The Pharmaceutical Press; 2009. p. 2171–4.
26. Di Girolamo G, Keller GA, de Los Santos AR, Schere D,Gonzalez CD. Bioequivalence of two levothyroxine tabletformulations without and with mathematical adjustment forbasal thyroxine levels in healthy Argentinian volunteers: asingle-dose, randomized, open-label, crossover study. ClinicalTher. 2008;30:2015–23.
27. Yannovits N, Zintzaras E, Pouli A, Koukoulis G, Lyberi S, SavariE, et al. A bioequivalence study of levothyroxine tablets versusan oral levothyroxine solution in healthy volunteers. Eur J DrugMetab Pharmacokinet. 2006;31:73–8.
28. Dong BJ, Hauck WW, Gambertoglio JG, Gee L, White JR,Bubp JL, et al. Bioequivalence of generic and brand-namelevothyroxine products in the treatment of hypothyroidism.JAMA. 1997;277:1205–13.
29. Health Canada: Expert Advisory Committee on Bioavailability.Record of proceedings. April 16, 2003. http://www.hc-sc.gc.ca/hpfbdgpsa/tpd-dpt/2003-04-16_e.html (2003). Accessed 1 Oct 2010.
947Discriminatory Dissolution Testing: Levothyroxine
30. Food and Drug Administration. Code of Federal Regulations.Title 21, Part 320: bioavailability and bioequivalence require-ments. Section 320.33(c). http://www.accessdata.fda.gov (2003).Accessed 1 Oct 2010.
31. Baek IH, Lee BY, Kang W, Kwon KI. Comparison of average,scaled average, and population bioequivalence methods for assess-ment of highly variable drugs: an experience with doxifluridine inbeagle dogs. Eur J Pharm Sci. 2010;39:175–80. Epub 2009 Dec 2.
32. Haidar SH, Makhlouf F, Schuirmann DJ, Hyslop T, Davit B,Conner D, et al. Evaluation of a scaling approach for thebioequivalence of highly variable drugs. AAPS J. 2008;10:450–4.
33. McCarthy LG, Bradley G, Sexton JC, Corrigan OI, Healy AM.Computational fluid dynamics modeling of the paddle dissolu-tion apparatus: agitation rate, mixing patterns, and fluid veloc-ities. AAPS PharmSciTech. 2004;5:e31.
34. Pabla D, Akhlaghi F, Zia H. A comparative pH-dissolutionprofile study of selected commercial levothyroxine productsusing inductively coupled plasma mass spectrometry. Eur JPharm Biopharm. 2009;72:105–10.
35. Volpato NM, Silva RL, Brito AP, Gonçalves JC, Vaisman M, Noël F.Multiple level C in vitro/in vivo correlation of dissolution profiles oftwo l-thyroxine tablets with pharmacokinetics data obtained frompatients treated for hypothyroidism.Eur J PharmSci. 2004;21:655–60.
36. Zhao N, Augsburger LL. Functionality comparison of 3 classesof superdisintegrants in promoting aspirin tablet disintegrationand dissolution. AAPS PharmSciTech. 2005;6:E634–40.
37. Carmella C, Ferrari F, Bonferroni MC, Ronchi M. Disintegrantsin solid dosage forms. Drug Dev Ind Pharm. 1990;16:2561–77.
38. Homsek I, Parojcic J, Dacevic M, Petrovic L, Jovanovic D.Justification of metformin hydrochloride biowaiver criteria basedon bioequivalence study. Arzneimittelforschung. 2010;60:553–9.
39. Flores-Murrieta FJ, Toledo A, del Carmen Carrasco-Portugal M,Reyes-García G, Rodríguez-Silverio J, Medina-Santillán R, et al.Comparative bioavailability of two oral formulations of raniti-dine. Biopharm Drug Dispos. 2006;27:23–7.
40. Blume HH, Schug BS. The biopharmaceutics classificationsystem (BCS): Class III drugs-better candidates for BA/BEwaiver? Eur J Pharm Sci. 1999;9:117–21.
41. Tsume Y, Amidon GL. The biowaiver extension for BCS class IIIdrugs: the effect of dissolution rate on the bioequivalence of BCSclass III immediate-release drugs predicted by computer simu-lation. Mol Pharm. 2010;7:1235–43.
42. Koytchev R, Lauschner R. Bioequivalence study of levothyrox-ine tablets compared to reference tablets and an oral solution.Arzneimittelforschung. 2004;54:680–4.
43. Grussendorf M, Vaupel R, Wegscheider K. Bioequivalence of L-thyroxine tablets and a liquid L-thyroxine solution in thetreatment of hypothyroid patients. Med Klin (Munich).2004;99:639–44.
44. Shah VP, Tsong Y, Sathe P, Liu JP. In vitro dissolution profilecomparison-statistics and analysis of the similarity factor, f2.Pharm Res. 1998;15:889–96.
948 Kocic et al.