An integrated earthquake vulnerability assessment framework for urban areas
31
ORIGINAL PAPER An integrated earthquake vulnerability assessment framework for urban areas H. S. B. Duzgun • M. S. Yucemen • H. S. Kalaycioglu • K. Celik • S. Kemec • K. Ertugay • A. Deniz Received: 10 March 2009 / Accepted: 31 March 2011 Ó Springer Science+Business Media B.V. 2011 Abstract In this paper, an integrated urban earthquake vulnerability assessment frame- work, which considers vulnerability of urban environment in a holistic manner and performs the vulnerability assessment for the neighborhood scale, is proposed. The main motivation behind this approach is the inability to implement existing vulnerability assessment methodologies for countries like Turkey, where the required data are usually missing or inadequate for the decision-makers in prioritization their limited resources for risk reduction in the administrative units from which they are responsible for. The methodology integrates socio-economical, structural, coastal, ground condition, vulnerabilities (fragilities), as well as accessibility to critical services. The proposed methodology is implemented for Esk- isehir, which is one of the metropolitans of Turkey. In the implementation of the proposed framework, geographic information system (GIS) is used. While the overall vulnerabilities obtained for neighborhoods are mapped in GIS, the overall vulnerabilities obtained for buildings are visualized in 3D city model. The main reason behind using different mapping and visualization tools for vulnerabilities is to provide better ways for communicating with decision-makers. The implementation of the proposed vulnerability assessment methodol- ogy indicates that an urban area may have different vulnerability patterns in terms of structural, socio-economical, and accessibility to critical services. When such patterns are H. S. B. Duzgun (&) S. Kemec K. Ertugay Geodetic and Geographical Information Technologies and Earthquake Studies Department, Middle East Technical University, Ankara, Turkey e-mail: [email protected] M. S. Yucemen Civil Engineering and Earthquake Studies Departments, Middle East Technical University, Ankara, Turkey H. S. Kalaycioglu Department of Sociology, Middle East Technical University, Ankara, Turkey K. Celik Department of Sociology, Ondokuz Mayıs University, Samsun, Turkey A. Deniz Technological Engineering Services Co. Ltd., Po Box 45, Aksu, Ankara, Turkey 123 Nat Hazards DOI 10.1007/s11069-011-9808-6
-
Upload
independent -
Category
Documents
-
view
5 -
download
0
Transcript of An integrated earthquake vulnerability assessment framework for urban areas

ORI GIN AL PA PER
An integrated earthquake vulnerability assessmentframework for urban areas
H. S. B. Duzgun • M. S. Yucemen • H. S. Kalaycioglu •
K. Celik • S. Kemec • K. Ertugay • A. Deniz
Received: 10 March 2009 / Accepted: 31 March 2011� Springer Science+Business Media B.V. 2011
Abstract In this paper, an integrated urban earthquake vulnerability assessment frame-
work, which considers vulnerability of urban environment in a holistic manner and performs
the vulnerability assessment for the neighborhood scale, is proposed. The main motivation
behind this approach is the inability to implement existing vulnerability assessment
methodologies for countries like Turkey, where the required data are usually missing or
inadequate for the decision-makers in prioritization their limited resources for risk reduction
in the administrative units from which they are responsible for. The methodology integrates
socio-economical, structural, coastal, ground condition, vulnerabilities (fragilities), as well
as accessibility to critical services. The proposed methodology is implemented for Esk-
isehir, which is one of the metropolitans of Turkey. In the implementation of the proposed
framework, geographic information system (GIS) is used. While the overall vulnerabilities
obtained for neighborhoods are mapped in GIS, the overall vulnerabilities obtained for
buildings are visualized in 3D city model. The main reason behind using different mapping
and visualization tools for vulnerabilities is to provide better ways for communicating with
decision-makers. The implementation of the proposed vulnerability assessment methodol-
ogy indicates that an urban area may have different vulnerability patterns in terms of
structural, socio-economical, and accessibility to critical services. When such patterns are
H. S. B. Duzgun (&) � S. Kemec � K. ErtugayGeodetic and Geographical Information Technologies and Earthquake Studies Department,Middle East Technical University, Ankara, Turkeye-mail: [email protected]
M. S. YucemenCivil Engineering and Earthquake Studies Departments, Middle East Technical University,Ankara, Turkey
H. S. KalayciogluDepartment of Sociology, Middle East Technical University, Ankara, Turkey
K. CelikDepartment of Sociology, Ondokuz Mayıs University, Samsun, Turkey
A. DenizTechnological Engineering Services Co. Ltd., Po Box 45, Aksu, Ankara, Turkey
123
Nat HazardsDOI 10.1007/s11069-011-9808-6
investigated, effective vulnerability reduction policies can be designed by the decision-
makers. The proposed methodology well serves for this purpose.
Keywords Earthquake � Structural fragility � Socio-economic vulnerability �Accessibility to critical services � 3D visualization � GIS
1 Introduction
Urban earthquake vulnerability has increased over the years due to the increasing com-
plexities in urban environments. The main reasons for high vulnerability of urban envi-
ronments to earthquakes are the location of major cities in hazard prone areas, growth in
urbanization and population, and rising wealth measures (Tucker et al. 1994; Kakhandiki
and Shah 1998). In recent years, physical examples of these factors are observed through
the growing costs of major disasters in urban areas which have stimulated a demand for in-
depth evaluation of possible strategies to manage the large-scale damaging effects of
earthquakes. Understanding and formulation of urban earthquake vulnerability requires
consideration of a wide range of vulnerability aspects, which can be handled by developing
an integrated approach. In such an integrated approach, an interdisciplinary view should be
incorporated into the vulnerability assessment.
There have been several attempts for the development of vulnerability assessment
methodologies and its use in earthquake risk assessment by considering various aspects of
vulnerability, such as, physical, social, economical, etc. Moreover, the developed method-
ologies vary in scale, such as local, regional, national, international, etc. Examples of risk
assessment incorporated with vulnerability analysis at various scales can be found in King
and Kiremidjian (1994), Hewitt (1997), Davidson and Shah (1997), Mileti (1999), Radius
(1999), FEMA-NIBS (1999), Alexander (2000), Dowrick (2002, 2003), Morales (2002),
Plattner (2005), Mourouse and Brun (2006), and Karaman et al. (2008). Among these
examples, Earthquake Disaster Risk Index (EDRI) presented by Davidson and Shah (1997) is
one of the earliest models, which provided a multidisciplinary approach by considering
several dimensions of risk and vulnerability. As EDRI has been developed for comparisons of
relative risks of different cities, it does not allow comparisons to be made among the
neighborhoods within a city, which is required for developing effective disaster risk reduction
plans in detail. In later approaches, the value of geographic information systems (GIS) has
been realized, and GIS is used for preparing urban earthquake risk and vulnerability maps at
different scales. For example, in Radius (1999) project, earthquake risk for 27 cities selected
from Asia, Europe, the Middle East, Africa, and Latin America is assessed by using GIS tools
and considering mainly physical urban environment, such as buildings, infrastructures, etc.
HAZUS, which was developed by FEMA-NIBS (1999), considers economical and
social aspects of urban earthquake risk as well as buildings, lifelines, and infrastructure.
HAZUS also allows mapping of results by providing outputs compatible with GIS soft-
ware. Although HAZUS methodology is one of the most sophisticated urban earthquake
risk assessment approach, its application is limited to the United States as it is designed for
the US conditions. Recognizing this fact, several initiatives in Europe have started for
developing earthquake risk assessment and loss estimation methodologies across the Euro-
Mediterranean region. The final products of these initiatives are usually software packages
for assessing the seismic risk and earthquake losses.
Stafford et al. (2007) reviewed eighteen such packages in terms of their potential for
effective rapid postearthquake response. Strasser et al. (2008) comparatively investigated
Nat Hazards
123

five European seismic risk estimation methodologies, namely KOERILOSS, SELENA,
ESCENARIS, SIGE-DPC, and DBELA. Strasser et al. (2008) stated that these five models
have common inputs of ground motion and building stock data; however, the outputs vary
due to variations in vulnerability functions. Moreover, none of these models considered the
various aspects of urban environment vulnerability (social, economical, cultural, structural,
etc.) as a whole, rather they concentrated on predicting loss of building stock and related
indirect losses, such as number of fatalities and economic losses due to structural damages.
However, when the urban environment is considered in a holistic manner, the predicted
losses due to earthquakes will be much higher. The main reason is that earthquakes not
only cause losses in building stock and fatalities but also result in destruction of urban
environment’s economy, cultural heritage, social structure, etc. Since the final products of
urban earthquake risk assessment methodologies are crucial for decision-makers in
developing effective risk reduction strategies, the components of urban environment such
as ground conditions, buildings, infrastructure, social, economical, organizational struc-
tures, and accessibility to critical services have to be integrated in the overall vulnerability
assessment. In addition to that, computed risk for an urban environment is time dependent
as urban environments are changing in time and vulnerabilities of elements at risk are
variable at different phases of an earthquake. Hence, the establishment of pre-, during, and
post-disaster intervention plans requires holistic considerations of urban earthquake vul-
nerability. Another problem with the existing methodologies is the fact that they generally
divide the urban environment under study into grids and risk is assessed for these grid
units, whereas the grids may not have any physical meaning for decision-makers. The
solution to this problem would be working in small grid sizes and aggregating these grids
for administrative zones, which requires too detailed data collection and analyses.
In this paper, an integrated urban earthquake vulnerability assessment framework, which
considers vulnerability of urban environment in a holistic manner and performs the vul-
nerability assessment for the smallest administrative unit, namely at neighborhood scale, is
proposed. The main motivation behind this approach is the inability to implement existing
vulnerability assessment methodologies for countries like Turkey, where the required data
are usually missing or inadequate for the decision-makers for prioritization their limited
resources in risk reduction in the administrative units from which they are responsible for.
The methodology integrates socio-economical, structural, coastal, ground condition, vul-
nerabilities (fragilities), as well as accessibility to critical services. After giving the general
overview of the proposed framework, its application for Odunpazari Municipality of Esk-
isehir, which is one of the metropolitans of Turkey, is presented. In the implementation of
the proposed framework, the tools of the geographic information system (GIS) are used in
order to establish the backbone of a spatial decision support system (SDSS) for decision-
makers of the administrative units. The backbone of SDSS is supported by 3-D visualiza-
tion/mapping techniques so that decision-makers can easily use and interpret the outputs.
2 The proposed integrated vulnerability assessment framework
The vulnerability components of an urban area can be considered in two main categories.
In the first category (Type I vulnerability), the vulnerability is determined based on seismic
hazard and fragility analysis of the structural elements of the urban area, such as buildings,
infrastructure, lifelines, etc. On the other hand, in the second category (Type II Vulnera-
bility), the urban elements are mainly vulnerable to any kind of natural disasters like socio-
economic structure and accessibility to critical services. Hence, Type II Vulnerability is not
Nat Hazards
123

dependent on the seismic hazard analysis. In the proposed methodology, the indexes of the
Type I and Type II vulnerabilities are evaluated for the neighborhoods of the considered
urban area. Then, Type I and Type II vulnerability indexes are combined in an overall
urban vulnerability index according to a GIS-based multicriteria decision analysis
(MCDA) for the urban area. In MCDA analysis, simple additive weighting (SAW) method
is used, where the vulnerability indexes are given weights according to their importance.
The overall vulnerability index (V) is computed by using Eq. 1.
V ¼ w1vs þ w2v12 þ w3v22 ð1Þ
where vs = vulnerability index obtained for structural vulnerability (fragility) for a given
neighborhood; v12 = vulnerability index obtained for socio-economical vulnerability for a
given neighborhood; v22 = vulnerability index obtained for accessibility to critical ser-
vices for a given neighborhood; wi = weights of each vulnerability component for a given
neighborhood, i = 1, 2, 3
Note thatX3
i¼1
wi ¼ 1
The computed overall vulnerability indexes as well as the individual vulnerability index
values are mapped for each neighborhood in GIS. Moreover, the overall and individual
vulnerability values for each building are visualized in a 3D urban environment in order to
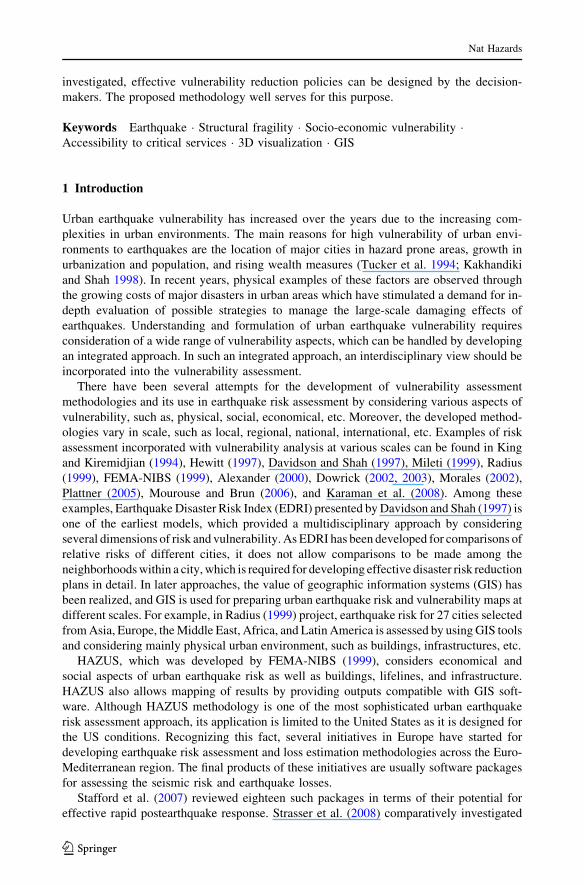
better convey the computed vulnerability information to the decision-makers. Figure 1
illustrates the overall structure of the proposed methodology.
As it can be seen from Fig. 1, in the most general context, the proposed framework has
the following nine components:
• Seismic hazard analysis
• Soil response analysis
• Tsunami inundation analysis
• Structural vulnerability (fragility) analysis
• Socio-economic vulnerability analysis
• Vulnerability for accessibility to critical services
• Overall vulnerability assessment
• GIS-based mapping of vulnerabilities for neighborhoods
• Visualization of vulnerabilities in 3D virtual city model
The first three components (seismic hazard analysis, soil response analysis, and tsunami
inundation analysis) are required prior to structural vulnerability (Type I vulnerability, v11)
analysis as v11 is dependent on the input from the first three components. (It is more proper
to use the term fragility instead of vulnerability when the built environment is considered.
However, in order to be consistent with the use of the term vulnerability for nonstructural
elements involved in the framework, we preferred to use the term structural vulnerability).
The seismic hazard analysis can be performed either in a deterministic way or by using
a probabilistic approach. Considering the aleatory uncertainties related to earthquake
occurrences with respect to time, space, magnitude, and the additional epistemic uncer-
tainties, probabilistic approach appears to be more appropriate. Also, recently, more
attention is paid to the assessment of seismic hazard due to active faults. Accumulation of
more data and information on the main characteristics of faults has also contributed to this.
Accordingly, the new generation of seismic hazard maps should take into consideration the
potential threat created by faults and should utilize the stochastic models consistent with
Nat Hazards
123

the available information on faults. However, this process requires time and is quite
expensive if it is carried out for large regions. This fact is observed in the pilot study
conducted for the development of the seismic hazard map of Eskisehir, where all seismic
sources are defined as area sources. Besides, the results of the probabilistic seismic hazard
analysis are used only to evaluate the distribution of seismic hazard all over the Eskisehir
province at a macrolevel. In the case of the structural fragility analysis conducted at a
microlevel for the municipality of Odunpazari, a deterministic seismic hazard analysis,
based on a single critical scenario, is conducted.
The soil response analysis deals with the amplification of the seismic motions by the
local site conditions. The seismic hazard analysis provides only the magnitude of the
expected peak ground motion values on bedrock. During the propagation of earthquake
waves from bedrock to surface, their characteristics change as they pass through different
soil layers. Soil response analysis provides one of the basic inputs for structural fragility
analyses. An earthquake site response analysis is traditionally carried out based on a one-
dimensional wave propagation assumption unless there are strong evidences for 2-D or 3-D
effects, such as when the site is close to the edge of a valley or it is located on a sharp
topographical feature. To perform a soil response analysis for a site, typical data
requirements are seismic hazard maps and site characterization consisting of soil stratifi-
cation (type of soil, layering, and water table) and mechanical properties of the soil (most
notably, the shear modulus and non-linear soil properties) at least in the top 30–40 m of the
deposit. These data can be obtained by either in situ geotechnical investigations or geo-
physical site characterization methods or combinations of both. The soil response analysis
GIS-Based Mapping of Vulnerabilities for
Neighborhoods
Visualization of Vulnerabilities
in 3D Virtual City Model
Seismic Hazard Analysis
Soil Response Analysis Tsunami Inundation Analysis
Structural Vulnerability (Fragility) Analysis (vs)
Type I Vulnerability
Socio-Economic Vulnerability Analysis
(v21)
Vulnerability for Accessibility to Critical Services
(v22)
Type II Vulnerability
Overall Vulnerability Assessment (V)
Fig. 1 Components of the proposed integrated vulnerability assessment framework
Nat Hazards
123

results in a soil response map of the urban area to be used in the structural vulnerability
analyses. The maps are prepared by using GIS tools with certain interpolation methods.
The tsunami inundation analysis is an optional component to be used for urban envi-
ronment in coastal regions. Cummins et al. (2009) discuss the importance of site selection
for housing in coastal areas and tsunami inundation mapping for estimating loss. Usually,
numerical models are used to develop the inundation maps. The main inputs to these
models are bathymetric and topographic data. Synolakis et al. (2008) reviewed the
available numerical models for tsunami inundation maps. Hence, if the study area involves
some coastal residential areas, it would be beneficial to obtain a tsunami inundation map in
order to integrate it to the overall vulnerability assessment.
After carrying out seismic hazard, soil response, and/or tsunami inundation analysis, the
next step is to perform structural vulnerability (fragility) analysis. Due to underlying
uncertainties, seismic vulnerability of buildings has to be treated in a probabilistic manner.
The vulnerability assessment involves the consideration of building characteristics and
conditions. The earthquake damage can be presented and estimated in various ways. These
can be classified as empirical/statistical methods, analytical/theoretical methods, and
methods utilizing expert opinion.
A reliable data source for earthquake damage estimation is the damage data assessed
based on field observations of buildings damaged during earthquakes, provided that per-
sonal biases in the damage evaluation are eliminated. This empirical data can be described
based on a relatively old statistical method, which is proposed by Whitman (1973), and
referred to as the damage probability matrix (DPM). A DPM is composed of probabilities
that a certain damage state (DS) is observed when a certain type of structure is exposed to
known earthquake intensity (say, I). The ratio of the cost of repairing the earthquake
damage to the replacement cost of the building (excluding the value of land on which the
building is constructed) is defined as the damage ratio (DR). This method gives an average
value of the damage ratio for a group of buildings having similar structural systems and
materials of construction and suitable for regional damage estimation rather than an
individual building. A more sophisticated statistical method is proposed by Yucemen et al.
(2004) who have used the discriminant analysis technique of multivariate statistics.
The analytical/theoretical methods involve structural analysis models that consider the
dynamic characteristic of buildings and are generally used to forecast damage for a single
structure. Their advantage is that the method correlates the seismic demand with typical
physical parameters used in seismic design. However, the main drawback is the difficulties
involved in model development and computational efforts. Lack of sufficient empirical
data and incomplete knowledge may necessitate the use of expert opinion.
The structural vulnerability (fragility) of the building stock (v11) for every neighborhood
in the considered urban environment is evaluated and mapped by using GIS. In the pro-
posed methodology, it is also possible to evaluate the fragilities of infrastructures (v12) and
of lifelines (v13). The overall structural vulnerability (vs) for the given neighborhood is
given by Eq. 2:
vs ¼X3
i¼1
w1iv1i ð2Þ
where w1i is the weight assigned to the ith structural vulnerability component for the given
neighborhood, and the sum of w1is equals 1.
Once the Type I vulnerability is computed, the next step is to evaluate the socio-
economic vulnerability (v21). The vulnerability in socio-economic content is taken to be the
Nat Hazards
123
ability to anticipate, resist, cope with, and respond to a hazard. Therefore, v21 is evaluated
independent from the seismic hazard analysis. Socio-economic vulnerability can also apply
to a particular group or social unit and to the structures and institutions—economic,
political, and social—which govern human life. Instead of focusing solely on the risk of
exposure to physical phenomena, the approach used in this study recognizes that such
physical phenomena are embedded in and mediated by the particular human context
(social, political, economic, and institutional) in which they occur.
Socio-economic vulnerability assessment refers to the analysis of various factors in
order to establish the probability of certain outcomes from an uncertain event or suite of
events; in this case, it is the earthquake hazard. Earthquake risk is specifically high in urban
areas where a high concentration of people, buildings, infrastructure, economic and social
activities, etc. can be found. It is to be noted that the aim is not to formulate a specific
policy for earthquake risk management, but results of this study can provide insights for the
policy makers to understand differential levels of vulnerability for the social groups and
formulate effective risk prevention policies.
Differential socio-economic vulnerability analysis of different groups is discussed
widely in the literature. For example, The Social Vulnerability Index (SoVI), created by
Cutter (2003), examined the spatial patterns of social vulnerability to natural hazards at the
county level in the United States in order to describe and understand the social burdens of
risk. Social vulnerability stems from limited access to resources and political power, social
capital, beliefs and customs, physical limitations of the population, and characteristics of
the built environment, such as building stock and age, and the type and density of infra-
structure and lifelines. Socio-economic vulnerability for different sections of the society is
analyzed based on such characteristics as age, gender, health, welfare and wealth of
households, and capability and coping strategies of social groups. Response to risk by
children, elderly, sick, and the disabled may be quite different from that of young and
healthy persons (Yiing-Jenq et al. 2004). Similarly, an individual’s level of income,
occupation, and family size are among characteristics that determine socio-economic
position, which in turn determine the place of residence, its qualitative and quantitative
features and infrastructure, which eventually determine the impact of risk (Evans and
Kantrowitz 2002).
Physical accessibility is one of the most vital and important components of natural
disaster preparedness. For this reason, emergency accessibility is a paramount factor for a
decision-maker, who has to consider accessibility to/from critical services in a disaster
situation and in the early stages of preparedness planning. In this study, vulnerability for
the physical accessibility to/from critical services (ambulances, fire brigades, etc.) in an
urban area (v22) is described by using zone-based, isochronal-based, and raster-based
models. These models are implemented in geographic information systems by considering
accessibility of fire brigades (v221), ambulances (v222), etc. Moreover, the accessibilities to
health services from each neighborhood of the urban area are evaluated by considering the
capacity of the health services. The cumulative effects of accessibility in different parts of
the urban environment are determined. Then, the overall vulnerability for accessibility
(v22) is computed by taking the weighted sum of the individual vulnerabilities for acces-
sibility (v221, v222,…).
v22 ¼X3
i¼1
w2iv22i ð3Þ
Nat Hazards
123

where w2i is the weight assigned to the ith accessibility to critical services vulnerability
component for the given neighborhood, and the sum of w2is equals to 1.
After evaluating the Type I and Type II vulnerabilities, the overall vulnerability can be
evaluated for each individual building or each neighborhood. In the proposed approach, in
order to demonstrate the methodology, both are evaluated in the case study. While the
overall vulnerabilities obtained for neighborhoods are mapped in GIS, the overall vul-
nerabilities obtained for buildings are visualized in 3D city model. The main reason behind
using different mapping and visualization tools for vulnerabilities is to provide efficient
ways for communicating with the decision-makers.
3 Implementation of the proposed framework for the Eskisehirmetropolitan area
3.1 General information about Eskisehir
Eskisehir, with a population of 600,000, is one of the important centers of industry in
Turkey. It is the main center of Eskisehir province. Eskisehir City Greater Municipality
coordinates Odunpazari and Tepebasi Municipalities, which are the two administrative
units dividing the Eskisehir City into two (Fig. 2). A number of dams and two universities
are located within Eskisehir City boundaries. Due to its rapid development, Eskisehir has
become a popular location for new investments. According to the current seismic zoning
map of Turkey (Code 1997), the province of Eskisehir is located in Zones II–IV. The
seismic zoning map of Turkey contains five zones, with Zone I being the seismically most
active one. Odunpazari, which has a population of 350,000, is the largest municipality of
Eskisehir and is selected as the region to illustrate the application of the proposed
framework.
3.2 Seismic hazard assessment
The classical probabilistic seismic hazard analysis (PSHA) method is utilized for the
assessment of seismic hazard for the Eskisehir province. Earthquake occurrences in the
time domain are assumed to exhibit a Poisson process and magnitudes to be distributed
exponentially. It was not possible to use the alternative characteristic earthquake and
renewal process models due to the lack of sufficient data on the main parameters of the
Fig. 2 Odunpazari and Tepebasi municipalities of Eskisehir greater municipality
Nat Hazards
123
faults, such as slip rates, magnitude and mean recurrence interval of characteristic earth-
quakes, time passed since the last characteristic earthquake, etc.
A comprehensive earthquake catalog, in which earthquakes in different scales are
converted to a common scale, is compiled. Seismic source zones near the region are
delineated, and different attenuation relationships are employed. Uncertainties related to
the seismicity parameters and different assumptions are taken into consideration by using
the logic tree procedure. Seismic hazard maps in terms of peak ground acceleration and
MSK intensity, corresponding to a return period of 475 years, are developed for the
Eskisehir province. The basic steps of the probabilistic seismic hazard analysis carried out
for Eskisehir are summarized in the following subsections.
3.2.1 The earthquake database and modifications
A comprehensive seismic database, which contains the earthquakes that have occurred
within 250 kms of the city center (coordinates: 30.489�E longitude and 39.774�N latitude)
in the last century, is compiled. It is assumed that the seismic hazard for the Eskisehir
province is due to the seismic activity occurring in a rectangular region bounded between
27.50� and 33.50�E longitudes and 37.50�–42.00�N latitudes. In preparing this seismic
database, four different sources of seismicity data were utilized. These are the catalogs
provided by the Earthquake Research Department of General Directorate of Disaster
Affairs of Turkey (GDDA-ERD 2004), Kandilli Observatory and Earthquake Research
Institute of the Bogazici University (KOERI 2004), International Seismological Centre
(ISC 2004a, b), and United States Geological Survey (USGS 2004a, b). The data in these
catalogs were provided in different magnitude scales, and it is necessary that they are
converted to a single scale. All the magnitude scales used in the seismic database are
homogenized and converted to the moment magnitude scale. The moment magnitude (Mw)
scale is selected since in recent years, this scale has become the most preferred one. The
minimum value of Mw is set to 4.5, and earthquake magnitudes reported in different scales
are converted to Mw by using the empirical conversion equations developed by Deniz and
Yucemen (2010) by applying the orthogonal regression procedure to earthquakes that have
occurred in the last 100 years in Turkey.
In order to satisfy the assumptions of the Poisson process, it is necessary that earthquake
clusters should be identified and dependent events (fore and after shocks) be eliminated
from the seismic database (declustering). This is achieved by using the space and time
windows specified by Deniz (2006), which were obtained based on an extensive literature
survey. This way two alternative seismic databases containing all earthquakes and only
main shocks are created.
The incompleteness in the earthquake catalogs is also taken into account. For this
purpose, an analysis of catalog completeness is performed based on the method proposed
by Stepp (1973). In view of this analysis, both databases (which contain all earthquakes
and only main shocks) are assumed to be complete for earthquakes with magnitude greater
than 5.0. However, the completeness is assumed to be valid since 1966 for earthquakes
with magnitudes between 4.5 and 5.0. The resulting seismic database is referred to as the
artificially completed catalog.
3.2.2 Delineation of the seismic source zones
Since the geographical location of seismic source zones depends highly on subjective
judgment of experts, the number and the layout of seismic source zones change from study
Nat Hazards
123

to study. In our study, the areal seismic source zones delineated by Bommer et al. (2002)
are adopted with some local modifications (Kocyigit 2005) to take into account the recent
findings. The resulting seismic source zones, which formed the basis for the seismic hazard
analysis conducted in this study, are tabulated in Table 1. In the same table, the maximum
earthquake magnitudes are also given. For the earthquakes that cannot be related to any
one of the 13 seismogenic provinces, background seismicity regions (G1–G4) are defined.
There exist background seismicity regions both inside and outside of the main seismic
source zones as listed in Table 1. The configuration of seismic source zones is displayed in
Fig. 3.
In order to quantify the seismicity parameters, information given in the two seismic
databases that include whole events and only main shocks is considered. Considering the
other alternative assumptions listed in Table 2, namely incomplete versus artificially
completed catalog and standard least squares regression versus maximum likelihood
method in the computation of the recurrence relationships, 23 = 8 different combinations
are possible. The earthquakes in the finalized seismic databases are distributed to these
thirteen main and four background seismic source zones according to the location of their
epicenters and are used to predict the seismicity parameters of each seismic source zone.
For the estimation of the parameters of the Gutenberg-Richter linear magnitude–recurrence
relationship (mainly b, the parameter of the exponential magnitude distribution), the least
squares regression and maximum likelihood methods are applied both to the original
(incomplete) and artificially completed data sets, creating four different combinations for
each one of the alternative seismic databases that include whole events and only main
shocks. Because of space limitation, here only the standard least squares (SLS) and
maximum likelihood (ML) estimates of b computed for the case of artificially completed
Table 1 Seismic source zones, expected maximum earthquake magnitude values, observed mean annualrates, and the b values computed from the artificially completed earthquake catalog containing all earth-quakes (SLSE standard least squares estimate, MLE maximum likelihood estimate)
Source number Seismic source zone (Mw)max mobs bSLSE bMLE
1 North anatolian fault system—segment B 8.0 3.284 1.741 2.970
2 North anatolian fault system—segment C 7.4 2.400 1.699 3.062
3 North anatolian fault system—segment D 8.0 1.898 1.817 1.778
4 Bartin fault zone 6.8 0.202 1.099 2.556
5 Beypazari-Urus fault zone 5.4 0.100 3.182 3.182
6 Orta (Dodurga) fault zone 6.2 0.238 1.931 1.931
7 Inonu-Eskisehir fault zone 7.1 0.343 1.669 1.669
8 Tuz Golu fault zone 6.9 0.101 1.676 3.108
9 Kutahya fault zone 6.9 0.288 2.263 2.993
10 Simav-Aksehir fault zone 7.2 2.762 2.083 2.809
11 Alasehir-Izmir (Gediz) graben 7.2 2.188 2.326 2.395
12 Buyuk Menderes graben 7.1 0.430 1.516 3.454
13 Cameli-Burdur fault zone 7.1 1.013 2.053 2.125
G1 Background north 5.8 0.713 2.930 3.362
G2 Background inner 1 5.4 1.036 3.182 3.182
G3 Background inner 2 5.4 1.204 2.025 2.025
G4 Background inner 3 5.4 2.710 2.464 2.464
Nat Hazards
123

Fig. 3 Configuration of the seismic source zones listed in Table 1 (9: shows the approximate location ofEskisehir’s city center)
Table 2 Alternativeassumptions and the corre-sponding subjectiveprobabilities
Alternative assumptions Subjectiveprobability
All earthquakes 0.5
Main shocks only 0.5
Incomplete catalogs 0.4
Artificially completed catalogs 0.6
Standard least squares regression in the computationof the recurrence relationships
0.4
Maximum likelihood method in the computation of the
Recurrence relationships 0.6
If PGA is used
Attenuation relationship of Gulkan and Kalkan (2002) 0.6
Attenuation relationship of Boore et al. (1997) 0.4
Attenuation uncertainty, rln Y = 0.447 0.1
Attenuation uncertainty rln Y is equal to the reportedvalue
0.6
Attenuation uncertainty, rln Y = 0.707 0.3
If intensity (MSK) is used
Attenuation relationship of Musson (2000) in itsoriginal form
0.5
Attenuation relationship of Musson (2000) convertedto Mw scale
0.5
Attenuation uncertainty, rln I = 0.01 0.15
Attenuation uncertainty, rln I = 0.06 0.60
Attenuation uncertainty, rln I = 0.10 0.25
Nat Hazards
123

catalog containing all earthquakes are given in Table 2, together with the values of the
annual seismic activity rate, m, for earthquakes with Mw C 4.5.
3.2.3 Attenuation relationships
Peak ground acceleration and MSK intensity are selected as the earthquake severity
parameters. In order to estimate earthquake hazard in terms of these parameters, the
following attenuation relationships are employed. For the peak ground acceleration, the
ground motion prediction equations given by Gulkan and Kalkan (2002) and Boore et al.
(1997) for rock sites are adopted. These equations are, respectively, as follows:
ln Y ¼ �0:682þ 0:253� M � 6ð Þ þ 0:036� M � 6ð Þ2�0:562� ln r þ 0:202 ð4Þ
ln Y ¼ �0:242þ 0:527� M � 6ð Þ � 0:778� ln r þ 0:301 ð5Þ
where r ¼ffiffiffiffiffiffiffiffiffiffiffiffiffiffiffir2
cl þ h2p
; Y = horizontal component of the peak ground acceleration (PGA) in
g; M = moment magnitude; rcl = closest horizontal distance to the vertical projection of
the rupture in km; h = fictitious depth, computed by regression analysis as 4.48 and
5.57 km, respectively, for Eqs. 4 and 5. The standard deviation, rlnY, is reported as 0.562
and 0.520, for Eqs. 4 and 5, respectively. For intensity attenuation, the following equation
proposed by Musson (2000) is used:
I ¼ 1:063þ 1:522�Ms � 1:102� ln R� 0:0043� R ð6Þ
where I = intensity in MSK scale; Ms = earthquake magnitude in the surface wave
magnitude scale; and R = hypocentral distance in kms. The standard deviation came out to
be rI = 0.486 (or rln I & 0.06). The alternative assumptions considered for the attenuation
relationships are summarized in Table 2. The use of an imported attenuation relationship
as an alternative to a local one is due to the fact that the relationship given by Boore et al.
(1997) has been used widely in many studies in Turkey (e.g., Erdik et al. 2004, Yucemen
and Ozturk 2008). It is well known that the output of an attenuation relationship is quite
sensitive to the value of the associated standard deviation. Accordingly, the epistemic
uncertainty associated with this factor is taken into consideration by assuming alternative
values for the underlying standard deviation with weights as shown in Table 2.
3.2.4 ‘‘Best’’ estimate of seismic hazard for Eskisehir city center
In order to reflect the influence of various assumptions discussed above and to account for
the epistemic uncertainties in the values of seismicity parameters, the logic tree procedure
is applied as described below. The alternative assumptions are listed in Table 2, together
with the subjective probabilities assigned to them. These probabilities quantify the like-
lihood of each assumption being valid as compared to the alternative assumptions
reflecting the subjective opinions of the authors. Seismic hazard computations are carried
out for each one of the resulting 24 9 3 = 48 combinations, and the mean hazard values
are obtained for each alternative case. By multiplying the mean seismic hazard results
computed for each one of the 48 combinations by the corresponding joint probability
(multiplication of the probabilities of the selected alternatives) of that combination and
adding these values, a weighted average seismic hazard value is computed. The resulting
seismic hazard curve in terms of PGA is called as the ‘‘best’’ estimate of seismic hazard for
Eskisehir city center and is shown in Fig. 4a. The same procedure is repeated for the
Nat Hazards
123

48 combinations resulted for MSK, and the ‘‘best’’ estimate seismic hazard curve in terms
of MSK is obtained as shown in Fig. 4b. Based on these ‘‘best’’ estimate hazard curves and
for a return period of 475 years, the PGA and MSK values are obtained as 0.28 g and 8.2
(MSK), respectively, for the city center of Eskisehir. It is to be noted that the term ‘‘best’’
estimate is used within the context of Bayesian statistics to reflect the fact that the weights
are assigned subjectively.
Seismic hazard maps are also plotted for peak ground acceleration (PGA) and intensity
(MSK) corresponding to a return period of 475 years (10% probability of exceedance in
50 years) considering the combination composed of the most likely assumptions. These
maps are shown in Fig. 5. All of the seismic hazard calculations are carried out by using
the software CRISIS 2003 (Ordaz et al. 2003).
3.3 Structural fragility analysis for Odunpazari municipality
The structural fragility (vulnerability) analysis is carried out only for the municipality of
Odunpazari. According to the seismic hazard map given in Fig. 5b, the MSK intensity for a
return period of 475 years is about 7.5 for Odunpazari municipality. Based on the damage
probability matrices developed for Turkey by Yucemen (2005), ‘‘moderate’’ building
damage is expected in Odunpazari for this level of hazard from a probabilistic point of
(a)
1.0E-04
1.0E-03
1.0E-02
1.0E-01
1.0E+00
1.0E+01
Eski ehir
Maximum expected intensity (MSK)
Ann
uale
xcee
danc
erat
e
1.0E-04
1.0E-03
1.0E-02
1.0E-01
1.0E+00
1.0E+01
1.000 3.000 5.000 7.000 9.000 11.0000.000 0.100 0.200 0.300 0.400 0.500 0.600
Eski ehir
Maximum expected PGA
Ann
ual e
xcee
danc
e ra
te (b)
Fig. 4 ‘‘Best’’ estimate seismic hazard curves for Eskisehir city center. a In terms of peak groundacceleration (PGA in g); b in terms of intensity (MSK)
Fig. 5 Seismic hazard maps corresponding to a return period of 475 years obtained based on thecombination of the most likely assumptions. a In terms of peak ground acceleration (PGA in g); b in termsof intensity (MSK)
Nat Hazards
123

view. However, it is not possible to distinguish finer levels of damage since the aim of the
probabilistic seismic hazard analysis, consistent with the lack of sufficient information on
active faults, is to evaluate the distribution of seismic hazard all over the Eskisehir
province, which has larger spatial coverage than the city center of Eskisehir province, at a
macrolevel. Accordingly, a deterministic analysis is carried out in order to quantify the
level of damage for the 31 neighborhoods located in Odunpazari municipality by estab-
lishing a finer rating within the range of moderate damage. For this purpose, a more
detailed damage analysis is carried out based on the characteristics of buildings located in
these neighborhoods and by selecting a scenario earthquake.
Servi (2004) has compiled a database for the 27,904 buildings located in the 31
neighborhoods of the Odunpazari municipality based on the records kept officially by the
municipality for the registered buildings. This database contains information on the
location (longitude and latitude), number of floors, soil classification (Z1, Z2, Z3, Z4),
apparent quality (very bad, bad, moderate, good), and type (reinforced concrete, masonry,
wooden) of these buildings. The soil classification indicated above is according to the
Turkish Seismic Code (Code 1997) as detailed in Table 3. In this table, VS denotes the
shear wave velocity.
Seismic Risk Analysis Software (SRAS) described in Yakut and Kucukcoban (2005) is
used in order to assess the expected damage in these buildings due to the selected scenario
earthquake. The software uses five data sets to start the damage estimation analysis. These
are building inventory data, attenuation relationship data, scenario earthquake data,
capacity curves for each building type, and the analysis method data. Reliable building
inventory data are must to obtain realistic results for the defined scenario earthquake
assuming that attenuation relationship and the analysis method yield dependable results
(Yakut and Kucukcoban 2005). The calculation involves three parts, namely demand
calculation, performance calculation, and damage estimation. Demand calculation part
initially finds the shortest distance between each building in the considered region and the
fault associated with the scenario earthquake and then generates smoothed acceleration
response spectrum expected under each building. Subsequently, the performance calcu-
lation module computes performance using the generated demand curve and the provided
capacity curve for each building. Finally, damage estimation module predicts the perfor-
mance of each building under the scenario earthquake induced forces.
The building inventory data require the following information for each building:
location, site soil classification, number of stories, type of construction, age, and apparent
quality. It is to be noted that all the required building inventory data are provided
Table 3 Site soil classification scheme according to Turkish Seismic Code (Code 1997)
Classname
General description Mean VS (m/s)
Min. Ave. Max.
Z1 FIRM to HARD ROCKS (e.g., rock, very stiff clay,very dense sands)
700 850 –
Z2 GRAVELLY SOILS and SOFT to FIRM ROCKS(e.g., tuffs, agglomerate, stiff clays, dense sands)
400 550 700
Z3 STIFF CLAYS and SANDY SOILS (e.g., soft deposits,medium dense sand, stiff clay and silt)
200 300 400
Z4 SOFT SOILS (e.g., high water table ? alluvial deposits,loose and soft clay and silt)
– 180 200
Nat Hazards
123

by Servi (2004), for the 27,904 registered buildings located in the 31 neighborhoods of the
Odunpazari municipality as stated above. For more information on SRAS, the reader is
referred to Yakut and Kucukcoban (2005).
Based on the past seismic activity and the seismic sources delineated in the region
(Fig. 3), it is clear that the most important seismic threat to Odunpazari municipality is due
to the Eskisehir Fault Zone. The 6.4 magnitude of the February 20, 1956, Eskisehir
earthquake is taken as the magnitude of the scenario earthquake to be created from this
fault. The attenuation equation of Gulkan and Kalkan (2002) is used.
The damage ratio (DR) obtained from the SRAS program for each building is used to
find the mean damage ratios (MDR) for each neighborhood. Damage ratio is defined as the
ratio of the cost of repair to the replacement cost of the building. The MDRs vary between
23.06 and 36.48% for the neighborhoods. The variation for the individual buildings is
between 21 and 37%. The largest MDR of 36.48% is observed for the neighborhood of
Sumer, which is a very small region. Here, it was only possible to evaluate 4 registered
buildings. These are all high-rise reinforced concrete buildings of 9–10 floors, all located
on Z3 soil class (see Table 3) and their apparent qualities are rated as very poor. As a result
the highest MDR is observed in this small neighborhood. In earthquake damage evaluation,
the damage ratios between 10 and 50% are rated as moderate damage based on the damage
probability matrices developed for Turkey by Yucemen (2005). Accordingly, all of the
neighborhoods of Odunpazari municipality are expected to experience moderate damage
due to this scenario earthquake. This result is also consistent with the results of the
probabilistic seismic hazard analysis conducted for the Eskisehir province as described in
the previous sections. However, in order to distinguish the neighborhoods according to the
expected mean damage ratio, a finer subdivision is established as follows: The neigh-
borhoods with MDR less than 25% are classified as Light, those with MDR between 25 and
28% as ‘‘Light-moderate’’ and those with MDR [ 28% as ‘‘Moderate’’. The indicator
variables 0 (zero), 1 (one), and 2 (two) are assigned, respectively, to these three groups.
The results of this classification are shown in Table 4, and these will form the basis for the
assessment of vulnerabilities in the following stage of the proposed integrated vulnerability
assessment framework. When the values of Table 4 are mapped for neighborhoods of
Odunpazari municipality, spatial distribution of structural vulnerability can easily be
visualized (Fig. 6). Figure 6 shows that in Odunpazari, the northern neighborhoods have
building vulnerability ranging from moderate to light-moderate, and the central to southern
parts have light building vulnerability. In Odunpazari municipality, the central and
southern parts constitute the older parts, with concentrations of many historic buildings. On
the other hand, the northern part is the newly developed section of the municipality that has
relatively high building vulnerability. This distribution of vulnerability is contradictory to
the common observation that vulnerability increases with the age of buildings and is due to
the fact that the newly developed section is located in a region where the soil conditions are
poor and this problem is not taken into consideration adequately in the construction of
these new buildings.
3.4 Socio-economic vulnerability analysis for Odunpazari
In this study, the major sociological dimensions of socio-economic vulnerability are
defined by referring to such characteristics of individuals:
1. Socio-demographic dimension refers to population profile, age distribution, marital
conditions, gender, race/ethnic composition, health status, migration, household size,
Nat Hazards
123

and number of dependent persons in the household like children under the age 15 and
elderly over the age 65?.
2. Socio-economic dimension refers to level of education and skills, level of income,
house and property ownership, employment status as self-employed or wage or
salaried work, seniority in work, size of workplace and investment if self-employed,
degree and nature of risks related to unemployment and/or specific job losses, access
to welfare benefits, social networks—social solidarity and reciprocal ties among
family, relatives, friends, neighbors as well as housing conditions, house ownership
Table 4 The level of expected damage for the different neighborhoods of the Odunpazari municipality(0 ‘‘Light’’; 1 ‘‘Light-moderate’’; 2 ‘‘Moderate’’)
Neighborhood Mean damageratio (MDR %)
Damageindicator
Neighborhood Mean damageratio (MDR%)
Damageindicator
Akarbasi 27.56 1 Huzur 23.65 0
Akcaglan 26.95 1 Istiklal 27.61 1
Akcami 25.20 1 Karapinar 23.06 0
Alanonu 24.66 0 Kirmizitoprak 27.95 1
Arifiye 28.12 2 Kurtulus 26.68 1
Buyukdere 24.13 0 Orhangazi 24.19 0
Cankaya 24.79 0 Orta 24.49 0
Cunudiye 23.60 0 Osmangazi 25.08 1
Dede 23.88 0 Pasa 24.41 0
Deliklitas 28.47 2 Sarkiye 23.70 0
Emek 24.56 0 Sumer 36.48 2
Erenkoy 23.44 0 Visnelik 28.96 2
Gokmeydan 26.89 1 Yenidogan 23.31 0
Goztepe 24.33 0 Yenikent 29.51 2
Gultepe 24.35 0 Yildiztepe 24.02 0
Gundogdu 23.62 0
Fig. 6 Spatial distribution of building vulnerability (fragility) in Odunpazari
Nat Hazards
123

status (owner occupied or rented), nature of physical infrastructure like roads,
sanitation, access to clean water, etc.
3. Social security dimension refers to the degree and nature of social insurance and social
security benefits for the population, access to retirement payments, access to health
care, public provisions for population with special needs like disability, homeless, etc.
4. Socio-spatial dimension refers to regional differences, mainly urban/rural settlements.
5. Political dimension refers to the level of political participation of the people, as well as
the policies and activities of the local governments toward reduction of all
vulnerabilities and social risks.
6. Behavioral dimension refers to the level and nature of perceptions of risks in the
population, attitudes toward all kinds of risks and specifically disasters and earthquake
risks, political awareness and being organized as pressure groups to be effective on
policies, the level of precautions taken by the population.
In fact, within the scope of sociological dimensions explained above, the socio-eco-
nomic vulnerability is understood as an outcome of existing social inequalities in the
society. Furthermore, some studies conducted so far show that ill health, disability and
poverty are all closely associated with vulnerability. Additionally, social inequalities
determine the space where individuals live and the nature of this living place. The vul-
nerability of the living space (including the dwelling, neighborhood and means and
endowment of infrastructures in that neighborhood) is also effective in the determination of
the socio-economic vulnerability in close association with the characteristics of the indi-
vidual. The vulnerability of this living space is further increased by factors, such as the
level of urbanization, population growth, and density. Consequently, it can be assumed that
places where the poor live have poorer infrastructural services. This is the point where the
space is interwoven with what is social. All these sociological and spatial features deter-
mine the levels at which individuals are affected before, during, and after the hazard and
the time required for recovery.
Assessment of socio-economic vulnerability in Odunpazari municipality is carried out
in terms of four stages: (a) sample selection and questionnaire development, (b) cluster and
indicator development, (c) measurement analysis and indicator selection, and (c) index
development.
3.4.1 Sample selection and questionnaire development
To develop a social vulnerability index, a representative database on the basis of neigh-
borhoods and streets is needed. On the other hand, province-based data collected by the
Turkish Statistical Office (TUIK) is not published as disaggregated by neighborhoods and
streets. This causes researchers to face with difficulties in reaching relevant databases. In
order to overcome this difficulty, in this study, a field research was conducted to reach
representative and space-based data in terms of neighborhoods. The addresses required
were obtained from the Eskisehir Greater Municipality database after signing a confi-
dentiality agreement. Such a database was developed as ‘‘City Information System’’ by
Eskisehir Greater Municipality which enabled ‘‘muhtars’’ (local administrators) to sys-
tematically follow any changes in the status of the registered households residing in their
respective neighborhoods. From this database, 5% of addresses were randomly selected
from the neighborhoods and streets of Odunpazari and used as the sample of the field
research for the present study. Consequently, building numbers were determined from
randomly selected streets in 31 neighborhoods of Odunpazari and its streets.
Nat Hazards
123

Later, however, considering that the focus of this study is to understand socio-economic
vulnerability before and after an earthquake, the research team decided to modify the
sample so as to give relatively more weight to addresses from the inner streets rather than
main streets and boulevards. It was decided to interview only one household from each
selected building (address). Determining which household this should be constituted the
second stage of the sampling process. At the second stage, it was assumed that the number
of stories in a building is an important indicator of earthquake vulnerability reviewing the
previous earthquake casualties in Turkey. The death tolls were higher in lower stories.
Accordingly, interviews were conducted with households living in:
Flat on the 1st storey in single storey buildings
Flat on the 2nd storey in two-storey buildings
Flat on the 2nd storey in three-storey buildings
Flat on the 3rd storey in four-storey buildings
Flat on the 4th storey in five-storey buildings, and
Flat on the 5th storey in six-storey buildings.
In cases where there were more than one flat in a storey, questionnaires were conducted
with that household who accepted to be interviewed. Questionnaires were administered
with one household member over the age of 18 and who was capable to answer the
questions. The original sample consisted of 1,500 households, and interviews were con-
ducted with 1498 of these. This high rate of realization stems from the fact that the sample
included those households present in their homes at the time of the field research and were
ready to take part.
The questionnaire was made up of 69 open- and close-ended questions under 8 sub-
headings. In order to form the questionnaire, the above explained sociological dimensions
have to be converted into relevant indicators to measure socio-economic vulnerability
before and after an earthquake.
3.4.2 Cluster and indicator development
First, a broad literature review was made to find similar studies. In this review, the most
relevant study was found to be by Cutter et al. (2003). In this study, property, income,
employment, education, demography, social, politics, local government, attitude, and
behavior of individuals were mentioned as relevant indicators of vulnerability involved in
environmental hazards. However, all such mentioned indicators in the literature should be
re-defined within the specific local conditions of the town/space under study and with
respect to the conditions of an earthquake. Additionally, since this is the first study of this
kind in Turkey, in terms of developing a single socio-economical vulnerability index for
each neighborhood, other previous sociological researches on earthquakes conducted in
Turkey (Kasapoglu and Ecevit 2001; Izmit Kent Kurultayi 2000; Akdur 2001; Adapazari
Chamber of Industry and Commerce 2000) were also reviewed. Hence, the items of the
questionnaire were derived from the findings of these studies, mainly conducted after
the Marmara earthquake to assess the social, economical, and cultural impact on the
households.
After the literature review, 9 clusters and 57 indicators of social vulnerability were
decided to be used in the vulnerability assessment questionnaire. It decided to include a
wide list of indicators as derived from the literature in order not to miss any significant
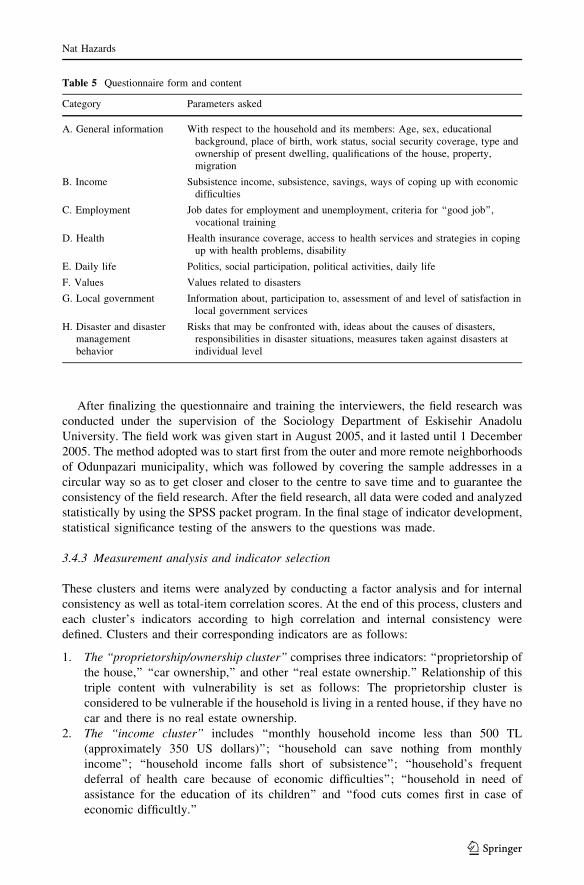
findings. The Table 5 below displays the contents of the questionnaire prepared according
to this wider perspective.
Nat Hazards
123
After finalizing the questionnaire and training the interviewers, the field research was
conducted under the supervision of the Sociology Department of Eskisehir Anadolu
University. The field work was given start in August 2005, and it lasted until 1 December
2005. The method adopted was to start first from the outer and more remote neighborhoods
of Odunpazari municipality, which was followed by covering the sample addresses in a
circular way so as to get closer and closer to the centre to save time and to guarantee the
consistency of the field research. After the field research, all data were coded and analyzed
statistically by using the SPSS packet program. In the final stage of indicator development,
statistical significance testing of the answers to the questions was made.
3.4.3 Measurement analysis and indicator selection
These clusters and items were analyzed by conducting a factor analysis and for internal
consistency as well as total-item correlation scores. At the end of this process, clusters and
each cluster’s indicators according to high correlation and internal consistency were
defined. Clusters and their corresponding indicators are as follows:
1. The ‘‘proprietorship/ownership cluster’’ comprises three indicators: ‘‘proprietorship of
the house,’’ ‘‘car ownership,’’ and other ‘‘real estate ownership.’’ Relationship of this
triple content with vulnerability is set as follows: The proprietorship cluster is
considered to be vulnerable if the household is living in a rented house, if they have no
car and there is no real estate ownership.
2. The ‘‘income cluster’’ includes ‘‘monthly household income less than 500 TL
(approximately 350 US dollars)’’; ‘‘household can save nothing from monthly
income’’; ‘‘household income falls short of subsistence’’; ‘‘household’s frequent
deferral of health care because of economic difficulties’’; ‘‘household in need of
assistance for the education of its children’’ and ‘‘food cuts comes first in case of
economic difficultly.’’
Table 5 Questionnaire form and content
Category Parameters asked
A. General information With respect to the household and its members: Age, sex, educationalbackground, place of birth, work status, social security coverage, type andownership of present dwelling, qualifications of the house, property,migration
B. Income Subsistence income, subsistence, savings, ways of coping up with economicdifficulties
C. Employment Job dates for employment and unemployment, criteria for ‘‘good job’’,vocational training
D. Health Health insurance coverage, access to health services and strategies in copingup with health problems, disability
E. Daily life Politics, social participation, political activities, daily life
F. Values Values related to disasters
G. Local government Information about, participation to, assessment of and level of satisfaction inlocal government services
H. Disaster and disastermanagementbehavior
Risks that may be confronted with, ideas about the causes of disasters,responsibilities in disaster situations, measures taken against disasters atindividual level
Nat Hazards
123

3. The ‘‘employment cluster’’: The household is deemed to be vulnerable in terms of
employment in case ‘‘household head is unemployed’’ and if there is also ‘‘somebody
else unemployed in the same household.
4. The ‘‘education cluster’’: Household is vulnerable if the ‘‘level of education of
household head is below primary school’’, if the ‘‘level of education of the spouse of
the household is below primary school,’’ and if there is ‘‘no books in the house other
than school textbooks.’’
A study conducted following the Marmara Earthquake revealed the importance of
education as a leading parameter where rational behavior and attitude went hand in hand
with higher levels of education and where education stood as one of the most important
independent variables, as it is was in many other cases, that particularly determined request
for support (Kasapoglu and Ecevit 2001; Adapazari Chamber of Industry and Commerce
2000).
5. The ‘‘demographic cluster’’: Household size is taken as a major indicator. Households
with 6 or more members are determined as demographically vulnerable. According to
Poverty Survey by Turkish Statistical Office (2004), for all Turkey (including rural and
urban), households with 7 or more members are found to be vulnerable to poverty.
Since Eskisehir is an urban area and household size is lower than Turkey’s average,
researchers decided households with 6 or more members can be considered as
vulnerable.
6. The ‘‘migration cluster’’ has three contents: Households with ‘‘duration of residence in
Eskisehir shorter than 5 years’’, ‘‘duration of residence in the present neighborhood is
5 years or shorter’’ and ‘‘households with scant confidence in the house they are
living’’ are considered vulnerable in terms of migration.
7. The ‘‘politics cluster’’: It is assessed in terms of ‘‘daily taking of a national paper’’ and
‘‘holding a political opinion’’. Political vulnerability emerges if households do not
follow daily papers regularly and state no political opinion. Again, in the previous
studies about the coping strategies with the after effects of the earthquakes, it was
found that households who have information about government decisions and policies
can cope better.
8. The ‘‘spatial cluster’’ has two major indicators. In the questionnaire, the respondents
were asked to assess 13 local government services with respect to the quality of these
services and their level of satisfaction. In this cluster, however, the point was confined
to level of satisfaction with respect to services related to disasters. Related questions
included those on the type of dwelling, how heating is provided, features of the
dwelling in terms of infrastructure (electricity, water, and sanitation) and household
items owned. In this cluster, spatial vulnerability is determined by the evaluations of
the respondents of the local government services under urgent action plans ‘‘in cases of
disasters like earthquake, flood, and fire are insufficient.’’ Also, households living in
squatter housing areas and in such dwellings where heating is provided by stove are
considered to be vulnerable.
9. The cluster ‘‘disaster-related attitude/behavior/beliefs’’: In this cluster, 6 questions
were forwarded under the heading attitudes/values/beliefs. These questions were to be
responded within the framework of 5 scales (fully agree, agree, undecided, disagree,
and fully disagree) in order to convert a somewhat subjective dimension into an
indicator. Vulnerability indicators of this cluster were respondents’ declarations in
terms of citizenship responsibilities and payment of taxes. In that sense, opposing
views to the statements ‘‘it is the responsibility of citizens to construct houses resistant
Nat Hazards
123

to earthquake, fire, and flood’’ and ‘‘I agree to pay more taxes for a cleaner and safer
environment’’ were taken as heightening the risk of vulnerability from earthquakes.
The inclusion of attitudes is again mentioned by previous studies who emphasized that
the populations expecting everything from the state and not taking their own
precautions due to such behavior are vulnerable. In sum, we have nine clusters
accompanied by relevant indicators that increase social vulnerability as shown in
Table 5.
After the determination of the nine clusters and related indicators, they were examined
with respect to internal consistency and item-sum correlations. Then, each indicator was
assigned a weight between 0 and 1 points. In the literature, it is common to assign weights
to indicators in order to stress the relative importance of some indicators over the others.
The arguments underlying this approach were considered; however, in the absence of an
empirical justification for weighting, it was decided to treat each variable as having an
equal weight. Cluster scores were obtained by adding up these 0–1 points. Hence, selected
variables can be gathered under a single factor for each area. Furthermore, they yielded
high correlation with the total and strengthen internal consistency.
In the factor analysis, when the indicators were checked for internal consistency and
intercorrelations, it was seen that certain issues can be gathered under a single dimension
that are related to each other. Hence, a total score to strengthen internal consistency was
identified. Accordingly, nine clusters were reduced to four: namely proprietorship, income,
education, and politics, which were found to constitute a coherent whole. Factor analysis
showed that 45.81% of variance in total score could be explained by this four-variable
structure. Weight values that these four variables assumed in the context of the first factor
turned out as 0.61, 0.77, 0.66, and 0.66, respectively. Internal consistency coefficient,
Cronbach alpha, (Cronbach 1951, Crocker and Algina 1986) was calculated as 0.77, and
correlations of clusters with total score were found as 0.63, 0.74, 0.66, and 0.66,
respectively.
Afterward, each cluster was transformed into Z scores with zero mean and standard
deviation of 1, and vulnerability index was obtained by adding these up. This value, in turn,
was transformed into T score with an average value of 250 and standard deviation of 10.
The distribution of vulnerability index that ranges from 23.93 to 73.29 is shown in the chart
below.
At the end of the analysis it was found that while households with vulnerability scores
under 40 are considered to have ‘‘light vulnerability,’’ those in the interval 40 and below 60
are considered to have ‘‘moderate vulnerability’’ and others with scores 60 and higher are
considered to be ‘‘highly vulnerable.’’ (See Table 6)
The statistical findings were also examined whether vulnerability scores differed with
respect to neighborhoods. Since there were very few observations in some neighborhoods,
the normality assumption of single direction variance analysis could not be satisfied, and
instead, Kruskal–Wallis test, which is the nonparametric equivalent of the former, was
applied. This test showed that with 95% confidence level, there are significant differences
with respect to neighborhoods.
3.4.4 Index development
Finally, the socio-economical vulnerability indexes for the neighborhoods are mapped by
using GIS. Figure 6 shows that in Odunpazari, the central and south eastern parts have high
degree of social vulnerability, whereas the northern parts have light socio-economic
Nat Hazards
123

vulnerability levels. When the maps for building (Fig. 6) and socio-economic (Fig. 7)
vulnerabilities are compared, it can be seen that socio-economically least vulnerable
neighborhoods have structurally more vulnerable building stocks.
As can be seen from the results of socio-economic vulnerability analysis, differential
socio-economic vulnerability of different groups is found as supported by the literature. In
that sense, it can be argued that socio-economic vulnerability has the following
characteristics:
1. It differs among different sections of the society based on age, gender, and health
differences.
2. The most disadvantaged, poor, and dependent sections can usually be more vulnerable.
3. However, vulnerability may not necessarily depend on wealth or poverty as the level
of fragility of buildings can vary. The most vulnerable people may not be found in the
most vulnerable places: Poor people can live in resilient physical environments and be
vulnerable because of the lack of resources and access to basic needs, and wealthy
Table 6 Indicators that exacerbate social vulnerability
Cluster type Variables Condition of beingvulnerable
Ownership Owner of the house Lessee
Car If no car
Real estate If none
Income Monthly household income If less than 500 TL
Saving If no saving
Whether income is sufficient If not sufficient
Assistance for education If none received
Deferral to healthcare services because of economicdifficulties
If frequently deferred
What is cut in case of economic difficulty If there is cut from food
Employment Job of household head If unemployed
Any other unemployed household member If there is one
Education Education level of household head If primary or lower
Education level of spouse If primary or lower
Any book other than textbook If none
Demography Household size If 6 or more
Migration Duration of residence in the city If 5 years or shorter
Duration of residence in the neighborhood If 5 years or shorter
Confidence in house If none
Politics Following any daily paper If none
Political opinion If none is stated
Space Earthquake related local government services If considered insufficient
Type of dwelling If squatter housing
Any restoration in the house If done
Heating in the dwelling If stove is used
Attitude/belief
Citizen responsibility If not accepted
Willing to pay higher taxes for earthquake-safe places If not accepted
Nat Hazards
123

people can be living in fragile physical environments and not vulnerable because they
have more and stable access to resources, such as better precautions. In Eskisehir, as
well as all over Turkey, the construction of the buildings is given to the private and
single constructors. The system works such that a person who owns a piece of urban
land can make an agreement with a constructor in return for a specified number of
apartment flats for the land. The number of flats the land owner can get depends on the
size of the land and its market value. Despite the fact that municipalities are
responsible from license control checks and safety regulations, such a procedure was
implemented with a very flexible understanding before the 1999 Marmara earthquake.
So one can have luxury and modern apartment buildings on highly demanded and
valuable urban land, mainly constructed for the well-off persons, but which may not be
earthquake resistant. This finding of the research should be understood within this
framework of the realities of construction sector in Turkey, including the private
agreements between the constructor and the land owner, as well as the poor control
policies of the municipalities before 1999.
4. It is dependent on the dynamic interaction of a range of economic, social, and physical
processes, which influence the capacity of individuals, social groups, sectors, regions,
and ecosystems to respond to various socio-economic and biophysical shocks.
From socio-economic vulnerability assessment point of view, it was also found that just
as buildings do not face exactly the same risk in case of an earthquake, neither do indi-
viduals and households. In the case of any earthquake, interventions and actions may yield
better results if decision-makers, particularly local government authorities, know well
about priority areas and priority groups.
3.5 Accessibility to critical services
Physical accessibility is defined as being able reach an intended point or location in spite of
the hindrances like transportation and reflects the ease for travelers. Accessibility can be
assessed based on the measures of time, cost, distance, and population, and it is one of the
most important variables in the early planning stages. Accessibility analyses basically
serve for checking the benefits of plans as a planning control tool, and helping decision-
Fig. 7 Spatial distribution of socio-economic vulnerability in Odunpazari
Nat Hazards
123

makers to investigate the new locations of urban services, testing the benefits of the current
locations of urban services, identifying thresholds about urban services, and finding out the
capacity and service area of urban services (Kuntay 1990). When emergency accessibility
is considered, physical accessibility basically reflects emergency organization’s readiness
to respond to an emergency in a coordinated, timely, and effective manner and helps to
determine the extent to which a city is ready for any disaster. That is why, measurement
and evaluation of physical accessibility of emergency services is one of the most vital
components of disaster preparedness. A few seconds of delay by emergency response units
may mean loss of human life, environment, and property. Measuring and evaluating
emergency accessibility can help decision-makers to test the current emergency service
response performance, to identify critical areas that have low or no accessibility, and to
find out solutions in order to improve the response to these critical areas (Badri et al. 1996).
There are basically three accessibility measurement techniques: zone-based, isochronal-
based, and raster-based. It is difficult to rate any one of these as the best measuring
technique. Different situations and purposes demand different approaches (Makri and
Folkesson 1999).
In zone-based accessibility, the accessibility evaluations are calculated and presented in
zone-based units, such as administrative units, quarters, etc. Based on costs on a trans-
portation network (usually time or distance), the accessibility values are calculated for each
zone separately from zone centroid to related urban service or vice versa. The disadvantage
of this technique is that the same accessibility result is obtained for the whole zone. It has
an advantage of producing easily comparable results with other urban-based parameters.
One of the other accessibility measurement techniques is the isochronal technique,
where the accessibility evaluations are calculated and presented in an isochronal logic. An
isochrone is a line on a map that connects points of equal travel time away from a single
reference point. If an origin is defined as the reference point, isochrones can be drawn
connecting points in all directions that can be reached in a threshold time or distance. The
isochrone is irregularly shaped because of the structure of transportation network. Routes
make it possible to travel faster in some directions than in others. The representation of the
accessibility results can be either total of polylines having similar accessibility costs
(polyline-based representation) or simple polygons that connect the edges of related
polylines (polygon-based representation). Polygon-based representation is mostly used to
be able to perform GIS-based overlay analyses; on the other hand, polyline-based repre-
sentation can also be chosen for visual representations. The basic disadvantage of this
technique is that the details of the accessibility costs directly depend on the selected
threshold intervals and the same accessibility value is obtained for the isochrones (Ertugay
and Duzgun 2006).
The raster-based technique is similar to isochronal-based technique; however, in
raster-based technique, equal travel time or distance from a reference point is represented
by the value of pixels in raster environment instead of isochrones, which are lines in
vector environment. An advantage of this technique is that more detailed costs (time or
distance) can be obtained based on selected pixel size. The traditional methods of
accessibility evaluation do not consider the whole territory and mainly based on node/arc
logic, so accessibility evaluation can be done in raster environment in order to create a
continuous model. The main disadvantage of it is that working in raster environment
reduces the geometrical accuracy of the information (mostly preferred in regional
studies, which does not necessitate high spatial accuracy) but opens a wide range of new
analysis capabilities.
Nat Hazards
123

In this study, the three different accessibility measurement techniques (zone-based,
isochronal-based, and raster-based) are used within GIS environment creating an acces-
sibility vulnerability index. Four steps are followed: (a) data collection; (b) calculation of
accessibility costs; (c) analysis of physical accessibility of emergency services based on
three different accessibility measurement techniques (zone-based, isochronal-based and
raster-based); (d) creation of emergency accessibility vulnerability indexes.
1. Data collection: The data used in the study are digital transportation network data,
their hierarchies and average speeds, the location of emergency services of fire
brigades and health services, and the administrative borders of neighborhoods, which
are obtained from Eskisehir Great City Municipality.
2. Calculation of accessibility costs: In all of the three techniques, average speeds
extracted from Eskisehir metropolitan municipality travel survey are reduced by 30%,
assuming that in case of disaster emergency, the traffic speeds will be less than the
normal ones and are used for calculating travel costs. In zone-based technique, the
polygons of quarters are converted to centroids, and the costs (distance and time)
among each emergency services and centroids are calculated. In isochrone-based
technique, network analyst function of GIS is used to define the accessed networks
from emergency services. In raster-based technique, the vector transportation network
is converted to raster, and costs for each pixel are calculated based on average speed
and pixel size (The 5 km/h speed accepted for average pedestrian speed and attached
to unnetworked cells).
3. Analysis of physical accessibility of emergency services: There are two fire brigades in
Eskisehir, one of which is the Tepebasi fire brigade located in the northern part of the
city, the other one is the Odunpazari fire brigade located in the south. There are also a
total of 36 hospitals in Eskisehir, 18 out of these 36 are local clinics.
The zone-based accessibility costs for fire brigades are calculated for single access
(fire brigade to quarter). The zone-based accessibility costs for ambulances are calcu-
lated for three different cases that are single access cost (hospital to quarter), return
access cost (hospital to quarter to hospital), and capacity constrained access cost
(hospital to quarter to hospital with a constraint based on hospital capacity). The details
of these calculations can be found from Ertugay and Duzgun (2006). The isochronal-
based accessibility costs for fire brigades and health services are calculated for 0- to
5-min time intervals, as reaching an emergency case in 5 min is the critical threshold
for emergency accessibility. Similarly, the raster-based accessibility costs for fire bri-
gades and health services are calculated for each pixel continuously and classified
0–5 min time intervals.
4. Creation of emergency accessibility vulnerability indexes: The accessibility values
obtained from each method and those for the considered emergency services are
combined by using Eq. 3. Then, the vulnerability indexes are classified in a scale of
1–3; 1 being the least vulnerable, 2 being medium vulnerable, and 3 being highly
vulnerable.
Figure 8 shows that in Odunpazari, the neighborhoods on the axis from north to south
have least vulnerability in terms of accessibility to critical services. However, the neigh-
borhoods on the periphery have the highest vulnerability. When the maps for building
(Fig. 6), socio-economic (Fig. 7), and accessibility to critical services (Fig. 8) vulnera-
bilities are compared, it is observed that every component of urban vulnerability has a
different spatial pattern.
Nat Hazards
123

3.6 GIS-based integrated vulnerability assessment
In this study, the different types of vulnerability indexes assessed for the Odunpazari
municipality are combined by using Eq. 1. Here, simple additive weighting (SAW) method
is used, where each one of the vulnerability indexes is given equal weights. It is also
possible for decision-makers to assign different weights in order to analyze several
earthquake scenarios at different disaster phases. For example, vulnerability due to
accessibility to critical services can be given a higher weight during the response period of
an earthquake as compared to the post-disaster phase. The spatial distribution of the overall
vulnerability assessed for the Odunpazari municipality is displayed in Fig. 9. The overall
vulnerability pattern of the neighborhoods in the Odunpzari municipality is subject to
Fig. 8 Spatial distribution of accessibility to critical services in Odunpazari
Fig. 9 Spatial distribution of overall vulnerability in the Odunpazari municipality
Nat Hazards
123

variations depending on the decision-makers’ interest and type of the disaster phase to be
considered.
3.7 Visualization of overall vulnerability in 3D
Visualization of the evaluated vulnerabilities provides input for decision-making and
increases disaster awareness among decision-makers (US HHS 2002). In the literature, it
has been shown that the presentation of hazards, vulnerability, coping capacity, and risk in
the form of digital maps has a higher impact than traditional analog information repre-
sentations (Martin and Higgs 1997). Digital maps are being progressively more used by
disaster managers. In addition to the digital maps, 3D visualizations have the potential to
be an even more effective communication tool (Kolbe et al. 2005, Marincioni 2007, Raper
1989, Zlatanova et al. 2002). Three-dimensional representations significantly reduce the
amount of cognition exertion and improve the efficiency of the decision-making process
(Kolbe et al. 2005, Zlatanova 2008). However, to achieve an appropriate 3D visualization,
two aspects must be ensured: appropriate presentation and tools for interaction.
In such a visualization case, users are the key element which include municipality staff,
such as urban planners, cartographers, and sociologists in the considered case study. They
require clear view of the distribution of vulnerable regions throughout the city. The
Eskisehir municipality has an urban information system infrastructure, so they have quite
reliable data and sophisticated software (planning, cartographic, and GIS software). A 3D
urban model environment is used to visualize the previously calculated social, physical,
and accessibility vulnerability indexes of each building object. The pilot area is a part of
the city centre and has various kinds of city development textures, including low-rise,
historic buildings and high-rise apartments. There are nearly 400 buildings in the case
study area.
Used data for visualization are as follows: vector layers from the Eskisehir Municipality
Digital City Information System, street and building footprint layers, and 1/25,000 digital
contour maps. To construct building objects, facade images and building height data are
needed, which are collected by a field survey. The following steps are used to develop an
urban model:
1. 2.5D DEM generation from digital contour maps.
2. Generation of facade textured boundary representation (B-rep) buildings by using
building height information and ground images.
3. Draping of city furniture, tree points, road data, and building models with a terrain
model.
4. Relating vulnerability indexes that are in the tabular form to the building objects.
The detail of the 3D virtual city model generation is given by Kemec and Duzgun
(2006a, b). Figures 10 and 11 illustrate typical 3D visualization realizations. The main
expected benefit of this pilot visualization application is to demonstrate the positive effects
of well-balanced 3D models on the decision-makers as a communication tool.
4 Conclusions
The proposed integrated vulnerability assessment framework is flexible and can easily be
applied to urban environments at various geographical scales with different mapping units.
As the vulnerability maps prepared for the neighborhoods of the considered case study
Nat Hazards
123

indicate the relative vulnerability of the neighborhoods in each vulnerability class
(structural, socio-economical, and accessibility), it provides a guideline for the decision-
makers to prioritize scarce resources. For example, the highly vulnerable neighborhoods
due to their accessibility to critical services can be improved by providing more service
locations or rearranging the service locations. In this sense, the overall vulnerability maps
for the urban area have potential for decision-makers in designing vulnerability reduction
strategies and hence risk reduction strategies. Moreover, as several aspects of elements at
risk for an urban area are considered through vulnerability analyses, effect of changes in
vulnerability conditions on the overall vulnerability maps can easily be determined.
Although not all aspects of the proposed framework have been implemented in the case
study, it is believed that if sufficient data become available, total vulnerability for the urban
environment can be assessed in more detail. In addition, the developed framework enables
decision-makers to monitor temporal and spatial changes in the urban environment due to
implementation of risk reduction strategies.
Acknowledgments The authors would like to thank the anonymous reviewer for the accurate reading ofthe manuscript and providing valuable comments on the initial manuscript. This research work is partlysupported by the Institute of Natural and Applied Sciences, Middle East Technical University (Project No:BAP-08-11-DPT2002K120510). The authors also express their thanks to Eskisehir Greater MetropolitanMunicipality and Odunpazari Municipality for providing data for the application of the case study,Dr. Fatima Gunes for her invaluable efforts during the implementation of field surveys for socio-economicalvulnerability, Prof. Dr. Ali Kocyigit for his contributions to the delineation of seismic source zones, andMr. Mehmet Servi for providing the building damage data for Odunpazari.
Fig. 10 General view from the 3D urban visualization
Fig. 11 Visualization of various vulnerabilities in the 3D city model
Nat Hazards
123

References
Adapazari Chamber of Industry and Commerce (2000) Adapazari’nda Deprem ve Sonrasi, (Earthquake inAdapazari and after), Adapazari
Akdur R (2001) Afetlere Karsı Saglık Hizmeti Senaryoları Yazma: Deprem Ornegi (Writing up Scenarios ofHealth Services in Disaster Situations: The Case of Earthquake). http://www.bsm.gov.tr/umke/ftp/afetlerde_saglik_hizmeti_senaryolari.pdf
Alexander D (2000) Confronting catastrophe: new perspectives on natural disasters. Oxford UniversityPress, New York
Badri MA, Mortagy AK, Alsayed CA (1996) A multi-objective model for locating fire stations. Eur J OperRes 110:243–260
Bommer J, Spence R, Erdik M, Tabuchi S, Aydınoglu N, Booth E, del Re D, Peterken O (2002) Devel-opment of an earthquake loss model for Turkish catastrophe insurance. J Seismol 6:431–446
Boore DM, Joyner WB, Fumal TE (1997) Equations for estimating horizontal response spectra and peakacceleration from Western North American earthquakes: a summary of recent work. Seismol Res Lett68(1):128–153
Code (1997) Specifications for structures to be built in Disaster areas. General Directorate of DisasterAffairs, Ministry of Public Works and Settlement, Ankara (in Turkish)
Crocker L, Algina J (1986) Introduction to classical and modern test theory. Harcourt Brace JovanovichCollege Publishers, Fort Worth, pp 119–122
Cronbach LJ (1951) Coefficient alpha and the internal structure of tests. Psychometrika 16(3):297–334Cummins PR, Laura S, Kong L, Sakate K (2009) Introduction to ‘‘tsunami science four years after the 2004
Indian Ocean tsunami, part I: modelling and hazard assessment. Pure Appl Geophys 165:1983–1989Cutter SL (2003) The vulnerability of science and the science of vulnerability. Ann Assoc Am Geogr
93(1):1–12Cutter SL, Boruff BJ, Shirley WL (2003) Social vulnerability to environmental hazards. Soc Sci Q
84(2):242–261Davidson R, Shah HC (1997) A multidisciplinary urban earthquake disaster risk index. Earthq Spectra
13(2):211–223Deniz A (2006) Estimation of earthquake insurance premium rates for Turkey. M.Sc. Thesis, Department of
Civil Engineering, METU, AnkaraDeniz A, Yucemen MS (2010) Magnitude conversion problem for the Turkish earthquake data. Nat Hazards.
doi:10.1007/s11069-010-9531-8Dowrick DJ (2002) Earthquake risk reduction actions for New Zealand, technical conference of New
Zealand sciety of earhquake engineering, NapierDowrick DJ (2003) Earthquake risk reduction. Wiley, New YorkErdik M, Demircioglu M, Sesetyan K, Durukal E, Siyahi B (2004) Earthquake hazard in Marmara region,
Turkey. Soil Dyn Earthq Eng 24:605–631Ertugay K, Duzgun HSB (2006) Integrating physical accessibility of emergency establishments into
earthquake risk assessment. In: ECI conference: geohazards—technical, economical and social riskevaluation 18–21 June 2006, Lillehammer, Norway. Paper 45
Evans GW, Kantrowitz E (2002) Socioeconomic status and health: the potential role of environmental riskexposure. Annu Rev Public Health 23:303–331
FEMA-NIBS (1999) HAZUS: user’s manual and technical manuals, vol 1–4. Federal emergency Man-agement Agency and Institute of Building Sciences, Washington, DC
GDDA-ERD (2004) Internet page of the Earthquake Research Department of Turkey, General Directorate ofDisaster Affairs, Ministry of Public Works and Settlement, Ankara. TURKNET, http://sismo.deprem.gov.tr/VERITABANI/turknetkatalog.php
Gulkan P, Kalkan E (2002) Attenuation modeling of recent earthquakes in Turkey. J Seismol 6:397–409Hewitt K (1997) Regions of risk: a geographical Introduction to Disasters. Logman, HarlowISC (2004a) Internet page of the Earthquake Research Department of Turkey. General Directorate of
Disaster Affairs, Ministry of Public Works and Settlement, Ankara. ISC Based, http://sismo.deprem.gov.tr/VERITABANI/isckatalog.php
ISC (2004b) Internet page of the International Seismological Centre, International Seismological Centre,Thatcham, United Kingdom. On-line Bulletin, http://www.isc.ac.uk/Bull
Izmit Kent Kurultayi (2000) Kocaeli Deprem Sonrası Demografik, Ekonomik ve Sosyal Durumu, ArastirmaDizisi, (Demographic, Economic and Social Conditions After Kocaeli (in Marmara Region) Earth-quake), Izmit Kent Kurultayı-Yerel Gundem 21, Kocaeli
Kakhandiki A, Shah H (1998) Understanding time variation of risk crucial implications for megacitiesworldwide. Appl Geogr 18(1):47–53
Nat Hazards
123
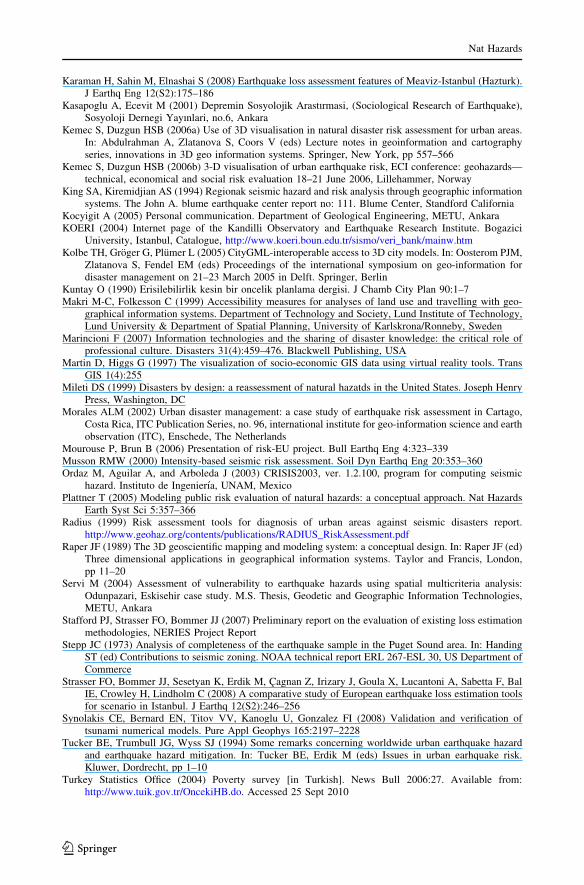
Karaman H, Sahin M, Elnashai S (2008) Earthquake loss assessment features of Meaviz-Istanbul (Hazturk).J Earthq Eng 12(S2):175–186
Kasapoglu A, Ecevit M (2001) Depremin Sosyolojik Arastırmasi, (Sociological Research of Earthquake),Sosyoloji Dernegi Yayınlari, no.6, Ankara
Kemec S, Duzgun HSB (2006a) Use of 3D visualisation in natural disaster risk assessment for urban areas.In: Abdulrahman A, Zlatanova S, Coors V (eds) Lecture notes in geoinformation and cartographyseries, innovations in 3D geo information systems. Springer, New York, pp 557–566
Kemec S, Duzgun HSB (2006b) 3-D visualisation of urban earthquake risk, ECI conference: geohazards—technical, economical and social risk evaluation 18–21 June 2006, Lillehammer, Norway
King SA, Kiremidjian AS (1994) Regionak seismic hazard and risk analysis through geographic informationsystems. The John A. blume earthquake center report no: 111. Blume Center, Standford California
Kocyigit A (2005) Personal communication. Department of Geological Engineering, METU, AnkaraKOERI (2004) Internet page of the Kandilli Observatory and Earthquake Research Institute. Bogazici
University, Istanbul, Catalogue, http://www.koeri.boun.edu.tr/sismo/veri_bank/mainw.htmKolbe TH, Groger G, Plumer L (2005) CityGML-interoperable access to 3D city models. In: Oosterom PJM,
Zlatanova S, Fendel EM (eds) Proceedings of the international symposium on geo-information fordisaster management on 21–23 March 2005 in Delft. Springer, Berlin
Kuntay O (1990) Erisilebilirlik kesin bir oncelik planlama dergisi. J Chamb City Plan 90:1–7Makri M-C, Folkesson C (1999) Accessibility measures for analyses of land use and travelling with geo-
graphical information systems. Department of Technology and Society, Lund Institute of Technology,Lund University & Department of Spatial Planning, University of Karlskrona/Ronneby, Sweden
Marincioni F (2007) Information technologies and the sharing of disaster knowledge: the critical role ofprofessional culture. Disasters 31(4):459–476. Blackwell Publishing, USA
Martin D, Higgs G (1997) The visualization of socio-economic GIS data using virtual reality tools. TransGIS 1(4):255
Mileti DS (1999) Disasters by design: a reassessment of natural hazatds in the United States. Joseph HenryPress, Washington, DC
Morales ALM (2002) Urban disaster management: a case study of earthquake risk assessment in Cartago,Costa Rica, ITC Publication Series, no. 96, international institute for geo-information science and earthobservation (ITC), Enschede, The Netherlands
Mourouse P, Brun B (2006) Presentation of risk-EU project. Bull Earthq Eng 4:323–339Musson RMW (2000) Intensity-based seismic risk assessment. Soil Dyn Earthq Eng 20:353–360Ordaz M, Aguilar A, and Arboleda J (2003) CRISIS2003, ver. 1.2.100, program for computing seismic
hazard. Instituto de Ingenierıa, UNAM, MexicoPlattner T (2005) Modeling public risk evaluation of natural hazards: a conceptual approach. Nat Hazards
Earth Syst Sci 5:357–366Radius (1999) Risk assessment tools for diagnosis of urban areas against seismic disasters report.
http://www.geohaz.org/contents/publications/RADIUS_RiskAssessment.pdfRaper JF (1989) The 3D geoscientific mapping and modeling system: a conceptual design. In: Raper JF (ed)
Three dimensional applications in geographical information systems. Taylor and Francis, London,pp 11–20
Servi M (2004) Assessment of vulnerability to earthquake hazards using spatial multicriteria analysis:Odunpazari, Eskisehir case study. M.S. Thesis, Geodetic and Geographic Information Technologies,METU, Ankara
Stafford PJ, Strasser FO, Bommer JJ (2007) Preliminary report on the evaluation of existing loss estimationmethodologies, NERIES Project Report
Stepp JC (1973) Analysis of completeness of the earthquake sample in the Puget Sound area. In: HandingST (ed) Contributions to seismic zoning. NOAA technical report ERL 267-ESL 30, US Department ofCommerce
Strasser FO, Bommer JJ, Sesetyan K, Erdik M, Cagnan Z, Irizary J, Goula X, Lucantoni A, Sabetta F, BalIE, Crowley H, Lindholm C (2008) A comparative study of European earthquake loss estimation toolsfor scenario in Istanbul. J Earthq 12(S2):246–256
Synolakis CE, Bernard EN, Titov VV, Kanoglu U, Gonzalez FI (2008) Validation and verification oftsunami numerical models. Pure Appl Geophys 165:2197–2228
Tucker BE, Trumbull JG, Wyss SJ (1994) Some remarks concerning worldwide urban earthquake hazardand earthquake hazard mitigation. In: Tucker BE, Erdik M (eds) Issues in urban earhquake risk.Kluwer, Dordrecht, pp 1–10
Turkey Statistics Office (2004) Poverty survey [in Turkish]. News Bull 2006:27. Available from:http://www.tuik.gov.tr/OncekiHB.do. Accessed 25 Sept 2010
Nat Hazards
123

US Department of Health, Human Services, (2002) Communicating in a crisis: risk communicationguidelines for public officials. Department of Health and Human Services, Washington, DC
USGS (2004a) Internet page of the United States Geological Survey. U.S. Department of the Interior,Reston, VA. USGS/NEIC (PDE) 1973—Present, available on-line at http://neic.usgs.gov/neis/epic/epic_global.html
USGS (2004b) Internet page of the United States Geological Survey. U.S. Department of the Interior,Reston, VA. Significant Worldwide Earthquakes (2150 B.C.–1994 A.D.), available on-line athttp://neic.usgs.gov/neis/epic/epic_global.html
Whitman RV (1973) Damage probability matrices for prototype buildings. R73-57, Department of CivilEngineering, Massachusetts Institute of Technology, Cambridge
Yakut A, Kucukcoban S (2005) A scenario based seismic damage estimation for Istanbul. In: Internationalconference on 250th anniversary of the 1755 Lisbon earthquake, CD-ROM paper no 32, Lisbon,Portugal
Yiing-Jenq C, Nicole H, Cheng-Hua L, Shu-Ling T, Long-Shen C, Hong-Jen C (2004) Who is at risk ofdeath in an earthquake? Am J Epidemiol 160(7):688–695
Yucemen MS (2005) Probabilistic assessment of earthquake insurance rates for Turkey. Nat Hazards35:291–313
Yucemen MS, Ozturk NY (2008) Assessment of seismic hazard due to active faults. In: Proceedings,structural reliability and its applications APSSRA’08. The Hong Kong University of Science andTechnology, Hong Kong, June. pp 253–258
Yucemen MS, Ozcebe G, Pay AC (2004) Prediction of potential damage due to severe earthquakes. StructSaf 26(3), 349–366
Zlatanova S (2008) SII for emergency response: the 3D challenges. In: Chen J, Jiang J, Nayak S (eds)Proceedings of the XXI ISPRS congress, Part B4-TYC IV, July 2008. Beijing, pp 1631–1637
Zlatanova S, Rahman AA,Pilouk M (2002). 3D GIS: current status and perspectives. In: Proceedings of thejoint conference on geo-spatial theory, processing and applications. 8–12 July, Ottawa, Canada
Nat Hazards
123