An improved mathematical model of melt/water detonations—I. Model formulation and example results
11
hr. J. Heur Mus Trunsjer. Vol. 34, No. IO, pp. 244S2-2459, 1991 0017-9310191 s3.oo+o.oo Printed in Great Britain 0 1991 Pergamon Press plc An improved mathematical model of melt/water detonations-l I. A study of escalation D. F. FLETCHER AEA Safety and Reliability, C&ham Laboratory, Abingdon, Oxon., OX14 3DB, U.K. (Received 2 1 May 1990 and injinalform I December 1990) Abstract-In this paper, the model presented in Part I is used to perform a detailed study of the effect of various model parameters and constitutive assumptions on the escalation stage of a vapour explosion. In particular, the roles played by the chosen heat transfer rate and fragmentation law, the effect of geometry, and of a non-uniform premixture are examined. Finally, the requirements for experimental validation of the model are discussed. 1. INTRODUCTION IN PART I [l] of this paper a detailed description of the mathematical model developed to simulate melt/water interactions was presented. This paper takes a closer look at the escalation stage, i.e. the development of the pressure wave following triggering. Unfor- tunately, there is very little quantitative data available to validate the model. Thus the results from simu- lations which highlight areas of uncertainty in the modelling will be presented here, in order to provide guidance to future experimentalists. In recent years there has been a growing awareness of the importance of the escalation stage and of the need to know the trigger characteristics if experiments are to be modelled successfully [2]. One obvious reason for this is the realization that explosions may require longer distances to escalate to a steady state than are available in most experiments. Also it is important to understand the escalation stage because it is a well-known experimental fact that detonations do not always occur when melt contacts and mixes with water, and in some circumstances only a small region of the mixture may explode following trig- gering [3]. Recent experiments performed at Sandia National Laboratory have identified a trigger threshold for efficient fragmentation of a single droplet of melt [4]. A three order of magnitude increase in the volume of the vapour bubble formed following the frag- mentation of a single melt droplet was observed when the trigger strength, defined as the product of the trigger pressure and impulse, exceeded a critical value. This has led Berman and Beck [4] to postulate that a wide spectrum of propagation modes are possible, depending on the initial trigger ‘strength’. These range from deflagration type waves to fully developed det- onations. They have developed an empirical para- meterization of trigger strength, based on an analogy with explosive welding, but at the present time there are not enough detailed data available to check their hypothesis. However, the work represents a sig- nificant step forward, as it is the first systematic study of the effect of trigger strength. They also highlighted the need for models, such as this one, for making scoping calculations and to analyse the experimental data. The aim of this paper is to present a series of scoping calculations which are of interest to both exper- imentalists and modellers. In Section 2 the role played by heat transfer modelling is examined. The role played by fragmentation modelling is examined in Section 3. The effect of changing from a planar to a spherical geometry and the effect of mixture inhom- ogeneities are then examined in Sections 4 and 5, respectively. In Section 6 the experimental require- ments for model validation are discussed, and Section 7 contains some conclusions. 2. HEAT TRANSFER BETWEEN THE WATER AND FRAGMENTS There is considerable uncertainty as to what value should be used for the fragment to water heat transfer coefficient (h,). In Part I of this paper, most simu- lations were performed with a value of 10’ W m-* K- ‘, since this is a typical value obtained if the liquid- liquid conduction heat flux is averaged over a 1 ms timescale [2]. However, values of lo6 W m-* Km’ have been obtained in experiments where some form of fast transient boiling is present. These experiments are reviewed in ref. [2]. However, it is clear that the pressure must be sub-critical and the void fraction must be relatively low if this mechanism is to operate. The question then arises as to what value should be used for the heat transfer coefficient in a highly voided mixture, both during the escalation phase and once a shock wave has formed. During the escalation phase heat is transferred from the fragments to a two-phase mixture, so that not all the fragments are in contact with liquid water. Also, even once the detonation wave has developed the water density behind the shock 2449
-
Upload
independent -
Category
Documents
-
view
0 -
download
0
Transcript of An improved mathematical model of melt/water detonations—I. Model formulation and example results
hr. J. Heur Mus Trunsjer. Vol. 34, No. IO, pp. 244S2-2459, 1991 0017-9310191 s3.oo+o.oo Printed in Great Britain 0 1991 Pergamon Press plc
An improved mathematical model of melt/water detonations-l I. A study of escalation
D. F. FLETCHER AEA Safety and Reliability, C&ham Laboratory, Abingdon, Oxon., OX14 3DB, U.K.
(Received 2 1 May 1990 and injinalform I December 1990)
Abstract-In this paper, the model presented in Part I is used to perform a detailed study of the effect of various model parameters and constitutive assumptions on the escalation stage of a vapour explosion. In particular, the roles played by the chosen heat transfer rate and fragmentation law, the effect of geometry, and of a non-uniform premixture are examined. Finally, the requirements for experimental validation of
the model are discussed.
1. INTRODUCTION
IN PART I [l] of this paper a detailed description of the mathematical model developed to simulate melt/water interactions was presented. This paper takes a closer look at the escalation stage, i.e. the development of the pressure wave following triggering. Unfor- tunately, there is very little quantitative data available to validate the model. Thus the results from simu- lations which highlight areas of uncertainty in the modelling will be presented here, in order to provide guidance to future experimentalists.
In recent years there has been a growing awareness of the importance of the escalation stage and of the need to know the trigger characteristics if experiments are to be modelled successfully [2]. One obvious reason for this is the realization that explosions may require longer distances to escalate to a steady state than are available in most experiments. Also it is important to understand the escalation stage because it is a well-known experimental fact that detonations do not always occur when melt contacts and mixes with water, and in some circumstances only a small region of the mixture may explode following trig- gering [3].
Recent experiments performed at Sandia National Laboratory have identified a trigger threshold for efficient fragmentation of a single droplet of melt [4]. A three order of magnitude increase in the volume of the vapour bubble formed following the frag- mentation of a single melt droplet was observed when the trigger strength, defined as the product of the trigger pressure and impulse, exceeded a critical value. This has led Berman and Beck [4] to postulate that a wide spectrum of propagation modes are possible, depending on the initial trigger ‘strength’. These range from deflagration type waves to fully developed det- onations. They have developed an empirical para- meterization of trigger strength, based on an analogy with explosive welding, but at the present time there are not enough detailed data available to check their
hypothesis. However, the work represents a sig- nificant step forward, as it is the first systematic study of the effect of trigger strength. They also highlighted the need for models, such as this one, for making scoping calculations and to analyse the experimental data.
The aim of this paper is to present a series of scoping calculations which are of interest to both exper- imentalists and modellers. In Section 2 the role played by heat transfer modelling is examined. The role played by fragmentation modelling is examined in Section 3. The effect of changing from a planar to a spherical geometry and the effect of mixture inhom- ogeneities are then examined in Sections 4 and 5, respectively. In Section 6 the experimental require- ments for model validation are discussed, and Section 7 contains some conclusions.
2. HEAT TRANSFER BETWEEN THE WATER
AND FRAGMENTS
There is considerable uncertainty as to what value should be used for the fragment to water heat transfer coefficient (h,). In Part I of this paper, most simu- lations were performed with a value of 10’ W m-* K- ‘, since this is a typical value obtained if the liquid- liquid conduction heat flux is averaged over a 1 ms timescale [2]. However, values of lo6 W m-* Km’ have been obtained in experiments where some form of fast transient boiling is present. These experiments are reviewed in ref. [2]. However, it is clear that the pressure must be sub-critical and the void fraction must be relatively low if this mechanism is to operate. The question then arises as to what value should be used for the heat transfer coefficient in a highly voided mixture, both during the escalation phase and once a shock wave has formed. During the escalation phase heat is transferred from the fragments to a two-phase mixture, so that not all the fragments are in contact with liquid water. Also, even once the detonation wave has developed the water density behind the shock
2449

300 r
2LO -
180 -
0.0 0.1 0.2 0.3 04 05 0.6 0.7 0.8 0.9 1-o
Distance lm)
FIG. I. Development of the pressure profile in a highly voided mixture for a fragment to water heat transfer coefficient of IO5 W mm * K- I. (Pressure profiles shown every 0.5 ms.)
front is low (see Fig. 8 of Part I, where pw N 100 kg m- 3 over most of the solution domain if the mixture is initially highly voided) so heat transfer will not be efficient. This section contains the results of some scoping calculations performed to address this issue and to determine the importance of making hrw flow regime dependent
A simulation with an initial void fraction of 0.9 and the artificial viscosity factor b0 = 10 is taken as the starting point. All other parameters are identical to those presented in Table 1 of Part I. In this section of the paper it is assumed that there is no slip between the fragment and water phases. Figure 1 shows the development of the pressure profile for a fragment to water heat transfer coefficient of 10’ W me2 K- ‘. It is evident that a detonation wave develops very quickly for this choice of heat transfer rate.
One simple possibility of allowing for the reduced heat transfer rate in a two-phase system is to assume that the void fraction (J!?) is a measure of the likelihood that a fragment is in water or steam [S]. Thus, if the water consists of a mixture of liquid and vapour, the heat transfer coefficient is set to
hFw = &,,.Sll + ( 1 - Bhiquid (11
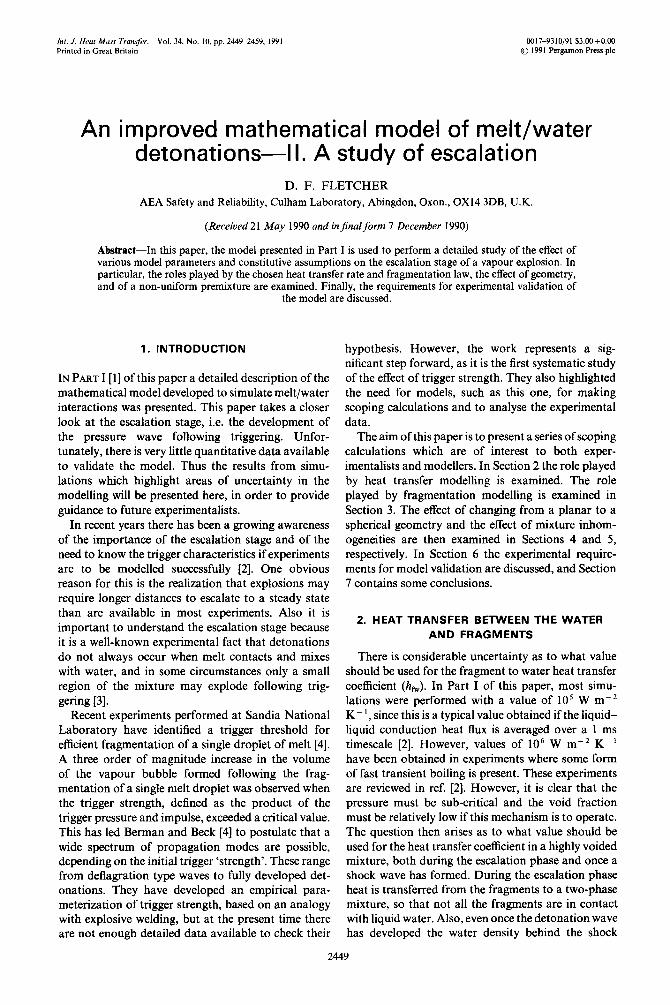
and it is assumed that hliquid = 10’ W m- ’ K- ‘, since this corresponds to a typical time-averaged value for liquid-liquid conduction and that h,,,,, = IO3 W mm2 K- ‘, since this corresponds to a typical value of the heat transfer coefficient when radiation and film boil- ing are occurring. Otherwise, the higher heat transfer coefficient is used. Figure 2 shows the development of the pressure profile in this case. It is evident that the pressure wave develops much more slowly than in the previous simulation and high pressures only occur once the void fraction becomes very small. The shape of the pressure profile is very ragged because the heat transfer rate can vary considerably between cells,
especially when the transition from largely vapour to a su~rc~tical fluid occurs. It is clear from the figure that physical consistency requires that the heat trans- fer rate must also vary in a continuous way when the fluid state changes from being two-phase to single phase.
One obvious way of doing this is to make the heat transfer rate a function of the local water density. This will give the same results, as those described above, in the two-phase region, but will also cause the heat transfer rate to be lowered in the low density super- critical region. The simplest choice is to assume that the heat transfer rate varies linearly with density, so that
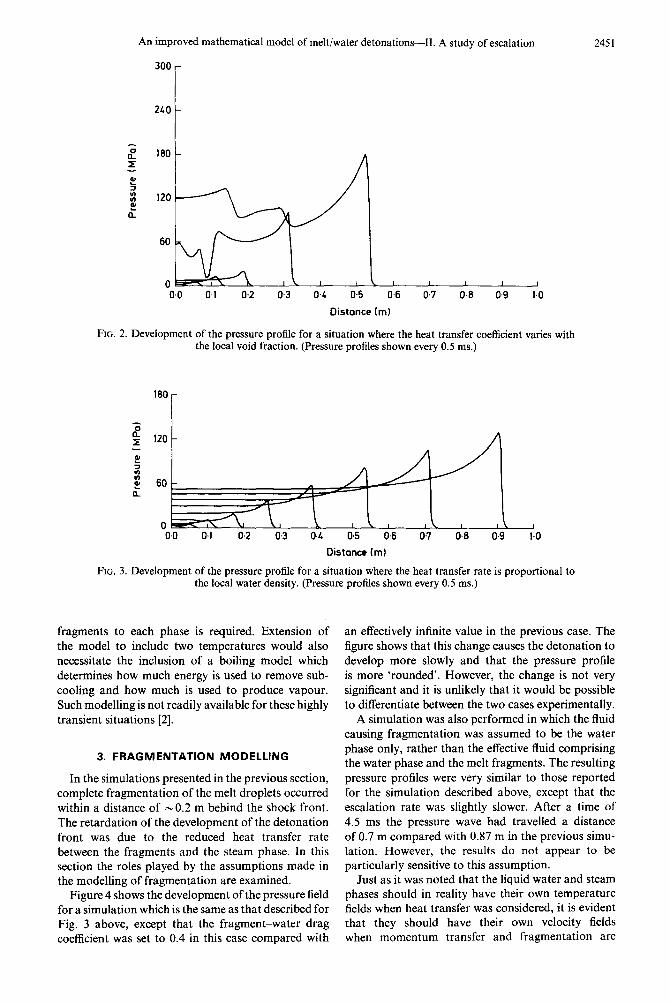
where Lam and hfiquid take the same values as specified above. The end point densities were given the fol- lowing values : ptisuid = 1000 kg me3 and psteam = 0.6 kg rne3. Figure 3 shows the pressure profile every 0.5 ms for this case. It is apparent that the detonation develops even more slowly in this case, and that the unphysical discontinuities resulting from the first modification described above have been removed. With this choice of heat transfer model the detonation wave takes 4.5 ms to travel 0.9 m compared with 2 ms if no dependency of the heat transfer coefficient on the flow regime is assumed.
Thus it is evident from the simulations presented in this section that a knowledge of the flow regime dependence of the heat transfer rate is required if the details of the escalation stage are to be predicted correctly. In reality, the picture is even more com- plicated than that suggested here because the vapour and liquid phases will not be at the same temperature and so the fraction of the heat transferred from the
An improved mathematical model of melt/water detonations-II. A study of escalation 2451
300 r
60
0 0.0 0.1 0.2 0.3 0.1 09 0.6 0.7 0.6 0.9 I.0
Distance (m)
FIG. 2. Development of the pressure profile for a situation where the heat transfer coefficient varies with the local void fraction. (Pressure profiles shown every 0.5 ms.)
60
0 0.0 0.1 0.2 0.3 0.4 06 0.6 0.7 0.6 0.9
A
1.0
Distance (ml
FIG. 3. Development of the pressure profile for a situation where the heat transfer rate is proportional to the local water density. (Pressure profiles shown every 0.5 ms.)
fragments to each phase is required. Extension of the model to include two temperatures would also necessitate the inclusion of a boiling model which determines how much energy is used to remove sub- cooling and how much is used to produce vapour. Such modelling is not readily available for these highly transient situations [2].
3. FRAGMENTATION MODELLING
In the simulations presented in the previous section, complete fragmentation of the melt droplets occurred within a distance of -0.2 m behind the shock front. The retardation of the development of the detonation front was due to the reduced heat transfer rate between the fragments and the steam phase. In this section the roles played by the assumptions made in the modelling of fragmentation are examined.
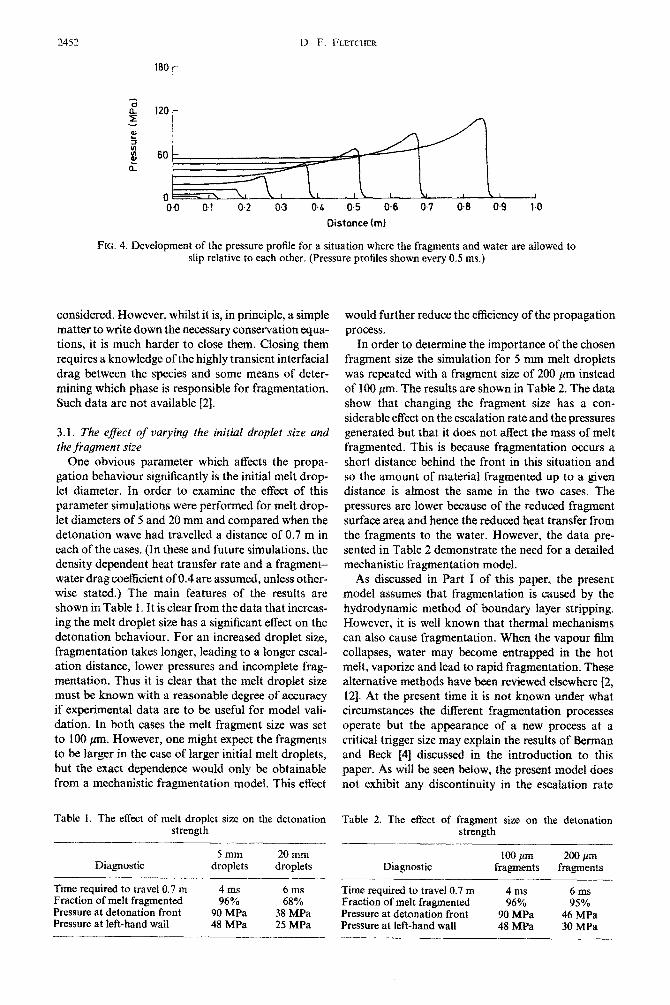
Figure 4 shows the development of the pressure field for a simulation which is the same as that described for Fig. 3 above, except that the fragment-water drag coefficient was set to 0.4 in this case compared with
an effectively infinite value in the previous case. The figure shows that this change causes the detonation to develop more slowly and that the pressure profile is more ‘rounded’. However, the change is not very significant and it is unlikely that it would be possible to differentiate between the two cases experimentally.
A simulation was also performed in which the fluid causing fragmentation was assumed to be the water phase only, rather than the effective fluid comprising the water phase and the melt fragments. The resulting pressure profiles were very similar to those reported for the simulation described above, except that the escalation rate was slightly slower. After a time of 4.5 ms the pressure wave had travelled a distance of 0.7 m compared with 0.87 m in the previous simu- lation. However, the results do not appear to be particularly sensitive to this assumption.
Just as it was noted that the liquid water and steam phases should in reality have their own temperature fields when heat transfer was considered, it is evident that they should have their own velocity fields when momentum transfer and fragmentation are
2452 I). F. FLETCHER
L I 0.4 ofl 0.6 0,7 0.9 1.0
Distance (ml
FIG. 4. Development of the pressure profile for a situation where the fragments and water are allowed to slip relative to each other. (Pressure profiles shown every 0.5 ms.)
considered. However, whilst it is, in principle, a simple would further reduce the e@iciency of the propagation matter to write down the necessary conservation equa- process. lions, it is much harder to close them. Closing them In order to determine the importance of the chosen requires a knowledge of the highly transient interfacial fragment size the simulation for 5 mm melt droplets drag between the species and some means of deter- was repeated with a fragment size of 200 pm instead mining which phase is responsible for fragmentation. of 100 pm. The results are shown in Table 2. The data Such data are not available [2]. show that changing the fragment size has a con-
siderable effect on the escalation rate and the pressures 3.1. The efict of oarying the initial droplet size and generated but that it does not affect the mass of melt the fragment size fragmented. This is because fragmentation occurs a
One obvious parameter which affects the propa- short distance behind the front in this situation and gation behaviour significantly is the initial melt drop- so the amount of material fragmented up to a given let diameter. In order to examine the effect of this distance is almost the same in the two cases. The parameter simulations were performed for melt drop- pressures are lower because of the reduced fragment let diameters of 5 and 20 mm and compared when the surface area and hence the reduced heat transfer from detonation wave had travelled a distance of 0.7 m in the fragments to the water. However, the data pre- each of the cases. (In these and future simulations, the sented in Table 2 demonstrate the need for a detailed density dependent heat transfer rate and a fragment- mechanistic fragmentation model. water drag coefficient of 0.4 are assumed, unless other- As discussed in Part I of this paper, the present wise stated.) The main features of the results are model assumes that fra~entation is caused by the shown in Table 1. It is clear from the data that increas- hydrodynamic method of boundary layer stripping. ing the melt droplet size has a significant effect on the However, it is well known that thermal mechanisms detonation behaviour. For an increased droplet size, can also cause fragmentation. When the vapour film fragmentation takes longer, leading to a longer escal- collapses, water may become entrapped in the hot ation distance, lower pressures and incomplete frag- melt, vaporize and lead to rapid fragmentation. These mentation. Thus it is clear that the melt droplet size alternative methods have been reviewed elsewhere [Z, must be known with a reasonable degree of accuracy 121. At the present time it is not known under what if experimental data are to be useful for model vali- circumstances the different fragmentation processes dation. In both cases the melt fragment size was set operate but the appearance of a new process at a to 100 pm. However, one might expect the fragments critical trigger size may explain the results of Berman to be larger in the case of larger initial melt droplets, and Beck [4] discussed in the introduction to this but the exact dependence would only be obtainable paper. As will be seen below, the present model does from a mechanistic fra~entation model. This effect not exhibit any discontin~ty in the escalation rate
Table 1. The effect of melt droplet size on the detonation strength
- 5mm 20 mm
Diagnostic droplets droplets
Time required to travel 0.7 m 4 ms 6ms Fraction of melt fragmented 96% 68% Pressure at detonation front 90 MPa 38 MPa Pressure at left-hand wall 48 MPa 25 MPa
Table 2. The effect of fragment size on the detonation strength
Diagnostic
Time required to travel 0.7 m Fraction of melt fragmented Pressure at detonation front Pressure at left-hand wall
100 pm 200 pm fragments fragments
4 ms 6ms 96% 95%
90 MPa 46 MPa 48 MPa 30 MPa
An improved mathematical model of melt/water detonations--K A study of escalation 2453
@stance fml
FIG. 5. Development of the pressure profile in a spherical geometry. (Pressure profiles shown every 0.5 ms.)
with trigger size, sugg~ting that the effect observed by Berman and Beck is some sort of regime transition at which a new physical effect becomes important.
4. THE EFFECT OF TRIGGER SIZE IN PLANAR
AND SPHERICAL GEOMETRIES
One must also be aware that the chosen trigger size, i.e. 90% of the melt droplets fragmented in a mixture zone 20 mm long is arbitrary. For example, in a case where 10% rather than 90% of the melt was frag mented as a trigger, a simulation showed that the pressure wave developed more slowly within the same envelope of peak pressure against distance as that shown in Fig. 4. Thus the model does not appear to show a critical trigger size at which different types of detonations develop. Provided the trigger is large enough to cause sufficiently large relative velocities that fragmentation occurs, escalation is bound to follow. There are no loss processes, such as sideways flow, in the present model that can prevent escalation.
To examine the effect of changing to a spherical geometry the simulation shown in Fig. 4 was repeated for a spherical geometry. (This involved setting the area factor, A, to x2 in the conservation equations.) Figure 5 shows the development of the pressure field for this case. (Note the change in pressure scale.) In this case the detonation wave travelled a distance of only 0.9 m in 7 ms. In the planar case it took only 4.5 ms to travel the same distance. Also the figure shows that the wave has travelled a distance of approxi- mately 0.5 m before a von Neumann spike appears. This simulation emphasizes the fact that ~nsiderable distances are required for a steady state to develop, especially in a spherical geometry. Reducing the trig- ger to 10% of the melt droplets fragmented from 90% again slows down the development of the detonation wave, but propagation still occurred.
It is evident from the simulation presented here that if a multi-dimensional geometry was considered it would be much harder for a detonation to escalate, since there could be a significant flow of material away from the front in the long escalation times predicted above. Again, in principle, it is a straight-forward task to extend the model to two dimensions but such calculations would be expensive to perform because a line grid would be required in both directions. One must be careful not to fall into the trap of increasing the grid size in order to obtain a solution in two dimensions. Simulations performed by Thyagaraja and Fletcher [7] show that if the grid size is too large then the structure of the detonation wave is lost, i.e. the existence of a von Neumann spike is not predicted and the propagation speed is controlled by the grid size.
To date the only two-dimensional calculations available are those of Medhekar et cd. [8] which sug gest that propagation is much more licit in two dimensions. However, these simulations were per- formed using very coarse grids. In their one-dimen- sional calculations they use a 10 mm mesh size but changed to using a 220 x 190 mm mesh for most of their two-dimensional simulations. (A grid refinement study used a 73 x 63 mm mesh.) Thus since a shock wave is spread over a minimum of three cells, this model will lead to a shock width of the order of 20@- 600 mm, which is comparable with the reaction zone lengths predicted in Part I of this paper. Thus the question of the importance of two-dimensional effects still awaits thorough investigation.
5. THE EFFECT OF AN INHOMOGENEOUS
PREMIXTURE
In this section the effect of mixture inhomogeneity on the propagation behaviour is examined. During
2454 D. F. FLETCHER
TRIGGER ZONE
/ I
MIXTURE STEAM MIXTURE
(al Initial condition.
Distance (ml
1 b) Pressure profiles.
FIG. 6. The geometry and resulting pressure profiles for a study of pressure wave propagation across a vapour filled zone. Note the rapid escalation once the pressure wave has crossed the vapour gap.
mixing, buoyancy forces cause the melt and vapour to separate. Also in any real situation, such as an accidental spill of molten metal into water, the melt pour is unlikely to be uniform. Thus mixture inhom- ogeneities are almost certain to be present prior to any real explosion. In order to examine the importance of this effect the model has been used to examine propagation in a number of idealized inhomogeneous geometries. When presenting these results particular attention is paid to the predicted pressure field, since in experiments the pressure transient at a number of locations is often the only diagnostic available.
The first situation considered was that of two regions of highly voided mixture (10% melt and a void fraction of 90%) separated by a steam filled zone. The initial conditions are shown in Fig. 6(a), and Fig. 6(b) shows the pressure profiles at 0.5 ms intervals from the start of the calculation. The figure shows that the pressure wave starts to develop, but rapidly decays when it enters the steam-filled region. However, the pressure rapidly escalates again when it reaches the second region of mixture. This second escalation is much more rapid than the first. Exam- ination of the other fields shows that a considerable fraction of the melt fragments is transported across the steam zone and thus cause compression of the water phase when they reach the second mixture zone. This compression, coupled with the enhanced heat transfer that it causes (since hr, is proportional to p,,,) leads to rapid escalation.
The calculation described above was repeated with no-slip allowed between the melt fragments and the water phase. The resulting behaviour was very similar but the pressure spikes were much sharper and the escalation in the second region was more rapid. This confirms that the compression effect of the melt par- ticles is indeed responsible for the rapid escalation beyond the steam zone.
The effect of mixture inhomogeneity was further
investigated by examining propagation in a highly inhomogeneous mixture. Figure 7 shows the initial conditions used for a calculation where it is assumed that the mixture consists of 0.1 m long zones of highly voided mixture separated by steam zones. A planar geometry is used and the usual trigger, i.e. 90% of the melt fragmented in the first 0.02 m of the mixture, is assumed. This is the same geometry as that used in a previous paper [6] in which the effect of mixture inhomogeneity was also examined but with very high fragment to water heat transfer rates.
Figure 8 shows the pressure profile every 0.5 ms for a simulation where the heat transfer model given in equation (2) was used. The figure shows that a com- plex pattern of pressure profiles develops, with the pressure increasing in zones of mixture and decaying in the vapour zones. The development of the det- onation front is rather slow. The pressure wave travels a distance of 0.9 m in 5 ms and reaches a peak pressure of only 40 MPa. In contrast with this, if a uniform heat transfer coefficient of lo5 W me2 K- ’ is assumed the pressure wave develops much more quickly. Fig- ure 9 shows the development of the pressure profile in this case. (This figure is plotted on the same scale as Fig. 1, where a uniform mixture was assumed.) It is evident, by comparison of Figs. 1 and 9, and Figs. 3 and 8, that mixture inhomogeneities :
(1) lead to complex pressure profiles ; (2) reduce the peak pressure considerably ; (3) have a greater effect when a density dependent
heat transfer rate is assumed.
It is interesting to examine how the presence of mixture inhomogeneities would affect the data obtained in an experimental study of vapour explosions. The situation shown in Fig. 7 could be thought of as representing an initial premixture con- tained in a tube. In this situation the experiment would probably be instrumented with an array of pressure

An improved mathematical model of melt/water detonations-II. A study of escalation 2455
\ void traction
0.6
o’2- fragments to act 05 a trigger melt traction
/ 0.0
00 0.2 0.4 0.6 0.6 1-o 12 l-4
Distance (ml
FIG. 7. The geometry used in the inhomogeneous mixture simulations.
0.0 0.1 0.2 0.3 0.4 0.5 0.6 0.7 0.6 0.9 1.0
Distance (ml
FIG. 8. Development of the pressure pro6le for an inhomogeneous initial mixture and a density dependent heat transfer coefficient. (Pressure profiles shown every 0.5 ms.)
160 -
;; 8 120 -
L 5 s t
1 o-4 0.5 0.6 0.7 0.8 0.9 1.0
Distance(m)
FIG. 9. Development of the pressure profile for an inhomogeneous initial mixture and a constant fragment to water heat transfer coefficient of 10’ W m-* K- ‘. (Pressure profiles shown every 0.5 ms.)

2456 D. F. FLETCHEK
lime (ms)
FIG. 10. The predicted pressure-time histories at a number of ‘transducer’ locations in the inhomogeneous mixture. The different curves show the pressure record at locations separated by 0.1 m, starting 0.1 m from
the left-hand wall.
transducers mounted in the tube wall. Such an exper- imental arrangement has been used in the past; an example being the tin-water experiments of Baines [9], which are discussed in the next section. If, at the end of the experiment, all of the pressure signals are plotted with a common time origin then, in theory, this plot can be used to determine the detonation velocity. However, in practice this procedure is com- plicated by factors such as reflected pressure waves, ‘ringing’ in the transducer, and the sensitivity of the transducers to temperature and acceleration effects.
If the initial mixture is inhomogeneous, then the picture is even more complicated. Figure 10 shows a pressure-time plot for ‘transducers’ located at 0.1 m intervals (from 0.1 to 0.7 m) along the ‘tube’ for the simulation shown in Fig. 8. The figure shows that the resulting data are hard to interpret. The ‘signals’ show that the detonation wave is escalating but that it is not escalating at a uniform rate because of the mixture inhomogeneities. Without a detailed knowledge of the initial mixture conditions it would be impossible to validate a model using such data.
6. MODEL VALIDATION
It is clear from the calculations presented in the previous section that inhomogeneities in the mixture can have a very important effect on the behaviour of a detonation wave. In experiments it is virtually impossible to produce a homogeneous mixture in a pouring mode of contact between melt and coolant. Thus experimental data need to consist of local measurements of melt volume fraction and coolant void fractions if they are to be useful for detailed
model validation. Such information is obviously very difficult to measure because of the transient nature of the event (the mixing stage often lasts for only - 100 ms) and the hostile environment in the mixture (melt temperatures - 3500 K if the hot fluid is UOz).
The difficulty of working with such materials has led various workers to perform detonation experiments using simulant materials, such as tin and aluminium. To date, the best characterized experiments of this kind are those of Baines [9]. In these experiments molten tin (at - 800°C) was poured into a long vertical column containing nearly saturated water. He was able to measure the average tin volume fraction and void fraction. Typically, the experiments produced a mixture where the average melt fraction was 0.14 and the void fraction was 0.24. The mixture was not uni- form because of the tendency of vapour to rise and melt to sink. Also the water temperature became stratified in the vessel during mixing, so that more vapour was produced at the top of the test section. When triggered, these mixtures gave rise to pro- pagating interactions with peak pressures of the order of 40-100 bar and a plateau pressure behind the det- onation wave of - 20 bar. Propagation velocities were in the range 5&250 m s- ‘. The efficiency of conversion of thermal to mechanical energy was very low (<0.4%).
At first sight these experiments would appear to be ideal for model validation purposes. However, attempts to simulate these experiments using CUL- DESAC were unsuccessful. CULDESAC predictions for these experiments never produced a detonation. Instead the trigger initiated fragmentation and ‘boil- ing’ behind the pressure front. No von Neumann spike
An improved mathematical model of melt/water detonations-II. A study of escalation
3-
2451
O- I I I I I I
0 1 2 3 4 5 6
lime (ms)
FIG. 11. The predicted pressure-time history for the case of a tin-water mixture. This very oscillatory behaviour occurs when the thermodynamic end-state of the water is close to the boundary between the
two-phase region and the subcooled liquid region.
developed and the pressure wave travelled at a speed of only - 60 m s- ‘, even for a case where the fragment
to water heat transfer coefficient was set to a constant value of lo6 W m-* K-‘. This velocity increased to - 75 m s- ’ when the fragment to water drag coefficient was increased sufficiently so that there was no slip between the fragment and water phases. The predicted pressure field was very erratic, even for large values (6, = 15-25) of the artificial viscosity coefficient. This is because there was very little heat addition at the pressure front, and so the water remained close to the two-phase envelope.
Because the water and steam are assumed to be in thermodynamic equilibrium a local oscillation in the pressure can be set up. Figure 11 shows the pressure- time history 0.3 m from the left-hand end of the ‘tube’. The figure shows that the pressure is very oscillatory at this point. The pressure rises very sharply as the water is compressed and all of the vapour collapses. This high pressure causes the water to flow, the pressure falls and vapour forms. This process occurs in each grid cell and sets up oscillations, since as the water expands in one cell it compresses the water in the adjacent cells. Thus the solution is not grid independent, since the frequency of oscillation changes with grid size. The assumption of thermal equilibrium between the water and the steam is responsible for this behaviour, since if the two differ- ent phases were allowed to have different tempera- tures, subcooled water and superheated steam could coexist transiently, and any small change in the system would not result in the change from a highly com- pressible two-phase mixture to a highly incom- pressible single phase fluid. However, the solution does show that the predicted pressures are far too low, compared with those observed in the experiment, suggesting that superheated steam and subcooled water were present in the experiment.
However, the failure of CULDESAC to simulate these experiments is not surprising. Baines [9] per- formed analysis of the heat transfer from tin frag- ments and showed that ‘non-equilibrium effects were an important feature of the experiments’. That is to say, ail the water at the detonation front is not heated uniformly. The melt fragments are surrounded by thin (- 10-100 pm) thermal boundary layers and most of the water is not heated at the front. In CULDESAC it is assumed that all of the water is heated at the front and so the pressure rise at the front is too low. Baines showed that if all the water was assumed to be heated at the detonation front then the Chapman-Jouguet pressure would be -3 bar and the propagation vel- ocity would be -34 m s-‘. Again these values are much lower than those observed in the experiments.
The above analysis shows that a non-equilibrium model is required to analyse detonations in these cir- cumstances. However, if the mixture is ‘rich’ in melt and the melt fragments are dispersed throughout the water one might expect the equilibrium theory to apply, provided that the two components were inter- mixed on the 100 pm length-scale. Note that allowing for thermal disequilibrium in the water at the front will always result in higher pressures and faster propa- gation velocities.
The problem of model validation is not unique to the present investigation. In a recent paper, Biirger et al. [IO] used a detonation model similar to the present one to analyse data from the KROTOS facility at JRC Ispra. Even after a considerable amount of parameter variation, the ‘best’ model predictions were found to be in poor agreement with the measured pressure pro- files. However, there would seem to be little point in even attempting such a comparison, since to quote from the paper: “unfortunately the experimental device does not allow for any assessment of the state of premixing”. Thus even if the experimental pressure
2458 I3. F. FI.~-KHER
traces could have been matched it would not con- stitute model validation, since the melt fraction, void fraction and melt droplet sizes in the initial mixture were all unknown. The above authors were aware of the limitations of the data they used to attempt validation of their model and stated the need for high quality data. They also identified non-homogeneous heating of the water phase as an important physical process missing from their model.
One is led to wonder why the detonation concept, first postulated in 1975 by Board et al. [I I], has not led to a validated model given the large amount of work, both theoretical (reviewed in ref. [2]) and exper- imental (reviewed in ref. [12]) which has been per- formed since that time. The answer seems to lie in the observations made in the paper by Burger et al. [lo]. To quote from that paper :
“However, after the formulation of the first models, describing the processes in the reaction zone of a det- onation wave, and after some boom of discussing these models, the efforts on vapour explosions separated again, although the thermal detonation concept became the most familiar concept and although the detection of strong propagating pressure waves in experiments performed at Winfrith, Sandia and Ispra indicated the importance of the concept. A consequent, systematic continuation of the development of the thermal detonation model was not further pursued as a general project. The same is true of the experimental work. A consequent line of improvements of detonation experiments aiming to install defined con- ditions cannot be recognised. Instead, large scale ex- periments mainly aimed to the occurrence of strong explosions and to detect their yield in order to draw conclusions on the possible damage potential, especially for nuclear reactor conditions. Thus, because of the uncertainties in the conditions, these experiments were only of limited value for basic examinations on thermal detonation models.”
The validation attempt described above and the views expressed by these workers are not peculiar to that particular research group. There is a fundamental difficulty in model validation because high quality data are not available. However, it is clear from the work presented in Parts I and II of this study that such data are required if propagating vapour explosions are to be understood. If an experiment is to be use- ful for model validation then the following con- ditionsidiagnosti~s are required :
l a highly constrained one-dimensional geometry (this would allow validation of the simplest one- dimensional model) ;
o a knowledge of the initial premixture, including the void fraction, melt fraction and melt particle size; l the melt fraction must be sufficiently high that
the assumption that the fragments transfer their heat to all of the water is approximately valid (this would allow validation of the simplest equilibrium model); l a uniform premixture or a knowledge of how the
mixture varies spatially ; e well-defined trigger characteristics, i.e. the
trigger strength and duration J l reliable pressure traces (although these may still
be difficult to interpret for the reasons discussed above) and high speed photographic data.
Without such data it will be impossible to validate this type of model. However, it is important to keep in mind that the present model is based on a highly idealized picture of vapour explosions. In particular, the model assumes an initial state in which the hot fluid is in the form of a homogeneous dispersion of vapour blanket droplets immersed in a pool of the cold fluid. This initial state may be impossible to achieve experimentally and would seem very un- likely to occur in real vapour explosions. A review by Fletcher and Anderson [2] contains a detailed de- scription of the various situations in which vapour explosions have been observed. None of these corre- sponds to the picture described above. Thus it is im- portant to realize that even if propagation in this very idealized situation is understood, the model may not be directly applicable to most real explosions.
7. CONCLUSIONS
In this paper the melt/water detonation model described in Part I of this paper has been used to examine the effect of various constitutive relations and initial conditions on the escalation stage of a detonation wave. These results may be summarized as follows :
l the mode1 predictions are very sensitive to the assumed heat transfer rate, especially if the heat trans- fer model takes the flow-regime into account ; l the predicted behaviour is very sensitive to the
initial melt droplet size and the fragment size ; l allowing for slip between the fragments and the
water phase does not have a significant effect but does lead to more ‘rounded’ pressure profiles ; l geometrical considerations are important, e.g.
detonations escalate more slowly in a spherical geometry than in a planar geometry ; l mixture inhomogenejties can reduce the peak
pressures and lead to complicated transient pressure profiles ; l the mode1 does not predict any discontinuity in
behaviour as a function of the trigger size, for the given constitutive physics assumptions ; l detailed experimental data are needed for model
validation.
The work discussed in these two papers has high- lighted the need for future work in the following areas :
l improved modelling of fragment to water heat transfer, based on relevant experimental data ;
o development of a framework to allow for non- homogeneous heating of the cold fluid ; l the need to check that the fragmentation model
currently employed is valid for all the Weber numbers encountered during the escalation stage and to check whether thermal fragmentation effects are important ;
An improved mathematical model of melt/water detonations-II. A study of escalation 2459
l calculations in two dimensions to examine the effect of mixture inhomogeneity in these circum- stances ; l development of a model that allows the liquid
water and steam to have separate velocity and tem- perature fields during the escalation stage. This would require the specification of flow regime dependent constitutive relations for interfacial drag, heat transfer and phase change modelling ; l the need for a better understanding of triggering,
to enable a better prescription of the initiating event and to determine whether triggering can occur in highly voided mixtures.
It is clear that future progress in this area will depend on the availability of experimental data for model validation and determination of the required consti- tutive physics. However, in the meantime, this model provides a useful tool for stimulating experimentalists and theoreticians in this area. Continued research in this area is essential if a fundamental understanding of the vapour explosion process is to be gained. Acknowledgements-This work was performed as part of the General Nuclear Safety Research Programme funded by the Department of Energy. The author is very pleased to acknowledge Drs R. P. Anderson and D. Cho of Argonne National Laboratory, Dr M. Berman of Sandia National Laboratory and Drs A. Thyagaraja and B. D. Turland of Culham Laboratory for stimulating technical discussions on this subject.
REFERENCES
D. F. Fletcher, An improved mathematical model of melt/water detonations-I. Model formulation and example results, ht. J. Heat Mass Transfer 34, 24355 2448 (1991).
2.
3.
4.
5. 6.
7.
8.
9.
IO.
11.
12.
D. F. Fletcher and R. P. Anderson, A review of pressure- induced propagation models of the vapour explosion process, Prog. Nucl. Energy 23, 137-179 (1990). M. J. Bird, An experimental study of scaling in core melt/water interactions. Paper presented at the 22nd Natn. Heat Transfer Conf., Niagara Falls, 5-8 August (1984). M. Berman and D. Beck, Steam explosion triggering and propagation: hypothesis and evidence, Proc. 3rd Int. Seminar on Containment of Nuclear Reactors, University of California, Los Angeles, California, I&l1 August 1989. (Also available as Sandia National Laboratory Report SAND89-1878C.) R. W. Hall, Private communication (1990). D. F. Fletcher, Some computations of detonations using the CULDESAC code, Culham Laboratory Report CLM-R291, HMSO (1989). A. Thyagaraja and D. F. Fletcher, Numerical aspects of multiphase detonation modelling, Proc. 6th Znt. Conf. on Numerical Methods in Laminar and Turbulent Flow, Swansea, 11-15 July 1989 (Edited by C. Taylor, P. Gresho, R. L. Sani and J. Hluser), Vol. 6, pp. 17533 1763. Pineridge Press, Swansea (1989). S. Medhekar. W. H. Amarasooriva and T. G. Theo- fanous, Integrated analysis of steam explosions, Proc. 4th Int. Topical Meeting on Nuclear Reactor Thermal Hydraulics, Karlsruhe, K.F.G., l&13 October 1989, Vol. 1, pp. 319-326 (1989). M. Baines, Preliminary measurements of steam explosion work yields in a constrained system, Inst. Chem. Engng Symp. Series 86,977108 (1984). M. Burger, K. Miiller, M. Buck, S. H. Cho, A. Schatz, H. Schins, R. Zeyens and H. Hohmann, Analysis of thermal detonation experiments by means of a transient multiphase detonation code, Proc. 4th Int. Topical Meet- irtq on Nuclear Reactor Thermal Hydraulics, Karlsruhe, K.F.G., 10-13 October 1989, Vol. 1, pp. 304311 (1989). S. J. Board. R. W. Hall and R. S. Hall. Detonation of fuel coolant explosions, Nature 254, 319-321 (1975). M. L. Corradini, B. J. Kim and M. D. Oh, Vapour explosions in light water reactors : a review of theory and modelling, Prog. Nucl. Energy 22, 1-l 17 (1988).
UN MODELE MATHEMATIQUE AMELIORE POUR LA DETONATION BAIN FONDU/EAU-II. ETUDE DE L’ESCALADE
R&u&---Le modtle est utilise dans la premiere partie pour conduire une etude detaillee de l’effet des differents parametres du modele et des hypotheses constitutives sur l’etat d’escalade de l’explosion de la vapeur. En particulier, on examine les roles jouts par les choix du flux thermique et de la loi de fragmen- tation, l’effet de la geometric et du premelange non uniforme. Finalement, on discute des besoins de
validation experimentale du modiie.
EIN VERBESSERTES MATHEMATISCHES MODELL FUR DETONATIONEN BEIM KONTAKT ZWISCHEN GESCHMOLZENEM MATERIAL UND WASSER-II.
UNTERSUCHUNG DER ESKALATION
Zusemmenfassung-Das Model1 aus dem ersten Teil der Arbeit wird fur eine detaillierte Untersuchung des Einflusses der unterschiedlichen Modellparameter und verschiedener Annahmen auf die Eskalation einer Dampfexplosion verwendet. Insbesondere wird die Rolle der folgenden EinfluBgrijBen untersucht : Gewiihlter Wlrmeiibergang, GesetzmHBigkeit der Fragmentation, EinfluB der Geometrie, ungleichfiirmige Vermischung. AbschlieDend wird die Erfordemis einer experimentellen Validierung des Modells diskutiert.
YCOBEPIIIEHCTBOBAHHAX MATEMATAgECKAR MOAEJIb AETOHAHMH B PACI-IJIABE MJIM BOAE-II. MCCJIEHOBAHME XKAJIAHMM
AllEOT~MOAeJlb, tlpeAcTaBJleHHa%l B I ‘laCTH pa6orbr, HCnOJlb3yeTCR Qnn “pOBene”ml neTa.ItbHOrO riccnenonamin B~HRHH~ pasnriq~brx ee napahterpoe B ociro~~brx nonymemiii na cramno scxa.saurm napoeoro n3pbma. B ~acmocrri, pacch+arprisarorcn pony c~opocru rennonepeuoca H 3aKosia @palcurio- miposamin, a raroxe z~$+~KT reoMerpsirr H ueonriopormocm ~cxon~ol chiecu. 06cymnamrcr Taxme
rpe60namin K srccnepriMeuranbuo% npoeeptte anetcnarriocm npeanoncetmofi btonenu.