Research Article Formulation Optimization of Erythromycin ...
9
Research Article Formulation Optimization of Erythromycin Solid Lipid Nanocarrier Using Response Surface Methodology Anil Kumar Sahu, Tekeshwar Kumar, and Vishal Jain University Institute of Pharmacy, Pt. Ravishankar Shukla University, Raipur 492010, India Correspondence should be addressed to Vishal Jain; [email protected] Received 28 February 2014; Revised 17 May 2014; Accepted 28 May 2014; Published 18 June 2014 Academic Editor: Yunfeng Lin Copyright © 2014 Anil Kumar Sahu et al. is is an open access article distributed under the Creative Commons Attribution License, which permits unrestricted use, distribution, and reproduction in any medium, provided the original work is properly cited. In present work response surface methodology (RSM) using the miscellaneous design model was used to optimize formulations of erythromycin solid lipid nanocarriers (ERY-SLN). Two-factor three level factorial design was considered for optimization. ere were three parameters, drug entrapment efficiency (EE), drug loading (DL) percentage, and mean particle size of ERY-SLN, considered for investigating the optimal formulation with respect to two independent variables, including lipid concentration (X 1 ) and surfactant : cosurfactant ratio (X 2 ). e result showed that the optimal ERY-SLN was composed of lipid concentration (X 1 ) 15 mg/mL and surfactant : cosurfactant ratio (X 2 ) 1 : 1 with %EE of 88.40 ± 2.09%, DL of 29.46 ± 0.69%, mean particle size of 153.21 ± 2.31 nm, polydispersity index (PDI) of 0.026 ± 0.008, and zeta potential value of −15.18 ± (−5.53) mV. DSC and TEM study showed that there was no chemical interaction between ERY and lipid (GMS) and the ERY-SLN particles are nonspherical, respectively. e drug release experiments exhibited a sustained release over during 24 h, up to 66.26 ± 2.83%. Accelerated stability studies showed that there was no significant change occurring in the responses aſter storage condition for a total period of 3 months. 1. Introduction Erythromycin 9-{O-[(2-methoxyethoxy)methyl]oxime} (ERY) is a 14-member lactone ring macrolide antibiotic pro- duced from a strain of the actinomycete Saccharopolys- pora erythraea, formerly known as Streptomyces erythraeus [1]. It has been used clinically for over 60 years. It is active in a wide variety of infections like bronchitis, severe campylobacter enteritis, chancroid, diphtheria, legionnaires, pneumonia sinusitis, trench fever, chlamydia, syphilis, acne, and gonorrhea [2]. ERY has poor solubility in water, instability in gastric pH, unpleasant taste, low half-life (1– 1.5 hrs), and low oral bioavailability (about 35%). Due to the above reasons its oral application is limited [3]. ERY topical preparations are used as a second-line topical treatment for acne following failure of nonantibiotic topical preparations to treat the condition. Sometimes resistance to ERY may be developed by many bacterial strains due to different mechanisms, among which an impaired permeability of the bacterial cells, resulting in a reduction of the drug concentration in the cytoplasm to insufficient (subactive) levels. Topical administration of drug might be beneficial for the treatment of skin diseases because it reduced the systemic side effects and improves the patient compliance, but topical administration of drug is still a challenge in drug delivery due to the difficulties in controlling the fate of drug within the skin [4]. For overcoming the above difficulties lipid nanoparticles have shown a great potential as a carrier for topical administration of active pharmaceutical ingredients. Solid lipid nanoparticles (SLN) are the forerunner of the rapidly developing field in nanotechnology with several potential applications in drug delivery, clinical medicine, and research [5]. e SLNs offered a great potential for the administration of active molecules by any route of administration and simultaneously having other advantages like improved avoidance of organic solvent’s biotoxicity, drug stability, high drug payload, and incorporation of lipophilic and hydrophilic drugs. SLN can be also used to improve the bioavailability and to obtain sustain release of drugs [6]. SLN administered through topical route has advantages Hindawi Publishing Corporation BioMed Research International Volume 2014, Article ID 689391, 8 pages http://dx.doi.org/10.1155/2014/689391
-
Upload
khangminh22 -
Category
Documents
-
view
2 -
download
0
Transcript of Research Article Formulation Optimization of Erythromycin ...

Research ArticleFormulation Optimization of Erythromycin Solid LipidNanocarrier Using Response Surface Methodology
Anil Kumar Sahu, Tekeshwar Kumar, and Vishal Jain
University Institute of Pharmacy, Pt. Ravishankar Shukla University, Raipur 492010, India
Correspondence should be addressed to Vishal Jain; [email protected]
Received 28 February 2014; Revised 17 May 2014; Accepted 28 May 2014; Published 18 June 2014
Academic Editor: Yunfeng Lin
Copyright © 2014 Anil Kumar Sahu et al. This is an open access article distributed under the Creative Commons AttributionLicense, which permits unrestricted use, distribution, and reproduction in any medium, provided the original work is properlycited.
In present work response surface methodology (RSM) using the miscellaneous design model was used to optimize formulationsof erythromycin solid lipid nanocarriers (ERY-SLN). Two-factor three level factorial design was considered for optimization.There were three parameters, drug entrapment efficiency (EE), drug loading (DL) percentage, and mean particle size of ERY-SLN,considered for investigating the optimal formulation with respect to two independent variables, including lipid concentration (X
1)
and surfactant : cosurfactant ratio (X2). The result showed that the optimal ERY-SLN was composed of lipid concentration (X
1)
15mg/mL and surfactant : cosurfactant ratio (X2) 1 : 1 with %EE of 88.40 ± 2.09%, DL of 29.46 ± 0.69%, mean particle size of 153.21
± 2.31 nm, polydispersity index (PDI) of 0.026 ± 0.008, and zeta potential value of −15.18 ± (−5.53) mV. DSC and TEM study showedthat there was no chemical interaction between ERY and lipid (GMS) and the ERY-SLN particles are nonspherical, respectively.Thedrug release experiments exhibited a sustained release over during 24 h, up to 66.26 ± 2.83%. Accelerated stability studies showedthat there was no significant change occurring in the responses after storage condition for a total period of 3 months.
1. Introduction
Erythromycin 9-{O-[(2-methoxyethoxy)methyl]oxime}(ERY) is a 14-member lactone ring macrolide antibiotic pro-duced from a strain of the actinomycete Saccharopolys-pora erythraea, formerly known as Streptomyces erythraeus[1]. It has been used clinically for over 60 years. It isactive in a wide variety of infections like bronchitis, severecampylobacter enteritis, chancroid, diphtheria, legionnaires,pneumonia sinusitis, trench fever, chlamydia, syphilis,acne, and gonorrhea [2]. ERY has poor solubility in water,instability in gastric pH, unpleasant taste, low half-life (1–1.5 hrs), and low oral bioavailability (about 35%). Due to theabove reasons its oral application is limited [3]. ERY topicalpreparations are used as a second-line topical treatment foracne following failure of nonantibiotic topical preparationsto treat the condition. Sometimes resistance to ERY maybe developed by many bacterial strains due to differentmechanisms, among which an impaired permeability ofthe bacterial cells, resulting in a reduction of the drug
concentration in the cytoplasm to insufficient (subactive)levels. Topical administration of drug might be beneficial forthe treatment of skin diseases because it reduced the systemicside effects and improves the patient compliance, but topicaladministration of drug is still a challenge in drug deliverydue to the difficulties in controlling the fate of drug withinthe skin [4]. For overcoming the above difficulties lipidnanoparticles have shown a great potential as a carrier fortopical administration of active pharmaceutical ingredients.
Solid lipid nanoparticles (SLN) are the forerunner ofthe rapidly developing field in nanotechnology with severalpotential applications in drug delivery, clinical medicine,and research [5]. The SLNs offered a great potential forthe administration of active molecules by any route ofadministration and simultaneously having other advantageslike improved avoidance of organic solvent’s biotoxicity, drugstability, high drug payload, and incorporation of lipophilicand hydrophilic drugs. SLN can be also used to improvethe bioavailability and to obtain sustain release of drugs[6]. SLN administered through topical route has advantages
Hindawi Publishing CorporationBioMed Research InternationalVolume 2014, Article ID 689391, 8 pageshttp://dx.doi.org/10.1155/2014/689391

2 BioMed Research International
such as achieving the higher amount of drug concentrationin subjected area and minimizing the systemic transportof drug, which bypasses first-pass metabolism and systemictoxicity.
Experimental design and optimization of pharmaceuticalformulation are a key issue for the development of nanocar-riers. Optimization procedure may help to develop nanocar-riers having maximum drug entrapment efficiency and drugloading capacity and appropriate mean particle size throughminimum experimental trials. Presently computerized opti-mization technique based on response surface methodology(RSM) is used for optimization purpose. Response surfacemethodology is a collection of mathematical and statisti-cal techniques based on polynomial equation, which mustdescribe the influence of independent variables on responsewith the objective of making statistical previsions [7].
The objective of this study was to use response sur-face methodology (RSM) in conjunction with miscella-neous design to establish the functional relationship betweenoperating variables and responses. Glyceryl monostearate,Poloxamer 188, and soya lecithin were selected as the solidlipid, surfactant, and cosurfactant, respectively. ERY-SLNwas prepared using hot homogenization method followedby ultrasonication. Optimization was done by computersimulation programmeDesign-Expert version 8.0.1. SLNwasfurther characterized for their mean particle size, loadingparameters, in vitro drug release behaviour, andmorphology.
2. Experimental
2.1. Materials. Erythromycin (ERY) and Poloxamer 188 werea generous gift from S Kant Health Care Ltd., Gujaratand Signet Chemical Corporation Pvt. Ltd., Mumbai, India,respectively. Glycerol monostearate (GMS), cetyl alcohol(CA), cetostearyl alcohol (CSA), and stearic acid (SA) werepurchased from Loba Chemie Pvt. Ltd., Mumbai, India. Soyalecithinwas purchased fromHiMedia Lab. Pvt. Ltd.,Mumbai,India. All other chemicals and solvents used for the studywere of analytical grade.
2.2. Partitioning Behaviour of ERY in Different Lipids. ERY(25mg) was dispersed in a mixture of melted lipid (2 g) andhot distilled water (2mL).Themixture was shaken for 30minat 80∘C in a hot water bath and then centrifuged at 5000 rpmfor 10min. Aqueous phase was filtered through membranefilter with a pore size of 0.45𝜇m. The drug concentrationin the water was determined by UV-spectroscopy. Partitioncoefficient value is determined to study its partitioningbehaviour with different lipids [8].
2.3. Preparation of ERY Loaded SLNs. Drug-SLNs were pre-pared using hot homogenization followed by ultrasonicationmethod. GMS was considered as a lipid phase; its concentra-tion at different levels was shown in Table 1. ERY (100mg)was dissolved in melted lipid phase, and this solution wasthen dissolved in 20mL of ethanol : acetone (1 : 1) mixture.Surfactant (Poloxamer 188) and cosurfactant (soya lecithin)were dissolved in 20mL of distilled water to obtain 2%
solutions and heated up to 80∘C in a beaker. When a clearhomogenous lipid phase was obtained, the hot aqueoussurfactant, cosurfactant solution were added to hot lipidphase, and homogenization was carried out at 15,000 rpm,for 10min, using a high-speed homogenizer (T10 basic, IKA-Werke GmbH&Co. KG, Staufen, Germany) withmaintainedtemperature at 80∘CThe resulted preemulsion was ultrasoni-fied using a probe sonicator (Frontline Sonicator) at 50W for5min. Later, themixturewas cooled to room temperature anddiluted up to 100mLwith deionisedwater yielding ERY-SLNsdispersion [9].
2.4. Determination of Optimal Concentration of Surfactant.ERY (50mg) was dissolved in 100mgmelted lipid (GMS) andthis solution was then dissolved in 20mL of ethanol : acetonemixture (1 : 1). Surfactant was added to cosurfactant aqueousdispersion at concentration of 1%, 2%, 3%, 4%, and 5% (w/v).SLNs were prepared as in the above-mentioned method. Themost favourable concentration of surfactant was determinedfrom size, entrapment efficiency (EE), and drug loading (DL)of the prepared SLNs [10].
2.5. Experimental Design. Statistical models are extensivelyused to design the formulation of lipid based nanoparticles;it was essential to recognise the independent variables inthe formulation which can affect the properties of desiredformulation. A 3-level factorial-response surface method-ology (3LF-RSM) was used to study the effect of differentvariables on formulation properties like mean particle size,percentage drug loading (%DL), and entrapment efficiency(%EE) of the prepared SLNs. Independent variables includelipid concentration (𝑋
1) and ratio of surfactant: cosurfactant
(𝑋2) (Table 1). The best fitted model for statistical analysis
was considered significant when 𝑃 value <0.05. Predicted 𝑅2value and ANOVA were pursued to confirm best fittingnessof themodel.Three-dimensional (3D) surface plots were usedto establish the relationship between independent variablesand dependent variables (response).The desirability functionof particle size was in the minimum level while that ofentrapment efficiency and drug loading was in the maximumlevel, which was used for optimization of formulations [7].
2.6. Determination of Mean Particle Size, PDI, and Zeta-Potential of the ERY-SLNs. Themean particle size (𝑧-average)of the SLNs and polydispersity index (PDI) as a measure ofthe width of particle size distribution is found out by photoncorrelation spectroscopy (PCS) using a Zetasizer (Nano ZS90, Malvern Instruments, UK) at 25∘C and a 90∘ scatteringangle. SLNs formulation was diluted with double distilledwater to weaken opalescence before measurements. Thesurface charge was assessed by measuring the zeta potentialof SLNs based on the Smoluchowski equation, using the sameequipment at 25∘Cwith electric field strength of 23V/cm [11].
2.7. Determination of %EE and %DL of the ERY-SLNs. Per-centage of EE and DL was evaluated by determining theamount of free ERY in the aqueous surfactant-cosurfactantsolution which was separated by using the cooling centrifuge

BioMed Research International 3
Table 1: Independent variables along with their coded level, actual level, and respective responses values of different batches of ERY-SLNs.
Form. code
Coded level Actual level Responses
𝑋1𝑋2𝑋1𝑋2
Mean particlesize(nm)
Polydispersityindex(PDI)
Zeta Potential(mV)
EE(%)
DL(%)
SLN 1 −1 −1 15 01 : 02 193.16 ± 18.49 0.024 ± 0.002 −7.54 ± (−1.41) 84.96 ± 4.17 28.32 ± 1.39
SLN 2 −1 0 15 01 : 01 119.86 ± 6.54 0.075 ± 0.030 −15.18 ± (−5.53) 91.72 ± 0.98 30.57 ± 0.32
SLN 3 −1 1 15 02 : 01 255.73 ± 22.68 0.042 ± 0.028 −11.11 ± (−3.20) 81.14 ± 1.94 27.04 ± 0.64
SLN 4 0 −1 20 01 : 02 358.20 ± 27.00 0.352 ± 0.059 −11.61 ± (−1.46) 87.60 ± 0.93 21.89 ± 0.23
SLN 5 0 0 20 01 : 01 321.46 ± 17.99 0.195 ± 0.057 −8.87 ± (−3.78) 93.39 ± 3.90 23.34 ± 0.97
SLN 6 0 1 20 02 : 01 389.20 ± 33.34 0.419 ± 0.090 −16.26 ± (−1.89) 84.55 ± 1.57 21.13 ± 0.39
SLN 7 1 −1 25 01 : 02 451.00 ± 38.00 0.286 ± 0.056 −14.56 ± (−6.03) 90.78 ± 1.46 18.15 ± 0.29
SLN 8 1 0 25 01 : 01 434.06 ± 21.43 0.208 ± 0.079 −10.23 ± (−6.77) 94.27 ± 2.98 18.85 ± 0.60
SLN 9 1 1 25 02 : 01 526.50 ± 25.12 0.458 ± 0.124 −19.57 ± (−4.76) 89.72 ± 2.81 18.20 ± 0.19
(Remi Instruments Ltd., Mumbai, India) [12]. The ERY-SLNsaqueous dispersionwas placed in the cooling centrifuge tubesand speed of centrifuge was kept at 12,000 rpm for 20minat 4∘C. The concentration of ERY in the aqueous phase wasdetermined using UV-visible spectrophotometer (UV 1700,Shimadzu, Japan) at 𝜆max 236 nm. The %EE and %DL werecalculated by the following equations:
%EE
=Weight of ERY used −Weight of free ERY
Weight of ERY used× 100,
%DL
=Weight of ERY used −Weight of free ERY
Weight of GMS× 100.
(1)
2.8. Differential Scanning Calorimetric (DSC) Study. DSCanalysis was carried out by using DSCQ20 (TA Instruments,USA) at a heating rate of 10∘C/min in the range of 40–220∘C.DSC studies were conducted for ERY, GMS, and physicalmixture of ERY and GMS in ratio 1 : 1 and freeze-dried ERY-SLNs of the optimized batch [13].
2.9. Transmission ElectronMicroscopy (TEM) Study. The sur-face morphology and size of optimized SLNs were analyzedby transmission electron microscopy (TEM). It optimizedERY-SLNs aqueous dispersion which was placed on coppergrids coated with carbon film and dried at room temperaturefor observation. The magnification for the TEM images was150000x [14].
2.10. Determination of In Vitro Drug Release from OptimizedERY-SLNs. In vitro release of ERY from optimized ERY-SLNs was determined by modified Franz’s diffusion usingdialysismembrane (molecular weight cutoff 10,000Da). Dial-ysis membrane was kept in double distilled water for 24hours before utilizing in modified Franz’s diffusion cell.ERY-SLNs aqueous dispersion (2mL) was placed in thedonor compartment, and the receptor compartment was
filled with dissolution medium (pH 6.8 phosphate buffer)and maintained temperature at 32 ± 0.5∘C by continuousstirring at 100 rpm. After regular time intervals, sampleswere withdrawn from the receptor compartment and exactvolume of a dissolution medium was added to the samecompartment to maintain the constant volume throughoutthe study. The amount of ERY released was analyzed by UV-visible spectroscopy [15].
2.11. Storage Stability Studies. The storage stability studieswere carried out with the optimized ERY-SLN formulation.A 10mL of ERY-SLN dispersion with 2mg/mL drug concen-tration was taken into glass vials and stored at 4 and 25∘Cfor 3 months. The stability test was analyzed on the basisof particle size, zeta potential, and percentage entrapmentefficiency determination in the dispersion with a samplingfrequency of 1 month.
2.12. Statistical Analysis. Design-Expert software (version8.0.1; Stat-Ease, trial version) was utilised for statisticalanalysis and graph plotting.The results of one-way analysis ofvariance (ANOVA) for the dependent variables were utilisedfor the selection of the model which could be consideredsignificant for the response variables.
3. Results and Discussions
3.1. Partitioning Behaviour of ERY. Standard curve of ERYin methanol was utilised for estimating the concentration ofthe ERY in the aqueous phase. Partition coefficients obtainedwere 110.96 ± 27.90, 49.77 ± 2.10, 19.18 ± 0.77, and 45.79 ±4.65 for glycerol monostearate, stearic acid, cetyl alcohol, andcetostearyl alcohol, respectively. On the basis of results, itcan be claimed that the lipophilic drug ERY is soluble in thegreater amount in GMS than any other lipid used. Thus, theGMS used as the lipid phase for the study of ERY-SLNs.
3.2. Preparation of ERY-SLNs. The high shear homogenisa-tion followed by ultrasonication method is the easy methodwhich can be utilised for the laboratories’ production ofthe SLNs. 20mL ethanol : acetone (1 : 1) was incorporated

4 BioMed Research International
Table 2: The effect of surfactant (Poloxamer 188) concentration (%w/v) on mean particle size, %EE, and %DL of ERY-SLNs.
Lipid Poloxamer 188concentration (%w/v)
Mean particlesize (nm) EE (%) DL (%)
GMS
1 337.96 ± 9.81 79.99 ± 4.89 25.99 ± 1.63
2 138.42 ± 17.48 84.52 ± 5.58 28.17 ± 1.86
3 224.29 ± 11.69 79.14 ± 3.69 26.37 ± 1.23
4 338.76 ± 9.51 68.42 ± 5.06 22.80 ± 1.68
5 387.29 ± 9.15 67.47 ± 5.60 22.48 ± 1.86
Table 3: Summary of results of regression analysis for responses and analysis of variance for particle size, EE, and DL.
Parameters DF SS MS 𝐹 𝑃 value 𝑅2 SD Coeff. of variance %
Mean particle sizeModel 5 1.35𝐸 + 05 26902.5 49.04 0.0045 significant 0.9879 23.42 6.91Residual 3 1645.67 548.56Total 8 1.36𝐸 + 05
%Entrapment efficiencyModel 5 149.33 29.87 11.56 0.0356 significant 0.9507 1.61 1.81Residual 3 7.75 2.58Total 8 157.08
%Drug loadingModel 5 168.89 33.78 61.66 0.0032 significant 0.9904 0.74 3.21Residual 3 1.64 0.55Total 8 170.53
for homogenous distribution of ERY inside the lipid phase(GMS). The homogenisation speed and sonication time wereoptimized to 15,000 rpm for 10minutes and 5minutes at 50W,respectively.
3.3. Determination of Optimal Concentration of Surfactant.The surfactant concentration plays a significant role indesired formulation properties. On the basis of preliminarystudies, the surfactant concentration from 1% to 5% (w/v)Poloxamer 188 was selected for evaluating the effect ofsurfactant concentration on mean particle size, percentage ofdrugs EE and DL. Consequently, the smallest particle size,highest %EE and %DL were found to be 2% (w/v) Poloxamer188. At this concentration, the mean particle size, %EE, and%DL of SLNs were 138.42 ± 17.48, 84.52 ± 5.58, and 28.17 ±1.86, respectively (Table 2). It is concluded from the aboveresults that the 2% Poloxamer 188 was determined as optimalconcentration.
3.4. Optimization Data Analysis for the ERY-SLNs. Observedresponses of nine formulations were fitted to various modelsby using Design-Expert software trial version 8.0.1. It wasseen that the quadraticmodels were best-fitted for the studiedresponses, that is, mean particle size, %EE, and %DL. Thequadratic equations generated for responses were given as
Mean particle size (nm)
= −672.35 + 70.06𝑋1+ 15 − 24𝑋
2
+ 0.64𝑋1𝑋2− 1.04𝑋
12+ 70.50𝑋
22,
Entrapment Efficiency (%)
= +85.68 + 0.16𝑋1− 4.08𝑋
2
+ 0.13𝑋1𝑋2+ 0.01𝑋
12− 6.66𝑋
22,
Drug Loading (%)
= +66.23 − 3.26𝑋1− 1.66𝑋
2
+ 0.06𝑋1𝑋2+ 0.05𝑋
12− 1.79𝑋
22, (2)
where 𝑋1and 𝑋
2represent the coded values of the lipid
concentration and surfactant cosurfactant ratio, respectively.Thepositive value of a factor in the above equations point outsthe enhancement of that response and vice versa. All valuesof correlation coefficient (𝑅2), SD, % coefficient of variation,and results of ANOVAare shown in Table 3. A value of𝑅2 andresults of ANOVA for the dependent variables confirmed thatthe model was significant for observed response variables.
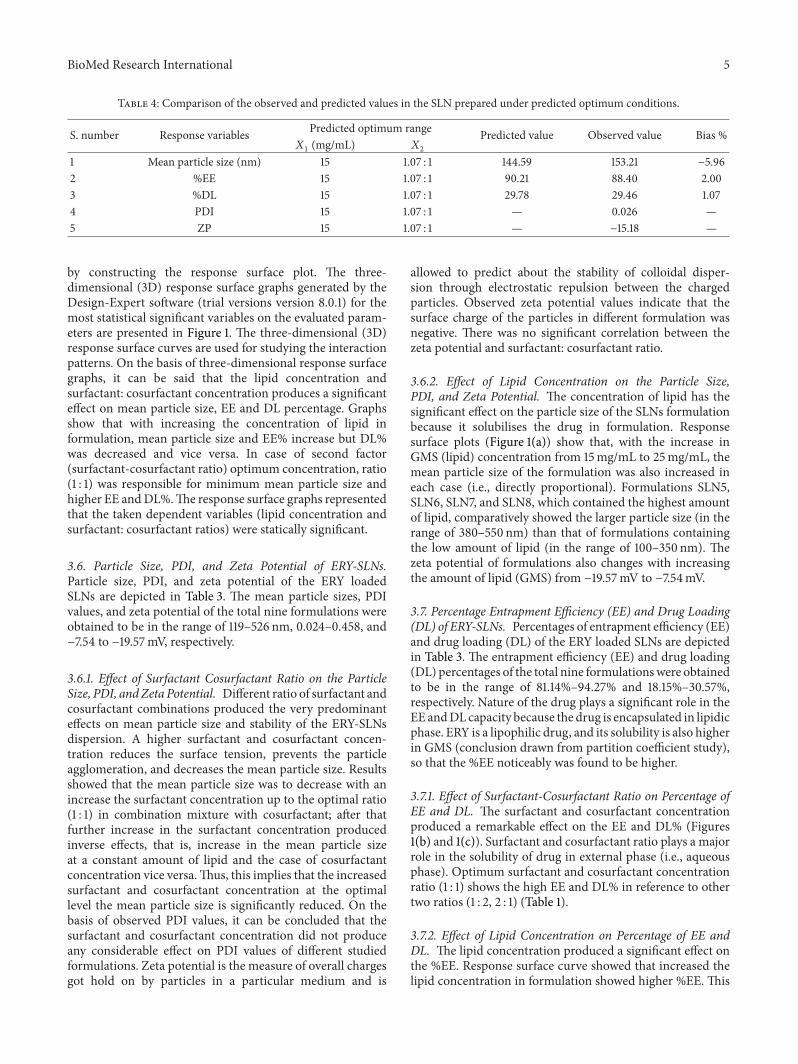
Predicted optimum ranges of the independent variableswere listed in Table 4. The fitting results point out that theoptimized SLNs formulation with high EE, high drug loadingpercentage, and small mean diameter was obtained at thelipid concentration of 15mg/mL and ratio of surfactant :cosurfactant of 1.07 : 1, respectively. Table 4 showed that theobserved values of the prepared batch with the optimizedformula was very close to the predicted values, with lowpercentage bias, suggesting that the optimized formulationwas trustworthy and rational.
3.5. Response Surface Plots. The relationship between thedependent and independent variables is further elucidated
BioMed Research International 5
Table 4: Comparison of the observed and predicted values in the SLN prepared under predicted optimum conditions.
S. number Response variables Predicted optimum range Predicted value Observed value Bias %𝑋1(mg/mL) 𝑋
2
1 Mean particle size (nm) 15 1.07 : 1 144.59 153.21 −5.962 %EE 15 1.07 : 1 90.21 88.40 2.003 %DL 15 1.07 : 1 29.78 29.46 1.074 PDI 15 1.07 : 1 — 0.026 —5 ZP 15 1.07 : 1 — −15.18 —
by constructing the response surface plot. The three-dimensional (3D) response surface graphs generated by theDesign-Expert software (trial versions version 8.0.1) for themost statistical significant variables on the evaluated param-eters are presented in Figure 1. The three-dimensional (3D)response surface curves are used for studying the interactionpatterns. On the basis of three-dimensional response surfacegraphs, it can be said that the lipid concentration andsurfactant: cosurfactant concentration produces a significanteffect on mean particle size, EE and DL percentage. Graphsshow that with increasing the concentration of lipid informulation, mean particle size and EE% increase but DL%was decreased and vice versa. In case of second factor(surfactant-cosurfactant ratio) optimum concentration, ratio(1 : 1) was responsible for minimum mean particle size andhigher EE andDL%.The response surface graphs representedthat the taken dependent variables (lipid concentration andsurfactant: cosurfactant ratios) were statically significant.
3.6. Particle Size, PDI, and Zeta Potential of ERY-SLNs.Particle size, PDI, and zeta potential of the ERY loadedSLNs are depicted in Table 3. The mean particle sizes, PDIvalues, and zeta potential of the total nine formulations wereobtained to be in the range of 119–526 nm, 0.024–0.458, and−7.54 to −19.57mV, respectively.
3.6.1. Effect of Surfactant Cosurfactant Ratio on the ParticleSize, PDI, andZeta Potential. Different ratio of surfactant andcosurfactant combinations produced the very predominanteffects on mean particle size and stability of the ERY-SLNsdispersion. A higher surfactant and cosurfactant concen-tration reduces the surface tension, prevents the particleagglomeration, and decreases the mean particle size. Resultsshowed that the mean particle size was to decrease with anincrease the surfactant concentration up to the optimal ratio(1 : 1) in combination mixture with cosurfactant; after thatfurther increase in the surfactant concentration producedinverse effects, that is, increase in the mean particle sizeat a constant amount of lipid and the case of cosurfactantconcentration vice versa.Thus, this implies that the increasedsurfactant and cosurfactant concentration at the optimallevel the mean particle size is significantly reduced. On thebasis of observed PDI values, it can be concluded that thesurfactant and cosurfactant concentration did not produceany considerable effect on PDI values of different studiedformulations. Zeta potential is the measure of overall chargesgot hold on by particles in a particular medium and is
allowed to predict about the stability of colloidal disper-sion through electrostatic repulsion between the chargedparticles. Observed zeta potential values indicate that thesurface charge of the particles in different formulation wasnegative. There was no significant correlation between thezeta potential and surfactant: cosurfactant ratio.
3.6.2. Effect of Lipid Concentration on the Particle Size,PDI, and Zeta Potential. The concentration of lipid has thesignificant effect on the particle size of the SLNs formulationbecause it solubilises the drug in formulation. Responsesurface plots (Figure 1(a)) show that, with the increase inGMS (lipid) concentration from 15mg/mL to 25mg/mL, themean particle size of the formulation was also increased ineach case (i.e., directly proportional). Formulations SLN5,SLN6, SLN7, and SLN8, which contained the highest amountof lipid, comparatively showed the larger particle size (in therange of 380–550 nm) than that of formulations containingthe low amount of lipid (in the range of 100–350 nm). Thezeta potential of formulations also changes with increasingthe amount of lipid (GMS) from −19.57mV to −7.54mV.
3.7. Percentage Entrapment Efficiency (EE) and Drug Loading(DL) of ERY-SLNs. Percentages of entrapment efficiency (EE)and drug loading (DL) of the ERY loaded SLNs are depictedin Table 3. The entrapment efficiency (EE) and drug loading(DL) percentages of the total nine formulationswere obtainedto be in the range of 81.14%–94.27% and 18.15%–30.57%,respectively. Nature of the drug plays a significant role in theEE andDL capacity because the drug is encapsulated in lipidicphase. ERY is a lipophilic drug, and its solubility is also higherin GMS (conclusion drawn from partition coefficient study),so that the %EE noticeably was found to be higher.
3.7.1. Effect of Surfactant-Cosurfactant Ratio on Percentage ofEE and DL. The surfactant and cosurfactant concentrationproduced a remarkable effect on the EE and DL% (Figures1(b) and 1(c)). Surfactant and cosurfactant ratio plays a majorrole in the solubility of drug in external phase (i.e., aqueousphase). Optimum surfactant and cosurfactant concentrationratio (1 : 1) shows the high EE and DL% in reference to othertwo ratios (1 : 2, 2 : 1) (Table 1).
3.7.2. Effect of Lipid Concentration on Percentage of EE andDL. The lipid concentration produced a significant effect onthe %EE. Response surface curve showed that increased thelipid concentration in formulation showed higher %EE. This

6 BioMed Research International
−1−0.5
00.5
1
100
200
300
400
500
600
Part
icle
size
(nm
) 140.392
−1−0.5
00.5
1
X1X2
Part
icle
size
(nm
)
Design points above predicted valueDesign points below predicted value
526.5
119.86
B: ratio of surfactant and co-surfactantX2 =
A: lipid concentration (mg)X1 =
(a)
−1−0.5
00.5
1
−1−0.5
00.5
1
80
85
90
95
100
EE (%
)
90.5366
X1X2
EE (%
)
94.27
81.14
Design points above predicted valueDesign points below predicted value
B: ratio of surfactant and co-surfactantX2 =
A: lipid concentration (mg)X1 =
(b)
−1−0.5
00.5
1
161820222426283032
DL
(%)
29.9025
−1−0.5
00.5
1
X1X2
30.57
18.15
DL
(%)
Design points above predicted valueDesign points below predicted value
B: ratio of surfactant and co-surfactantX2 =
A: lipid concentration (mg)X1 =
(c)
Figure 1: Response surface plot showing the effect of lipid (GMS) concentration (𝑋1) and ratio of surfactant: cosurfactant (𝑋
2) on (a) mean
diameter of particles (𝑌1), (b) %EE (𝑌
2), and (c) %DL (𝑌
3).
may be due to the increasing internal phase; more amounts oflipid were available for the dissolving of drug (ERY). ERY hasthe highest partition coefficient in GMS (conclusion drawnfrom partition coefficient study) which is another reason forincreasing %EE.
3.8. DSC Studies. DSC studies were performed for the assess-ment of the drug excipients interactions. The DSC thermo-gram was run for the pure ERY, bulk GMS, physical mixtureof ERY and GMS at 1 : 1 ratio, and drug loaded freeze driedSLNs. Figure 2 showed the DSC thermogram. The melting

BioMed Research International 7
60 1008040 120 140 160 180 220200
ERY -SLNGMS
PHY -MIX
ERY
(∘C)
Figure 2: DSC thermograms of pure Erythromycin (ERY), physicalmixture of ERY and GMS (PHY-MIX), bulk GMS (GMS), and ERYloaded lyophilised SLNs (ERY-SLN).
Figure 3: Transmission electron microscopic (TEM) image ofoptimized Erythromycin loaded solid lipid nanoparticles.
point of ERY is 193–195∘C. The DSC thermogram of ERYand bulk GMS showed a sharp endothermic peak at 193∘Cand 55∘C, respectively. No significant shift in the position ofendothermic peaks was observed after running the physicalmixture (1 : 1) of ERY andGMS.Thus, no chemical interactionwas found between ERY and GMS. ERY loaded SLNs showtwo endothermic peaks in DSC thermogram; first one wasobserved at 56∘C for GMS and second one at around 165∘Cfor mannitol (cryoprotectant), but ERY peak was not found.This result suggests that ERY entrap in SLNs exists in theamorphous state.
3.9. Transmission Electron Microscopy (TEM) Studies. Inorder to investigate the morphology and size of the optimalERY-SLNs, TEM was used. TEM photomicrograph of theERY loaded SLNs is shown in Figure 3. The optimized ERY-SLNs formulation showed nonspherical shape and particlesize is about 150 nm which are almost the same results obtainfrom Zetasizer determination.
3.10. In Vitro Drug Release Studies. The in vitro release curveof the optimal ERY-SLNs suspension in 6.8 pH phosphate
020406080
0 5 10 15 20 25 30Time (h)
Cumulative drug release
Cum
ulat
ive d
rug
rele
ase (
%)
Figure 4: Release curve of the optimized ERY-SLNs suspension in6.8 pH phosphate buffer at 37∘C.
buffer at 32 ± 0.5∘C was shown in Figure 4. Cumulativepercentage drug release of optimized ERY-SLNs suspensionshowed 66.26 ± 2.83% in 24 hours. In vitro release curveshowed the initial burst release with the about 40% of drugrelease during the first two hours; after that release sustainedfrom the optimized ERY-SLNs. Burst release occurred due tothe presence of the free ERY in the external phase and on thesurface of the SLNs. The lipophilic nature of the ERY couldbe the reason for sustained release of the drug from internallipidic phase after initial burst release. Initial burst releaserate was affected by the change of concentration of lipid andsurfactant in external phase. When the lipid concentrationincreased, the initial burst release rate decreased; this may bedue to the higher concentration of drug presence in the innercore. Whereas surfactant concentration increases, the initialburst release rate increases due to the increased solubility ofdrug in external phase.
3.11. Storage Stability Studies. Storage stability studies wereconducted on optimized SLNs using the particle size, zetapotential, and EE as the prime parameters. There was anegligible or slight increase in the particle size during thethree-month storage at 4∘C and 25∘C from the 153.21 ±2.31 nm to 151.98 ± 1.68 nm and 158.81 ± 3.28 nm, respectively.In case of zeta potential similar results were seen for threemonths storage at 4∘C and 25∘C from the −15.18 ± (−5.53)mVto −14.10±(−1.76)mV and −12.53±(−0.59)mV, respectively.The EE% of the optimized batch initially was found to be88.40 ± 2.09% while that after three-month storage at 4∘Cand 25∘C was found to be 87.06 ± 0.53% and 85.69 ± 0.51%,respectively, indicating that the drug can retain within theSLNs for the sufficient period of time. On storage of the SLNs,there was no significant change occurring in the size, zetapotential, and EE% of the SLNs. Hence, they were found tobe stable on taken storage condition (at 4∘C and 25∘C) for atotal period of 3 months.
4. Conclusion
The ERY-SLNs were optimized using the miscellaneousdesign-response surface methodology by fitting a second-order model to the response data. The effect of twovariables, including lipid concentration (𝑋
1) and ratio of
surfactant : cosurfactant (𝑋2) with their interactions, had
been evaluated and modelled. The best local maximum of

8 BioMed Research International
entrapment efficiency (88.40± 2.09%) andminimumparticlesize (153.21 ± 2.31 nm) were found at lipid concentration15mg/ml and surfactant/cosurfactant ratio 1.07 : 1.The releaseprofile of the produced SLN was investigated in phosphatebuffer media, and it showed prolonged release during 24 h,up to 66.26 ± 2.83% release.The drug release behaviour fromthe SLNs exhibited a biphasic pattern with the burst releaseat the initial stage and sustained release subsequently. Theseresults indicated that the SLNs obtained in this study couldpotentially be exploited as a carrier with an initial dose andprolonged release when therapeutically desired.
Conflict of Interests
The authors declare that there is no conflict of interestsregarding the publication of this paper.
Acknowledgments
The authors are thankful to Director, University Instituteof Pharmacy, Pt. Ravi Shankar Shukla University, Raipur,Chhattisgarh, India, for providing necessary infrastructuralfacilities. The authors are also thankful to S Kant healthCare Ltd. and Gujrat and Signet Chemical Corporation Pvt.Ltd., Mumbai, India, for providing gift sample of drug andsurfactant.
References
[1] E. Marian, B. Tita, T. Jurca, A. Fulias, L. Vicas, and D. Tita,“Thermal behaviour of erythromycin-active substance andtablets,” Journal of Thermal Analysis and Calorimetry, vol. 111,no. 2, pp. 1025–1031, 2013.
[2] N. S. Ganesh, M. Deecaraman, B. Ramesh, and P. A. Kulkarni,“Orodispersible—slow releasing erythromycin tablets,” Interna-tional Journal of PharmTech Research, vol. 3, pp. 600–605, 2011.
[3] R. Pignatello, A. Mangiafico, B. Ruozi, G. Puglisi, and P. M.Furneri, “Amphiphilic erythromycin-lipoamino acid ion pairs:characterization and in vitromicrobiological evaluation,”AAPSPharmSciTech, vol. 12, no. 2, pp. 468–475, 2011.
[4] C. Puglia, P. Blasi, L. Rizza et al., “Lipid nanoparticles forprolonged topical delivery: an in vitro and in vivo investigation,”International Journal of Pharmaceutics, vol. 357, no. 1-2, pp. 295–304, 2008.
[5] R. H. Muller, M. Radtke, and S. A. Wissing, “Solid lipidnanoparticles (SLN) and nanostructured lipid carriers (NLC)in cosmetic and dermatological preparations,” Advanced DrugDelivery Reviews, vol. 54, supplement 1, pp. S131–S155, 2002.
[6] L. S. Kotikalapudi, L. Adepu, J. V. Ratna, and P. V. Diwan,“Formulation and in-vitro characterization of domperidoneloaded solid lipid nanoparticles,” International Journal of Phar-maceutical and Biomedical Research, vol. 3, pp. 22–29, 2012.
[7] X. Zhang, J. Liu, H. Qiao et al., “Formulation optimization ofdihydroartemisinin nanostructured lipid carrier using responsesurface methodology,” Powder Technology, vol. 197, no. 1-2, pp.120–128, 2010.
[8] S. S. Chalikwar, V. S. Belgamwar, V. R. Talele, S. J. Surana, andM.U. Patil, “Formulation and evaluation of Nimodipine-loadedsolid lipid nanoparticles delivered via lymphatic transport
system,” Colloids and Surfaces B: Biointerfaces, vol. 97, pp. 109–116, 2012.
[9] M. R. Aji Alex, A. J. Chacko, S. Jose, and E. B. Souto, “Lopinavirloaded solid lipid nanoparticles (SLN) for intestinal lymphatictargeting,” European Journal of Pharmaceutical Sciences, vol. 42,no. 1-2, pp. 11–18, 2011.
[10] K. C. Song, H. S. Lee, I. Y. Choung, K. I. Cho, Y. Ahn, andE. J. Choi, “The effect of type of organic phase solvents onthe particle size of poly(D,L-lactide-co-glycolide) nanoparti-cles,” Colloids and Surfaces A: Physicochemical and EngineeringAspects, vol. 276, no. 1–3, pp. 162–167, 2006.
[11] K. Manjunath and V. Venkateswarlu, “Pharmacokinetics, tissuedistribution and bioavailability of clozapine solid lipid nanopar-ticles after intravenous and intraduodenal administration,”Journal of Controlled Release, vol. 107, no. 2, pp. 215–228, 2005.
[12] M. A. Kalam, Y. Sultana, A. Ali, M. Aqil, A. K. Mishra, andK. Chuttani, “Preparation, characterization, and evaluation ofgatifloxacin loaded solid lipid nanoparticles as colloidal oculardrug delivery system,” Journal of Drug Targeting, vol. 18, no. 3,pp. 191–204, 2010.
[13] Z. Rahman, A. S. Zidan, and M. A. Khan, “Non-destructivemethods of characterization of risperidone solid lipid nanopar-ticles,” European Journal of Pharmaceutics and Biopharmaceu-tics, vol. 76, no. 1, pp. 127–137, 2010.
[14] C.-H. Liu and C.-T. Wu, “Optimization of nanostructuredlipid carriers for lutein delivery,” Colloids and Surfaces A:Physicochemical and Engineering Aspects, vol. 353, no. 2-3, pp.149–156, 2010.
[15] R. Paliwal, S. Rai, B. Vaidya et al., “Effect of lipid core materialon characteristics of solid lipid nanoparticles designed for orallymphatic delivery,” Nanomedicine: Nanotechnology, Biology,and Medicine, vol. 5, no. 2, pp. 184–191, 2009.

Submit your manuscripts athttp://www.hindawi.com
PainResearch and TreatmentHindawi Publishing Corporationhttp://www.hindawi.com Volume 2014
The Scientific World JournalHindawi Publishing Corporation http://www.hindawi.com Volume 2014
Hindawi Publishing Corporationhttp://www.hindawi.com
Volume 2014
ToxinsJournal of
VaccinesJournal of
Hindawi Publishing Corporation http://www.hindawi.com Volume 2014
Hindawi Publishing Corporationhttp://www.hindawi.com Volume 2014
AntibioticsInternational Journal of
ToxicologyJournal of
Hindawi Publishing Corporationhttp://www.hindawi.com Volume 2014
StrokeResearch and TreatmentHindawi Publishing Corporationhttp://www.hindawi.com Volume 2014
Drug DeliveryJournal of
Hindawi Publishing Corporationhttp://www.hindawi.com Volume 2014
Hindawi Publishing Corporationhttp://www.hindawi.com Volume 2014
Advances in Pharmacological Sciences
Tropical MedicineJournal of
Hindawi Publishing Corporationhttp://www.hindawi.com Volume 2014
Medicinal ChemistryInternational Journal of
Hindawi Publishing Corporationhttp://www.hindawi.com Volume 2014
AddictionJournal of
Hindawi Publishing Corporationhttp://www.hindawi.com Volume 2014
Hindawi Publishing Corporationhttp://www.hindawi.com Volume 2014
BioMed Research International
Emergency Medicine InternationalHindawi Publishing Corporationhttp://www.hindawi.com Volume 2014
Hindawi Publishing Corporationhttp://www.hindawi.com Volume 2014
Autoimmune Diseases
Hindawi Publishing Corporationhttp://www.hindawi.com Volume 2014
Anesthesiology Research and Practice
ScientificaHindawi Publishing Corporationhttp://www.hindawi.com Volume 2014
Journal of
Hindawi Publishing Corporationhttp://www.hindawi.com Volume 2014
Pharmaceutics
Hindawi Publishing Corporationhttp://www.hindawi.com Volume 2014
MEDIATORSINFLAMMATION
of