FORMULATION AND SENSORY EVALUATION OF HERB ...
141
KWAME NKRUMAH UNIVERSITY OF SCIENCE AND TECHNOLOGY, KUMASI, GHANA DEPARTMENT OF BIOCHEMISTRY AND BIOTECHNOLOGY COLLEGE OF SCIENCE FORMULATION AND SENSORY EVALUATION OF HERB TEA FROM MORINGA OLEIFERA, HIBISCUS SABDARIFFA AND CYMBOPOGON CITRATUS A THESIS SUBMITTED TO THE DEPARTMENT OF BIOCHEMISTRY AND BIOTECHNOLOGY, KWAME NKRUMAH UNIVERSITY OF SCIENCE AND TECHNOLOGY, IN PARTIAL FULFILLMENT OF THE REQUIREMENT FOR THE AWARD OF THE DEGREE OF MASTER OF SCIENCE (FOOD SCIENCE AND TECHNOLOGY) BY NICHOLAS EKOW ANESI DE-HEER OCTOBER 2011
-
Upload
khangminh22 -
Category
Documents
-
view
0 -
download
0
Transcript of FORMULATION AND SENSORY EVALUATION OF HERB ...

KWAME NKRUMAH UNIVERSITY OF SCIENCE AND TECHNOLOGY, KUMASI, GHANA
DEPARTMENT OF BIOCHEMISTRY AND BIOTECHNOLOGY
COLLEGE OF SCIENCE
FORMULATION AND SENSORY EVALUATION OF HERB TEA FROM MORINGA OLEIFERA, HIBISCUS SABDARIFFA AND
CYMBOPOGON CITRATUS
A THESIS SUBMITTED TO THE DEPARTMENT OF BIOCHEMISTRY AND BIOTECHNOLOGY, KWAME NKRUMAH UNIVERSITY OF SCIENCE AND
TECHNOLOGY, IN PARTIAL FULFILLMENT OF THE REQUIREMENT FOR THE AWARD OF THE DEGREE OF MASTER OF SCIENCE
(FOOD SCIENCE AND TECHNOLOGY)
BY
NICHOLAS EKOW ANESI DE-HEER
OCTOBER 2011

ii
DECLARATION
STUDENT:
I hereby declare that this thesis is the outcome of my own original research and that it has neither in part nor in whole been presented for another certificate in this university or elsewhwere.
NAME: Nicholas Ekow Anesi de-Heer SIGNATURE……………………………
DATE: ………………………………….
SUPERVISORS:
We hereby declare that the preparation and presentation of this project work were supervised in accordance with guidelines on the supervision of project work laid down by the Kwame Nkrumah University of Science and Technology.
NAME: Prof. (Mrs) Ibok Oduro SIGNATURE………………………………
DATE: ………………………………….
NAME: Dr. Peter Twumasi SIGNATURE………………………………
DATE: …………………………………..

iii
DEDICATION
To the hungry in Africa; and all who share the dream of ending hunger in Africa and the
world over.

iv
ACKNOWLEDGEMENT
Completing my research and writing this thesis has been, in many ways, like a journey up
Mount Everest; long, steep and dotted with many moments of discouragement. The view
from the mountaintop leaves me dizzy with nostalgia, and I recount with a profound sense of
gratitude, the several personalities on whose support I leaned during my journey.
I am forever grateful to my supervisors, Prof. Mrs. Ibok Oduro and Dr. Peter Twumasi, who
provided sound guidance throughout the work. Without their patience and encouragement,
this project would not have seen the life of day. I am indebted to Mr. Amaglo Newton, whose
passion for Moringa research led him to provide all the Moringa samples and bag all the
formulations into teabags free of charge. Also deserving mention is my good friend, Mr.
Tohib Sule, who assisted me immensely in the latter stages of my work. I was fortunate to
have sat across the office desks of many lecturers who provided pieces of advice and
information. From KNUST I thank Mr. Ter Larbi, Mr. Agorku Eric Selorm, Mrs Gloria
Koomson and Mr Ofosu. I am also grateful to Dr. Esther Sakyi-Dawson, Mr. David Nana
Adjei and Mr. Felix Worlanyo of the University of Ghana.
I thank my family who have been a rock of support for me every stage of my life; Nana Esi
my cousin, the Ekems, Ewuresi my dear sister, and my heroic mother, Mrs. Joyce de-Heer.
To Mrs. Angela de-Heer, my best friend and partner, who cheered me on every step of this
marathon, I cannot express my heartfelt appreciation enough. Finally, to Him who gives me
life, for whom and by whom I have my being; He who will help me ascend higher heights;
Glory be Unto His Name. It is the Lord who has done it and it is marvelous in our eyes.

v
ABSTRACT
The sensory appeal of tea, like all food products, is an important consideration in new
product development. Tea in general and herb tea in particular, are gaining increasing
consumer attention due to a growing awareness of health benefits derived from their
consumption. Even though several underutilized plants exist with potential for processing
into herb tea, research in product development of herb teas is limited. The objectives of the
study were (1) to conduct chemical analyses on three herbs – Cymbopogon citratus leaves,
Hibiscus sabdariffa calyces and Moringa oleifera leaves – in order to assess their potential
for food product development; (2) to conduct acceptance tests on herb tea prepared from
formulations of the herbs; and (3) to generate descriptive vocabulary on the sensory
properties of herb tea. The herbs were unblanched and solar-dried. Standard methods were
used to measure proximate parameters, water soluble extractives (WSE), light petroleum
extractives (LPE), pH, total polyphenolics content (TPC) and minerals (Ca, Fe, Cu and Zn).
Fifty (50) untrained panelists conducted acceptance tests on infusions from nine formulations
and one control, and a nine-member trained panel conducted descriptive tests on infusions
from three selected blends. Results of chemical analysis revealed that Moringa, Roselle and
Lemon grass had, respectively, TPC of 35.70 mg/g, 27.81 mg/g and 15.37 mg/g; WSE of
7.44%, 12.38% and 4.07%; LPE of 3.48%, 2.71% and 4.1%; pH of 5.47, 2.73 and 4.53.
Mineral analyses revealed that Moringa, Roselle and Lemon grass had, respectively, Ca of
412.5 mg/100g, 294 mg/100g and Fe of 12.93 mg/100g; 24.26 mg/100g and 11.58 mg/100g.
A total of seventeen (17) descriptors were generated, defined and referenced for herb tea
comprising six (6) appearance, three (3) aroma, one (1) flavour, five (5) taste and two (2)
mouthfeel descriptors. Herb tea brewed from product 532 (50% Moringa, 30% Roselle and
20% Lemon grass) was the most preferred in colour, flavour, astringency and overall sensory

vi
properties while the control (100% Moringa) brewed the least preferred herb tea in most of
the sensory attributes. Product 532 was predominantly reddish in colour (12.56) while the
control was yellowish (11.93). Product 532 had high mean scores for Turbidity (12.67),
Herbal aroma (11.41), Citrus aroma (11.30), Sour taste (12.15) and Astringency (11.41) while
the control had significantly low scores for most of these attributes (≤ 2.33). Herb tea from
blend of Moringa, Roselle and Lemon grass was more appealing than herb tea from only
Moringa.

vii
TABLE OF CONTENTS
TITLE PAGE i
DECLARATION ii
DEDICATION iii
ACKNOWLEDGEMENT iv
ABSTRACT v
TABLE OF CONTENTS vii
LIST OF TABLES xi
LIST OF FIGURES xii
LIST OF APPENDICES xiv
CHAPTER ONE 1
1.0 INTRODUCTION 1
1.1 MAIN OBJECTIVE 3
1.2 SPECIFIC OBJECTIVES 3
1.3 RESEARCH JUSTIFICATION 4
CHAPTER TWO 5
2.0 LITERATURE REVIEW 5
2.1 TEA – DEFINITION AND TYPES 5
2.2 HEALTH BENEFITS OF CONSUMING TEA 7
2.3 SENSORY ATTRIBUTES OF TEA 8
2.4 PREPARATION OF TEA 10
2.5 WORLD PRODUCTION OF TEA 10

viii
2.6 MORINGA (Moringa oleifera Lam) 12
2.6.1 GENERAL USES OF MORINGA 12
2.6.2 CHEMICAL COMPOSITION OF MORINGA LEAF 13
2.6.3 HEALTH BENEFITS OF CONSUMING MORINGA LEAF 14
2.7 ROSELLE (Hibiscus sabdariffa L.) 15
2.7.1 GENERAL USES OF ROSELLE 16
2.7.2 CHEMICAL COMPOSITION OF ROSELLE CALYX 17
2.7.3 HEALTH BENEFITS OF CONSUMING ROSELLE CALYX 18
2.8 LEMON GRASS (Cymbopogon citratus Stapf) 19
2.8.1 GENERAL USES OF LEMONGRASS 20
2.8.2 CHEMICAL COMPOSITION OF LEMON GRASS LEAF 20
2.8.3 HEALTH BENEFITS OF CONSUMING LEMON GRASS LEAF 21
2.8.4 RATIONALE FOR USING MORINGA, ROSELLE AND
LEMON GRASS IN HERB TEA FORMULATIONS 22
2.9 SENSORY EVALUATION 23
2.9.1 Descriptive Sensory Analysis 23
2.9.2 Training 24
CHAPTER THREE 27
3.0 MATERIALS AND METHODS 27
3.1 SAMPLE COLLECTION 27
3.2 SAMPLE PREPARATION AND STORAGE 27
3.3 CHEMICAL ANALYSES 29
3.3.1 DETERMINATION OF STALKS 29
3.3.2 DETERMINATION OF TOTAL POLYPHENOLICS 30

ix
3.3.3 DETERMINATION OF WATER-SOLUBLE EXTRACTIVES (WSE) 31
3.3.4 DETERMINATION OF LIGHT PETROLEUM EXTRACT (LPE) 32
3.4 PREPARATION OF FORMULATIONS 32
3.5 SENSORY EVALUATION 33
3.5.1 PREPARATION OF INFUSIONS 33
3.5.2 ACCEPTANCE TEST 34
3.5.2.1 Selection of panelists 34
3.5.2.2 Procedure for serving the tea to panelists 34
3.5.2.3 Scoring of samples 35
3.5.3 DESCRIPTIVE TEST 35
3.5.3.1 Selection of panelists 35
3.5.3.2 Training of panelists 36
3.5.3.3 Main Sensory Evaluation 38
3.6 STATISTICAL ANALYSIS 38
CHAPTER FOUR 39
4.0 RESULTS AND DISCUSSION 39
4.1 CHEMICAL ANALYSIS OF HERB SAMPLES 39
4.1.1 MOISTURE CONTENT 39
4.1.2 CRUDE ASH CONTENT 40
4.1.3 MINERAL CONTENT 41
4.1.4 CRUDE PROTEIN CONTENT 45
4.1.5 CRUDE FIBRE CONTENT 46
4.1.6 WATER SOLUBLE EXTRACTIVES (WSE) 47
4.1.7 LIGHT PETROLEUM EXTRACTIVES (LPE) 48

x
4.1.8 pH 49
4.1.9 STALKS 50
4.1.10 TOTAL POLYPHENOL CONTENT (TPC) 50
4.2 ACCEPTANCE TESTS 52
4.2.1 COLOUR 52
4.2.2 AROMA 53
4.2.3 FLAVOUR 55
4.2.4 AFTERTASTE 56
4.2.5 ASTRINGENCY 57
4.2.6 OVERALL ACCEPTABILITY 59
4.3 DESCRIPTIVE TESTS 60
4.3.1 APPEARANCE DESCRIPTORS 60
4.3.2 AROMA AND FLAVOUR DESCRIPTORS 62
4.3.3 TASTE DESCRIPTORS 64
4.3.4 MOUTHFEEL DESCRIPTORS 66
4.4 TOTAL POLYPHENOL CONTENT OF PRODUCTS 67
CHAPTER FIVE 69
5.0 CONCLUSION AND RECOMMENDATION 69
5.1 CONCLUSION 69
5.2 RECOMMENDATIONS 70
REFERENCES 71

xi
LIST OF TABLES
Table 2.1 1998 World Production of Tea 11
Table 2.2 Vitamin, mineral and amino acid content of
Moringa leaf powder 14
Table 2.3 Proportion of herbs in blended products 33
Table 3.1 Reference samples for green tea 37
Table 4.1 Definitions and references of appearance descriptors
for herb tea 61
Table 4.2 Definitions and references of aroma and flavour descriptors
for herb tea 63
Table 4.3 Definitions and references of taste descriptors for herb tea 65
Table 4.4 Definitions and references of mouthfeel descriptors for herb tea 66

xii
LIST OF FIGURES
Figure 2.1 Picture of Moringa oleifera 12
Figure 2.2 Picture of Hibiscus sabdariffa 16
Figure 2.3 Picture of Cymbopogon citrates 19
Figure 3.1 Flow diagram of sample preparation and process 28
Figure 4.1 Moisture content of herb samples 40
Figure 4.2 Crude ash content of herb samples 41
Figure 4.3 Calcium content of herb samples 42
Figure 4.4 Iron content of herb samples 43
Figure 4.5 Copper content of herb samples 44
Figure 4.6 Zinc content of herb samples 45
Figure 4.7 Crude protein content of herb samples 46
Figure 4.8 Crude fibre content of herb samples 47
Figure 4.9 Water soluble extractive (WSE) of herb samples 48
Figure 4.10 Light petroleum extractive (LPE) of herb samples 49
Figure 4.11 pH of herb samples 50
Figure 4.12 Total polyphenol content (TPC) of herb samples 51
Figure 4.13 Panelist scores of acceptance test for colour 53
Figure 4.14 Panelist scores of acceptance test for aroma 54
Figure 4.15 Panelist scores of acceptance test for flavor 56
Figure 4.16 Panelist scores of acceptance test for aftertaste 57
Figure 4.17 Panelist scores of acceptance test for astringency 58
Figure 4.18 Panelist scores of acceptance test for overall acceptability 59
Figure 4.19 Quantitative scores for appearance descriptors of herb tea 62
Figure 4.20 Quantitative scores for aroma and flavour descriptors of herb tea 64
Figure 4.21 Quantitative scores for taste descriptors of herb tea 65
Figure 4.22 Quantitative scores for mouthfeel descriptors of herb tea 67

xiii
Figure 4.23 Total polyphenol content (TPC) of herb tea products 68

xiv
LIST OF APPENDICES
Appendix A Sensory Evaluation Form 93
Appendix B Summary of Analysis of Variance 94

1
CHAPTER ONE
1.0 INTRODUCTION
The drinking of tea begun in China centuries ago, and has over the years become an
inseparable part of most cultures worldwide. Tea is currently the most widely consumed
beverage in the world (Schmidt et al., 2005) and therefore ranks as an important world food
product. About one tenth of the world production volume of tea is supplied by Kenya which
is Africa’s largest producer of tea (International Tea Committee, 1998).
Tea is generally consumed for its attractive aroma and taste as well as the unique place it
holds in the culture of many societies. In recent times, there is renewed interest in tea because
of growing consumer awareness of health benefits derived from tea consumption (McKay
and Blumberg, 2002). Tea therefore belongs to a rapidly expanding market of ‘wellness
beverages’ (Byun and Han, 2004).
By definition, tea is an infusion of the leaves or other parts of the evergreen tea plant
(Camellia sp). Teas have been traditionally categorized into green, oolong and black teas
according to the processing conditions employed during manufacturing (Kirk and Sawyer
(1997). In recent times, however, a fourth category, called herb teas, is gaining increasing
popularity among consumers. Unlike traditional teas, herb teas are prepared from plants other
than Camellia (Bender, 2003)
Tea preparation follows a simple procedure. Hot water (70 °C to 100 °C) is poured over the
plant part(s) in a container and allowed to steep for a few minutes (usually 1 – 5 min) after
which the plant material, usually contained in a bag, is removed from the container. The

2
temperature of the water used and the duration of steeping affect the ‘strength’ of the tea. Tea
is drunk hot, warm or iced. In some cases milk and/or a sweetener such as honey or sucrose
may be added before drinking (Hakim et al., 2000).
According to Abbey and Timpo (1990), indigenous herbs are in general heavily under-
exploited in spite of their huge dietary potential. It is therefore imperative to explore the
potential of indigenous plant materials in the development of new herb teas. Three examples
of indigenous plants discussed in this thesis are Moringa oleifera (Moringa), Hibiscus
sabdariffa (Roselle) and Cymbopogon citratus (Lemon grass).
Moringa is an easily propagated plant which thrives well in harsh environmental conditions.
It is increasingly gaining global attention due to an excellent profile of nutrients and
antioxidants. Moringa leaf is rich in minerals, amino acids, vitamins and -carotene. It also
contains a rare combination of health-promoting antioxidants: zeatin, quercetin, sitosterol,
caffeoylquinic acid and kaempferol (Anwar et al., 2007). Currently, there is growing interest
in the use of Moringa leaf as an ingredient in the preparation of herb tea. According to
unpublished reports, however, herb tea made solely from Moringa is poor in sensory appeal
(Source: personal communication). This may probably be due to the absence of distinctive
flavour properties. It may therefore be necessary to combine Moringa with other herbs in
developing herb teas as a way of improving its sensory appeal. This is crucial because
consumers are generally unwilling to buy food with poor sensory appeal, irrespective of
health or nutritional benefits (de Cock et al., 2005).

3
Roselle is an aromatic, astringent herb with multiple food uses including the preparation of
beverages. Roselle is known to impart a characteristic reddish colour and sour taste which
many consider appealing in beverages (Blench, 1997).
Lemon grass has been a preferred component of many cuisines for centuries because of its
excellent aromatic properties. Infusion of lemon grass leaf gives an aromatic drink with a
characteristic lemon flavour (Figueirinha et al., 2008).
1.1 MAIN OBJECTIVE
The main objective of the study is to explore alternative uses for Moringa oleifera, Hibiscus
sabdariffa and Cymbopogon citratus by blending the three herbs to produce a herb tea with
acceptable sensory properties.
1.2 SPECIFIC OBJECTIVES
The specific objectives of the study are:
• to determine chemical composition of dried Moringa oleifera leaves, Hibiscus
sabdariffa calyces and Cymbopogon citratus leaves;
• to perform acceptance tests on infusions prepared from blends of the three herbs;
and
• to generate descriptive vocabulary that would characterize the sensory properties
of herb tea.

4
1.3 RESEARCH JUSTIFICATION
Developing new herb tea products from indigenous plants will provide novel uses for
underutilized plants. It will further provide consumers with new alternatives to traditional
teas. Moreover the research will bring to light the potential of the underutilized plants for
food product development. The research will broaden understanding of the sensory
characteristics and preferences of herb teas in particular and beverages in general. It will
further advance research in herb tea product development.

5
CHAPTER TWO
2.0 LITERATURE REVIEW
2.1 TEA – DEFINITION AND TYPES
Tea is, by definition, a beverage prepared by infusion of young leaves, leaf buds and
internodes of varieties of the tea plant Camellia sinensis or Camellia assamica (Bender,
2003).
During the processing of tea, the plant materials usually undergo some level of fermentation.
The type of processing conditions, mainly the extent of fermentation, determines the type of
tea produced as well as its distinctive characteristics. Kirk and Sawyer (1997) recognized
three main types of tea: green tea, oolong tea and black tea.
Processing of green tea involves little or no fermentation and the tea leaf often remains
reasonably green. Oolong tea undergoes partial fermentation while black tea undergoes
complete fermentation (Taylor and McDowell, 1993; Rinzler, 2001).
Green teas are characterized by inactivation of the enzyme polyphenol oxidase immediately
after plucking of the tea shoots. This enzyme is responsible for oxidizing the catechins to
theaflavins and thearubigins, the tea pigments responsible for the colour and taste of black
teas. The inactivation can be achieved by parching, roasting or steaming the tea shoots.
Traditionally, the Chinese roast the tea shoots in a metal roaster and process the tea shoots by
using a unidirectional rotatory roller. This type of rolling gives a twist to the leaf and
compacts the particles. Chinese green tea is characterized by a roast odour. On the other
hand, the Japanese inactivate the tea shoots by steaming, followed by bi-directional rolling.

6
This rolling makes the shoot surface flat with leaf juice spread over the entire surface
(Sharma et al., 2005).
In recent times infusions of dry plant parts of other higher plant species have been given the
same generic name ‘tea’ (Owusu and Odamtten, 1999). Reports from India indicate
alternative sources of tea from the leaves of five mangrove species namely Bruguiera
cylindrical (L) Bl., Ceriops decandra (Griff). Ding Hou, Rhizopora apiculata Blame, R.,
lamarckii Montr and R. mucuonata Lam (Kathiresan, 1965). Previous workers in Europe
have formulated tea from leaves of several plants including Fragaria vesca, Sorbus
aucuparia, Filipendula ulmaria, Epilobium anguistifolium and Rubus idaeus (Julkenen-Tito
et al., 1988) with abundant aromatic constituents showing therapeutic effects in man. A more
appropriate term for these infusions of other plants is ‘herb tea’. A herb tea is defined as an
‘infusion of leaves, fruits, stems, roots, etc. made from plant parts other than Camellia sp.’
(Bender, 2003). Other names for herb tea are ‘herbal tea’ or ‘tisane’. In Ghana, the use of
Cinnamon (Cinnamomum zeylanicum Blume) leaves, Citronella (Cymbopogon nardus)
leaves, Roselle (Hibiscus sabdariffa) calices and other indigenous herbs in making herb tea
has become a common practice (Owusu and Odamtten, 1999).
However, within each category of tea, differences in characteristics exist due to factors such
as differences in the processing methods used, differences in the stage of maturity of tea
leaves at harvest, differences in the type of tree species, and differences in the region where
the tea was cultivated (Jung, 2004). Further, some commercial teas may contain additional
herbs from other plant materials; pieces of fruit, flowers, etc; intended to impart flavor, color
or taste to the tea. Examples include “Earl Grey Tea”; black tea with added bergamot; and
Jasmine tea; black tea with added jasmine flowers (Jung, 2004).

7
All teas – green, oolong, black or herb – are hot water infusions of plant parts enjoyed by
many people around the world for their desirable sensory properties, probable health benefits
or cultural significance.
2.2 HEALTH BENEFITS OF CONSUMING TEA
Teas were originally consumed for their taste and aroma. However, a recent awareness of
their health benefits has increased consumers’ interest in the beverage (Khokhar and
Magnusdottir 2002; Byun and Han 2004). Specific health claims in various countries include
promotion of respiratory health and reduction in cholesterol and blood pressure (MINTEL.,
2005). For these reasons, teas are regarded as functional foods along with beverages such as
sports drinks, fruit and vegetable juices (Byun and Han 2004).
A functional food is, by definition, food that has a relevant effect on well-being and health, or
results in a reduction in disease risk. The functional component of a functional food may be
an essential macronutrient or micronutrient, a nutrient that is not considered essential, or a
non-nutritive component (Roberfroid, 1999). Even though teas have little nutritional value
per se (Hamiltion-Miller, 1995), they are rich in phenolic compounds which have proven
health benefits (Marongiu et al., 2004). Larson (1988) reported on several biological
activities of polyphenols including antibacterial, anti-carcinogenic, anti-inflammatory, anti-
viral, anti-allergic, estrogenic, and immune-stimulating effects. They are also known to
exhibit high solubility in water (Haslam, 1998).
The global functional food market reached a value of $ 31.7 billion in 1999 with an expected
growth of 10% until 2004 (Euromonitor, 2000). Consumers are generally unwilling to buy

8
food with poor sensory appeal, irrespective of health or nutritional benefits (de Cock et al.,
2005). For this reason, a closer attention needs to be given to the sensory properties of
functional foods in new product development.
2.3 SENSORY ATTRIBUTES OF TEA
The flavor of tea, particularly green tea, has been studied using both chemical and sensory
methods (Chambers and Lee, 2007). Volatile fractions of various teas contain more than 50
aroma active compounds, including ones that could yield nutty, popcorn-like, metallic, floral,
meaty, fruity, potato, green, cucumber-like and hay-like characteristics (Kumazawa and
Masuda, 2002). Wang et al. (2000) found that epigallocatechin gallate and epigallocatechin
appeared to play the key role in the changes of sensory qualities of a processed green tea
beverage. Age and the extent of fermentation have significant effects on volatile flavor
compounds. Teas with the youngest leaves generally have the highest amounts of catechins
and amino acids, which could result in off-flavors (Kinugasa et al., 1997).
Ellis (2002) used a variety of terms to describe tea flavor. These included sweet, fragrant,
malty, strong, full-bodied, spicy, fragrantly fruity, fresh, herbaceous, smoothly fragrant, deep,
astringent, grassytasting, smoky, savory strength, bitter and refreshing. However, no precise
definitions or references were provided (Chambers and Lee, 2007).
Other publications (Yamanishi, 1977; Park et al., 1999) have also provided some sensory
terminologies. Those authors included terms related to appearance (e.g., color of dried green
tea leaves, shape of tea leaves and color of infused green tea); flavor (fresh floral, sweet
floral, citrus, sweet fruity, fresh green, sweet, resinous, roasted, dimethyl sulfide-like, green,

9
burned, acidic, fermented, oily, earthly, moldy, seaweed, dried leaf, nutty, juice of
motherwort, acrid); fundamental tastes (bitter, sweet, aftertaste, umami); and mouthfeel
properties (astringent, biting/pungent).
A total of sixteen (16) sensory terms developed by Yamanishi (1977) were used by Togari et
al. (1995) to evaluate and differentiate among green, oolong and black tea, but did not
provide references to help with understanding of the attributes. Neither did his work include
herb teas. Cho et al. (2005) used descriptive analysis to compare 10 canned tea products
using 17 different attributes, including floral, lemon, roasted tea, roasted rice tea (artificial),
sweet odor, green tea, oolong tea, black tea, boiled milk, arrowroot/rooty, sour taste, sweet
taste, chestnut shell, oily, burnt leaf, bitter taste and astringency. Perhaps because the
products tested were processed in cans, the list included somewhat generic names of tea such
as green tea, oolong tea and black tea to describe tea products. Character references were
used, but intensities of the references were not given. All of the studies were conducted on a
limited number of samples that may not represent a broad range of teas (Chambers and Lee,
2007).
Sensory attributes of herb teas have received relatively little research attention despite the
growing popularity of herb teas worldwide. A wide variety of plant materials with distinctive
sensory qualities exist as potential ingredients of herb tea. There is the need for research to
explore options for blending different herbs in varying proportions to produce different
products. Blends could elicit distinct attributes which may be more desirable in sensory
appeal than individual herbs. Further, research must develop descriptive vocabulary to
enhance understanding of the sensory qualities of herb tea.

10
2.4 PREPARATION OF TEA
The extraction procedure during tea preparation is considered one of the most critical factors
for determining the sensory characteristics of the beverage (Hara et al., 1995). The extraction
of tea is determined by various factors, such as the tea-to-water ratio, length of infusion (Choi
et al., 2000), temperature of infusion (Jaganyi and Price 1999; Choi et al., 2000; Jaganyi and
Mdletshe 2000; Sharma et al., 2005; Weerts et al., 2005; Xia et al., 2006), type of infusing
water (Yau and Haung 2000) and type of tea (Shin 1994; Kim et al., 2002; Liang et al.,
2003).
2.5 WORLD PRODUCTION OF TEA
Tea is the most widely consumed beverage in the world, next only to water (Schmidt et al.,
2005). The global market for tea is expected to grow from $6.8 billion to $10 billion by end
of 2010 (Sloan, 2005).
The average annual global tea production from 1995 to 1997 was approximately 2.6 million
tonnes, with a global record of 2.86 million tonnes in 1998 (Table 2.1). World tea production
increased at an annual growth rate of 2.8 percent between 1970 and 2000, expanding from
1.27 million tonnes to 2.97 million tonnes. Tea is grown in at least 30 countries on five
continents. In the past two decades the most significant change in tea production has been the
development of tea plantations in Africa and South America (International Tea Committee,
1998).
The world production of tea is expected to increase further, since the areas under tea
production in countries like India, Bangladesh, Kenya, Malawi and Tanzania have been
recently expanded (International Tea Committee, 1998).

11
Tea production is highly centralized. In 1993, five countries – India, China, Sri Lanka,
Indonesia and Kenya – accounted for 75% of the world production. Most countries produce
tea mainly for export, but in India, China, Japan and Turkey about 70% of the tea produced is
consumed within the country. Tea is grown on about 2.5 million hectares of land in Asia (89
percent of global tea cultivated areas) and Africa (8 percent) (International Tea Committee,
1998).
Tea-producing countries can be further divided into two types based on investment –
traditional producers of tea, anxious to protect their market shares, who invest particularly in
the rehabilitation of trade areas, e.g. India and Sri Lanka; and relatively new producers in the
expansionary phase who invest in order to obtain a greater market share e.g. Kenya, Malawi,
Tanzania and Uganda (Kirk and Sawyer, 1997).
Table 2.1 1998 World Production of Tea
Country Production (tonnes) Percentage of World
Production (%)
India 870, 000 30
China 625, 000 22
Kenya 294, 000 10
Sri-Lanka 281, 000 10
Indonesia 166, 000 6
Turkey 115, 000 4
Japan 83, 000 3
Iran 60, 000 2
Argentina 50, 000 2
Australia 2, 000 0.1
Others 310, 000 11
Total 2, 856, 000 100
Source: International Tea Committee (1998)

12
2.6 MORINGA (Moringa oleifera Lam)
Moringa (Moringa oleifera Lam) is one of the best known and most widely distributed and
naturalized species of a monogeneric family Moringaceae (Nadkarni 1976; Ramachandran et
al. 1980) (Figure 2.1). Fully grown, Moringa trees range from 5m to 10m in height (Morton,
1991). The plant is a native of India. It is commonly known in English by names such as
Horseradish tree (describing the taste of its roots) and Drumstick tree (describing the shape
of its pods) (Ramachandran et al., 1980). In Ghana, it is found wild or cultivated next to
kitchens and in gardens (Newton, 2007).
Figure 2.1 Picture of Moringa oleifera
2.6.1 GENERAL USES OF MORINGA
Moringa is a multi-purpose tree with virtually every part of the plant being useful. It is
known to be extremely valuable in local communities where people have a direct
dependence on plants (Booth and Wickens, 1988). The immature pods are often cooked and
eaten like green beans. The roots are a popular food in East Africa. The bark of the tree is
known to contain a gum that is used as seasoning. The leaves are eaten as vegetable in many
cultures, either fresh or as canned. In Ghana, they are cooked and eaten like ‘Kontomire’ or
used to make soups, sauces or salads (Newton, 2007).

13
Moringa seed oil is suitable for cooking, particularly in salads. It is industrially used for soap
manufacturing. Moringa seeds are reported to be among the best natural coagulants ever
discovered (Ndabigengesere and Narasiah, 1998). Crushed seeds are a viable replacement for
synthetic coagulants (Kalogo et al., 2000). The seeds can also be used as an antiseptic in the
treatment of drinking water (Obioma and Adikwu, 1997).
Booth and Wickens (1988) reported several agronomic and industrial uses of Moringa. These
included alley cropping systems (for biomass production), animal forage (from leaves and
treated seed cake), biogas (from leaves), domestic cleaning agents (from crushed leaves), dye
(from the wood), fencing material, fertilizer (green manure from leaves), foliar nutrient, gum
(from tree trunks), honey clarifier, medicine, ornamental, crop disease prevention, industrial
manufacture of newsprint and writing paper, rope-making, tanning hides and water
purification. Many indigenous leafy vegetables in Ghana including Moringa oleifera are
under-exploited with some of them being endangered despite their immense potential value
(Abbey and Timpo, 1999). Developing food products from these under-exploited plants will
encourage local production of these plants and prevent their extinction.
2.6.2 CHEMICAL COMPOSITION OF MORINGA LEAF
Moringa leaf has been advocated as an outstanding indigenous source of highly digestible
proteins with an excellent amino acid profile. It contains the sulphur-containing amino acids
methionine and cystine. It is particularly rich in the minerals calcium and iron and the
vitamins A, B, C and E (Table 2.2). The leaves are also rich in -carotene and are an
exceptionally good source of fiber (Nambiar et al., 2003).

14
TABLE 2.2 Vitamin, mineral and amino acid content of Moringa leaf powder
Vitamin Content
(mg/100g)
Mineral Content
(100mg/g)
Amino acid Content
(mg/100g)
A 18.9 Calcium 2003 Arginine 1325
B1 2.64 Copper 0.57 Histidine 613
B2 20.5 Iron 28.2 Isoleucine 825
B3 8.2 Potassium 1324 Leucine 1950
E 11.3 Magnesium 368 Lysine 1325
Phosphorus 204 Methionine 350
Sulphur 870 Phenylalanine 1388
Selenium 0.09 Threonine 1188
Zinc 3.29 Tryptophan 425
Valine 1063
Source: Booth and Wickens (1988)
The leaf is also reported to have a wide range of beneficial polyphenolic compounds. These
include zeatin, quercetin, -sitosterol, caffeolquinic acid, rutin, lutein, catechins,
isothiocynates and kaempferol (Nambiar and Daniel, 2005).
2.6.3 HEALTH BENEFITS OF CONSUMING MORINGA LEAF
Moringa has been well known for its high medicinal properties in many cultures around the
world for many generations. Leaves and other plant parts are extensively used for treating
various ailments (The Wealth of India, 1962).
Moringa leaf is known to be beneficial for people with cardiovascular disorders. Moringa leaf
juice is also known to have a stabilizing effect on blood pressure (The Wealth of India, 1962).
The leaves have been reported to have hypocholesterolaemic (Ghasi et al., 2000) and
antitumour activities (Murakami et al., 1998; Makonnen et al., 1997), as well as being helpful

15
in the treatment of cardiovascular diseases and inflammation (Ezeamuzle et al., 1996).
Moringa leaves are also known to be useful for people with high risk factors of hypertension
(Faizi et al., 1998). An infusion of leaf juice has been shown to reduce glucose levels in
rabbits (Makonnen et al., 1997) and is known to be helpful for people with diabetes mellitus
(Kar et al., 2003).
Aqueous leaf extracts regulate thyroid hormone and can be used to treat hyperthyroidism
while exhibiting an antioxidant effect (Pal et al., 1995). Leaf extracts also exhibit
antispasmodic activity making it useful in diarrhea (Gilani et al., 1992) and gastrointestinal
motility disorder (Gilani et al., 1994). Aqueous leaf extracts show antiulcer effect (Pal et al.,
1995). Fresh leaf juice was found to inhibit the growth of microorganisms (Pseudomonas
aeruginosa and Staphylococcus aureus), pathogenic to man (Caceres et al., 1991). The leaves
have been reported to have anthelmintic activity (Bhattacharya et al., 1982).
2.7 ROSELLE (Hibiscus sabdariffa L.)
Roselle (Hibiscus sabdariffa L.) is an erect annual herb belonging to the family Malvaceae
(Figure 2.2). It originated from Malaysia and is cultivated mainly in tropical and subtropical
regions of the world (Appel, 2003). It is known by many names: ‘Florida roselle’, Florida
cranberry’ and Indian roselle in the USA; ‘asam susur’, ‘asama paya’ and ‘asam kumbang’ in
Malaysia; ‘sorrel’ or ‘Jamaican sorrel’ in the Caribbean; ‘karkade’ or ‘carcade’ in Sudan; and
‘Bisap’ in Senegal and Ghana (Morton 1974; Stephens 1994; Tee et al., 2002; Wong et al.,
2002).

16
Figure 2.2 Picture of Hibiscus sabdariffa
2.7.1 GENERAL USES OF ROSELLE
The calyces of Roselle are used in tropical Africa, West Indies, the Phillipines and Indonesia
to make refreshing drinks, tea, syrups, puddings, sauces, condiments and perfume (Esselen
and Sammy 1973; Clydesdale et al., 1979; D’Heureux-Calix and Badrie 2004). Roselle
extracts are used as raw material of soft drink and medicinal herb preparations (Chen, 2003).
Blench (1997) reported that the fleshy, cup-shaped calyces of Roselle are dried and commonly
used as tea, drunk hot or cold, after adding some sugar. This beverage, known for its aromatic,
astringent and cooling properties, is popular around the world especially in the Caribbean, but
also in North-Eastern Africa where the calyces were traditionally chewed to alleviate thirst
during long dessert trips. The fleshy Roselle is increasingly gaining popularity in the
Americas, where the calyces are used for making jelly, jams and beverages as well as food
colorants and chemical dyes. Fresh succulent calyces can also be used to make a kind of
chutney, together with ginger, pimento and other spices (Blench, 1997).
Roselle is an important fibre crop and leafy vegetable. In the savannah areas of The Ivory
Coast, Ghana and Burkina Fasso, it is widely cultivated for its leaves which are used to
prepare a wide variety of cuisines. In Asia, roselle fibre provides a good substitute for jute
while the pulp is used in the manufacture of newsprint. In Chad, one of the reasons for

17
growing the crop is oil. Roselle oil is mainly used for cooking purposes, but can also be used
as an ingredient for making paints. Roselle leaves are a source of mucilage used in
pharmaceuticals and cosmetics. Of recent interest is the ornamental value of the plant. Farmers
in Israel are promoting it as a cut flower. Other countries are using its shrubbery for decorative
purposes (Blench, 1997).
2.7.2 CHEMICAL COMPOSITION OF ROSELLE CALYX
Roselle contains a wide range of vitamins and minerals including Vitamin C, calcium, niacin,
riboflavin and flavonoids (SRC, 2002). Subramanian and Nair (1972) reported the presence of
two main flavonoids in Roselle calyx – gossypetin and hibiscetin – along with their glycosides.
Takeda and Yasui (1985) reported the presence of a third flavonoid, quercetin. Roselle calyx
has also been demonstrated to be a rich source of anthocyanins (Du and Francis, 1973) and
organic acids (Kerharo, 1971).
Chen et al. (1998) studied the composition of the volatile constituents of Roselle tea. More than
37 compounds were characterized, which were classified into four groups: fatty acid
derivatives, sugar derivatives, phenolic derivatives and terpenoids.
Roselle calyces contain brilliantly red, water-soluble, flavonoid pigments known as
anthocyanins (Du and Francis 1973; Mazza and Miniati 2000). Calyx anthocyanin content
ranges from 1.7% to 2.75% per dry weight according to Khafaga and Koch (1980). Roselle is
therefore an important source of pigments used as food colouring agents (Esselen and Sammy,
1973). Hot water extraction was found to be the most effective method of calyx anthocyanin
extraction (Wong et al., 2003).

18
Roselle anthocyanins may exert an effect on consumer perception due to its bright red colour.
This is because appearance of food, particularly colour, can have a halo effect which modifies
subsequent flavor perception and food acceptability (Nazlin, 1999). Colour is often taken as an
index of palatability and nutritional value (Haisman and Clarke, 1975).
Citric and malic acids have been reported as the major organic acids in aqueous extracts of the
calyces (Buogo and Picchinenna, 1937; Indovina and Capotummino, 1938; Reaubourg and
Monceaux, 1940). Trace amounts of tartaric acid has also been reported (Indovina and
Capotummino, 1938). Lin (1975) and Tseng et al. (1996) reported the presence of oxalic acids
and protocatechuic acids respectively. The calyces are also known to contain significant
amounts of ascorbic acid (vitamin C) (Buogo and Picchinenna 1937; Reaubourg and
Monceaux 1940). Research by Wong et al. (2002) showed that roselle calyx contained 1.4109
mg/g of ascorbic acid. Acids generally play a significant role in influencing the taste of both
natural and processed food products by imparting a sour or sharp taste to food. Citric acid, for
example, is responsible for the sour taste of lemons, limes, grapefruits, and oranges while
acetic acid is responsible for the sour taste of vinegar (Bender, 2003).
Ascorbic acid (Vitamin C) plays a key nutritional role in foods. It is an essential nutrient for
humans, a deficiency of which causes scurvy. It is also a potent antioxidant, protecting the
body from oxidative stress (Bender, 2003)
2.7.3 HEALTH BENEFITS OF CONSUMING ROSELLE CALYX
Wang et al. (2000) suggested that daily consumption of Hibiscus anthocyanins might be
effective in lowering oxidative damage in living systems. Mazza (2000) detailed the health

19
effects of anthocyanins as anti-inflammatory, antihepatoxic, antibacterial, antiviral,
antallergenic, antithrombic and antioxidant. The anthocyanins of roselle have been used
effectively in folk medicines against hypertension, pyrexia and liver disorders (Delgado-
Vargas and Paredes-López, 2003).
Aqueous extracts of roselle calyces have been demonstrated to have strong antioxidant effects
(Tsai et al., 2002; Hirunpanich et al., 2005). Anthocyanins have been correlated with their
antioxidant property in the role of reduction of coronary heart disease and cancer and to
enhance the body’s immune system (Bridle and Timberlake 1997; Delgado-Vargas et al.,
2000; SRC 2002; Tee et al., 2002).
2.8 LEMON GRASS (Cymbopogon citratus Stapf)
Lemon grass (Cymbopogon citratus Stapf) is a perennial tufted grass, about 60 – 90 cm tall
(Figure 2.3). It belongs to the family Graminae and is widely distributed in tropical and sub-
tropical regions of the world. It originates from India and is known by other names such as
Citronella Grass or Fever Grass (Chisowa et al., 1998).
Figure 2.3 Picture of Cymbopogon citrates

20
2.8.1 GENERAL USES OF LEMONGRASS
Lemon grass is used in the preparation of a wide variety of dishes. It is a common ingredient
in Asian cuisines, particularly teas, curries and soups. Infusion of the leaves gives an aromatic
drink used in traditional cuisine for its lemon flavour (Figueirinha et al., 2008).
In some cultures, the leaves are traditionally used as a chewing stick to provide a pleasant
fragrance in the mouth. Industrially, lemon grass is used in aromatherapy and manufacture of
mosquito repellents, soaps, cosmetics and perfumes. C. citratus leaf constitutes a source of
essential oil for the flavour and fragrance industries and most uses and phytochemical studies
are centred on its volatile compounds (Kasali et al., 2001).
2.8.2 CHEMICAL COMPOSITION OF LEMON GRASS LEAF
Lemon grass leaf is rich in aromatic essential oils. Because C. citratus leaves constitute a
source of essential oil for the flavour and fragrance industries, most uses and phytochemical
studies are centred on their volatile compounds (Baratta et al., 1998; Kasali et al., 2001).
Chisowa et al. (1998) isolated 16 compounds in a research to determine the volatile
constituents of the essential oils of Cymbopogon citratus. The major components were citral
(68.4%) and myrcene (18.0%). The citral is composed of two essential oils, geranial (39.0%)
and neral (29.4%). Other components of the oil identified in minute quantities were limonene,
1, 8-Cineole, (Z)-b-Ocimene, (E)-b-Ocimene, 6-Methyl-hept-5-en-2-one, verbanol, linalol and
citronellol. Lemon grass leaf also contains nerolic and geranic acids (Dudai, 2001).

21
Among the several isolated and identified substances from the leaves of lemon grass, there are
alkaloids, saponin, asistosterol, terpenes, alcohols, ketone, flavonoids, chlorogenic acids,
caffeic acid, p-coumaric acid and sugars (Olaniyi et al., 1975; Hanson, 1976; Gunasingh and
Nagarajan, 1981). Lemon grass leaf is also known to be rich in the flavonoid luteolin (Bricout
and Koziet, 1978). Mien and Mohamed (2001) described the isolation of the flavonoids
myrcene, quercetin, kaempferol and apigenine while Faruq (1994) obtained the phenolic
compounds elemicin, catechol and hydroquinone.
Lemon grass leaf is also known to contain rich amounts of alcohols and esters. The geraniol is
the most frequently isolated compound and is thought to be the main compound of plants of
African origin corresponding to 40% of the essential oil composition (Faruq, 1994). An
analytical study of the plant further revealed the presence of tannins, phosphates, nitrates and
chlorets (Chisowa et al., 1998). The major component of the non-saponifiable fraction of the
light petroleum extract was found to be â-sistosterol, according to Olaniyi et al. (1975). Both
authors also isolated a steroidal saponin, closely related to fucosterol, from the defatted plant
material.
2.8.3 HEALTH BENEFITS OF CONSUMING LEMON GRASS LEAF
Infusion prepared from fresh or dry leaves of lemon grass is used in popular medicines across
almost all continents and it comprises a wide range of indications. Equally wide is the
spectrum use of substances extracted from lemon grass, especially of the essential oil. In
India, it is used for gastrointestinal problems and, in China, as ansiolitic (Peigen, 1983). In
the Mauricio islands and the Malay Peninsula, Lemon grass tea is commonly used against flu,
fever, pneumonia, and to solve gastric and sudorific problems (Negrelle and Gomes, 2007).

22
In Nigeria, it is used as antipyretic, and for its stimulating and antispasmodic effects (Olaniyi
et al., 1975). In Indonesia, the plant is indicated to help digestion, to promote diuresis,
sweating and as emmenagogue (Hirschorn, 1983).
Lemon grass is also widely used in traditional medicine in Cuba and in many other countries
of the Caribbean region. In Trinidad and Tobago it is used to combat diabetes (Mahabir and
Gulliford, 1997). In Surinamese traditional medicine, lemon grass is used against coughing,
cuts, asthma, bladder disorders and as a diaphoretic and to relieve headaches. Its popular use
range is considerably wide, such as: restorative, digestive, anti-tussis, effective against colds,
analgesic, antihermetic, anti-cardiopatic, antithermic, anti-inflammatory of urinary ducts,
diuretic, antispasmodic, diaphoretic and antiallergic (Negrelle and Gomes, 2007). In the State
of Parana, Lemon grass stands out in several ethnobotanical studies, being preferentially used
as sedative (Jacomassi and Piedade, 1994). In Ghana, people drink Lemon grass infusions to
cure ailments like fever and malaria. The plant also grows freely in backyards and gardens
(Source: personal communication and observation).
2.8.4 RATIONALE FOR USING MORINGA, ROSELLE AND LEMON GRASS IN HERB TEA FORMULATIONS
Local consumption of ‘Moringa tea’ is increasing as a consequence of rising publicity about
its health benefits (Newton, 2007). Roselle has been a desirable component of herb tea
preparations because of its characteristic brightly coloured red infusions which consumers
find attractive (Blench, 1997) as well as its unique flavour. Lemon grass leaves are used in
food products to enhance their aromatic and flavor qualities (Figueirinha et al., 2008). It is
expected that blending the three herbs in the right proportions will produce a herb tea product
with acceptable sensory properties.

23
2.9 SENSORY EVALUATION
Sensory evaluation is a scientific discipline used to evoke, measure, analyze and interpret
reactions to those characteristics of food and materials as they are perceived by the senses of
sight, smell, taste, touch and hearing. Sensory analysis, therefore, is indispensable and many
food industries integrate this program in their research and development plan. In the
measurement of sensory properties, two main types of sensory tests have been identified –
analytical and consumer sensory tests (Stone et al., 1974).
2.9.1 Descriptive Sensory Analysis
Sensory profiling is a descriptive method that qualifies and quantifies organoleptic properties
of products. In other words, sensory characterization of a food product begins with
descriptive sensory evaluation that provides a pre-defining terminology for describing
sensory perceptions as objectively as possible (Moskowitz, 1983). The terminology is,
simply, a set of labels (descriptors) that a panel has agreed upon that enables them to fully
describe the sensory properties of the products being evaluated.
Descriptive sensory analysis addresses some of the problems of language use, interpretation
and scaling difficulties. To achieve this, a sensory quality program is organized where time
and effort is taken to recruit and train panelists. This procedure also helps to obtain reliable
data on the product being evaluated. Sometimes reference samples, if available, are used to
calibrate the panel. In some cases, the terms may be selected from previously existing lists, in
other cases they may be specifically generated by a panel of assessors (Stone et al., 1974).
Methods for generating descriptors are classified according to whether the results are
qualitative or quantitative even though one could be transformed to another.

24
After the generation of descriptors, it is necessary to determine which of the descriptors
sufficiently describe the product. Generally, methods employed for descriptor generation tend
to yield many attribute sets many of which are unnecessary and therefore must be reduced to
feasible size. This reduction should aim to identify those descriptors that are sufficient to
describe the product fully, at the same time avoiding synonymous descriptors or
characteristics that are difficult to quantify (Dura´ n et al., 1989; Johnsen and Kelly, 1990).
2.9.2 Training
Trained panelists have been used to carry out most of the methods put forward for vocabulary
generation and assessment of products through sensory evaluation. Several standardization
institutions recommend performing sensory profiling with a trained or an expert panel. This is
necessary because training positions the panelists to adopt an analytical frame of mind.
Conversely, untrained consumers tend to act non-analytically when scoring attributes
(Lawless and Heymann, 1998). However, free choice profiling which does not require
training of panelists has also been used successfully (Gains and Thomson 1990; Guy et al.,
1989).
Recently, many authors have compared the performance of trained and untrained panels,
presenting different conclusions. This is so because the studies in both situations varied
significantly in terms of the nature and size of the covered product range, the methodology
and the data analysis (Labbe et al., 2003). Many published studies have demonstrated lack of
consensus on the impact of training on sensory descriptive analysis.
In the following publications authors showed that training really impacted on panel
performance:

25
In a research conducted by Wolters and Allchurch (1994) where four different panels each
made up of six to eight subjects assessed 16 oranges. It was found that training increased the
number of discriminating and consensual attributes of the orange juices. The panels varied in
duration of training and in the number of scored attributes (60 h/97 generated attributes, 30
h/70 generated attributes, 15 h/36 pre-defined attributes, 0 h/free choice profiling).
In a study conducted by Chollet and Valentin (2001), it was concluded that training increased
the specificity and precision of the vocabulary of 12 beers. Samples were assessed by two
different panels varying in size, duration of training and number of scored attributes (22
assessors/11 h/24 generated attributes, 18 assessors/0 h/22 generated attributes).
In a study conducted by Moskowitz (1996), the author found expertise to have no significant
impact on product rating in a study of 37 sauces/ gravies for meat or pasta. Samples were
assessed using the same predefined glossary (24 attributes) by two different panels varying in
size and expertise (12 experts, 225 consumers).
Labbe et al., 2003, concluded that the lack of consensus may be due to the different
methodologies which were adopted and the context (academic research, industry) within
which the study was conducted. In a typical industry setting, Labbe et al., 2003, supported the
fact that training indeed had an influence on the reliability of sensory profiling. In their study,
untrained panel was made to assess eight soluble coffees, representative of a benchmarking
study. Training sessions were organized for the subjects, after which they were asked to
assess these products again. The results showed that training was indeed necessary.
Interestingly, their findings agreed with those of Wolters and Allchurch (1994), Roberts and
Vickers (1994), and Chollet and Valentin (2001).
Even though some authors have seen no impact on training, many agree that training is
necessary in carrying out a descriptive sensory evaluation. Training, in fact, orients the minds

26
of the panel to have a common understanding of the meanings of the attributes selected and
score products in a similar and objective way. For consumer acceptance untrained panel
always provides reliable information since scoring is based on preference rather than
description.

27
CHAPTER THREE
3.0 MATERIALS AND METHODS
3.1 SAMPLE COLLECTION
Fresh Moringa was harvested from Newman Farms in Kumasi, Ghana. Fresh lemon grass
was harvested from Kwame Nkrumah University of Science and Technology (KNUST)
Botanic Gardens in Kumasi. Both samples were harvested at about ten (10) cm from the tip
of the leaves and in the case of Moringa this included leaves and petioles of the plant. All
wilting and visibly diseased plant materials were removed. Dried Roselle samples were
purchased from the open market in Kejetia, Kumasi, Ghana. The samples were identified at
the Department of Horticulture, Faculty of Agriculture in the Kwame Nkrumah University of
Science and Technology, Kumasi, Ghana.
3.2 SAMPLE PREPARATION AND STORAGE
All plant materials were carefully inspected and all foreign materials removed. The samples
were then gently rinsed in tap water. Lemon grass leaves were cut into about three cm pieces
using a stainless steel kitchen knife. Moringa and Roselle were not cut into pieces, and the
leaf stalks of Moringa were not removed. The samples were spread thinly on paper and dried
in a solar drier for five days at a peak temperature of 62 °C. After drying the samples were
milled using an electric Binatone Blender (China, Model BLG401). Milling was performed
for about 15 min. The blender was washed before and after milling of each sample. The
milled material was sieved through an Aluminum sieve (2mm). Part of the sieved samples
were stored in glass bottles with tight lids and labeled. Formulations were prepared from the
rest and bagged in non-drip tea bags using an automatic tea bagging machine (Telesonic ST-
101). Each tea bag contained approximately 2g of product. The tea bags were stored in glass

28
bottles with tight lids and labeled for sensory analysis. A summary of the sample preparation
procedure is shown in Figure 3.1.
Sorting and rinsing of samples
Drying in solar drier (Peak temperature of 62 for 5days)
Milling (Electric blender)
Sieveing (2mm) Chemical Analyses
Preparing formulations
Bagging into tea bags
Preparing infusions
Sensory Analyses Polyphenol Analyses
Figure 3.1 Flow diagram of sample preparation and process

29
3.3 CHEMICAL ANALYSES
Chemical analyses were performed on dried samples of Moringa, Roselle and Lemon grass
using the Official Methods of Analyses (AOAC, 1990) and Pearson’s Composition and
Analysis of Foods (Kirk and Sawyer, 1997). The tests were moisture, total ash, minerals (Fe,
Cu, Zn and Ca), crude protein, water insoluble ash and crude fibre. Other physicochemical
tests were total polyphenolics, stalks, water soluble extractives, pH and light petroleum
extracts. Three of the formulated products were further subjected to total polyphenolics tests.
All analyses were carried out in triplicates.
3.3.1 DETERMINATION OF STALKS
This test was conducted solely on the Moringa leaf samples because Roselle calyces and
lemon grass leaves did not contain any stalks. About 5 g of the sample was weighed and
boiled for 15 min in a 1000 ml flat bottomed flask with 500 ml distilled water. The contents
of the flask were transferred into a large plastic basin and the stalks were handpicked out of
the basin with forceps. The leaves were dried in the drying oven at 100 °C for 5 h and left
overnight till a constant weight was obtained and weighed. The stalks content was then
determined by difference and expressed as a percentage of the initial sample weight (Kirk and
Sawyer, 1997) using the formula as follows:
% Stalks = Initial weight of leaves – final weight of leaves × 100 Initial weight of leaves

30
3.3.2 DETERMINATION OF TOTAL POLYPHENOLICS
The extraction and determination of total polyphenolics followed the method of Makkar et
al. (1993). This was performed in two stages: preparation of standard solution (using tannic
acid) to produce a calibration curve; and preparation of polyphenol-containing water extract
from the samples. The amounts of polyphenols in the samples were subsequently calculated
as tannic acid equivalent from the tannic acid curve.
Preparation of standard solution
Fifty milliliters of 2 N Folin Ciocalteu reagent was diluted with an equal volume of distilled
water in a 200 ml conical flask and stored in a brown bottle under refrigeration. About 40 g
sodium carbonate was weighed and placed in a 200 ml conical flask. About 150 ml distilled
water was added to the flask and swirled. The solution was topped up to the 200 ml mark
with distilled water to obtain a 20% Sodium Carbonate Solution. About 0.1 g of pure tannic
acid was weighed into a 100 ml volumetric flask and made to the mark with distilled water.
The solution was gently swirled for 5 min. About 10 ml of the resulting solution was pipetted
into another 100 ml volumetric flask and again made to the mark with distilled water.
Successive quantities of the tannic acid solution were pipetted into test tubes. Distilled water,
Folin reagent and sodium carbonate solution were measured and added to the tannic acid
solutions in the test tubes. The resulting solutions were swirled gently for 5 min. Absorbance
of the solutions were measured at 725 nm using the Spectrophotometer 259 (Sherwood). The
values obtained were used to ̀ plot a standard tannic acid curve.
Preparation of polyphenol-containing water extract
About 2 g of the herb samples was weighed and placed in a 250 ml conical flask. About 150
ml of boiling water was transferred into the conical flask. The liquid was then filtered after 5

31
min and allowed to cool. About 1 ml of the filtrate was transferred into a test tube and the
volume was made up to the 5 ml mark with distilled water. About 2.5 ml of the Folin reagent
(1N) and 12.5 ml of the sodium carbonate solution (20%) were added (to establish an alkaline
medium for the reaction) in the test tube. The solution was mixed by gently swirling the test
tube for 5 min and allowed to stand for 40 min. The absorbance was read at 725 nm using the
Spectrophotometer 259 (Sherwood).
This assay is based on the principle that phenols or phenolic compounds react with
phosphomolybdic acid in Folin-Ciolcalteau reagent in alkaline medium, to produce a blue
coloured complex (molybdenum blue), which absorbs in the UV-Visible region. The
polyphenol content of each sample is calculated as tannic acid equivalent of the sample on a
moisture-free basis:
Conc (mg/g) = Conc (mg/ml) ×FV × DF Sample weight
Where;
FV = final volume DF = dilution factor
3.3.3 DETERMINATION OF WATER-SOLUBLE EXTRACTIVES (WSE)
Two grams (2 g) of the sample was refluxed with 100 ml distilled water for 1 hr. The sample
was then filtered into a 250 ml volumetric flask using filter paper in a funnel. The residue
inside the filter paper was returned to the boiling flask, and boiled with further 100 ml water
for 30 min. The contents of the boiling flask were again filtered into the volumetric flask, and
the residue washed thoroughly with hot water. The filtrate was made to the 250 ml, swirled
gently, and 50 ml of it was pipetted into a clean and weighed moisture crucible, and dried in
an oven at 100 °C for 12 h. The crucible and its contents were then cooled in a desiccator and

32
reweighed. The results were calculated as a percentage of the sample on a moisture free basis
(Kirk and Sawyer, 1997):
% WSE = Weight of crucible contents × 100 Weight of the sample 3.3.4 DETERMINATION OF LIGHT PETROLEUM EXTRACT (LPE)
Two grams (2 g) of each sample was put in a paper thimble and plugged with cotton wool.
The thimble was placed in a soxhlet extraction apparatus and extracted with light petroleum
ether (boiling point 40 – 60 °C) at low heat for 5 hrs in a continuous extraction manner. The
extract was collected in a flask and dried at 100 °C for 30 min, cooled in a dessicator and
weighed (Kirk and Sawyer, 1997). The percent light petroleum extract (LPE) was calculated
as follows:
% LPE = Weight of extract × 100 Weight of sample
3.4 PREPARATION OF FORMULATIONS
The three dried and milled herbs were mixed in varying proportions to obtain nine different
formulations (Table 2.3). The proportions were obtained using Design Expert (2007). Two
gram samples of each formulation were bagged in rectangular infusion tea bags (5cm × 4cm).
Commercial Moringa herb tea (Newman Farms Ltd) was used as control. All bagged samples
were stored in glass jars at between 28 °C and 34 °C away from sunlight. They were labeled
accordingly for sensory analyses.

33
Table 2.3 Proportion of herbs in blended products
Product code Moringa leaves (%) Roselle calyces
(%)
Lemon grass
leaves (%)
721 70 20 10
712 70 10 20
755 70 15 15
631 60 30 10
622 60 20 20
613 60 10 30
532 50 30 20
523 50 20 30
553 55 15 30
591 (control) 100 0 0
3.5 SENSORY EVALUATION
Sensory evaluation was carried out in two phases – acceptance tests and descriptive tests. In
the first phase, acceptance tests were conducted on ten (10) sample infusions using fifty (50)
untrained panelists. The second phase consisted of descriptive tests on three (3) selected
samples using nine (9) trained panelists. Randomized complete block design was used for the
descriptive tests with the order of serving of the samples randomized to prevent any biasing
effect.
3.5.1 PREPARATION OF INFUSIONS
Infusions were prepared from all bagged samples including the control. Ten (10) bags of each
sample formulation were placed in a glass jar and boiling water (1.5l) was poured into the jar.
Mineral water (Voltic) was used. The formulations were allowed to infuse for 5 min. The
bags were then removed from the infusions. The infusions were unsweetened.

34
3.5.2 ACCEPTANCE TEST
3.5.2.1 Selection of panelists
Fifty (50) panelists (32 female; 18 male) were recruited from KNUST campus for the
acceptance tests. Panelists were mostly students aged between 18 and 24 years with few
university staff. The number of panelists was decided based on sensory evaluation guidelines
(IFT 1981), which indicates that for a sensory evaluation method of preference and/or
acceptance and/or opinions of a product, there is no recommended ‘magic number’ – the
minimum is generally 24 panelists, which is sometimes considered rough product screening;
50 – 100 panelists are usually considered adequate. Panelists were chosen on the basis of
their willingness and commitment to partake in the sensory evaluation, availability and
familiarity with tea in general or herb tea in particular. They were neither trained nor given
prior information about the constituent ingredients from which the infusions were prepared.
3.5.2.2 Procedure for serving tea to panelists
Sample infusions were three-digit coded and served randomly to panelists. About 30 ml of
each infusion was served in a 50 ml transparent cup. One sample was served at a time.
Panelists were free to analyze the samples in any order of their choice. Panelists were
discouraged from conferring among one another during the analyses.
The sample infusions were approximately 60 °C to 70 °C at the time of tasting. Panelists
were required to rinse their mouths with warm water (about 60° C) before the commencement
of tasting. To minimize possible carry-over effects, panelists were required to rinse their
mouths thoroughly with warm water (about 60°C) after each tasting and wait 90 s before
tasting the next sample. Panelists were not required to swallow all 30 ml of each sample;

35
however they were asked to hold about 10 ml sample in the mouth for 5 s and swallow small
quantities in order to appreciate the full sensory character of the beverage. Panelists were
allowed to repeat tasting where necessary.
The tests were carried out in two sessions, separated by a 24-hour period. This was to prevent
likely panelist fatigue due to the large number of samples. Each session started at 10.00am
and lasted for approximately 1.5 h. In both sessions, all ten tea samples were presented to all
panelists. Each panelist was free to select any five samples of their choice for evaluation.
During the second session, each panelist was asked to continue with analyses of the
remaining five samples. Sessions took place in the College of Science Chemistry Laboratory,
KNUST, Ghana.
3.5.2.3 Scoring of samples
The panelists were instructed to score their acceptance for 6 attributes of the infusions:
colour, aroma, flavor, aftertaste, astringency and overall acceptability. Where a panelist did
not clearly understand the meaning of a particular attribute, explanation was provided. The
panelists scored their acceptance of the attributes using a 5-point hedonic scale with 1
meaning ‘dislike very much’ and ‘5’ meaning ‘like very much’. From the results of the
acceptance tests, two formulations were selected in addition to the control for further
descriptive tests.
3.5.3 DESCRIPTIVE TEST
3.5.3.1 Selection of panelists
Eleven (11) people were initially recruited as panelists for descriptive tests. However, only
nine (9) panelists underwent the full training and took part in the main sensory evaluation.

36
Out of the nine, seven (7) were undergraduate students while the remaining were
postgraduate students from Department of Biochemistry or Food Science and Technology.
They included six (6) females and three (3) males with an age range of 21 to 34 years. All
panelists for descriptive tests had participated in at least two descriptive analyses of a
beverage and were regular consumers of tea.
3.5.3.2 Training of panelists
Panelist training consisted of research orientation, familiarization of panelists with test
procedures, calibration of panel using reference samples for green tea, development,
definition and grouping of descriptors. Training duration was approximately 9 h over a 3-day
period.
Research orientation
Panelists were given an introduction to the research and purpose of the study. They were
further informed that a descriptive vocabulary needed to be developed for herb tea. Panelists
were taken through the basic principles of sensory evaluation. This session lasted for
approximately 1 h.
Calibration of Panel and familiarization with test procedures
Panelists were calibrated using reference samples for green tea (Chambers and Lee 2007)
(Table 3.1). The panel was introduced to the 15-point numerical scale where ‘0’ represents
‘weak’ and ‘15’ represents ‘strong’ (Munoz and Civille, 1998). Most of the panel members
were familiar with this test procedure. This lasted for approximately 4 h.

37
Table 3.1 Reference samples for green tea
Sensory attribute Reference
Sweet taste 0.1% sucrose
Sour taste 0.035% citric acid
Bitter taste 0.05% caffeine
Astringency 0.1% tannic acid
Source: Chambers and Lee (2007)
Development, definition and grouping of descriptors, and generation of references
General procedures for developing definitions and references were adapted from the flavor
profile method (Caul, 1957; Keane, 1992).The panel leader instructed the panelists to make
individual notes on descriptors for the sensory attributes of the herb teas. After all the
panelists were done, the panel leader then led a discussion to reach agreement on the
descriptors present in the herb tea samples. Once the panel came to an agreement on the
descriptors, a concise definition was provided for each descriptor. Synonymous descriptors
were identified and eliminated. The panelists also provided references for each descriptor. As
much as possible, panelists attempted to use reference products that were representative and
exhibiting a specific attribute as suggested by Piggott (1991). Specific attention was given to
references because they can be used to overcome communication difficulties (Barcenas et al.,
1999), are helpful in lowering judge variability, allow calibration of the panel in the use of
intensity scale (Stampanoni, 1994) and help reduce the time needed to train a panel (Rainey,
1986). This session lasted for approximately 4 h.

38
3.5.3.3 Main Sensory Evaluation
In the main experiment, the panelists evaluated the sensory characteristics of the herb tea
based on the descriptors generated during training. The appearance attributes were evaluated
first followed by the aroma, flavour and mouthfeel attributes. The three products were
presented to each subject in the order based on a randomized complete block design to
prevent any biasing effect. Sessions took place in the College of Science Chemistry
Laboratory, KNUST. All samples were three-digit coded and served in 50 ml transparent
glass cups. Panelists were instructed to measure each of the defined descriptors in the herb
teas using a 15-point numerical scale where ‘0’ represents ‘weak’ and ‘15’ represents ‘strong’
(Munoz and Civille, 1998). The products were scored in triplicates.
3.6 STATISTICAL ANALYSIS
GraphPad Prism 5 and Excel (2007) were used to carry out Analysis of Variance (ANOVA)
on the data and graphical representation of the results. Where variations were observed
among the samples at 5% statistical significance, Post-hoc tests (Turkey) were carried out to
determine the sources of variation.

39
CHAPTER FOUR
4.0 RESULTS AND DISCUSSION
4.1 CHEMICAL ANALYSIS OF HERB SAMPLES
4.1.1 MOISTURE CONTENT
The initial moisture contents of the freshly harvested Moringa and Lemon grass samples were
74.38% and 65.27% respectively. The Roselle, which was obtained partially dried, had an
initial moisture content of 17.93%. After drying in the solar drier, Roselle retained the
highest average moisture content of 8.57% followed by Moringa with 6.86% and Lemon
grass having the least moisture content of 6.17% (Figure 4.1). All the values were
significantly different (P < 0.05). The differences in moisture content of the dried samples
may be attributable to differences in structure of the samples. Roselle calyx is fleshy and cup-
shaped in nature (Blench 1997; Ali et al. 2005) implying reduced surface area. It may
therefore have allowed the least penetration of heat during drying hence the relatively high
moisture content after drying. It is therefore necessary to process Roselle into a form that
allows for better drying. Moreover, alternative methods need to be explored for drying
Roselle. Lemon grass leaf is comparatively longer and has a wider surface area than Moringa
leaf. This may have accounted for its relatively low moisture content than Moringa.
According to Fennema (1996), moisture content bears a relation with the shelf stability of a
food product in that the higher the moisture content, the lower the shelf stability and vice
versa. Tea in excess of 11% moisture is liable to mould infestation and musty infusion (Kirk
and Sawyer, 1997). The samples were however within the recommended moisture range of
6.1% to 9.2% (Kirk and Sawyer, 1997).

40
Moringa
Roselle
Lemon gras
s0
2
4
6
8
10
% MOISTURE
Figure 4.1 Moisture content of herb samples (Error bars indicate SEM at 5% probability; n=3)
4.1.2 CRUDE ASH CONTENT
Crude ash content refers to the total mineral composition of a sample. Moringa had the
highest ash content of 8.57% followed by Roselle with 6.79%, while lemon grass had the
least ash value of 6.09% (Figure 4.2). All the values were significantly different (P < 0.05).
The ash value of Moringa leaf was lower than ash values reported by Fuglie (2001) of three
dried Moringa leaf samples obtained from plants cultivated in three separate regions –
Nicaragua, Niger and India. The samples showed respective ash values of 8.9%, 9.4% and
11.8%. These differences in ash value may be attributable to differences in the mineral
composition of the soils within which they were cultivated. The ash value of Roselle was
approximately the same as reported value of 6.8% by Babalola (2000). The dry weight
moisture content values of the lemon grass and Roselle samples were within the
recommended range of 5.2% to 7.2% for teas (Kirk and Sawyer, 1997).
Moringa Roselle Lemon grass
% M
OIS
TUR
E

41
Figure 4.2 Crude ash content of herb samples (Error bars indicate SEM at 5% probability; n=3)
4.1.3 MINERAL CONTENT
Calcium Content
The Calcium (Ca) content of the dried samples was relatively high compared to the other
minerals analyzed. Moringa leaf contained the highest Ca content of 412.5 mg/100g which
was more than twice that of Lemon grass leaf (149.1 mg/100g). The Ca content of Roselle
(294.6 mg/100g) was the equivalent of about one third the recommended daily intake of 1000
mg (Jensen, 2000). The results showed that the herb samples were generally good sources of
Ca. All the values were however statistically different (P < 0.05) (Figure 4.3). Besides their
nutritional significance, minerals may also influence the sensory character of beverages.
According to Fennema (1996), Calcium in foods is mostly present as Ca(OH)2, forming Ca2+
and OH- ions in aqueous solution. Because these ions are alkaline, they increase the pH of the
solution, making the solution less acidic and therefore less sour.
Mor
inga
Roselle
Lemon
grass
0
2
4
6
8
10
SAMPLE
% CRUDE ASH%
CR
UD
E A
SH

42
Moringa
Roselle
Lemon gras
s0
100
200
300
400
500
SAMPLE
Ca (mg/100g)
Figure 4.3 Calcium content of herb samples (Error bars indicate SEM at 5% probability; n=3).
Iron Content
Iron (Fe) is an essential macronutrient required for human growth. The concentration of Fe in
Roselle calyx (24.26 mg/100g) was about twice that in Moringa leaf (12.93 mg/100g) and
Lemon grass leaf (11.58 mg/100g) (Figure 4.4). All the values were significantly different (P
< 0.05). The value of Roselle was lower than the reported value of 34.6mg/100g by Babalola
(2000) and 83.3 mg/100g by Nnam and Onyeke (2003). Further, the Fe content of Moringa
leaf was higher than reported value of 9.82 mg/100g by Tetteh (2008). Generally, differences
in plant mineral composition may be attributed to differences in mineral composition of the
soils within which the plants were cultivated, which may be affected in turn by cultural
practices such as fertilizer application. The results show that the three samples are good
sources of Fe. This is because the values are comparable to Recommended Daily Allowance
Ca
(mg/
100g
)

43
of Fe – 10 mg/100g to 13 mg/100g for children; 7 mg/100g for men; and 12 mg/100g to 16
mg/100g for women and breast feeding mothers (Fuglie, 2001).
Mor
inga
Roselle
Lemon
grass
0
10
20
30
SAMPLE
Fe (mg/100g)
Figure 4.4 Iron content of herb samples (Error bars indicate significant differences at 5% probability; n=3)
Copper Content
Copper is an essential micronutrient needed for normal human metabolism. Recommended
dietary allowances range from 1.5 to 2.0 mg per day for adults (Sandstead, 1982). The herb
samples were however low in copper content. The Lemon grass sample recorded the least
value of 0.58 mg/100g as compared to the Roselle sample which had 0.69 mg/100g and
Moringa with 0.94 mg/100g (Figure 4.5). Since the copper content of the samples was below
the recommended daily requirement, it is important to supplement copper needs from other
dietary sources.
Fe (m
g/10
0g)

44
Mor
inga
Roselle
Lemon
grass
0.0
0.2
0.4
0.6
0.8
1.0
SAMPLE
Cu (mg/100g)
Figure 4.5 Copper content of herb samples (Error bars indicate SEM at 5% probability; n=3)
Zinc Content
Zinc is an essential micronutrient for human growth, development and maintenance of
immune function, which enhances prevention and recovery from infectious diseases (Black,
2003; Walker et al., 2005). The average recommended dietary allowance of zinc is 6 mg per
adult per day (Smith et al., 1983). Meat products are the best sources of Zn (Walker et al.,
2005), and consequently, Zn deficiencies are usually found in populations which consume
diets with insufficient amounts of animal-source foods. Moringa had the highest composition
of Zn (2.06 mg/100g) while Lemon grass had the least composition (1.82 mg/100g) (Figure
4.6). The results imply that the three herbs, particularly Moringa, could be used as a cheap
source of zinc in diet formulation.
Cu
(mg/
100g
)

45
Mor
inga
Roselle
Lemon
grass
0.0
0.5
1.0
1.5
2.0
2.5
SAMPLE
Zn (mg/100g)
Figure 4.6 Zinc content of herb samples (Error bars indicate SEM at 5% probability; n=3)
4.1.4 CRUDE PROTEIN CONTENT
The Moringa sample had the highest crude protein content of 26.59% while Roselle and
Lemon grass samples had values of 8.59% and 7.23% respectively (Figure 4.7). All the
values were significantly different (P < 0.05). These values are comparable to reported values
of 27.1% for Moringa (Booth and Wickens, 1988) and 8.6% for Roselle (Babalola, 2000).
The high crude protein value of Moringa is corroborated by Fuglie (2001) who reported
further that the protein digestibility of Moringa is high (85% to 90%). Crude protein bears an
indirect relationship to the sensory character of tea. This is because amino acids, which are
the building blocks of proteins, have been shown to produce off-flavours in tea (Kinugasa et
al., 1997).
Zn
(mg/
100g
)

46
Mor
inga
Roselle
Lemon
grass
0
10
20
30
SAMPLE
% CRUDE PROTEIN
Figure 4.7 Crude protein content of herb samples (Error bars indicate SEM at 5% probability; n=3)
4.1.5 CRUDE FIBRE CONTENT
The Lemon grass sample had the highest crude fibre content of 21.38% followed by the
Moringa sample with 19.64%. Roselle had the least value of 10.02% (Figure 4.8). All the
values were significantly different (P < 0.05). Crude fibre in the diet generally serves to
enhance the efficiency of digestion by stimulating peristaltic action and thereby enhancing
the movement of food through the alimentary canal. It is also known to prevent colon cancer
(BeMiller and Whistler, 1999). In tea, however, crude fibre improves the sensory appeal of
the beverage by providing a filter system to prevent the leaching of plant material from the
tea bag into the infusion (Waldron et al., 2003).
% C
RU
DE
PR
OT
EIN

47
Mor
inga
Roselle
Lemon
grass
0
5
10
15
20
25
SAMPLE
% CRUDE FIBRE
Figure 4.8 Crude fibre content of herb samples (Error bars indicate SEM at 5% probability; n=3)
4.1.6 WATER SOLUBLE EXTRACTIVES (WSE)
The WSE indicates the percentage of extractives that can be dissolved in infusion during
brewing of tea (Kirk and Sawyer, 1997). For a herb tea containing more than one herb
ingredient, the ingredient with the highest WSE will exert the greatest influence on the
character of the infusion. From the results, the WSE value of Roselle calyx (12.38%) was
about three times that of Lemon grass leaf (4.07%) and almost twice that of Moringa leaf
(7.44%) (Figure 4.9). All the values were significantly different (P < 0.05). The high WSE of
Roselle calyx may be due to its rich water-soluble anthocyanin pigments (Du and Francis
1973; Mazza and Miniati 2000). The observation is further supported by Wong et al., 2002,
who reported that hot water extraction is an effective method of calyx anthocyanin extraction
in Roselle. By inference, Roselle will generally exert stronger influence on the properties of
herb tea.
% C
RU
DE
FIB
RE

48
Mor
inga
Roselle
Lemon
grass
0
5
10
15
% WSE
Figure 4.9 Water soluble extractive (WSE) of herb samples (Error bars indicate SEM at 5% probability; n=3)
4.1.7 LIGHT PETROLEUM EXTRACTIVES (LPE)
Lemon grass sample had the highest LPE value of 4.1% followed by Moringa with 3.48%.
Roselle sample had the least value of 2.71% (Figure 4.10). All the values were significantly
different (P < 0.05). The high LPE of Lemon grass leaf may be attributable to its rich
aromatic essential oils (Chisowa et al., 1998). By inference, Lemon grass will impart pleasant
aroma to herb tea.
%
WSE
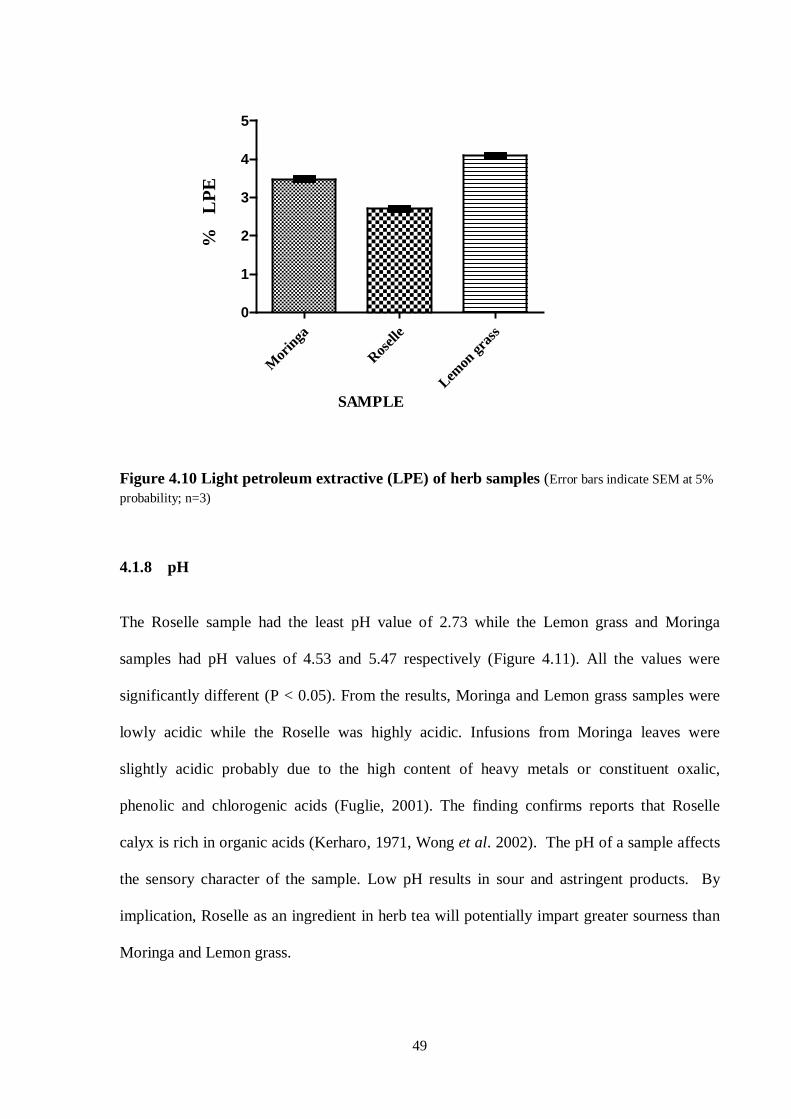
49
Mor
inga
Roselle
Lemon
grass
0
1
2
3
4
5
SAMPLE
% LPE
Figure 4.10 Light petroleum extractive (LPE) of herb samples (Error bars indicate SEM at 5% probability; n=3)
4.1.8 pH
The Roselle sample had the least pH value of 2.73 while the Lemon grass and Moringa
samples had pH values of 4.53 and 5.47 respectively (Figure 4.11). All the values were
significantly different (P < 0.05). From the results, Moringa and Lemon grass samples were
lowly acidic while the Roselle was highly acidic. Infusions from Moringa leaves were
slightly acidic probably due to the high content of heavy metals or constituent oxalic,
phenolic and chlorogenic acids (Fuglie, 2001). The finding confirms reports that Roselle
calyx is rich in organic acids (Kerharo, 1971, Wong et al. 2002). The pH of a sample affects
the sensory character of the sample. Low pH results in sour and astringent products. By
implication, Roselle as an ingredient in herb tea will potentially impart greater sourness than
Moringa and Lemon grass.
%
LPE

50
Mor
inga
Roselle
Lemon
grass
0
2
4
6
SAMPLE
pH
Figure 4.11 pH of herb samples (Error bars indicate SEM at 5% probability; n=3)
4.1.9 STALKS
The stalk content gives an indication of the proportion of leaf stalks that a tea ingredient
contains in relation to actual leaves. The stalk content for Moringa leaf was 7%. This falls
within the range recommended by Kirk and Sawyer (1997) who reported that the proportion
of stalks in tea should preferably be below 25%. Roselle calyx and Lemon grass leaf did not
contain any stalks.
4.1.10 TOTAL POLYPHENOL CONTENT (TPC)
The polyphenol content of ingredients in herb tea formulation is important because it gives a
direct indication of the health-enhancing property of the herb. Moringa leaf recorded the
highest total polyphenol content (TPC) of 35.70 mg/g followed by Roselle with 27.81 mg/g.

51
Lemon grass had the least TPC of 15.37 mg/g (Figure 4.12). All the values were significantly
different (P < 0.05). Bajpai et al. (2005) reported TPC values of 20.9 mg/g for Moringa leaves
using 50% methanol: water extract. This implies that hot water extraction (100 °C) proved to
be a more efficient means of total polyphenol extraction. The values compare well with the
TPC of other plants commonly used in herb teas such as leaves of Cinnamomum tamala (12.5
mg/g), Matricaria charantina (15.9 mg/g) and Piper longum leaves (18.1 mg/g) (Bajpai et al.,
2005).
Mor
inga
Roselle
Lemon
grass
0
10
20
30
40
SAMPLE
TPC (mg/g)
Figure 4.12 Total polyphenol content (TPC) of herb samples (Error bars indicate SEM at 5% probability; n=3
TPC
(mg/
g)

52
4.2 ACCEPTANCE TESTS
4.2.1 COLOUR
Consumer appetite for food is stimulated or dampened by its colour. This is because the
colour of food indicates the flavour of food (Downham and Collins, 2000). Product 532
brewed infusions with the most preferred colour (3.9), followed by products 631 (3.82), 523
(3.30), 622 (3.18) and 613 (3.12) in that order (Figure 4.15). From the trend the three most
preferred products (532, 631 and 523) contained high proportions of Roselle (30% and 20%).
Conversely, the three least preferred products (the control, 712 and 755) contained the least
proportion of Roselle (0%, 10% and 15%). This indicates that products with higher
proportions of Roselle brewed infusions with a more appealing colour. Roselle infusion has
been described as a red, transparent, liquid (Dominguez-Lopez et al., 2008) which many
people find attractive (Blench, 1997). Roselle is also known as Red Sorrel due to the unique
red colour of its calyx (Mounigan and Badrie, 2006). Researchers (Du and Francis 1973;
Mazza and Miniati 2000) have attributed the reddish colour of Roselle calyx to the presence
of anthocyanins – highly water-soluble, brilliantly red pigments. The mean score for colour
for product 532 was significantly different (P < 0.05) from that of all the other products
except 631. There were however no significant differences (P > 0.05) between colour scores
of products 721 (2.94), 712 (2.78), 755 (2.84), 622 (3.18), 613 (3.12), 553 (2.98) and 591
(control) (2.68).

53
COLOUR
721
712
755
631
622
613
532
523
553
591
0
1
2
3
4
5
PRODUCTS
MEAN SCORES
Figure 4.13 Panelist scores of acceptance test for colour (Hedonic scale of 1 to 5; where 5 represents ‘like very much’ and 1 represents ‘dislike very much’. 721 (70% Moringa + 20% Roselle + 10% Lemon grass); 712 (70% Moringa + 10% Roselle + 20% Lemon grass); 755 (70% Moringa + 15% Roselle + 15% Lemon grass); 631 (60% Moringa + 30% Roselle + 10% Lemon grass); 622 (60% Moringa + 20% Roselle + 20% Lemon grass); 613 (60% Moringa + 10% Roselle + 30% Lemon grass); 532 (50% Moringa + 30% Roselle + 20% Lemon grass); 523 (50% Moringa + 20% Roselle + 30% Lemon grass); 553 (55% Moringa + 15% Roselle + 30% Lemon grass); 591 (100% Moringa). Error bars indicate SEM at 5% probability; n=50) 4.2.2 AROMA
Panelists showed the highest preference for the aroma of product 523 (3.96), followed by 532
(3.94), 613 (3.76), 553 (3.54) and 622 (3.52) in that order (Figure 4.16). Four blends with the
least proportions of Roselle and Lemon grass (591, 755, 712 and 721) were also the least
preferred in aroma. Because of reports of high concentration of aromatic oils in Lemon grass
(Baratta et al., 1998; Kasali et al., 2001), it was expected that samples with higher
proportions of Lemon grass would record higher mean scores for aroma. Even though most
of the scores followed this trend, there were few exceptions. One exception was product 532
which contains only 20% Lemon grass, but was more preferable in aroma to 613 and 553
which both contain 30% Lemon grass. A possible explanation to this unexpected result is that
the high Roselle content (30%) in 532 may have produced a synergistic effect with the
Lemon grass component, thereby resulting in its unexpected high aroma preference. The
ME
AN
SC
OR
ES

54
mean score of product 523 was significantly different (P < 0.05) from those of all the other
products except products 613 and 532. The mean scores for aroma were not significantly
different (P > 0.05) for products 721 (2.70), 712 (2.72), 755 (2.68), 631 (2.88) and the 591
(control) (2.66).
AROMA
721
712
755
631
622
613
532
523
553
591
0
1
2
3
4
5
PRODUCTS
MEAN SCORES
Figure 4.14 Panelist scores of acceptance test for aroma (Hedonic scale of 1 to 5; where 5 represents ‘like very much’ and 1 represents ‘dislike very much’. 721 (70% Moringa + 20% Roselle + 10% Lemon grass); 712 (70% Moringa + 10% Roselle + 20% Lemon grass); 755 (70% Moringa + 15% Roselle + 15% Lemon grass); 631 (60% Moringa + 30% Roselle + 10% Lemon grass); 622 (60% Moringa + 20% Roselle + 20% Lemon grass); 613 (60% Moringa + 10% Roselle + 30% Lemon grass); 532 (50% Moringa + 30% Roselle + 20% Lemon grass); 523 (50% Moringa + 20% Roselle + 30% Lemon grass); 553 (55% Moringa + 15% Roselle + 30% Lemon grass); 591 (100% Moringa). Error bars indicate SEM at 5% probability; n=50)
ME
AN
SC
OR
ES

55
4.2.3 FLAVOUR
The product which brewed infusions with the most preferred flavour was 532 (3.88) followed
by 523 (3.60), 553 (3.24), 631 (2.80) and 622 (2.72) in that order (Figure 4.17). Infusions
from 591 (control) recorded the lowest score in flavor (2.36). From the trend, products with
high proportions of Moringa and low proportions of Roselle and Lemon grass were less
preferable. Conversely products with low proportions of Moringa and high proportions of
Roselle and Lemon grass had a more appealing flavour. This observation is consistent with
the trend of scores for aroma. However, unlike aroma which was influenced mainly by the
proportion of Lemon grass, flavour was influenced more by Roselle. Thus product 532 (3.88)
was preferable to 523 (3.60) because the former contains higher Roselle (30%) than the latter
(20% Roselle). Similarly, product 523 (3.60) was preferable to 553 (3.24), and product 553
(3.24) was preferable to 631 (2.80). The mean score of product 532 was however
significantly different (P < 0.05) from those of all the other products except that of 523. There
were no significant differences (P > 0.05) in the mean scores of products 721 (2.38), 712
(2.38), 755 (2.42), 613 (2.68) and 591 (control) (2.36).

56
FLAVOUR
721
712
755
631
622
613
532
523
553
591
0
1
2
3
4
5
PRODUCTS
MEAN SCORES
Figure 4.15 Panelist scores of acceptance test for flavour (Hedonic scale of 1 to 5; where 5 represents ‘like very much’ and 1 represents ‘dislike very much’. 721 (70% Moringa + 20% Roselle + 10% Lemon grass); 712 (70% Moringa + 10% Roselle + 20% Lemon grass); 755 (70% Moringa + 15% Roselle + 15% Lemon grass); 631 (60% Moringa + 30% Roselle + 10% Lemon grass); 622 (60% Moringa + 20% Roselle + 20% Lemon grass); 613 (60% Moringa + 10% Roselle + 30% Lemon grass); 532 (50% Moringa + 30% Roselle + 20% Lemon grass); 523 (50% Moringa + 20% Roselle + 30% Lemon grass); 553 (55% Moringa + 15% Roselle + 30% Lemon grass); 591 (100% Moringa). Error bars indicate significant difference at 5% probability; n=50)
4.2.4 AFTERTASTE
Differences in aftertaste scores among all the products were insignificant (P > 0.05). This
may be as a result of the absence of any significant differences in the aftertaste characteristics
of the products, or panelists’ inability to clearly distinguish between the aftertaste
characteristics of the products. Product 591 (control) was however the most preferred product
(2.98) followed by 712 (2.94), 755 (2.94) and 722 (2.90) (Figure 4.18).
ME
AN
SC
OR
ES

57
AFTERTASTE
721
712
755
631
622
613
532
523
553
591
0
1
2
3
4
PRODUCTS
MEAN SCORES
Figure 4.16 Panelist scores of acceptance test for aftertaste (Hedonic scale of 1 to 5; where 5 represents ‘like very much’ and 1 represents ‘dislike very much’. 721 (70% Moringa + 20% Roselle + 10% Lemon grass); 712 (70% Moringa + 10% Roselle + 20% Lemon grass); 755 (70% Moringa + 15% Roselle + 15% Lemon grass); 631 (60% Moringa + 30% Roselle + 10% Lemon grass); 622 (60% Moringa + 20% Roselle + 20% Lemon grass); 613 (60% Moringa + 10% Roselle + 30% Lemon grass); 532 (50% Moringa + 30% Roselle + 20% Lemon grass); 523 (50% Moringa + 20% Roselle + 30% Lemon grass); 553 (55% Moringa + 15% Roselle + 30% Lemon grass); 591 (100% Moringa). Error bars indicate SEM at 5% probability; n=50).
4.2.5 ASTRINGENCY
Astringency is generally recognized as a feeling of extreme dryness or puckeriness that is not
confined to a particular region of the mouth or tongue, but is experienced invariably as a
diffuse stimulus (Haslam and Lilley 1988). Product 631 (3.72) was the most preferred in
astringency followed by 532 (3.64), 553 (3.22), 523 (3.18) and 622 (3.22) in that order
(Figure 4.19). From the trend, products with low proportions of Roselle were least preferable
in astringency. For example, products containing 10% Roselle or below – 613 (2.94), 712
(2.96) and the 591 (control) (2.32) – had the lowest scores in astringency. On the other hand,
ME
AN
SC
OR
ES

58
products with high proportions of Roselle such as 631 (3.72), 532 (3.64) and 622 (3.22) had
corresponding high scores for astringency. This implies that the highly astringent quality of
Roselle (Dominguez-Lopez et al., 2008) was appealing to the panelists. This finding agrees
with that by Wismer et al. (2004) that astringency is an important and often appealing
characteristic of brewed tea. Product 591 (the control) had the lowest score for astringency
(2.32) which was significantly different (P < 0.05) from those of all the other products.
ASTRINGENCY
721
712
755
631
622
613
532
523
553
591
0
1
2
3
4
5
PRODUCTS
MEAN SCORES
Figure 4.17 Panelist scores of acceptance test for astringency (Hedonic scale of 1 to 5; where 5 represents ‘like very much’ and 1 represents ‘dislike very much’. 721 (70% Moringa + 20% Roselle + 10% Lemon grass); 712 (70% Moringa + 10% Roselle + 20% Lemon grass); 755 (70% Moringa + 15% Roselle + 15% Lemon grass); 631 (60% Moringa + 30% Roselle + 10% Lemon grass); 622 (60% Moringa + 20% Roselle + 20% Lemon grass); 613 (60% Moringa + 10% Roselle + 30% Lemon grass); 532 (50% Moringa + 30% Roselle + 20% Lemon grass); 523 (50% Moringa + 20% Roselle + 30% Lemon grass); 553 (55% Moringa + 15% Roselle + 30% Lemon grass); 591 (100% Moringa). Error bars indicate SEM at 5% probability; n=50)
ME
AN
SC
OR
ES

59
4.2.6 OVERALL ACCEPTABILITY
Product 532 had the highest mean score in overall acceptability (4.08) (Figure 4.20). This
was expected as it was the most preferred product in colour (3.90) and flavour (3.88), and the
second most preferred product in aroma (3.94) and astringency (3.64). Conversely, 591
(control) was the least preferred product in overall acceptability (2.56). It scored the lowest
preference for colour (2.68), aroma (2.66) and flavour (2.38). The mean score for overall
acceptability of product 532 was significantly different (P < 0.05) from all the other samples
with the exception of 613 (3.74). Likewise the mean score for overall acceptability of 591
(control) was significantly different (P < 0.05) from those of the other samples.
OVERALL ACCEPTABILITY
721
712
755
631
622
613
532
523
553
591
0
1
2
3
4
5
PRODUCTS
MEAN SCORES
Figure 4.18 Panelist scores of acceptance test for overall acceptability (Hedonic scale of 1 to 5; where 5 represents ‘like very much’ and 1 represents ‘dislike very much’. 721 (70% Moringa + 20% Roselle + 10% Lemon grass); 712 (70% Moringa + 10% Roselle + 20% Lemon grass); 755 (70% Moringa + 15% Roselle + 15% Lemon grass); 631 (60% Moringa + 30% Roselle + 10% Lemon grass); 622 (60% Moringa + 20% Roselle + 20% Lemon grass); 613 (60% Moringa + 10% Roselle + 30% Lemon grass); 532 (50% Moringa + 30% Roselle + 20% Lemon grass); 523 (50% Moringa + 20% Roselle + 30% Lemon grass); 553 (55% Moringa + 15% Roselle + 30% Lemon grass); 591 (100% Moringa). Error bars indicate SEM at 5% probability; n=50)
ME
AN
SC
OR
ES

60
4.3 DESCRIPTIVE TESTS
During the training of the panelists, a total of 17 descriptors were generated, defined,
referenced and scored by the panelists. These were grouped into 6 appearance, 3 aroma, 1
flavor, 5 taste and 2 mouthfeel descriptors.
4.3.1 APPEARANCE DESCRIPTORS
The appearance descriptors generated by the trained panel included four colours – Greenness,
Yellowness, Redness and Brownness. Two additional attributes were Turbidity and
Sparkling. Definitions and references were provided for all the attributes (Table 4.1).
Infusions from 591 (control) were predominantly yellowish in colour (11.93) while those
from product 532 were predominantly reddish (12.56) (Figure 4.20). This finding agrees with
research findings by Tetteh (2008) which showed that Moringa tea is mainly a golden yellow
beverage, contrary to expectations of it being green. The reddish colour of infusions from 532
is most likely a consequence of the high Roselle content (30%) in the formulation. As
confirmed by Dominiguez-Lopez et al. (2008), the calyx of Roselle produces infusions which
are intensely reddish in colour. This characteristic of Roselle is due to its high water-soluble
anthocyanin pigment content (Du and Francis 1973; Mazza and Miniati 2000). It is therefore
likely that the anthocyanins in the calyces may have more readily dissolved in infusion
thereby overshadowing green pigments such as chlorophyll contained in Lemon grass and
Moringa. This explanation is supported by the relatively high water soluble extractive
(12.38%) of Roselle as recorded in the chemical analysis (section 4.16). The results of the
acceptance tests show that the reddish colour of infusions from 532 was more preferable to
the yellowish colour of infusions from 591 (control).

61
Infusions from product 532 scored highest in turbidity (12.67). This implies that the infusions
from 532 were less transparent than infusions from the 591 (control) and 613.
Since pure Roselle calyx infusions yield transparent infusions (Dominiguez-Lopez et al.,
2008), the high turbidity may be caused by Lemon grass and Moringa. The yellowish
infusions of the 591 (control) scored highest for Sparkling (9.93) (Figure 4.21).
Table 4.1 Definitions and references of appearance descriptors for herb tea
Descriptor Definition Reference Greenness Intensity of green colour of herb
tea Unripe tomato fruit
Yellowness Intensity of yellow colour of herb tea
Margarine
Redness Intensity of red colour of herb tea Ripe tomato fruit Brownness Intensity of brown colour of herb
tea Groundnut paste
Turbidity Cloudiness of herb tea Soymilk Sparkling Luminous character or bright
appearance of herb tea Oil

62
Figure 4.19 Quantitative scores for appearance descriptors of herb tea (Numerical scale (15-points) where ‘0’ represents ‘weak’ and ‘15’ represents ‘strong’. 591 (100% Moringa); 532 (50% Moringa + 30% Roselle + 20% Lemon grass); 613 (60% Moringa + 10% Roselle + 30% Lemon grass). n=3)
4.3.2 AROMA AND FLAVOUR DESCRIPTORS
The trained panel generated, defined and referenced three descriptors to describe the aroma
characteristics of the infusions: Citrus, Lemon grass and Herbal (Table 4.2).
Both 613 and 532 were rated high in Citrus aroma (11.74 and 11.30 respectively). The Citrus
aroma identified by the trained panel is likely to be resulting from the Lemon grass
constituent. As the name suggests, Lemon grass naturally possesses aroma characteristics
similar to lemon, a citrus fruit. Predictably, the Citrus aroma was stronger in 613, which
contained 30% Lemon grass, than in 532 which contained only 20% Lemon grass. Product
591 (control) did not contain Lemon grass, consequently its infusions did not elicit significant
Lemon grass aroma (0.59) or Citrus aroma (0.52).
0
2
4
6
8
10
12
14Greeness
Yellowness
Redness
Brownness
Turbidity
Sparkling
Control
532
613

63
Both 532 and 613 had high mean scores for Lemon grass aroma (11.07 and 10.07
respectively). This implies that the aroma of lemon grass was perceptible at 20% and 30%
inclusion rate in the herb tea formulations. It also implies that even though Moringa was the
dominant ingredient in both formulations (50% in 532 and 60% in 613) it was unable to elicit
strong aroma quality to overcome the Lemon grass aroma.
Product 532 scored high for Herbal aroma (11.41) compared to the score by 613 (6.81).
Infusions from 591 (control) scored low in all the aroma attributes (≤ 1.89). The weak aroma
quality of 591 (control) may have accounted for its low scores for aroma in the acceptance
tests (section 4.2.2).
Even though none of the formulations contained ginger, the trained panel identified Ginger
flavour. This may be explained on the basis of unpublished reports which describe Lemon
grass as having ‘a dominant lemon smell with a slight hint of ginger’. Alternatively, the
observation may be due to ginger-like flavour perceptions arising from the combination of
the three herbs. The Ginger flavour was however minimally perceived as shown by the low
scores for all three products (≤ 1.30) (Figure 4.22).
Table 4.2 Definitions and references of aroma and flavour descriptors for herb tea
Descriptor Definition Reference
Herbal aroma Aroma characteristics typical of
dried eaves
Dried leaves
Citrus aroma Aroma characteristics typical of
citrus fruits
Orange fruit
Lemon grass aroma Aroma characteristics typical of
lemon grass leaves
Lemon grass leaf
Ginger flavour Spicy flavour sensation typical of
ginger root
Ginger root

64
Figure 4.20 Quantitative scores for aroma and flavour descriptors of herb tea (Numerical scale (15-points) where ‘0’ represents ‘weak’ and ‘15’ represents ‘strong’. 591 (100% Moringa); 532 (50% Moringa + 30% Roselle + 20% Lemon grass); 613 (60% Moringa + 10% Roselle + 30% Lemon grass). n=3)
4.3.3 TASTE DESCRIPTORS
Taste descriptors generated by the trained panel are shown in Table 4.3 below along with
their definitions and references. With the exception of Sour taste, all the taste attributes were
weak and therefore had low mean scores (≤ 1.52) (Figure 4.23). Infusions from product 532
had high scores for Sour taste (12.15) whereas those from product 613 had low scores (5.22).
Infusions from 591 (control) had low scores for all the taste descriptors identified (≤ 0.19).
Roselle has been known to produce sour and astringent infusions due to its high acid content
(Ross, 2003). This is evidenced by the low pH of Roselle infusions (2.73) as shown by results
of the chemical analyses (Figure 4.11). Product 532 may therefore have produced sourer
infusions than product 613 due to the higher Roselle content in the former.
02468
1012
Herbal aroma
Citrus aroma
Lemongrass aroma
Ginger flavour
Control
532
613

65
Table 4.3 Definitions and references of taste descriptors for herb tea
Descriptor Definition Reference Sweet taste Taste sensation typical of sucrose Table sugar
Sour taste Taste sensation typical of acidic fruits Lemon juice
Bitter taste Taste sensation typical of kola nut Kola nut
Pungent aftertaste
Lingering spicy sensation after swallowing Pepper
Bitter aftertaste Lingering bitter taste after swallowing Kola nut
Figure 4.21 Quantitative scores for taste descriptors of herb tea (Numerical scale (15-points) where ‘0’ represents ‘weak’ and ‘15’ represents ‘strong’. 591 (100% Moringa); 532 (50% Moringa + 30% Roselle + 20% Lemon grass); 613 (60% Moringa + 10% Roselle + 30% Lemon grass). n=3)
02468
101214
Sweet taste
Sour taste
Bitter tastePungent
aftertaste
Bitter aftertaste Control
532
613

66
4.3.4 MOUTHFEEL DESCRIPTORS
Mouthfeel descriptors generated by the trained panel are shown in Table 4.4 below along
with definitions and references. Product 532 was the most astringent (11.41) of the three
products. It also had the highest mean score for Tooth-etching (8.67). Products 613 had
comparatively higher scores for Astringency and Tooth-etching (3.48 and 1.59) than the
control (0.19 and 0.00) (Figure 4.24). The high acid content of Roselle has been shown to
cause astringency (Ross, 2003). It is therefore likely that panelists perceived the highest
astringency in product 532 as a result of its high Roselle content. The same reason may
account for the high scores for Tooth-etching in product 532.
Table 4.4 Definitions and references of mouthfeel descriptors for herb tea
DESCRIPTOR DEFINITION REFERENCE
Astringency Shriveling taste sensation on the tongue or
pluckering of the oral tissue
Unripe banana
Tooth-etching Sharp feeling on the tooth Vinegar

67
Figure 4.22 Quantitative scores for mouthfeel descriptors of herb tea (Numerical scale (15-points) where ‘0’ represents ‘weak’ and ‘15’ represents ‘strong’. 591 (100% Moringa); 532 (50% Moringa + 30% Roselle + 20% Lemon grass); 613 (60% Moringa + 10% Roselle + 30% Lemon grass). n=3)
4.4 TOTAL POLYPHENOL CONTENT OF PRODUCTS
Total polyphenol tests were performed on infusions from three products used in the sensory
evaluation tests. The results showed that the commercial herb tea (control) containing 100%
Moringa recorded the highest polyphenol content (30.5 mg/g) while herb tea from products
631 and 532 recorded TPC values of 27.93 mg/g and 24.33 mg/g respectively (Fig 4.1.3).
Between 631 and the control the difference was not significant (P > 0.05) while the
difference was significant between 532 and the control. It can be inferred from the results
that the TPC of the commercial Moringa herb tea was lower than that of the Moringa sample
which was harvested fresh and dried for analysis. The difference could be due to poor
storage conditions which may have led to the degradation of the phenolic compounds and/or
the presence of impurities within the commercial product.
0
2
4
6
8
10
12
control 532 613
Astringency
Tooth-etching

68
Control
631
532
0
10
20
30
40
PRODUCTS
TPC (mg/g)
Figue 4.23 Total polyphenol content (TPC) of herb tea products (Error bars indicate SEM at 5% probability; n=3)

69
CHAPTER FIVE
5.0 CONCLUSION AND RECOMMENDATION
5.1 CONCLUSION
The results of the chemical analysis showed that Roselle calyx could potentially exert the
strongest influence on the sensory character of the beverage compared with Lemon grass and
Moringa leaf. This was evident from the relatively high water soluble extractive of Roselle
(12.38%). Roselle also showed a relatively low pH (2.73) indicating its potential to impart
sourness and astringency to herb tea. Lemon grass, on the other hand, recorded the highest
light petroleum extractive (4.1%) which indicated its potential to impart aromatic quality to
herb tea. The sample was also relatively high in crude fibre content (21.38%). Moringa leaf
showed relatively high crude protein (26.59%) and crude ash content (8.57%) making it a
suitable ingredient for malnutrition diets.
Herb tea brewed from product 532 (50% Moringa: 30% Roselle: 20% Lemon grass) was the
most preferred in colour, flavour and overall acceptability while that from the 591 (control)
(100% Moringa) was the least preferred in colour, aroma, flavour, astringency and overall
acceptability. Blending Moringa, Roselle and Lemon grass produced a herb tea with more
appealing characteristics than herb tea from only Moringa.
A total of 17 descriptors were generated, defined and referenced for herb tea. This included
six appearance descriptors: Greenness, Yellowness, Redness, Brownness, Turbidity and
Sparkling; three aroma descriptors: Herbal, Lemon grass and Citrus; one flavour descriptor:
Ginger; five taste descriptors: Sweet taste, Sour taste, Bitter taste, Pungent aftertaste and
Bitter aftertaste; and two mouthfeel descriptors: Astringency and Tooth-etching.

70
5.2 RECOMMENDATIONS
It is recommended that:
• The sensory appeal of infusions from blends of other herbs is compared with that of
product 532;
• A full mineral and vitamin analysis of the infusions is performed;
• Measurements of the infusion dynamics are carried out; and
• A full microbiological analysis is carried out on the herb formulations.

71
REFERENCES
Abbey, L. and Timpo, G.M. (1999) Production and utilization of indigenous leafy vegetables:
a proposal intervention model for Savannah zones of Ghana. Technical Note, Department of
Horticulture, KNUST, Kumasi, Ghana.
Ali, B.H., Mousa, H.M., and El-Mougy, S. (2003). The effect of a water extract and
anthocyanins of Hibiscus sabdariffa L. on paracetamol induced hepatoxicity in rats.
Phythotherapy Research 17: 56 – 59.
Anwar, F., Latif, S., Ashraf, M. and Gilani, A.H. (2007) Moringa oleifera: A Food Plant with
Multiple Medicinal Uses. Phytotherapy Research 21: 17 – 25.
AOAC (1990) Official Methods of Analysis of the Association of Official Analytical
Chemists (15th edition), Washington D.C., 992 – 995.
Appel, S.D. (2003) Red sorrel (Hibiscus sabdariffa) – the other ‘cranberry’. Plants and
Garden News 18: 1 – 2.
Babalola, S.O. (2000) Chemical Composition of roselle (Hibiscus sabdariffa L.) calyx.
Proceeding of the 24th Annual Conference of the Nigerian Institute of Food Science and
Technology; 119 – 121.
Bajpai, M., Pande, A., Tewari, S.K. and Prakash, D. (2005) Phenolic contents and antioxidant
activity of some food and medicinal plants. International Journal of Food Sciences and
Nutrition 56 (4): 287 – 291.

72
Baratta, M.T., Dorman, H.J.D., Deans, S.G., Figueiredo, A.C., Barroso, J.G. and Ruberto, G.
(1998) Antimicrobial and antioxidant properties of some commercial essential oils, Flavour
and Fragrance Journal 13 (4): 235 – 244.
Barcenas, P., Perez Elortondo, F.J., Salmeron, J. and Albisu, M. (1999) Development of a
preliminary sensory lexicon and standard references of ewes milk cheeses aided by
multivariate statistical procedures. Journal of Sensory Studies 14: 161 – 179.
BeMiller, J.N. and Whistler, R.L. (1999) Carbohydrates. In: Fennema, R.O., Karel, M.,
Sanderson, G.W.; Tannenbaum, S.R., Walstra, P., Witaker, J.R. (eds). Food Chemistry,
Marcel Dekker Inc. New York, 219.
Bender, D.A. (2003) Benders’ Dictionary of Nutrition and Food Technology, 7th Edition,
CRC Press.
Bhattacharya, S.B., Das, A.K. and Banerji, N. (1982) Chemical investigations on the gum
exudates from Sonja (Moringa oleifera). Carbohydrates Research 102: 253 – 262.
Black, R.E. (2003) Zinc deficiency, infectious disease and mortality in the developing world.
Journal of Nutrition 133: 1484S – 9S.
Blench, R. (1997) Agriculture within the cultural system of the Tarok people of East Central Nigeria.
(London: ODI) 137 – 139.

73
Booth, F.E.M. and Wickens, G.E. (1988) Non-timber uses of selected arid zone trees and
shrubs in Africa. FAO Conservation Guide, Rome, 92 – 101.
Bricout, J. and Koziet, J. (1978) Characterization of synthetic substances in food flavours by
isotropic analysis. In Flavour Symposium, Anals. 199 – 208.
Bridle, P. and Timberlake, C.F. (1997) Anthocyanins as natural food colour – selected
aspects. Food Chemistry 58: 103 – 9.
Buogo G. and Picchinenna D. (1937) Chemical characteristics of Roselle hemp. Journal of
Applied Chemistry 27 (4): 577 – 582.
Byun, J.O. and Han, J.S. (2004) A study perception and actual status of utilization for green
tea. Korean Journal of Food Culture 18: 184–192.
Caceres, A., Cabrera, O., Morales, O., Mollinedo, P. and Mendia, P. (1991) Pharmacological
properties of Moringa oleifera 1: Preliminary screening for antimicrobial activity. Journal of
Ethnopharmacolology 33: 213 – 216.
Caul, J.F. (1957) The profile method of flavor analysis. In Advances in Food Research, Vol 7
(E.M. Mrak and G.F. Stewart, eds.) Academic Press, New York, NY, 1 – 40.
Chambers, H.D. and Lee, J. (2007) A lexicon for flavor descriptive analysis of green tea.
Journal of Sensory Studies 22: 256 – 272.
74
Chen, C.C. (2003) Hibiscus sabdariffa extract inhibits development of atherosclerosis in
cholesterol-fed rabbits. Journal of Agricultural and Food Chemistry 51: 5472 – 7.
Chen, S.H., Huang, T.C., Ho, C.T. and Tsai, P.J. (1998) Extraction and study on the volatiles
in roselle tea. Journal of Agricultural Food Chemistry 46: 1101 – 1106.
Chisowa, E.H., Hall, D.R. and Farman D.I. (1998) Volatile Constituents of the Essential Oil
of Cymbopogon citrates Stapf grown in Zambia. Flavour and Fragrance Journal 13: 29 – 30.
Cho, H.Y., Chung, S.J., Kim, H.S. and Kim, K.O. (2005) Effect of sensory characteristics
and non-sensory factors on consumer liking of various canned tea products. Journal of Food
Science 79: 532 – 538.
Choi, H.J., Lee,W.S., Hwang, S.J., Lee, I.J., Shin, D.H., Kim, H.Y. and Kim, K.U. (2000)
Changes in chemical compositions of green tea (Camellia sinensis L.) under the different
extraction conditions. Korean Journal of Life Science 10: 202–209.
Chollet, S., and Valentin, D. (2001) Impact of training on beer flavor perception and
description: are trained and untrained subjects really different? Journal of Sensory Studies 16:
601 – 618.
Clydesdale, F.M., Main, J.H. and Francis, F.J. (1979) Roselle (Hibiscus sabdariffa L.)
anthocyanins as colorant beverage and gelatin deserts. Journal of Food Protection 42: 204 –
67.

75
De Cock, H.L., Kinnear, M. and Geel, L. (2005) Relating consumer preferences to sensory
attributes of instant coffee. Food Quality and Preference 16 (3): 237 – 244.
Delgado-Vargas, F., Jiménez, A.R. and Paredes-López, O. (2000) Natural pigments:
carotenoids, anthocyanins and betalains – characteristics, biosynthesis, processing and
stability. Critical Reviews in Food Science and Nutrition 40: 173 – 289.
Delgado-Vargas, F. and Parades-López, O. (2003). Chemicals and colorants as nutraceuticals.
In: Natural Colorants for Food and Nutraceutical Uses., pp. 257 – 305. CRC Press: Boca
Raton, FL.
Design Expert (2007). State-Ease, Inc., Hennepin Square, Suite 480, 2021 E. Hennepin Ave.,
Minneapolis, MN 55413 – 2726.
D’Heureux-Calix, F. and Badrie, N. (2004) Consumer acceptance and physicochemical
quality of processed red sorrel/roselle (Hibiscus sabdariffa L.) sauces from enzymatic
extracted calyces. Food Service Technology 4: 141 – 8.
Dominiguez-Lopez, A., Remondetto, G. E. and Salvador, N. (2008) Thermal kinetic
degradation of anthocyanins in a roselle (Hibiscus sabdariffa L. cv. ‘Criollo’) infusion.
International Journal of Food Science and Technology 43: 322 – 325.
Downham, A. and Collins, P. (2000) Coloring our foods in the last millennium. International
Journal of Food Science and Technology: 35: 5 – 22.
76
Du, C.T. and Francis, F.J. (1973) Anthocyanins of roselle (Hibiscus sabdariffa L.) Journal of
Food Science 38: 810 – 812.
Dudai, N. (2001) Changes in essential oil during enzyme-assisted ensiling of Lemon grass
(Cymbopogon citratus) (DC) Stapf and eucalyptus (Eucalyptus citriodora Hook). Journal of
Agricultural and Food Chemistry 49 (5): 2262 – 6.
Dura´ n, L., Damasio, M. H., and Costell, E. (1989). Non-oral texture evaluation of mixed
gels. Selection of parameters. In R. P. Sing, and A. G. Medina (Eds.), Food properties and
computer aided engineering of food processing systems Dordrecht: Kluwer Academic. 321 –
326.
Ellis, H. (2002) Tea: Discovering, Exploring, Enjoying, Ryland Peters and Small, Inc., New
York, NY. 38 – 47.
Esselen, W.B. and Sammy, G.M. (1973) Roselle: a natural red colorant for foods. Food
Product and Development 7: 80 – 82.
Euromonitor (2000) Functional Foods: World Survey, 2000. 68 – 76.
Ezeamuzle, I.C., Ambedederomo, A.W., Shode, F.O. and Ekwebelem, S.C., (1996)
Antiinflammatory effects of Moringa oleifera root extract. International Journal of
Pharmacognosy 34: 207–212.
Faizi, S., Siddiqui, B.S., Saleem, R., Aftab, K., Shaheen, F. and Gilani, A.H. (1998)
Hypotensive constituents from the pods of Moringa oleifera. Planta Medica 64 (3):225–228.
77
Faruq, M.O. (1994) TLC technique in the component characterization and quality
determination of Bangladeshi Lemongrass oil (Cymbopogon citratus). Bangladesh Journal of
Science Industrial Research 29 (2): 27 – 38.
Fennema, R.O. (1996) Water and Ice. In: Fennema, R.O., Karel, M., Sanderson, G.W.,
Tannenbaum, S.R., Walstra, P., Witaker, J.R. (eds.) Food Chemistry, Marcel Dekker Inc.
New York. 52.
Figueirinha, A., Paranhos, A., Perez-Alonso, J.J., Santos-Buelga, C., Batista, M.A. (2008)
Cymbopogon citratus leaves: Characterization of flavonoids by HPLC–PDA–ESI/MS/MS
and an approach to their potential as a source of bioactive polyphenols. Journal of Food
Chemistry 110 (3): 718 – 728.
Fuglie, L.G. (ed.) (2001) The Miracle Tree. The Multiple Attributes of Moringa. CTA,
Wageningen, The Netherlands. 668 – 749.
Gains, N., and Thomson, D.M.H. (1990) Sensory profiling of canned lager beers using
consumers in their own homes. Food Quality and Preference 2: 39 – 47.
Ghasi, S., Nwobodo, E. and Ofili, J.O. (2000) Hypocholestrolaemic effects of crude extract
of leaf of Moringa oleifera Lam in high fat diet fed to Wister rats. Journal of
Ethnopharmacology 69: 21–25.

78
Gilani, A.H., Aftab, K. and Shaheen, F. (1992) Antispasmodic activity of active principle
from Moringa oleifera. In Natural Drugs and the Digestive Tract, Capasso F, Mascolo N
(eds). EMSI: Rome, 60 – 63.
Gilani, A.H., Aftab, K. and Suria, A. (1994) Pharmacological studies on hypotensive and
spasmodic activities of pure compounds from Moringa oleifera. Phytotherapy Research 8: 87
– 91.
Gunasingh, C.B.G. and Nagarajan, S. (1981) Flavonoids of Cymbopogon citratus. Indian
Journal of Pharmaceutical Science 43 (3): 115
.
Guy, C., Piggott, J.R., and Marie, S. (1989) Consumer profiling of Scotch whisky. Food
Quality and Preference 1: 69 – 73.
Haisman, D.R. and Clarke, M.W. (1975) The interfacial factor in the heat-induced conversion
of chlorophyll to pheophytin in green leaves. Journal of the Science of Food and Agriculture
26: 1111 – 26.
Hakim, I.A., Weisgerber, U.M., Harris, R.B., Balentine, D., van-Mierlo, C.A.J. and Paetau-
Robinson, I. (2000) Preparation, composition and consumption patterns of tea-based
beverages in Arizona. Nutrition Research 20 (12): 1715 – 1724.
Hamilton-Miller, J.M. (1995) Antimicrobial properties of tea (Camellia sinensis. L).
Antimicrobial Chemotherapy 39 (11): 2375 – 2377.
PREPARATION, COMPOSITION AND CONSUMPTION PATTERNS OFEA-BASED BEVERAGES I

79
Hanson, S.W. (1976) Cymbopogonol, a new triterpenoid from Cymbopogon citratus.
Phytochemistry 15: 1074 – 5.
Hara, Y., Luo, S., Wickremasinghe, R.L. and Yamanishi, T. (1995) Special issue on tea.
Food Reviews International 11: 371 – 542.
Haslam E. (1998) Practical Polyphenolics: From Structure to Molecular Recognition and
Physiological Action. Cambridge University Press, Cambridge, UK. 89 – 93.
Haslam, E. and Lilley, T.H. (1988) Natural astringency in foodstuffs – A Molecular
interpretation. Critical Reviews in Food Science and Nutrition 27: 1 – 40.
Hirschorn, H.H. (1983) Botanical remedies of the former Dutch East Indies (Indonesia). Part
1: Eumycetes, Pteridophyta, Gmnospermae, Angilospermae (Monocotyledones only) Journal
of Ethnopharmacology 7: 123 – 56.
Hirunpanich, V., Utaipat, A., Morales, N.P., Bunyapraphatsara, N., Sato, H., Herunsalee, A.
and Suthisisang, C. (2005) Antioxidant effects of aqueous extracts from dried calyx of
Hibiscus sabdariffa L. (roselle) in vitro using low-density lipoprotein (LDL). Biological and
Pharmaceutical Bulletin 28: 481 – 4.
IFT. (1981) Sensory evaluation guide for testing food and beverage products. Food
Technology 35 (11): 550 – 559.

80
Indovina R. and Capotummino G. (1938) Chemical analysis of karkade, the extract derived
from Hibiscus sabdariffa L. cultivated in Sicily (Palermo) Chemical Abstracts 28: 413 – 418.
International Tea Committee, Supplement to Annual Bulletin of Statistics, 1998. 103 – 146.
Jacomassi, E. and Piedade, L.H. (1994) Importance of medicinal plants and their use in the
town of Goiore – PR. Revista da UNIMAR 16: 335 – 53.
Jaganyi, D. and Mdletshe, S. (2000) Kinetics of tea infusion. Part 2: The effect of tea-bag
material on the rate and temperature dependence of caffeine extraction from black Assam tea.
Food Chemistry 70: 163–165.
Jaganyi, D. and Price, R.D. (1999) Kinetics of tea infusion: The effect of the manufacturing
process on the rate of extraction of caffeine. Food Chemistry 64: 27–31.
Jensen, B. (2000) Guide to Body Chemistry and Nutrition. Keats Publishing, Illinois, U.S.A..
55 – 80.
Johnsen, P.B., and Kelly, C.A. (1990) A technique for the quantitative sensory evaluation of
farm-raised catfish. Journal of Sensory Studies 4: 189 – 199.
Julkenen-Tito, M.R.K., Kirsi, M.J. and Rimpilaeinen, T.K. (1988) Methods of analysis and
the aroma composition of some species of herbal teas. Lebesm Wiss Technology 21(1); 36 –
40.

81
Jung, D.H. (2004) Components and Effects of Tea (In Korean), Hongikjae, Seoul, Korea. 28
– 43.
Kalogo, Y., Rosillon, F., Hammes F. and Verstraete W. (2000) Effect of a water extract of
Moringa oleifera seeds on the hydrolytic microbial species diversity of a UASB reactor
treating domestic waste water. Letters in Applied Microbiology 31: 259 – 264.
Kar, A., Choudhary, B.K. and Bandyopadhyay, N.G. (2003) Comparative evaluation of
hypoglycaemic activity of some Indian medicinal plants in alloxan diabetic rats. Journal of
Ethnopharmacology 84 (1): 105–108.
Kasali, A.A., Oyedeji, A.O. and Ashilokun, A.O. (2001) Volatile leaf oil constituents of
Cymbopogon citratus (DC) Stapf, Flavour and Fragrance Journal 16(5): 377 – 378.
Kathiresan, K. (1965) Studies on tea from mangrove leaves. Environmental Ecology 13 (2),
321 – 323.
Keane, P. (1992) The flavor profile. In ` Manual on Descriptive Analysis Testing for Sensory
Evaluation (R.C. Hootman, ed.) ASTM, Philadelphia, P.A. 2 – 15.
Kerharo, J. (1971) Senegal bisap (Hibiscus sabdariffa) or Guinea sorrel or red sorrel. Plant
Med Phytother 5: 277 – 281; from Chemical Abstracts 1972; 77: 16568.

82
Khafaga E-SR and Koch, H. (1980) Stage of maturity and quality of roselle (Hibiscus
sabdariffa L. var sabdariffa). 1. Organic acids. Angew Bot 54: 287 – 293; from Chem Abstr
1980; 94: 1711.
Khokhar, S. and Magnusdottir, S.G.M. (2002) Total phenol, catechin, and caffeine contents
of teas commonly consumed in the United Kingdom. Journal of Agricultural Food Chemistry
50: 565 – 570.
Kim, B.S., Yang, W.M. and Choi, J. (2002) Comparison of caffeine, free amino acid, vitamin
C and catechins content of commercial green tea in Bosung, Sunchon, Kwangyang, Hadong.
Journal of Korean Tea Society 8: 55–62.
Kinugasa, H., Takeo, T. and Yano, N. (1997) Differences of flavor components found in
green tea canned drinks made from tea leaves plucked on different matured stage. Journal of
Japanese Society for Food Science and Technology. 44(2): 112 – 118.
Kirk, R.S. and Sawyer, R. (1997) Pearson’s Composition and Analysis of Foods (9th Ed)
Longman Singapore Publishers; Singapore. 356 – 362.
Kumazawa, K. and Masuda, H. (2002) Identification of potent odorants in different green tea
varieties using flavor dilution technique. Journal of Agricultural Food Chemistry 50: 5660 –
5663.
Labbe, D., Rytz, A. and Hugi, A. (2003). Training is a critical step to obtain reliable product
profiles in a real food industry context. Food Quality and Preference 15: 341 – 348.

83
Larson, R.A. (1988) The antioxidants of higher plants. Phytochemistry 27: 969–978.
Lawless, H.T., and Heymann, H. (1998) Sensory Evaluation of Food: Principles and
Practices, Chapman and Hall, New York. 139 – 146.
Liang, Y., Lu, J., Zhang, L., Wu, S. and Wu, Y. (2003) Estimation of black tea quality by
analysis of chemical composition and colour difference of tea infusions. Food Chemistry 80:
283–290.
Lin, Y.C. (1975) The study of red pigments in Taiwan plants. Proceedings of the National
Science Council Part 1 (Taiwan) 8: 133 – 137.
Mahabir, D. and Gulliford, M.L. (1997) Use of medicinal plants for diabetes in Trinidad and
Tobago. Revista Panamericana de Salud Publica 3: 174 – 9.
Makkar, H.P.S., Bluemmel, M., Borowy, N.K. and Becker, K. (1993) Gravimetric
determination of tannins and their correlations with chemical and protein precipitation
methods. Journal Science Food Agriculture 61: 161–165.
Makonnen, E., Hunde, A. and Damecha, G. (1997) Hypoglycaemic effect of Moringa
stenopetala aqueous extract in rabbits. Phytotherapy Research 11: 147 – 148.
Marongiu, B., Porcedda, S. and Piras, A. (2004) Antioxidant activity of supercritical extract
of Melissa officinalis subsp officinalis and Melissa officinalis subsp inodora. Phytotherapy
Research 18 (10): 789 – 792

84
Mazza, G. (2000) Health aspects of natural colors. In: Natural Food Colorants (eds G.J.
Lauro, F.J. Francis), Marcel Dekker: New York. 289 – 314.
Mazza, G. and Miniati, E. (2000) Anthocyanin in Fruits, Vegetables and Grains. CRC Press:
Boca Raton, FL. 63 – 89.
McKay, D.L. and Blumberg, J.B. (2002) The role of tea in human health: an update. Journal
of the American College of Nutrition 21: 1 – 13.
Mien, K.H. and Mohamed, S. (2001) Flavonoid (Myricitin, Quercetin, Kaempferol, Luteolin
and Apigenin) Content of Edible Tropical Plants. Journal of Agricultural and Food
Chemistry 46(6): 3106 – 12.
MINTEL. (2005). Category Review – Tea – August 2005. MINTEL Intl, Chicago, IL. 78 –
92.
Morton, J.F. (1974) Renewed interest in roselle (Hibiscus sabdariffa L.), the long-forgotten
‘Florida cranberry’. Proceedings of the Florida State Horticultural Society 87: 415 – 25.
Morton, J.F. (1991) The horseradish tree, Moringa pterigosperma (Monringaceae). A boon to
arid lands. Society for Economic Botany 45: 318 – 333.
Moskowitz, H. (1996) Descriptive analysis of perceptions. In Product testing and sensory
evaluation of foods. Westport, CT: Food Nutrition Press 20 – 78.

85
Mounigan, P. and Badrie, N. (2006) Roselle/sorrel (Hibiscus sabdariffa L.) wines with
varying calyx puree and total soluble solids: sensory acceptance, quantitative, descriptive and
physicochemical analysis. Blackwell Publishing Journal of Foodservice (17): 102 – 110.
Munoz, A.M. and Civille, G.V. (1998) Universal, product and attribute specific scaling and
the development of common lexicon in descriptive analysis. Journal of Sensory Studies 13:
57 – 75.
Murakami, A., Kitazonz, Y., Jiwajinda, S., Koshimizu, K., Ohigashi, H. (1998). Niaziminin,
a thiocarbamate from the leaves of Moringa oleifera, holds a strict structural requirement for
inhibition of tumor promotor-induced Epstein-Barr virus activation. Planta Medica 64: 319–
323.
Nadkarni, A.K. (1976). Indian Materia Medica. Popular Prakashan: Bombay. Chopra’s
indigenous drugs of India 21: 810 – 816.
Nambiar V., Bhadalkar K. and Daxini M. (2003) Drumstick leaves in the ICDS-SFP. Indian
Journal of Peadiatrics 70(5): 11-15.
Nambiar V. and Daniel M. (2005) Polyphenol content of three Indian green leafy vegetables.
Journal of Food Science and Technology 42(6): 312 – 315.
Nazlin, I. (1999) The role of visual cues in consumer perception and acceptance of a food
product. Journal of Nutrition and Food Science Vol. 99, 5: 224 – 230.

86
Ndabigengesere, A. and Narasiah, K.S. (1998) Quality of water treated by coagulation using
Moringa oleifera seeds. Water Research 32: 781 – 791.
Negrelle, R.R.B. and Gomes, E.C. (2007) Cymbopogon citratus (DC) Stapf: chemical
composition and biological activities. Rev. Bras. Pl. Med., Botucatu 9: 80 – 92.
Newton, K.A. (2007) Effect of spacing and harvest frequency on the growth, leaf quality and
yield of Moringa oleifera as a leafy vegetable. MSc. Thesis, Faculty of Agriculture and
Natural Resources, KNUST. 4 – 6.
Nnam, N.M. and Onyeke, N.G. (2003) Chemical composition of two varieties of sorrel
(Hibiscus sabdariffa L.), calyces and the drinks made from them. Plant Foods for Human
Nutrition. 58: 1 – 7.
Obioma U.N. and Adikwu M.U. (1997) Investigation on some physiochemical antioxidant
and toxicological properties of Moringa oleifera seed oil. Acta Pharmaceutica 47: 287 – 290.
Olaniyi, A.A., Sofowora, E.A. and Oguntimenin, B.O. (1975) Phytochemical investigation of
some Nigerian plants used against fevers. II Cymbopogon citratus. Planta Medica 28:186 – 9.
Owusu, E. and Odamtten, G.T. (1999) Quality of Ghana herbal tea: microflora and control
measures. Journal of the Ghana Science Association 1 (3): 84-99.
Pal, S.K., Mukherjee, P.K. and Saha, B.P. (1995) Studies on the antiulcer activity of Moringa
oleifera leaf extract on gastric ulcer models in rats. Phytotherapy Research 9: 463 – 465.

87
Park, G.S., Jeon, J.R. and Lee, S.J. (1999) The sensory characteristics of Korean green tea
produced by Kujeungkupo’s method. Korean Journal Society of Food Science 15(5): 475 –
482.
Peigen, X. (1983) Recent developments on medicinal plants in China. Journal of
Ethnopharmacoloy 7: 95 – 109.
Piggott, J.R. (1991) Selection of terms for descriptive analysis. In Sensory Science Theory
and Application in Food (H. Lawless and B. Klein, eds.) Marcel Dekker, New York, NY. 339
– 351.
Rainey, B.A. (1986) Importance of reference standards in training panelists. Journal of
Sensory Studies 1: 149 – 154.
Ramachandran, C., Peter, K.V. and Gopalakrishnan, P.K. (1980) Drumstic (Moringa
oleifera): a multipurpose Indian vegetable. Economic Botany 34: 276 – 283.
Reaubourg, G. and Monceaux, R.H. (1940) The chemical, botanical and pharmacological
characteristics of the karkade (rosella) Hibiscus sabdariffa (gossypifolius). Journal of
Biological Chemistry 1: 292 – 305.
Rinzler, C.A. (2001) The New Complete Book of Herbs, Spices, and Condiments, Checkmark
Books, New York, NY.

88
Roberfroid, M.B. (1999) Concepts in functional foods: the case of inulin and oligofructose.
Journal of Nutrition 129 (7 Suppl): 1398 – 1401.
Roberts, A.K. and Vickers, Z.M. (1994) A comparison of trained and untrained judges,
evaluation of sensory attribute intensities and liking of Cheddar cheeses. Journal of Sensory
Studies 9: 1 – 20.
Ross, I.A. (2003) Hibiscus sabdariffa. In: Medicinal Plants of the World. Vol 1, 2nd edn.
Humana Press: New Jersey, 267 – 275.
Sandstead, H.H. (1982) Copper bioavailability and requirements. American Journal of
Clinical Nutrition: Vol 35: 809 – 814.
Schmidt M., Schmitz H.J., Baumgart, A., Guedon, D., Netsch, M.I. and Kreuter, M.H. (2005)
Toxicity of green tea extracts and their constituents in rat hepatocytes in primary culture.
Food Chemistry Toxicology 43: 307– 14.
Sharma, V., Gulati, A. and Ravindranath, S.D. (2005) Extractability of tea catechins as a
function of manufacture procedure and temperature of infusion. Food Chemistry 93 (1): 141
– 148.
Shin, M.K. (1994) Science in green teas. Korean Journal of Dietary Culture 9: 433–445.
Sloan, A.E. (2005) The center-store aisles. Food Technology 59(10); 29 – 39.

89
Smith, J.C., Morris, E.R. and Ellis, R. (1983) Zinc: requirements, bioavailabilities and
recommended allowances. Clinical Biological Research 129: 147 – 169.
SRC (2002). Sorrel as a Nutraceutical – Health Benefits. Public Education Unit, the
Scientific, Research Council of Jamaica, Kingston. 48 – 49.
Stampanoni, C.R. (1994) The use of standardized flavor languages and quantitative flavor
profiling technique for flavored dairy products. Journal of Sensory Studies 9: 383 – 400.
Stephens, J.M. (1994) Roselle Hibiscus Sabdariffa L. Cooperative Extension Services.
Institute of Food and Agriculutural Sciences, University of Florida: Gainesville, FL. Fact
Sheet HS – 659.
Stone, H., Sidel, J., Oliver, S., Woolsey, A. and Singleton, R.C. (1974) “Sensory evaluation
by quantitative descriptive analysis”, Food Technology 28 (11): 24 – 34.
Subramanian S.S. and Nair A.G.R. (1972) Flavonoids of four Malvaceous plants.
Phytochemistry 11: 1518 – 1519.
Takeda N. and Yasui Y. (1985) Identification of mutagenic substances in roselle color,
elderberry color and safflower yellow. Agricultural Biological Chemistry 49: 1851 – 1852.
Taylor, S. and McDowell, I. (1993) Tea: Types, production and trade. In: Encyclopeadia of
Food Sciences, Food Technology and Nutrition (R. Macrae, R.K. Robinson and M.J. Sadler,
eds.) Academic Press Inc., San Diego, CA. 4521 – 4527.
90
Tee, P.L.; Yusof, S.M.; Mohammed, S.; Umar, N.A. and Mohammed, M.N. (2002) Effect of
roselle (Hibiscus sabdariffa L.) on serum lipids of Sprague Dawley rats. Nutrition and Food
Science 32: 351 – 6.
Tetteh, O.N.A. (2008) Effects of blanching and dehydration methods on the quality of
Moringa leaf powder used as herbal green tea. MSc Thesis. Department of Biochemistry and
Biotechnology, KNUST. 16 – 23.
The Wealth of India (A Dictionary of Indian Raw Materials and Industrial Products) (1962).
Raw Materials, Vol. VI: L-M; Council for Scientific and Industrial Research: New Delhi, 425
– 429.
Togari, N., Kobayashi, A. and Aishima, T. (1995) Relating sensory properties of tea aroma to
gas chromatographic data by chemometric calibration methods. Food Research International
28 (5): 485 – 493.
Tsai, P. McIntosh, J., Pearce, P., Camden, B. and Jordan, B.R. (2002) Anthocyanin and
antioxidant capacity in roselle (Hibiscus sabdariffa L.) extract. Food Research International
35: 351 – 6.
Tseng, T.H., Wang C.J., Kao E.S. and Chu C.Y. (1996) Hibiscus protocatechuic acid protects
against oxidative damage induced by tert-butylhydroperoxide in rat primary hepatocytes
Medicinal Chemistry 101: 137 – 148.

91
Waldron, K.W., Parker, M.L. and Smith, A.C. (2003) Plant Cell Wall and Food Quality. A
review, Journal of Food Science and Technology 2: 109 – 110.
Walker, C.F., Kordas, K., Stoltzfus, R.J. and Black, R.E. (2005) Interactive effects of iron
and zinc on biochemical and functional outcomes in supplementation trials. American
Journal of Clinical Nutrition 82(1): 5 – 12.
Wang, C.J., Wang, J.M. and Lin, W.L. (2000) Protective effect of Hibiscus anthocyanins
against tert-butyl hydroperoxide-induced hepatic toxicity in rats. Food Chemistry Toxicology
38: 411 – 416.
Wang, L.F., Kim, D.M. and Lee, C.Y. (2000) Effects of heat processing and storage on
flavonols and sensory qualities of green tea beverage. Journal of Agricultural Food
Chemistry 48: 4227 – 4232.
Weerts, A.H., Martin, D.R., Lian, G. and Melrose, J.R. (2005) Modelling the hydration of
foodstuffs. Simulation, Modeling Practice 13: 119–128.
Wismer, W.V. and Goonewardene, L.A. (2004) Selection of an astringency reference
standard for the evaluation of black tea. Journal of Sensory Studies 19: 119 – 132.
Wolters, C.J., and Allchurch, E.M. (1994) Effect of training procedure on the performance of
descriptive panels. Food Quality Preference, 5: 203 – 214.

92
Wong, P.K., Yusof, S., Ghazali, H.M. and Che-Man, Y.B. (2002) Physico-chemical
characteristics of roselle (Hibiscus sabdariffa L.). Nutrition and Food Science 32: 68 – 73.
Xia, T., Shi, S. and Wan, X. (2006) Impact of ultrasonic-assisted extraction on the chemical
and sensory quality of tea infusion. Journal of Food Engineering 74: 557–560.
Yamanishi, T. (1977) Aroma of teas. Koryo (Flavor) 199: 89 – 92.
Yau, N.J.N. and Haung, Y.J. (2000) The effect of membrane-processed water on sensory
properties of oolong tea drinks. Food Quality Preference 11: 331–339.

93
APPENDIX A SENSORY EVALUATION FORM
Department of Food Science and Technology
You are provided with samples of herb teas. Please indicate your score of acceptance for
the given attributes of the products using the five-point hedonic scale below.
SCALE
Score Acceptance
5 ‘Like very much’
4 ‘Like slightly’
3 ‘Neither like nor dislike’
2 ‘Dislike slightly’
1 ‘Dislike very much’
EVALUATION FORM
SAMPLE COLOUR AROMA FLAVOUR AFTERTASTE ASTRING
ENCY OVERALL
ACCEPTABILITY
553 721 591 523 613 712 755 631 622 532

94
APPENDIX B
SUMMARY OF ANALYSIS OF VARIANCE
B1. ANOVA FOR CHEMICAL TESTS
I. MOISTURE CONTENT
P value < 0.0001 P value summary *** Are means signif. different? (P < 0.05) Yes Number of groups 3 F 23250 R squared 0.9999 ANOVA Table SS df MS Treatment (between columns) 9.816 2 4.908 Residual (within columns) 0.001267 6 0.0002111 Total 9.817 8 Tukey's Multiple Comparison Test Mean Diff. q Significant? P < 0.05? Summary 95% CI of diff Moringa vs Roselle 1.783 212.6 Yes *** 1.747 to 1.820 Moringa vs Lemon grass 2.480 295.6 Yes *** 2.444 to 2.516 Roselle vs Lemon grass 0.6967 83.05 Yes *** 0.6603 to 0.7331
II. CRUDE ASH CONTENT
P value < 0.0001 P value summary *** Are means signif. different? (P < 0.05) Yes Number of groups 3
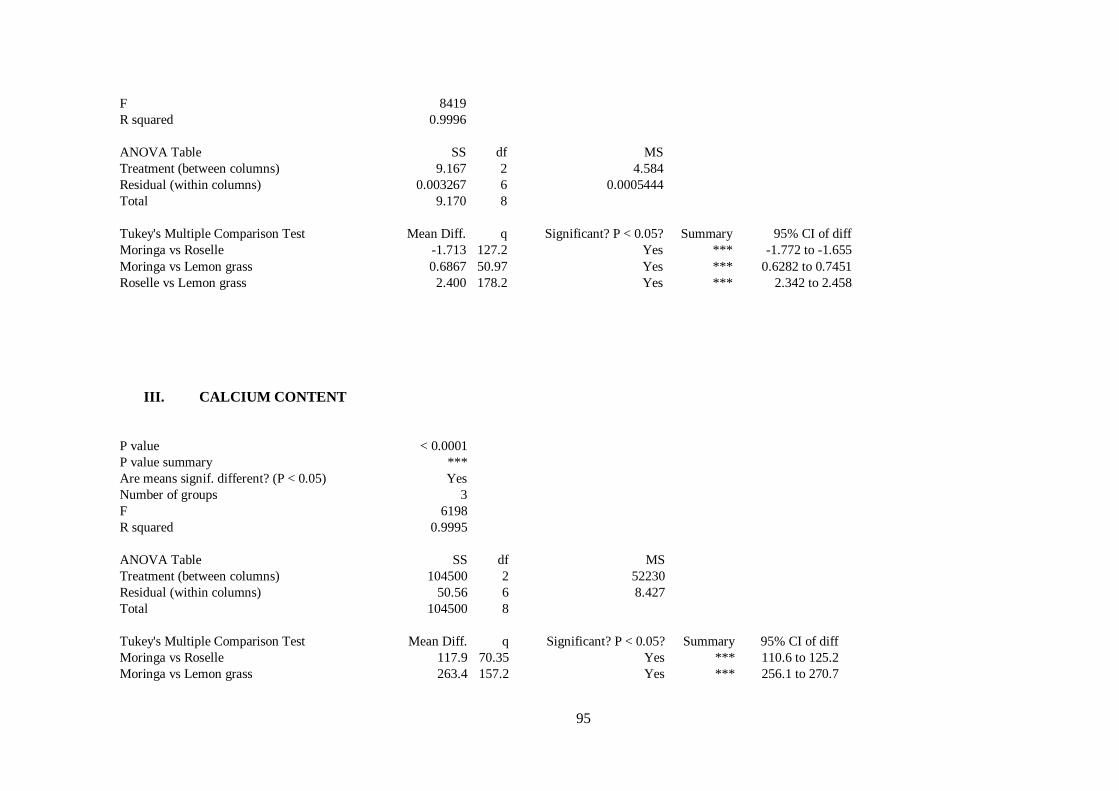
95
F 8419 R squared 0.9996 ANOVA Table SS df MS Treatment (between columns) 9.167 2 4.584 Residual (within columns) 0.003267 6 0.0005444 Total 9.170 8 Tukey's Multiple Comparison Test Mean Diff. q Significant? P < 0.05? Summary 95% CI of diff Moringa vs Roselle -1.713 127.2 Yes *** -1.772 to -1.655 Moringa vs Lemon grass 0.6867 50.97 Yes *** 0.6282 to 0.7451 Roselle vs Lemon grass 2.400 178.2 Yes *** 2.342 to 2.458
III. CALCIUM CONTENT
P value < 0.0001 P value summary *** Are means signif. different? (P < 0.05) Yes Number of groups 3 F 6198 R squared 0.9995 ANOVA Table SS df MS Treatment (between columns) 104500 2 52230 Residual (within columns) 50.56 6 8.427 Total 104500 8 Tukey's Multiple Comparison Test Mean Diff. q Significant? P < 0.05? Summary 95% CI of diff Moringa vs Roselle 117.9 70.35 Yes *** 110.6 to 125.2 Moringa vs Lemon grass 263.4 157.2 Yes *** 256.1 to 270.7

96
Roselle vs Lemon grass 145.5 86.82 Yes *** 138.2 to 152.8
IV. IRON CONTENT
P value < 0.0001 P value summary *** Are means signif. different? (P < 0.05) Yes Number of groups 3 F 555700 R squared 1.000 ANOVA Table SS df MS Treatment (between columns) 291.0 2 145.5 Residual (within columns) 0.001571 6 0.0002618 Total 291.0 8 Tukey's Multiple Comparison Test Mean Diff. q Significant? P < 0.05? Summary 95% CI of diff Moringa vs Roselle -11.33 1212 Yes *** -11.37 to -11.29 Moringa vs Lemon grass 1.358 145.3 Yes *** 1.317 to 1.398 Roselle vs Lemon grass 12.68 1358 Yes *** 12.64 to 12.72
V. COPPER CONTENT
P value < 0.0001 P value summary *** Are means signif. different? (P < 0.05) Yes Number of groups 3 F 1188 R squared 0.9975 ANOVA Table SS df MS Treatment (between columns) 0.2064 2 0.1032

97
Residual (within columns) 0.0005212 6 0.00008686 Total 0.2069 8 Tukey's Multiple Comparison Test Mean Diff. q Significant? P < 0.05? Summary 95% CI of diff Moringa vs Roselle 0.2493 46.34 Yes *** 0.2260 to 0.2727 Moringa vs Lemon grass 0.3625 67.37 Yes *** 0.3392 to 0.3858 Roselle vs Lemon grass 0.1132 21.03 Yes *** 0.08982 to 0.1365
VI. ZINC CONTENT
P value < 0.0001 P value summary *** Are means signif. different? (P < 0.05) Yes Number of groups 3 F 1831 R squared 0.9984 ANOVA Table SS df MS Treatment (between columns) 0.09157 2 0.04578 Residual (within columns) 0.0001500 6 0.00002500 Total 0.09172 8 Tukey's Multiple Comparison Test Mean Diff. q Significant? P < 0.05? Summary 95% CI of diff Moringa vs Roselle 0.06917 23.96 Yes *** 0.05664 to 0.08169 Moringa vs Lemon grass 0.2400 83.14 Yes *** 0.2275 to 0.2525 Roselle vs Lemon grass 0.1708 59.18 Yes *** 0.1583 to 0.1834
VII. CRUDE PROTEIN CONTENT
P value < 0.0001 P value summary *** Are means signif. different? (P < 0.05) Yes

98
Number of groups 3 F 606200 R squared 1.000 ANOVA Table SS df MS Treatment (between columns) 700.5 2 350.3 Residual (within columns) 0.003467 6 0.0005778 Total 700.5 8 Tukey's Multiple Comparison Test Mean Diff. q Significant? P < 0.05? Summary 95% CI of diff Moringa vs Roselle 18.00 1297 Yes *** 17.94 to 18.06 Moringa vs Lemon grass 19.36 1395 Yes *** 19.30 to 19.42 Roselle vs Lemon grass 1.357 97.76 Yes *** 1.296 to 1.417
VIII. CRUDE FIBRE CONTENT
P value < 0.0001 P value summary *** Are means signif. different? (P < 0.05) Yes Number of groups 3 F 600.8 R squared 0.9950 ANOVA Table SS df MS Treatment (between columns) 194.2 2 97.12 Residual (within columns) 0.9699 6 0.1616 Total 195.2 8 Tukey's Multiple Comparison Test Mean Diff. q Significant? P < 0.05? Summary 95% CI of diff Moringa vs Roselle 8.990 38.73 Yes *** 7.983 to 9.997 Moringa vs Lemon grass -1.547 6.663 Yes ** -2.554 to -0.5395 Roselle vs Lemon grass -10.54 45.39 Yes *** -11.54 to -9.529

99
IX. WATER SOLUBLE EXTRACTIVE
P value < 0.0001 P value summary *** Are means signif. different? (P < 0.05) Yes Number of groups 3 F 90720 R squared 1.000 ANOVA Table SS df MS Treatment (between columns) 104.8 2 52.41 Residual (within columns) 0.003467 6 0.0005778 Total 104.8 8 Tukey's Multiple Comparison Test Mean Diff. q Significant? P < 0.05? Summary 95% CI of diff Moringa vs Roselle -4.943 356.2 Yes *** -5.004 to -4.883 Moringa vs Lemon grass 3.367 242.6 Yes *** 3.306 to 3.427 Roselle vs Lemon grass 8.310 598.8 Yes *** 8.250 to 8.370
X. LIGHT PETROLEUM EXTRACTIVES
P value < 0.0001 P value summary *** Are means signif. different? (P < 0.05) Yes Number of groups 3 F 3210 R squared 0.9991 ANOVA Table SS df MS Treatment (between columns) 2.925 2 1.462 Residual (within columns) 0.002733 6 0.0004556 Total 2.928 8 Tukey's Multiple Comparison Test Mean Diff. q Significant? P < 0.05? Summary 95% CI of diff Moringa vs Roselle 0.7767 63.03 Yes *** 0.7232 to 0.8301

100
Moringa vs Lemon grass -0.6167 50.04 Yes *** -0.6701 to -0.5632 Roselle vs Lemon grass -1.393 113.1 Yes *** -1.447 to -1.340
XI. pH
P value < 0.0001 P value summary *** Are means signif. different? (P < 0.05) Yes Number of groups 3 F 261300 R squared 1.000 ANOVA Table SS df MS Treatment (between columns) 11.61 2 5.806 Residual (within columns) 0.0001333 6 0.00002222 Total 11.61 8 Tukey's Multiple Comparison Test Mean Diff. q Significant? P < 0.05? Summary 95% CI of diff Moringa vs Roselle 2.737 1006 Yes *** 2.725 to 2.748 Moringa vs Lemon grass 0.9333 342.9 Yes *** 0.9215 to 0.9451 Roselle vs Lemon grass -1.803 662.6 Yes *** -1.815 to -1.792
XII. TOTAL POLYPHENOLICS TEST ON HERB SAMPLES
P value 0.0001 P value summary *** Are means signif. different? (P < 0.05) Yes Number of groups 3 F 54.19 R squared 0.9475 ANOVA Table SS df MS

101
Treatment (between columns) 629.9 2 314.9 Residual (within columns) 34.87 6 5.812 Total 664.7 8 Tukey's Multiple Comparison Test Mean Diff. q Significant? P < 0.05? Summary 95% CI of diff Moringa vs Roselle 7.890 5.669 Yes * 1.851 to 13.93 Moringa vs Lemon grass 20.32 14.60 Yes *** 14.28 to 26.36 Roselle vs Lemon grass 12.43 8.933 Yes ** 6.394 to 18.47
XIII. TOTAL POLYPHENOLICS TEST ON PRODUCTS
P value 0.0124 P value summary * Are means signif. different? (P < 0.05) Yes Number of groups 3 F 9.965 R squared 0.7686 ANOVA Table SS df MS Treatment (between columns) 57.58 2 28.79 Residual (within columns) 17.33 6 2.889 Total 74.91 8 Tukey's Multiple Comparison Test Mean Diff. q Significant? P < 0.05? Summary 95% CI of diff Control vs 631 2.567 2.616 No ns -1.691 to 6.825 Control vs 532 6.167 6.284 Yes * 1.909 to 10.42 631 vs 532 3.600 3.669 No ns -0.6579 to 7.858

102
B2. ANOVA FOR ACCEPTANCE TESTS
I. COLOUR
P value < 0.0001 P value summary *** Are means signif. different? (P < 0.05) Yes Number of groups 10 F 13.01 R squared 0.1928 Bartlett's test for equal variances Bartlett's statistic (corrected) 37.16 P value < 0.0001 P value summary *** Do the variances differ signif. (P < 0.05) Yes ANOVA Table SS df MS Treatment (between columns) 78.12 9 8.680 Residual (within columns) 327.0 490 0.6674 Total 405.1 499 Tukey's Multiple Comparison Test Mean Diff. q Significant? P < 0.05? Summary 95% CI of diff 721 vs 712 0.1600 1.385 No ns -0.3656 to 0.6856 721 vs 755 0.1000 0.8656 No ns -0.4256 to 0.6256 721 vs 631 -0.8800 7.617 Yes *** -1.406 to -0.3544 721 vs 622 -0.2400 2.077 No ns -0.7656 to 0.2856 721 vs 613 -0.1800 1.558 No ns -0.7056 to 0.3456 721 vs 532 -0.9600 8.309 Yes *** -1.486 to -0.4344 721 vs 523 -0.3600 3.116 No ns -0.8856 to 0.1656 721 vs 553 -0.04000 0.3462 No ns -0.5656 to 0.4856 721 vs 591 0.2600 2.250 No ns -0.2656 to 0.7856 712 vs 755 -0.06000 0.5193 No ns -0.5856 to 0.4656 712 vs 631 -1.040 9.002 Yes *** -1.566 to -0.5144 712 vs 622 -0.4000 3.462 No ns -0.9256 to 0.1256 712 vs 613 -0.3400 2.943 No ns -0.8656 to 0.1856

103
712 vs 532 -1.120 9.694 Yes *** -1.646 to -0.5944 712 vs 523 -0.5200 4.501 No ns -1.046 to 0.005552 712 vs 553 -0.2000 1.731 No ns -0.7256 to 0.3256 712 vs 591 0.1000 0.8656 No ns -0.4256 to 0.6256 755 vs 631 -0.9800 8.482 Yes *** -1.506 to -0.4544 755 vs 622 -0.3400 2.943 No ns -0.8656 to 0.1856 755 vs 613 -0.2800 2.424 No ns -0.8056 to 0.2456 755 vs 532 -1.060 9.175 Yes *** -1.586 to -0.5344 755 vs 523 -0.4600 3.982 No ns -0.9856 to 0.06555 755 vs 553 -0.1400 1.212 No ns -0.6656 to 0.3856 755 vs 591 0.1600 1.385 No ns -0.3656 to 0.6856 631 vs 622 0.6400 5.540 Yes ** 0.1144 to 1.166 631 vs 613 0.7000 6.059 Yes ** 0.1744 to 1.226 631 vs 532 -0.08000 0.6924 No ns -0.6056 to 0.4456 631 vs 523 0.5200 4.501 No ns -0.005552 to 1.046 631 vs 553 0.8400 7.271 Yes *** 0.3144 to 1.366 631 vs 591 1.140 9.867 Yes *** 0.6144 to 1.666 622 vs 613 0.06000 0.5193 No ns -0.4656 to 0.5856 622 vs 532 -0.7200 6.232 Yes *** -1.246 to -0.1944 622 vs 523 -0.1200 1.039 No ns -0.6456 to 0.4056 622 vs 553 0.2000 1.731 No ns -0.3256 to 0.7256 622 vs 591 0.5000 4.328 No ns -0.02555 to 1.026 613 vs 532 -0.7800 6.751 Yes *** -1.306 to -0.2544 613 vs 523 -0.1800 1.558 No ns -0.7056 to 0.3456 613 vs 553 0.1400 1.212 No ns -0.3856 to 0.6656 613 vs 591 0.4400 3.808 No ns -0.08555 to 0.9656 532 vs 523 0.6000 5.193 Yes * 0.07445 to 1.126 532 vs 553 0.9200 7.963 Yes *** 0.3944 to 1.446 532 vs 591 1.220 10.56 Yes *** 0.6944 to 1.746 523 vs 553 0.3200 2.770 No ns -0.2056 to 0.8456 523 vs 591 0.6200 5.366 Yes ** 0.09445 to 1.146 553 vs 591 0.3000 2.597 No ns -0.2256 to 0.8256

104
II. AROMA
P value < 0.0001 P value summary *** Are means signif. different? (P < 0.05) Yes Number of groups 10 F 20.70 R squared 0.2755 Bartlett's test for equal variances Bartlett's statistic (corrected) 3.508 P value 0.9407 P value summary ns Do the variances differ signif. (P < 0.05) No ANOVA Table SS df MS Treatment (between columns) 139.4 9 15.49 Residual (within columns) 366.7 490 0.7484 Total 506.2 499 Tukey's Multiple Comparison Test Mean Diff. q Significant? P < 0.05? Summary 95% CI of diff 721 vs 712 -0.02000 0.1635 No ns -0.5765 to 0.5365 721 vs 755 0.02000 0.1635 No ns -0.5365 to 0.5765 721 vs 631 -0.1800 1.471 No ns -0.7365 to 0.3765 721 vs 622 -0.8200 6.702 Yes *** -1.377 to -0.2635 721 vs 613 -1.060 8.664 Yes *** -1.617 to -0.5035 721 vs 532 -1.240 10.14 Yes *** -1.797 to -0.6835 721 vs 523 -1.260 10.30 Yes *** -1.817 to -0.7035 721 vs 553 -0.8400 6.866 Yes *** -1.397 to -0.2835 721 vs 591 0.04000 0.3269 No ns -0.5165 to 0.5965 712 vs 755 0.04000 0.3269 No ns -0.5165 to 0.5965 712 vs 631 -0.1600 1.308 No ns -0.7165 to 0.3965 712 vs 622 -0.8000 6.539 Yes *** -1.357 to -0.2435 712 vs 613 -1.040 8.501 Yes *** -1.597 to -0.4835 712 vs 532 -1.220 9.972 Yes *** -1.777 to -0.6635 712 vs 523 -1.240 10.14 Yes *** -1.797 to -0.6835

105
712 vs 553 -0.8200 6.702 Yes *** -1.377 to -0.2635 712 vs 591 0.06000 0.4904 No ns -0.4965 to 0.6165 755 vs 631 -0.2000 1.635 No ns -0.7565 to 0.3565 755 vs 622 -0.8400 6.866 Yes *** -1.397 to -0.2835 755 vs 613 -1.080 8.828 Yes *** -1.637 to -0.5235 755 vs 532 -1.260 10.30 Yes *** -1.817 to -0.7035 755 vs 523 -1.280 10.46 Yes *** -1.837 to -0.7235 755 vs 553 -0.8600 7.029 Yes *** -1.417 to -0.3035 755 vs 591 0.02000 0.1635 No ns -0.5365 to 0.5765 631 vs 622 -0.6400 5.231 Yes * -1.197 to -0.08346 631 vs 613 -0.8800 7.193 Yes *** -1.437 to -0.3235 631 vs 532 -1.060 8.664 Yes *** -1.617 to -0.5035 631 vs 523 -1.080 8.828 Yes *** -1.637 to -0.5235 631 vs 553 -0.6600 5.395 Yes ** -1.217 to -0.1035 631 vs 591 0.2200 1.798 No ns -0.3365 to 0.7765 622 vs 613 -0.2400 1.962 No ns -0.7965 to 0.3165 622 vs 532 -0.4200 3.433 No ns -0.9765 to 0.1365 622 vs 523 -0.4400 3.596 No ns -0.9965 to 0.1165 622 vs 553 -0.02000 0.1635 No ns -0.5765 to 0.5365 622 vs 591 0.8600 7.029 Yes *** 0.3035 to 1.417 613 vs 532 -0.1800 1.471 No ns -0.7365 to 0.3765 613 vs 523 -0.2000 1.635 No ns -0.7565 to 0.3565 613 vs 553 0.2200 1.798 No ns -0.3365 to 0.7765 613 vs 591 1.100 8.991 Yes *** 0.5435 to 1.657 532 vs 523 -0.02000 0.1635 No ns -0.5765 to 0.5365 532 vs 553 0.4000 3.269 No ns -0.1565 to 0.9565 532 vs 591 1.280 10.46 Yes *** 0.7235 to 1.837 523 vs 553 0.4200 3.433 No ns -0.1365 to 0.9765 523 vs 591 1.300 10.63 Yes *** 0.7435 to 1.857 553 vs 591 0.8800 7.193 Yes *** 0.3235 to 1.437

106
III. FLAVOUR
P value < 0.0001 P value summary *** Are means signif. different? (P < 0.05) Yes Number of groups 10 F 21.89 R squared 0.2867 Bartlett's test for equal variances Bartlett's statistic (corrected) 16.51 P value 0.0571 P value summary ns Do the variances differ signif. (P < 0.05) No ANOVA Table SS df MS Treatment (between columns) 134.5 9 14.95 Residual (within columns) 334.6 490 0.6829 Total 469.1 499 Tukey's Multiple Comparison Test Mean Diff. q Significant? P < 0.05? Summary 95% CI of diff 721 vs 712 0.0000 0.0000 No ns -0.5316 to 0.5316 721 vs 755 -0.04000 0.3423 No ns -0.5716 to 0.4916 721 vs 631 -0.4200 3.594 No ns -0.9516 to 0.1116 721 vs 622 -0.3400 2.909 No ns -0.8716 to 0.1916 721 vs 613 -0.3000 2.567 No ns -0.8316 to 0.2316 721 vs 532 -1.500 12.84 Yes *** -2.032 to -0.9684 721 vs 523 -1.220 10.44 Yes *** -1.752 to -0.6884 721 vs 553 -0.8600 7.359 Yes *** -1.392 to -0.3284 721 vs 591 0.02000 0.1711 No ns -0.5116 to 0.5516 712 vs 755 -0.04000 0.3423 No ns -0.5716 to 0.4916 712 vs 631 -0.4200 3.594 No ns -0.9516 to 0.1116 712 vs 622 -0.3400 2.909 No ns -0.8716 to 0.1916 712 vs 613 -0.3000 2.567 No ns -0.8316 to 0.2316

107
712 vs 532 -1.500 12.84 Yes *** -2.032 to -0.9684 712 vs 523 -1.220 10.44 Yes *** -1.752 to -0.6884 712 vs 553 -0.8600 7.359 Yes *** -1.392 to -0.3284 712 vs 591 0.02000 0.1711 No ns -0.5116 to 0.5516 755 vs 631 -0.3800 3.252 No ns -0.9116 to 0.1516 755 vs 622 -0.3000 2.567 No ns -0.8316 to 0.2316 755 vs 613 -0.2600 2.225 No ns -0.7916 to 0.2716 755 vs 532 -1.460 12.49 Yes *** -1.992 to -0.9284 755 vs 523 -1.180 10.10 Yes *** -1.712 to -0.6484 755 vs 553 -0.8200 7.017 Yes *** -1.352 to -0.2884 755 vs 591 0.06000 0.5134 No ns -0.4716 to 0.5916 631 vs 622 0.08000 0.6845 No ns -0.4516 to 0.6116 631 vs 613 0.1200 1.027 No ns -0.4116 to 0.6516 631 vs 532 -1.080 9.241 Yes *** -1.612 to -0.5484 631 vs 523 -0.8000 6.845 Yes *** -1.332 to -0.2684 631 vs 553 -0.4400 3.765 No ns -0.9716 to 0.09162 631 vs 591 0.4400 3.765 No ns -0.09162 to 0.9716 622 vs 613 0.04000 0.3423 No ns -0.4916 to 0.5716 622 vs 532 -1.160 9.926 Yes *** -1.692 to -0.6284 622 vs 523 -0.8800 7.530 Yes *** -1.412 to -0.3484 622 vs 553 -0.5200 4.449 No ns -1.052 to 0.01162 622 vs 591 0.3600 3.080 No ns -0.1716 to 0.8916 613 vs 532 -1.200 10.27 Yes *** -1.732 to -0.6684 613 vs 523 -0.9200 7.872 Yes *** -1.452 to -0.3884 613 vs 553 -0.5600 4.792 Yes * -1.092 to -0.02838 613 vs 591 0.3200 2.738 No ns -0.2116 to 0.8516 532 vs 523 0.2800 2.396 No ns -0.2516 to 0.8116 532 vs 553 0.6400 5.476 Yes ** 0.1084 to 1.172 532 vs 591 1.520 13.01 Yes *** 0.9884 to 2.052 523 vs 553 0.3600 3.080 No ns -0.1716 to 0.8916 523 vs 591 1.240 10.61 Yes *** 0.7084 to 1.772 553 vs 591 0.8800 7.530 Yes *** 0.3484 to 1.412

108
IV. AFTERTASTE
P value 0.8545 P value summary ns Are means signif. different? (P < 0.05) No Number of groups 10 F 0.5280 R squared 0.009605 Bartlett's test for equal variances Bartlett's statistic (corrected) 3.497 P value 0.9413 P value summary ns Do the variances differ signif. (P < 0.05) No ANOVA Table SS df MS Treatment (between columns) 4.122 9 0.4580 Residual (within columns) 425.0 490 0.8674 Total 429.1 499 Tukey's Multiple Comparison Test Mean Diff. q Significant? P < 0.05? Summary 95% CI of diff 721 vs 712 -0.04000 0.3037 No ns -0.6391 to 0.5591 721 vs 755 -0.04000 0.3037 No ns -0.6391 to 0.5591 721 vs 631 0.1200 0.9111 No ns -0.4791 to 0.7191 721 vs 622 0.0000 0.0000 No ns -0.5991 to 0.5991 721 vs 613 0.1000 0.7592 No ns -0.4991 to 0.6991 721 vs 532 0.1800 1.367 No ns -0.4191 to 0.7791 721 vs 523 0.1600 1.215 No ns -0.4391 to 0.7591 721 vs 553 0.1400 1.063 No ns -0.4591 to 0.7391 721 vs 591 -0.08000 0.6074 No ns -0.6791 to 0.5191 712 vs 755 0.0000 0.0000 No ns -0.5991 to 0.5991 712 vs 631 0.1600 1.215 No ns -0.4391 to 0.7591 712 vs 622 0.04000 0.3037 No ns -0.5591 to 0.6391 712 vs 613 0.1400 1.063 No ns -0.4591 to 0.7391

109
712 vs 532 0.2200 1.670 No ns -0.3791 to 0.8191 712 vs 523 0.2000 1.518 No ns -0.3991 to 0.7991 712 vs 553 0.1800 1.367 No ns -0.4191 to 0.7791 712 vs 591 -0.04000 0.3037 No ns -0.6391 to 0.5591 755 vs 631 0.1600 1.215 No ns -0.4391 to 0.7591 755 vs 622 0.04000 0.3037 No ns -0.5591 to 0.6391 755 vs 613 0.1400 1.063 No ns -0.4591 to 0.7391 755 vs 532 0.2200 1.670 No ns -0.3791 to 0.8191 755 vs 523 0.2000 1.518 No ns -0.3991 to 0.7991 755 vs 553 0.1800 1.367 No ns -0.4191 to 0.7791 755 vs 591 -0.04000 0.3037 No ns -0.6391 to 0.5591 631 vs 622 -0.1200 0.9111 No ns -0.7191 to 0.4791 631 vs 613 -0.02000 0.1518 No ns -0.6191 to 0.5791 631 vs 532 0.06000 0.4555 No ns -0.5391 to 0.6591 631 vs 523 0.04000 0.3037 No ns -0.5591 to 0.6391 631 vs 553 0.02000 0.1518 No ns -0.5791 to 0.6191 631 vs 591 -0.2000 1.518 No ns -0.7991 to 0.3991 622 vs 613 0.1000 0.7592 No ns -0.4991 to 0.6991 622 vs 532 0.1800 1.367 No ns -0.4191 to 0.7791 622 vs 523 0.1600 1.215 No ns -0.4391 to 0.7591 622 vs 553 0.1400 1.063 No ns -0.4591 to 0.7391 622 vs 591 -0.08000 0.6074 No ns -0.6791 to 0.5191 613 vs 532 0.08000 0.6074 No ns -0.5191 to 0.6791 613 vs 523 0.06000 0.4555 No ns -0.5391 to 0.6591 613 vs 553 0.04000 0.3037 No ns -0.5591 to 0.6391 613 vs 591 -0.1800 1.367 No ns -0.7791 to 0.4191 532 vs 523 -0.02000 0.1518 No ns -0.6191 to 0.5791 532 vs 553 -0.04000 0.3037 No ns -0.6391 to 0.5591 532 vs 591 -0.2600 1.974 No ns -0.8591 to 0.3391 523 vs 553 -0.02000 0.1518 No ns -0.6191 to 0.5791 523 vs 591 -0.2400 1.822 No ns -0.8391 to 0.3591 553 vs 591 -0.2200 1.670 No ns -0.8191 to 0.3791

110
V. ASTRINGENCY
P value < 0.0001 P value summary *** Are means signif. different? (P < 0.05) Yes Number of groups 10 F 9.617 R squared 0.1501 Bartlett's test for equal variances Bartlett's statistic (corrected) 18.47 P value 0.0301 P value summary * Do the variances differ signif. (P < 0.05) Yes ANOVA Table SS df MS Treatment (between columns) 67.78 9 7.531 Residual (within columns) 383.7 490 0.7831 Total 451.5 499 Tukey's Multiple Comparison Test Mean Diff. q Significant? P < 0.05? Summary 95% CI of diff 721 vs 712 0.1800 1.438 No ns -0.3893 to 0.7493 721 vs 755 0.1000 0.7991 No ns -0.4693 to 0.6693 721 vs 631 -0.5800 4.635 Yes * -1.149 to -0.01072 721 vs 622 -0.08000 0.6393 No ns -0.6493 to 0.4893 721 vs 613 0.2000 1.598 No ns -0.3693 to 0.7693 721 vs 532 -0.5000 3.995 No ns -1.069 to 0.06928 721 vs 523 -0.04000 0.3196 No ns -0.6093 to 0.5293 721 vs 553 -0.08000 0.6393 No ns -0.6493 to 0.4893 721 vs 591 0.8200 6.552 Yes *** 0.2507 to 1.389 712 vs 755 -0.08000 0.6393 No ns -0.6493 to 0.4893 712 vs 631 -0.7600 6.073 Yes ** -1.329 to -0.1907 712 vs 622 -0.2600 2.078 No ns -0.8293 to 0.3093 712 vs 613 0.02000 0.1598 No ns -0.5493 to 0.5893

111
712 vs 532 -0.6800 5.434 Yes ** -1.249 to -0.1107 712 vs 523 -0.2200 1.758 No ns -0.7893 to 0.3493 712 vs 553 -0.2600 2.078 No ns -0.8293 to 0.3093 712 vs 591 0.6400 5.114 Yes * 0.07072 to 1.209 755 vs 631 -0.6800 5.434 Yes ** -1.249 to -0.1107 755 vs 622 -0.1800 1.438 No ns -0.7493 to 0.3893 755 vs 613 0.1000 0.7991 No ns -0.4693 to 0.6693 755 vs 532 -0.6000 4.794 Yes * -1.169 to -0.03072 755 vs 523 -0.1400 1.119 No ns -0.7093 to 0.4293 755 vs 553 -0.1800 1.438 No ns -0.7493 to 0.3893 755 vs 591 0.7200 5.753 Yes ** 0.1507 to 1.289 631 vs 622 0.5000 3.995 No ns -0.06928 to 1.069 631 vs 613 0.7800 6.233 Yes *** 0.2107 to 1.349 631 vs 532 0.08000 0.6393 No ns -0.4893 to 0.6493 631 vs 523 0.5400 4.315 No ns -0.02928 to 1.109 631 vs 553 0.5000 3.995 No ns -0.06928 to 1.069 631 vs 591 1.400 11.19 Yes *** 0.8307 to 1.969 622 vs 613 0.2800 2.237 No ns -0.2893 to 0.8493 622 vs 532 -0.4200 3.356 No ns -0.9893 to 0.1493 622 vs 523 0.04000 0.3196 No ns -0.5293 to 0.6093 622 vs 553 0.0000 0.0000 No ns -0.5693 to 0.5693 622 vs 591 0.9000 7.192 Yes *** 0.3307 to 1.469 613 vs 532 -0.7000 5.594 Yes ** -1.269 to -0.1307 613 vs 523 -0.2400 1.918 No ns -0.8093 to 0.3293 613 vs 553 -0.2800 2.237 No ns -0.8493 to 0.2893 613 vs 591 0.6200 4.954 Yes * 0.05072 to 1.189 532 vs 523 0.4600 3.676 No ns -0.1093 to 1.029 532 vs 553 0.4200 3.356 No ns -0.1493 to 0.9893 532 vs 591 1.320 10.55 Yes *** 0.7507 to 1.889 523 vs 553 -0.04000 0.3196 No ns -0.6093 to 0.5293 523 vs 591 0.8600 6.872 Yes *** 0.2907 to 1.429 553 vs 591 0.9000 7.192 Yes *** 0.3307 to 1.469

112
VI. OVERALL ACCEPTABILITY
P value < 0.0001 P value summary *** Are means signif. different? (P < 0.05) Yes Number of groups 10 F 10.18 R squared 0.1575 Bartlett's test for equal variances Bartlett's statistic (corrected) 7.844 P value 0.5499 P value summary ns Do the variances differ signif. (P < 0.05) No ANOVA Table SS df MS Treatment (between columns) 86.83 9 9.648 Residual (within columns) 464.3 490 0.9476 Total 551.2 499 Tukey's Multiple Comparison Test Mean Diff. q Significant? P < 0.05? Summary 95% CI of diff 721 vs 712 0.1000 0.7264 No ns -0.5262 to 0.7262 721 vs 755 0.06000 0.4358 No ns -0.5662 to 0.6862 721 vs 631 -0.1200 0.8717 No ns -0.7462 to 0.5062 721 vs 622 -0.5600 4.068 No ns -1.186 to 0.06623 721 vs 613 -0.6800 4.940 Yes * -1.306 to -0.05377 721 vs 532 -1.020 7.409 Yes *** -1.646 to -0.3938 721 vs 523 -0.2200 1.598 No ns -0.8462 to 0.4062 721 vs 553 -0.1000 0.7264 No ns -0.7262 to 0.5262 721 vs 591 0.5000 3.632 No ns -0.1262 to 1.126 712 vs 755 -0.04000 0.2906 No ns -0.6662 to 0.5862 712 vs 631 -0.2200 1.598 No ns -0.8462 to 0.4062 712 vs 622 -0.6600 4.794 Yes * -1.286 to -0.03377 712 vs 613 -0.7800 5.666 Yes ** -1.406 to -0.1538 712 vs 532 -1.120 8.136 Yes *** -1.746 to -0.4938 712 vs 523 -0.3200 2.324 No ns -0.9462 to 0.3062

113
712 vs 553 -0.2000 1.453 No ns -0.8262 to 0.4262 712 vs 591 0.4000 2.906 No ns -0.2262 to 1.026 755 vs 631 -0.1800 1.308 No ns -0.8062 to 0.4462 755 vs 622 -0.6200 4.504 No ns -1.246 to 0.006235 755 vs 613 -0.7400 5.375 Yes ** -1.366 to -0.1138 755 vs 532 -1.080 7.845 Yes *** -1.706 to -0.4538 755 vs 523 -0.2800 2.034 No ns -0.9062 to 0.3462 755 vs 553 -0.1600 1.162 No ns -0.7862 to 0.4662 755 vs 591 0.4400 3.196 No ns -0.1862 to 1.066 631 vs 622 -0.4400 3.196 No ns -1.066 to 0.1862 631 vs 613 -0.5600 4.068 No ns -1.186 to 0.06623 631 vs 532 -0.9000 6.538 Yes *** -1.526 to -0.2738 631 vs 523 -0.1000 0.7264 No ns -0.7262 to 0.5262 631 vs 553 0.02000 0.1453 No ns -0.6062 to 0.6462 631 vs 591 0.6200 4.504 No ns -0.006234 to 1.246 622 vs 613 -0.1200 0.8717 No ns -0.7462 to 0.5062 622 vs 532 -0.4600 3.341 No ns -1.086 to 0.1662 622 vs 523 0.3400 2.470 No ns -0.2862 to 0.9662 622 vs 553 0.4600 3.341 No ns -0.1662 to 1.086 622 vs 591 1.060 7.700 Yes *** 0.4338 to 1.686 613 vs 532 -0.3400 2.470 No ns -0.9662 to 0.2862 613 vs 523 0.4600 3.341 No ns -0.1662 to 1.086 613 vs 553 0.5800 4.213 No ns -0.04623 to 1.206 613 vs 591 1.180 8.571 Yes *** 0.5538 to 1.806 532 vs 523 0.8000 5.811 Yes ** 0.1738 to 1.426 532 vs 553 0.9200 6.683 Yes *** 0.2938 to 1.546 532 vs 591 1.520 11.04 Yes *** 0.8938 to 2.146 523 vs 553 0.1200 0.8717 No ns -0.5062 to 0.7462 523 vs 591 0.7200 5.230 Yes * 0.09377 to 1.346 553 vs 591 0.6000 4.358 No ns -0.02623 to 1.226

114
B3. ANOVA FOR DESCRIPTIVE TESTS
I. YELLOWNESS
P value < 0.0001 P value summary *** Are means signif. different? (P < 0.05) Yes Number of groups 3 F 6299 R squared 0.9938 Bartlett's test for equal variances Bartlett's statistic (corrected) P value P value summary ns Do the variances differ signif. (P < 0.05) No ANOVA Table SS df MS Treatment (between columns) 2560 2 1280 Residual (within columns) 15.85 78 0.2032 Total 2576 80 Tukey's Multiple Comparison Test Mean Diff. q Significant? P < 0.05? Summary 95% CI of diff Control vs 532 11.93 137.5 Yes *** 11.63 to 12.22 Control vs 613 11.93 137.5 Yes *** 11.63 to 12.22 532 vs 613 0.0000 0.0000 No ns -0.2938 to 0.2938

115
II. GREENNESS
P value < 0.0001 P value summary *** Are means signif. different? (P < 0.05) Yes Number of groups 3 F 183.3 R squared 0.8245 Bartlett's test for equal variances Bartlett's statistic (corrected) P value P value summary ns Do the variances differ signif. (P < 0.05) No ANOVA Table SS df MS Treatment (between columns) 180.3 2 90.16 Residual (within columns) 38.37 78 0.4919 Total 218.7 80 Tukey's Multiple Comparison Test Mean Diff. q Significant? P < 0.05? Summary 95% CI of diff control vs 532 3.630 26.89 Yes *** 3.173 to 4.087 control vs 613 1.444 10.70 Yes *** 0.9874 to 1.902 532 vs 613 -2.185 16.19 Yes *** -2.642 to -1.728
III. REDNESS
P value < 0.0001 P value summary *** Are means signif. different? (P < 0.05) Yes Number of groups 3 F 2239 R squared 0.9829 Bartlett's test for equal variances

116
Bartlett's statistic (corrected) P value P value summary ns Do the variances differ signif. (P < 0.05) No ANOVA Table SS df MS Treatment (between columns) 2199 2 1099 Residual (within columns) 38.30 78 0.4910 Total 2237 80 Tukey's Multiple Comparison Test Mean Diff. q Significant? P < 0.05? Summary 95% CI of diff Control vs 532 -12.56 93.11 Yes *** -13.01 to -12.10 Control vs 613 -4.296 31.86 Yes *** -4.753 to -3.840 532 vs 613 8.259 61.25 Yes *** 7.803 to 8.716
IV. BROWNNESS
P value < 0.0001 P value summary *** Are means signif. different? (P < 0.05) Yes Number of groups 3 F 507.6 R squared 0.9286 Bartlett's test for equal variances Bartlett's statistic (corrected) P value P value summary ns Do the variances differ signif. (P < 0.05) No ANOVA Table SS df MS Treatment (between columns) 813.7 2 406.8 Residual (within columns) 62.52 78 0.8015 Total 876.2 80

117
Tukey's Multiple Comparison Test Mean Diff. q Significant? P < 0.05? Summary 95% CI of diff Control vs 532 -6.407 37.19 Yes *** -6.991 to -5.824 Control vs 613 -7.000 40.63 Yes *** -7.583 to -6.417 532 vs 613 -0.5926 3.439 Yes * -1.176 to -0.009181
V. TURBIDITY
P value < 0.0001 P value summary *** Are means signif. different? (P < 0.05) Yes Number of groups 3 F 861.9 R squared 0.9567 Bartlett's test for equal variances Bartlett's statistic (corrected) 9.841 P value 0.0073 P value summary ** Do the variances differ signif. (P < 0.05) Yes ANOVA Table SS df MS Treatment (between columns) 1518 2 758.8 Residual (within columns) 68.67 78 0.8803 Total 1586 80 Tukey's Multiple Comparison Test Mean Diff. q Significant? P < 0.05? Summary 95% CI of diff Control vs 532 -10.33 57.23 Yes *** -10.94 to -9.722 Control vs 613 -3.111 17.23 Yes *** -3.723 to -2.500 532 vs 613 7.222 40.00 Yes *** 6.611 to 7.834

118
VI. SPARKLING
P value < 0.0001 P value summary *** Are means signif. different? (P < 0.05) Yes Number of groups 3 F 79.21 R squared 0.6701 Bartlett's test for equal variances Bartlett's statistic (corrected) 1.095 P value 0.5784 P value summary ns Do the variances differ signif. (P < 0.05) No ANOVA Table SS df MS Treatment (between columns) 203.9 2 101.9 Residual (within columns) 100.4 78 1.287 Total 304.2 80 Tukey's Multiple Comparison Test Mean Diff. q Significant? P < 0.05? Summary 95% CI of diff Control vs 532 1.481 6.786 Yes *** 0.7423 to 2.221 Control vs 613 3.852 17.64 Yes *** 3.113 to 4.591 532 vs 613 2.370 10.86 Yes *** 1.631 to 3.110
VII. HERBAL AROMA
P value < 0.0001 P value summary *** Are means signif. different? (P < 0.05) Yes Number of groups 3 F 634.1 R squared 0.9421 Bartlett's test for equal variances

119
Bartlett's statistic (corrected) 0.3680 P value 0.8319 P value summary ns Do the variances differ signif. (P < 0.05) No ANOVA Table SS df MS Treatment (between columns) 1224 2 611.8 Residual (within columns) 75.26 78 0.9649 Total 1299 80 Tukey's Multiple Comparison Test Mean Diff. q Significant? P < 0.05? Summary 95% CI of diff Control vs 532 -9.519 50.35 Yes *** -10.16 to -8.878 Control vs 613 -4.926 26.06 Yes *** -5.566 to -4.286 532 vs 613 4.593 24.29 Yes *** 3.952 to 5.233
VIII. CITRUS AROMA
P value < 0.0001 P value summary *** Are means signif. different? (P < 0.05) Yes Number of groups 3 F 1189 R squared 0.9682 Bartlett's test for equal variances Bartlett's statistic (corrected) 7.997 P value 0.0183 P value summary * Do the variances differ signif. (P < 0.05) Yes ANOVA Table SS df MS Treatment (between columns) 2181 2 1090 Residual (within columns) 71.56 78 0.9174 Total 2252 80

120
Tukey's Multiple Comparison Test Mean Diff. q Significant? P < 0.05? Summary 95% CI of diff Control vs 532 -10.78 58.47 Yes *** -11.40 to -10.15 Control vs 613 -11.22 60.88 Yes *** -11.85 to -10.60 532 vs 613 -0.4444 2.411 No ns -1.069 to 0.1797
IX. LEMON GRASS AROMA
P value < 0.0001 P value summary *** Are means signif. different? (P < 0.05) Yes Number of groups 3 F 900.9 R squared 0.9585 Bartlett's test for equal variances Bartlett's statistic (corrected) 10.22 P value 0.0060 P value summary ** Do the variances differ signif. (P < 0.05) Yes ANOVA Table SS df MS Treatment (between columns) 1807 2 903.4 Residual (within columns) 78.22 78 1.003 Total 1885 80 Tukey's Multiple Comparison Test Mean Diff. q Significant? P < 0.05? Summary 95% CI of diff Control vs 532 -10.48 54.39 Yes *** -11.13 to -9.829 Control vs 613 -9.481 49.20 Yes *** -10.13 to -8.829 532 vs 613 1.000 5.189 Yes ** 0.3474 1.653

121
X. GINGER FLAVOUR
P value < 0.0001 P value summary *** Are means signif. different? (P < 0.05) Yes Number of groups 3 F 23.10 R squared 0.3720 Bartlett's test for equal variances Bartlett's statistic (corrected) 29.14 P value < 0.0001 P value summary *** Do the variances differ signif. (P < 0.05) Yes ANOVA Table SS df MS Treatment (between columns) 20.67 2 10.33 Residual (within columns) 34.89 78 0.4473 Total 55.56 80 Tukey's Multiple Comparison Test Mean Diff. q Significant? P < 0.05? Summary 95% CI of diff Control vs 532 -1.222 9.496 Yes *** -1.658 to -0.7864 Control vs 613 -0.7778 6.043 Yes *** -1.214 to -0.3420 532 vs 613 0.4444 3.453 Yes * 0.008617 to 0.8803
XI. SWEET TASTE
P value < 0.0001 P value summary *** Are means signif. different? (P < 0.05) Yes Number of groups 3 F 17.82 R squared 0.3136

122
Bartlett's test for equal variances Bartlett's statistic (corrected) 18.18 P value 0.0001 P value summary *** Do the variances differ signif. (P < 0.05) Yes ANOVA Table SS df MS Treatment (between columns) 28.84 2 14.42 Residual (within columns) 63.11 78 0.8091 Total 91.95 80 Tukey's Multiple Comparison Test Mean Diff. q Significant? P < 0.05? Summary 95% CI of diff Control vs 532 -1.333 7.702 Yes *** -1.920 to -0.7472 Control vs 613 -1.185 6.846 Yes *** -1.771 to -0.5990 532 vs 613 0.1481 0.8558 No ns -0.4380 to 0.7343
XII. SOUR TASTE
P value < 0.0001 P value summary *** Are means signif. different? (P < 0.05) Yes Number of groups 3 F 1221 R squared 0.9690 Bartlett's test for equal variances Bartlett's statistic (corrected) P value P value summary ns Do the variances differ signif. (P < 0.05) No ANOVA Table SS df MS

123
Treatment (between columns) 2005 2 1003 Residual (within columns) 64.07 78 0.8215 Total 2069 80 Tukey's Multiple Comparison Test Mean Diff. q Significant? P < 0.05? Summary 95% CI of diff Control vs 532 -12.15 69.65 Yes *** -12.74 to -11.56 Control vs 613 -5.222 29.94 Yes *** -5.813 to -4.632 532 vs 613 6.926 39.71 Yes *** 6.335 to 7.517
XIII. BITTER TASTE
P value < 0.0001 P value summary *** Are means signif. different? (P < 0.05) Yes Number of groups 3 F 13.18 R squared 0.2526 Bartlett's test for equal variances Bartlett's statistic (corrected) 15.95 P value 0.0003 P value summary *** Do the variances differ signif. (P < 0.05) Yes ANOVA Table SS df MS Treatment (between columns) 12.54 2 6.272 Residual (within columns) 37.11 78 0.4758 Total 49.65 80 Tukey's Multiple Comparison Test Mean Diff. q Significant? P < 0.05? Summary 95% CI of diff Control vs 532 -0.9630 7.254 Yes *** -1.412 to -0.5135 Control vs 613 -0.5185 3.906 Yes * -0.9680 to -0.06903 532 vs 613 0.4444 3.348 No ns -0.005048 to 0.8939

124
XIV. PUNGENT AFTERTASTE
P value < 0.0001 P value summary *** Are means signif. different? (P < 0.05) Yes Number of groups 3 F 70.03 R squared 0.6423 Bartlett's test for equal variances Bartlett's statistic (corrected) P value P value summary ns Do the variances differ signif. (P < 0.05) No ANOVA Table SS df MS Treatment (between columns) 60.52 2 30.26 Residual (within columns) 33.70 78 0.4321 Total 94.22 80 Tukey's Multiple Comparison Test Mean Diff. q Significant? P < 0.05? Summary 95% CI of diff Control vs 532 -1.519 12.00 Yes *** -1.947 to -1.090 Control vs 613 -2.037 16.10 Yes *** -2.465 to -1.609 532 vs 613 -0.5185 4.099 Yes * -0.9469 to -0.09016

125
XV. BITTER AFTERTASTE
P value < 0.0001 P value summary *** Are means signif. different? (P < 0.05) Yes Number of groups 3 F 39.62 R squared 0.5040 Bartlett's test for equal variances Bartlett's statistic (corrected) 24.42 P value < 0.0001 P value summary *** Do the variances differ signif. (P < 0.05) Yes ANOVA Table SS df MS Treatment (between columns) 28.22 2 14.11 Residual (within columns) 27.78 78 0.3561 Total 56.00 80 Tukey's Multiple Comparison Test Mean Diff. q Significant? P < 0.05? Summary 95% CI of diff Control vs 532 -1.444 12.58 Yes *** -1.833 to -1.056 Control vs 613 -0.6667 5.805 Yes *** -1.056 to -0.2778 532 vs 613 0.7778 6.772 Yes *** 0.3889 to 1.167
XVI. ASTRINGENCY
P value < 0.0001 P value summary *** Are means signif. different? (P < 0.05) Yes Number of groups 3 F 156.8 R squared 0.8008

126
Bartlett's test for equal variances Bartlett's statistic (corrected) 18.61 P value < 0.0001 P value summary *** Do the variances differ signif. (P < 0.05) Yes ANOVA Table SS df MS Treatment (between columns) 166.7 2 83.37 Residual (within columns) 41.48 78 0.5318 Total 208.2 80 Tukey's Multiple Comparison Test Mean Diff. q Significant? P < 0.05? Summary 95% CI of diff Control vs 532 -0.5926 4.222 Yes * -1.068 to -0.1174 Control vs 613 -3.296 23.49 Yes *** -3.772 to -2.821 532 vs 613 -2.704 19.26 Yes *** -3.179 to -2.228
XVII. TOOTH-ETCHING
P value < 0.0001 P value summary *** Are means signif. different? (P < 0.05) Yes Number of groups 3 F 1017 R squared 0.9631 Bartlett's test for equal variances Bartlett's statistic (corrected) P value P value summary ns Do the variances differ signif. (P < 0.05) No ANOVA Table SS df MS

127
Treatment (between columns) 2061 2 1030 Residual (within columns) 79.04 78 1.013 Total 2140 80 Tukey's Multiple Comparison Test Mean Diff. q Significant? P < 0.05? Summary 95% CI of diff Control vs 532 -11.41 58.88 Yes *** -12.06 to -10.75 Control vs 613 -1.593 8.221 Yes *** -2.249 to -0.9366 532 vs 613 9.815 50.66 Yes *** 9.159 to 10.47