
An efficient semi-distributed hillslope erosion model for the sub humid Ethiopian Highlands
13
Hydrol. Earth Syst. Sci., 17, 1051–1063, 2013 www.hydrol-earth-syst-sci.net/17/1051/2013/ doi:10.5194/hess-17-1051-2013 © Author(s) 2013. CC Attribution 3.0 License. Hydrology and Earth System Sciences Open Access An efficient semi-distributed hillslope erosion model for the subhumid Ethiopian Highlands S. A. Tilahun 1,2 , C. D. Guzman 1 , A. D. Zegeye 3,4 , T. A. Engda 3 , A. S. Collick 1,2 , A. Rimmer 5 , and T. S. Steenhuis 1,2 1 Department of Biological and Environmental Engineering, Cornell University, Ithaca, NY, USA 2 School of Civil and Water Resources Engineering, Bahir Dar University, Bahir Dar, Ethiopia 3 Integrated Watershed Management and Hydrology Program, Cornell University, Bahir Dar, Ethiopia 4 Adet Research Center, Amhara Regional Agricultural Research Institute, Bahir Dar, Ethiopia 5 Israel Oceanographic and Limnological Research, The Yigal Allon Kinneret Limnological Laboratory, Migdal, Israel Correspondence to: T. S. Steenhuis ([email protected]) Received: 5 February 2012 – Published in Hydrol. Earth Syst. Sci. Discuss.: 20 February 2012 Revised: 20 December 2012 – Accepted: 10 January 2013 – Published: 8 March 2013 Abstract. Erosion modeling has been generally scaling up from plot scale but not based on landscape topographic po- sition, which is a main variable in saturation excess runoff. In addition, predicting sediment loss in Africa has been ham- pered by using models developed in western countries and do not perform as well in the monsoon climate prevailing in most of the continent. The objective of this paper is to develop a simple erosion model that can be used in the Ethiopian Highlands in Africa. We base our sediment pre- diction on a simple distributed saturated excess hydrology model that predicts surface runoff from severely degraded lands and from bottom lands that become saturated during the rainy season and estimates interflow and baseflow from the remaining portions of the landscape. By developing an equation that relates surface runoff to sediment concentra- tion generated from runoff source areas, assuming that base- flow and interflow are sediment-free, we were able to pre- dict daily sediment concentrations from the Anjeni water- shed with a Nash–Sutcliffe efficiency ranging from 0.64 to 0.78 using only two calibrated sediment parameters. Anjeni is a 113 ha watershed in the 17.4 million ha Blue Nile Basin in the Ethiopian Highlands. The discharge of the two wa- tersheds was predicted with Nash–Sutcliffe efficiency values ranging from 0.80 to 0.93. The calibrated values in Anjeni for degraded (14 %) and saturated (2 %) runoff source area were in agreement with field evidence. The analysis suggests that identifying the runoff source areas and predicting the surface runoff correctly is an important step in predicting the sedi- ment concentration. 1 Introduction In the African highlands, erosion has occurred for a long time (Hudson, 1957, 1963; Lal, 1985; Nyssen et al., 2004). In colonial times, the devastating effects of soil loss from newly developed agricultural lands was noted and the need to combat it was expressed (Champion, 1933). However, de- spite large investments in soil and water conservation prac- tices, sediment yields have been increasing in Africa (Lal, 1985; Fleitmann et al., 2007). The reasons mentioned for in- creased soil loss were greater population pressure and con- sequently more intensive cultivation (Fleitmann et al., 2007). Moreover, as reported by Mitiku et al. (2006) 40 % of all ero- sion in Ethiopia is caused by the wrong installation of soil and water conservation (SWC) practices, clearly indicating that our understanding of erosion processes is far from per- fect (Hudson, 1987). For the Blue Nile Basin, a part of the Ethiopian High- lands, reported soil losses vary from 1 to over 400 t ha -1 yr -1 (Hurni, 1988; Mitiku et al., 2006; Tebebu et al., 2010) with an average of 7 t ha -1 yr -1 , or equivalent to a depth of 0.5 mm yr -1 (Garzanti et al., 2006). At the same time sev- eral large dams are planned in the Blue Nile Basin; there- fore, these future developments urgently need better ways to reduce soil loss in order to sustain the efficient operation of the dams well into the future. In the coming decades, models will play an important role in predicting sediment concentration and loads for reservoirs in the Blue Nile Basin. The Grand Ethiopian Renaissance Published by Copernicus Publications on behalf of the European Geosciences Union.
-
Upload
independent -
Category
Documents
-
view
4 -
download
0
Transcript of An efficient semi-distributed hillslope erosion model for the sub humid Ethiopian Highlands
Hydrol. Earth Syst. Sci., 17, 1051–1063, 2013www.hydrol-earth-syst-sci.net/17/1051/2013/doi:10.5194/hess-17-1051-2013© Author(s) 2013. CC Attribution 3.0 License.
EGU Journal Logos (RGB)
Advances in Geosciences
Open A
ccess
Natural Hazards and Earth System
Sciences
Open A
ccess
Annales Geophysicae
Open A
ccess
Nonlinear Processes in Geophysics
Open A
ccess
Atmospheric Chemistry
and Physics
Open A
ccess
Atmospheric Chemistry
and Physics
Open A
ccess
Discussions
Atmospheric Measurement
Techniques
Open A
ccess
Atmospheric Measurement
Techniques
Open A
ccess
Discussions
Biogeosciences
Open A
ccess
Open A
ccess
BiogeosciencesDiscussions
Climate of the Past
Open A
ccess
Open A
ccess
Climate of the Past
Discussions
Earth System Dynamics
Open A
ccess
Open A
ccess
Earth System Dynamics
Discussions
GeoscientificInstrumentation
Methods andData Systems
Open A
ccess
GeoscientificInstrumentation
Methods andData Systems
Open A
ccess
Discussions
GeoscientificModel Development
Open A
ccess
Open A
ccess
GeoscientificModel Development
Discussions
Hydrology and Earth System
SciencesO
pen Access
Hydrology and Earth System
Sciences
Open A
ccess
Discussions
Ocean Science
Open A
ccess
Open A
ccess
Ocean ScienceDiscussions
Solid Earth
Open A
ccess
Open A
ccess
Solid EarthDiscussions
The Cryosphere
Open A
ccess
Open A
ccess
The CryosphereDiscussions
Natural Hazards and Earth System
Sciences
Open A
ccess
Discussions
An efficient semi-distributed hillslope erosion model for thesubhumid Ethiopian Highlands
S. A. Tilahun1,2, C. D. Guzman1, A. D. Zegeye3,4, T. A. Engda3, A. S. Collick1,2, A. Rimmer5, and T. S. Steenhuis1,2
1Department of Biological and Environmental Engineering, Cornell University, Ithaca, NY, USA2School of Civil and Water Resources Engineering, Bahir Dar University, Bahir Dar, Ethiopia3Integrated Watershed Management and Hydrology Program, Cornell University, Bahir Dar, Ethiopia4Adet Research Center, Amhara Regional Agricultural Research Institute, Bahir Dar, Ethiopia5Israel Oceanographic and Limnological Research, The Yigal Allon Kinneret Limnological Laboratory, Migdal, Israel
Correspondence to:T. S. Steenhuis ([email protected])
Received: 5 February 2012 – Published in Hydrol. Earth Syst. Sci. Discuss.: 20 February 2012Revised: 20 December 2012 – Accepted: 10 January 2013 – Published: 8 March 2013
Abstract. Erosion modeling has been generally scaling upfrom plot scale but not based on landscape topographic po-sition, which is a main variable in saturation excess runoff.In addition, predicting sediment loss in Africa has been ham-pered by using models developed in western countries anddo not perform as well in the monsoon climate prevailingin most of the continent. The objective of this paper is todevelop a simple erosion model that can be used in theEthiopian Highlands in Africa. We base our sediment pre-diction on a simple distributed saturated excess hydrologymodel that predicts surface runoff from severely degradedlands and from bottom lands that become saturated duringthe rainy season and estimates interflow and baseflow fromthe remaining portions of the landscape. By developing anequation that relates surface runoff to sediment concentra-tion generated from runoff source areas, assuming that base-flow and interflow are sediment-free, we were able to pre-dict daily sediment concentrations from the Anjeni water-shed with a Nash–Sutcliffe efficiency ranging from 0.64 to0.78 using only two calibrated sediment parameters. Anjeniis a 113 ha watershed in the 17.4 million ha Blue Nile Basinin the Ethiopian Highlands. The discharge of the two wa-tersheds was predicted with Nash–Sutcliffe efficiency valuesranging from 0.80 to 0.93. The calibrated values in Anjeni fordegraded (14 %) and saturated (2 %) runoff source area werein agreement with field evidence. The analysis suggests thatidentifying the runoff source areas and predicting the surfacerunoff correctly is an important step in predicting the sedi-ment concentration.
1 Introduction
In the African highlands, erosion has occurred for a longtime (Hudson, 1957, 1963; Lal, 1985; Nyssen et al., 2004).In colonial times, the devastating effects of soil loss fromnewly developed agricultural lands was noted and the needto combat it was expressed (Champion, 1933). However, de-spite large investments in soil and water conservation prac-tices, sediment yields have been increasing in Africa (Lal,1985; Fleitmann et al., 2007). The reasons mentioned for in-creased soil loss were greater population pressure and con-sequently more intensive cultivation (Fleitmann et al., 2007).Moreover, as reported by Mitiku et al. (2006) 40 % of all ero-sion in Ethiopia is caused by the wrong installation of soiland water conservation (SWC) practices, clearly indicatingthat our understanding of erosion processes is far from per-fect (Hudson, 1987).
For the Blue Nile Basin, a part of the Ethiopian High-lands, reported soil losses vary from 1 to over 400 t ha−1 yr−1
(Hurni, 1988; Mitiku et al., 2006; Tebebu et al., 2010) withan average of 7 t ha−1 yr−1, or equivalent to a depth of0.5 mm yr−1 (Garzanti et al., 2006). At the same time sev-eral large dams are planned in the Blue Nile Basin; there-fore, these future developments urgently need better ways toreduce soil loss in order to sustain the efficient operation ofthe dams well into the future.
In the coming decades, models will play an important rolein predicting sediment concentration and loads for reservoirsin the Blue Nile Basin. The Grand Ethiopian Renaissance
Published by Copernicus Publications on behalf of the European Geosciences Union.

1052 S. A. Tilahun et al.: An efficient semi-distributed hillslope erosion model
Dam near the Ethiopian–Sudan border is currently beingbuilt and several other dams are being planned. In the past,several models have been used in the (semi) humid EthiopianHighlands to predict discharge and soil loss. Models thatemploy the SCS curve number method (infiltration excessrunoff) for runoff are the Agricultural Non-Point Source Pol-lution (AGNPS) model (Haregeweyn and Yohannes, 2003;Mohammed et al., 2004), the Water Erosion PredictionProject (WEPP) model (Zeleke, 2000) and the Soil and WaterAssessment Tool (SWAT) (Setegn et al., 2008). These mod-els need detailed soil and land use data that is not available inthe Ethiopian Highlands. Moreover, these models do not sim-ulate saturation excess, which is the dominant runoff mech-anism in the Ethiopian Highland (Bayabil et al., 2010; Liuet al., 2008). The modified SWAT-WB Water Balance model(Easton et al., 2010; White et al., 2010) includes saturationexcess runoff and gives better results than models used previ-ously. However, data requirements are even greater than forthe standard SWAT model.
An additional limitation with these models is that theyuse the standard Universal Soil Loss Equation (USLE)(Wischmeier and Smith, 1978) or related versions (suchas the one modified for Ethiopian conditions; Hurni, 1985;Eweg et al., 1998; and Zegeye et al., 2010) where the param-eters values are based on small plot measurements. Despiteusing rigorous, theoretically justified erosion prediction rou-tines in WEPP, it did not perform well because runoff predic-tions were based on the infiltration excess (Zeleke, 2000).
Thus, scaling up USLE (i.e., plot scale) estimates towatershed- or basin-scale invariably leads to overestimationor underestimation of soil loss at the outlet (Vanmaerckeet al., 2011). Discussions of scaling up are not only lim-ited to erosion. For example, for discharge predictionsSavenije (2010) writes, “physically based small scale basicprinciples (such as the Darcy, Richards, and Navier–Stokesequations) with detailed distributed modeling, leads to equi-finality and high predictive uncertainty, mostly because thesemethods ill account for heterogeneity, preferential pathwaysand structural patterns on and under the surface”. Other re-searchers argue that Darcy’s and Richards’ law apply andcan predict with a reasonable degree of accuracy the mois-ture contents and leaching patterns after some calibration ofthe parameters (Kung et al., 2000; Kim et al., 2005; Zehe etal., 2010; Klaus and Zehe, 2011). Although, due to the lackof fine and detailed information, the best way of finding theregularity in the “calibration” parameters is being intensivelyresearched, there is agreement that there exists some measureof organized complexity in naturally formed catchments atintermediate and larger scales (Dooge, 1986, 2005; Savenije,2010; He et al., 2011). Field research such as in the semi-humid Ethiopian Highlands (Bayabil et al., 2010); CatskillMountains (in New York State, Lyon et al., 2006; de Alwiset al., 2007; Harpold et al., 2010; Dahlke et al., 2012) andAustralia (Western et al., 2002) confirms that these emerging
patterns of self-organization in watersheds exist because ofthe similarity in moisture contents from year to year.
Many different approaches are being developed to in-corporate this organized complexity into discharge predic-tions (Borga et al., 2011; Rimmer and Hartmann, 2012; andSivapalan et al., 2011). These models are often much simplerwhen compared with models that use Darcy’s law and con-servation of mass (Dooge, 1986, 2005; and Savenije, 2010).Our nine-parameter hydrology model, using just three frac-tional areas that produce either overland flow or subsurfaceflow, developed for the Ethiopian Highlands (Steenhuis et al.,2009; and Tesemma et al., 2010), is an example of such amodel.
The objective of this study is therefore to develop an ero-sion model that goes beyond scaling up plot erosion esti-mates, to improve sediment concentration prediction for amonsoon climate prevailing in the Ethiopian Highlands atseveral scales. Our erosion model will use the patterns ofself-organization introduced by Savenije (2010) to model thedischarge and the sediment concentration of two watershedsin the Ethiopian Highlands varying greatly in size. To thebest of our knowledge, this is the first attempt to include or-ganized complexity in sediment concentrations predictions atthe watershed scale.
In this new approach, we combine the hydrology modelof Steenhuis et al. (2009) and Tesemma et al. (2010) withan erosion model. The hydrology model employs organizedcomplexity to define the areas that recharge the subsurfacestorages and generate surface runoff. Magnitude of the fluxesis calculated with a water balance type approach. The ero-sion model assumes a linear relationship between sedimentconcentration and velocity from runoff-producing areas. Italso assumes dilution with interflow similar to the sedimentconcentration prediction approach in Steenhuis et al. (2009).The physical justification for our semi-distributed sedimentmodel closely follows Hairsine and Rose (1992a, b), as im-plemented by Rose (1993), and the models of Ciesiolka etal. (1995) and Yu et al. (1997). The Hairsine and Rose modelpredicted sediment concentrations successfully in the mon-soon climate of the Philippines, Thailand and Malaysia usingobserved stream flows (Rose, 2001). In the foothills of Nepal,soil erosion from USLE-type plots was predicted most accu-rately by WEPP, followed by the Griffith University ErosionSystem Template (GUEST) Technology (based on Hairsineand Rose Model), and European Soil Erosion Model (EU-ROSEM) (Kandel et al., 2001). In this manuscript, we in-troduce the model development and illustrate its capacity tosimulate Ethiopian Highland hydrology and erosion.
Hydrol. Earth Syst. Sci., 17, 1051–1063, 2013 www.hydrol-earth-syst-sci.net/17/1051/2013/

S. A. Tilahun et al.: An efficient semi-distributed hillslope erosion model 1053
2 Material and methods
2.1 Description of Anjeni watershed andBlue Nile Basin
Sediment concentration data are available for a few water-sheds in Ethiopia. These watersheds were established by theSoil Conservation Research Program (SCRP) as a collabo-rative project of the University of Bern, Switzerland, andthe Ministry of Agriculture, Ethiopia. This watershed is inthe Ethiopian Highlands and drains into the Blue Nile Basininitiated in 1981 in order to support and monitor SWC ef-forts in the highlands of Ethiopia. In this paper, we use thedata of one of these experimental watersheds located in theEthiopian Highlands, Anjeni, and the Ethiopian Blue NileBasin at the Ethiopian–Sudan border.
The Anjeni watershed (Fig. 1 and Table 1) covers anarea of 113.4 ha, with elevations ranging between 2405 and2507 m. It is located approximately at the center of the BlueNile Basin that covers 17 400 000 ha. Anjeni is subhumidin climate, while the Blue Nile flows from humid to semi-arid climates on the way to the Ethiopian–Sudan border.The annual rainfall of the basin ranges from approximately2000 mm in the southeast to nearly 1000 mm in the northeastand 1690 mm at Anjeni. The rainfall at Anjeni is unimodal,which lasts from the middle of May to the middle of October.Mean daily temperature ranges from approximately 6◦C to25◦C in the basin as well as in the Anjeni watershed.
The basin has a rugged topography and considerable vari-ation in altitude, ranging from 480 m to 4260 m and highlyincised by Blue Nile River and its tributaries in the north-west direction. The highlands of the basin are mainly basalticrock and the lower part is predominantly basement complexrocks. The Anjeni watershed at the highland of the basin isoriented north–south and flanked on three sides by plateauridges. Most of the watershed is on slopes ranging from 8to 30 %. The geological formation of this watershed area be-longs to the basaltic Trap series of the Tertiary volcanic erup-tions, and the topography of the area is deeply incised bystreams (Zeleke, 2000). There is high gully formation at theupper part of the watershed, where a perennial spring is lo-cated at the head of the gully and becomes a source for a rivercalled Minchet.
Alisols and Leptosols (21 %), Nitosols (16 %) and Verti-sols (15 %) are the dominant soil types in the basin with shal-low and permeable soil underlain by bedrock on the high-lands and deeper soil at the lower reaches of the basin andits tributaries (Betrie et al., 2011). The soils of Anjeni havedeveloped on the basalt and volcanic ash of the plateau. Thesouthern part of the watershed with valley floors at the outletof the watershed and the depressions of the foothills con-sist of deep and highly conductive Humic Alisols and HaplicNitosols, while moderately deep Cambisols cover the mid-dle area, and the shallow Haplic Alisols and Humic Nitosolscover the hillsides, indicating land degradation processes
Fig. 1.Watershed boundary and drainage map of Anjeni(a) with itslocation in the Blue Nile Basin(b) and in the map of Ethiopia(c).
(Zeleke, 2000). The very shallow Regosols and Leptosolssoils cover 12 % of the hillsides (Leggesse, 2009).
Before 1986, no management activities existed in the An-jeni watershed and the hydrology events were monitoredwithout any SWC (SCRP, 2000).Fanya juu(SWC structurecomprised of a bund above and a drainage ditch below thebund; Thomas and Biamah, 1991) were then constructed inearly 1986 throughout the watershed and by 1992 had gener-ally developed into terraces (Fig. 4, Hanggi, 1997).
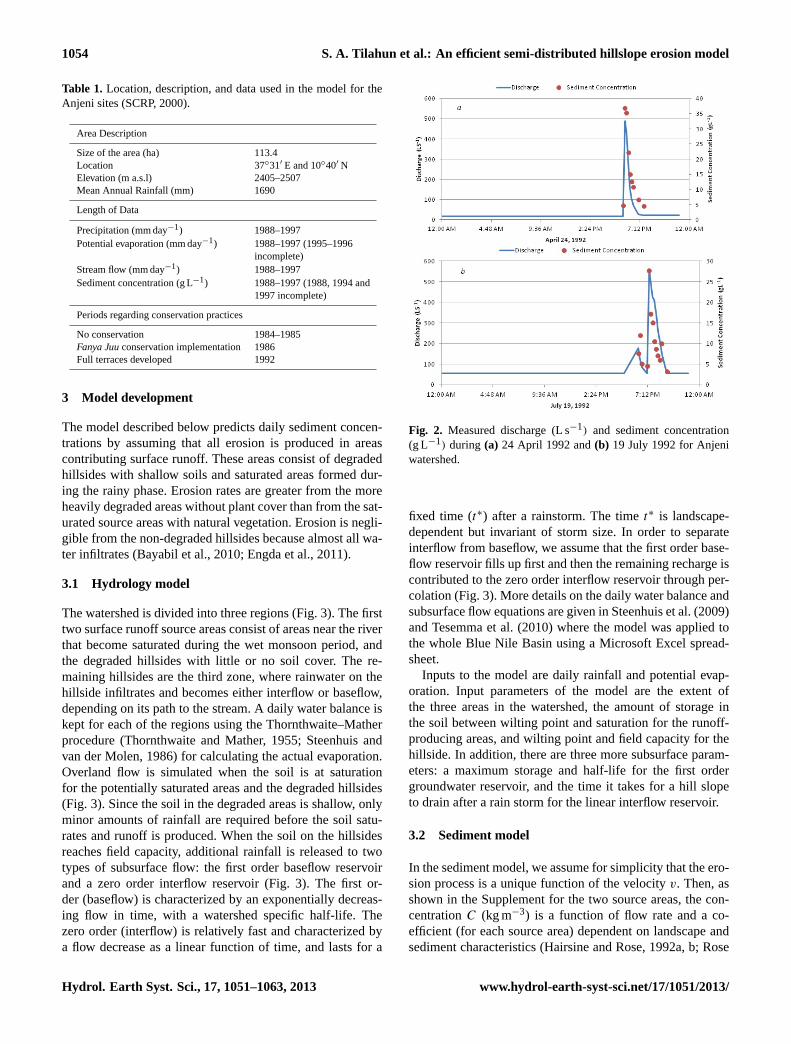
Baseflow and interflow significantly affect daily sedi-ment concentration calculations. To demonstrate this, twostorms are depicted: one in the beginning of the rainy sea-son (24 April 1992, Fig. 2a), and one later in the main rainyseason (19 July 1992, Fig. 2b). The surface runoff for bothevents is similar, with peak runoff at 400–500 L s−1 above theflow recorded prior to the beginning of the storm, with peaksediment concentrations around 30–35 g L−1. Despite thesimilar surface runoff characteristics, the April discharge was2.4× 103 m3 day−1, and for July it was 6.5× 10³ m3 day−1.The difference in magnitude is because of baseflow dischargeincreases during the rainy phase of the monsoon (10 L s−1 inApril and 50 L s−1 in July). The average daily sediment con-centration is obtained by dividing the total sediment load bythe total flow resulting in concentrations of 11 g L−1 for theApril storm and 4.4 g L−1 for the July storm. In essence, thebaseflow dilutes the peak storm concentration when simu-lated on a daily basis later in the rainy season. It is, therefore,important to incorporate the contribution of baseflow in theprediction of sediment concentration.
www.hydrol-earth-syst-sci.net/17/1051/2013/ Hydrol. Earth Syst. Sci., 17, 1051–1063, 2013
1054 S. A. Tilahun et al.: An efficient semi-distributed hillslope erosion model
Table 1. Location, description, and data used in the model for theAnjeni sites (SCRP, 2000).
Area Description
Size of the area (ha) 113.4Location 37◦31′ E and 10◦40′ NElevation (m a.s.l) 2405–2507Mean Annual Rainfall (mm) 1690
Length of Data
Precipitation (mm day−1) 1988–1997Potential evaporation (mm day−1) 1988–1997 (1995–1996
incomplete)Stream flow (mm day−1) 1988–1997Sediment concentration (g L−1) 1988–1997 (1988, 1994 and
1997 incomplete)
Periods regarding conservation practices
No conservation 1984–1985Fanya Juuconservation implementation 1986Full terraces developed 1992
3 Model development
The model described below predicts daily sediment concen-trations by assuming that all erosion is produced in areascontributing surface runoff. These areas consist of degradedhillsides with shallow soils and saturated areas formed dur-ing the rainy phase. Erosion rates are greater from the moreheavily degraded areas without plant cover than from the sat-urated source areas with natural vegetation. Erosion is negli-gible from the non-degraded hillsides because almost all wa-ter infiltrates (Bayabil et al., 2010; Engda et al., 2011).
3.1 Hydrology model
The watershed is divided into three regions (Fig. 3). The firsttwo surface runoff source areas consist of areas near the riverthat become saturated during the wet monsoon period, andthe degraded hillsides with little or no soil cover. The re-maining hillsides are the third zone, where rainwater on thehillside infiltrates and becomes either interflow or baseflow,depending on its path to the stream. A daily water balance iskept for each of the regions using the Thornthwaite–Matherprocedure (Thornthwaite and Mather, 1955; Steenhuis andvan der Molen, 1986) for calculating the actual evaporation.Overland flow is simulated when the soil is at saturationfor the potentially saturated areas and the degraded hillsides(Fig. 3). Since the soil in the degraded areas is shallow, onlyminor amounts of rainfall are required before the soil satu-rates and runoff is produced. When the soil on the hillsidesreaches field capacity, additional rainfall is released to twotypes of subsurface flow: the first order baseflow reservoirand a zero order interflow reservoir (Fig. 3). The first or-der (baseflow) is characterized by an exponentially decreas-ing flow in time, with a watershed specific half-life. Thezero order (interflow) is relatively fast and characterized bya flow decrease as a linear function of time, and lasts for a
Fig. 2. Measured discharge (L s−1) and sediment concentration(g L−1) during (a) 24 April 1992 and(b) 19 July 1992 for Anjeniwatershed.
fixed time (t∗) after a rainstorm. The timet∗ is landscape-dependent but invariant of storm size. In order to separateinterflow from baseflow, we assume that the first order base-flow reservoir fills up first and then the remaining recharge iscontributed to the zero order interflow reservoir through per-colation (Fig. 3). More details on the daily water balance andsubsurface flow equations are given in Steenhuis et al. (2009)and Tesemma et al. (2010) where the model was applied tothe whole Blue Nile Basin using a Microsoft Excel spread-sheet.
Inputs to the model are daily rainfall and potential evap-oration. Input parameters of the model are the extent ofthe three areas in the watershed, the amount of storage inthe soil between wilting point and saturation for the runoff-producing areas, and wilting point and field capacity for thehillside. In addition, there are three more subsurface param-eters: a maximum storage and half-life for the first ordergroundwater reservoir, and the time it takes for a hill slopeto drain after a rain storm for the linear interflow reservoir.
3.2 Sediment model
In the sediment model, we assume for simplicity that the ero-sion process is a unique function of the velocityv. Then, asshown in the Supplement for the two source areas, the con-centrationC (kg m−3) is a function of flow rate and a co-efficient (for each source area) dependent on landscape andsediment characteristics (Hairsine and Rose, 1992a, b; Rose
Hydrol. Earth Syst. Sci., 17, 1051–1063, 2013 www.hydrol-earth-syst-sci.net/17/1051/2013/

S. A. Tilahun et al.: An efficient semi-distributed hillslope erosion model 1055
t
tBSQ tB
)exp(1
*
2,1,02
*
max
**12
tI
t
PercQ
BSBSwhen
A
Q1 E
Smax
P
Parameters Smax of three areas
A of three areas BSmax
*
Hill slope infiltration area
P P P
Saturated area Hill slope degraded area
Q1
Q2
Base flow (QB)
Interflow (QI)
Percolation (Perc)
BSmax
QB
QI
푆 = 푆 ∆ 푒푥푝푃 − 퐸푆 ∆푡
푆 = 푃 − 퐸 + 푆 ∆
푸ퟐ = 푺풕 − 푺풎풂풙
when P<Ep
when P >Ep
when St > Smax
푆 = 푆 ∆ 푒푥푝푃 − 퐸푆 ∆푡
푆 = 푃 − 퐸 + 푆 ∆
푸ퟏ = 푺풕 − 푺풎풂풙
when P<Ep
when P >Ep
when St > Smax
A Recharge(Rech) when St > Smax
Smax
E P
A
Smax
Q2 E P
Bedrock
Fig. 3.Schematic of the hydrology model whereP is precipitation;Ep is potential evaporation;A is area fraction for components of1-saturated area, 2-degraded area and 3-infiltration areas;Smax ismaximum water storage capacity of the three areas; BSmax is max-imum baseflow storage of linear reservoir;t1/2 (= 0.69 /α) is thetime it takes in days to reduce the volume of the baseflow reservoirby a factor of two under no recharge condition; andτ∗ is the dura-tion of the period after a single rainstorm (until interflow ceases).
et al., 1993; Siepel et al., 2002; Ciesiolka et al., 1995 and Yuet al., 1997).
C = aQn, (1)
whereQ is the runoff rate per unit area from each sourcearea (m day−1), anda is a constant which is a function of theslope, Manning’s roughness coefficient, slope length, the ef-fective deposition and vegetation cover (Yu et al., 1997). Theexponentn is 0.4 when the width of flow is much larger thanthe water depth on the runoff-producing areas (Ciesiolka etal., 1995 and Yu et al., 1997). As water depth increases,a
essentially becomes independent of the runoff rate and canbe taken as a constant such as in this application where weare interested in sediment concentration at the outlet of wa-tersheds of over 100 ha (Lisle et al., 1996).
Sediment yield, (t day−1 ha−1) Yi , for each of the tworunoff source areas,i, then becomes
Yi = aQiQ0.4i . (2)
To calculate the suspended sediment concentration at the wa-tershed outlet, we note that the total dischargeQ from thethree areas at timet can be written in terms of the contribu-tions of the three areas delineated in the watershed:
Q = A1Q1 + A2Q2 + A3 (QB + QI) , (3)
whereQ1 and Q2 are the runoff rates expressed in depthunits for contributing area;A1 is the fractional saturated area;andA2 is the fractional degraded area.A3 is the fractionalcontributing area for baseflow,QB and interflow,QI .
Sediment yield in the stream depends on the amount ofsuspended sediment delivered by each component of thestream flow. The daily sediment yield equation in its mostgeneral form is
Y = A1Q1C1 + A2Q2C2 + A3 (QBCB + QICI) , (4)
whereC1and C2 are the sediment concentration in runofffrom the saturated area, and degraded area, respectively;CBis the sediment concentration in the baseflow andCI the con-centration in interflow. Recalling that sediment concentra-tion,C, is related to the discharge as shown in Eq. (1), Eq. (4)can be rewritten as
Y = a1A1Qn+11 + a2A2Q
n+12 + A3
(aBQn+1
B + aIQn+1I
), (5)
which simplifies to a relationship between sediment yield anddischarge forn = 0.4
Y = a1A1Q1.41 + a2A2Q
1.42 + A3
(aBQ1.4
B + aIQ1.4I
). (6)
The superscript ofQ in Eq. (6) is within the range from 0.5to 2 in the most common sediment transport capacity models(Prosser and Rustomji, 2000). By dividing Eq. (6) by the totaldischarge (Eq. 3) and taking the sediment concentration inthe base and interflow as zero (i.e.,aB = 0 andaI = 0), thesediment concentration can be found as
C =a1A1Q
1.41 + a2A2Q
1.42
A1Q1 + A2Q2 + A3 (QB + QI). (7)
All parameters in Eq. (7) can be obtained from the hydrologicsimulation, with the exception ofa1 anda2, which need to becalibrated with existing field data.
3.3 Input data
Since the 1984 establishment of the Anjeni micro-watershedsby the Soil Conservation Research Project (SCRP), fine-resolution data on climate, hydrology, and suspended sedi-ment from both river and test plots have been collected. In ad-dition, an expansive database has been established that servesas a data source to carry out hydrological, soil erosion, andconservation research activities at regional, national, and in-ternational levels. This watershed provided the most compre-hensive data of daily rainfall, potential evaporation, streamflow, and sediment concentrations (Mitiku et al., 2006).
www.hydrol-earth-syst-sci.net/17/1051/2013/ Hydrol. Earth Syst. Sci., 17, 1051–1063, 2013

1056 S. A. Tilahun et al.: An efficient semi-distributed hillslope erosion model
Table 2. Calibrated parameters for daily and 10-day stream flows and sediment concentration modeling in the Anjeni watershed and BlueNile Basin, respectively.
Calibrated values
BlueComponents Description Parameters Unit Anjeni Nile
Hydrology Saturated area AreaA1 % 2 20Smax in A1 mm 200 200
Degraded area AreaA2 % 14 20Smax in A2 mm 10 10
Hill side AreaA3 % 50 60Smax in A3 mm 100 300
Subsurface flow parameters BSmax mm 100 20t1/2 days 70 35τ∗ days 10 140
Sediment Subsurface flow aB (g L−1) (mm day−1)−0.4 0 0aI (g L−1) (mm day−1)−0.4 0 0
Saturated area a1 (g L−1) (mm day−1)−0.4 0.2 0.2Degraded area a2 (g L−1) (mm day−1)−0.4 3.40 1.2
Ai is area fraction for components of 1-saturated area, 2-degraded area and 3-infiltration zone;Smax is maximum water storage capacity;t1/2is the time it takes in days to reduce the volume of the baseflow reservoir by a factor of two under no recharge condition; BSmax is maximumbaseflow storage of linear reservoir;τ∗ is the duration of the period after a single rainstorm until interflow ceases;ai is calibrated parameter insediment concentration model for components of baseflow (B), interflow (I), saturated area (1) and degraded area (2).
Stream flow and sediment concentration were measuredat a station located at the outlet of the Anjeni watershedby SCRP. The depth of water was taken with float-actuatedrecorders. The water level in the stream was measured at08:00 a.m. LT daily. In case of peak stream flow events, wa-ter level measurements and sediment samples were recordedat ten-minute intervals during the event and every 30 minwhen water level decreased. Discharge was evaluated us-ing the relation between water level and stream discharge(Bossahart, 1997). The river stage–discharge relationshipwas determined using salt dilution and current meter meth-ods.
To determine sediment concentration during the storm,one-liter samples were taken from the river at the gaugingstation. Sampling started once the water at the gauging sta-tion looked turbid (brown), and the sampling continued at10 min intervals. When runoff became clearer, the samplinginterval was extended to thirty minutes, and sampling con-tinued until the runoff was visibly sediment-free. The col-lected water samples were filtered using filter paper, sun-dried, and oven dried, and finally weighed to calculate thenet dry soil loss of the sample. Event-based sediment yieldswere summed over a daily period to determine daily sedi-ment load. Daily sediment concentration was determined bydividing the daily sediment load by the total discharge dur-ing that day. These were then compared to the daily predictedsediment concentrations.
3.4 Model calibration and validation
3.4.1 Data
We first calibrate daily discharge values with the water bal-ance model and subsequently the sediment concentration val-ues with the sediment model of Eq. (7). The data used inthe model is summarized in Table 1. In Anjeni, the periodfrom 1988 to 1997 was used as data source for daily rain-fall, potential evaporation and stream flow in this study. Thedata from 1988 and 1990 were used for calibration of the wa-ter balance model (Table 2) and from 1989, 1991–1994 and1997 for validation. The climate data for the years 1995 and1996 were incomplete and excluded from the model devel-opment processes.
For the sediment modeling, the year 1990 was used forcalibration and the period 1991–1993 was used for valida-tion. The sediment concentration data of 1989 was excludedbecause of very low sediment concentration measurements.The low concentrations might have been caused by soil bunds(Fanya juu) installed in the watershed in 1986 that capturedall sediment effectively. Equilibrium was likely establishedin 1990, when the terraces were formed behind the bunds inthe runoff source area (Hanggi, 1997).
Available sediment concentration data for the Blue Nile atthe Sudan border was limited to three years: 1993, 2003 and2004. The period of 1993 was used to calibrate both hydrol-ogy and sediment models in the Blue Nile Basin while theother two years – 2003 and 2004 – were used for validation.
Hydrol. Earth Syst. Sci., 17, 1051–1063, 2013 www.hydrol-earth-syst-sci.net/17/1051/2013/

S. A. Tilahun et al.: An efficient semi-distributed hillslope erosion model 1057
Fig. 4. Flank portion of the Anjeni watershed at the background,which was developed to full terraces fromFanya juuconservationpractices and the deep soil with saturated area at the forefront.
3.4.2 Methods of calibration and validation
All nine parameters were calibrated for the hydrology model(Table 2). Initial values for calibrating parameters were basedon Steenhuis et al. (2009) and Collick et al. (2009). These ini-tial values were changed manually through randomly varyingcalibrated parameters in order that the best “closeness” or“goodness-of-fit” was achieved between simulated and ob-served subsurface and overland flow in the watershed. Thegoodness-of-fit and the model performance were measuredand evaluated using the Nash–Sutcliffe Efficiency (NSE)coefficient, coefficient of determination (R2) and the RootMean Squared Error (RMSE).
For partitioning rainfall into surface runoff, size (A) andmaximum storage capacity (Smax) are the important parame-ters considered in the three areas. For the subsurface reser-voirs, the parameters considered were half-life (t1/2) andmaximum storage capacity (BSmax) of a linear aquifer andthe drainage time of the zero order reservoir (τ ∗).
In the sediment model, daily sediment concentration wascomputed first by calculating daily sediment load then divid-ing the daily load by the total daily stream flow using Eq. (7).In the equation, there are two calibration parameters consist-ing of the constants for each of the two runoff source areasa1 anda2. These constants are changed manually in order toget a best fit between measured and simulated daily sedimentconcentration.
4 Results and discussion
The calibrated parameters are shown in Table 2 and thegoodness of fit as determined by the Nash–Sutcliffe Effi-ciency (NSE), coefficient of determinationR2 and root meansquared error (RMSE) for the hydrology and sediment model
Fig. 5. (a)Predicted and observed daily stream flow for Anjeni wa-tershed;(b) calibrated discharge using 1988 and 1990 daily data;and(c) validated discharge (shown only for 1991 and 1992).
are presented in Table 3. A comparison of predicted and ob-served daily stream flow for the Anjeni watershed is shownin Fig. 5 and in the Supplement Fig. S1 and predicted andmeasured sediment concentration in Fig. 6 and Fig. S2 in theSupplement. For the Blue Nile Basin, Fig. 7 shows both pre-dicted and observed 10-day stream flow, and 10-day averagesediment concentration was shown in Fig. 8.
4.1 Hydrology model
The hydrology model performed quite well (Table 3) forboth the Anjeni watershed (Fig. 5) and the Blue Nile Basin(Fig. 7). The model calibration suggests (Table 2) that 14 %of the Anjeni watershed and 20 % of the Blue Nile Basin con-sist of degraded area with shallow soil or exposed hardpan,which requires only a little rain to generate direct runoff (i.e.,
www.hydrol-earth-syst-sci.net/17/1051/2013/ Hydrol. Earth Syst. Sci., 17, 1051–1063, 2013

1058 S. A. Tilahun et al.: An efficient semi-distributed hillslope erosion model
Table 3.Runoff (Q) and sediment concentration (C) simulation efficiency as evaluated by statistical measures for daily time step in Anjeniwatershed and Blue Nile Basin.
Stream flow (mm) Sediment Concentration (g L−1)Calibration Validation Calibration Validation
Site Year 1988 & 1990 1989 & 1991–1997 1990 1991–1993
Anjeni Mean Observed 2.1 1.9 0.72 0.67Predicted 2.3 1.9 0.65 0.65
Standard Observed 3.2 2.7 2.24 2.19Deviation Predicted 3.6 2.8 1.94 1.78
Statistical NSE 0.86 0.80 0.78 0.64Parameters R2 0.88 0.82 0.80 0.67
RMSE 1.6 1.5 1.66 1.32
Blue Nile Basin Year 1993 2003–2004 1993 2003–2004
Mean Observed 9.7 9.4 0.85 1.28Predicted 9.5 9.2 1.26 0.92
Standard Observed 9.9 9.9 1.51 2.32Deviation Predicted 11.8 9.2 1.98 1.87
Statistical NSE 0.93 0.92 0.76 0.76Parameters R2 0.97 0.93 0.88 0.80
RMSE 2.6 2.7 0.73 1.89
Smax = 10 mm) and approximately 2 % of Anjeni and 20 %of Blue Nile Basin are saturated bottom lands that needed200 mm of effective precipitation to generate runoff (i.e.,Smax = 200 mm). The hillside, or the infiltration (recharge)areas, in Anjeni and Blue Nile Basin represent 50 % and60 %, respectively, of the total area and require 100 mmand 300 mm of effective precipitation to reach field capac-ity. Thirty-four percent of the discharge in the Anjeni water-shed is not accounted for and leaves the watershed as deepregional flow through the deep soil profile at the outlet of thewatershed, while this cannot be (and is not) the case for theBlue Nile Basin.
In the Anjeni watershed, the small proportion of satu-rated area is consistent with the piezometer readings ofLeggesse (2009) that showed a deep water table throughoutthe uniformly steep watershed except in very close proxim-ity to the stream (Fig. 4). This is unlike the Maybar (Bayabilet al., 2010) and Andit Tid (Engda et al., 2011) watersheds,where large flat areas near the river usually saturate duringthe rainy season with annual precipitation over 500 mm (Liuet al., 2008). In the Anjeni watershed, where the soils aredeep at the middle and lower part and there are no flat areas,all the water that otherwise would have saturated the soil,drains directly into the stream. The 14 % degraded area isslightly overpredicting the shallow soil, covering 12 % thewatershed (Zeleke, 2000; Leggesse, 2009). This is consis-tent with sensitivity results on the validation years, indicat-ing a smaller degraded area than indicated by the calibrationwould fit better. The maximum baseflow storage (BSmax) was
calibrated to 100 mm andτ ∗ was 10 days for the watershed.The half-life of baseflow storage was set to be 70 days. Inthe Blue Nile,τ ∗ was 140 days, much greater than in Anjeni,since the larger basin receives more deep flows than are inter-cepted by the Blue Nile River. However, the half-life of theBlue Nile Basin was 35 days, two times less than the valuefor the Anjeni watershed. The slower response for Anjeniwas expected because the rainfall that does not flow throughits outlet takes a longer path to reach the river system.
The good fit in Figs. 5 and 7 and Figs. S1 and S2 inthe Supplement was confirmed by the performance statistics.The R2, NSE and RMSE values for Anjeni (Table 3) were0.88, 0.86 and 1.6 mm, for calibration and 0.82, 0.80 and1.5 mm for validation, indicating that the model has reason-ably captured the watershed response to rainfall. For the caseof the Blue Nile, theR2, NSE and RMSE values were 0.97,0.93 and 2.6 mm for calibration and 0.93, 0.92 and 2.7 mmfor validation.
Despite the good statistics, the model overpredicted lowflows and underpredicted flows of greater than 20 mm day−1
during the calibration period for Anjeni (Figs. 5a, b and 7a).The same is true for the Blue Nile Basin, where the peakflows during August were underestimated during the calibra-tion period, 1993 (Fig. 7a). During validation (Figs. 5c and7b), there is a reasonable agreement between observed andpredicted low flows, especially for the Blue Nile Basin in2003, even though there is underprediction for flows greaterthan 20 mm day−1 for Anjeni. The underprediction of peakflows is likely caused by an expansion of runoff-producing
Hydrol. Earth Syst. Sci., 17, 1051–1063, 2013 www.hydrol-earth-syst-sci.net/17/1051/2013/
S. A. Tilahun et al.: An efficient semi-distributed hillslope erosion model 1059
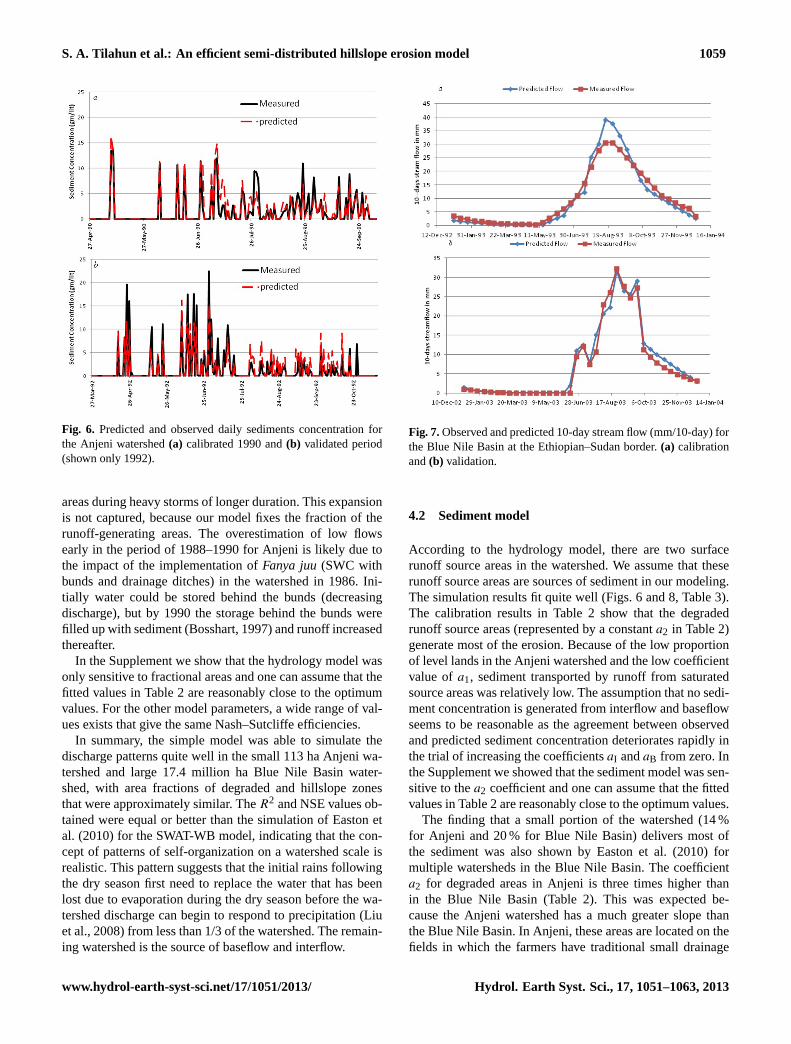
Fig. 6. Predicted and observed daily sediments concentration forthe Anjeni watershed(a) calibrated 1990 and(b) validated period(shown only 1992).
areas during heavy storms of longer duration. This expansionis not captured, because our model fixes the fraction of therunoff-generating areas. The overestimation of low flowsearly in the period of 1988–1990 for Anjeni is likely due tothe impact of the implementation ofFanya juu(SWC withbunds and drainage ditches) in the watershed in 1986. Ini-tially water could be stored behind the bunds (decreasingdischarge), but by 1990 the storage behind the bunds werefilled up with sediment (Bosshart, 1997) and runoff increasedthereafter.
In the Supplement we show that the hydrology model wasonly sensitive to fractional areas and one can assume that thefitted values in Table 2 are reasonably close to the optimumvalues. For the other model parameters, a wide range of val-ues exists that give the same Nash–Sutcliffe efficiencies.
In summary, the simple model was able to simulate thedischarge patterns quite well in the small 113 ha Anjeni wa-tershed and large 17.4 million ha Blue Nile Basin water-shed, with area fractions of degraded and hillslope zonesthat were approximately similar. TheR2 and NSE values ob-tained were equal or better than the simulation of Easton etal. (2010) for the SWAT-WB model, indicating that the con-cept of patterns of self-organization on a watershed scale isrealistic. This pattern suggests that the initial rains followingthe dry season first need to replace the water that has beenlost due to evaporation during the dry season before the wa-tershed discharge can begin to respond to precipitation (Liuet al., 2008) from less than 1/3 of the watershed. The remain-ing watershed is the source of baseflow and interflow.
Fig. 7.Observed and predicted 10-day stream flow (mm/10-day) forthe Blue Nile Basin at the Ethiopian–Sudan border.(a) calibrationand(b) validation.
4.2 Sediment model
According to the hydrology model, there are two surfacerunoff source areas in the watershed. We assume that theserunoff source areas are sources of sediment in our modeling.The simulation results fit quite well (Figs. 6 and 8, Table 3).The calibration results in Table 2 show that the degradedrunoff source areas (represented by a constanta2 in Table 2)generate most of the erosion. Because of the low proportionof level lands in the Anjeni watershed and the low coefficientvalue ofa1, sediment transported by runoff from saturatedsource areas was relatively low. The assumption that no sedi-ment concentration is generated from interflow and baseflowseems to be reasonable as the agreement between observedand predicted sediment concentration deteriorates rapidly inthe trial of increasing the coefficientsaI andaB from zero. Inthe Supplement we showed that the sediment model was sen-sitive to thea2 coefficient and one can assume that the fittedvalues in Table 2 are reasonably close to the optimum values.
The finding that a small portion of the watershed (14 %for Anjeni and 20 % for Blue Nile Basin) delivers most ofthe sediment was also shown by Easton et al. (2010) formultiple watersheds in the Blue Nile Basin. The coefficienta2 for degraded areas in Anjeni is three times higher thanin the Blue Nile Basin (Table 2). This was expected be-cause the Anjeni watershed has a much greater slope thanthe Blue Nile Basin. In Anjeni, these areas are located on thefields in which the farmers have traditional small drainage
www.hydrol-earth-syst-sci.net/17/1051/2013/ Hydrol. Earth Syst. Sci., 17, 1051–1063, 2013

1060 S. A. Tilahun et al.: An efficient semi-distributed hillslope erosion model
Fig. 8.The 10-day average sediment concentration (g L−1) (shownin b) for the Blue Nile Basin at the Ethiopian–Sudan border.(a) cal-ibration and(b) validation.
(or cultural) ditches on shallow and slowly permeable soils(Leggesse, 2009) while in the Blue Nile Basin, the degradedareas are located at Mount Choke in East and West Gojamwhere Anjeni is located, Lake Tana subbasin, Jema subbasinin Wolo and Abay Gorge in East Wollega (Hydrosult Inc. etal., 2006).
Daily suspended sediment concentrations in the Anjeniwatershed were simulated well. The coefficient of determi-nation,R2, was 0.8 for calibration and 0.67 for validation.The Nash–Sutcliffe efficiency of 0.78 for calibration and 0.64for validation. These results are comparable with the workof Easton et al. (2010) in which the modified SWAT-WBfor monsoonal climates was used and that of Zeleke (2000)which used WEPP. Our model uses only two parameterswhereas SWAT and WEPP models incorporate more calibra-tion parameters, such as plant cover, slope, soil and watermanagement or soil type. Since such factors interact to affectsoil erosion at a spot, choosing the correct values for eachparticular location is a very challenging task when only theintegral sediment signal at the outlet is known. This makessediment modeling very difficult. Therefore, getting theserelatively high coefficients of determination and NSE fordaily data using only two calibration parameters is very de-sirable for data scarce regions.
Despite the good fit, the model underpredicted duringhigh sediment concentration measurements and overesti-mated during low sediment concentration measurements inAnjeni (Figs. 6 and 8) during the validation period specifi-cally in 1992 and 1993. This is due to, first, the under- andoverestimations in the hydrology model being propagated tothe simulation of sediment concentration. Secondly, it is re-ported in Bosshart (1997) that poor maintenance of SWC inthe watershed during these years resulted in higher sedimentconcentration values.
The incorporation of baseflow and interflow in the modelhelps to capture the lower sediment concentration after Julyfor Anjeni Watershed (Figs. 6 and 8). In the Blue Nile Basin,it seems that baseflow and interflow play an important rolein diluting the sediment after July and decreasing the sedi-ment concentration. The drop and subsequent low sedimentconcentration at this time is similarly reported in Tigray, inthe northern part of Ethiopia, by Vanmaercke et al. (2010).The authors argued that sediment depletion during this timereduced the sediment concentration in the streams. Others(Descheemaeker et al., 2006; Bewket and Sterk, 2003) sug-gested that the lower sediment concentrations are a result ofthe increased plant cover. Although this effect could exist,Tebebu et al. (2010) showed that such a relationship does notexist for Debre Mawi watershed in Blue Nile Basin.
The low sediment concentration measurements in 1989due to SWC were difficult to capture using the model, andhence excluded from the data set. This justifies that incor-porating more calibration parameters, such as SWC manage-ment for the different runoff areas, might improve the sedi-ment concentration prediction.
5 Conclusions
A simplified watershed sediment model, coupled with a hy-drology model, was developed and used to simulate sedimentconcentrations and runoff at two widely varying scales. Suchsimplified models that require very few calibration parame-ters to simulate runoff and sediment transport are importantin data-limiting environments. Using these models, it waspossible to identify the proportion of runoff-contributing ar-eas, which are also sources of sediment. The analysis showedthat the model could capture quite well the variability in dis-charge and sediment concentrations using parameter valuesthat did not vary greatly between the scales. The model basi-cally assumes in its simplest form that a watershed in a mon-soon climate wets up after the dry season and produces in-creasing amounts of base- and interflow as the rainy seasonprogresses. At the same time, this dilutes the sediment in therivers that originates mainly from relatively small portionsof degraded hillsides. More research is needed into how themodel parameters vary between scales and watershed char-acteristics.
Hydrol. Earth Syst. Sci., 17, 1051–1063, 2013 www.hydrol-earth-syst-sci.net/17/1051/2013/

S. A. Tilahun et al.: An efficient semi-distributed hillslope erosion model 1061
Supplementary material related to this article isavailable online at:http://www.hydrol-earth-syst-sci.net/17/1051/2013/hess-17-1051-2013-supplement.pdf.
Acknowledgements.Funding was provided by the InternationalFoundation for Science (IFS), Higher Education for Development(HED) and USDA International Science and Education (ISE)program. The runoff and sediment data were made available byAmhara Regional Agricultural Research Institute. Finally, wewould like to thank Hans Hurni for providing the information werequested and foresight in establishing the Anjeni watershed forrunoff and sediment data collection.
Edited by: E. Zehe
References
Bayabil, H. K., Tilahun, S. A., Collick, A. S., and Steenhuis, T. S.:Are runoff processes ecologically or topographically driven inthe Ethiopian Highlands? The case of the Maybar, Ecohydrology,3, 457–466,doi:10.1002/eco.170, 2010.
Betrie, G. D., Mohamed, Y. A., van Griensven, A., and Srini-vasan, R.: Sediment management modelling in the Blue NileBasin using SWAT model, Hydrol. Earth Syst. Sci., 15, 807–818,doi:10.5194/hess-15-807-2011, 2011.
Bewket, W. and Sterk, G.: Assessment of soil erosion in cultivatedfields using a survey methodology for rills in Chemoga water-shed, Ethiopia, Agr. Ecosyst. Environ., 97, 81–93, 2003.
Borga, M., Anagnostou, E. N., Bloeschl, G., and Creutin, J.-D.: Flash flood forecasting, warning and risk management:the HYDRATE project, Environ. Sci. Pol., 14, 834–844,doi:10.1016/j.envsci.2011.05.017, 2011.
Bosshart, U.: Catchment Discharge and Suspended Sediment Trans-port as Indicators of Physical Soil and Water Conservation inthe Minchet Catchment, Anjeni Research Unit, Soil Conserva-tion Research Report 40, University of Berne, Berne, Switzer-land, 1997.
Ciesiolka, C. A. A., Coughlan, K. J., Rose, C. W., Escalante, M.C., Hashim, G. M., Paningbatan Jr., E. P., and Sombatpanit, S.:Methodology for a multi-country study of soil erosion manage-ment, Soil Technol., 8, 179–192, 1995.
Champion, A. M.: Soil Erosion in Africa, Geogr. J., 82, 131–139,1933.
Collick, A. S., Easton, Z. M., Ashagrie, T., Biruk, B., Tilahun, S.,Adgo, E., Awulachew, S. B., Zeleke, G., and Steenhuis, T. S.: Asimple semi distributed water balance model for the EthiopianHighlands, Hydrol. Process., 23, 3718–3727, 2009.
Dahlke, H. E., Easton, Z. M., Walter, M. T., and Steenhuis, T. S.:Field Test of the Variable Source Area Interpretation of the CurveNumber Rainfall-Runoff Equation, J. Irrig. Drain. Eng.-ASCE,138, 235–244, 2012.
de Alwis, D. A., Easton, Z. M., Dahlke, H. E., Philpot, W.D., and Steenhuis, T. S.: Unsupervised classification of satu-rated areas using a time series of remotely sensed images, Hy-drol. Earth Syst. Sci., 11, 1609–1620,doi:10.5194/hess-11-1609-2007, 2007.
Descheemaeker, K., Nyssen, J., Rossi, J., Poesen, J., Haile, M.,Raes, D., Muys, B., Moeyersons, J., and Deckers, S.: Sedimentdeposition and pedogenesis in exclosures in the Tigray High-lands, Ethiopia, Geoderma, 132, 291–314, 2006.
Dooge, J. C. I.: Looking for Hydrologic Laws, Water Resour. Res.,22, S46–S58, 1986.
Dooge, J. C. I.: Bringing it all together, Hydrol. Earth Syst. Sci., 9,3–14,doi:10.5194/hess-9-3-2005, 2005.
Easton, Z. M., Fuka, D. R., White, E. D., Collick, A. S., Biruk Asha-gre, B., McCartney, M., Awulachew, S. B., Ahmed, A. A., andSteenhuis, T. S.: A multi basin SWAT model analysis of runoffand sedimentation in the Blue Nile, Ethiopia, Hydrol. Earth Syst.Sci., 14, 1827–1841,doi:10.5194/hess-14-1827-2010, 2010.
Engda, T. A., Bayabil, H. K., Legesse, E. S., Ayana, E. K., Tilahun,S. A., Collick, A. S., Easton, Z. M., Rimmer, A., Awulachew, S.B., and Steenhuis, T. S.: Watershed hydrology of the (semi) hu-mid Ethiopian Highlands, in: Nile River: Hydrology, Climate andLand Use, edited by: Melesse, A., Springer Science Publisher,New York, 2011.
Eweg, H. P. A., Van Lammeren, R., Deurloo, H., and Woldu, Z.: An-alyzing degradation and rehabilitation for sustainable land man-agement in the highlands of Ethiopia, Land Degrad. Dev., 9, 529–542, 1998.
Fleitmann, D., Dunbar, R. B., McCulloch, M., Mudelsee, M.,Vuille, M., McClanahan, T. R., Cole, J. E., and Eggins,S.: East African soil erosion recorded in a 300 year oldcoral colony from Kenya, Geophys. Res. Lett., 34, L04401,doi:10.1029/2006GL028525, 2007.
Garzanti, E., Ando, S., Vezzoli, G., Ali Abdel Megid, A., and ElKammar, A.: Petrology of Nile River sands (Ethiopia and Su-dan): sediment budgets and erosion patterns, Earth Planet. Sc.Lett., 252, 327–341, 2006.
Hanggi, F.: Temporal and spatial variations of soil erosion in the Re-search Units Anjeni and Andit Tid: case studies of test plot soilerosion in the north western and central highlands of Ethiopia,SCRP research report 37, University of Berne, Berne, Switzer-land, 1997.
Hairsine, P. B. and Rose, C. W.: Modeling water erosion due to over-land flow using physical principles 1. Sheet flow, Water Resour.Res., 28, 237–243, 1992a.
Hairsine, P. B. and Rose, C. W.: Modeling water erosion due tooverland flow using physical principles 2. Rill flow, Water Re-sour. Res., 28, 245–250, 1992b.
Haregeweyn, N. and Yohannes, F.: Testing and evaluation of theagricultural non-point source pollution model (AGNPS) on Au-gucho catchment, Western Hararghe, Ethiopia, Agr. Ecosyst. En-viron., 99, 201–212, 2003.
Harpold, A. A., Lyon, S. W., Troch, P. A., and Steenhuis, T. S.:The hydrological effects of lateral preferential flow paths in aglaciated watershed in the Northeastern United States, VadoseZone J., 9, 397–414, 2010.
He, Y., Bardossy, A., and Zehe, E.: A catchment classificationscheme using local variance reduction method, J. Hydrol., 411,140–154, 2011.
Hudson, N. W.: Erosion control research. Progress report on ex-periments at Henderson Research Station, 1953–1956, RhodesiaAgric. Jour., 54, 297–323, 1957.
Hudson, N. W.: Raindrop size distribution in high intensity storms.Rhod. J. Agr. Res., 1, 6–11, 1963.
www.hydrol-earth-syst-sci.net/17/1051/2013/ Hydrol. Earth Syst. Sci., 17, 1051–1063, 2013

1062 S. A. Tilahun et al.: An efficient semi-distributed hillslope erosion model
Hudson, N. W.: Soil and Water conservation in semi-arid areas, SoilResources, Management and Conservation Service, FAO Landand Water Development Division, Food and Agriculture Organi-zation of the United Nations, Rome, 1987.
Hurni, H.: An ecosystem approach to soil conservation, in: Soil Ero-sion and Conservation, edited by: El-Swaify, S. A., Moldenhauer,W. C., and Lo, A., Soil Conservation Society of America, Ankey,Iowa, 759–771, 1985.
Hurni, H.: Degradation and conservation of the resources in theEthiopian Highlands, Mt. Res. Dev., 8, 123–130, 1988.
Hydrosult Inc., Techsult, DHV, their Associates Nile Consult, Co-matex Nilotica, and T and A Consulting: Trans-Boundary Anal-ysis: Abay – Blue Nile Sub-basin. NBI-ENTRO (Nile BasinInitiative-Eastern Nile Technical Regional Organization), 2006.
Kandel, D., Western, A., Grayson, R., and Turral, H.: Testing cur-rent generation soil erosion models at two minute and dailyscales using plot scale data from a mid-hill catchment ofNepal, in: Integrating Models for Natural Resources Manage-ment Across Disciplines, Issues and Scales, edited by: Ghassemi,F., Post, D., Sivapalan, M., and Vertessy, R., Proceedings of theInternational Congress on Modelling and Simulation (MODSIM2001), Volume 1: Natural Systems Modelling and SimulationSociety of Australia and New Zealand Inc., Australian NationalUniversity, Canberra, Australia, 365–370, 2001.
Kim, Y.-J., Darnault, C. J. G., Bailey, N. O., Parlange, J.-Y., andSteenhuis, T. S.: Equation for describing solute transport in fieldsoils with preferential flow paths, Soil Sci. Soc. Am. J., 69, 291–300, 2005.
Klaus, J. and Zehe, E.: A novel explicit approach to model bro-mide and pesticide transport in connected soil structures, Hy-drol. Earth Syst. Sci., 15, 2127–2144,doi:10.5194/hess-15-2127-2011, 2011.
Kung, K.-J. S., Steenhuis, T. S., Kladivko, E. J., Gish, T. J., Buben-zer, G., and Helling, C. S.: Impact of Preferential Flow on theTransport of Adsorbing and Non-Adsorbing Tracers, Soil Sci.Soc. Am. J., 64, 1290–1296, 2000.
Lal, R.: Soil erosion and transport research in tropical Africa, Hy-drolog. Sci., 30, 239–256, 1985.
Leggesse, E. S.: Modelling Rainfall-Runoff Relationships for theAnjeni watershed in the Blue Nile Basin, A Thesis Presented tothe Faculty of the Graduate School of Cornell University In Par-tial Fulfillment of the Requirements for the Degree of Master ofProfessional Studies, Ithaca, NY, 2009.
Lisle, I. G., Coughlan, K. J., and Rose, C. W.: GUPRO 3.1: Aprogram for calculating particle size and settling characteristics,ENSWorking Paper 7/96. Faculty of Environmental Sciences,Griffith University, Brisbane, 1996.
Liu, B. M., Collick, A. S., Zeleke, G., Adgo, E., Easton, Z. M., andSteenhuis, T. S.: Rainfall discharge relationships for a monsoonalclimate in the Ethiopian Highlands, Hydrol. Process., 22, 1059–1067, 2008.
Lyon, S. W., Lembo, A. J., Walter, M. T., and Steenhuis, T. S.:Defining Probability of Saturation With Indicator Kriging onHard and Soft Data, Adv. Water Resour., 29, 181–93, 2006.
Mitiku, H., Herweg, K., and Stillhardt, B.: Sustainable land man-agement – a new approach to soil and water conservation inEthiopia, Land Resource Management and Environmental Pro-tection Department, Mekelle University, Mekelle, Ethiopia, Cen-ter for Development and Environment (CDE), University of Bern
and Swiss National Center of Competence in Research (NCCR)North-South, Bern, Switzerland, 269 pp., 2006.
Mohammed, A., Yohannes, F., and Zeleke, G.: Validation of agricul-tural non-point source (AGNPS) pollution model in Kori water-shed, South Wollo, Ethiopia, Int. J. Appl. Earth Obs., 6, 97–109,2004.
Nyssen, J., Poesen, J., Moeyersons, J., Haile, M., Deckers, J., andLang, A.: Human impacts on the environment in the Ethiopianand Eritrean Highlands – a states of the art, Earth Sci. Rev., 64,270–320, 2004.
Prosser, I. P. and Rustomji, P.: Sediment transport capacity relationsfor overland flow, Prog. Phys. Geogr., 24, 179–193, 2000.
Rimmer, A. and Hartmann, A.: Simplified conceptual structures andanalytical solutions for groundwater discharge using reservoirequations. Chapter 10 in InTech Open Access book, “Water Re-sources Management and Modeling”, ISBN 978-953-51-0246-5,2012.
Rose, C. W.: Erosion and sedimentation, in: Hydrology and Wa-ter Management in the Humid Tropics-Hydrological ResearchIssues and Strategies for Water Management, edited by: Bonnell,M., Hufschmidt, M. M., and Gladwell, J. S., Cambridge Univer-sity Press, Cambridge, 301–343, 1993.
Rose, C. W.: Soil erosion models and implications for conservationof sloping tropical lands, in: Sustaining the Global Farm- Se-lected papers from the 10th International Soil Conservation Or-ganization Meeting, 24–29 May 1999, West Lafayette, IN, Inter-national Soil Conservation Organization in cooperation with theUSDA and Purdue University, West Lafayette, edited by: Stott,D. E., Mohtar, R. H., and Steinardt, G. C., CD-ROM availablefrom the USDA-ARS National Soil Erosion Laboratory, WestLafayette, 852–859, 2001.
Savenije, H. H. G.: HESS Opinions “Topography driven conceptualmodelling (FLEX-Topo)”, Hydrol. Earth Syst. Sci., 14, 2681–2692,doi:10.5194/hess-14-2681-2010, 2010.
SCRP: Area of Anjeni, Gojam, Ethiopia: long-term monitoringof the agricultural environment 1984–1994, Soil erosion andconservation database, Soil Conservation Research Programme(SCRP), Centre for Development and Environment and theMinistry of Agriculture, Ethiopia, University of Berne, Berne,Switzerland, 89 pp., 2000.
Setegn, S. G., Ragahavan, S., and Bijan, D.: Hydrological modellingin the Lake Tana Basin, Ethiopia using SWAT model, Open Hy-drol. J., 2, 49–62, 2008.
Siepel, A. C., Steenhuis, T. S., Rose, C. W., Parlange, J.-Y., andMcIsaac, G. F.: A simplified hillslope erosion model with vege-tation elements for practical applications, J. Hydrol., 258, 111–121, 2002.
Sivapalan, M., Yaeger, M. A., Harman, C. J., Xu, X., andTroch, P. A.: Functional model of water balance variabilityat the catchment scale: 1. Evidence of hydrologic similarityand space-time symmetry, Water Resour. Res., 47, W02522,doi:10.1029/2010WR009568, 2011.
Steenhuis, T. S. and van der Molen, W. H.: The Thornthwaite-Mather procedure as a simple engineering method to predictrecharge, J. Hydrol., 84, 221–229, 1986.
Steenhuis, T. S., Collick, A. S., Easton, Z. M., Leggesse, E. S.,Bayabil, H. K., White, E. D., Awulachew, S. B., Adgo, E., andAhmed, A. A.: Predicting discharge and erosion for the Abay(Blue Nile) with a simple model, Hydrol. Process., 23, 3728–
Hydrol. Earth Syst. Sci., 17, 1051–1063, 2013 www.hydrol-earth-syst-sci.net/17/1051/2013/

S. A. Tilahun et al.: An efficient semi-distributed hillslope erosion model 1063
3737, 2009.Tebebu, T. Y., Abiy, A. Z., Zegeye, A. D., Dahlke, H. E., Easton,
Z. M., Tilahun, S. A., Collick, A. S., Kidnau, S., Moges, S.,Dadgari, F., and Steenhuis, T. S.: Surface and subsurface flow ef-fect on permanent gully formation and upland erosion near LakeTana in the northern highlands of Ethiopia, Hydrol. Earth Syst.Sci., 14, 2207–2217,doi:10.5194/hess-14-2207-2010, 2010.
Tesemma, Z. K., Mohamed, Y. A., and Steenhuis, T. S.: Trends inrainfall and runoff in the Blue Nile Basin: 1964–2003, Hydrol.Process., 24, 3747–3758,doi:10.1002/hyp.7893, 2010.
Thomas, D. B. and Biamah, E. K.: Origin, application and designof fanya juu terrace, in: Development of Conservation Farmingon Hillslopes, edited by: Moldenhauer, W. C., Hudson, N. W.,Sheng, T. C., and Lee, S. W., Soil and Water Conservation Soci-ety, Ankeny, Iowa, 185–194, 1991.
Thornthwaite, C. W. and Mather, J. R.: The water balance, Publ.Climatol., 8, 1–104, 1955.
Vanmaercke, M., Zenebe, A., Poesen, J., Nyssen, J., Vertstraeten,G., and Deckers, J.: Sediment dynamics and the role of flashfloods in sediment export from medium-sized catchments: a casestudy from the semi-arid tropical highlands in Northern Ethiopia,J. Soil Sediment., 10, 611–627, 2010.
Vanmaercke, M., Poesen, J., Maetens, W., Vente, J., and Verstraeten,G.: Sediment yield as a desertification risk indicator, Sci. TotalEnviron., 409, 1715–1725,doi:10.1016/j.scitotenv.2011.01.034,2011.
Western, A. W., Grayson, R. B., and Bloschl, G.: Scaling of soilmoisture: A Hydrologic Perspective, Annu. Rev. Earth Pl. Sc.,30, 149–180, 2002.
Wischmeier, W. H. and Smith, D. D.: Predicting rainfall erosionlosses – a guide to conservation planning, USDA Agric. Hand-book, 537, 58 pp., 1978.
White, E. D., Easton, Z. M., Fuka, D. R., Collick, A. S., Adgo, E.,McCartney, M., Awulachew, S. B., Selassie, Y., and Steenhuis, T.S.: Development and application of a physically based landscapewater balance in the SWAT model, Hydrol. Process., 23, 3728–3737,doi:10.1002/hyp.7876, 2010.
Yu, B., Rose, C. W., Ciesiolka, B. C. A. A., Coughlan, K. J., andFentie, B.: Toward a framework for runoff and soil loss predic-tion using GUEST technology, Aust. J. Soil Res., 35, 1191–1212,1997.
Zehe, E., Graeff, T., Morgner, M., Bauer, A., and Bronstert, A.: Plotand field scale soil moisture dynamics and subsurface wetnesscontrol on runoff generation in a headwater in the Ore Moun-tains, Hydrol. Earth Syst. Sci., 14, 873–889,doi:10.5194/hess-14-873-2010, 2010.
Zegeye, A. D., Steenhuis, T. S., Blake, R. W., Kidnau, S., Col-lick, A. S., and Dadgari, F.: Assessment of Upland Erosion Pro-cesses and Farmer Perception of Land Conservation in Debre-Mewi Watershed, near Lake Tana, Ethiopia, Ecohydrologica, 10,297–306, 2010.
Zeleke, G.: Landscape Dynamics and Soil Erosion Process Model-ing in the North-Western Ethiopian Highlands, African StudiesSeries A 16, Geographica Bernensia, Berne, Switzerland, 2000.
www.hydrol-earth-syst-sci.net/17/1051/2013/ Hydrol. Earth Syst. Sci., 17, 1051–1063, 2013