An automated system for rapid evaluation of high-density electrode arrays in neural prostheses
48
This is the author’s version of a work that was accepted for publication in the following source: John, S., Shivdasani, M. N., Leuenberger, J., Fallon, J., Shepherd, R., Millard, R., Rathbone, G. D., & Williams, C. E. (2011). An automated system for rapid evaluation of high-density electrode arrays in neural prostheses. Journal of Neural Engineering, 8(3), Article#036011. © 2011 by the Institute of Physics Notice: Changes introduced as a result of publishing processes such as copy-editing and formatting may not be reflected in this document. For a definitive version of this work, please refer to the published source: http://dx.doi.org/10.1088/1741-2560/8/3/036011
-
Upload
bionicsinstitute -
Category
Documents
-
view
2 -
download
0
Transcript of An automated system for rapid evaluation of high-density electrode arrays in neural prostheses

This is the author’s version of a work that was accepted for publication in the following source: John, S., Shivdasani, M. N., Leuenberger, J., Fallon, J., Shepherd, R., Millard, R., Rathbone, G. D., & Williams, C. E. (2011). An automated system for rapid evaluation of high-density electrode arrays in neural prostheses. Journal of Neural Engineering, 8(3), Article#036011. © 2011 by the Institute of Physics Notice: Changes introduced as a result of publishing processes such as copy-editing and formatting may not be reflected in this document. For a definitive version of this work, please refer to the published source:
http://dx.doi.org/10.1088/1741-2560/8/3/036011

An automated system for rapid evaluation of high density
electrode arrays in neural prostheses
Running Head: An automated system for rapid evaluation of high density electrode arrays
Sam E John1,2, Mohit N Shivdasani1, James Leuenberger1,4, James B Fallon1,3, Robert K
Shepherd1,3, Rodney E Millard1, Graeme D Rathbone1,2, and Chris E Williams1,3.
1The Bionic Ear Institute, Daly Wing, St Vincent’s Hospital, VIC – 3065, AUSTRALIA
2Department of Electronic Engineering, La Trobe University, VIC – 3086, AUSTRALIA
3Department of Otolaryngology, University of Melbourne, Royal Victorian Eye and Ear Hospital,
VIC – 3002, AUSTRALIA
4University of Bern, CH – 3012, Bern, Switzerland
5Corresponding Author:
A Prof. Chris E Williams
The Bionic Ear Institute, 6th Floor, Daly Wing, St Vincent’s Hospital, Fitzroy, VIC – 3065,
AUSTRALIA.
Tel: +61-3-92883523
Fax: +61-3-92882998
Email: [email protected]

Abstract
The success of high density electrode arrays for use in neural prostheses depends on efficient
impedance monitoring and fault detection. Conventional methods of impedance testing and fault
detection are time consuming and are not always suited for in-vivo assessment of high density
electrode arrays. Additionally the ability to evaluate impedances and faults such as open and short
circuits both, in-vitro and in-vivo are important to ensure safe and effective stimulation.. In the
present work we describe an automated system for the rapid evaluation of high density electrode
arrays. The system uses a current pulse similar to that used to stimulate neural tissue and measures
the voltage across the electrode in order to calculate the impedance. The switching of the system
was validated by emulating a high density electrode array using light emitting diodes and a resistor-
capacitor network. The system was tested in-vitro and in-vivo using a range of commercially
available and in-house developed electrode arrays. The system accurately identified faults on an 84
electrode array in less than 20 seconds and reliably measured impedances up to 110 kΩ using a 200
µA, 250 µs per phase current pulse. This system has direct application for screening high
density electrode arrays in both a clinical and experimental setting.

1. Introduction
High density electrode arrays are being used in neural prostheses in several chronic recording and
electrical stimulation applications (Brindley and Lewin, 1968, Rizzo et al., 2003, Prochazka and
Mushahwar, 2004, Schwartz, 2004, Mccreery et al., 2006, Donoghue, 2008, Middlebrooks and
Snyder, 2008). However, the success of such devices depends on several factors including: access
to a large number of electrically active electrodes; rapid electrode switching and effective mapping
of stimuli to multiple electrodes on the array; estimation of the instantaneous impedance of the
electrode-tissue interface; and quick and reliable electrode fault detection. For chronic neural
prostheses, the instantaneous impedance describes the functional ability of the electrode.
Impedance spectroscopy, the sine wave method (SWM) and the stimulus waveform test (SWT)
have commonly been used to measure impedances of electrodes in neural prostheses (table 1).
Impedance spectroscopy uses a low voltage sinusoidal input (10-50 mV) and provides the phase
angle and magnitude of the impedance over a range of frequencies. Impedance spectroscopy can
characterize the impedance dominated by the electrode from the impedances measured at high
frequencies and the impedance dominated by tissue reaction (e.g. encapsulation) from the
impedances measured at low frequencies (Mercanzini et al., 2009). However, impedance
spectroscopy requires the use of a wide range of frequencies and is time consuming.
The SWM uses a low voltage or current sinusoidal input (10-50 mV / 1-20 nA) and reports the
impedance at 1 kHz (Hornig et al., 2005, Gunalan et al., 2009). The 1 kHz frequency is used
because it roughly corresponds to the 1 ms duration of the neuron’s action potential (Mercanzini et
al., 2009). Gunalan et al. (2009) describe an automated system for evaluating high density
electrode arrays using this method. They used a 10 mV, 1 kHz sine wave to evaluate the impedance
of a 100 electrode array in 5 minutes with a three electrode set up (working, reference and counter).
However, the SWM is less relevant for applications involving electrical stimulation as it does not
differentiate between the impedance of the tissue reaction and the impedance of the electrode and

the tissue surrounding it (Mercanzini et al., 2009). As a result the SWM is more suited for assessing
recording electrodes (Cogan, 2008). In addition both the SWM and impedance spectroscopy use
low voltage or current levels and do not replicate the clinically relevant levels used for neural
stimulation.
There is therefore a need to monitor impedance using clinically relevant stimulus pulses and
current levels. In addition, it would be advantageous for such a method to provide an estimate of
the current that can be safely injected into tissue; confirm that the stimulator is working within its
designed voltage compliance for a given current; provide an estimate of the charge balanced state
of the current pulse; and provide an indication of the tissue reactions around the electrode. The
SWT uses a bi-phasic or mono-phasic constant current pulse, similar to those used to stimulate
neural tissue. In the present work, a charge balanced symmetric bi-phasic constant current pulse
was used to measure impedance under clinically relevant conditions (Weinman and Mahler, 1964,
Brummer and Turner, 1977, Parker et al., 1999, Tykocinski et al., 2005, Cogan, 2008). Using this
method both the current and voltage waveforms can be monitored, enabling one to confirm that
there is no imbalance in the current waveforms and that the stimulator is working within its
compliance limits for the given stimulus parameters. In addition, the SWT can give an indication of
the tissue reactions in the vicinity of the electrode due to stimulation (Shepherd et al., 1990, Xu et
al., 1997, Newbold et al., 2004). Xu et al. (1997) and Newbold et al. (2004) showed that there is a
direct correlation between tissue reaction (such as fibrous tissue growth around the electrode) and
impedance. If the impedance becomes too high the stimulator may begin to operate out of voltage
compliance which may lead to loss of charge balance, resulting in tissue damage (Seligman and
Shepherd, 2004). Reducing irreversible electrochemical reactions and ensuring charge balance are
essential in providing safe neural stimulation (Brummer and Turner, 1977, Seligman and Shepherd,
2004). We describe a fully isolated flexible system that allows the user to: connect an electrode or a
combination of electrodes on the array as the stimulating (active) or the return electrode(s);

measure impedances in different configurations; and detect faults on the array such as open circuits
and short circuits.

Table 1. Impedance properties of commonly used electrode arrays and materials
Application AuditoryProsthesis
VisualProsthesis
VisualProsthesis
VisualProsthesis
MotorProsthesis
Brain-Machineinterfaces
Species Human Human Cat Rabbit Cat Monkey
ElectrodePlacement
Cochlea Epiretinal Supra-choroidal
Subretinal Spinal cord Primary MotorCortex
Application Stimulation Stimulation Stimulation Stimulation Stimulation RecordingArrayconfiguration
24 4 × 4 6 ×12 3 × 5 6 to 12wires
10x10
Electrode Full banded Surface Surface Surface Penetrating PenetratingElectrodeMaterial
Platinum Sputtered thinfilm platinum
PlatedPlatinum
Activatediridium oxide
Stainless-steel wires
Boron-dopedsilicon shankswith Pt-coatedTips
GeometricSurface areas
480000 µm2
to300000 µm2
31415 µm2
to1963 µm2
123000 µm2
to20100 µm2
125600 µm2 3000 µm2
to 1400 µm2
1600 µm2
Meanin-vitro
Impedance
0.2-1.5 kΩ Not reported 2-20 kΩSaline
3.6 kΩ at 1kHzInterstitial fluid(ISF)
10-30 kΩ 100–750 kΩsaline
Meanin-vivoImpedance
1-12 kΩ 10 -100 kΩat 1 kHz
20-50 kΩ 3.8 kΩat 1 kHz
Not reported 50-1000 kΩ
Method usedto measureimpedance
SWT-StimulusWaveformTest
ElectrochemicalImpedanceSpectroscopy: 10mV sine wave;10-100 kHz.
SWT-StimulusWaveformTest
ElectrochemicalImpedanceSpectroscopy:10 mV sinewave;10-100 kHz.
Not reported Sine Wavemethod:1 nA, 1 kHzsine wave
References (Shepherd etal., 1990,Tykocinskiet al., 2005)
(Shah et al.,2007)
(Shivdasaniet al., 2010)
(Cogan, 2006) (Mushahwaret al., 2000)
(Suner et al.,2005)

2. Material and methods
2.1. Hardware and Software Design
Figure 1: Hardware block diagram of the system consists of a personal computer (PC), a constant
current stimulator, two Digital Multimeters (DMMs) and a cross-point switch matrix. The DMMs,
switch matrix and stimulator were isolated to ensure safety of the experimental animals and for
clinical use. The dotted lines indicate components which can be easily replaced with alternative
components. Biphasic stimulation pulses were routed to the electrode array via the cross-point
switch matrix. The current and voltage responses were recorded and measured using the DMMs
and were displayed on the PC.
Figure 1 shows a schematic diagram of our system, the dotted lines indicate components which can
be easily replaced with commercially available or custom built components. The basic components
consist of a National Instruments 512 cross-point reed relay switch matrix (NI PXI-2532; NI,
Austin TX) and two NI isolated digital multimeters (DMMs, NI PXI-4072) in a PXI chassis. The
NI-2532 switch matrix has a maximum switching speed of 2,000 cycles/sec with a relay operating
time of 0.25 ms, relay release time 0.25 ms, switch settling time up to 3.4 ms and NI-4072 DMM is

a high accuracy digitizer with an initialisation time of 4 ms. One DMM was connected in series
with the stimulator and measured the stimulus current waveform. The second DMM was connected
in parallel to the electrode array via the switch matrix and measured the voltage across the
electrode(s). A personal computer was connected to the PXI chassis through a NI MXI-4 optical
interface. An optically isolated constant current stimulator (Shepherd et al., 1990) developed in-
house was used to provide the stimulation current. The stimulator was shorted at the end of each
pulse to minimize any direct current. The stimulator output was fed to the electrode array through a
pair of ribbon cables via the switch matrix.
Custom software (virtual instrument, VI) was developed in LabVIEW to synchronize and control
the data acquisition and online analysis of the data. The user can enter the stimulus pulse
parameters, electrode configuration to test, electrode area and the safe maximum charge-density
(Rose and Robblee, 1990) for the given electrode array. The VI uses the entered pulse parameters
to calculate the charge that would be injected through the electrode. The VI automatically aborts
the test if the calculated charge exceeds the maximum charge-injection capacity for the electrode.
Both the current and voltage waveforms were acquired by the DMMs. The acquired waveforms are
then filtered using LabVIEW and the raw and analysed data were displayed on the PC.
2.2. Stimulation Pattern Mapping
Monopolar configurations are widely used for neural stimulation (Weiland and Anderson, 2000,
Clark, 2003, Shivdasani et al., 2010). This configuration uses a single or a combination of
electrode(s) as the active and a remote electrode as the return. The common ground configuration is
another electrode configuration which has been implemented in the Nucleus 22 channel cochlear
implant (Cochlear Ltd) (Clark, 2003). In this configuration, one electrode on the array acts as the
active electrode and all other electrodes on the array form the return. Recent advances in visual

prosthesis have motivated the investigation of several patterns of stimulations (Humayun et al.,
1999, Xinyu et al., 2008) such as squares, lines (rows and columns), letters and circles (Zrenner et
al., 2010). Furthermore, the need to improve spatial resolution has led researchers to investigate
patterns such as bipolar stimulation and the hexagonal return configuration(Suaning et al., 2004).
The system was used to implement some of these commonly used electrode configurations. Figure
2 shows schematic examples of some stimulation configurations created on an 84 electrode
platinum plated array designed in-house (Shivdasani et al., 2010).
Figure 2: Examples of electrode configurations. Upper: monopolar configurations using a remote
return electrode; single electrode (SE), monopolar row (ROW) and monopolar column (COL).
Lower: common ground (CG), bipolar electrode pair (BP) and hexagonal return (HX). These maps
were visually verified on an LED emulation of the platinum plated array.
1) Monopolar Single Electrode (SE): Used one electrode on the array as the active electrode
and a remote electrode as the return electrode.

2) Monopolar column (COL): Used a column of electrodes on the array shorted together as
the active electrode and a remote electrode as the return electrode.
3) Monopolar row (ROW): Used a row of electrodes on the array shorted together as the
active electrode and a remote electrode as the return electrode.
4) Common ground (CG): Used one electrode on the array as the active electrode and the 19
electrodes closest to it on the array were shorted together as the return electrode.
5) Bipolar pair (BP): Used one electrode on the array as the as the active electrode and a
second electrode on the array as the return electrode.
6) Hexagonal return (HX): Used one electrode on the array as the central active electrode and
the six electrodes surrounding it were shorted together as the return electrode (Suaning et
al., 2004).
A platinum ball electrode (1.5 mm diameter) with an impedance of 350 Ω was used as the remote
return electrode for monopolar stimulation. The platinum ball electrode was placed in the vitreous
humour during the in-vivo experiments and in normal saline (0.9% NaCl) during in-vitro
experiments. In-vivo studies were approved by the Royal Victorian Eye and Ear Hospital Animal
Ethics Committee.
2.3 Impedance Testing Procedure
The impedance measurements used a two electrode set up (active and return) and different
electrode configurations as described in section 2.2. The system acquired the current waveform
(figure 3A) from the stimulator and the voltage waveform (figure 3B) across the electrode. The
acquired waveforms were filtered with a median filter of rank 7 to remove the large current spikes
caused by shorting the stimulator and stray capacitance. It was important to eliminate spikes in the
acquired waveforms to ensure accuracy and a spatial filter such as the median filter effectively
eliminated impulse noise such as current spikes. The rank of the median filter is number of samples
used to compute the median filter and the data sampled at 1.8 M Samples/second. Both the current
pulse and the resultant electrode voltage waveforms acquired are analogous to periodic square
pulses. These square pulses can be analysed as an initial step which corresponds to a high
frequency AC sinusoidal wave followed by a plateau which corresponding to zero frequency
(Teorell, 1946). In this case the impedance is the ratio of the potential difference across the
electrode-tissue interface to the current flowing through it (Dymond, 1976).
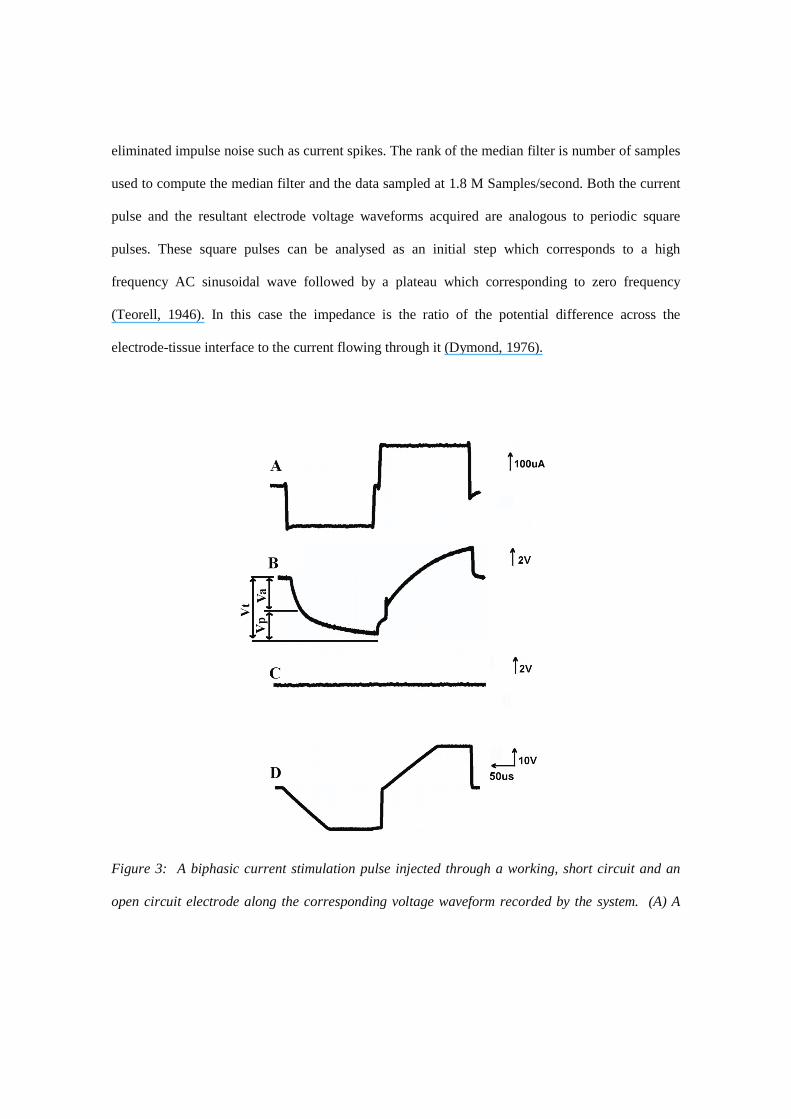
Figure 3: A biphasic current stimulation pulse injected through a working, short circuit and an
open circuit electrode along the corresponding voltage waveform recorded by the system. (A) A

charge balanced biphasic constant current pulse (200µA, 250µs per phase, 25µs interphase gap)
was used for stimulation and was recorded by the first DMM. (B) The monopolar-single electrode
voltage across the electrode was recorded by the second DMM. The waveform shows the electrode
had a total impedance of 15 kΩ and a peak voltage of 3.2 V which was within the operational
range for the stimulator. (C) The common ground voltage across an electrode that was shorted to
one of its neighbouring 19 electrodes (the neighbouring19 electrodes form the return electrode in
the CG configuration) on the array. (D) The monopolar-single electrode voltage across an
electrode that was found to be open circuited. Note: Different scale for D.
The impedance was calculated from the peak current and peak voltage [Vt] obtained from the
leading cathodic phase (figure 3A and 3B). The overall impedance [Zt] using the SWT represents
the sum of the bulk impedance [Za] and the polarization impedance [Zp]. The bulk impedance [Za]
results in the initial steep rise in the voltage [Va] in figure 3A and the polarization impedance [Zp]
is due to the slow rising voltage reaching its peak [Vp] level in figure 3A (Tykocinski et al., 2005).
It is suggested that the bulk impedance is dominated by the resistivity of the electrode and the
tissue surrounding it, while the polarization impedance is dominated by the electrochemical
electrode-tissue interface. For the purpose of this paper all impedances reported in this study are
total impedances [Zt].
2.4 System Validation and Testing
The working range and accuracy of the system were characterized using a resistor-capacitor (RC)
network. The RC network was constructed to emulate the electrode-tissue interface (inset of figure
4), RA was kept constant at 1.1 kΩ, C was varied in the nF range and RX was varied in the kΩ-MΩ
range using 20 different combinations (Seligman and Shepherd, 2004). For each combination we

calculated the theoretical equivalent impedance (Zeq) of the circuit model using, Zeq= ZA+ (ZX||ZC),
where, ZA = RA, ZX = RX and ZC = XC (XC is the capacitive reactance of the capacitor at a given
frequency f= (1/T), where T is the pulse width of the leading phase of the stimulus used) (Dymond,
1976). In addition, tests were performed to evaluate the effect of changes in current amplitude and
pulse width on measured impedance. Three RC circuits were built using the circuit diagram in inset
of figure 4 to represent the low, middle and high measurement ranges of the system. In the first test
the pulse width was kept constant at 250 µs per phase pulse and the current was varied between 10-
200 µA. In the second test the current was kept constant at 200 µA and the pulse width was varied
between 50-1000 µs per phase, except in the highest range of impedance where the stimulator
reached compliance at 400 µs per phase and only pulse widths up to 200 µs per phase are reported
for this impedance range.
Two in-house developed arrays made of pure platinum and plated platinum and one commercially
available array made of iridium oxide were tested in-vitro in normal saline:
1. Pure platinum array: A feline version of the scala tympani electrode array (Shepherd et al.,
1983), comprising of eight platinum (Pt) ring electrodes was used. The scala tympani electrode
array had the largest geometrical surface area (GSA) of 430000 µm2.
2. Platinum plated array: A platinum plated array was designed in-house and manufactured by
Flexible Circuit Technologies (Plymouth, MN). It comprised of a polyimide substrate with
platinum plated-gold disc electrodes(Shivdasani et al., 2010). The electrodes had a GSA of 123000
µm2 and were arranged in a 7 row x 12 electrode configuration.
3. Iridium oxide array: A 32 electrode activated iridium oxide multichannel array was purchased
from NeuroNexus Technologies Inc. (Ann Arbour, MI). The iridium oxide array was arranged in a
4 row x 8 electrode configuration and each electrode had a GSA of 413 µm2.

The impedances of all individual electrodes on each array were measured with the SWT against a
platinum ball return electrode in the monopolar single electrode configuration. The impedances
obtained with the system were compared to those obtained using the SWM (Solartron 1260
impedance gain-phase analyser and the Solartron 1287 electrochemical interface Solartron
Analytical, Hampshire UK). The SWM was performed with a three electrode set up with a
platinum wire as the counter; a saturated Ag|AgCl as the reference electrode and the working
electrode as the array being tested. The three electrodes were immersed in normal saline at room
temperature and a 4 kHz, 10 mV sine wave was applied. This frequency was chosen as it roughly
corresponds to the nominal frequency of the current pulse used in the current work.
The electrode configurations were verified visually on an emulation of the platinum plated
electrode array made of light emitting diodes (LED) configured as in figure 2. Red and green
LEDs were connected in opposite directions to display each stimulation phase. The system’s ability
to test electrodes in-vitro and in-vivo in different configurations was verified with the platinum
plated array (section 3.2). The in-vitro impedances were obtained with the array in normal saline
before implantation and in-vivo impedances were obtained post-operatively in the suprachoroidal
space of cats (Shivdasani et al., 2010). The mean in-vitro impedance in each configuration was
compared to its corresponding mean in-vivo impedance.
2.5 Fault Detection
The impedance of the electrodes was also used to determine faults on the array such as short
circuits (using CG configurations) and open circuits (using SE or CG configurations). Short circuits
can exist between the active electrode and its neighbouring electrodes on the array due to fluid
leaking into the substrate forming an electrical short circuit or wiring errors. In the present work,

the common ground configuration comprised an active electrode and a return electrode
incorporated 19 electrodes closest to the active electrode. Short circuits were detected when the
electrodes forming the short showed identical low impedances (< 300 Ω) and the peak voltage was
close to zero indicating the noise floor (figure 3C). Open circuits can be formed by corrosion of the
electrode surface; dissolution of the electrode material; breakage of the lead wires or wiring errors.
Open circuits were identified when the electrode showed high impedance and a voltage waveform
with a peak voltage equal to the stimulator compliance limit (24 V for our lab stimulator) (figure
3D). If an electrode(s) on the array is found to be faulty that electrode can be excluded from the
stimulating configuration.
Several tests were performed to evaluate the system’s ability to detect faults. First, a platinum
plated array was modified to deliberately produce faults: five tracks on the array were cut and five
pads were coated with silicone to form open circuits; while three pairs of electrode were soldered
together to form short circuits. This array was then tested in-vitro in normal saline. Second, to
ensure that the system could identify faults in-vivo, platinum plated arrays were tested during
several acute visual prosthesis experiments in the suprachoroidal space of a cat (Shivdasani et al.,
2010). Prior to implantation each platinum plated array was visually inspected for faults, this was
followed by impedance measurements in-vitro in normal saline and in-vivo in the suprachoroidal
space of a cat. In addition, during one acute experiment, tests were also made using a commercially
available impedance testing system (Custom Sound EP 2.0, Cochlear ltd, Sydney) and the results
compared to faults identified by our system. Also, to ensure that faults could be identified by our
system on a different array in-vivo, an experiment was performed with a pure platinum array
implanted in the scala tympani of a cat and measurements were made with both our system and the
commercial Custom Sound EP 2.0 system.

3. Results
3.1. RC circuit model-Testing and Validation
The theoretical impedance values of the RC networks were compared to the experimentally
obtained impedance values using the system (figure 4). The test pulse parameters used were 200
µA amplitude, 250 µs pulse width per phase with a 25 µs interphase gap. The optimal operating
range of the system was found to be from 1 kΩ to 110 kΩ (using the test pulse parameters above)
with an average percentage error of 3.24 % and a maximum percentage error of 10 % at 110 kΩ
(figure 4). In order to measure impedances above 110 kΩ a test current of less than 200 µA was
required to stay within stimulator compliance voltage.
Figure 4: A resistor-capacitor (RC) network was measured using system, and the values obtained
were compared to the theoretical values of the RC combination at terminals ’A’ and ’B’ (inset).

Ten measurement trials were averaged for each RC combination. Error bars indicate standard
error of the mean (SEM). Dashed line represents equal theoretical values and measured values by
the system.
The system performance at different currents (10-200µA) and pulse widths (50-1000µs) was
evaluated with three RC combinations representing the lower (9.6 kΩ), middle (50 kΩ) and high
(110 kΩ) range of the system (theoretical impedances were calculated using a 250 µs pulse). Figure
5A shows the plots of impedance normalized to the theoretical calculated value versus the current
amplitude for each of the three impedance ranges. With all current amplitudes tested, impedance
measurements were within 10% of the theoretical calculated values for all three impedance ranges.
Figure 5B shows the impedance normalized to the theoretical calculated impedance versus the
pulse width (50-1000 µs) for each of the three impedance ranges. Impedance values were found to
be within 10% of the theoretical calculated values for all pulse widths with the middle impedance
ranges, while for the low impedance range, only values measured using pulse widths > 100 µs,
were within 10% of the theoretical calculated values. For the highest impedance range, although
measurements were reasonably accurate within 10% error, only pulse widths less than 400 µs could
be tested as the stimulator would reach compliance for longer pulse widths with the fixed current of
200 µA.
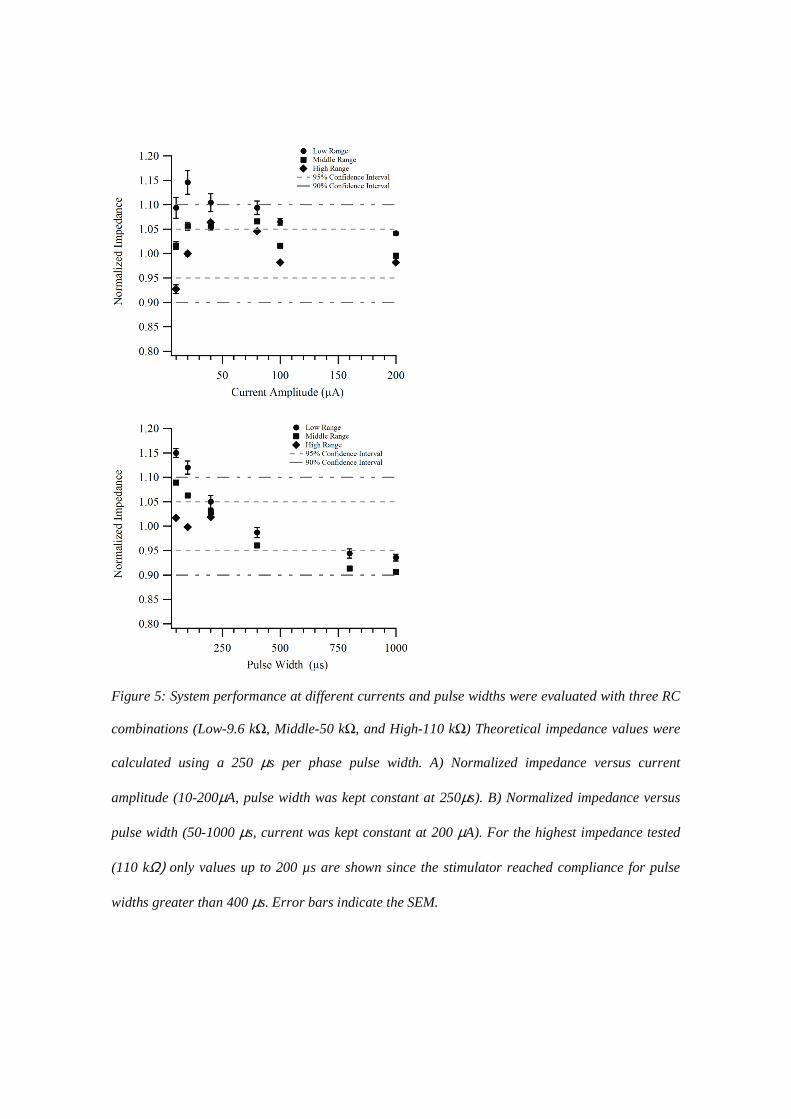
Figure 5: System performance at different currents and pulse widths were evaluated with three RC
combinations (Low-9.6 kΩ, Middle-50 kΩ, and High-110 kΩ) Theoretical impedance values were
calculated using a 250 µs per phase pulse width. A) Normalized impedance versus current
amplitude (10-200µA, pulse width was kept constant at 250µs). B) Normalized impedance versus
pulse width (50-1000 µs, current was kept constant at 200 µA). For the highest impedance tested
(110 kΩ) only values up to 200 µs are shown since the stimulator reached compliance for pulse
widths greater than 400 µs. Error bars indicate the SEM.

3.2. In-vitro Analysis of Electrode Arrays
Figure 6 shows the three electrode arrays used in this study (bottom panel) and the voltage
waveforms (top panel) corresponding to each array. Table 2 shows the mean impedance of the
three electrode arrays tested in-vitro. The test pulse parameters used were 200 µA amplitude, 250
µs pulse width per phase with a 25 µs interphase gap. As expected, measured impedances were
found to correlate with electrode geometry (Electrodes with larger surface areas showed lower
impedances; table 2).
Figure 6: Three types of multi-channel electrode arrays used for electrical stimulation applications
in neural prostheses were tested in normal saline. The images show the array used and the
corresponding voltage response waveforms across one of the electrodes on the array. A) Pure
platinum array made up of 8 platinum rings on a silastic carrier. B) Platinum plated array made
up of 84 electrodes arranged as a 7x12 array on a polyimide substrate and C) Iridium oxide array
(NeuroNexus Technologies Inc.) made up of 32 electrodes arranged as a 4x8 array. A current
pulse of 200 µA, 250 µs per phase with a 25 µs interphase gap was used to test each electrode
array. Note: Different scales.

Table 2. In-vitro analysis of electrode arrays using system.
The electrodes were found to exhibit different voltage waveform shapes. For example, the
electrodes on the pure platinum array showed an initial step in voltage followed by a slower rise. In
comparison, the electrodes of the platinum plated array did not show much of an initial step in
voltage but showed a flatter second region than the other two arrays. The iridium oxide array had
the largest peak voltage and showed a slow rising waveform with an almost constant slope.
Electrode Name Pure platinum array Platinum plated array Iridium oxide array
Designed In-house In-house NeuroNexusTechnologies Inc.
Manufactured In-house(Shepherd et al., 1983)
Flexible CircuitTechnologies(Plymouth, MN).plated in-house(Shivdasani et al., 2010)
NeuroNexusTechnologies Inc.(Ann Arbour, MI).(Weiland andAnderson, 2000)
Number of sites 8 84 32
Geometric SurfaceArea
430000 µm2 123000 µm2 413 µm2
Mean in-vitroImpedance
3.3 kΩ 11.6 kΩ 80.80 kΩ
Standard Error ofthe Mean (SEM)
±0.1 kΩ ±1.3 kΩ ±1.5 kΩ
Charge TransferMechanism
Pseudocapacitive Pseudocapacitive Reversible Faradiac

Figure 7: Comparison of the impedance values obtained using the system described in the current
work and the impedance values obtained using the SWM with a 4 kHz, 10 mV sine wave. The pure
platinum array (8-electrodes, closed circles) and the platinum plated array (84-electrodes, open
circles) were tested. A current pulse of 200 µA, 250 µs per phase with a 25 µs interphase gap was
used to test each electrode array. Data points have been fitted using linear regression. Filled
circles (solid line), r2 = 0.9, slope = 0.84 and open circles (dashed line), r2 = 0.78, slope = 0.92.
Dotted line represents unity.
Figure 7 shows a comparison of the impedances obtained from the pure platinum array and the
platinum plated array using the system described here and those obtained using the SWM. The
impedances obtained from the two methods were comparable in value with our system generally
tending to measure slightly higher impedance values than those obtained using the SWM (figure 7).

3.3 In-vivo Analyses.
Figure 8: The in-vitro (open bars) and in-vivo (filled bars) impedances of the platinum plated
array was analysed for specific stimulation configurations (see figure 2). The in-vivo values show
an increase in impedance from the in-vitro values for all stimulation configurations. A 200µA
(250µs per phase and 25µs interphase gap) stimulation current pulse used for impedance analysis
(see figure 3A).
Figure 8 shows the mean in-vitro and in-vivo impedances of the platinum plated array (bars) in
each stimulation configuration (top). The in-vivo impedance measured immediately after
implantation was found to increase by a factor of 1.5-2.5 times the in-vitro impedance measured in
normal saline prior to implantation. The system measured the impedances of all the electrodes on
each array in less than 10 seconds in the monopolar configuration while speeds using other
configurations varied (table 3). The configuration was also found to affect the impedance values
measured. Impedances measured using the SE and CG configurations were similar however they

were lower than those measured using the HX configuration. The ROW and COL configurations
showed the lowest measured impedances.
Table 3. System temporal performance in scanning the 7 x 12 platinum plated array.
ElectrodeConfigurationon the Platinumplated array
Number of electrodesconnected as Activefor eachmeasurement
Number of electrodesconnected as Returnfor eachmeasurement
Number ofelectrodestested
Time taken toscan thewhole array
SE 1 1 84 <10 s
CG 1 19 84 <20 s
HX 1 6 67 <15 s
ROW 12 1 12 <5 s
COL 7 1 7 <5 s
3.4. Fault detection
The system reliably detected all the fabricated faults on the platinum plated array in less than 20
seconds in-vitro. Short circuited electrodes showed very low impedances with no voltage response
waveform as shown in figure 3C. Open circuited electrodes showed very high impedances and a
characteristic waveform as shown in figure 3D. Normal working electrodes with no faults showed a
characteristic waveform as shown in figure 3B. In 20 in-vivo experiments performed with the
platinum plated array, several open circuits and 3 short circuits were detected - these were later
confirmed to be caused by wiring errors or trauma to the array during implantation. In the scala
tympani experiment, only one open circuit was detected – this was determined to be caused by a
lead-wire breakage. When tested in-vivo, identical faults were detected with both our system and
the Custom Sound EP 2.0 system. The platinum plated array had one open circuit and one short

circuit and the pure platinum array had one open circuit. In all the tests conducted, there were no
false positives in the results and the existence of faults did not change the scanning speeds (table 3).

4. Discussion
The present study describes a system and method for rapid evaluation of high density electrode
arrays including effective mapping of stimuli to multiple electrodes on the array, estimation of the
instantaneous impedance of the electrode-tissue interface and quick and reliable electrode fault
detection. The system reliably performed fast in-vitro and in-vivo measurements over a wide range
of impedances and with a range of electrode arrays. In addition, the system accurately identified all
open and short circuit faults when tested.
4.1 System Performance
Using different RC network circuits which model the electrode-tissue interface, we were able to
determine a working impedance range for the system. Using a 200 µA, 250 µs per phase current
pulse, a maximum impedance of 110 kΩ could be measured within 10% error. In addition, the
system made accurate impedance measurements within 10% error at all current levels between 50-
200 µA and at pulse widths greater than 200 µs for a wide range of impedances. The upper limits
were primarily due to the compliance voltage of the stimulator (24V). A higher compliance voltage
may improve the measurement ranges and accuracy even further (see section below on Alternative
Design).
Our system was effective in measuring impedances of several types of arrays with electrodes of
different sizes and materials using the SWT. The results obtained were comparable to those
measured using the SWM with a commercially available testing system. However, our system
made use of a simple two-electrode set up for impedance measurements while the SWM required
an additional reference electrode for measurements. In addition, the constant current stimulator
used in our system eliminated the need for voltage protection circuitry, which is often required
when using the SWM (Gunalan et al., 2009). These attributes give our system the advantage of

being readily used in a clinical setting where a standard reference electrode is not available.
Of the three arrays that were tested in-vitro, the pure platinum array had the lowest impedance and
the iridium oxide array had the highest impedance. The difference in impedance was mainly
attributed to the difference in the GSA of the electrodes. It must be noted that the area considered
here was only the GSA, however the electrochemical surface area also plays a role in the
impedance of porous electrodes such as those on the platinum plated array and the iridium oxide
array. Generally however, the electrochemical surface area is difficult to determine and not often
reported (Cogan, 2008). There were also significant differences in the characteristic voltage
waveforms for each array, these could be attributed to several reasons including the electrode area
(both the GSA and the electrochemical surface area), the interface (normal saline/tissue), the
charge transfer mechanism (Table 3) and the resultant electrochemical reactions involved during
stimulation (Tykocinski et al., 2005, Weinman and Mahler, 1964, Cogan, 2008). The exact cause
of the changes in voltage waveforms across electrode arrays could not be determined by the
experiments performed in this study.
Impedances were obtained using the platinum plated array in several electrode configurations
including monopolar, common ground and hexagonal returns in-vitro and in-vivo. The impedances
of the electrodes were found to be affected by the number of active electrodes and the number of
electrodes comprising the return electrode in each configuration. In the SWT the voltage is
measured using a two-electrode setup, therefore the measured impedance is the result of the
combined impedance of the active and return electrodes. In the monopolar configurations (SE,
ROW and COL) the return electrode was a platinum ball electrode with very low impedance (350
Ω); hence the impedance of the return electrode had very little effect on the measured impedance.
The HX and CG configurations were made of a return electrode comprising of 6 and 19 electrodes

shorted together respectively. . Hence with the HX and CG configurations, impedances measured
were slightly higher than those measured with the SE configuration. Furthermore, the ROW and
COL configurations had much lower impedances than the other configurations measured because
the active electrode comprised of 12 and 7 electrodes shorted together respectively, thereby
increasing the GSA of the active electrode. Finally, the system was able to detect common faults
such as open and short circuits, both replicated in the laboratory and in real world applications at a
similar performance level to the Custom Sound EP 2.0 commercial system.
The system provided fast scanning of electrodes on high density electrode arrays in all
configurations. The speed of scanning depended on the NI-2532 relay operating time (0.25 ms);
DMM initialisation time (4 ms); number of simultaneous switch connections for different electrode
configurations; and the pulse width of the constant current pulse. For example in the monopolar SE
configuration, 4 simultaneous switch connections were required (two for the stimulator and two for
the DMM to record the voltage waveform), while in the CG configuration, 40 simultaneous switch
connections were required to connect 20 electrodes (1 active and 19 return) and record from them.
The system was able to scan up to 84 electrodes in the monopolar SE configuration in less than 10
seconds and in the CG configuration in less than 20 seconds; using the standard test pulse
parameters of 200 µΑ, 250 µs per phase, 25 µs inter phase gap. Furthermore, the identification of
electrode faults did not change scanning speeds.
4.2 System Applications
The method and system described in the current work could be applied to both stimulating and
recording electrodes in both a clinical and experimental setting. Chronic recording electrodes such
as the ones used in neural interfaces (eg. Brain machine interfaces-BMIs) can be potentially tested

using such a system to characterize tissue reactions and perform in-vivo calibration. This system
can be used with EEG based BMI’s that employ electrodes with impedances in the 1-110 kΩ range.
Currently available BMI’s use up to 100 electrodes on an array and higher density arrays could be
employed in the future. Routine evaluation of such arrays in-vivo will thus become important to
ensure the effectiveness of chronic BMI’s. Chronic stimulating electrodes such as the ones used in
auditory, visual, motor and other neural prostheses can also use this method for evaluating
electrode performance; detecting tissue and electrode damage; measurement of impedances and
detection of faults. Furthermore, this method can also obtain a better understanding of the charge
transfer mechanism involved during chronic stimulation (Brummer et al., 1983, Rose and Robblee,
1990, Shepherd et al., 1990, Newbold et al., 2004). Particularly where the high density electrode
arrays are concerned, this method enables a quick and safe evaluation of the array both in-vitro and
in-vivo.
4.3 Errors and Limitations
The system was limited by the consecutive switching capability of the switch matrix and an
impedance measurement range of less than 110 kΩ. Further, the use of very low currents and very
long pulse widths affected the system performance in impedance measurements. The NI-4532
switch matrix can only connect 40 switches simultaneously, which effectively reduced the number
of electrodes that could be connected simultaneously, especially in the CG configuration. The
current waveform measurements were limited by the DMM’s accuracy in measuring currents less
than 200 µA, while the stimulator compliance voltage was a limiting factor for measurements using
longer pulse widths and large current amplitudes, particularly with the high impedance range.
Furthermore, parasitic capacitances and resistances from the DMM, switch and cables affected

measurements at high impedances (greater than 110 kΩ) and at very low currents. Noise induced
errors also contributed to measurement errors at low currents and with high impedance electrodes.
4.4 Alternative design
Despite some shortcomings, the SWT-based system described in this study is versatile and can
accommodate various types of electrode arrays with little or no modifications required to the
hardware. The switches can also be easily expanded to address arrays with greater numbers of
electrodes than those described in this study. The accuracy and range of the system can be further
improved by applying adequate compensation for the parasitic capacitances and resistances as well
as by using a constant current stimulator with a larger voltage compliance, or by using current
levels <200 µA. For example a constant current stimulator with a voltage compliance of 100V can
measure impedances up to 1 MΩ using a 200 µA current pulse and using a 10 µA current pulse this
range can be increased up to 2.4 MΩ. If desired, this system can be easily adapted for use with the
SWM by replacing the constant current stimulator with a sine wave generator. The effects of
capacitive coupling in the cables and noise at low currents can be reduced by using shielded cables
and by replacing the DMM used to measure current with one which is more sensitive.

5. Conclusions
The system and method described measured the impedance of several electrode arrays reliably,
both in-vitro and in-vivo in the 1 kΩ to100 kΩ range in several electrode configurations, with fast
scanning speeds, reasonable accuracy and correct identification of faults. Together the results
indicate that this approach is capable of rapid evaluation of a range of high density electrode arrays
both in-vitro and in-vivo and can be very beneficial in a clinical environment.

Acknowledgements
The authors wish to thank Penny Allen for assistance with surgeries, Mark Harrison and David Ng
for designing the flexible electrode arrays. This work was performed at the Bionic Ear Institute at
St Vincent’s hospital. Funding was provided by the Ian Potter Foundation, John T Reid Charitable
Trusts and Bionic Vision Australia’s Special Research Initiative "Research in Bionic Vision
Science and Technology" from the Australian Research Council. The Bionic Ear Institute wishes to
acknowledge the supported of the Victorian Government through its Operational Infrastructure
Support Program.

References
Brindley G S and Lewin W S (1968) The sensations produced by electrical stimulation of
the visual cortex. J Physiol 196:479-93
Brummer S B, Robblee L S and Hambrecht F T (1983) Criteria for selecting electrodes for
electrical stimulation: theoretical and practical considerations. Ann N Y Acad Sci
405:159-71
Brummer S B and Turner M J (1977) Electrochemical considerations for safe electrical
stimulation of the nervous system with platinum electrodes. IEEE Trans Biomed
Eng 24:59-63
Clark G M (2003) Cochlear implants : fundamentals and applications / Graeme Clark
Editor Place New York : Springer
Cogan S F (2006) In vivo and in vitro differences in the charge-injection and
electrochemical properties of iridium oxide electrodes Journal 1 882-5
Cogan S F (2008) Neural Stimulation and Recording Electrodes. Annual Review of
Biomedical Engineering 10:275-309
Cogan S F (2008) Neural stimulation and recording electrodes. Annu Rev Biomed Eng
10:275-309

Donoghue J P (2008) Bridging the brain to the world: a perspective on neural interface
systems. Neuron 60:511-21
Dymond A M (1976) Characteristics of the metal-tissue interface of stimulation electrodes.
IEEE Trans Biomed Eng 23:274-80
Gunalan K, Warren D J, Perry J D, Normann R A and Clark G A (2009) An automated
system for measuring tip impedance and among-electrode shunting in high-
electrode count microelectrode arrays. J Neurosci Methods 178:263-9
Hornig R, Laube T, Walter P, Velikay-Parel M, Bornfeld N, Feucht M, Akguel H, Rossler
G, Alteheld N, Lutke Notarp D, Wyatt J and Richard G (2005) A method and
technical equipment for an acute human trial to evaluate retinal implant technology.
J Neural Eng 2:S129-34
Humayun M S, De Juan E, Jr., Weiland J D, Dagnelie G, Katona S, Greenberg R and
Suzuki S (1999) Pattern electrical stimulation of the human retina. Vision Res
39:2569-76
Mccreery D, Lossinsky A, Pikov V and Liu X (2006) Microelectrode array for chronic
deep-brain microstimulation and recording. IEEE Trans Biomed Eng 53:726-37

Mercanzini A, Colin P, Bensadoun J C, Bertsch A and Renaud P (2009) In vivo electrical
impedance spectroscopy of tissue reaction to microelectrode arrays. IEEE Trans
Biomed Eng 56:1909-18
Middlebrooks J C and Snyder R L (2008) Intraneural stimulation for auditory prosthesis:
modiolar trunk and intracranial stimulation sites. Hear Res 242:52-63
Mushahwar V K, Collins D F and Prochazka A (2000) Spinal cord microstimulation
generates functional limb movements in chronically implanted cats. Exp Neurol
163:422-9
Newbold C, Richardson R, Huang C Q, Milojevic D, Cowan R and Shepherd R (2004) An
in vitro model for investigating impedance changes with cell growth and electrical
stimulation: implications for cochlear implants. Journal of Neural Engineering
1:218-27
Newbold C, Richardson R, Huang C Q, Milojevic D, Cowan R and Shepherd R (2004) An
in vitro model for investigating impedance changes with cell growth and electrical
stimulation: implications for cochlear implants. J Neural Eng 1:218-27
Parker J R, Duan Y Y, Patrick J, Harrison H B, Reinhold O and Clark G M (1999) Testing
of thin-film electrode arrays for cochlear implants of the future Editor Place

Prochazka A and Mushahwar V K (2004) Spinal Cord and Rootlets In: Neuroprosthetics
Theory and Practice Horch, K W and Dhillon, G S Place Singapore World
Scientific 786-806
Rizzo J F, 3rd, Wyatt J, Loewenstein J, Kelly S and Shire D (2003) Perceptual efficacy of
electrical stimulation of human retina with a microelectrode array during short-term
surgical trials. Invest Ophthalmol Vis Sci 44:5362-9
Rose T L and Robblee L S (1990) Electrical stimulation with Pt electrodes. VIII.
Electrochemically safe charge injection limits with 0.2 ms pulses. IEEE Trans
Biomed Eng 37:1118-20
Schwartz A B (2004) Cortical neural prosthetics. Annu Rev Neurosci 27:487-507
Seligman P M and Shepherd R K (2004) Cochlear Implants In: Neuroprosthetics: Theory
and Practise Hoch, K and Dhillon, G Place Singapore World Scientific 878-904
Shah S, Hines A, Zhou D, Greenberg R J, Humayun M S and Weiland J D (2007)
Electrical properties of retinal-electrode interface. J Neural Eng 4:S24-9
Shepherd R K, Clark G M and Black R C (1983) Chronic electrical stimulation of the
auditory nerve in cats. Physiological and histopathological results. Acta
Otolaryngol Suppl 399:19-31

Shepherd R K, Franz B K-H and Clark G M (1990) The biocompatibility and safety of
cochlear prostheses In: Cochlear Prostheses Clark, G M, Tong, Y C and Patrick, J
F Place Melbourne Churchill Livingstone 69-98
Shivdasani M N, Luu C D, Cicione R, Fallon J B, Allen P J, Leuenberger J, Suaning G J,
Lovell N H, Shepherd R K and Williams C E (2010) Evaluation of stimulus
parameters and electrode geometry for an effective suprachoroidal retinal
prosthesis. J Neural Eng 7:036008
Suaning G J, Hallum L E, Preston P J and Lovell N H (2004) An efficient multiplexing
method for addressing large numbers of electrodes in a visual neuroprosthesis. Conf
Proc IEEE Eng Med Biol Soc 6:4174-7
Suaning G J, Hallum L E, Preston P J and Lovell N H (2004) An efficient multiplexing
method for addressing large numbers of electrodes in a visual neuroprosthesis
Journal 6 4174-7
Suner S, Fellows M R, Vargas-Irwin C, Nakata G K and Donoghue J P (2005) Reliability
of signals from a chronically implanted, silicon-based electrode array in non-human
primate primary motor cortex. IEEE Trans Neural Syst Rehabil Eng 13:524-41
Teorell T (1946) Application of "Square Wave Analysis" to Bioelectric Studies. Acta
Physiologica Scandinavica 12:235-54

Tykocinski M, Cohen L T and Cowan R S (2005) Measurement and analysis of access
resistance and polarization impedance in cochlear implant recipients. Otol Neurotol
26:948-56
Weiland J D and Anderson D J (2000) Chronic neural stimulation with thin-film, iridium
oxide electrodes. IEEE Trans Biomed Eng 47:911-8
Weinman J and Mahler J (1964) An Analysis of Electrical Properties of Metal Electrodes.
Med Electron Biol Eng 2:299-310
Xinyu C, Liming L, Kaijie W, Chuanqing Z, Pengjia C and Qiushi R (2008) C-Sight
Visual Prostheses for the Blind. IEEE Engineering in Medicine and Biology
Magazine 27:20-8
Xu J, Shepherd R, Millard R and Clark G (1997) Chronic electrical stimulation of the
auditory nerve at high stimulus rates: a physiological and histopathological study.
Hearing research 105:1-29
Xu J, Shepherd R K, Millard R E and Clark G M (1997) Chronic electrical stimulation of
the auditory nerve at high stimulus rates: a physiological and histopathological
study. Hear Res 105:1-29

Zrenner E, Bartz-Schmidt K U, Benav H, Besch D, Bruckmann A, Gabel V P, Gekeler F,
Greppmaier U, Harscher A, Kibbel S, Koch J, Kusnyerik A, Peters T, Stingl K,
Sachs H, Stett A, Szurman P, Wilhelm B and Wilke R (2010) Subretinal electronic
chips allow blind patients to read letters and combine them to words. Proceedings
of the Royal Society B: Biological Sciences

Figure 1 (Figure1.tiff)

Figure 2 (Figure2.tif)

Figure 3 (Figure3.tiff)

Figure 4 (Figure4.tiff)

Figure 5a (Figure5a.tif)

Figure 5b (Figure5b.tif)

Figure 6 (Figure6.tiff)

Figure 7 (Figure7.tif)

Figure 8 (Figure8.tif)