An atlas of Calcium triplet spectra of active galaxies
18
arXiv:astro-ph/0502478 v1 23 Feb 2005 Mon. Not. R. Astron. Soc. 000, 000–000 (0000) Printed 23 February 2005 (MN L A T E X style file v2.2) An atlas of Calcium triplet spectra of active galaxies A. Garcia-Rissmann 1⋆ , L. R. Vega 1,2 †, N. V. Asari 1 ‡, R. Cid Fernandes 1 §, H. Schmitt 3,4 ¶, R. M. Gonz´alez Delgado 5 ‖, T. Storchi-Bergmann 6⋆⋆ 1 Depto. de F´ ısica - CFM - Universidade Federal de Santa Catarina, C.P. 476, 88040-900, Florian´opolis, SC, Brazil 2 Observatorio Astron´omico de C´ordoba, Laprida 854, 5000, C´ordoba, Argentina 3 Remote Sensing Division, Code 7210, Naval Research Laboratory, 4555 Overlook Avenue, SW, Washington, DC 20375 4 Interferometric Inc., 14120 Parke Long Court, 103, Chantilly, VA20151 5 Instituto de Astrof´ ısica de Andaluc´ ıa (CSIC), P.O. Box 3004, 18080 Granada, Spain 6 Instituto de F´ ısica, Universidade Federal do Rio Grande do Sul, C.P. 15001, 91501-970, Porto Alegre, RS, Brazil 23 February 2005 ABSTRACT We present a spectroscopic atlas of active galactic nuclei covering the region around the λλ8498, 8542, 8662 Calcium triplet (CaT). The sample comprises 78 ob- jects, divided into 43 Seyfert 2s, 26 Seyfert 1s, 3 Starburst and 6 normal galaxies. The spectra pertain to the inner ∼ 300 pc in radius, and thus sample the central kine- matics and stellar populations of active galaxies. The data are used to measure stellar velocity dispersions (σ ⋆ ) both with cross-correlation and direct fitting methods. These measurements are found to be in good agreement with each-other and with those in previous studies for objects in common. The CaT equivalent width is also measured. We find average values and sample dispersions of W CaT of 4.6 ± 2.0, 7.0± and 7.7±1.0 ˚ A for Seyfert 1s, Seyfert 2s and normal galaxies, respectively. We further present an atlas of [SIII]λ9069 emission line profiles for a subset of 40 galaxies. These data are analyzed in a companion paper which addresses the connection between stellar and Narrow Line Region kinematics, the behaviour of the CaT equivalent width as a function of σ ⋆ , activity type and stellar population properties. Key words: galaxies: active - galaxies: Seyfert - galaxies: stellar content - galaxies: kinematics - galaxies: statistics 1 INTRODUCTION Fifteen years ago, Terlevich, D´ ıaz & Terlevich (1990, here- inafter TDT) carried out the first systematic study of the λλ8498,8542,8662 ˚ A absorption lines of the Ca II ion in ac- tive galactic nuclei (AGN). The main focus of that pioneer work on the “Calcium Triplet” (CaT) was on the equivalent width of this feature (WCaT), which provides both a stel- lar population diagnostic and a tool to investigate the pres- ence of an underlying non-stellar continuum. Most of the AGN in the TDT sample were type 2 Seyferts. Their main finding was that WCaT is remarkably similar for Seyfert 2s and normal galaxies, implying that the non-stellar feature- less continuum (FC) invoked to account for the dilution of ⋆ E-mail: [email protected] † E-mail: [email protected] ‡ E-mail: [email protected] § E-mail: [email protected] ¶ E-mail: [email protected] ‖ E-mail: [email protected] ⋆⋆ [email protected] optical absorption lines in these objects either is not feature- less at all or somehow disappears between optical and near- infrared (NIR) wavelengths. The interpretation advanced by TDT was that both the optical FC and the CaT lines are produced by a nuclear starburst. Subsequent work by the same group suggests that this may also apply to at least some type 1 Seyferts (Jim´ enez-Benito et al. 2000), although in the more active of these objects the AGN continuum does cause some dilution of the CaT. Since then, the existence of starbursts around Seyfert 2 nuclei has been established by both indirect means (Cid Fer- nandes & Terlevich 1995; Heckman et al. 1995; Oliva et al. 1999) and direct detections of young stars by optical–UV imaging and spectroscopy (Heckman etal. 1997; Gonz´alez Delgado, Heckman & Leitherer 2001). While these stud- ies confirmed that the optical FC of Seyfert 2s is predom- inantly due to recent star-formation, there are still doubts as to whether the CaT is produced by these starbursts or by older stars in the host galaxy bulge. In other words, it is not clear whether the CaT can be used to diagnose the pres- ence of starbursts. Indeed, the mere fact that WCaT shows
-
Upload
independent -
Category
Documents
-
view
0 -
download
0
Transcript of An atlas of Calcium triplet spectra of active galaxies

arX
iv:a
stro
-ph/
0502
478
v1
23 F
eb 2
005
Mon. Not. R. Astron. Soc. 000, 000–000 (0000) Printed 23 February 2005 (MN LATEX style file v2.2)
An atlas of Calcium triplet spectra of active galaxies
A. Garcia-Rissmann1⋆, L. R. Vega1,2†, N. V. Asari1‡, R. Cid Fernandes1§,H. Schmitt3,4¶, R. M. Gonzalez Delgado5‖, T. Storchi-Bergmann6⋆⋆
1 Depto. de Fısica - CFM - Universidade Federal de Santa Catarina, C.P. 476, 88040-900, Florianopolis, SC, Brazil2 Observatorio Astronomico de Cordoba, Laprida 854, 5000, Cordoba, Argentina3 Remote Sensing Division, Code 7210, Naval Research Laboratory, 4555 Overlook Avenue, SW, Washington, DC 203754 Interferometric Inc., 14120 Parke Long Court, 103, Chantilly, VA201515 Instituto de Astrofısica de Andalucıa (CSIC), P.O. Box 3004, 18080 Granada, Spain6 Instituto de Fısica, Universidade Federal do Rio Grande do Sul, C.P. 15001, 91501-970, Porto Alegre, RS, Brazil
23 February 2005
ABSTRACT
We present a spectroscopic atlas of active galactic nuclei covering the regionaround the λλ8498, 8542, 8662 Calcium triplet (CaT). The sample comprises 78 ob-jects, divided into 43 Seyfert 2s, 26 Seyfert 1s, 3 Starburst and 6 normal galaxies. Thespectra pertain to the inner ∼ 300 pc in radius, and thus sample the central kine-matics and stellar populations of active galaxies. The data are used to measure stellarvelocity dispersions (σ⋆) both with cross-correlation and direct fitting methods. Thesemeasurements are found to be in good agreement with each-other and with those inprevious studies for objects in common. The CaT equivalent width is also measured.We find average values and sample dispersions of WCaT of 4.6±2.0, 7.0± and 7.7±1.0A for Seyfert 1s, Seyfert 2s and normal galaxies, respectively. We further presentan atlas of [SIII]λ9069 emission line profiles for a subset of 40 galaxies. These dataare analyzed in a companion paper which addresses the connection between stellarand Narrow Line Region kinematics, the behaviour of the CaT equivalent width as afunction of σ⋆, activity type and stellar population properties.
Key words: galaxies: active - galaxies: Seyfert - galaxies: stellar content - galaxies:kinematics - galaxies: statistics
1 INTRODUCTION
Fifteen years ago, Terlevich, Dıaz & Terlevich (1990, here-inafter TDT) carried out the first systematic study of theλλ8498,8542,8662 A absorption lines of the Ca II ion in ac-tive galactic nuclei (AGN). The main focus of that pioneerwork on the “Calcium Triplet” (CaT) was on the equivalentwidth of this feature (WCaT), which provides both a stel-lar population diagnostic and a tool to investigate the pres-ence of an underlying non-stellar continuum. Most of theAGN in the TDT sample were type 2 Seyferts. Their mainfinding was that WCaT is remarkably similar for Seyfert 2sand normal galaxies, implying that the non-stellar feature-less continuum (FC) invoked to account for the dilution of
⋆ E-mail: [email protected]† E-mail: [email protected]‡ E-mail: [email protected]§ E-mail: [email protected]¶ E-mail: [email protected]‖ E-mail: [email protected]⋆⋆ [email protected]
optical absorption lines in these objects either is not feature-less at all or somehow disappears between optical and near-infrared (NIR) wavelengths. The interpretation advanced byTDT was that both the optical FC and the CaT lines areproduced by a nuclear starburst. Subsequent work by thesame group suggests that this may also apply to at leastsome type 1 Seyferts (Jimenez-Benito et al. 2000), althoughin the more active of these objects the AGN continuum doescause some dilution of the CaT.
Since then, the existence of starbursts around Seyfert 2nuclei has been established by both indirect means (Cid Fer-nandes & Terlevich 1995; Heckman et al. 1995; Oliva et al.1999) and direct detections of young stars by optical–UVimaging and spectroscopy (Heckman et al. 1997; GonzalezDelgado, Heckman & Leitherer 2001). While these stud-ies confirmed that the optical FC of Seyfert 2s is predom-inantly due to recent star-formation, there are still doubtsas to whether the CaT is produced by these starbursts orby older stars in the host galaxy bulge. In other words, it isnot clear whether the CaT can be used to diagnose the pres-ence of starbursts. Indeed, the mere fact that WCaT shows
2 Garcia-Rissmann et al.
little variation among galaxies of widely different morpho-logical and spectroscopic properties indicates that this fea-ture may not be as simple a tracer of stellar populations asinitially thought. Recent empirical and theoretical work re-inforce this idea (Cenarro et al. 2003, 2004; Saglia et al. 2002;Falcon-Barroso et al. 2003; Michielsen et al. 2003; Thomas,Maraston & Bender 2003; Vazdekis et al. 2003), and showthat there is still much to be learned about the CaT be-haviour even in normal galaxies.
A more widespread use of the CaT nowadays is to mea-sure stellar velocity dispersions (σ⋆). This was the approachfollowed by Nelson & Whittle (1995 and 1996; hereinaftercollectively revered to as NW) in their comprehensive studyof stellar and gaseous kinematics of AGN. The discovery ofthe relation between black-hole mass (MBH) and σ⋆ (Fer-rarese & Merrit 2000; Gebhardt et al. 2000; Tremaine et al.2002) brought renewed interest in this kind of work. Indeed,most of the current observational CaT studies in AGN aregeared towards using this spectroscopic feature as an indi-rect black-hole weighing-scale (Ferrarese et al. 2001; Barth,Ho & Sargent 2002, 2003; Filippenko & Ho 2003; Barth et al.2004; Botte et al. 2004; Nelson et al. 2004; Onken et al. 2004;Barth, Greene & Ho 2005). Finally, velocity dispersions arealso useful to investigate stellar populations. Combined withsize and luminosity measurements, σ⋆ allows the estimationof the mass-to-light ratio, which is a strong function of theage in stellar systems. There have been few applications ofthis idea to AGN, but the results reported so far seem to fitthe scenario where active nuclei tend to be surrounded bystellar populations younger than those typical of ellipticalgalaxies and bulges (NW; Oliva et al. 1995; 1999).
This brief summary illustrates that there is plenty ofmotivation to study the CaT in both active and normalgalaxies. In this paper we present an atlas of CaT spec-tra and related data products for a sample of 78 galaxies,most of which have active nuclei. This material is used ina companion paper (Vega et al. 2005, hereafter Paper II) toaddress issues such as the connection between nebular andstellar kinematics, the sensitivity of WCaT to stellar popu-lation properties, and constraints on the contribution of anon-stellar component to the NIR spectra of AGN.
This paper is organized as follows. Section 2 describesthe sample, observations and data reduction. Section 3presents our atlas of CaT spectra, as well as [SIII]λ9069emission line profiles for a subset of the objects. Measure-ments of stellar velocity dispersions are presented Section 4,while Section 5 presents results on the equivalent width ofthe CaT. Finally, Section 6 summarizes our main results.
2 OBSERVATIONS
The data presented here were obtained in 6 runs in 3 differ-ent telescopes: two at the 1.52m ESO-La Silla (39 galaxies),two at the KPNO 2.1m (25 galaxies), and two at the KPNO4m telescope (16 galaxies). Although the original projectshad somewhat different specific goals, they all centered onthe measurement of the CaT in AGN. We have thus decidedto merge all the CaT-related data in a single atlas containingthe nuclear spectra and associated data-products, processedin a way as homogeneous as possible. This section describes
the observations, reduction process and the general sampleproperties.
2.1 ESO 1.52m observations
Most of the Southern objects in the sample have beenobserved with the Boller & Chivens spectrograph cou-pled at the Cassegrain focus (f/14.9) of the now extinct1.52m telescope, located in ESO-La Silla (Chile), during tworuns (2002 March and October). Similar setups have beenadopted in both runs, with a grating of 900 l/mm (# 5) cen-tered at about 7230 A, giving a dispersion of 1.32 A pix−1
on the CCD #38 (2688×512 pixels2, each pixel with a 15µmsize). The slit width of 2′′ adopted for all the program ob-jects (which comprise the galaxies and the template stars)provided a resolution σinst of about 56 and 44 km/s for thespectra of March and October, respectively, as measuredthrough sky emission lines. The slit was always aligned inthe E-W direction (P.A. = 90◦), and was long enough (4.5′)as to guarantee the inclusion of enough sky to allow its sub-traction from the galaxies spectra. The plate scale on theCCD was 0.82′′ pix−1, and the wavelengths covered by theobservations ranged from ∼ 6300 to 9500 A. Wavelengthcalibration was performed using a HeNeArFe lamp spectrataken in each telescope position. A log of the observationsis presented in Table 1. A series of velocity standard stars,listed in Table 4, have also been observed with the samesetup and used as templates in the determination of σ⋆ (§4).
Since fringing effects in the NIR can be a serious concern(see below), internal flats made with a Quartz lamp havealso been acquired (only in the first run) for every telescopepointing. Twilight flats have also been taken, generally atthe sunset, to be used for the illumination correction. Spec-trophotometric standard stars from Hamuy et al. (1994),Oke (1990), Massey et al. (1988) and Massey & Gronwal(1990) were observed (at least 2 per night), always with theslit wide open (5–8′′), for flux calibration. Given the variableatmospheric conditions (particularly in the October run) ourabsolute flux scale is uncertain, but this has no consequencefor the results reported in this paper, since we report onlyrelative measurements.
2.2 KPNO 2.1m observations
A total of 25 Northern galaxies were observed on 2 observingruns with the KPNO 2.1m telescope, on the nights of 2002-Nov-12/13-14/15 and 2003-Feb-17/18-19/20. The observa-tional setup was the same in both runs, resulting in spectraof similar quality to those obtained for the ESO sample. Weused the Gold Camera Spectrograph with grating #35 anda slit width of 2′′. The slit was oriented in the E-W directionduring the first run and in the N-S direction in the secondone. This configuration gives a plate scale of 0.78′′ pix−1, aspectral resolution of 1.24 A pix−1 and a wavelength cover-age of ∼ 6800–9300 A. The spectral resolution for these datais σinst ∼ 57 km/s. A log of the observations is presented inTable 2.
The observation of each galaxy was preceded and fol-lowed by internal Quartz lamp flat-field frames (for fringingcorrections) and HeNeAr wavelength calibration frames. Inthe case of flux and velocity standard stars, which required
An atlas of Calcium triplet spectra of active galaxies 3
Object Activity vrad (km/s) Morph Type T Date Exp. time (s) Flag
NGC 526A Sy1.5 5725 S0 pec? 0.0 04 Oct 2002 (2x)1800 cNGC 526B Normal 5669 SB0: pec 0.0 04 Oct 2002 (1x)1500 cNGC 1125 Sy2 3277 SB(r)0+ -1.0 30 Sep 2002 (3x)1500 cNGC 1140 HII/Sy2 1501 IBm pec 10.0 03 Oct 2002 (3x)1500 cNGC 1365 Sy1.8 1636 (R’)SBb(s)b 3.0 02 Oct 2002 (3x)1500 dNGC 1380 Normal 1877 SA0 0.0 30 Sep 2002 (2x)1500 cNGC 1433 Sy2 1075 (R’1)SB(rs)ab 2.0 01 Oct 2002 (3x)1500 bNGC 1672 Sy2 1350 (R’1)SB(r)bc 4.0 03 Oct 2002 (2x)1500 aNGC 1808 Sy2 1000 (R’1)SAB(s:)b 3.0 04 Oct 2002 (2x)1200 aNGC 2997 Normal 1087 SA(s)c 5.0 11 Mar 2002 (2x)1200 aNGC 3081 Sy2 2385 (R’1)SAB(r)0 0.0 09 Mar 2002 (4x)1200 aNGC 3115 Sy2 720 S0- -3.0 11 Mar 2002 (1x)600 aNGC 3256 HII 2738 Pec; merger ? 12 Mar 2002 (1x)900,(1x)1200 bNGC 3281 Sy2 3200 SAB(rs+)a 1.0 10 Mar 2002 (4x)1200 bNGC 3783 Sy1 2717 (R’)SB(r)a 1.0 09 Mar 2002 (5x)1200 aNGC 4507 Sy1.9 3538 SAB(s)ab 2.0 11 Mar 2002 (3x)1800 aNGC 4593 Sy1 2698 (R)SB(rs)b 3.0 11 Mar 2002 (3x)1800 cNGC 4748 Sy1 (NLSy1) 4386 Sa 1.0* 12 Mar 2002 (3x)1800 cNGC 4968 Sy2 2957 (R’)SAB00 -2.0 12 Mar 2002 (2x)1800 aNGC 5135 Sy2 4112 SB(1)ab 2.0 11 Mar 2002 (2x)1800 aNGC 6300 Sy2 1110 SB(rs)b 3.0 12 Mar 2002 (2x)1800 aNGC 6814 Sy1.5 1563 SAB(rs)bc 4.0 04 Oct 2002 (3x)1500 bNGC 6860 Sy1 4462 (R’)SB(r)ab 2.0 03 Oct 2002 (3x)1500 cNGC 6907 Normal 3161 SB(s)bc 4.0 30 Set 2002 (3x)1500 cNGG 7130 Sy2/L 4842 Sa pec 1.0 30 Sep 2002 (3x)1500 bNGC 7172 Sy2 2603 Sa pec sp 1.0 02 Oct 2002 (3x)1500 aNGC 7184 Normal 2617 SB(r)c 5.0 02 Oct 2002 (3x)1500 aNGC 7410 Sy2/L 1751 SB(s)a 1.0 04 Oct 2002 (2x)1800 aNGC 7496 Sy2 1649 (R’:)SB(rs)bc 4.0 02 Oct 2002 (3x)1500 cNGC 7582 Sy2 1575 (R’1)SB(s)ab 2.0 03 Oct 2002 (2x)1800 a
NGC 7590 Sy2 1596 S(r?)bc 4.0 30 Sep 2002 (3x)1500 aNGC 7714 HII/L 2798 SB(s)b:pec 3.0 04 Oct 2002 (2x)1200,(1x)1500 bIC 2560 Sy2 2925 (R’:)SB(r)bc 4.0 12 Mar 2002 (3x)1800 aIC 3639 Sy2 3275 SB(rs)bc: 4.0 10 Mar 2002 (3x)1800 aIC 5169 Sy2 3016 (R’1)SAB(r)0+ -1.0 01 Oct 2002 (3x)1500 cESO 362G08 Sy2 4785 Sa 1.0* 09 Mar 2002 (4x)1200 aESO 362G18 Sy1.5 3790 S0/a 0.0* 10 Mar 2002 (3x)1800 aMCG-6.30.15 Sy1.2 2323 E-S0 -2.0* 10 Mar 2002 (3x)1800 aMrk 1210 Sy2 4046 Sa 1.0* 11 Mar 2002 (3x)1800 b
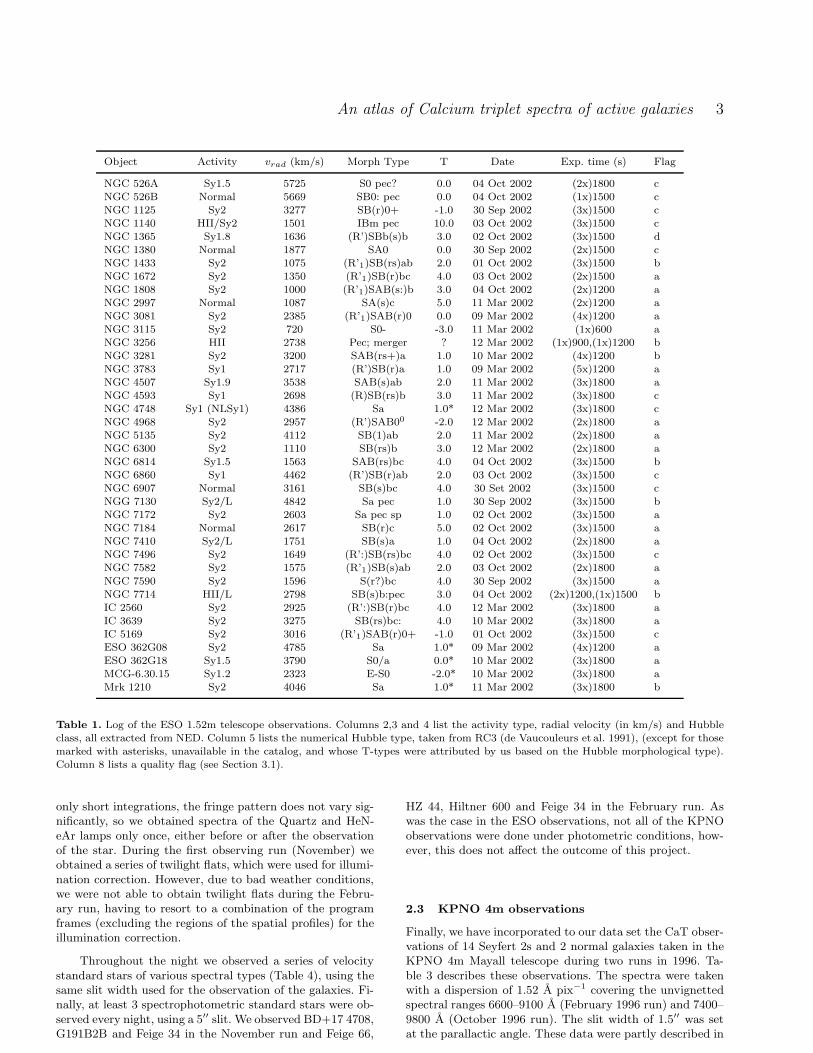
Table 1. Log of the ESO 1.52m telescope observations. Columns 2,3 and 4 list the activity type, radial velocity (in km/s) and Hubbleclass, all extracted from NED. Column 5 lists the numerical Hubble type, taken from RC3 (de Vaucouleurs et al. 1991), (except for thosemarked with asterisks, unavailable in the catalog, and whose T-types were attributed by us based on the Hubble morphological type).Column 8 lists a quality flag (see Section 3.1).
only short integrations, the fringe pattern does not vary sig-nificantly, so we obtained spectra of the Quartz and HeN-eAr lamps only once, either before or after the observationof the star. During the first observing run (November) weobtained a series of twilight flats, which were used for illumi-nation correction. However, due to bad weather conditions,we were not able to obtain twilight flats during the Febru-ary run, having to resort to a combination of the programframes (excluding the regions of the spatial profiles) for theillumination correction.
Throughout the night we observed a series of velocitystandard stars of various spectral types (Table 4), using thesame slit width used for the observation of the galaxies. Fi-nally, at least 3 spectrophotometric standard stars were ob-served every night, using a 5′′ slit. We observed BD+17 4708,G191B2B and Feige 34 in the November run and Feige 66,
HZ 44, Hiltner 600 and Feige 34 in the February run. Aswas the case in the ESO observations, not all of the KPNOobservations were done under photometric conditions, how-ever, this does not affect the outcome of this project.
2.3 KPNO 4m observations
Finally, we have incorporated to our data set the CaT obser-vations of 14 Seyfert 2s and 2 normal galaxies taken in theKPNO 4m Mayall telescope during two runs in 1996. Ta-ble 3 describes these observations. The spectra were takenwith a dispersion of 1.52 A pix−1 covering the unvignettedspectral ranges 6600–9100 A (February 1996 run) and 7400–9800 A (October 1996 run). The slit width of 1.5′′ was setat the parallactic angle. These data were partly described in
4 Garcia-Rissmann et al.
Object Activity vrad (km/s) Morph Type T Date Exp. time (s) Flag
Mrk 40 Sy1 6323 S0 pec -2.0 20 Feb 2003 (4x)1200 bMrk 79 Sy1.2 6652 SBb 3.0 14 Nov 2002 (3x)1200 dMrk 372 Sy1.5 9300 S0/a 0.0* 20 Feb 2003 (3x)1200 aMrk 461 Sy2 4856 S0 -2.0* 19 Feb 2003 (3x)1200 bMrk 516 Sy1.8 8519 Sc 6.0* 15 Nov 2002 (3x)1200 bMrk 705 Sy1.2 8739 S0? -2.0 15 Nov 2002 (3x)1200 cMrk 915 Sy1 7228 Sb 3.0* 15 Nov 2002 (3x)1200 bMrk 1210 Sy1/Sy2 4046 Sa 1.0* 13 Nov 2002 (3x)1200 aMrk 1239 Sy1.5 (NLSy1) 5974 E-S0 -3.0* 19 Feb 2003 (3x)1200 dUGC 3478 Sy1.2 3828 Sb 3.0 20 Feb 2003 (4x)1200 dUGC 1395 Sy1.9 5208 SA(rs)b 3.0 14 Nov 2002 (3x)1200 bUGC 12138 Sy1.8 7487 SBa 1.0 13 Nov 2002 (3x)1200 bUGC 12348 Sy2 7631 Sa 1.0 15 Nov 2002 (3x)1200 aNGC 1019 Sy1 7251 SB(rs)bc 4.0 14 Nov 2002 (3x)1200 aNGC 1142 Sy2 8648 S pec (Ring B) 1.0 14 Nov 2002 (3x)1200 cNGC 1241 Sy2 4052 SB(rs)b 3.0 15 Nov 2002 (3x)1200 aNGC 2639 Sy1.9 3336 (R)SA(r)a:? 1.0 13 Nov 2002 (3x)1200 aNGC 6951 L/Sy2 1424 SAB(rs)bc 4.0 14 Nov 2002 (2x)1200 aNGC 7469 Sy1.2 4892 (R’)SAB(rs)a 1.0 13 Nov 2002 (3x)1200 aIRAS 01475-0740 Sy2 5296 E-S0 -3.0* 13 Nov 2002 (3x)1200 cIRAS 04502-0317 Sy2 4737 SB0/a 0.0 15 Nov 2002 (3x)1200 cMCG -01-24-012 Sy2 5936 SAB(rs)c: 5.0 14 Nov 2002 (3x)1200 cMCG -02-08-039 Sy2 8989 SAB(rs)a pec: 1.0 15 Nov 2002 (3x)1200 bMCG +8-11-11 Sy1.5 6141 SB0 -2.0* 13 Nov 2002 (3x)1200 dAkn 564 Sy1.8 (NLSy1) 7400 SB 0.0 14 Nov 2002 (3x)1200 d
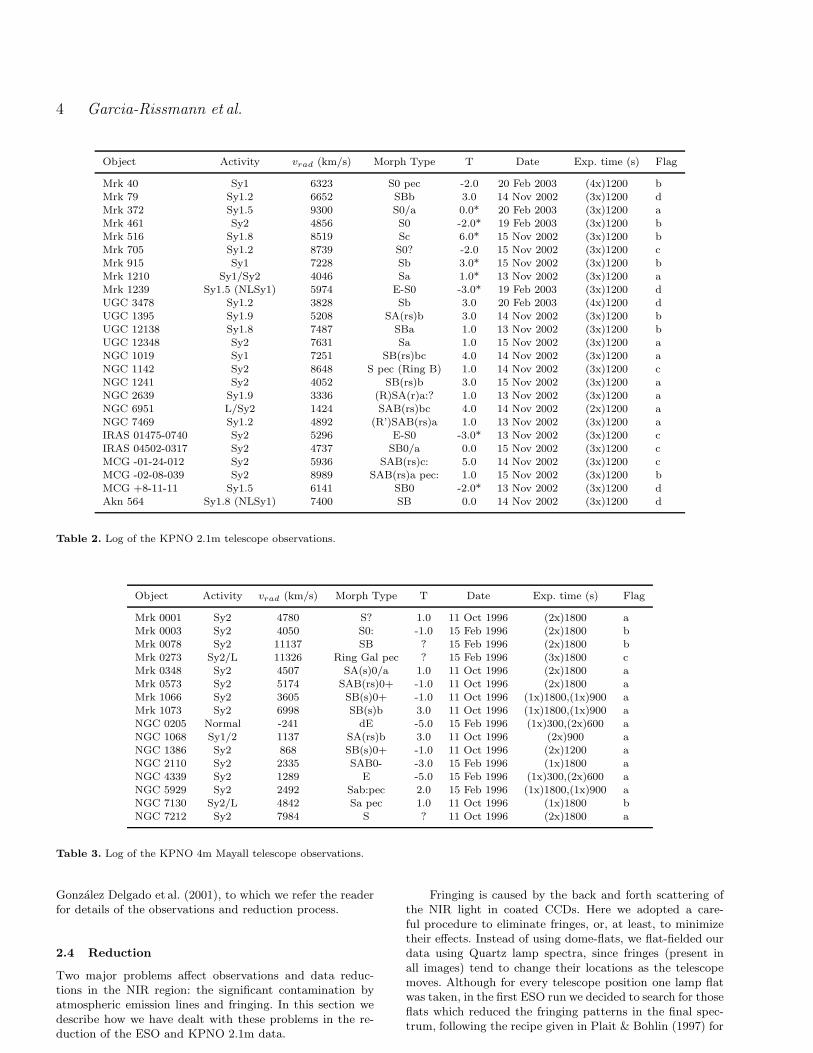
Table 2. Log of the KPNO 2.1m telescope observations.
Object Activity vrad (km/s) Morph Type T Date Exp. time (s) Flag
Mrk 0001 Sy2 4780 S? 1.0 11 Oct 1996 (2x)1800 aMrk 0003 Sy2 4050 S0: -1.0 15 Feb 1996 (2x)1800 bMrk 0078 Sy2 11137 SB ? 15 Feb 1996 (2x)1800 bMrk 0273 Sy2/L 11326 Ring Gal pec ? 15 Feb 1996 (3x)1800 cMrk 0348 Sy2 4507 SA(s)0/a 1.0 11 Oct 1996 (2x)1800 aMrk 0573 Sy2 5174 SAB(rs)0+ -1.0 11 Oct 1996 (2x)1800 aMrk 1066 Sy2 3605 SB(s)0+ -1.0 11 Oct 1996 (1x)1800,(1x)900 aMrk 1073 Sy2 6998 SB(s)b 3.0 11 Oct 1996 (1x)1800,(1x)900 aNGC 0205 Normal -241 dE -5.0 15 Feb 1996 (1x)300,(2x)600 aNGC 1068 Sy1/2 1137 SA(rs)b 3.0 11 Oct 1996 (2x)900 aNGC 1386 Sy2 868 SB(s)0+ -1.0 11 Oct 1996 (2x)1200 aNGC 2110 Sy2 2335 SAB0- -3.0 15 Feb 1996 (1x)1800 aNGC 4339 Sy2 1289 E -5.0 15 Feb 1996 (1x)300,(2x)600 aNGC 5929 Sy2 2492 Sab:pec 2.0 15 Feb 1996 (1x)1800,(1x)900 aNGC 7130 Sy2/L 4842 Sa pec 1.0 11 Oct 1996 (1x)1800 bNGC 7212 Sy2 7984 S ? 11 Oct 1996 (2x)1800 a
Table 3. Log of the KPNO 4m Mayall telescope observations.
Gonzalez Delgado et al. (2001), to which we refer the readerfor details of the observations and reduction process.
2.4 Reduction
Two major problems affect observations and data reduc-tions in the NIR region: the significant contamination byatmospheric emission lines and fringing. In this section wedescribe how we have dealt with these problems in the re-duction of the ESO and KPNO 2.1m data.
Fringing is caused by the back and forth scattering ofthe NIR light in coated CCDs. Here we adopted a care-ful procedure to eliminate fringes, or, at least, to minimizetheir effects. Instead of using dome-flats, we flat-fielded ourdata using Quartz lamp spectra, since fringes (present inall images) tend to change their locations as the telescopemoves. Although for every telescope position one lamp flatwas taken, in the first ESO run we decided to search for thoseflats which reduced the fringing patterns in the final spec-trum, following the recipe given in Plait & Bohlin (1997) for
An atlas of Calcium triplet spectra of active galaxies 5
Star Spectral Type Telescope
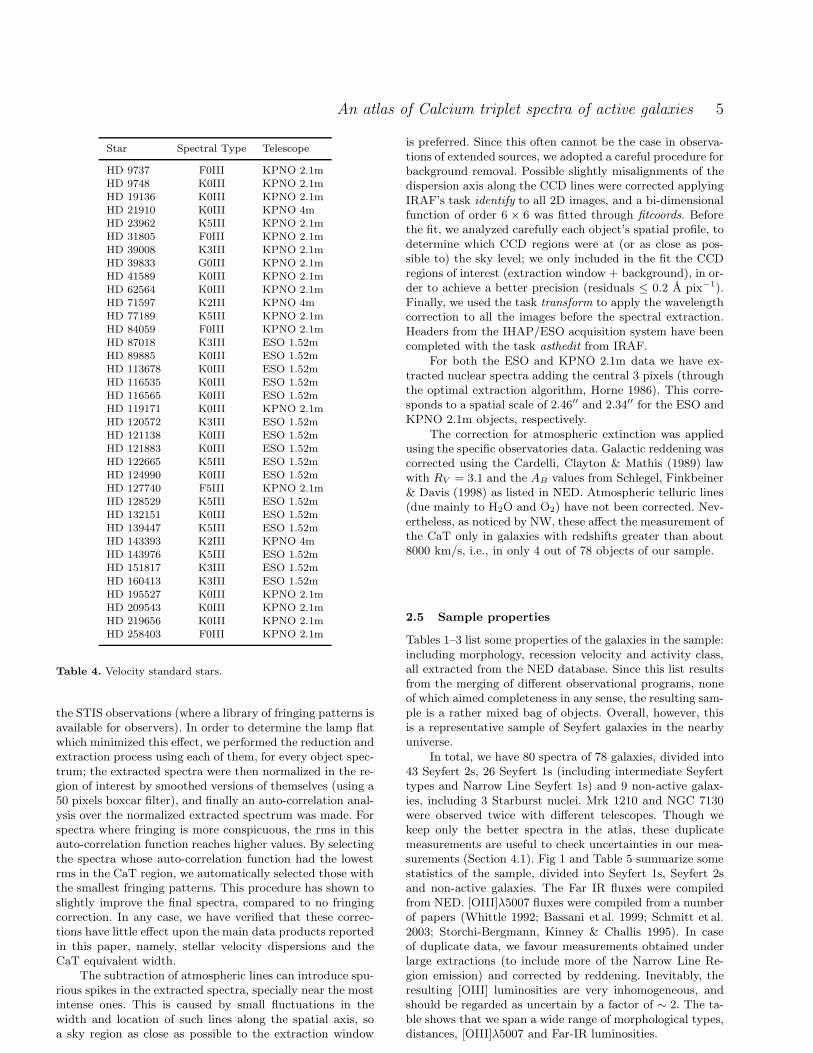
HD 9737 F0III KPNO 2.1mHD 9748 K0III KPNO 2.1mHD 19136 K0III KPNO 2.1mHD 21910 K0III KPNO 4mHD 23962 K5III KPNO 2.1mHD 31805 F0III KPNO 2.1mHD 39008 K3III KPNO 2.1mHD 39833 G0III KPNO 2.1mHD 41589 K0III KPNO 2.1mHD 62564 K0III KPNO 2.1mHD 71597 K2III KPNO 4mHD 77189 K5III KPNO 2.1mHD 84059 F0III KPNO 2.1mHD 87018 K3III ESO 1.52mHD 89885 K0III ESO 1.52mHD 113678 K0III ESO 1.52mHD 116535 K0III ESO 1.52mHD 116565 K0III ESO 1.52mHD 119171 K0III KPNO 2.1mHD 120572 K3III ESO 1.52mHD 121138 K0III ESO 1.52mHD 121883 K0III ESO 1.52mHD 122665 K5III ESO 1.52mHD 124990 K0III ESO 1.52mHD 127740 F5III KPNO 2.1mHD 128529 K5III ESO 1.52mHD 132151 K0III ESO 1.52mHD 139447 K5III ESO 1.52mHD 143393 K2III KPNO 4mHD 143976 K5III ESO 1.52mHD 151817 K3III ESO 1.52m
HD 160413 K3III ESO 1.52mHD 195527 K0III KPNO 2.1mHD 209543 K0III KPNO 2.1mHD 219656 K0III KPNO 2.1mHD 258403 F0III KPNO 2.1m
Table 4. Velocity standard stars.
the STIS observations (where a library of fringing patterns isavailable for observers). In order to determine the lamp flatwhich minimized this effect, we performed the reduction andextraction process using each of them, for every object spec-trum; the extracted spectra were then normalized in the re-gion of interest by smoothed versions of themselves (using a50 pixels boxcar filter), and finally an auto-correlation anal-ysis over the normalized extracted spectrum was made. Forspectra where fringing is more conspicuous, the rms in thisauto-correlation function reaches higher values. By selectingthe spectra whose auto-correlation function had the lowestrms in the CaT region, we automatically selected those withthe smallest fringing patterns. This procedure has shown toslightly improve the final spectra, compared to no fringingcorrection. In any case, we have verified that these correc-tions have little effect upon the main data products reportedin this paper, namely, stellar velocity dispersions and theCaT equivalent width.
The subtraction of atmospheric lines can introduce spu-rious spikes in the extracted spectra, specially near the mostintense ones. This is caused by small fluctuations in thewidth and location of such lines along the spatial axis, soa sky region as close as possible to the extraction window
is preferred. Since this often cannot be the case in observa-tions of extended sources, we adopted a careful procedure forbackground removal. Possible slightly misalignments of thedispersion axis along the CCD lines were corrected applyingIRAF’s task identify to all 2D images, and a bi-dimensionalfunction of order 6 × 6 was fitted through fitcoords. Beforethe fit, we analyzed carefully each object’s spatial profile, todetermine which CCD regions were at (or as close as pos-sible to) the sky level; we only included in the fit the CCDregions of interest (extraction window + background), in or-der to achieve a better precision (residuals ≤ 0.2 A pix−1).Finally, we used the task transform to apply the wavelengthcorrection to all the images before the spectral extraction.Headers from the IHAP/ESO acquisition system have beencompleted with the task asthedit from IRAF.
For both the ESO and KPNO 2.1m data we have ex-tracted nuclear spectra adding the central 3 pixels (throughthe optimal extraction algorithm, Horne 1986). This corre-sponds to a spatial scale of 2.46′′ and 2.34′′ for the ESO andKPNO 2.1m objects, respectively.
The correction for atmospheric extinction was appliedusing the specific observatories data. Galactic reddening wascorrected using the Cardelli, Clayton & Mathis (1989) lawwith RV = 3.1 and the AB values from Schlegel, Finkbeiner& Davis (1998) as listed in NED. Atmospheric telluric lines(due mainly to H2O and O2) have not been corrected. Nev-ertheless, as noticed by NW, these affect the measurement ofthe CaT only in galaxies with redshifts greater than about8000 km/s, i.e., in only 4 out of 78 objects of our sample.
2.5 Sample properties
Tables 1–3 list some properties of the galaxies in the sample:including morphology, recession velocity and activity class,all extracted from the NED database. Since this list resultsfrom the merging of different observational programs, noneof which aimed completeness in any sense, the resulting sam-ple is a rather mixed bag of objects. Overall, however, thisis a representative sample of Seyfert galaxies in the nearbyuniverse.
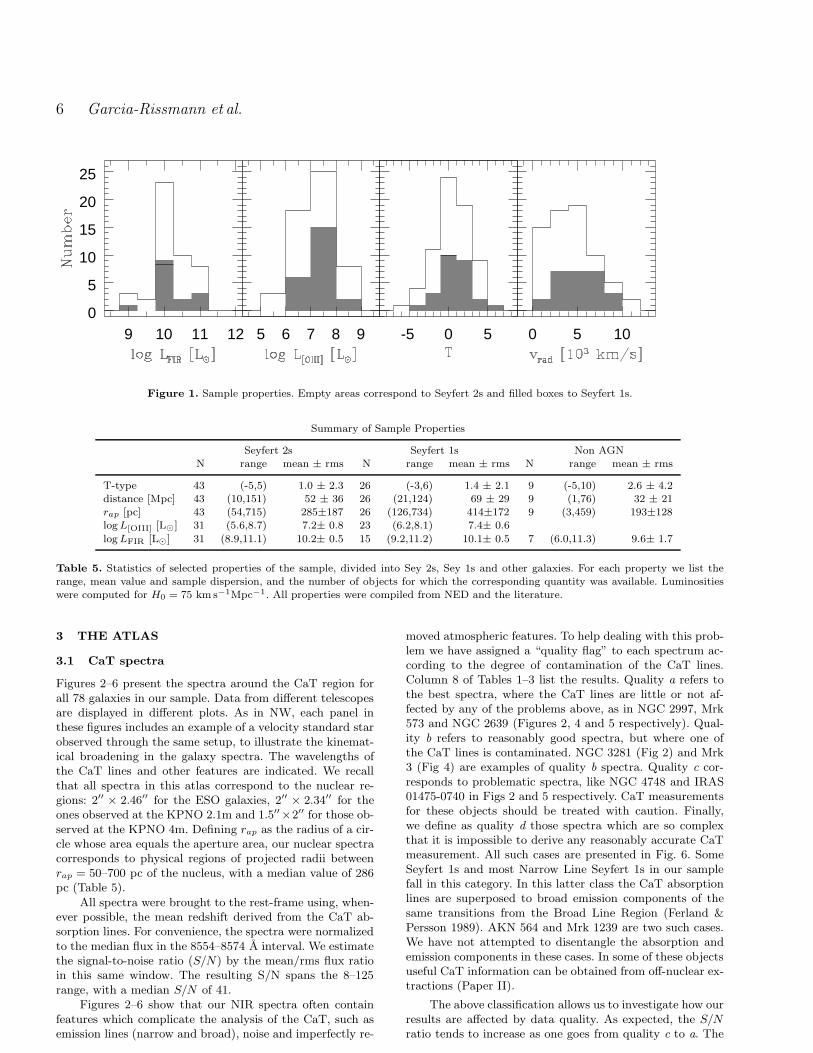
In total, we have 80 spectra of 78 galaxies, divided into43 Seyfert 2s, 26 Seyfert 1s (including intermediate Seyferttypes and Narrow Line Seyfert 1s) and 9 non-active galax-ies, including 3 Starburst nuclei. Mrk 1210 and NGC 7130were observed twice with different telescopes. Though wekeep only the better spectra in the atlas, these duplicatemeasurements are useful to check uncertainties in our mea-surements (Section 4.1). Fig 1 and Table 5 summarize somestatistics of the sample, divided into Seyfert 1s, Seyfert 2sand non-active galaxies. The Far IR fluxes were compiledfrom NED. [OIII]λ5007 fluxes were compiled from a numberof papers (Whittle 1992; Bassani et al. 1999; Schmitt et al.2003; Storchi-Bergmann, Kinney & Challis 1995). In caseof duplicate data, we favour measurements obtained underlarge extractions (to include more of the Narrow Line Re-gion emission) and corrected by reddening. Inevitably, theresulting [OIII] luminosities are very inhomogeneous, andshould be regarded as uncertain by a factor of ∼ 2. The ta-ble shows that we span a wide range of morphological types,distances, [OIII]λ5007 and Far-IR luminosities.
6 Garcia-Rissmann et al.
9 10 11 120
5
10
15
20
25
5 6 7 8 9 -5 0 5 0 5 10
Figure 1. Sample properties. Empty areas correspond to Seyfert 2s and filled boxes to Seyfert 1s.
Summary of Sample Properties
Seyfert 2s Seyfert 1s Non AGNN range mean ± rms N range mean ± rms N range mean ± rms
T-type 43 (-5,5) 1.0 ± 2.3 26 (-3,6) 1.4 ± 2.1 9 (-5,10) 2.6 ± 4.2distance [Mpc] 43 (10,151) 52 ± 36 26 (21,124) 69 ± 29 9 (1,76) 32 ± 21rap [pc] 43 (54,715) 285±187 26 (126,734) 414±172 9 (3,459) 193±128log L[OIII] [L⊙] 31 (5.6,8.7) 7.2± 0.8 23 (6.2,8.1) 7.4± 0.6
log LFIR [L⊙] 31 (8.9,11.1) 10.2± 0.5 15 (9.2,11.2) 10.1± 0.5 7 (6.0,11.3) 9.6± 1.7
Table 5. Statistics of selected properties of the sample, divided into Sey 2s, Sey 1s and other galaxies. For each property we list therange, mean value and sample dispersion, and the number of objects for which the corresponding quantity was available. Luminositieswere computed for H0 = 75 km s−1Mpc−1. All properties were compiled from NED and the literature.
3 THE ATLAS
3.1 CaT spectra
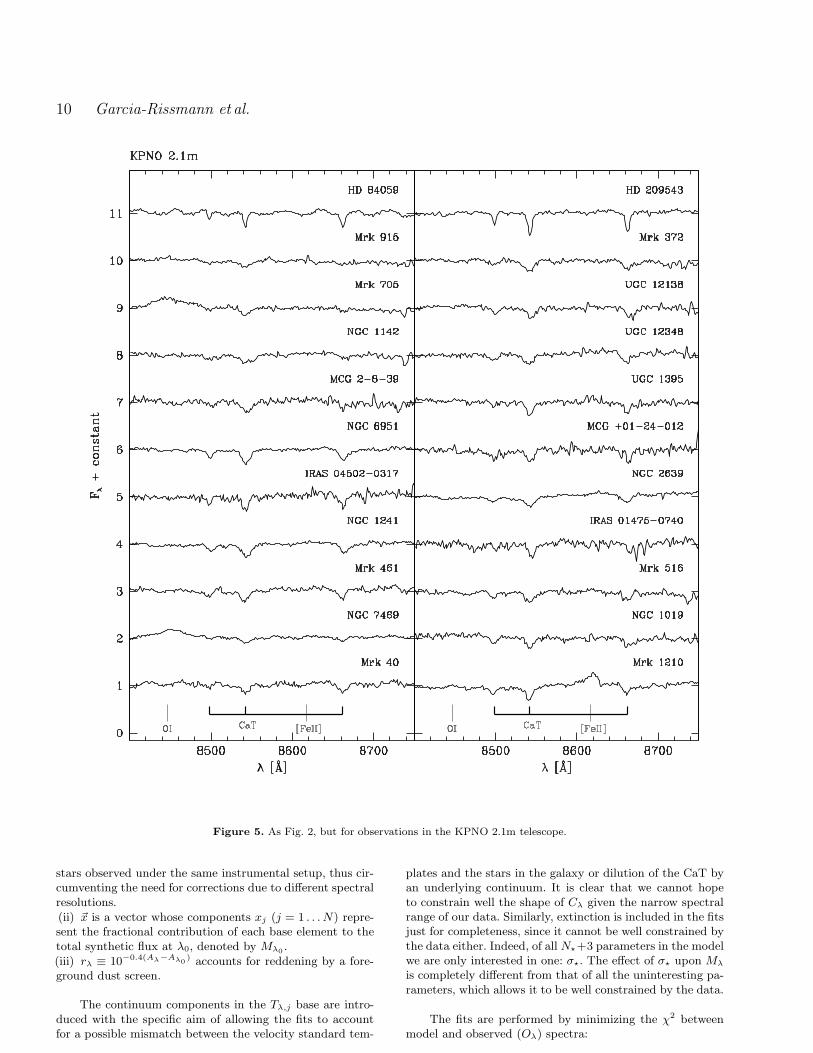
Figures 2–6 present the spectra around the CaT region forall 78 galaxies in our sample. Data from different telescopesare displayed in different plots. As in NW, each panel inthese figures includes an example of a velocity standard starobserved through the same setup, to illustrate the kinemat-ical broadening in the galaxy spectra. The wavelengths ofthe CaT lines and other features are indicated. We recallthat all spectra in this atlas correspond to the nuclear re-gions: 2′′ × 2.46′′ for the ESO galaxies, 2′′ × 2.34′′ for theones observed at the KPNO 2.1m and 1.5′′×2′′ for those ob-served at the KPNO 4m. Defining rap as the radius of a cir-cle whose area equals the aperture area, our nuclear spectracorresponds to physical regions of projected radii betweenrap = 50–700 pc of the nucleus, with a median value of 286pc (Table 5).
All spectra were brought to the rest-frame using, when-ever possible, the mean redshift derived from the CaT ab-sorption lines. For convenience, the spectra were normalizedto the median flux in the 8554–8574 A interval. We estimatethe signal-to-noise ratio (S/N) by the mean/rms flux ratioin this same window. The resulting S/N spans the 8–125range, with a median S/N of 41.
Figures 2–6 show that our NIR spectra often containfeatures which complicate the analysis of the CaT, such asemission lines (narrow and broad), noise and imperfectly re-
moved atmospheric features. To help dealing with this prob-lem we have assigned a “quality flag” to each spectrum ac-cording to the degree of contamination of the CaT lines.Column 8 of Tables 1–3 list the results. Quality a refers tothe best spectra, where the CaT lines are little or not af-fected by any of the problems above, as in NGC 2997, Mrk573 and NGC 2639 (Figures 2, 4 and 5 respectively). Qual-ity b refers to reasonably good spectra, but where one ofthe CaT lines is contaminated. NGC 3281 (Fig 2) and Mrk3 (Fig 4) are examples of quality b spectra. Quality c cor-responds to problematic spectra, like NGC 4748 and IRAS01475-0740 in Figs 2 and 5 respectively. CaT measurementsfor these objects should be treated with caution. Finally,we define as quality d those spectra which are so complexthat it is impossible to derive any reasonably accurate CaTmeasurement. All such cases are presented in Fig. 6. SomeSeyfert 1s and most Narrow Line Seyfert 1s in our samplefall in this category. In this latter class the CaT absorptionlines are superposed to broad emission components of thesame transitions from the Broad Line Region (Ferland &Persson 1989). AKN 564 and Mrk 1239 are two such cases.We have not attempted to disentangle the absorption andemission components in these cases. In some of these objectsuseful CaT information can be obtained from off-nuclear ex-tractions (Paper II).
The above classification allows us to investigate how ourresults are affected by data quality. As expected, the S/Nratio tends to increase as one goes from quality c to a. The

An atlas of Calcium triplet spectra of active galaxies 7
Figure 2. CaT spectra for the ESO 1.52m observations. All spectra are normalized and shifted vertically for clarity. The top spectrumin each panel corresponds to a velocity standard star observed with the same instrumental setup.
median values are S/N = 26, 37 and 47 for qualities c, b anda respectively. Also, the uncertainties in the CaT products(velocity dispersion and equivalent width) are smaller thebetter the quality (Sections 4 and 5).
Our data comprises 40, 15 and 17 objects with qualityflags a, b and c respectively, totaling 72 galaxies with usefulCaT spectra. This statistically significant dataset, which issimilar in quality and quantity to that of NW, is analyzedin the next sections.
3.2 The [SIII]λ9069 line
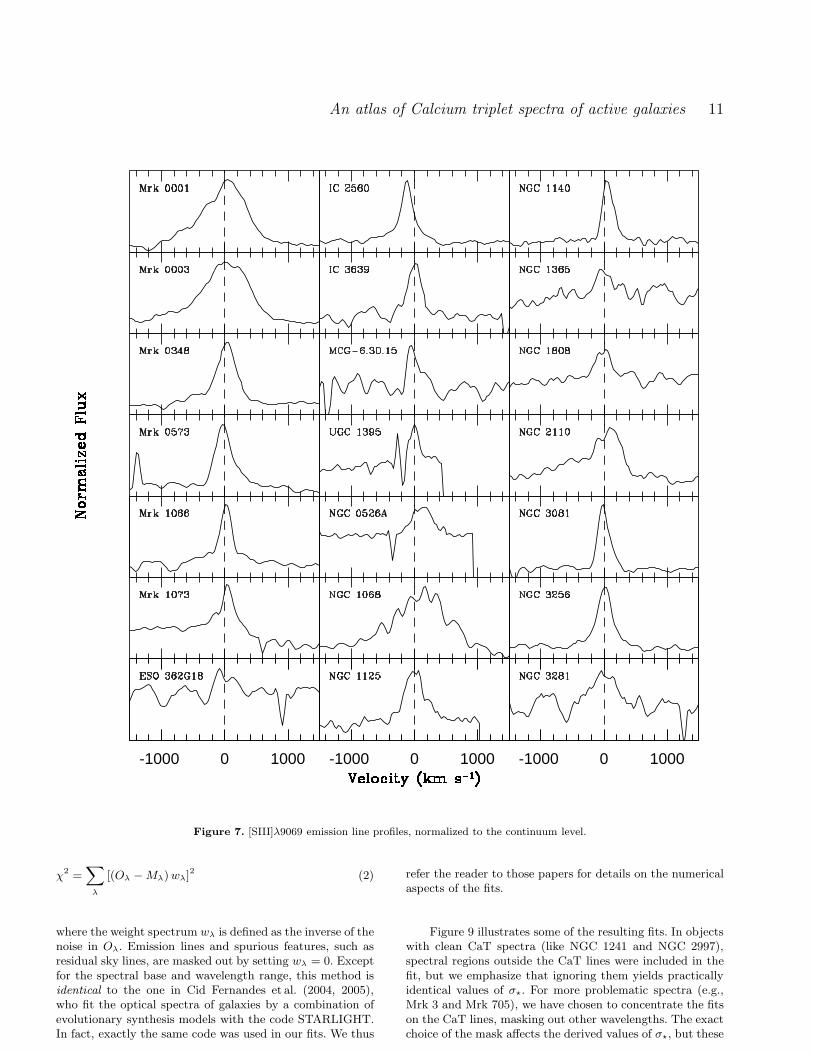
In 40 galaxies the [SIII]λ9069 line is detected with at leasta reasonable quality line profile (equivalent width >
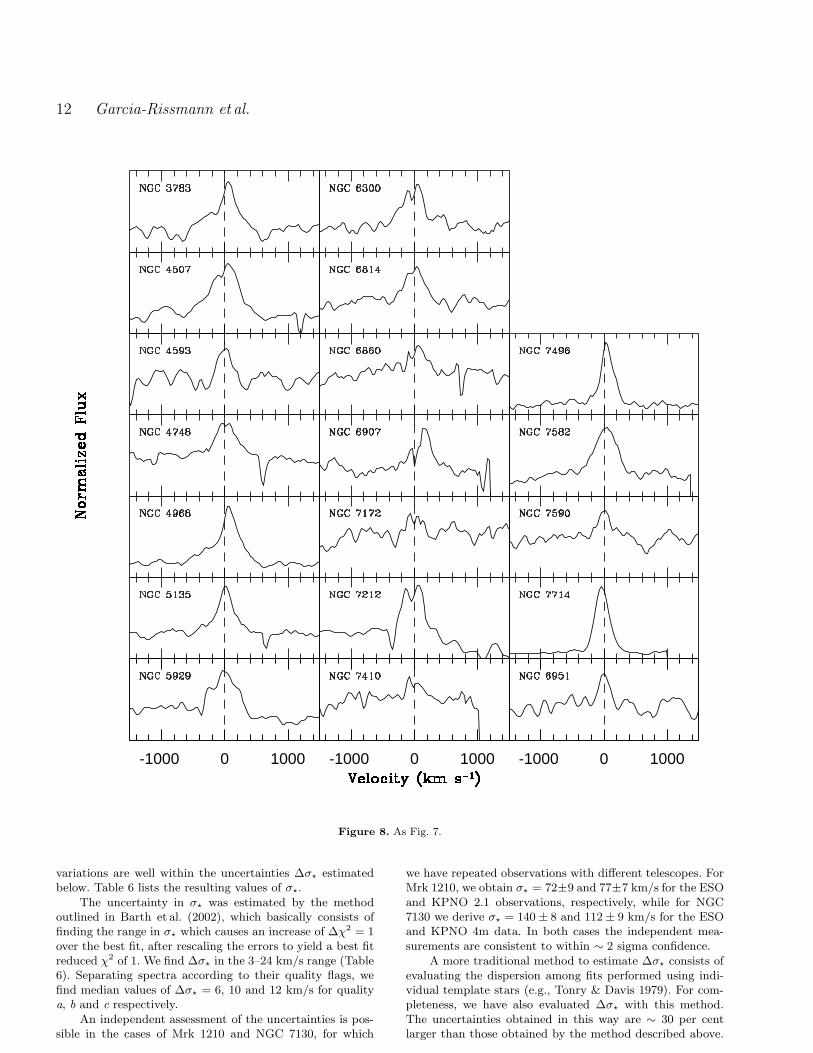
∼ 1 A).The [SIII] profiles are shown in Figs 7 and 8. We have fittedthis line with a single Gaussian profile. The resulting valuesof its width, σ[SIII] (corrected for instrumental broadening)and equivalent width W[SIII] are listed in Table 6. We donot quote [SIII] fluxes because of the uncertain absolute fluxscale. The width of the [SIII] line provides a rough measureof the typical velocity of clouds in the Narrow Line Region

8 Garcia-Rissmann et al.
Figure 3. As Fig. 2.
(NLR) of AGN. In Paper II we compare this velocity withthe typical stellar velocities deduced from the analysis of theCaT lines. Paper II also compares the W[SIII] values of type1 and 2 Seyferts, which may indicate the diluting effects ofan underlying AGN continuum at near-IR wavelengths.
4 STELLAR VELOCITY DISPERSIONS
Due to its location in a relatively clean spectral region, theCaT is an ideal tracer of stellar kinematics in galaxies. Thispotential was recognized long ago in studies of normal galax-
ies (Pritchet 1978; Dressler 1984) and even AGN (TDT).This is all the more true in AGN, were optical kinematicaltracers like the Mg lines at ∼ 5175 A are often contaminatedby emission features, which complicates the measurement ofkinematical properties (NW). The combination of this prac-tical advantage with the discovery of the MBH-σ⋆ relationbrought renewed interest in the CaT as a tool to measure σ⋆,and thus indirectly weigh black holes, particularly in AGN.
In this section we present measurements of σ⋆ for galax-ies in our atlas. Two different methods were employed to es-timate σ⋆. In what follows we describe these methods (§4.1

An atlas of Calcium triplet spectra of active galaxies 9
Figure 4. As Fig. 2, but for observations in the KPNO 4m telescope.
and 4.2) and compare their results both between them andwith values in the literature (§4.3).
4.1 Direct Fitting Method
Kinematical parameters can be estimated by a Direct Fit-ting Method (DFM), which consists of fitting a model tothe observed CaT spectrum directly in λ-space (Barth, Ho& Sargent 2002). A model spectrum Mλ can be built com-bining one or more stellar templates with a continuum Cλ,and then convolving it with an assumed Gaussian line of
sight velocity distribution function G(v⋆, σ⋆), centered at v⋆
and broadened by σ⋆. The resulting expression for Mλ is
Mλ = Mλ0
[
N∑
j=1
xjTj,λrλ
]
⊗ G(v⋆, σ⋆) (1)
where
(i) Tλ,j is the spectrum of the jth template star normalizedat λ0. The continuum Cλ is also included in the Tλ,j baseas a set of power-laws with different slopes. Each galaxywas modeled with a base containing only velocity standard
10 Garcia-Rissmann et al.
Figure 5. As Fig. 2, but for observations in the KPNO 2.1m telescope.
stars observed under the same instrumental setup, thus cir-cumventing the need for corrections due to different spectralresolutions.(ii) ~x is a vector whose components xj (j = 1 . . . N) repre-sent the fractional contribution of each base element to thetotal synthetic flux at λ0, denoted by Mλ0
.(iii) rλ ≡ 10−0.4(Aλ−Aλ0
) accounts for reddening by a fore-ground dust screen.
The continuum components in the Tλ,j base are intro-duced with the specific aim of allowing the fits to accountfor a possible mismatch between the velocity standard tem-
plates and the stars in the galaxy or dilution of the CaT byan underlying continuum. It is clear that we cannot hopeto constrain well the shape of Cλ given the narrow spectralrange of our data. Similarly, extinction is included in the fitsjust for completeness, since it cannot be well constrained bythe data either. Indeed, of all N⋆+3 parameters in the modelwe are only interested in one: σ⋆. The effect of σ⋆ upon Mλ
is completely different from that of all the uninteresting pa-rameters, which allows it to be well constrained by the data.
The fits are performed by minimizing the χ2 betweenmodel and observed (Oλ) spectra:
An atlas of Calcium triplet spectra of active galaxies 11
-1000 0 1000 -1000 0 1000 -1000 0 1000
Figure 7. [SIII]λ9069 emission line profiles, normalized to the continuum level.
χ2 =∑
λ
[(Oλ − Mλ) wλ]2 (2)
where the weight spectrum wλ is defined as the inverse of thenoise in Oλ. Emission lines and spurious features, such asresidual sky lines, are masked out by setting wλ = 0. Exceptfor the spectral base and wavelength range, this method isidentical to the one in Cid Fernandes et al. (2004, 2005),who fit the optical spectra of galaxies by a combination ofevolutionary synthesis models with the code STARLIGHT.In fact, exactly the same code was used in our fits. We thus
refer the reader to those papers for details on the numericalaspects of the fits.
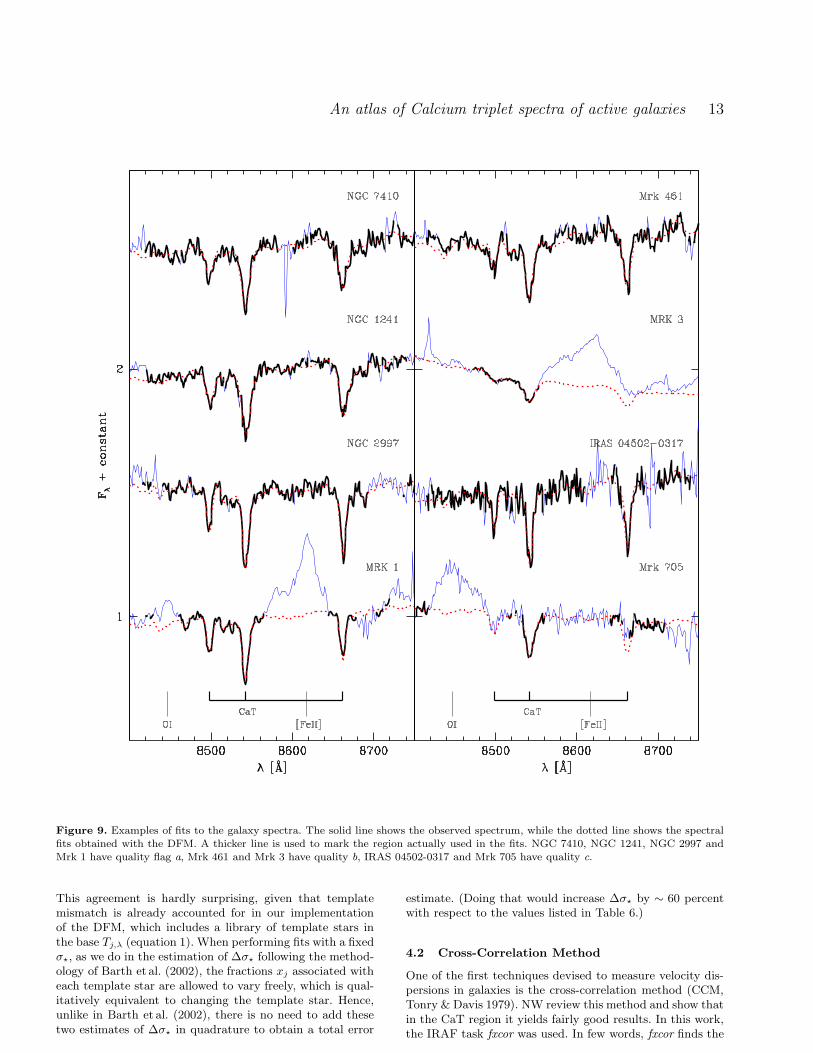
Figure 9 illustrates some of the resulting fits. In objectswith clean CaT spectra (like NGC 1241 and NGC 2997),spectral regions outside the CaT lines were included in thefit, but we emphasize that ignoring them yields practicallyidentical values of σ⋆. For more problematic spectra (e.g.,Mrk 3 and Mrk 705), we have chosen to concentrate the fitson the CaT lines, masking out other wavelengths. The exactchoice of the mask affects the derived values of σ⋆, but these
12 Garcia-Rissmann et al.
-1000 0 1000 -1000 0 1000 -1000 0 1000
Figure 8. As Fig. 7.
variations are well within the uncertainties ∆σ⋆ estimatedbelow. Table 6 lists the resulting values of σ⋆.
The uncertainty in σ⋆ was estimated by the methodoutlined in Barth et al. (2002), which basically consists offinding the range in σ⋆ which causes an increase of ∆χ2 = 1over the best fit, after rescaling the errors to yield a best fitreduced χ2 of 1. We find ∆σ⋆ in the 3–24 km/s range (Table6). Separating spectra according to their quality flags, wefind median values of ∆σ⋆ = 6, 10 and 12 km/s for qualitya, b and c respectively.
An independent assessment of the uncertainties is pos-sible in the cases of Mrk 1210 and NGC 7130, for which
we have repeated observations with different telescopes. ForMrk 1210, we obtain σ⋆ = 72±9 and 77±7 km/s for the ESOand KPNO 2.1 observations, respectively, while for NGC7130 we derive σ⋆ = 140 ± 8 and 112 ± 9 km/s for the ESOand KPNO 4m data. In both cases the independent mea-surements are consistent to within ∼ 2 sigma confidence.
A more traditional method to estimate ∆σ⋆ consists ofevaluating the dispersion among fits performed using indi-vidual template stars (e.g., Tonry & Davis 1979). For com-pleteness, we have also evaluated ∆σ⋆ with this method.The uncertainties obtained in this way are ∼ 30 per centlarger than those obtained by the method described above.
An atlas of Calcium triplet spectra of active galaxies 13
Figure 9. Examples of fits to the galaxy spectra. The solid line shows the observed spectrum, while the dotted line shows the spectralfits obtained with the DFM. A thicker line is used to mark the region actually used in the fits. NGC 7410, NGC 1241, NGC 2997 andMrk 1 have quality flag a, Mrk 461 and Mrk 3 have quality b, IRAS 04502-0317 and Mrk 705 have quality c.
This agreement is hardly surprising, given that templatemismatch is already accounted for in our implementationof the DFM, which includes a library of template stars inthe base Tj,λ (equation 1). When performing fits with a fixedσ⋆, as we do in the estimation of ∆σ⋆ following the method-ology of Barth et al. (2002), the fractions xj associated witheach template star are allowed to vary freely, which is qual-itatively equivalent to changing the template star. Hence,unlike in Barth et al. (2002), there is no need to add thesetwo estimates of ∆σ⋆ in quadrature to obtain a total error
estimate. (Doing that would increase ∆σ⋆ by ∼ 60 percentwith respect to the values listed in Table 6.)
4.2 Cross-Correlation Method
One of the first techniques devised to measure velocity dis-persions in galaxies is the cross-correlation method (CCM,Tonry & Davis 1979). NW review this method and show thatin the CaT region it yields fairly good results. In this work,the IRAF task fxcor was used. In few words, fxcor finds the

14 Garcia-Rissmann et al.
Object σDFM⋆ σ
CCM⋆ σ[SIII] W[SIII] WCaT
(km/s) (km/s) (km/s) (A) (A)
ESO 362-G08 179 ± 7 193 ± 10 7.2 ± 0.3ESO 362-G18 126 ± 5 134 ± 4 132: 3: 6.7 ± 0.3IC 2560 135 ± 4 138 ± 5 107 16 7.8 ± 0.4IC 3639 95 ± 5 99 ± 5 111 10 6.3 ± 0.3IC 5169 114 ± 12 111 ± 2 7.5 ± 0.9IRAS 01475-0740 62 ± 11 108 ± 17 6.0 ± 0.3IRAS 04502-0317 74 ± 8 74 ± 15 6.8 ± 0.5MCG +01-24-012 84 ± 10 92 ± 18 6.8 ± 0.7MCG -6.30.15 94 ± 8 103 ± 4 90 5 5.1 ± 0.5MCG 2-8-39 170 ± 13 126 ± 11 8.0 ± 0.8MRK 1 86 ± 4 79 ± 4 375 86 6.2 ± 0.5MRK 3 228 ± 13 249 ± 4 364 42 4.2 ± 0.4MRK 78 201 ± 8 186 ± 4 7.3 ± 0.3MRK 273 211 ± 14 186 ± 2 7.7 ± 0.7MRK 348 95 ± 6 98 ± 8 179 40 6.3 ± 0.2MRK 573 147 ± 5 148 ± 3 171 28 7.9 ± 0.1MRK 1066 100 ± 4 90 ± 6 119 21 5.9 ± 0.4MRK 1073 114 ± 6 109 ± 5 168 24 5.9 ± 0.5Mrk 40 125 ± 7 116 ± 4 4.0 ± 0.4Mrk 372 155 ± 6 161 ± 5 6.4 ± 0.5Mrk 461 111 ± 6 123 ± 4 5.6 ± 0.4Mrk 516 113 ± 12 114 ± 7 7.4 ± 0.6Mrk 705 128 ± 11 120 ± 15 5.1 ± 0.3Mrk 915 181 ± 18 146 ± 16 5.2 ± 0.6Mrk 1210 77 ± 7 82 ± 16 6.7 ± 0.4NGC 205 47 ± 6 74 ± 6 6.2 ± 0.2NGC 526A 198 ± 16 219 ± 11 159 4 4.7 ± 0.5NGC 526B 237 ± 22 167 ± 11 7.0 ± 1.1NGC 1019 106 ± 9 110 ± 11 6.5 ± 0.5
NGC 1068 140 ± 6 147 ± 3 543 120 6.3 ± 0.4NGC 1125 118 ± 9 138 ± 6 168 11 7.6 ± 0.5NGC 1140 53 ± 6 60 ± 3 81 12 5.9 ± 0.7NGC 1142 219 ± 15 202 ± 47 8.6 ± 0.4NGC 1241 136 ± 5 142 ± 12 8.5 ± 0.4NGC 1380 250 ± 16 215 ± 8 7.8 ± 2.4NGC 1386 123 ± 3 133 ± 3 8.1 ± 0.2NGC 1433 98 ± 6 113 ± 3 7.6 ± 0.4NGC 1672 108 ± 4 111 ± 3 7.7 ± 0.2NGC 1808 119 ± 6 129 ± 4 129 2 7.3 ± 0.4NGC 2110 264 ± 11 273 ± 7 375 16 6.4 ± 0.3NGC 2639 168 ± 6 155 ± 12 7.2 ± 0.2NGC 2997 79 ± 4 89 ± 4 8.0 ± 0.4NGC 3081 129 ± 8 113 ± 4 77 20 7.4 ± 0.4NGC 3115 275 ± 6 268 ± 8 7.0 ± 0.4NGC 3256 130 ± 13 100 ± 6 120 17 3.7 ± 0.5NGC 3281 161 ± 8 176 ± 3 235 8 7.3 ± 0.4NGC 3783 116 ± 20 114 ± 6 247 17 3.0 ± 0.2NGC 4339 123 ± 3 129 ± 3 7.4 ± 0.2NGC 4507 146 ± 7 152 ± 4 229 16 7.0 ± 0.4NGC 4593 153 ± 24 105 ± 5 96 3 3.4 ± 0.3NGC 4748 76 ± 15 78 ± 13 187 10 3.4 ± 0.5NGC 4968 105 ± 9 106 ± 4 182 16 6.9 ± 0.5NGC 5135 128 ± 8 124 ± 6 135 10 6.1 ± 0.4NGC 5929 119 ± 4 122 ± 4 195 9 6.5 ± 0.2NGC 6300 92 ± 5 110 ± 5 217 7 8.3 ± 0.4NGC 6814 83 ± 11 113 ± 6 169 5 4.0 ± 0.3NGC 6860 162 ± 11 141 ± 5 153: 3: 5.6 ± 0.6NGC 6907 157 ± 12 195 ± 15 199 6 9.2 ± 1.0NGC 6951 115 ± 4 113 ± 12 73 2 9.0 ± 0.3
Table 6. Columns 2 and 3: Velocity dispersions obtained with the DFM and CCM methods respectively. Columns 4 and 5: Width andequivalent width of the [SIII]λ9069 emission line. Uncertain measurements are marked with a ‘:’. Column 6: CaT equivalent width.

An atlas of Calcium triplet spectra of active galaxies 15
Object σDFM⋆ σ
CCM⋆ σ[SIII] W[SIII] WCaT
(km/s) (km/s) (km/s) (A) (A)
NGC 7130 141 ± 8 147 ± 5 6.9 ± 0.4NGC 7172 154 ± 6 160 ± 9 112: 1: 6.9 ± 1.1NGC 7184 146 ± 7 131 ± 5 7.9 ± 1.2NGC 7212 143 ± 10 140 ± 2 164 26 5.3 ± 0.2NGC 7410 144 ± 7 144 ± 6 126: 1: 7.7 ± 0.4NGC 7469 125 ± 12 144 ± 11 2.9 ± 0.2NGC 7496 76 ± 10 94 ± 6 96 15 5.8 ± 0.7NGC 7582 121 ± 7 113 ± 3 180 8 5.9 ± 0.5NGC 7590 93 ± 4 90 ± 4 136 2 7.7 ± 2.0NGC 7714 59 ± 9 65 ± 4 105 28 4.7 ± 2.4UGC 1395 66 ± 6 62 ± 16 47: 4: 6.5 ± 0.4UGC 12138 115 ± 10 136 ± 8 6.9 ± 0.6UGC 12348 155 ± 9 165 ± 14 7.6 ± 0.4
Table 7. Continuation of Table 6.
Figure 6. Objects containing complex (quality flag = d) spectrain the CaT region.
cross-correlation function between the galaxy and the tem-plate spectra in Fourier space. The peak of this function isthen modeled by a Gaussian. We use the same individualmasks which were used in the DFM, and we allow a linearcontinuum subtraction from the galaxy spectra. The outputfrom fxcor is calibrated in order to account for instrumentalresolution. Column 3 of Table 6 presents σ⋆ values obtainedwith this method. Uncertainties in this case are evaluatedfrom the rms in σ⋆ values obtained using different templatestars.
We find that the DFM and the CCM yield velocitydispersions consistent to within 19 km/s on-average. Theagreement is much better for quality a spectra, for whichthe difference between σDFM
⋆ and σCCM⋆ is just 9 km/s in
the rms. For quality b and c the DFM and CCM methodsagree to rms dispersions of 20 and 30 km/s respectively,which further confirms that data quality is the major sourceof uncertainty in σ⋆. The uncertainties ∆σ⋆ obtained withthese two methods are also similar, with an rms differenceof 6 km/s.
4.3 Comparison with previous results
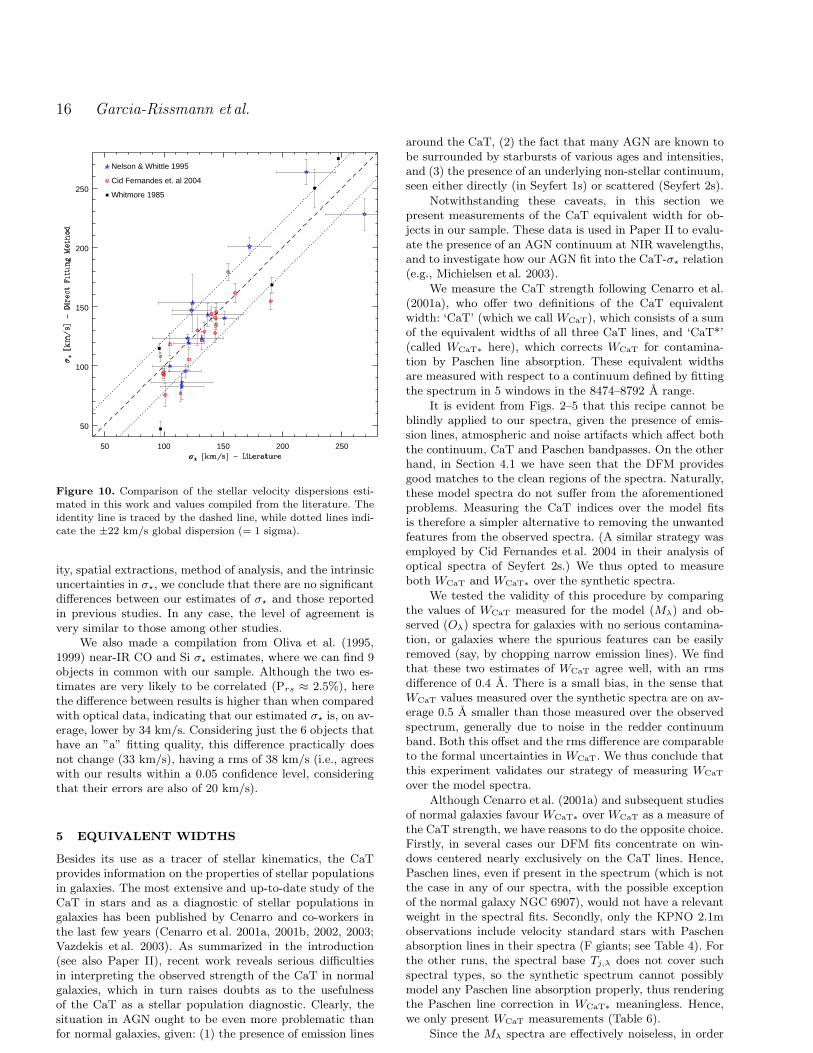
In Fig. 10 we compare our DFM measurements of σ⋆ withvalues compiled from the literature for objects in common.The two major sources of σ⋆ are NW and Cid Fernan-des et al. (2004), which have 14 and 22 objects in commonwith our sample, respectively. NW derive σ⋆ from the cross-correlation method applied to either the CaT or the Mg linesin the optical, while Cid Fernandes et al. (2004) estimate σ⋆
fitting the 3500–5200 A spectra of Seyfert 2s with a com-bination of single stellar populations from the Bruzual &Charlot (2003, hereafter BC03) models. These two studiesagree in their estimates of σ⋆ at the level of ±21 km/s rms.
Our CaT-based estimates of σ⋆ are in good agreementwith these previous estimates. The rms difference betweenour values and those in the literature is 22 km/s. The spreadis somewhat smaller for quality a data (rms of 21 km/s) thanfor qualities b and c (25 km/s). Furthermore, on average,our estimates of σ⋆ are just 4 km/s lower than those in theliterature. Very similar results are obtained comparing ourCCM-based estimates of σ⋆ with literature data, which alsoyields an rms of 22 km/s. Given the differences in data qual-
16 Garcia-Rissmann et al.
50 100 150 200 250
50
100
150
200
250
Nelson & Whittle 1995
Cid Fernandes et. al 2004
Whitmore 1985
Figure 10. Comparison of the stellar velocity dispersions esti-mated in this work and values compiled from the literature. Theidentity line is traced by the dashed line, while dotted lines indi-cate the ±22 km/s global dispersion (= 1 sigma).
ity, spatial extractions, method of analysis, and the intrinsicuncertainties in σ⋆, we conclude that there are no significantdifferences between our estimates of σ⋆ and those reportedin previous studies. In any case, the level of agreement isvery similar to those among other studies.
We also made a compilation from Oliva et al. (1995,1999) near-IR CO and Si σ⋆ estimates, where we can find 9objects in common with our sample. Although the two es-timates are very likely to be correlated (Prs ≈ 2.5%), herethe difference between results is higher than when comparedwith optical data, indicating that our estimated σ⋆ is, on av-erage, lower by 34 km/s. Considering just the 6 objects thathave an ”a” fitting quality, this difference practically doesnot change (33 km/s), having a rms of 38 km/s (i.e., agreeswith our results within a 0.05 confidence level, consideringthat their errors are also of 20 km/s).
5 EQUIVALENT WIDTHS
Besides its use as a tracer of stellar kinematics, the CaTprovides information on the properties of stellar populationsin galaxies. The most extensive and up-to-date study of theCaT in stars and as a diagnostic of stellar populations ingalaxies has been published by Cenarro and co-workers inthe last few years (Cenarro et al. 2001a, 2001b, 2002, 2003;Vazdekis et al. 2003). As summarized in the introduction(see also Paper II), recent work reveals serious difficultiesin interpreting the observed strength of the CaT in normalgalaxies, which in turn raises doubts as to the usefulnessof the CaT as a stellar population diagnostic. Clearly, thesituation in AGN ought to be even more problematic thanfor normal galaxies, given: (1) the presence of emission lines
around the CaT, (2) the fact that many AGN are known tobe surrounded by starbursts of various ages and intensities,and (3) the presence of an underlying non-stellar continuum,seen either directly (in Seyfert 1s) or scattered (Seyfert 2s).
Notwithstanding these caveats, in this section wepresent measurements of the CaT equivalent width for ob-jects in our sample. These data is used in Paper II to evalu-ate the presence of an AGN continuum at NIR wavelengths,and to investigate how our AGN fit into the CaT-σ⋆ relation(e.g., Michielsen et al. 2003).
We measure the CaT strength following Cenarro et al.(2001a), who offer two definitions of the CaT equivalentwidth: ‘CaT’ (which we call WCaT), which consists of a sumof the equivalent widths of all three CaT lines, and ‘CaT*’(called WCaT∗ here), which corrects WCaT for contamina-tion by Paschen line absorption. These equivalent widthsare measured with respect to a continuum defined by fittingthe spectrum in 5 windows in the 8474–8792 A range.
It is evident from Figs. 2–5 that this recipe cannot beblindly applied to our spectra, given the presence of emis-sion lines, atmospheric and noise artifacts which affect boththe continuum, CaT and Paschen bandpasses. On the otherhand, in Section 4.1 we have seen that the DFM providesgood matches to the clean regions of the spectra. Naturally,these model spectra do not suffer from the aforementionedproblems. Measuring the CaT indices over the model fitsis therefore a simpler alternative to removing the unwantedfeatures from the observed spectra. (A similar strategy wasemployed by Cid Fernandes et al. 2004 in their analysis ofoptical spectra of Seyfert 2s.) We thus opted to measureboth WCaT and WCaT∗ over the synthetic spectra.
We tested the validity of this procedure by comparingthe values of WCaT measured for the model (Mλ) and ob-served (Oλ) spectra for galaxies with no serious contamina-tion, or galaxies where the spurious features can be easilyremoved (say, by chopping narrow emission lines). We findthat these two estimates of WCaT agree well, with an rmsdifference of 0.4 A. There is a small bias, in the sense thatWCaT values measured over the synthetic spectra are on av-erage 0.5 A smaller than those measured over the observedspectrum, generally due to noise in the redder continuumband. Both this offset and the rms difference are comparableto the formal uncertainties in WCaT. We thus conclude thatthis experiment validates our strategy of measuring WCaT
over the model spectra.
Although Cenarro et al. (2001a) and subsequent studiesof normal galaxies favour WCaT∗ over WCaT as a measure ofthe CaT strength, we have reasons to do the opposite choice.Firstly, in several cases our DFM fits concentrate on win-dows centered nearly exclusively on the CaT lines. Hence,Paschen lines, even if present in the spectrum (which is notthe case in any of our spectra, with the possible exceptionof the normal galaxy NGC 6907), would not have a relevantweight in the spectral fits. Secondly, only the KPNO 2.1mobservations include velocity standard stars with Paschenabsorption lines in their spectra (F giants; see Table 4). Forthe other runs, the spectral base Tj,λ does not cover suchspectral types, so the synthetic spectrum cannot possiblymodel any Paschen line absorption properly, thus renderingthe Paschen line correction in WCaT∗ meaningless. Hence,we only present WCaT measurements (Table 6).
Since the Mλ spectra are effectively noiseless, in order
An atlas of Calcium triplet spectra of active galaxies 17
to compute uncertainties in WCaT we carried out a formalpropagation using the S/N derived for each galaxy (Section3.1). To be on the conservative side, we further add 0.5 Ain quadrature to account for the empirically established rmsdifference between WCaT measurements performed over Mλ
and over clean Oλ spectra. The median uncertainties are∆WCaT = 0.6, 0.7 and 0.8 A for quality a, b and c spectrarespectively.
Inspection of the WCaT values in Table 6 shows thatthis index spans a range of values from ∼ 1 to 9 A. How-ever, most values are within the 6–8 A range, giving the falseimpression that stellar populations are very homogeneous inour sample. This is definitely not true, as we know from in-dependent work at other wavelengths for many of the samegalaxies studied here (e.g., Cid Fernandes et al. 2001, 2004).Instead, the small variation in CaT strength reinforces thenotion that this feature is not much sensitive to stellar pop-ulation properties. The only noticeable trend is that Seyfert1s tend to have weaker CaT than other galaxies. On themean, WCaT = 4.6 ± 2.0 A (sample dispersion) for Seyfert1s and 7.0 ± 1.0 A for Seyfert 2s. The statistics for the 3starbursts in our sample is 4.7±1.1 A, while for the remain-ing 6 non-active galaxies WCaT = 7.7 ± 1.0 A, very similarto the values spanned by Seyfert 2s. The most likely originfor the difference between type 1 and type 2 AGN is dilu-tion by an underlying non-stellar featureless continuum intype 1s. Hence, if on the one hand WCaT turns out to bea rather poor tracer of stellar populations, it seems to bea good FC detector. These aspects are explored in greaterdepth in Paper II.
6 CONCLUSIONS
This paper presented a spectroscopic atlas of 78 galaxies inthe region around the Calcium triplet (CaT). Most of theobjects are AGN, split into 43 type 2 Seyferts and 26 type1s. The spectra cover the inner rpc ∼ 300 pc with a typicalS/N of 40. Quality flags were assigned to each spectrum todescribe the degree of contamination of the CaT absortionlines by emission lines or atmospheric features. The mainproducts from our analysis of this data set are stellar veloc-ity dispersions, [SIII]λ9069 line profiles, and CaT equivalentwidths.
Stellar velocity dispersions (σ⋆) were measured for 72of the spectra using both direct fitting and cross-correlationmethods. The two techniques yield results compatible towithin an rms of 19 km/s, which is also the typical uncer-tainty of our estimates. Comparison with σ⋆ values reportedin the literature for objects in common agree with our esti-mates at the level of ∼ 20 km/s rms for optical data, and ata 2 sigma level for near-IR data.
We have also analyzed the [SIII]λ9069 line profiles for40 galaxies in the sample with useful data in this range.Single Gaussian fits were performed, producing estimates ofline width and equivalent width.
The CaT equivalent width was measured over the syn-thetic spectra obtained from the direct fits, circumventingthe manual editing of the spectra which would be requiredto remove undesirable features which affect WCaT. We findthat the value of WCaT in Seyfert 2s and normal galaxiesare concentrated in a relatively small range, from ∼ 6 to 8
A. Type 1 Seyferts tend to have a weaker CaT, most likelydue to dilution by a non-stellar continuum.
These data products are analyzed in Paper II, where weinvestigate the relation between nebular and stellar kinemat-ics and the behaviour of the CaT strength as a function ofactivity type and stellar population properties.
ACKNOWLEDGMENTS
AGR, LRV, NVA, RCF and TSB acknowledge the sup-port from CAPES, CNPq and Instituto do Milenio. RGDacknowledges support by Spanish Ministry of Science andTechnology (MCYT) through grant AYA-2004-02703. AGRand LRV aknowledge A. Rodrıguez-Ardila for suggestions inthe reduction process. We thank the Laboratorio Nacionalde Astrofısica for the allocation of time on the ESO 1.52mand financial support during the runs. Part of the data de-scribed here were taken at Kitt Peak National Observatory,National Optical Astronomy Observatories, which are oper-ated by AURA, Inc., under a cooperative agreement withthe National Science Foundation. Basic research at the USNaval Research Laboratory is supported by the Office ofNaval Research. This research made use of the NASA/IPACExtragalactic Database (NED), which is operated by the JetPropulsion Laboratory, Caltech, under contract with NASA.
REFERENCES
Barth A.J., Ho L.C., Sargent W.L.W., 2002, ApJ, 566, L13.Barth A.J., Ho L.C., Sargent W.L.W., 2003, ApJ, 583, 134.
Barth A.J., Ho L.C., Rutledge R.E., Sargent W.L.W., 2004, ApJ,607, 90.
Barth A.J., Greene J.E., Ho L.C., 2005, ApJL, in press(astro-ph/0412575).
Bassani L., Dadina M., Maiolino R., Salvati M., Risaliti G., DellaCeca R., Matt G., Zamorani G., 1999, ApJS, 121, 473.
Botte V., Ciroi S., di Mille F., Rafanelli P., Romano A., 2004,MNRAS, 356, 789.
Bruzual G., Charlot S., 2003, MNRAS, 344, 1000.Cardelli J.A., Clayton G.C., Mathis J.S., 1989, ApJ, 345, 245.
Cenarro A.J., Cardiel N., Gorgas J., Peletier R.F., Vazdekis A.,Prada F., 2001a, MNRAS, 326, 959.
Cenarro A.J., Gorgas J., Cardiel N., Pedraz S., Peletier R.F.,Vazdekis A., 2001b, MNRAS, 326, 981.
Cenarro A.J., Gorgas J., Cardiel N., Vazdekis A., Peletier R.F.,2002, MNRAS, 329, 863.
Cenarro A.J., Gorgas J., Vazdekis A., Cardiel N., Peletier R.F.,2003, MNRAS, 339, 12.
Cenarro A.J., Sanchez-Blazquez P., Cardiel N., Gorgas J., 2004,ApJ, 614, 101.
Cid Fernandes R., Terlevich R.J., 1995, MNRAS, 272, 423
Cid Fernandes R., Heckman T., Schmitt H., Gonzalez DelgadoR.M., Storchi-Bergmann T., 2001, ApJ, 558, 81.
Cid Fernandes R., Gu Q., Melnick J., Terlevich E., Terlevich R.,Kunth D., Rodrigues Lacerda R., Joguet B., 2004, MNRAS,355, 273.
Cid Fernandes R., Mateus A., Sodre L., Stasinska G., Gomes
J.M., 2005, MNRAS, in press (astro-ph/0412481).Dressler A., 1984, ApJ, 286, 97.Falcon-Barroso J., Peletier R.F., Vazdekis A., Balcells M., 2003,
ApJ, 588, 17.
Ferland G.J., Persson S.E., 1989, ApJ, 347, 656.Ferrarese L., Merritt D., 2000, ApJ, 539, 9.

18 Garcia-Rissmann et al.
Ferrarese, L., Pogge, R. W., Peterson, B. M., & Merritt, D. 2001,
ApJ, 555, L79Filippenko A.V., Ho L.C., 2003, ApJ, 588, L13.Gebhardt K., Bender R., Bower G., Dressler A., Faber S.M., et
al., 2000, ApJ, 539, 13.Gonzalez Delgado R., Heckman T., Leitherer C., 2001, ApJ, 546,
845.Hamuy M., Suntzeff N.B., Heathcote S.R., Walker A.R., Gigoux
P., Phillips M.M., 1994, PASP, 106, 566.Heckman T., Krolik J., Meurer G., Calzetti D., Kinney A., Ko-
ratkar A., Leitherer C., Robert C., Wilson A., 1995, ApJ, 452,549.
Heckman T., Gonzalez Delgado R., Leitherer C., Meurer G., Kro-lik J., Wilson A.S., Koratkar A., Kinney A., 1997, ApJ, 482,114.
Horne K., 1986, PASP, 98, 609.Jimenez-Benito L., Dıaz A.I., Terlevich R.J., Terlevich E., 2000,
MNRAS, 317, 907.Massey P., Strobel K., Barnes J.V., Anderson E., 1988, ApJ, 328,
315.Massey P., Gronwall C., 1990, ApJ, 358, 344.Michielsen D., De Rijcke S., Dejonghe H., Zeilinger W.W., Hau
G.K.T., 2003, ApJ, 597, 21.Nelson C.H., Whittle M., 1995, ApJS, 99, 67.Nelson C.H., Whittle M., 1996, ApJ, 465, 96.Nelson C.H., Green R.F., Bower G., Gebhardt K., Weistrop D.,
2004, ApJ, 615, 652.Oke J.B., 1990, AJ, 99, 1621.Oliva E., Origlia L., Kotilainen J.K., Moorwood A.F.M., 1995,
A&A, 301, 55..Oliva E., Origlia L., Maiolino R., Moorwood A.F.M., 1999, A&A,
350, 90.Onken C.A., Ferrarese L., Merritt D., Peterson B.M., Pogge R.W.,
Vestergaard M., Wandel A., 2004, ApJ, 615, 645.Plait P., Bohlin R., 1997, Fringe Science: Creating a STIS CCD
Fringe Flat Field, In: The 1997 HST Calibration Workshop,eds. Casertano S., et al., STScI.
Pritchet C., 1978, ApJ, 221, 507.Saglia R.P., Maraston C., Thomas D., Bender R., Colless M.,
2002, ApJ, 579, 13.Schlegel D., Finkbeiner D., Davis M., 1998, ApJ, 500, 525.Schmitt H., Donley J.L., Antonucci R.R.J., Hutchings J.B., Kin-
ney A.L., 2003, ApJS, 148, 327.Storchi-Bergmann T., Kinney A.L., Challis P., 1995, ApJS, 98,
103.Terlevich E., Dıaz A.I., Terlevich R.J., 1990, MNRAS, 242, 271Thomas D., Maraston C., Bender R., 2003, MNRAS, 343, 279.
Tonry J., Davis M., 1979, AJ, 84, 1511.Tremaine S., Gebhardt K., Bender R., Bower G., Dressler A., et
al., 2002, ApJ, 574, 740.de Vaucouleurs G., de Vaucouleurs A., Corwin H.G.Jr., Buta
R.J., Paturel G., Fouque P., 1991, Third Reference Catalogof Bright Galaxies, v.1-3, Springer-Verlag Berlin HeidelbergNew York.
Vazdekis A., Cenarro A.J., Gorgas J., Cardiel N., Peletier R.F.,2003, MNRAS, 340, 1317.
Vega L.R., Asari N.V., Cid Fernandes R., Garcia-Rissmann A.,Schmitt H., Gonzalez Delgado R.M., Storchi-Bergmann T.,2005, in preparation.
Whitmore B.C., McElroy D.B., Tonry J.L., 1985, ApJS, 59, 1.Whittle M., 1992, ApJS, 79, 49.