Investigating the effect of chirality on coaxial Carbon Nanotube Field Effect Transistor

INSTITUTE OF PHYSICS PUBLISHING JOURNAL OF PHYSICS D: APPLIED PHYSICS
J. Phys. D: Appl. Phys. 39 (2006) 563–574 doi:10.1088/0022-3727/39/3/022
An analysis of the shielding gas flow froma coaxial conical nozzle during high powerCO2 laser weldingAntonio Ancona1, Teresa Sibillano1,2, Pietro Mario Lugara1,2,Giuseppe Gonnella2, Giuseppe Pascazio3,4 and Donato Maffione3,4
1 CNR-INFM Regional Laboratory LIT3, via Orabona 4, 70126 Bari, Italy2 Dipartimento Interateneo di Fisica, Universita Degli Studi di Bari, via Orabona 4,70126 Bari, Italy3 Dipartimento di Ingegneria Meccanica e Gestionale, Politecnico di Bari, via Re David 200,70125 Bari, Italy4 Centro di Eccellenza in Meccanica Computazionale, Politecnico di Bari, via Re David 200,70125 Bari, Italy
E-mail: [email protected]
Received 16 September 2005, in final form 8 December 2005Published 20 January 2006Online at stacks.iop.org/JPhysD/39/563
AbstractAn experimental and theoretical study on the role of the nitrogen gas stream,exiting from a conventional conical nozzle tip during a laser weldingprocess, has been carried out. A mathematical model has been used, basedon the Navier–Stokes equations which express fundamental conservationlaws of mass, momentum and energy for a compressible fluid. Numericalsimulations of the gas stream colliding onto a plane surface have beenperformed showing the effects of variations of inlet gas pressure, nozzle exitdiameter and standoff distance on the density and Mach number contours,axis pressure of the gas jet and plate pressure produced on the workpiecesurface. Laser welding experiments have been performed on carbon andstainless steel specimens, by varying the process parameters in the samerange as in the simulations and keeping constant the incident power and thetravel speed. Two different gas stream regimes were found, namely sonicand subsonic, which were experimentally verified to produce cutting andwelding conditions, respectively.
Weld performances have been evaluated in terms of bead width,penetration depth and melted area. Nozzle standoff distance was found tohave a negligible influence, while the exit diameter and the flow ratesignificantly affect the weld results. The numerical predictions allowed anexplanation of the experimental results yielding useful suggestions forenhancing the weld quality, acting simply on the shielding gas parameters.
1. Introduction
The shielding gas plays a fundamental role in the laser weldingprocess since it protects the focusing optics from spatters andscreens the solidifying metal from the surrounding atmosphere.In fact, active gases composing air, like oxygen and nitrogen,react very easily with the melted pool producing oxides andnitrides that affect the metallurgical properties of the weld.
For this reason, the laser welding process requires an inertgas flow, such as helium or argon, onto the laser–metalinteraction area; only in very few cases, when the material is notnegatively affected by nitrides, dry nitrogen may also be usedsuccessfully. Moreover, the gas flow has the beneficial effectof containing the expansion of the laser-generated plasmaplume that may inhibit, due to defocusing and absorptionmechanisms, effective beam energy delivery to the workpiece,
0022-3727/06/030563+12$30.00 © 2006 IOP Publishing Ltd Printed in the UK 563
A Ancona et al
when exceeding a characteristic size. In extreme cases ofineffective gas shielding, the plasma plume detaches from thesample surface, moves towards the direction of the oncominglaser beam and blocks the radiation, thus causing a weldinterruption. Shroud design, composition and flow rate of theshielding gas are key factors in order to limit the perturbingeffect of the plasma plume and cover the reactive hot region ofthe weld without causing instabilities and waves on the meltpool [1–3]. Improvements can be achieved by means of athorough understanding of the actual dynamics but most ofthe laser processes are very complex, with a large numberof variables; hence their modelling is quite a complex task.One possible approach is to model specific physical effectsin detail, while neglecting other effects. In the case of lasercutting processes, several experimental and theoretical workshave been devoted to analysing the dynamic characteristicsof the assist gas flow. The effects of nozzle design, inletstagnation pressure, tip to workpiece standoff distance, andwidth and thickness of the cut kerf on the behaviour of the gasjet patterns inside the kerf have been investigated by numericalsimulations [4, 5]. A correlation has been found betweenthese process parameters, influencing the motion of the viscousmolten pool inside the kerf, and the dross formation or moregenerally the quality of the cut surface [6–8].
Due to the complexity of the physical interactionsinvolved, very few works have studied the dynamics of theinert gas flow in the laser–metal interaction zone during alaser welding process. Furthermore, a small number ofexperimental data are currently available on the correlationbetween the shielding gas flow parameters and the weld quality.
Several laser welding nozzles have been developed,characterized by different designs of the shroud gas, aimingto enhance the coupling between the incident laser beam andthe workpiece and to prevent the formation of oxides onthe weld surface. An early empirical approach consisted ofemploying a conical nozzle, coaxial to the laser beam. Afterseveral tests the right combination of inlet gas pressure and exitdiameter was found that allowed a reduction in the turbulenceof the gas stream, thus stabilizing the plasma plume on thekeyhole surface [9]. This was considered a critical condition toobtain reliable and good quality welds. A novel nozzle designdeveloped by Herrmann [10] was characterized by one or moreconduits, for auxiliary gas jets, arranged with a rotationalsymmetry around the central opening for the laser beam. Theauxiliary gas jets have a velocity component perpendicular tothe beam axis so that a vacuum is produced at the weldingpoint, which is surrounded by an inert atmosphere. Fabbroet al [11] introduced a ring nozzle, coaxial to the laser beam,producing a laminar flow of gas that splits into two portionswhen it impinges on the workpiece surface. The centripetalradial flow directs towards the laser–metal interaction zone,shields the weld pool and then escapes towards the outside viathe open inlet face in counter flow to the laser beam. Thisoutgoing movement fully purges the inside of the nozzle thuspreventing contamination by the ambient air; the centrifugalradial flow completes the protection of the weld area.
In this paper a theoretical model has been employeddescribing the gas flow dynamics in an experimental laserwelding configuration. This task is quite different and morechallenging than previous works concerning laser cutting,
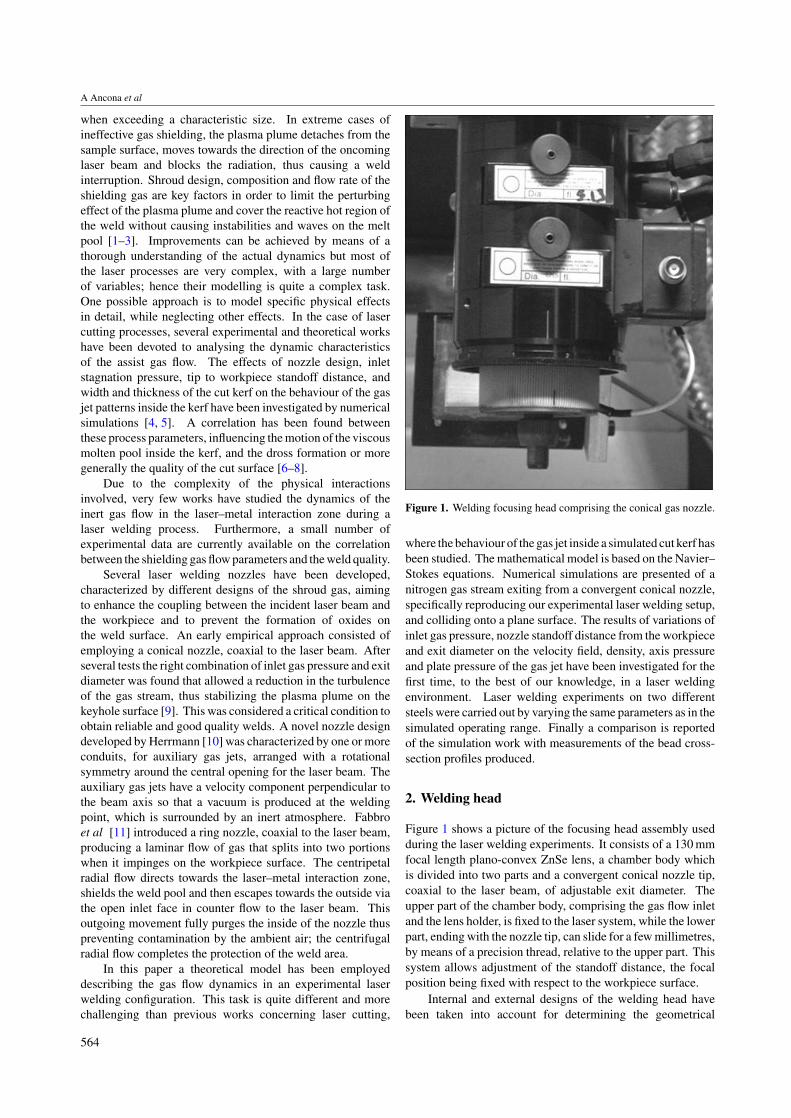
Figure 1. Welding focusing head comprising the conical gas nozzle.
where the behaviour of the gas jet inside a simulated cut kerf hasbeen studied. The mathematical model is based on the Navier–Stokes equations. Numerical simulations are presented of anitrogen gas stream exiting from a convergent conical nozzle,specifically reproducing our experimental laser welding setup,and colliding onto a plane surface. The results of variations ofinlet gas pressure, nozzle standoff distance from the workpieceand exit diameter on the velocity field, density, axis pressureand plate pressure of the gas jet have been investigated for thefirst time, to the best of our knowledge, in a laser weldingenvironment. Laser welding experiments on two differentsteels were carried out by varying the same parameters as in thesimulated operating range. Finally a comparison is reportedof the simulation work with measurements of the bead cross-section profiles produced.
2. Welding head
Figure 1 shows a picture of the focusing head assembly usedduring the laser welding experiments. It consists of a 130 mmfocal length plano-convex ZnSe lens, a chamber body whichis divided into two parts and a convergent conical nozzle tip,coaxial to the laser beam, of adjustable exit diameter. Theupper part of the chamber body, comprising the gas flow inletand the lens holder, is fixed to the laser system, while the lowerpart, ending with the nozzle tip, can slide for a few millimetres,by means of a precision thread, relative to the upper part. Thissystem allows adjustment of the standoff distance, the focalposition being fixed with respect to the workpiece surface.
Internal and external designs of the welding head havebeen taken into account for determining the geometrical
564
Analysis of shielding gas flow in CO2 laser welding
boundary conditions for the gas flow simulations describedin the following paragraph.
3. Theoretical model and gas flow simulations
Numerical simulations have been performed of a gas jet exitingfrom a conical convergent nozzle, described in section 2, andimpinging on a plain surface. The commercial code Fluent [12]has been used for this purpose. The effects on the gas flow ofthe thermal plasma plume as well as of the temperature gradienton the metal surface, generated by the laser–matter interaction,have been neglected in order to simplify the model. The gasflow has been modelled by the Navier–Stokes equations whichemploy a linear relation between the shear tensor τ and thestrain rate tensor (∇u + ∇uT )/2. The following set of partialdifferential equations, expressing the local conservation lawsof mass, momentum and energy, respectively, has been solved:
∂ρ
∂t+ ∇ · (ρu) = 0, (1)
∂
∂t(ρu) + ∇ · (ρuu + pI) − ∇ · τ = 0, (2)
∂
∂t(ρe) + ∇ · (ρhu) − ∇ · (τ · u − q) = 0. (3)
In the above equations ρ indicates the density, u the velocityvector, t the time, p the pressure, I is the identity tensor, ande the total specific internal energy,
e = ei +u2
2, (4)
ei is the specific internal energy, h is the total specific enthalpy,
h = ei +p
ρ+
u2
2; (5)
finally q indicates the heat flux, evaluated as q = −k∇T ,where k is the thermal conductivity and T the temperature.The employed linear relationship between the shear tensor, τ ,and the strain rate tensor is
τ = µ(∇u + ∇uT ) − 2
3µ I∇ · u, (6)
where µ is the molecular viscosity of the fluid. In order to solvethe above set of differential equations it is necessary to findfurther relationships between the thermodynamic variables.This is possible by assuming the following state equations:
p = ρ(γ − 1)ei = ρ(γ − 1)
(e − u2
2
); (7)
moreover,
h = γp
(γ − 1)ρ+
u2
2, (8)
where γ is the specific heat ratio.The following assumptions are made to simplify the
calculation:
(i) The spatial domain of the numerical simulations has anaxial symmetry, therefore an axisymmetric flow has beenconsidered in order to reduce the computational effort withrespect to the three-dimensional case.
(ii) Since the flow is turbulent, and therefore characterizedby random fluctuations of the flow variables, we use astatistical approach in which all quantities are expressedas the sum of mean and fluctuating contributions.Performing the mean of the governing equation term byterm, one obtains the Reynolds-Averaged Navier–Stokes(RANS) equations, which are solved to compute the meanflow variables. Such an approach is usually employed inpractical computations allowing solution of the turbulentflows with reasonable computing resources. On the otherhand, the non-linearity of the governing equations leadsto the introduction of additional fluxes in the momentumand energy equations (arising from the product of thefluctuations), which are not known a priori and are tobe modelled. In the present study, the k-ε realizableturbulence model has been used [13]; it is noteworthy thatusing different turbulence models resulted in negligibledifferences on the computed quantities, so that the abovemodel has been employed in all simulations.
(iii) The gas is nitrogen and is considered a calorically perfectgas.
(iv) The nitrogen jet is steady and it is ejected in an ambientatmosphere composed of nitrogen at standard atmospherictemperature and pressure.
(v) The flow is compressible and the viscosity variation withtemperature has been computed by means of Sutherland’slaw,
µ = µ0
(T
T0
)3/2T0 + S
T + S, (9)
where the viscosity µ at temperature T is computed withrespect to a reference value, µ0, at temperature T0. In theequation above the viscosity is measured in kg (ms)−1, thetemperature in K and the following values are used:
µ0 = 1.7894 · 10−5 kg (ms)−1, T0 = 273.11 K,
S = 110.56 K.
Besides these assumptions the following boundaryconditions have been used:
(a) Together with the adiabatic assumption, the no-slipvelocity boundary condition has been imposed along themetal surface, the internal walls of the stagnation chamberand the external walls of the nozzle.
(b) Considering the particular internal geometry of the gasconduit at the nozzle entrance, a mass flow inlet conditionhas been assumed, which allowed us to reduce theuncertainty on the pressure distribution downstream of thegas inlet.
(c) As regards the pressure outlet, the lateral and upstreamsections of the gas flow are fairly distant from the metalplate.
(d) The turbulence conditions of the gas stream at the nozzleinlet have been taken into account by means of theturbulence intensity, T u:
T u = u′
uavg= 0.16∗(ReDh)
1/8 = 0.04, (10)
where ReDh indicates the Reynolds number of the conduitupstream of the nozzle; moreover, the inlet turbulencelength scale has been assumed equal to 21 × 10−6 m.
565
A Ancona et al
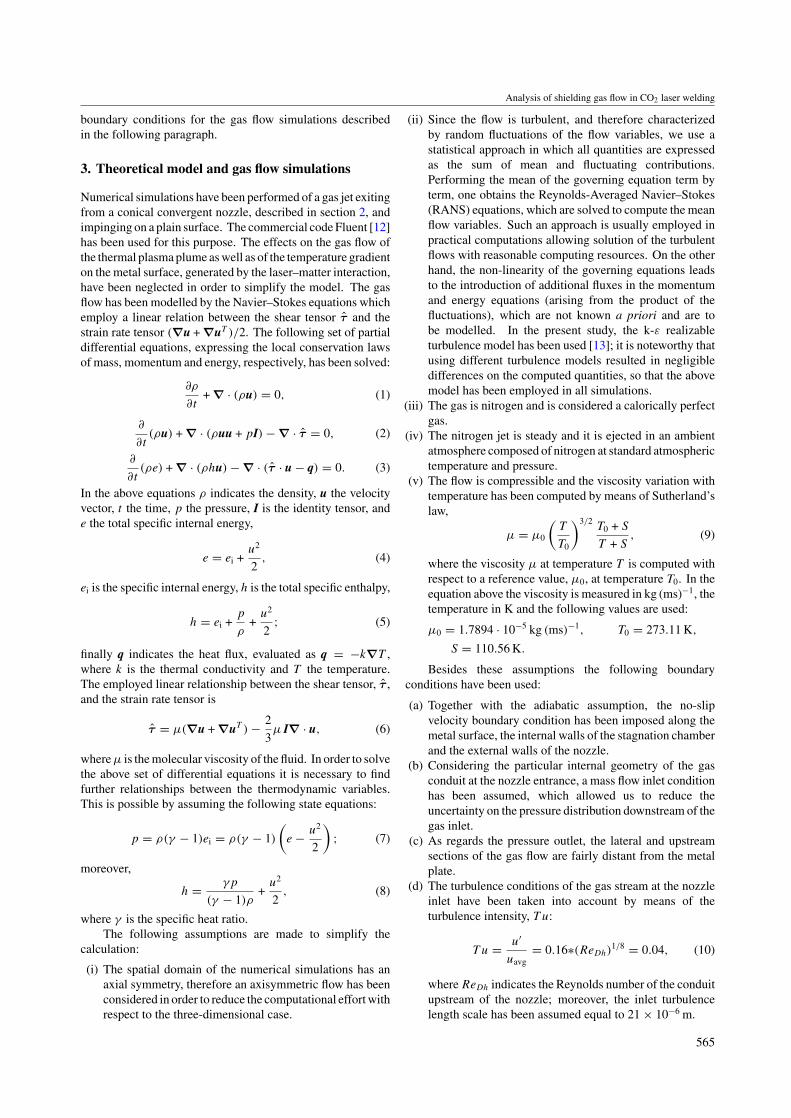
Figure 2. Geometry and space discretization employed in the computations; the box sketched in the picture indicates the spatial sub-domainused to illustrate the simulations shown in the following.
Table 1. Values of process parameters investigated during thenumerical simulations. Labels assigned to each geometricalparameter are reported in brackets.
Q [Nl/min] D [mm] NSD [mm]
10 1.5 (d1) 3 (h1)20 3 (d2) 6 (h2)30 4 (d3) 10 (h3)40
100
The solution of the RANS equations both inside andoutside the nozzle has been obtained by discretizing thespatial domain under investigation with a hybrid mesh. Thisappositively developed mesh, shown in figure 2, allowed usto minimize the number of points without losing significantinformation on the gas flow dynamics both at the centre of thenozzle and near its walls.
The values of the process parameters investigated duringthe numerical simulations are reported in table 1. Severalgas flow simulations have been performed, one for eachcombination of the mass flow rate (measured in normal litresper minute, Nl min−1, corresponding to the mass flow rate of1 l of gas at a pressure of 1 atm and a standard temperature of293 K per unit time) with the geometrical arrangement of thenozzle exit (diameter, D, and standoff distance, NSD).
4. Results of the simulations
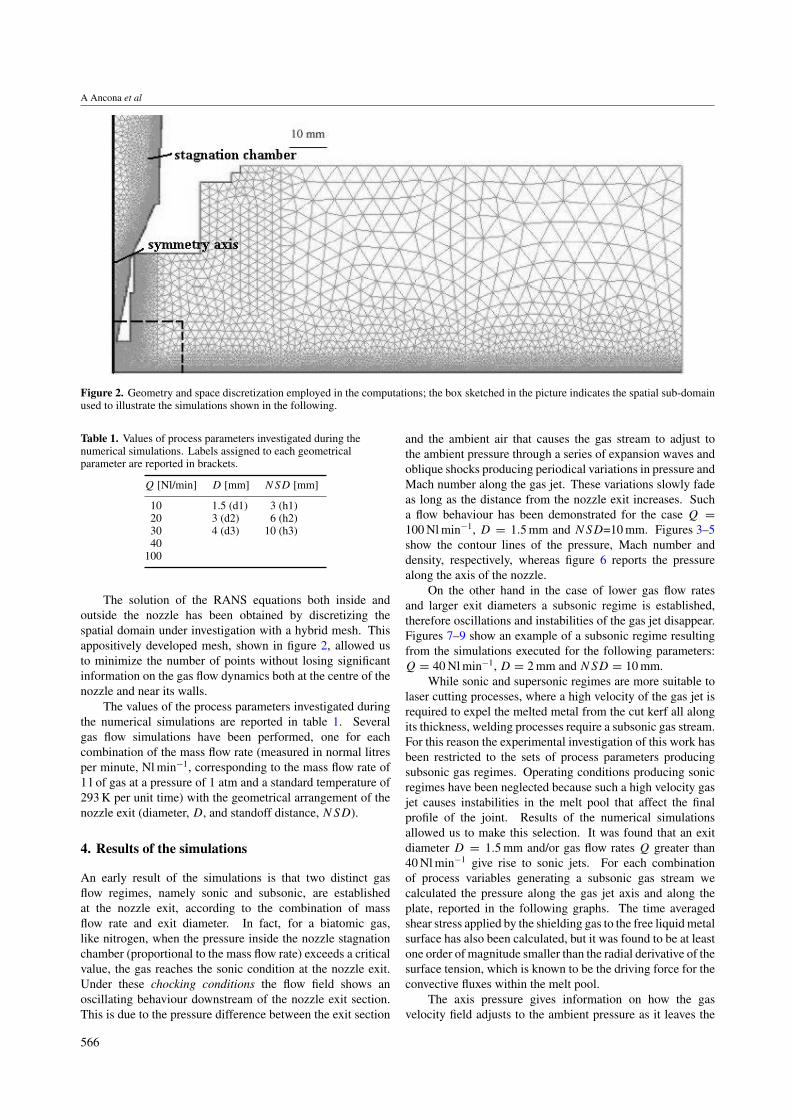
An early result of the simulations is that two distinct gasflow regimes, namely sonic and subsonic, are establishedat the nozzle exit, according to the combination of massflow rate and exit diameter. In fact, for a biatomic gas,like nitrogen, when the pressure inside the nozzle stagnationchamber (proportional to the mass flow rate) exceeds a criticalvalue, the gas reaches the sonic condition at the nozzle exit.Under these chocking conditions the flow field shows anoscillating behaviour downstream of the nozzle exit section.This is due to the pressure difference between the exit section
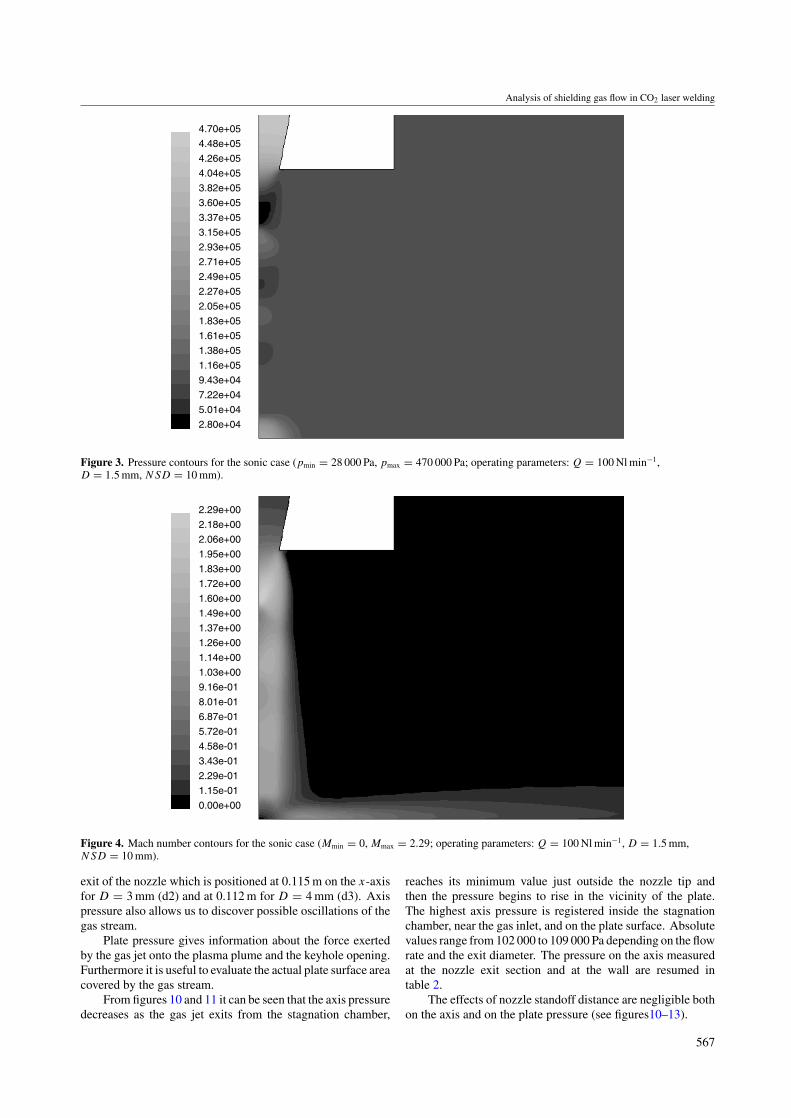
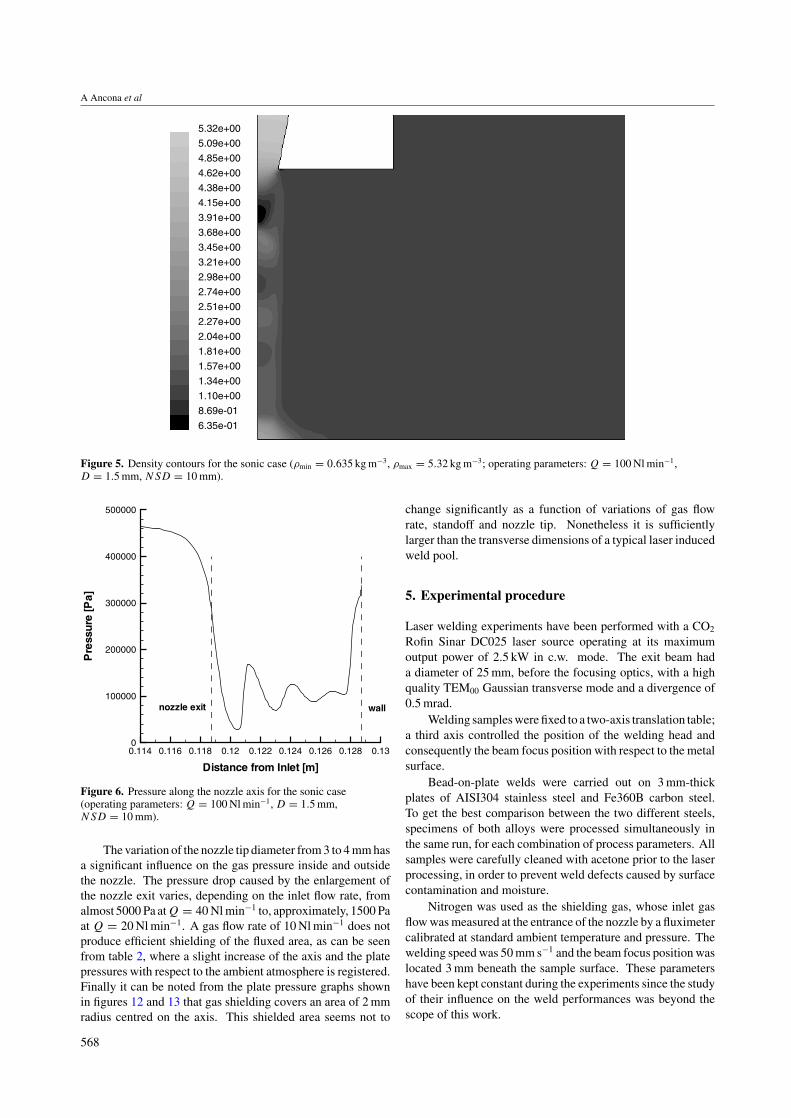
and the ambient air that causes the gas stream to adjust tothe ambient pressure through a series of expansion waves andoblique shocks producing periodical variations in pressure andMach number along the gas jet. These variations slowly fadeas long as the distance from the nozzle exit increases. Sucha flow behaviour has been demonstrated for the case Q =100 Nl min−1, D = 1.5 mm and NSD=10 mm. Figures 3–5show the contour lines of the pressure, Mach number anddensity, respectively, whereas figure 6 reports the pressurealong the axis of the nozzle.
On the other hand in the case of lower gas flow ratesand larger exit diameters a subsonic regime is established,therefore oscillations and instabilities of the gas jet disappear.Figures 7–9 show an example of a subsonic regime resultingfrom the simulations executed for the following parameters:Q = 40 Nl min−1, D = 2 mm and NSD = 10 mm.
While sonic and supersonic regimes are more suitable tolaser cutting processes, where a high velocity of the gas jet isrequired to expel the melted metal from the cut kerf all alongits thickness, welding processes require a subsonic gas stream.For this reason the experimental investigation of this work hasbeen restricted to the sets of process parameters producingsubsonic gas regimes. Operating conditions producing sonicregimes have been neglected because such a high velocity gasjet causes instabilities in the melt pool that affect the finalprofile of the joint. Results of the numerical simulationsallowed us to make this selection. It was found that an exitdiameter D = 1.5 mm and/or gas flow rates Q greater than40 Nl min−1 give rise to sonic jets. For each combinationof process variables generating a subsonic gas stream wecalculated the pressure along the gas jet axis and along theplate, reported in the following graphs. The time averagedshear stress applied by the shielding gas to the free liquid metalsurface has also been calculated, but it was found to be at leastone order of magnitude smaller than the radial derivative of thesurface tension, which is known to be the driving force for theconvective fluxes within the melt pool.
The axis pressure gives information on how the gasvelocity field adjusts to the ambient pressure as it leaves the
566
Analysis of shielding gas flow in CO2 laser welding
4.70e+05
2.80e+04
5.01e+04
7.22e+04
9.43e+04
1.16e+05
1.38e+05
1.61e+05
1.83e+05
2.05e+05
2.27e+05
2.49e+05
2.71e+05
2.93e+05
3.15e+05
3.37e+05
3.60e+05
3.82e+05
4.04e+05
4.26e+05
4.48e+05
Figure 3. Pressure contours for the sonic case (pmin = 28 000 Pa, pmax = 470 000 Pa; operating parameters: Q = 100 Nl min−1,D = 1.5 mm, NSD = 10 mm).
2.29e+00
0.00e+00
1.15e-01
2.29e-01
3.43e-01
4.58e-01
5.72e-01
6.87e-01
8.01e-01
9.16e-01
1.03e+00
1.14e+00
1.26e+00
1.37e+00
1.49e+00
1.60e+00
1.72e+00
1.83e+00
1.95e+00
2.06e+00
2.18e+00
Figure 4. Mach number contours for the sonic case (Mmin = 0, Mmax = 2.29; operating parameters: Q = 100 Nl min−1, D = 1.5 mm,NSD = 10 mm).
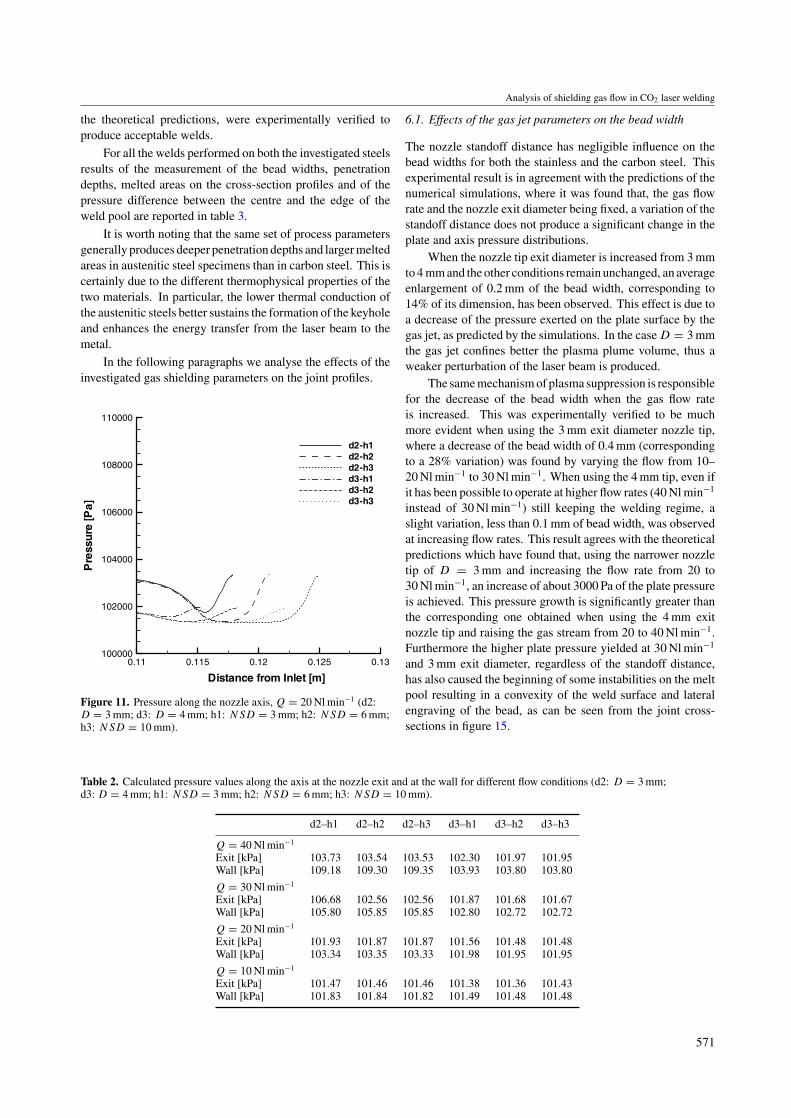
exit of the nozzle which is positioned at 0.115 m on the x-axisfor D = 3 mm (d2) and at 0.112 m for D = 4 mm (d3). Axispressure also allows us to discover possible oscillations of thegas stream.
Plate pressure gives information about the force exertedby the gas jet onto the plasma plume and the keyhole opening.Furthermore it is useful to evaluate the actual plate surface areacovered by the gas stream.
From figures 10 and 11 it can be seen that the axis pressuredecreases as the gas jet exits from the stagnation chamber,
reaches its minimum value just outside the nozzle tip andthen the pressure begins to rise in the vicinity of the plate.The highest axis pressure is registered inside the stagnationchamber, near the gas inlet, and on the plate surface. Absolutevalues range from 102 000 to 109 000 Pa depending on the flowrate and the exit diameter. The pressure on the axis measuredat the nozzle exit section and at the wall are resumed intable 2.
The effects of nozzle standoff distance are negligible bothon the axis and on the plate pressure (see figures10–13).
567
A Ancona et al
5.32e+00
6.35e-01
8.69e-01
1.10e+00
1.34e+00
1.57e+00
1.81e+00
2.04e+00
2.27e+00
2.51e+00
2.74e+00
2.98e+00
3.21e+00
3.45e+00
3.68e+00
3.91e+00
4.15e+00
4.38e+00
4.62e+00
4.85e+00
5.09e+00
Figure 5. Density contours for the sonic case (ρmin = 0.635 kg m−3, ρmax = 5.32 kg m−3; operating parameters: Q = 100 Nl min−1,D = 1.5 mm, NSD = 10 mm).
Distance from Inlet [m]
Pre
ssur
e[P
a]
0.114 0.116 0.118 0.12 0.122 0.124 0.126 0.128 0.130
100000
200000
300000
400000
500000
wallnozzle exit
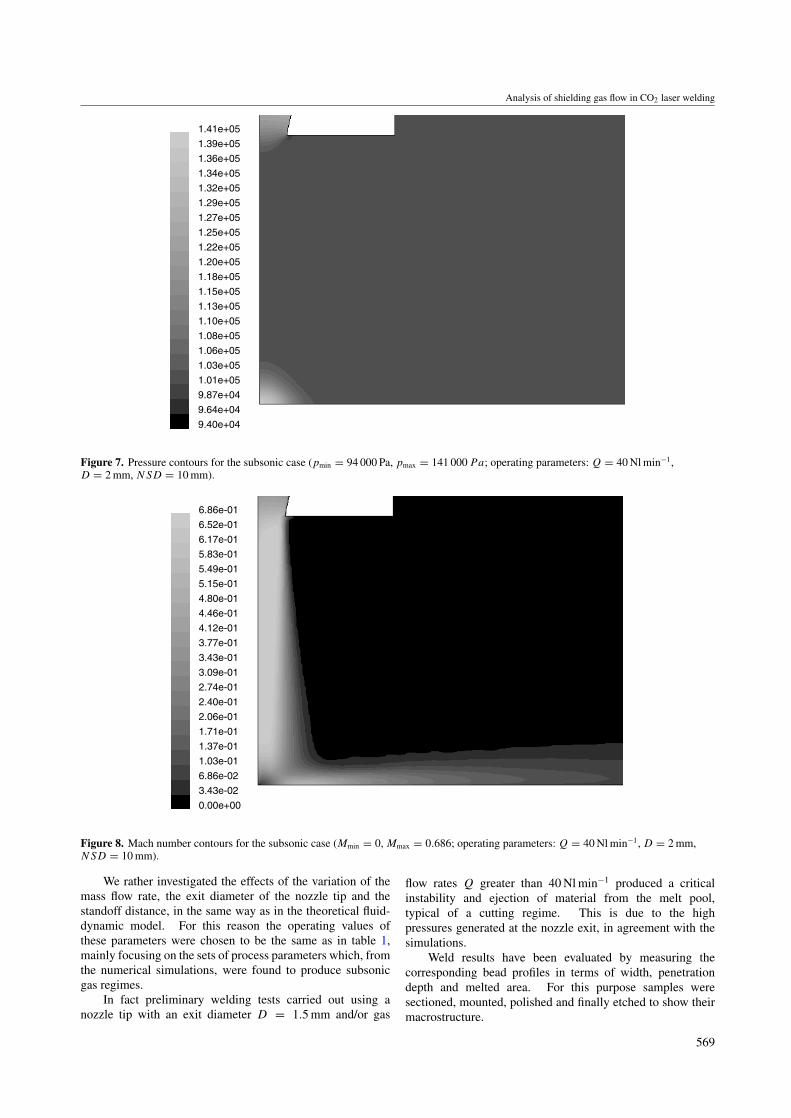
Figure 6. Pressure along the nozzle axis for the sonic case(operating parameters: Q = 100 Nl min−1, D = 1.5 mm,NSD = 10 mm).
The variation of the nozzle tip diameter from 3 to 4 mm hasa significant influence on the gas pressure inside and outsidethe nozzle. The pressure drop caused by the enlargement ofthe nozzle exit varies, depending on the inlet flow rate, fromalmost 5000 Pa atQ = 40 Nl min−1 to, approximately, 1500 Paat Q = 20 Nl min−1. A gas flow rate of 10 Nl min−1 does notproduce efficient shielding of the fluxed area, as can be seenfrom table 2, where a slight increase of the axis and the platepressures with respect to the ambient atmosphere is registered.Finally it can be noted from the plate pressure graphs shownin figures 12 and 13 that gas shielding covers an area of 2 mmradius centred on the axis. This shielded area seems not to
change significantly as a function of variations of gas flowrate, standoff and nozzle tip. Nonetheless it is sufficientlylarger than the transverse dimensions of a typical laser inducedweld pool.
5. Experimental procedure
Laser welding experiments have been performed with a CO2
Rofin Sinar DC025 laser source operating at its maximumoutput power of 2.5 kW in c.w. mode. The exit beam hada diameter of 25 mm, before the focusing optics, with a highquality TEM00 Gaussian transverse mode and a divergence of0.5 mrad.
Welding samples were fixed to a two-axis translation table;a third axis controlled the position of the welding head andconsequently the beam focus position with respect to the metalsurface.
Bead-on-plate welds were carried out on 3 mm-thickplates of AISI304 stainless steel and Fe360B carbon steel.To get the best comparison between the two different steels,specimens of both alloys were processed simultaneously inthe same run, for each combination of process parameters. Allsamples were carefully cleaned with acetone prior to the laserprocessing, in order to prevent weld defects caused by surfacecontamination and moisture.
Nitrogen was used as the shielding gas, whose inlet gasflow was measured at the entrance of the nozzle by a fluximetercalibrated at standard ambient temperature and pressure. Thewelding speed was 50 mm s−1 and the beam focus position waslocated 3 mm beneath the sample surface. These parametershave been kept constant during the experiments since the studyof their influence on the weld performances was beyond thescope of this work.
568
Analysis of shielding gas flow in CO2 laser welding
1.41e+05
9.40e+04
9.64e+04
9.87e+04
1.01e+05
1.03e+05
1.06e+05
1.08e+05
1.10e+05
1.13e+05
1.15e+05
1.18e+05
1.20e+05
1.22e+05
1.25e+05
1.27e+05
1.29e+05
1.32e+05
1.34e+05
1.36e+05
1.39e+05
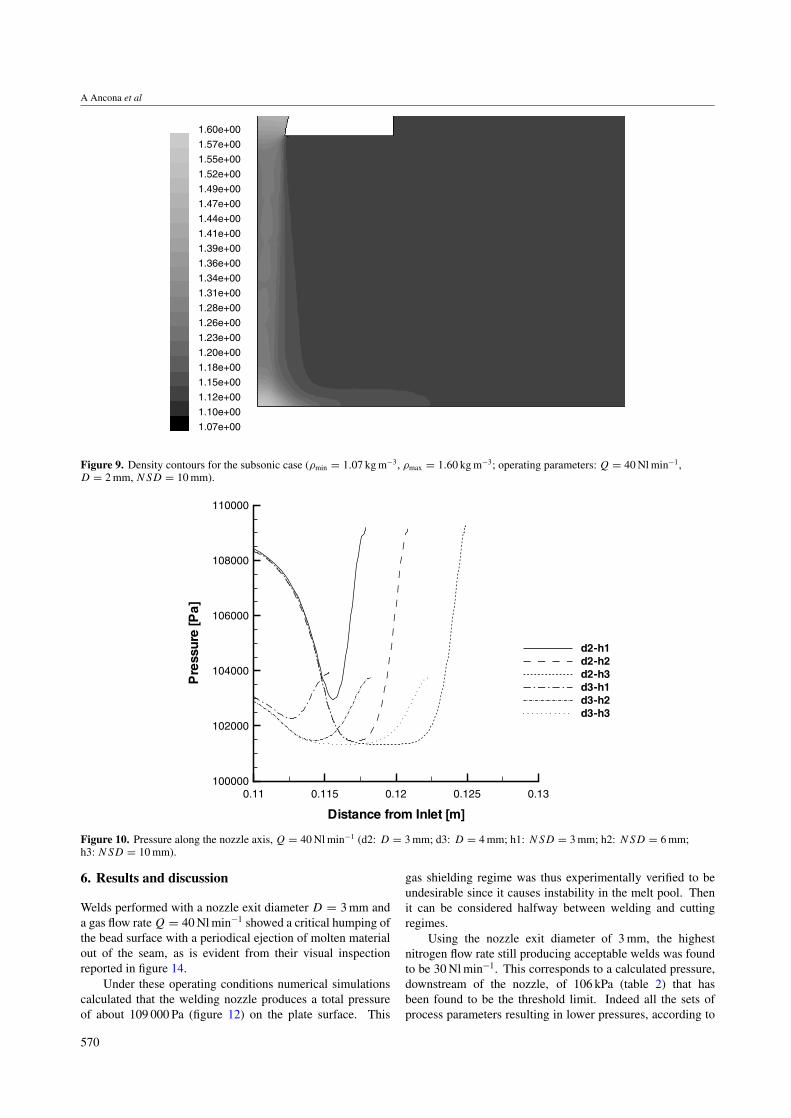
Figure 7. Pressure contours for the subsonic case (pmin = 94 000 Pa, pmax = 141 000 Pa; operating parameters: Q = 40 Nl min−1,D = 2 mm, NSD = 10 mm).
6.86e-01
0.00e+00
3.43e-02
6.86e-02
1.03e-01
1.37e-01
1.71e-01
2.06e-01
2.40e-01
2.74e-01
3.09e-01
3.43e-01
3.77e-01
4.12e-01
4.46e-01
4.80e-01
5.15e-01
5.49e-01
5.83e-01
6.17e-01
6.52e-01
Figure 8. Mach number contours for the subsonic case (Mmin = 0, Mmax = 0.686; operating parameters: Q = 40 Nl min−1, D = 2 mm,NSD = 10 mm).
We rather investigated the effects of the variation of themass flow rate, the exit diameter of the nozzle tip and thestandoff distance, in the same way as in the theoretical fluid-dynamic model. For this reason the operating values ofthese parameters were chosen to be the same as in table 1,mainly focusing on the sets of process parameters which, fromthe numerical simulations, were found to produce subsonicgas regimes.
In fact preliminary welding tests carried out using anozzle tip with an exit diameter D = 1.5 mm and/or gas
flow rates Q greater than 40 Nl min−1 produced a criticalinstability and ejection of material from the melt pool,typical of a cutting regime. This is due to the highpressures generated at the nozzle exit, in agreement with thesimulations.
Weld results have been evaluated by measuring thecorresponding bead profiles in terms of width, penetrationdepth and melted area. For this purpose samples weresectioned, mounted, polished and finally etched to show theirmacrostructure.
569
A Ancona et al
1.60e+00
1.07e+00
1.10e+00
1.12e+00
1.15e+00
1.18e+00
1.20e+00
1.23e+00
1.26e+00
1.28e+00
1.31e+00
1.34e+00
1.36e+00
1.39e+00
1.41e+00
1.44e+00
1.47e+00
1.49e+00
1.52e+00
1.55e+00
1.57e+00
Figure 9. Density contours for the subsonic case (ρmin = 1.07 kg m−3, ρmax = 1.60 kg m−3; operating parameters: Q = 40 Nl min−1,D = 2 mm, NSD = 10 mm).
Distance from Inlet [m]
Pre
ssur
e[P
a]
0.11 0.115 0.12 0.125 0.13100000
102000
104000
106000
108000
110000
d2-h1d2-h2d2-h3d3-h1d3-h2d3-h3
Figure 10. Pressure along the nozzle axis, Q = 40 Nl min−1 (d2: D = 3 mm; d3: D = 4 mm; h1: NSD = 3 mm; h2: NSD = 6 mm;h3: NSD = 10 mm).
6. Results and discussion
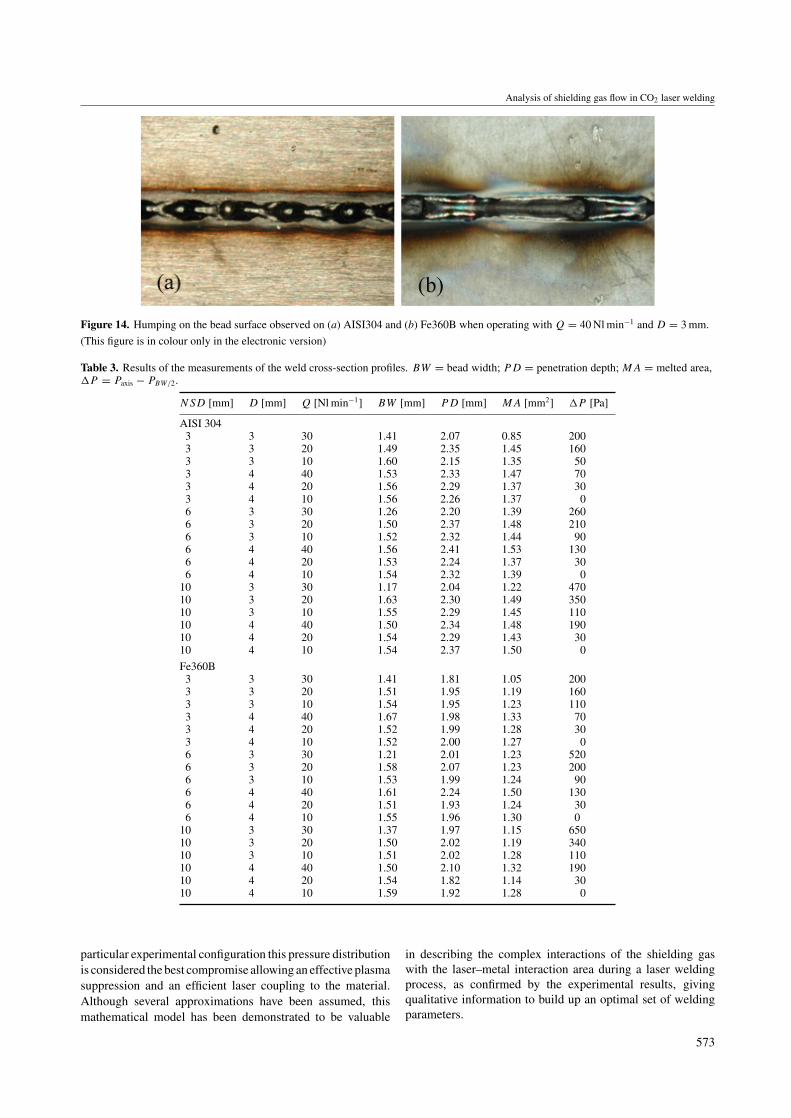
Welds performed with a nozzle exit diameter D = 3 mm anda gas flow rate Q = 40 Nl min−1 showed a critical humping ofthe bead surface with a periodical ejection of molten materialout of the seam, as is evident from their visual inspectionreported in figure 14.
Under these operating conditions numerical simulationscalculated that the welding nozzle produces a total pressureof about 109 000 Pa (figure 12) on the plate surface. This
gas shielding regime was thus experimentally verified to beundesirable since it causes instability in the melt pool. Thenit can be considered halfway between welding and cuttingregimes.
Using the nozzle exit diameter of 3 mm, the highestnitrogen flow rate still producing acceptable welds was foundto be 30 Nl min−1. This corresponds to a calculated pressure,downstream of the nozzle, of 106 kPa (table 2) that hasbeen found to be the threshold limit. Indeed all the sets ofprocess parameters resulting in lower pressures, according to
570
Analysis of shielding gas flow in CO2 laser welding
the theoretical predictions, were experimentally verified toproduce acceptable welds.
For all the welds performed on both the investigated steelsresults of the measurement of the bead widths, penetrationdepths, melted areas on the cross-section profiles and of thepressure difference between the centre and the edge of theweld pool are reported in table 3.
It is worth noting that the same set of process parametersgenerally produces deeper penetration depths and larger meltedareas in austenitic steel specimens than in carbon steel. This iscertainly due to the different thermophysical properties of thetwo materials. In particular, the lower thermal conduction ofthe austenitic steels better sustains the formation of the keyholeand enhances the energy transfer from the laser beam to themetal.
In the following paragraphs we analyse the effects of theinvestigated gas shielding parameters on the joint profiles.
Distance from Inlet [m]
Pre
ssur
e[P
a]
0.11 0.115 0.12 0.125 0.13100000
102000
104000
106000
108000
110000
d2-h1d2-h2d2-h3d3-h1d3-h2d3-h3
Figure 11. Pressure along the nozzle axis, Q = 20 Nl min−1 (d2:D = 3 mm; d3: D = 4 mm; h1: NSD = 3 mm; h2: NSD = 6 mm;h3: NSD = 10 mm).
Table 2. Calculated pressure values along the axis at the nozzle exit and at the wall for different flow conditions (d2: D = 3 mm;d3: D = 4 mm; h1: NSD = 3 mm; h2: NSD = 6 mm; h3: NSD = 10 mm).
d2–h1 d2–h2 d2–h3 d3–h1 d3–h2 d3–h3
Q = 40 Nl min−1
Exit [kPa] 103.73 103.54 103.53 102.30 101.97 101.95Wall [kPa] 109.18 109.30 109.35 103.93 103.80 103.80
Q = 30 Nl min−1
Exit [kPa] 106.68 102.56 102.56 101.87 101.68 101.67Wall [kPa] 105.80 105.85 105.85 102.80 102.72 102.72
Q = 20 Nl min−1
Exit [kPa] 101.93 101.87 101.87 101.56 101.48 101.48Wall [kPa] 103.34 103.35 103.33 101.98 101.95 101.95
Q = 10 Nl min−1
Exit [kPa] 101.47 101.46 101.46 101.38 101.36 101.43Wall [kPa] 101.83 101.84 101.82 101.49 101.48 101.48
6.1. Effects of the gas jet parameters on the bead width
The nozzle standoff distance has negligible influence on thebead widths for both the stainless and the carbon steel. Thisexperimental result is in agreement with the predictions of thenumerical simulations, where it was found that, the gas flowrate and the nozzle exit diameter being fixed, a variation of thestandoff distance does not produce a significant change in theplate and axis pressure distributions.
When the nozzle tip exit diameter is increased from 3 mmto 4 mm and the other conditions remain unchanged, an averageenlargement of 0.2 mm of the bead width, corresponding to14% of its dimension, has been observed. This effect is due toa decrease of the pressure exerted on the plate surface by thegas jet, as predicted by the simulations. In the case D = 3 mmthe gas jet confines better the plasma plume volume, thus aweaker perturbation of the laser beam is produced.
The same mechanism of plasma suppression is responsiblefor the decrease of the bead width when the gas flow rateis increased. This was experimentally verified to be muchmore evident when using the 3 mm exit diameter nozzle tip,where a decrease of the bead width of 0.4 mm (correspondingto a 28% variation) was found by varying the flow from 10–20 Nl min−1 to 30 Nl min−1. When using the 4 mm tip, even ifit has been possible to operate at higher flow rates (40 Nl min−1
instead of 30 Nl min−1) still keeping the welding regime, aslight variation, less than 0.1 mm of bead width, was observedat increasing flow rates. This result agrees with the theoreticalpredictions which have found that, using the narrower nozzletip of D = 3 mm and increasing the flow rate from 20 to30 Nl min−1, an increase of about 3000 Pa of the plate pressureis achieved. This pressure growth is significantly greater thanthe corresponding one obtained when using the 4 mm exitnozzle tip and raising the gas stream from 20 to 40 Nl min−1.Furthermore the higher plate pressure yielded at 30 Nl min−1
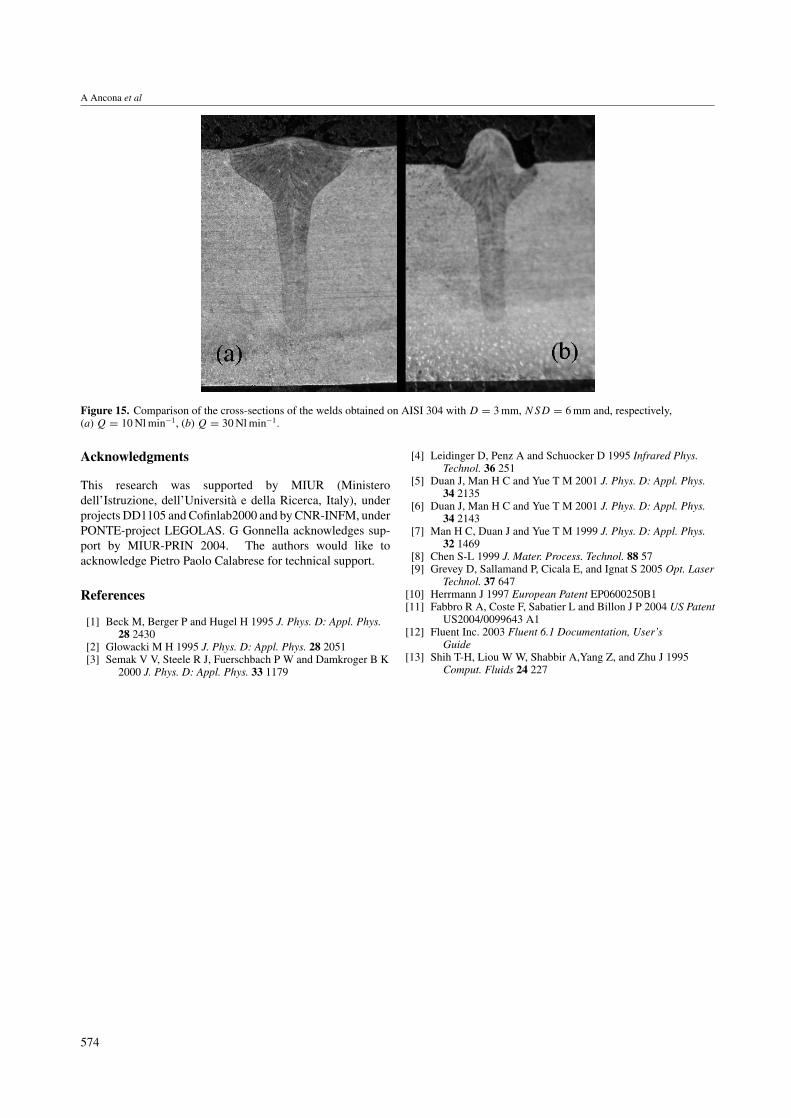
and 3 mm exit diameter, regardless of the standoff distance,has also caused the beginning of some instabilities on the meltpool resulting in a convexity of the weld surface and lateralengraving of the bead, as can be seen from the joint cross-sections in figure 15.
571
A Ancona et al
Distance from axis [m]
Pre
ssur
e[P
a]
0 0.001 0.002 0.003100000
102000
104000
106000
108000
110000
d2-h1d2-h2d2-h3d3-h1d3-h2d3-h3
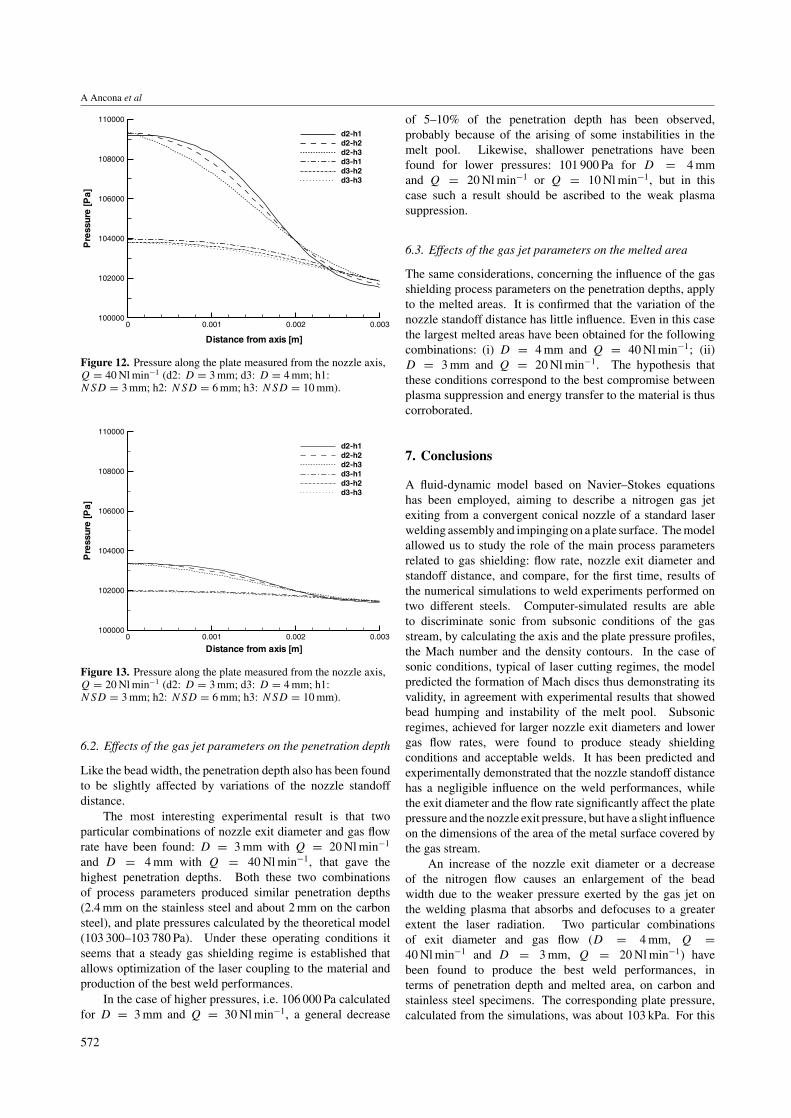
Figure 12. Pressure along the plate measured from the nozzle axis,Q = 40 Nl min−1 (d2: D = 3 mm; d3: D = 4 mm; h1:NSD = 3 mm; h2: NSD = 6 mm; h3: NSD = 10 mm).
Distance from axis [m]
Pre
ssur
e[P
a]
0 0.001 0.002 0.003100000
102000
104000
106000
108000
110000
d2-h1d2-h2d2-h3d3-h1d3-h2d3-h3
Figure 13. Pressure along the plate measured from the nozzle axis,Q = 20 Nl min−1 (d2: D = 3 mm; d3: D = 4 mm; h1:NSD = 3 mm; h2: NSD = 6 mm; h3: NSD = 10 mm).
6.2. Effects of the gas jet parameters on the penetration depth
Like the bead width, the penetration depth also has been foundto be slightly affected by variations of the nozzle standoffdistance.
The most interesting experimental result is that twoparticular combinations of nozzle exit diameter and gas flowrate have been found: D = 3 mm with Q = 20 Nl min−1
and D = 4 mm with Q = 40 Nl min−1, that gave thehighest penetration depths. Both these two combinationsof process parameters produced similar penetration depths(2.4 mm on the stainless steel and about 2 mm on the carbonsteel), and plate pressures calculated by the theoretical model(103 300–103 780 Pa). Under these operating conditions itseems that a steady gas shielding regime is established thatallows optimization of the laser coupling to the material andproduction of the best weld performances.
In the case of higher pressures, i.e. 106 000 Pa calculatedfor D = 3 mm and Q = 30 Nl min−1, a general decrease
of 5–10% of the penetration depth has been observed,probably because of the arising of some instabilities in themelt pool. Likewise, shallower penetrations have beenfound for lower pressures: 101 900 Pa for D = 4 mmand Q = 20 Nl min−1 or Q = 10 Nl min−1, but in thiscase such a result should be ascribed to the weak plasmasuppression.
6.3. Effects of the gas jet parameters on the melted area
The same considerations, concerning the influence of the gasshielding process parameters on the penetration depths, applyto the melted areas. It is confirmed that the variation of thenozzle standoff distance has little influence. Even in this casethe largest melted areas have been obtained for the followingcombinations: (i) D = 4 mm and Q = 40 Nl min−1; (ii)D = 3 mm and Q = 20 Nl min−1. The hypothesis thatthese conditions correspond to the best compromise betweenplasma suppression and energy transfer to the material is thuscorroborated.
7. Conclusions
A fluid-dynamic model based on Navier–Stokes equationshas been employed, aiming to describe a nitrogen gas jetexiting from a convergent conical nozzle of a standard laserwelding assembly and impinging on a plate surface. The modelallowed us to study the role of the main process parametersrelated to gas shielding: flow rate, nozzle exit diameter andstandoff distance, and compare, for the first time, results ofthe numerical simulations to weld experiments performed ontwo different steels. Computer-simulated results are ableto discriminate sonic from subsonic conditions of the gasstream, by calculating the axis and the plate pressure profiles,the Mach number and the density contours. In the case ofsonic conditions, typical of laser cutting regimes, the modelpredicted the formation of Mach discs thus demonstrating itsvalidity, in agreement with experimental results that showedbead humping and instability of the melt pool. Subsonicregimes, achieved for larger nozzle exit diameters and lowergas flow rates, were found to produce steady shieldingconditions and acceptable welds. It has been predicted andexperimentally demonstrated that the nozzle standoff distancehas a negligible influence on the weld performances, whilethe exit diameter and the flow rate significantly affect the platepressure and the nozzle exit pressure, but have a slight influenceon the dimensions of the area of the metal surface covered bythe gas stream.
An increase of the nozzle exit diameter or a decreaseof the nitrogen flow causes an enlargement of the beadwidth due to the weaker pressure exerted by the gas jet onthe welding plasma that absorbs and defocuses to a greaterextent the laser radiation. Two particular combinationsof exit diameter and gas flow (D = 4 mm, Q =40 Nl min−1 and D = 3 mm, Q = 20 Nl min−1) havebeen found to produce the best weld performances, interms of penetration depth and melted area, on carbon andstainless steel specimens. The corresponding plate pressure,calculated from the simulations, was about 103 kPa. For this
572
Analysis of shielding gas flow in CO2 laser welding
Figure 14. Humping on the bead surface observed on (a) AISI304 and (b) Fe360B when operating with Q = 40 Nl min−1 and D = 3 mm.
(This figure is in colour only in the electronic version)
Table 3. Results of the measurements of the weld cross-section profiles. BW = bead width; PD = penetration depth; MA = melted area,�P = Paxis − PBW/2.
NSD [mm] D [mm] Q [Nl min−1] BW [mm] PD [mm] MA [mm2] �P [Pa]
AISI 3043 3 30 1.41 2.07 0.85 2003 3 20 1.49 2.35 1.45 1603 3 10 1.60 2.15 1.35 503 4 40 1.53 2.33 1.47 703 4 20 1.56 2.29 1.37 303 4 10 1.56 2.26 1.37 06 3 30 1.26 2.20 1.39 2606 3 20 1.50 2.37 1.48 2106 3 10 1.52 2.32 1.44 906 4 40 1.56 2.41 1.53 1306 4 20 1.53 2.24 1.37 306 4 10 1.54 2.32 1.39 0
10 3 30 1.17 2.04 1.22 47010 3 20 1.63 2.30 1.49 35010 3 10 1.55 2.29 1.45 11010 4 40 1.50 2.34 1.48 19010 4 20 1.54 2.29 1.43 3010 4 10 1.54 2.37 1.50 0
Fe360B3 3 30 1.41 1.81 1.05 2003 3 20 1.51 1.95 1.19 1603 3 10 1.54 1.95 1.23 1103 4 40 1.67 1.98 1.33 703 4 20 1.52 1.99 1.28 303 4 10 1.52 2.00 1.27 06 3 30 1.21 2.01 1.23 5206 3 20 1.58 2.07 1.23 2006 3 10 1.53 1.99 1.24 906 4 40 1.61 2.24 1.50 1306 4 20 1.51 1.93 1.24 306 4 10 1.55 1.96 1.30 0
10 3 30 1.37 1.97 1.15 65010 3 20 1.50 2.02 1.19 34010 3 10 1.51 2.02 1.28 11010 4 40 1.50 2.10 1.32 19010 4 20 1.54 1.82 1.14 3010 4 10 1.59 1.92 1.28 0
particular experimental configuration this pressure distributionis considered the best compromise allowing an effective plasmasuppression and an efficient laser coupling to the material.Although several approximations have been assumed, thismathematical model has been demonstrated to be valuable
in describing the complex interactions of the shielding gaswith the laser–metal interaction area during a laser weldingprocess, as confirmed by the experimental results, givingqualitative information to build up an optimal set of weldingparameters.
573
A Ancona et al
Figure 15. Comparison of the cross-sections of the welds obtained on AISI 304 with D = 3 mm, NSD = 6 mm and, respectively,(a) Q = 10 Nl min−1, (b) Q = 30 Nl min−1.
Acknowledgments
This research was supported by MIUR (Ministerodell’Istruzione, dell’Universita e della Ricerca, Italy), underprojects DD1105 and Cofinlab2000 and by CNR-INFM, underPONTE-project LEGOLAS. G Gonnella acknowledges sup-port by MIUR-PRIN 2004. The authors would like toacknowledge Pietro Paolo Calabrese for technical support.
References
[1] Beck M, Berger P and Hugel H 1995 J. Phys. D: Appl. Phys.28 2430
[2] Glowacki M H 1995 J. Phys. D: Appl. Phys. 28 2051[3] Semak V V, Steele R J, Fuerschbach P W and Damkroger B K
2000 J. Phys. D: Appl. Phys. 33 1179
[4] Leidinger D, Penz A and Schuocker D 1995 Infrared Phys.Technol. 36 251
[5] Duan J, Man H C and Yue T M 2001 J. Phys. D: Appl. Phys.34 2135
[6] Duan J, Man H C and Yue T M 2001 J. Phys. D: Appl. Phys.34 2143
[7] Man H C, Duan J and Yue T M 1999 J. Phys. D: Appl. Phys.32 1469
[8] Chen S-L 1999 J. Mater. Process. Technol. 88 57[9] Grevey D, Sallamand P, Cicala E, and Ignat S 2005 Opt. Laser
Technol. 37 647[10] Herrmann J 1997 European Patent EP0600250B1[11] Fabbro R A, Coste F, Sabatier L and Billon J P 2004 US Patent
US2004/0099643 A1[12] Fluent Inc. 2003 Fluent 6.1 Documentation, User’s
Guide[13] Shih T-H, Liou W W, Shabbir A,Yang Z, and Zhu J 1995
Comput. Fluids 24 227
574
Copyright © 2022 FDOKUMEN