An aggregate air quality index considering combined effects of pollutants
76
An aggregate air quality index considering combined effects of pollutants Antonella Plaia , Mariantonietta Ruggieri, Anna Lisa Bondì Department of Statistical and Mathematical Sciences "S. Vianelli" University of Palermo A. Plaia, M. Ruggieri, A. L. Bondì (University of Palermo) An aggregate air quality index ... July, 5-9 2009 1 / 29
Transcript of An aggregate air quality index considering combined effects of pollutants

An aggregate air quality index considering combinedeffects of pollutants
Antonella Plaia, Mariantonietta Ruggieri, Anna Lisa Bondì
Department of Statistical and Mathematical Sciences "S. Vianelli"University of Palermo
A. Plaia, M. Ruggieri, A. L. Bondì (University of Palermo) An aggregate air quality index ... July, 5-9 2009 1 / 29
Outline
1 Air quality indices
2 Standardization and aggregation steps
3 Aggregation by pollutants
4 Simulation plan
5 An index of heterogeneity
6 Final remarks
7 Future research
8 Further Reading
A. Plaia, M. Ruggieri, A. L. Bondì (University of Palermo) An aggregate air quality index ... July, 5-9 2009 2 / 29
Air quality indices
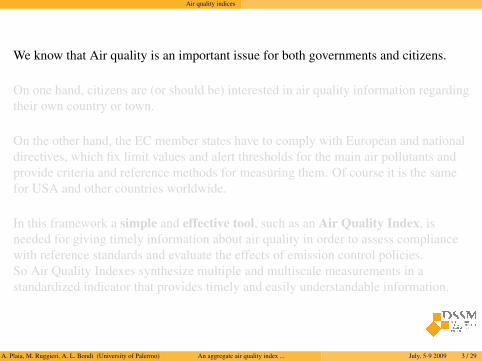
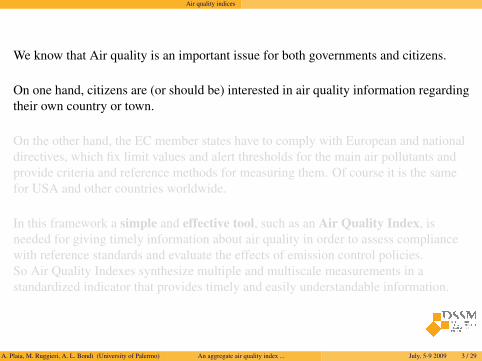
We know that Air quality is an important issue for both governments and citizens.
On one hand, citizens are (or should be) interested in air quality information regardingtheir own country or town.
On the other hand, the EC member states have to comply with European and nationaldirectives, which fix limit values and alert thresholds for the main air pollutants andprovide criteria and reference methods for measuring them. Of course it is the samefor USA and other countries worldwide.
In this framework a simple and effective tool, such as an Air Quality Index, isneeded for giving timely information about air quality in order to assess compliancewith reference standards and evaluate the effects of emission control policies.So Air Quality Indexes synthesize multiple and multiscale measurements in astandardized indicator that provides timely and easily understandable information.
A. Plaia, M. Ruggieri, A. L. Bondì (University of Palermo) An aggregate air quality index ... July, 5-9 2009 3 / 29
Air quality indices
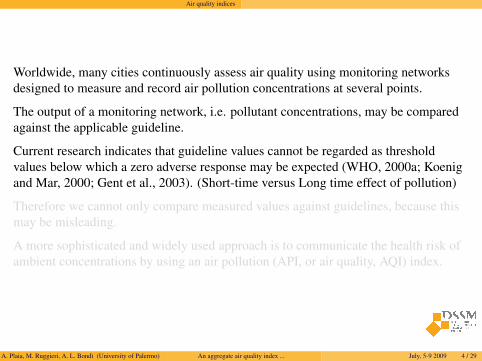
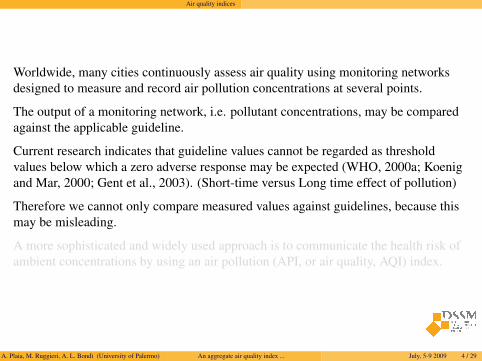
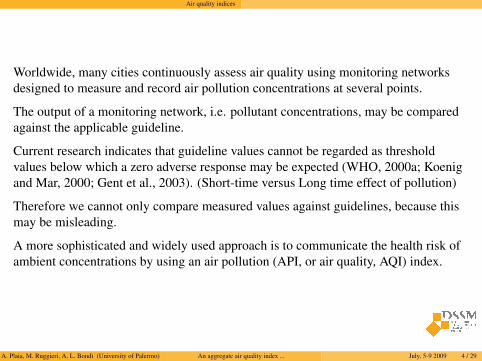
Worldwide, many cities continuously assess air quality using monitoring networksdesigned to measure and record air pollution concentrations at several points.
The output of a monitoring network, i.e. pollutant concentrations, may be comparedagainst the applicable guideline.
Current research indicates that guideline values cannot be regarded as thresholdvalues below which a zero adverse response may be expected (WHO, 2000a; Koenigand Mar, 2000; Gent et al., 2003). (Short-time versus Long time effect of pollution)
Therefore we cannot only compare measured values against guidelines, because thismay be misleading.
A more sophisticated and widely used approach is to communicate the health risk ofambient concentrations by using an air pollution (API, or air quality, AQI) index.
A. Plaia, M. Ruggieri, A. L. Bondì (University of Palermo) An aggregate air quality index ... July, 5-9 2009 4 / 29
Air quality indices
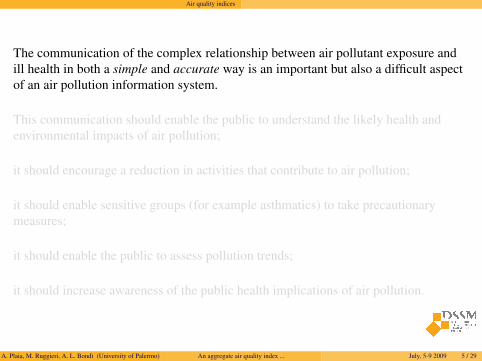
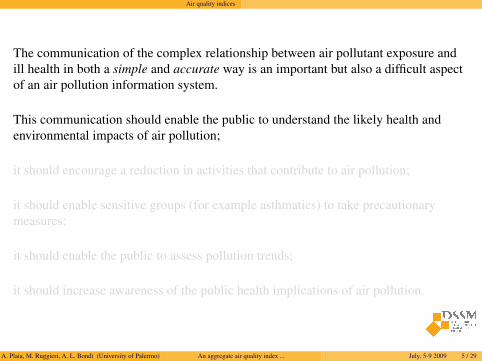
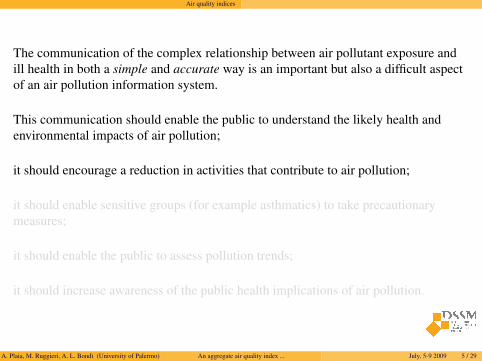
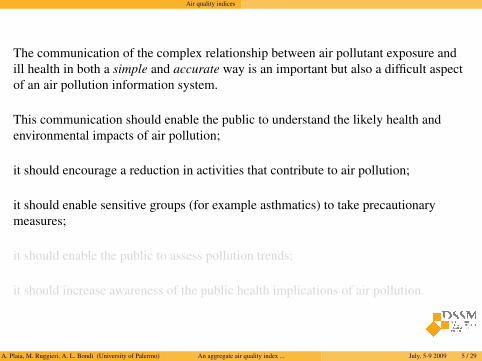
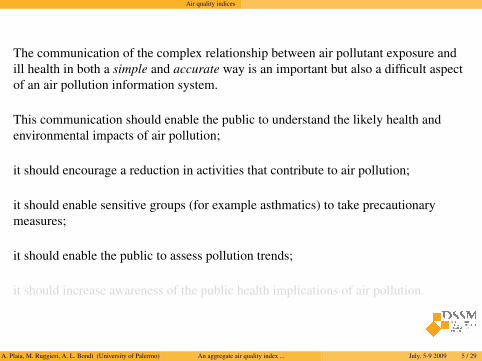
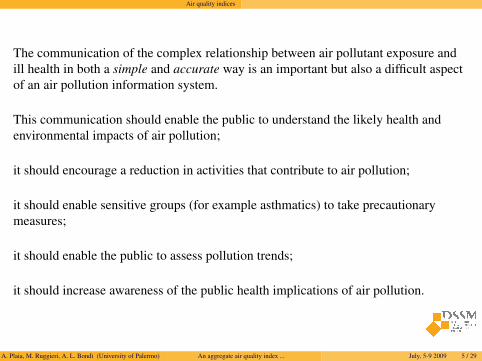
The communication of the complex relationship between air pollutant exposure andill health in both a simple and accurate way is an important but also a difficult aspectof an air pollution information system.
This communication should enable the public to understand the likely health andenvironmental impacts of air pollution;
it should encourage a reduction in activities that contribute to air pollution;
it should enable sensitive groups (for example asthmatics) to take precautionarymeasures;
it should enable the public to assess pollution trends;
it should increase awareness of the public health implications of air pollution.
A. Plaia, M. Ruggieri, A. L. Bondì (University of Palermo) An aggregate air quality index ... July, 5-9 2009 5 / 29
Air quality indices
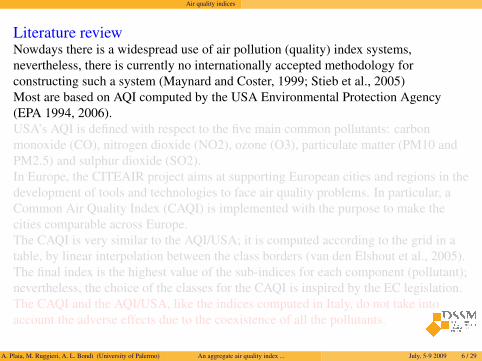
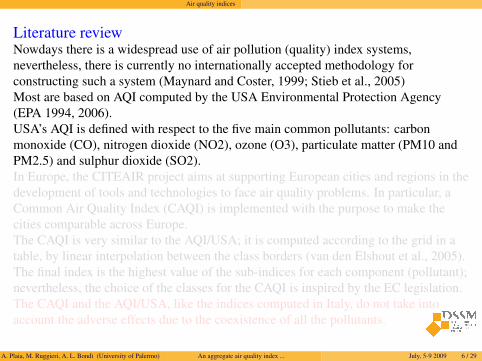
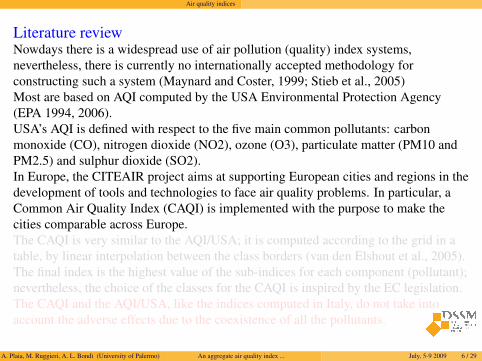
Literature reviewNowdays there is a widespread use of air pollution (quality) index systems,nevertheless, there is currently no internationally accepted methodology forconstructing such a system (Maynard and Coster, 1999; Stieb et al., 2005)Most are based on AQI computed by the USA Environmental Protection Agency(EPA 1994, 2006).USA’s AQI is defined with respect to the five main common pollutants: carbonmonoxide (CO), nitrogen dioxide (NO2), ozone (O3), particulate matter (PM10 andPM2.5) and sulphur dioxide (SO2).In Europe, the CITEAIR project aims at supporting European cities and regions in thedevelopment of tools and technologies to face air quality problems. In particular, aCommon Air Quality Index (CAQI) is implemented with the purpose to make thecities comparable across Europe.The CAQI is very similar to the AQI/USA; it is computed according to the grid in atable, by linear interpolation between the class borders (van den Elshout et al., 2005).The final index is the highest value of the sub-indices for each component (pollutant);nevertheless, the choice of the classes for the CAQI is inspired by the EC legislation.The CAQI and the AQI/USA, like the indices computed in Italy, do not take intoaccount the adverse effects due to the coexistence of all the pollutants.
A. Plaia, M. Ruggieri, A. L. Bondì (University of Palermo) An aggregate air quality index ... July, 5-9 2009 6 / 29
Air quality indices
A good air quality index
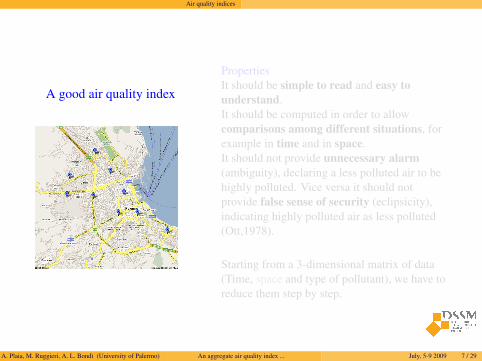
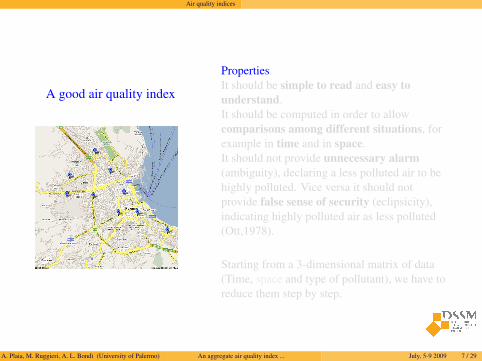
PropertiesIt should be simple to read and easy tounderstand.It should be computed in order to allowcomparisons among different situations, forexample in time and in space.It should not provide unnecessary alarm(ambiguity), declaring a less polluted air to behighly polluted. Vice versa it should notprovide false sense of security (eclipsicity),indicating highly polluted air as less polluted(Ott,1978).
Starting from a 3-dimensional matrix of data(Time, space and type of pollutant), we have toreduce them step by step.
A. Plaia, M. Ruggieri, A. L. Bondì (University of Palermo) An aggregate air quality index ... July, 5-9 2009 7 / 29
Air quality indices
A good air quality index
PropertiesIt should be simple to read and easy tounderstand.It should be computed in order to allowcomparisons among different situations, forexample in time and in space.It should not provide unnecessary alarm(ambiguity), declaring a less polluted air to behighly polluted. Vice versa it should notprovide false sense of security (eclipsicity),indicating highly polluted air as less polluted(Ott,1978).
Starting from a 3-dimensional matrix of data(Time, space and type of pollutant), we have toreduce them step by step.
A. Plaia, M. Ruggieri, A. L. Bondì (University of Palermo) An aggregate air quality index ... July, 5-9 2009 7 / 29
Standardization and aggregation steps
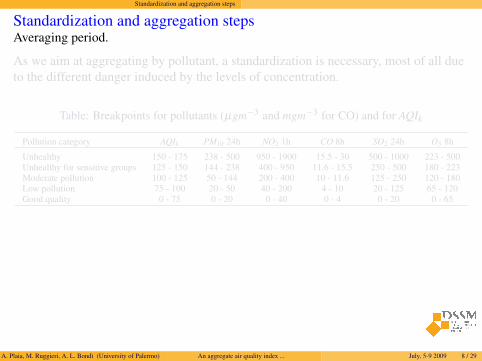
Standardization and aggregation stepsAveraging period.
As we aim at aggregating by pollutant, a standardization is necessary, most of all dueto the different danger induced by the levels of concentration.
Table: Breakpoints for pollutants (µgm−3 and mgm−3 for CO) and for AQIk
Pollution category AQIk PM10 24h NO2 1h CO 8h SO2 24h O3 8h
Unhealthy 150 - 175 238 - 500 950 - 1900 15.5 - 30 500 - 1000 223 - 500Unhealthy for sensitive groups 125 - 150 144 - 238 400 - 950 11.6 - 15.5 250 - 500 180 - 223Moderate pollution 100 - 125 50 - 144 200 - 400 10 - 11.6 125 - 250 120 - 180Low pollution 75 - 100 20 - 50 40 - 200 4 - 10 20 - 125 65 - 120Good quality 0 - 75 0 - 20 0 - 40 0 - 4 0 - 20 0 - 65
A. Plaia, M. Ruggieri, A. L. Bondì (University of Palermo) An aggregate air quality index ... July, 5-9 2009 8 / 29
Standardization and aggregation steps
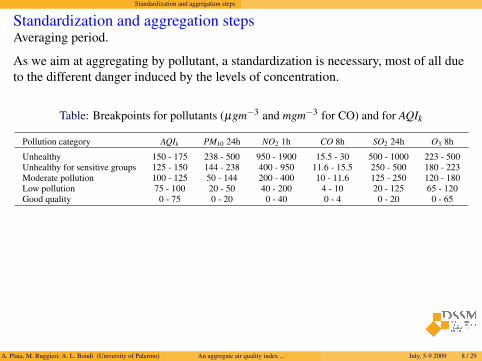
Standardization and aggregation stepsAveraging period.
As we aim at aggregating by pollutant, a standardization is necessary, most of all dueto the different danger induced by the levels of concentration.
Table: Breakpoints for pollutants (µgm−3 and mgm−3 for CO) and for AQIk
Pollution category AQIk PM10 24h NO2 1h CO 8h SO2 24h O3 8h
Unhealthy 150 - 175 238 - 500 950 - 1900 15.5 - 30 500 - 1000 223 - 500Unhealthy for sensitive groups 125 - 150 144 - 238 400 - 950 11.6 - 15.5 250 - 500 180 - 223Moderate pollution 100 - 125 50 - 144 200 - 400 10 - 11.6 125 - 250 120 - 180Low pollution 75 - 100 20 - 50 40 - 200 4 - 10 20 - 125 65 - 120Good quality 0 - 75 0 - 20 0 - 40 0 - 4 0 - 20 0 - 65
A. Plaia, M. Ruggieri, A. L. Bondì (University of Palermo) An aggregate air quality index ... July, 5-9 2009 8 / 29
Standardization and aggregation steps
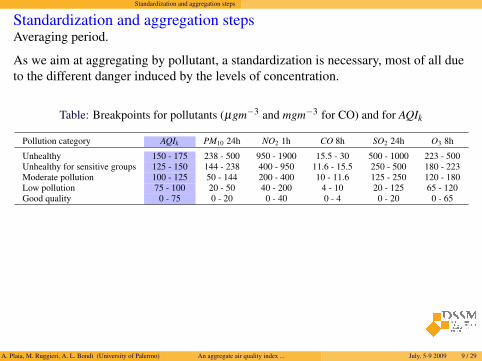
Standardization and aggregation stepsAveraging period.
As we aim at aggregating by pollutant, a standardization is necessary, most of all dueto the different danger induced by the levels of concentration.
Table: Breakpoints for pollutants (µgm−3 and mgm−3 for CO) and for AQIk
Pollution category AQIk PM10 24h NO2 1h CO 8h SO2 24h O3 8h
Unhealthy 150 - 175 238 - 500 950 - 1900 15.5 - 30 500 - 1000 223 - 500Unhealthy for sensitive groups 125 - 150 144 - 238 400 - 950 11.6 - 15.5 250 - 500 180 - 223Moderate pollution 100 - 125 50 - 144 200 - 400 10 - 11.6 125 - 250 120 - 180Low pollution 75 - 100 20 - 50 40 - 200 4 - 10 20 - 125 65 - 120Good quality 0 - 75 0 - 20 0 - 40 0 - 4 0 - 20 0 - 65
A. Plaia, M. Ruggieri, A. L. Bondì (University of Palermo) An aggregate air quality index ... July, 5-9 2009 9 / 29
Standardization and aggregation steps
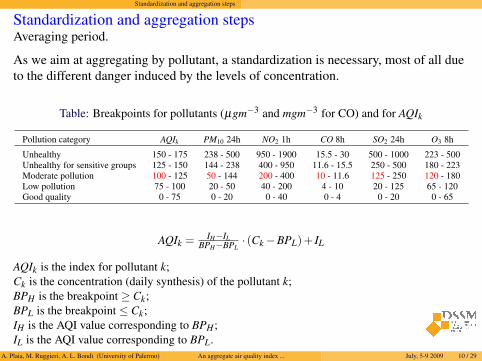
Standardization and aggregation stepsAveraging period.
As we aim at aggregating by pollutant, a standardization is necessary, most of all dueto the different danger induced by the levels of concentration.
Table: Breakpoints for pollutants (µgm−3 and mgm−3 for CO) and for AQIk
Pollution category AQIk PM10 24h NO2 1h CO 8h SO2 24h O3 8h
Unhealthy 150 - 175 238 - 500 950 - 1900 15.5 - 30 500 - 1000 223 - 500Unhealthy for sensitive groups 125 - 150 144 - 238 400 - 950 11.6 - 15.5 250 - 500 180 - 223Moderate pollution 100 - 125 50 - 144 200 - 400 10 - 11.6 125 - 250 120 - 180Low pollution 75 - 100 20 - 50 40 - 200 4 - 10 20 - 125 65 - 120Good quality 0 - 75 0 - 20 0 - 40 0 - 4 0 - 20 0 - 65
AQIk = IH−ILBPH−BPL
· (Ck−BPL)+ IL
AQIk is the index for pollutant k;Ck is the concentration (daily synthesis) of the pollutant k;BPH is the breakpoint ≥ Ck;BPL is the breakpoint ≤ Ck;IH is the AQI value corresponding to BPH ;IL is the AQI value corresponding to BPL.
A. Plaia, M. Ruggieri, A. L. Bondì (University of Palermo) An aggregate air quality index ... July, 5-9 2009 10 / 29
Aggregation by pollutants
Aggregation by pollutants
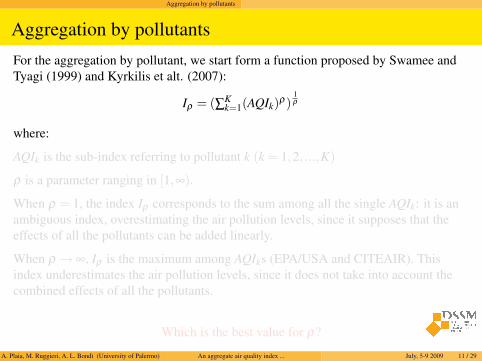
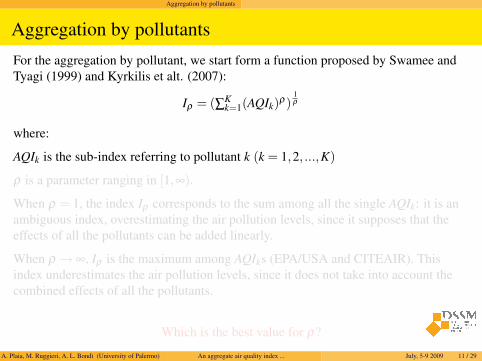
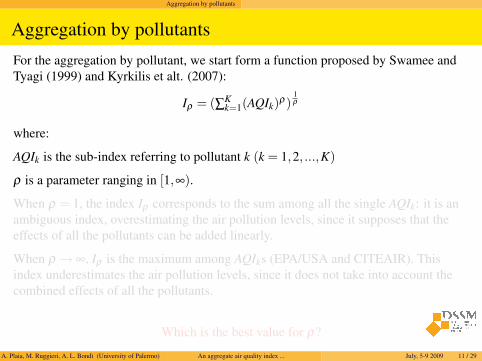
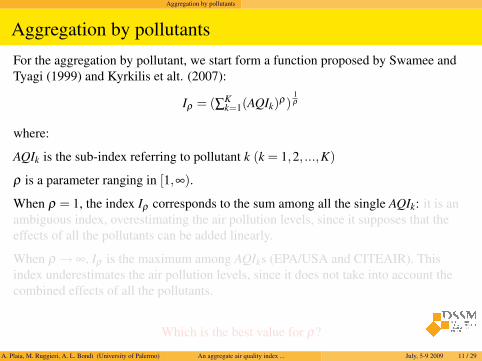
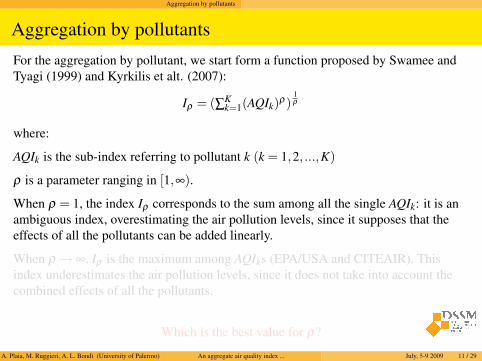
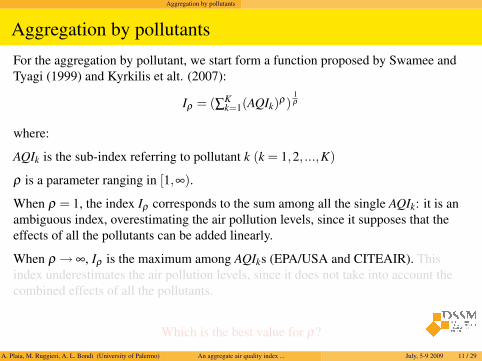
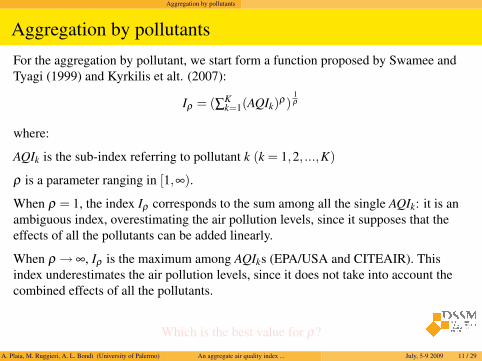
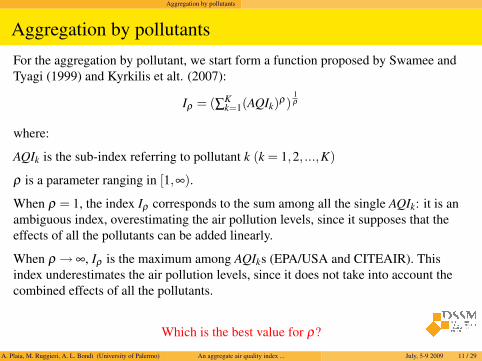
For the aggregation by pollutant, we start form a function proposed by Swamee andTyagi (1999) and Kyrkilis et alt. (2007):
Iρ = (∑Kk=1(AQIk)ρ)
1ρ
where:
AQIk is the sub-index referring to pollutant k (k = 1,2, ...,K)
ρ is a parameter ranging in [1,∞).
When ρ = 1, the index Iρ corresponds to the sum among all the single AQIk: it is anambiguous index, overestimating the air pollution levels, since it supposes that theeffects of all the pollutants can be added linearly.
When ρ → ∞, Iρ is the maximum among AQIks (EPA/USA and CITEAIR). Thisindex underestimates the air pollution levels, since it does not take into account thecombined effects of all the pollutants.
Which is the best value for ρ?
A. Plaia, M. Ruggieri, A. L. Bondì (University of Palermo) An aggregate air quality index ... July, 5-9 2009 11 / 29
Aggregation by pollutants
Aggregation by pollutants
For the aggregation by pollutant, we start form a function proposed by Swamee andTyagi (1999) and Kyrkilis et alt. (2007):
Iρ = (∑Kk=1(AQIk)ρ)
1ρ
where:
AQIk is the sub-index referring to pollutant k (k = 1,2, ...,K)
ρ is a parameter ranging in [1,∞).
When ρ = 1, the index Iρ corresponds to the sum among all the single AQIk: it is anambiguous index, overestimating the air pollution levels, since it supposes that theeffects of all the pollutants can be added linearly.
When ρ → ∞, Iρ is the maximum among AQIks (EPA/USA and CITEAIR). Thisindex underestimates the air pollution levels, since it does not take into account thecombined effects of all the pollutants.
Which is the best value for ρ?
A. Plaia, M. Ruggieri, A. L. Bondì (University of Palermo) An aggregate air quality index ... July, 5-9 2009 11 / 29
Simulation plan
Simulation plan
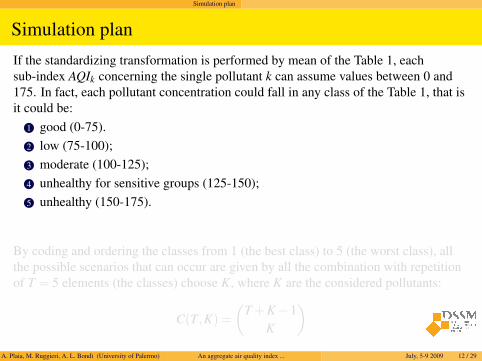
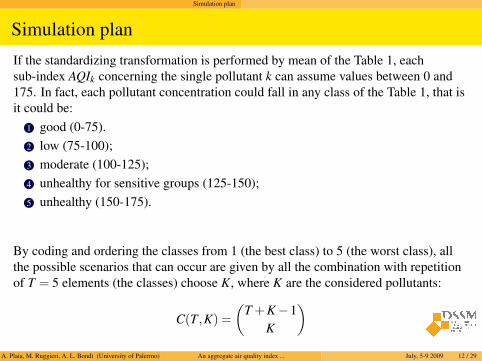
If the standardizing transformation is performed by mean of the Table 1, eachsub-index AQIk concerning the single pollutant k can assume values between 0 and175. In fact, each pollutant concentration could fall in any class of the Table 1, that isit could be:
1 good (0-75).2 low (75-100);3 moderate (100-125);4 unhealthy for sensitive groups (125-150);5 unhealthy (150-175).
By coding and ordering the classes from 1 (the best class) to 5 (the worst class), allthe possible scenarios that can occur are given by all the combination with repetitionof T = 5 elements (the classes) choose K, where K are the considered pollutants:
C(T,K) =(
T +K−1K
)A. Plaia, M. Ruggieri, A. L. Bondì (University of Palermo) An aggregate air quality index ... July, 5-9 2009 12 / 29
Simulation plan
Simulation plan
If the standardizing transformation is performed by mean of the Table 1, eachsub-index AQIk concerning the single pollutant k can assume values between 0 and175. In fact, each pollutant concentration could fall in any class of the Table 1, that isit could be:
1 good (0-75).2 low (75-100);3 moderate (100-125);4 unhealthy for sensitive groups (125-150);5 unhealthy (150-175).
By coding and ordering the classes from 1 (the best class) to 5 (the worst class), allthe possible scenarios that can occur are given by all the combination with repetitionof T = 5 elements (the classes) choose K, where K are the considered pollutants:
C(T,K) =(
T +K−1K
)A. Plaia, M. Ruggieri, A. L. Bondì (University of Palermo) An aggregate air quality index ... July, 5-9 2009 12 / 29
Simulation plan
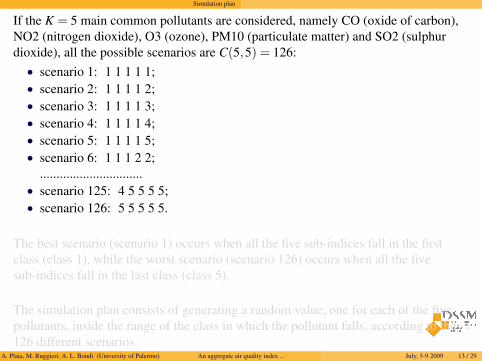
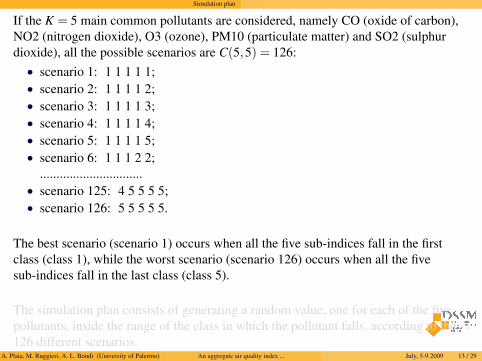
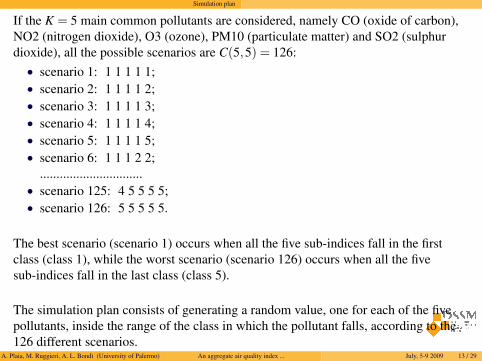
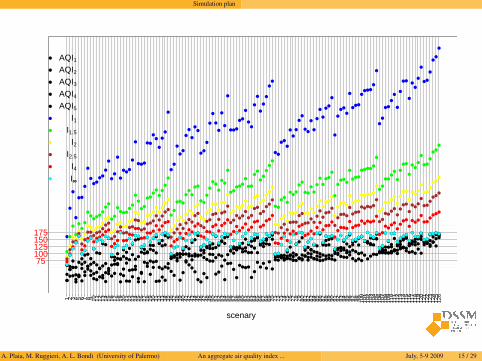
If the K = 5 main common pollutants are considered, namely CO (oxide of carbon),NO2 (nitrogen dioxide), O3 (ozone), PM10 (particulate matter) and SO2 (sulphurdioxide), all the possible scenarios are C(5,5) = 126:
• scenario 1: 1 1 1 1 1;• scenario 2: 1 1 1 1 2;• scenario 3: 1 1 1 1 3;• scenario 4: 1 1 1 1 4;• scenario 5: 1 1 1 1 5;• scenario 6: 1 1 1 2 2;
...............................• scenario 125: 4 5 5 5 5;• scenario 126: 5 5 5 5 5.
The best scenario (scenario 1) occurs when all the five sub-indices fall in the firstclass (class 1), while the worst scenario (scenario 126) occurs when all the fivesub-indices fall in the last class (class 5).
The simulation plan consists of generating a random value, one for each of the fivepollutants, inside the range of the class in which the pollutant falls, according to the126 different scenarios.
A. Plaia, M. Ruggieri, A. L. Bondì (University of Palermo) An aggregate air quality index ... July, 5-9 2009 13 / 29
Simulation plan
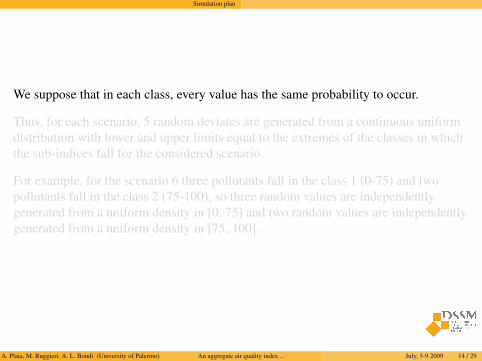
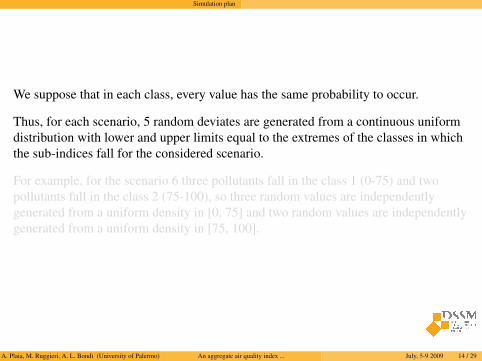
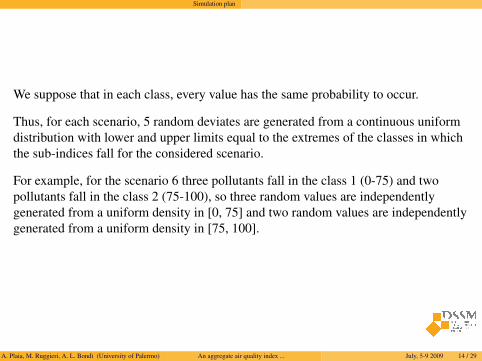
We suppose that in each class, every value has the same probability to occur.
Thus, for each scenario, 5 random deviates are generated from a continuous uniformdistribution with lower and upper limits equal to the extremes of the classes in whichthe sub-indices fall for the considered scenario.
For example, for the scenario 6 three pollutants fall in the class 1 (0-75) and twopollutants fall in the class 2 (75-100), so three random values are independentlygenerated from a uniform density in [0, 75] and two random values are independentlygenerated from a uniform density in [75, 100].
A. Plaia, M. Ruggieri, A. L. Bondì (University of Palermo) An aggregate air quality index ... July, 5-9 2009 14 / 29
Simulation plan
scenary
75100125150175
●●
●
●
●
●
●
●●
●
●●●
●
●
●
●●
●
●
●●●
●
●
●
●
●
●
●
●
●●
●
●
●●
●
●
●
●●
●●
●●
●●
●●
●●
●
●
●●
●
●
●●●●
●
●
●●
●●
●
●
●●●●●
●●●
●●●●●●●
●●●●
●●
●●●●
●●
●●●
●●
●●●
●
●●
●
●●
●
●●●●●●
●●
●●●
●●
●
●
●
●
●●
●
●●
●●
●
●●
●
●
●
●
●
●
●
●
●●●
●
●
●●
●
●
●
●●
●●
●●●●●
●●●●●●
●●
●●●
●●●
●
●
●●●
●●●●●
●
●●●●
●
●●●●●●●
●●
●●●
●●
●●●●
●●
●●●●●●
●●●●
●●●●
●
●●●
●●●●●●●
●●●●●●●●●
●●
●
●
●
●
●●
●
●●
●●
●
●
●●
●●●
●●●●
●●
●
●●
●●●
●
●●
●
●
●●●●●●●
●●●
●●
●●●●●
●●
●
●●●●●●●
●●●
●●
●●●
●●●●●●
●
●●●
●●●●●●
●●●
●
●●●●●●
●●●
●●●
●
●●
●
●
●●
●●
●●●●
●●●
●●●
●●
●●●
●●
●●
●
●●●●
●●●
●●
●
●
●●●
●●
●●
●●
●●●
●●
●
●●
●●
●●●●
●●
●
●●
●
●●
●●●
●
●●
●●
●●●
●●●
●●
●●
●●●
●●
●●●●
●●
●
●●
●
●●
●
●●
●
●●
●●
●●
●
●●
●
●●
●●●●
●●●
●●
●
●●
●
●●
●●
●●●●
●
●●
●●●
●
●
●
●
●
●
●
●
●●
●
●●●
●●
●
●●
●
●●
●●
●●
●●
●
●
●●
●
●●●
●
●●
●
●
●
●
●
●●
●●
●
●
●●
●
●●●
●
●
●
●
●●
●
●●●
●●
●●
●
●●
●
●
●
●
●
●
●●
●
●●
●
●●
●
●●●
●
●●
●●
●
●●●●
●
●
●●
●
●●
●
●
●
●
●
●●●
●
●●●
●
●●
●●●●●
●
●
●
●●
●
●
●
●●●●
●
●
●●
●
●
●●●
●
●
●●●
●●
●●
●
●
●
●
●
●
●
●●
●
●
●
●●
●●
●
●
●
●
●
●
●
●
●●●
●●
●
●●
●
●
●
●
●
●●
●●
●●
●
●
●
●
●●
●●
●
●
●
●
●
●●
●
●
●
●●
●
●
●●●
●●●●
●
●
●
●
●●
●
●
●
●
●●
●
●●
●
●
●●
●
●●
●
●
●
●
●
●●
●
●●
●●●
●●
●
●●
●●●●
●●
●
●
●●
●●●
●
●
●
●
●
●●
●●●
●●
●
●●
●●
●
●
●●
●
●●
●
●●●●●
●
●●
●●
●●
●
●●
●●
●●
●
●●
●
●●
●●
●
●
●
●
●
●●
●
●
●●●
●
●
●●●
●●●●●
●
●●
●●●
●
●
●
●●
●
●●
●
●
●●
●
●●
●
●
●
●●
●
●●
●●●
●●●
●●
●●
●●●●
●●
●●
●●
●●●
●●
●●
●
●●
●●
●
●●
●
●●
●●
●●
●●
●
●●
●
●●
●●●
●
●●
●●
●●
●●
●
●●
●●
●
●●●
●●
●●●
●
●
●
●●●
●
●
●●●
●
●
●●●
●●●●●
●
●●
●●●
●
●
●●●
●
●●
●
●
●●●
●●●
●
●
●●
●
●●
●●●
●●●
●●
●●
●●
●●
●●
●●
●●●●
●
●●
●●
●
●●
●●
●
●●
●
●●
●●
●●
●●
●
●●
●
●●
●●
●●
●●
●●
●●
●●
●
●●
●●
●
●●●
●●
●●●
●
●
●
●●●
●
●
●●●●
●
●●●●●●●●
●
●●
●●●
●
●
●●●
●
●●●
●
●●●
●●●
●
●
●●
●
●●
●●
●●●
●●●
●●
●
●
●●
●●
●●
●●●●●
●●
●●●
●●
●
●
●
●●
●
●●
●●
●●
●●
●
●●
●
●●
●●
●●
●●
●●
●●●●
●
●●
●
●
●
●●
●
●●
●●●
●
●●
●●●
●
●
●●●●
●
●●●●
●●●●
●
●●
●●●
●
●●
●●
●
●●●
●
●●●
●●●
●
●
●
●
●
●●
●●
●
●●●
●●
●
●●
●
●●
●●
●●
●●
●●
●●
●
●●●
●
●●
●
●
●
●
●
●●
●●
●●
●●
●
●●●
●
●
●
●
●●
●●
●●
●●
●●●
●●
●
●
●
●
●
●
●●
●
●●
●
●●
●
●●●
●
●●
●●
●
●●●●●
●●●
●
●●
●
●
●●
●●●●
●
●●●
●
●●●●●●
1 2 3 4 5 6 7 8 9 10 11 12 13 14 15 16 17 18 19 20 21 22 23 24 25 26 27 28 29 30 31 32 33 34 35 36 37 38 39 40 41 42 43 44 45 46 47 48 49 50 51 52 53 54 55 56 57 58 59 60 61 62 63 64 65 66 67 68 69 70 71 72 73 74 75 76 77 78 79 80 81 82 83 84 85 86 87 88 89 90 91 92 93 94 95 96 97 98 99 100
101
102
103
104
105
106
107
108
109
110
111
112
113
114
115
116
117
118
119
120
121
122
123
124
125
126
● AQI1● AQI2● AQI3● AQI4● AQI5● I1● I1.5
● I2● I2.5
● I4● I∞∞
A. Plaia, M. Ruggieri, A. L. Bondì (University of Palermo) An aggregate air quality index ... July, 5-9 2009 15 / 29
Simulation plan
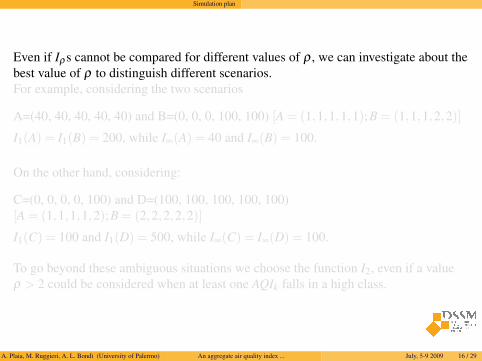
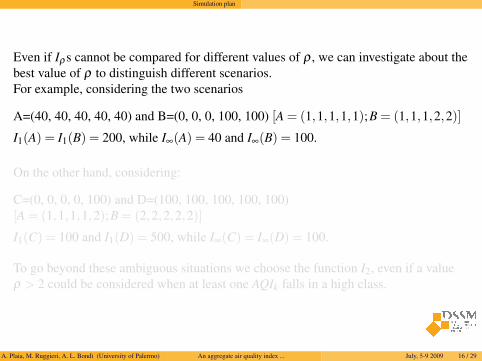
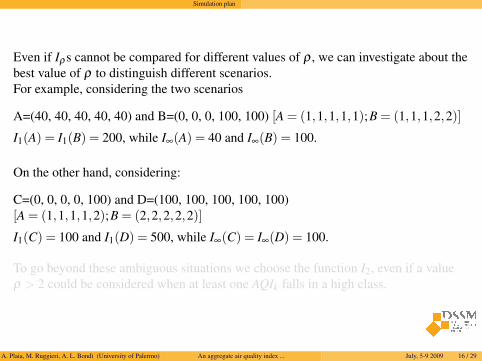
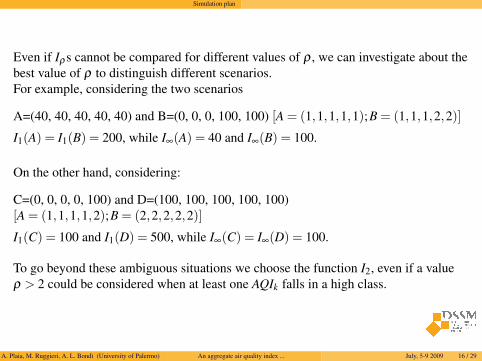
Even if Iρ s cannot be compared for different values of ρ , we can investigate about thebest value of ρ to distinguish different scenarios.For example, considering the two scenarios
A=(40, 40, 40, 40, 40) and B=(0, 0, 0, 100, 100) [A = (1,1,1,1,1);B = (1,1,1,2,2)]
I1(A) = I1(B) = 200, while I∞(A) = 40 and I∞(B) = 100.
On the other hand, considering:
C=(0, 0, 0, 0, 100) and D=(100, 100, 100, 100, 100)[A = (1,1,1,1,2);B = (2,2,2,2,2)]
I1(C) = 100 and I1(D) = 500, while I∞(C) = I∞(D) = 100.
To go beyond these ambiguous situations we choose the function I2, even if a valueρ > 2 could be considered when at least one AQIk falls in a high class.
A. Plaia, M. Ruggieri, A. L. Bondì (University of Palermo) An aggregate air quality index ... July, 5-9 2009 16 / 29
Simulation plan
Even if Iρ s cannot be compared for different values of ρ , we can investigate about thebest value of ρ to distinguish different scenarios.For example, considering the two scenarios
A=(40, 40, 40, 40, 40) and B=(0, 0, 0, 100, 100) [A = (1,1,1,1,1);B = (1,1,1,2,2)]
I1(A) = I1(B) = 200, while I∞(A) = 40 and I∞(B) = 100.
On the other hand, considering:
C=(0, 0, 0, 0, 100) and D=(100, 100, 100, 100, 100)[A = (1,1,1,1,2);B = (2,2,2,2,2)]
I1(C) = 100 and I1(D) = 500, while I∞(C) = I∞(D) = 100.
To go beyond these ambiguous situations we choose the function I2, even if a valueρ > 2 could be considered when at least one AQIk falls in a high class.
A. Plaia, M. Ruggieri, A. L. Bondì (University of Palermo) An aggregate air quality index ... July, 5-9 2009 16 / 29
An index of heterogeneity
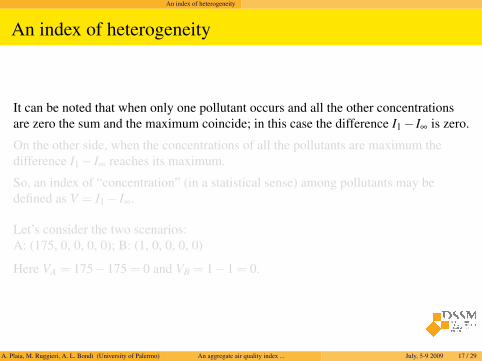
An index of heterogeneity
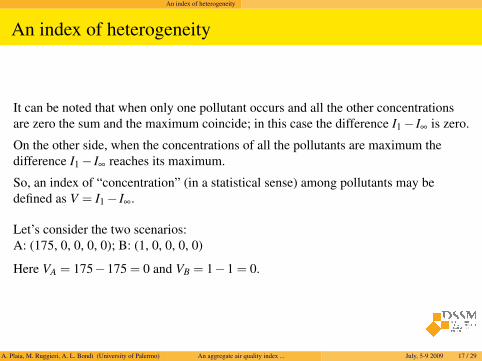
It can be noted that when only one pollutant occurs and all the other concentrationsare zero the sum and the maximum coincide; in this case the difference I1− I∞ is zero.
On the other side, when the concentrations of all the pollutants are maximum thedifference I1− I∞ reaches its maximum.
So, an index of “concentration” (in a statistical sense) among pollutants may bedefined as V = I1− I∞.
Let’s consider the two scenarios:A: (175, 0, 0, 0, 0); B: (1, 0, 0, 0, 0)
Here VA = 175−175 = 0 and VB = 1−1 = 0.
A. Plaia, M. Ruggieri, A. L. Bondì (University of Palermo) An aggregate air quality index ... July, 5-9 2009 17 / 29
An index of heterogeneity
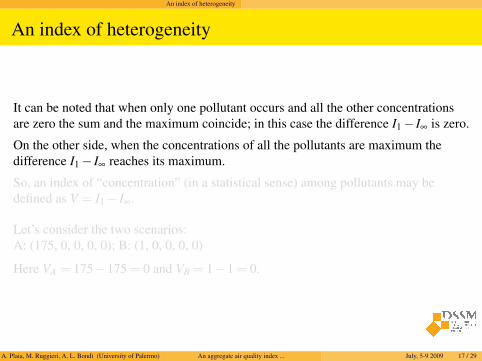
An index of heterogeneity
It can be noted that when only one pollutant occurs and all the other concentrationsare zero the sum and the maximum coincide; in this case the difference I1− I∞ is zero.
On the other side, when the concentrations of all the pollutants are maximum thedifference I1− I∞ reaches its maximum.
So, an index of “concentration” (in a statistical sense) among pollutants may bedefined as V = I1− I∞.
Let’s consider the two scenarios:A: (175, 0, 0, 0, 0); B: (1, 0, 0, 0, 0)
Here VA = 175−175 = 0 and VB = 1−1 = 0.
A. Plaia, M. Ruggieri, A. L. Bondì (University of Palermo) An aggregate air quality index ... July, 5-9 2009 17 / 29
An index of heterogeneity
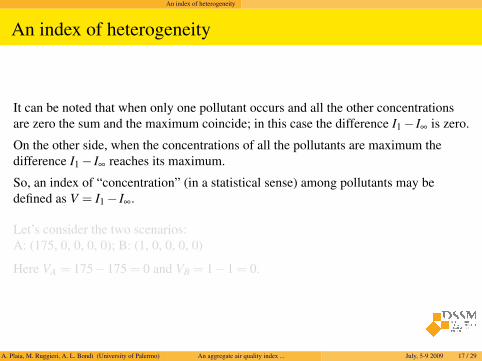
An index of heterogeneity
It can be noted that when only one pollutant occurs and all the other concentrationsare zero the sum and the maximum coincide; in this case the difference I1− I∞ is zero.
On the other side, when the concentrations of all the pollutants are maximum thedifference I1− I∞ reaches its maximum.
So, an index of “concentration” (in a statistical sense) among pollutants may bedefined as V = I1− I∞.
Let’s consider the two scenarios:A: (175, 0, 0, 0, 0); B: (1, 0, 0, 0, 0)
Here VA = 175−175 = 0 and VB = 1−1 = 0.
A. Plaia, M. Ruggieri, A. L. Bondì (University of Palermo) An aggregate air quality index ... July, 5-9 2009 17 / 29
An index of heterogeneity
An index of heterogeneity
It can be noted that when only one pollutant occurs and all the other concentrationsare zero the sum and the maximum coincide; in this case the difference I1− I∞ is zero.
On the other side, when the concentrations of all the pollutants are maximum thedifference I1− I∞ reaches its maximum.
So, an index of “concentration” (in a statistical sense) among pollutants may bedefined as V = I1− I∞.
Let’s consider the two scenarios:A: (175, 0, 0, 0, 0); B: (1, 0, 0, 0, 0)
Here VA = 175−175 = 0 and VB = 1−1 = 0.
A. Plaia, M. Ruggieri, A. L. Bondì (University of Palermo) An aggregate air quality index ... July, 5-9 2009 17 / 29
An index of heterogeneity
A possible solution is given by the difference:
VN =N I∞−N I1 (1)
where:
NIρ =Iρ
max(Iρ)100, (2)
with max(I1) = 875 and max(I∞) = 175.
Now VN(A) = 80 VN(B) = 0.46
VN is a measure of heterogeneity among pollutant concentration, and VN = 0 if andonly if there is no heterogeneity, that is when all the pollutants have the sameconcentration, while VN = Max if and only if one pollutant reaches its maximumvalue, while the other are null.
A. Plaia, M. Ruggieri, A. L. Bondì (University of Palermo) An aggregate air quality index ... July, 5-9 2009 18 / 29
An index of heterogeneity
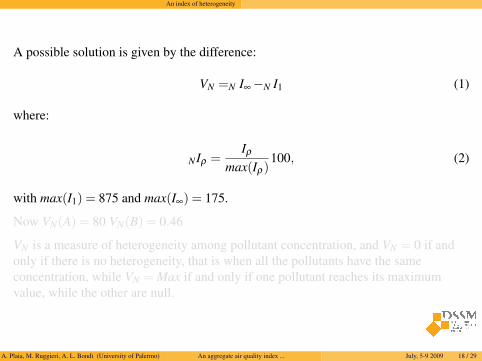
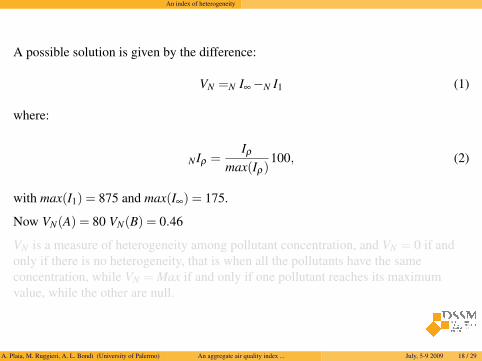
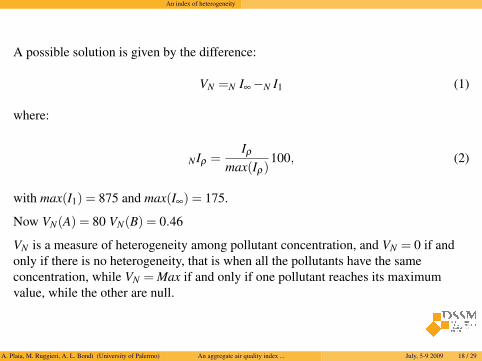
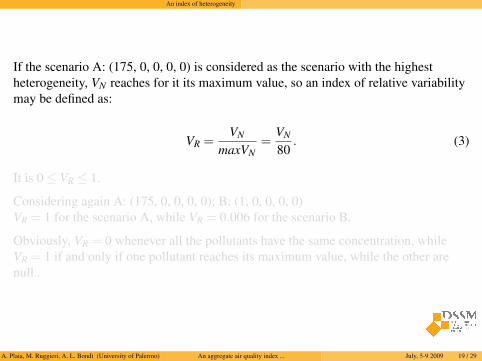
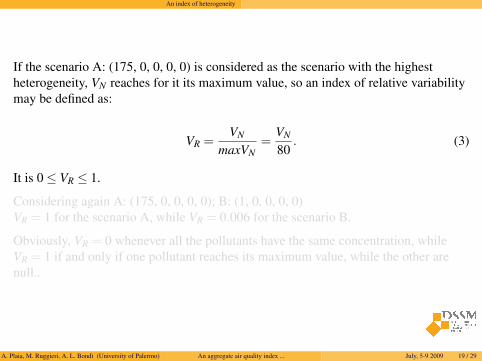
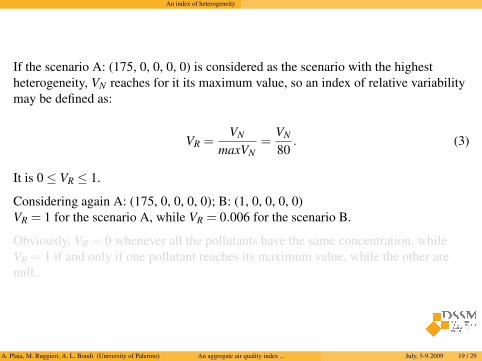
If the scenario A: (175, 0, 0, 0, 0) is considered as the scenario with the highestheterogeneity, VN reaches for it its maximum value, so an index of relative variabilitymay be defined as:
VR =VN
maxVN=
VN
80. (3)
It is 0≤ VR ≤ 1.
Considering again A: (175, 0, 0, 0, 0); B: (1, 0, 0, 0, 0)VR = 1 for the scenario A, while VR = 0.006 for the scenario B.
Obviously, VR = 0 whenever all the pollutants have the same concentration, whileVR = 1 if and only if one pollutant reaches its maximum value, while the other arenull..
A. Plaia, M. Ruggieri, A. L. Bondì (University of Palermo) An aggregate air quality index ... July, 5-9 2009 19 / 29
An index of heterogeneity
If the scenario A: (175, 0, 0, 0, 0) is considered as the scenario with the highestheterogeneity, VN reaches for it its maximum value, so an index of relative variabilitymay be defined as:
VR =VN
maxVN=
VN
80. (3)
It is 0≤ VR ≤ 1.
Considering again A: (175, 0, 0, 0, 0); B: (1, 0, 0, 0, 0)VR = 1 for the scenario A, while VR = 0.006 for the scenario B.
Obviously, VR = 0 whenever all the pollutants have the same concentration, whileVR = 1 if and only if one pollutant reaches its maximum value, while the other arenull..
A. Plaia, M. Ruggieri, A. L. Bondì (University of Palermo) An aggregate air quality index ... July, 5-9 2009 19 / 29
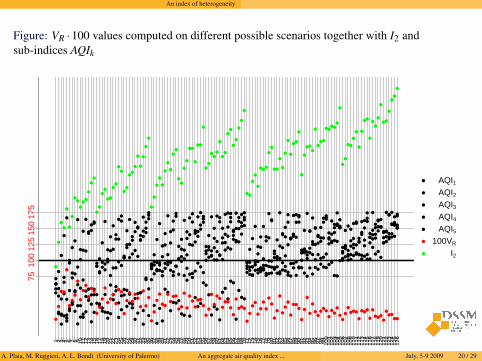
An index of heterogeneity
Figure: VR ·100 values computed on different possible scenarios together with I2 andsub-indices AQIk
scenary
7510
012
515
017
5
●
●
●
●
●
●
●
●
●
●
●●
●
●
●
●
●●●●
●
●
●
●
●
●
●●●
●
●
●
●
●
●
●
●
●
●
●
●●
●
●●●
●●
●
●
●
●
●●
●●
●
●
●●
●
●●
●
●●
●
●
●●
●
●
●
●
●●●
●●
●
●●●●
●
●●
●
●
●●
●●
●
●
●●
●●●
●●
●●
●●●●●
●●
●●
●
●●
●
●●
●
●●
●●
●
●
●
●●
●
●
●●
●
●
●
●
●
●
●●
●●●
●
●●
●
●
●
●
●●
●
●
●
●●
●
●
●
●●
●
●
●
●●
●
●
●
●
●
●
●
●●●
●●
●
●●
●●
●●
●
●●●
●
●●
●
●
●●●●●
●●●
●
●●
●●
●
●●
●●
●
●
●
●
●
●●
●
●●●
●
●●●●
●
●
●
●
●
●●●●●
●
●●●
●●
●●●●
●●
●●
●
●
●
●
●
●
●
●●
●
●
●
●
●
●
●●
●
●
●●
●●
●
●
●●
●
●
●
●●
●
●
●
●●
●●
●●
●
●
●●
●●
●●●
●
●
●
●●
●●
●
●
●●●
●
●●
●
●
●
●
●
●
●
●●●
●
●
●
●●
●●
●
●
●●
●
●
●●
●●●
●●●●
●
●
●
●
●●
●●
●●
●
●
●
●
●
●
●●●
●
●
●
●●
●
●
●
●
●●●●
●
●●
●
●
●●
●●
●
●
●
●
●
●
●●
●●
●
●
●●
●
●●
●●
●
●
●●●●
●
●
●
●
●
●
●
●●
●●
●
●●
●
●
●●●
●
●
●
●●
●●
●●
●
●●
●●
●●
●
●
●
●●
●
●●●
●●
●
●●
●
●
●●●
●
●
●
●●
●●
●●
●
●
●
●
●●
●●
●
●
●●
●
●
●
●●
●
●
●
●
●
●
●
●
●
●
●
●
●
●
●
●
●
●
●
●
●●
●●
●
●
●
●
●
●
●●
●
●
●
●
●
●
●
●
●
●
●
●
●
●
●
●
●
●
●
●
●
●
●
●
●●
●
●
●●
●
●
●
●
●●
●
●
●
●
●
●
●
●
●
●
●
●
●
●
●
●
●
●
●
●
●
●
●
●
●
●
●●●
●
●
●
●
●
●
●
●
●●
●
●
●●
●
●
●●
●
●●
●
●●
●
●
●
●●
●
●
●●
●●●
●
●
●●
●
●
●
●
●
●
●
●
●
●●
●
●
●
●
●●
●
●
●●
●
●
●
●
●●
●
●
●
●
●
●
●
●
●●
●
●
●●
●●
●
●
●●
●
●●
●
●
●
●
●
●●
●
●●
●
●
●
●●●
●
●
●●
●
●
●
●
●
●
●
●
●
●
●●
●
●●●
●
●
●
●
●
●●
●●
●
●
●●
●
●●
●
●●●●
●
●●●
●
●
●●●●
●●●
●●
●
●
●
●
●
●
●
●●
●
●●
●
●●
●
●
●●
●●
●●
●●
●●
●●
●
●
●
●
●
●
●
●
●
●
●
●
●
●
●●
●●
●
●
●●
●
●●
●
●●
●●
●
●
●●
●●
●
●
●
●
●
●●
●
●
●
●●●
●
●
●●
●
●
●
●
●
●●
●
●
●
●●●
●
●●●
●●●●
●
●
●
●
●●
●
●
●
●
●●
●
●●
●
●
●●
●
●●
●
1 2 3 4 5 6 7 8 9 10 11 12 13 14 15 16 17 18 19 20 21 22 23 24 25 26 27 28 29 30 31 32 33 34 35 36 37 38 39 40 41 42 43 44 45 46 47 48 49 50 51 52 53 54 55 56 57 58 59 60 61 62 63 64 65 66 67 68 69 70 71 72 73 74 75 76 77 78 79 80 81 82 83 84 85 86 87 88 89 90 91 92 93 94 95 96 97 98 99 100
101
102
103
104
105
106
107
108
109
110
111
112
113
114
115
116
117
118
119
120
121
122
123
124
125
126
● AQI1● AQI2● AQI3● AQI4● AQI5● 100VR
● I2
A. Plaia, M. Ruggieri, A. L. Bondì (University of Palermo) An aggregate air quality index ... July, 5-9 2009 20 / 29
An index of heterogeneity
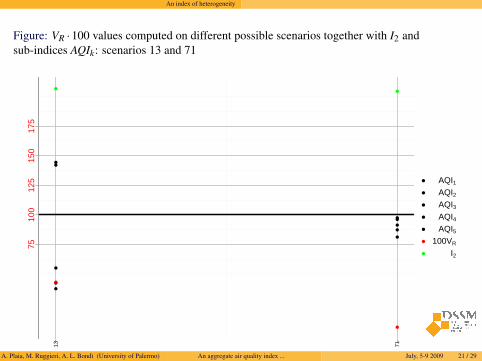
Figure: VR ·100 values computed on different possible scenarios together with I2 andsub-indices AQIk: scenarios 13 and 71
scenary
7510
012
515
017
5
●
●
●
●
●
●
●
●
●
●
●
●
●●
13 71
● AQI1● AQI2● AQI3● AQI4● AQI5● 100VR
● I2
A. Plaia, M. Ruggieri, A. L. Bondì (University of Palermo) An aggregate air quality index ... July, 5-9 2009 21 / 29
An index of heterogeneity
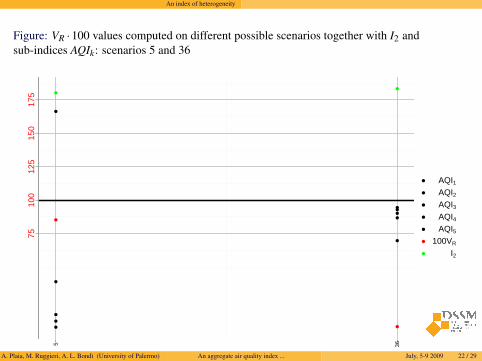
Figure: VR ·100 values computed on different possible scenarios together with I2 andsub-indices AQIk: scenarios 5 and 36
scenary
7510
012
515
017
5
●
●
●
●
●
●
●
●
●
●●
●
●●
5 36
● AQI1● AQI2● AQI3● AQI4● AQI5● 100VR
● I2
A. Plaia, M. Ruggieri, A. L. Bondì (University of Palermo) An aggregate air quality index ... July, 5-9 2009 22 / 29
Final remarks
Final remarks
Hence, VR allowes to know if I2 is influenced by one or more pollutants.
This additional information results useful especially when the value of I2 is high,because it allows to distinguish if a severe pollution episode occurs or not.In this case, a value of VR near to 0 means that we are facing with a scenario wherethe considered concentrations, considered one at a time, do not present verydangerous values. Otherwise, a value of VR near to 1 means that a particular pollutantis exhibiting an high concentration, that will be decisive on the value of I2.
A. Plaia, M. Ruggieri, A. L. Bondì (University of Palermo) An aggregate air quality index ... July, 5-9 2009 23 / 29
Final remarks
Final remarks
Hence, VR allowes to know if I2 is influenced by one or more pollutants.
This additional information results useful especially when the value of I2 is high,because it allows to distinguish if a severe pollution episode occurs or not.In this case, a value of VR near to 0 means that we are facing with a scenario wherethe considered concentrations, considered one at a time, do not present verydangerous values. Otherwise, a value of VR near to 1 means that a particular pollutantis exhibiting an high concentration, that will be decisive on the value of I2.
A. Plaia, M. Ruggieri, A. L. Bondì (University of Palermo) An aggregate air quality index ... July, 5-9 2009 23 / 29
Future research
Future research
The adequacy of I2 have been tested by a comparison to the Air Pollution Index(API), based on the Relative Risk (RR) of daily mortality associated with short termexposure to common air pollutants proposed by Cairncross and Zunckel (2007). APIassumes that the total attributable risk for simultaneous short-term exposure to severalair pollutants is the sum of the values for each pollutant.
What we are working on, at the moment, is the aggregation by monitoring sites: onthis subject we are following the approach of Principal Component Functional DataAnalysis.
A. Plaia, M. Ruggieri, A. L. Bondì (University of Palermo) An aggregate air quality index ... July, 5-9 2009 24 / 29
Future research
Future research
The adequacy of I2 have been tested by a comparison to the Air Pollution Index(API), based on the Relative Risk (RR) of daily mortality associated with short termexposure to common air pollutants proposed by Cairncross and Zunckel (2007). APIassumes that the total attributable risk for simultaneous short-term exposure to severalair pollutants is the sum of the values for each pollutant.
What we are working on, at the moment, is the aggregation by monitoring sites: onthis subject we are following the approach of Principal Component Functional DataAnalysis.
A. Plaia, M. Ruggieri, A. L. Bondì (University of Palermo) An aggregate air quality index ... July, 5-9 2009 24 / 29
Further Reading
Further Reading I
EPA (Environmental Protection Agency), 1994.Measuring Air Quality. The pollutant Standards Index. EPA, 451/K-94-001. Office of Air QualityPlanning and Standards, Research Triangle Park, NC.
EPA, 2006.Guideline for reporting of daily air quality: air quality index (AQI). - United States EnvironmentalProtection Agency, EPA-454/B-06-001.
Ott WR. 1978.Environmental Indices: Theory and Practice. Ann Arbor Science Publishers: Ann Arbor.
Bell, L.B., Hobbs, B.F., Ellis, H., 2005.Metric matters: Conflicting air quality rankings from different indices of air pollution. Journal Airand Waste Management 49, 97-106.
Bodnar O., Cameletti M., Fassó A., Schmid W., 2008.Comparing air quality in Italy, Germany and Poland using BC indexes. Atmospheric Environment 42,8412-8421.
Bruno, F., Cocchi, D., 2002.A unified strategy for building simple air quality indices. Environmetrics 13, 243-261.
Bruno, F., Cocchi, D., 2007.Recovering information from synthetic air quality indices. Environmetrics 18, 345-359.
A. Plaia, M. Ruggieri, A. L. Bondì (University of Palermo) An aggregate air quality index ... July, 5-9 2009 25 / 29
Further Reading
Further Reading II
Cairncross E. K., John, J., Zunckel, M., 2007A novel air pollution index based on the relative risk of daily mortality associated with short-termexposure to common air pollutants, Atmospheric Environment, 41, 8442–8454.
Cheng, W., Kuo, Y., Lin, P., Chang, K., Chen, Y., Lin, T., Huang, R., 2004.Revised air quality index derived from an entropy function. Atmospheric Environment 38, 383-391.
Cogliani, E., 2001.Air pollution forecast in cities by an air pollution index highly correlated with meteorologicalvariables. Atmospheric Environment 35, 2871-2877.
European Community (EC), 1999.CouncilDirective 1999/30/EC of 22 April 1999 relating to limit values for sulphur dioxide, nitrogendioxide and oxides of nitrogen, particulate matter and lead in ambient air. Official Journal L 163,29/06/1999, pp. 41-60.
European Community (EC), 2000.Directive 2000/69/EC of the European Parliament and of the Council of 16 November 2000 relatingto limit values for benzene and carbon monoxide in ambient air. Official Journal L 313, 13/12/2000,pp. 0012-0021.
European Community (EC), 2002.Directive 2002/3/EC of the European Parliament and of the Council of 12 February 2002 relating toozone in ambient air. Official Journal L 67, 9/3/2002, pp. 14-30.
A. Plaia, M. Ruggieri, A. L. Bondì (University of Palermo) An aggregate air quality index ... July, 5-9 2009 26 / 29
Further Reading
Further Reading III
Kassomenos, P., Skouloudis, A.N., Lykoudis, S., Flocas, H.A., 1999.”Air-quality indicators” for uniform indexing of atmospheric pollution over large metropolitan areas.Atmospheric Environment 33, 1861-1879.
Khanna, N., 2000.Measuring environmental quality: an index of pollution. Ecological Economics 35, 191-202.
Kyrkilis G., Chaloulakou A., Kassomenos P.A., 2007.Development of an aggregate AQI for an urban Mediterranean agglomeration: Relation to potentialhealth effects. Environment International, 33, 670–676.
Liu C.M., 2002.Effects of PM2.5 on AQI in Taiwan. Environ Model Softw17 29-37.
Mayer, H., Makra, L., Kalberlah, F., Ahrens, D., and Reuter, U., 2004,Air stress and air quality indices. Meteorologische Zeitschrift, 13(5), 395-403.
Murena, F., 2004.Measuring air quality over large urban areas: development and application of an air pollution index atthe urban area of Naples. Atmospheric Environment 38, 6195-6202.
Ott WR, Hunt Jr WF, 1976.A quantitative evaluation of the pollutant standards index. JAPCA 26 1051-1054.
A. Plaia, M. Ruggieri, A. L. Bondì (University of Palermo) An aggregate air quality index ... July, 5-9 2009 27 / 29
Further Reading
Further Reading IV
Shooter D., Brimblecombe P. (2009)Air quality indexing, International journal of Environment and Pollution, 36, 305–323.
Swamee, P.K., Tyagi, A., 1999.Formation of an air pollution index. Journal Air and Waste Management Association 49, 88-91.
Wu, H.W.Y., Chan, L.Y., 1997.Comparative study of air quality surveillance networks in Hong Kong. Atmospheric Environment 31,935-945. UK Archive, 2005. http://www.airquality.co.uk/archive/standards.php.
van den Elshout, S., Leger, K., Nussio, F., 2008.Comparing urban air quality in Europe in real time: A review of existing air quality indices and theproposal of a common alternative, Environment International, 34(5), 720–726.
A. Plaia, M. Ruggieri, A. L. Bondì (University of Palermo) An aggregate air quality index ... July, 5-9 2009 28 / 29
Thank you for your attention!
A. Plaia, M. Ruggieri, A. L. Bondì (University of Palermo) An aggregate air quality index ... July, 5-9 2009 29 / 29