AMCA 201-02 (R2011) - Fans and Systems
80
AMCA 201-02 (R2011) Fans and Systems PUBLICATION Air Movement and Control Association International AMCA Corporate Headquarters 30 W. University Drive, Arlington Heights, IL 60004-1893, USA [email protected] n Ph: +1-847-394-0150 n www.amca.org © 2017 Air Movement & Control Association International
-
Upload
khangminh22 -
Category
Documents
-
view
0 -
download
0
Transcript of AMCA 201-02 (R2011) - Fans and Systems

AMCA 201-02 (R2011)
Fans and Systems
PUBLICATION
Air Movement and Control Association InternationalAMCA Corporate Headquarters30 W. University Drive, Arlington Heights, IL 60004-1893, [email protected] n Ph: +1-847-394-0150 n www.amca.org© 2017 Air Movement & Control Association International

AMCA PUBLICATION 201-02 (R2011)
Fans and Systems
Air Movement and Control Association International, Inc.30 West University Drive
Arlington Heights, IL 60004-1893
© 2011 by Air Movement and Control Association International, Inc.
All rights reserved. Reproduction or translation of any part of this work beyond that permitted by Sections 107 and108 of the United States Copyright Act without the permission of the copyright owner is unlawful. Requests forpermission or further information should be addressed to the Executive Director, Air Movement and ControlAssociation International, Inc. at 30 West University Drive, Arlington Heights, IL 60004-1893 U.S.A.
Forward
ANSI/AMCA Standard 210 Laboratory Methods of Testing Fans for Aerodynamic Performance Rating, provides abasis for accurately rating the performance of fans when tested under standardized laboratory conditions. Theactual performance of a fan when installed in an air moving system will sometimes be different from the fanperformance as measured in the laboratory. The difference in performance between the laboratory and the fieldinstallation can sometimes be attributed to the interaction of the fan and the duct system, i.e., duct system designcan diminish the usable output of the fan.
AMCA Publication 201 Fans and Systems, introduced the concept of System Effect Factor to the air movingindustry. The System Effect Factor quantifies the duct system design effect on performance. The System EffectFactor has been widely accepted since its inception in 1973. It must be remembered, however, that the "factors"provided are approximations as it is prohibitive to test all fan types and all duct system configurations. The majorrevision to this edition of AMCA Publication 201 Fans and Systems, is a change to the use of SI units of measure,with Inch-Pound units being given secondary consideration.
AMCA 201 Review Committee
Bill Smiley The Trane Company / LaCrosse
James L. Smith Aerovent, A Twin City Fan Company
Tung Nguyen Emerson Ventilation Products
Patrick Chinoda Hartzell Fan, Inc.
Rick Bursh Illinois Blower, Inc.
Sutton G. Page Austin Air Balancing Corp.
Paul R. Saxon AMCA Staff
Disclaimer
AMCA International uses its best efforts to produce standards for the benefit of the industry and the public in lightof available information and accepted industry practices. However, AMCA International does not guarantee, certifyor assure the safety or performance of any products, components or systems tested, designed, installed oroperated in accordance with AMCA International standards or that any tests conducted under its standards will benon-hazardous or free from risk.
Objections to AMCA Standards and Certifications Programs
Air Movement and Control Association International, Inc. will consider and decide all written complaints regardingits standards, certification programs, or interpretations thereof. For information on procedures for submitting andhandling complaints, write to:
Air Movement and Control Association International30 West University DriveArlington Heights, IL 60004-1893 U.S.A.
or
AMCA International, Incorporatedc/o Federation of Environmental Trade Associations2 Waltham Court, Milley Lane, Hare HatchReading, BerkshireRG10 9TH United Kingdom

Related AMCA Standards and Publications
Publication 200 AIR SYSTEMS
System Pressure LossesFan Performance CharacteristicsSystem EffectSystem Design Tolerances
Air Systems is intended to provide basic information needed to design effective and energy efficient air systems.Discussion is limited to systems where there is a clear separation of the fan inlet and outlet and does not coverapplications in which fans are used only to circulate air in an open space.
Publication 201 FANS AND SYSTEMS
Fan Testing and RatingThe Fan "Laws"Air SystemsFan and System InteractionSystem Effect Factors
Fans and Systems is aimed primarily at the designer of the air moving system and discusses the effect on inlet andoutlet connections of the fan's performance. System Effect Factors, which must be included in the basic designcalculations, are listed for various configurations. AMCA 202 and AMCA 203 are companion documents.
Publication 202 TROUBLESHOOTING
System ChecklistFan Manufacturer's AnalysisMaster Troubleshooting Appendices
Troubleshooting is intended to help identify and correct problems with the performance and operation of the airmoving system after installation. AMCA 201 and AMCA 203 are companion documents.
Publication 203 FIELD PERFORMANCE MEASUREMENTS OF FAN SYSTEMS
Acceptance TestsTest Methods and InstrumentsPrecautionsLimitations and Expected AccuraciesCalculations
Field Performance Measurements of Fan Systems reviews the various problems of making field measurementsand calculating the actual performance of the fan and system. AMCA 201 and AMCA 202 are companiondocuments.

TABLE OF CONTENTS
1. Introduction . . . . . . . . . . . . . . . . . . . . . . . . . . . . . . . . . . . . . . . . . . . . . . . . . . . . . . . . . . . . . . . . . . . .1
1.1 Purpose . . . . . . . . . . . . . . . . . . . . . . . . . . . . . . . . . . . . . . . . . . . . . . . . . . . . . . . . . . . . . . . . . . . .1
1.2 Some limitations . . . . . . . . . . . . . . . . . . . . . . . . . . . . . . . . . . . . . . . . . . . . . . . . . . . . . . . . . . . . . .1
2. Symbols and Subscripts . . . . . . . . . . . . . . . . . . . . . . . . . . . . . . . . . . . . . . . . . . . . . . . . . . . . . . . . . .1
2.1 Symbols and subscripted symbols . . . . . . . . . . . . . . . . . . . . . . . . . . . . . . . . . . . . . . . . . . . . . . . .1
2.2 Subscripts . . . . . . . . . . . . . . . . . . . . . . . . . . . . . . . . . . . . . . . . . . . . . . . . . . . . . . . . . . . . . . . . . . .1
3. Fan Testing . . . . . . . . . . . . . . . . . . . . . . . . . . . . . . . . . . . . . . . . . . . . . . . . . . . . . . . . . . . . . . . . . . . . .1
3.1 ANSI/AMCA Standard 210 . . . . . . . . . . . . . . . . . . . . . . . . . . . . . . . . . . . . . . . . . . . . . . . . . . . . . .1
3.2 Ducted outlet fan tests . . . . . . . . . . . . . . . . . . . . . . . . . . . . . . . . . . . . . . . . . . . . . . . . . . . . . . . . .3
3.3 Free inlet, free outlet fan tests . . . . . . . . . . . . . . . . . . . . . . . . . . . . . . . . . . . . . . . . . . . . . . . . . . .4
3.4 Obstructed inlets and outlets . . . . . . . . . . . . . . . . . . . . . . . . . . . . . . . . . . . . . . . . . . . . . . . . . . . .4
4. Fan Ratings . . . . . . . . . . . . . . . . . . . . . . . . . . . . . . . . . . . . . . . . . . . . . . . . . . . . . . . . . . . . . . . . . . . .4
4.1 The Fan Laws . . . . . . . . . . . . . . . . . . . . . . . . . . . . . . . . . . . . . . . . . . . . . . . . . . . . . . . . . . . . . . .4
4.2 Limitations . . . . . . . . . . . . . . . . . . . . . . . . . . . . . . . . . . . . . . . . . . . . . . . . . . . . . . . . . . . . . . . . . .4
4.3 Fan performance curves . . . . . . . . . . . . . . . . . . . . . . . . . . . . . . . . . . . . . . . . . . . . . . . . . . . . . . .9
5. Catalog Performance Tables . . . . . . . . . . . . . . . . . . . . . . . . . . . . . . . . . . . . . . . . . . . . . . . . . . . . . .13
5.1 Type A: Free inlet, free outlet fans . . . . . . . . . . . . . . . . . . . . . . . . . . . . . . . . . . . . . . . . . . . . . . .13
5.2 Ducted fans . . . . . . . . . . . . . . . . . . . . . . . . . . . . . . . . . . . . . . . . . . . . . . . . . . . . . . . . . . . . . . . .13
6. Air Systems . . . . . . . . . . . . . . . . . . . . . . . . . . . . . . . . . . . . . . . . . . . . . . . . . . . . . . . . . . . . . . . . . . .16
6.1 The system . . . . . . . . . . . . . . . . . . . . . . . . . . . . . . . . . . . . . . . . . . . . . . . . . . . . . . . . . . . . . . . . .16
6.2 Component losses . . . . . . . . . . . . . . . . . . . . . . . . . . . . . . . . . . . . . . . . . . . . . . . . . . . . . . . . . . .16
6.3 The system curve . . . . . . . . . . . . . . . . . . . . . . . . . . . . . . . . . . . . . . . . . . . . . . . . . . . . . . . . . . . .17
6.4 Interaction of system curve and fan performance curve . . . . . . . . . . . . . . . . . . . . . . . . . . . . . .18
6.5 Effect of changes in speed . . . . . . . . . . . . . . . . . . . . . . . . . . . . . . . . . . . . . . . . . . . . . . . . . . . . .18
6.6 Effect of density on system resistance . . . . . . . . . . . . . . . . . . . . . . . . . . . . . . . . . . . . . . . . . . . .19
6.7 Fan and system interaction . . . . . . . . . . . . . . . . . . . . . . . . . . . . . . . . . . . . . . . . . . . . . . . . . . . .21
6.8 Effects of errors in estimating system resistance . . . . . . . . . . . . . . . . . . . . . . . . . . . . . . . . . . . .21

6.9 Safety factors . . . . . . . . . . . . . . . . . . . . . . . . . . . . . . . . . . . . . . . . . . . . . . . . . . . . . . . . . . . . . . .22
6.10 Deficient fan/system performance . . . . . . . . . . . . . . . . . . . . . . . . . . . . . . . . . . . . . . . . . . . . . .23
6.11 Precautions to prevent deficient performance . . . . . . . . . . . . . . . . . . . . . . . . . . . . . . . . . . . . .23
6.12 System effect . . . . . . . . . . . . . . . . . . . . . . . . . . . . . . . . . . . . . . . . . . . . . . . . . . . . . . . . . . . . . .23
7. System Effect Factor (SEF) . . . . . . . . . . . . . . . . . . . . . . . . . . . . . . . . . . . . . . . . . . . . . . . . . . . . . . .24
7.1 System Effect Curves . . . . . . . . . . . . . . . . . . . . . . . . . . . . . . . . . . . . . . . . . . . . . . . . . . . . . . . . .24
7.2 Power determination . . . . . . . . . . . . . . . . . . . . . . . . . . . . . . . . . . . . . . . . . . . . . . . . . . . . . . . . .29
8. Outlet System Effect Factors . . . . . . . . . . . . . . . . . . . . . . . . . . . . . . . . . . . . . . . . . . . . . . . . . . . . .29
8.1 Outlet ducts . . . . . . . . . . . . . . . . . . . . . . . . . . . . . . . . . . . . . . . . . . . . . . . . . . . . . . . . . . . . . . . .29
8.2 Outlet diffusers . . . . . . . . . . . . . . . . . . . . . . . . . . . . . . . . . . . . . . . . . . . . . . . . . . . . . . . . . . . . . .30
8.3 Outlet duct elbows . . . . . . . . . . . . . . . . . . . . . . . . . . . . . . . . . . . . . . . . . . . . . . . . . . . . . . . . . . .31
8.4 Turning vanes . . . . . . . . . . . . . . . . . . . . . . . . . . . . . . . . . . . . . . . . . . . . . . . . . . . . . . . . . . . . . . .35
8.5 Volume control dampers . . . . . . . . . . . . . . . . . . . . . . . . . . . . . . . . . . . . . . . . . . . . . . . . . . . . . .35
8.6 Duct branches . . . . . . . . . . . . . . . . . . . . . . . . . . . . . . . . . . . . . . . . . . . . . . . . . . . . . . . . . . . . . .37
9. Inlet System Effect Factors . . . . . . . . . . . . . . . . . . . . . . . . . . . . . . . . . . . . . . . . . . . . . . . . . . . . . . .38
9.1 Inlet ducts . . . . . . . . . . . . . . . . . . . . . . . . . . . . . . . . . . . . . . . . . . . . . . . . . . . . . . . . . . . . . . . . . .38
9.2 Inlet duct elbows . . . . . . . . . . . . . . . . . . . . . . . . . . . . . . . . . . . . . . . . . . . . . . . . . . . . . . . . . . . .38
9.3 Inlet vortex (spin or swirl) . . . . . . . . . . . . . . . . . . . . . . . . . . . . . . . . . . . . . . . . . . . . . . . . . . . . . .40
9.4 Inlet turning vanes . . . . . . . . . . . . . . . . . . . . . . . . . . . . . . . . . . . . . . . . . . . . . . . . . . . . . . . . . . .44
9.5 Airflow straighteners . . . . . . . . . . . . . . . . . . . . . . . . . . . . . . . . . . . . . . . . . . . . . . . . . . . . . . . . . .44
9.6 Enclosures (plenum and cabinet effects) . . . . . . . . . . . . . . . . . . . . . . . . . . . . . . . . . . . . . . . . . .46
9.7 Obstructed inlets . . . . . . . . . . . . . . . . . . . . . . . . . . . . . . . . . . . . . . . . . . . . . . . . . . . . . . . . . . . .47
10. Effects of Factory Supplied Accessories . . . . . . . . . . . . . . . . . . . . . . . . . . . . . . . . . . . . . . . . . . .49
10.1 Bearing and supports in fan inlet . . . . . . . . . . . . . . . . . . . . . . . . . . . . . . . . . . . . . . . . . . . . . . .50
10.2 Drive guards obstructing fan inlet . . . . . . . . . . . . . . . . . . . . . . . . . . . . . . . . . . . . . . . . . . . . . . .50
10.3 Belt tube in axial fan inlet or outlet . . . . . . . . . . . . . . . . . . . . . . . . . . . . . . . . . . . . . . . . . . . . . .50
10.4 Inlet box . . . . . . . . . . . . . . . . . . . . . . . . . . . . . . . . . . . . . . . . . . . . . . . . . . . . . . . . . . . . . . . . . . .50
10.5 Inlet box dampers . . . . . . . . . . . . . . . . . . . . . . . . . . . . . . . . . . . . . . . . . . . . . . . . . . . . . . . . . . .50
10.6 Variable inlet vane (VIV) . . . . . . . . . . . . . . . . . . . . . . . . . . . . . . . . . . . . . . . . . . . . . . . . . . . . . .51
Annex A. SI / I-P Conversion Table (Informative) . . . . . . . . . . . . . . . . . . . . . . . . . . . . . . . . . . . . . . .52
Annex B. Dual Fan Systems - Series and Parallel . . . . . . . . . . . . . . . . . . . . . . . . . . . . . . . . . . . . . . .53
B.1 Fans operating in series . . . . . . . . . . . . . . . . . . . . . . . . . . . . . . . . . . . . . . . . . . . . . . . . . . . . . . .53
B.2 Fans operating in parallel . . . . . . . . . . . . . . . . . . . . . . . . . . . . . . . . . . . . . . . . . . . . . . . . . . . . . .53
Annex C. Definitions and Terminology . . . . . . . . . . . . . . . . . . . . . . . . . . . . . . . . . . . . . . . . . . . . . . . .55
C.1 The air . . . . . . . . . . . . . . . . . . . . . . . . . . . . . . . . . . . . . . . . . . . . . . . . . . . . . . . . . . . . . . . . . . . .55
C.2 The fan . . . . . . . . . . . . . . . . . . . . . . . . . . . . . . . . . . . . . . . . . . . . . . . . . . . . . . . . . . . . . . . . . . . .55
C.3 The system . . . . . . . . . . . . . . . . . . . . . . . . . . . . . . . . . . . . . . . . . . . . . . . . . . . . . . . . . . . . . . . . .58
Annex D. Examples of the Convertibility of Energy from Velocity Pressure to Static Pressure . . . . . . . . . . . . . . . . . . . . . . . . . . . . . . . . . . . . . . . . . . . . . . . .62
D.1 Example of fan (tested with free inlet, ducted outlet) applied to a duct system . . . . . . . . . . . . . . . . . . . . . . . . . . . . . . . . . . . . . . . . . . . . . . . . . . . . . . . . . . . . . . . .62
D.2 Example of fan (tested with free inlet, ducted outlet), connected to a duct system and then a plenum . . . . . . . . . . . . . . . . . . . . . . . . . . . . . . . . . . . . . . . . . . . . . . . . .63
D.3 Example of fan with free inlet, free outlet - fan discharges directly into plenum and then to duct system (abrupt expansion at fan outlet) . . . . . . . . . . . . . . . . . . .65
D.4 Example of fan used to exhaust with obstruction in inlet, inlet elbow, inlet duct, free outlet . . . . . . . . . . . . . . . . . . . . . . . . . . . . . . . . . . . . . . . . . . . . . . . . . . . . . . . . . .66
Annex E. References . . . . . . . . . . . . . . . . . . . . . . . . . . . . . . . . . . . . . . . . . . . . . . . . . . . . . . . . . . . . . .69

AMCA INTERNATIONAL, INC. AMCA 201-02 (R2011)
Fans and Systems
1. Introduction
ANSI/AMCA 210 Laboratory Methods of Testing FansFor Aerodynamic Performance Rating, offers thesystem design engineer guidance as to how the fanwas tested and rated. AMCA Publication 201 Fansand Systems, helps provide guidance as to whateffect the system and its connections to the fan haveon fan performance.
Recognizing and accounting for losses that affect thefan’s performance, in the design stage, will allow thedesigner to predict with reasonable accuracy, theinstalled performance of the fan.
1.1 Purpose
This part of the AMCA Fan Application Manualincludes general information about how fans aretested in the laboratory, and how their performanceratings are calculated and published. It also reviewssome of the more important reasons for the "loss" offan performance that may occur when the fan isinstalled in an actual system.
Allowances, called System Effect Factors (SEF), arealso given in this part of the manual. SEF must betaken into account by the system design engineer if areasonable estimate of fan/system performance is tobe determined.
1.2 Some limitations
It must be appreciated that the System Effect Factorsgiven in this manual are intended as guidelines andare, in general, approximations. Some have beenobtained from research studies, others have beenpublished previously by individual fan manufacturers,and many represent the consensus of engineers withconsiderable experience in the application of fans.
Fans of different types and even fans of the sametype, but supplied by different manufacturers, will notnecessarily react with the system in exactly the sameway. It will be necessary, therefore, to apply judgmentbased on actual experience in applying the SEF.
The SEF represented in this manual assume that thefan application is generally consistent with themethod of testing and rating by the manufacturer.Inappropriate application of the fan will result in SEF
values inconsistent with the values presented.
Mechanical design of the fan is not within the scopeof this publication.
2. Symbols and Subscripts
For symbols and subscripted symbols, see Table 2.1.For subscripts, see Table 2.2.
3. Fan Testing
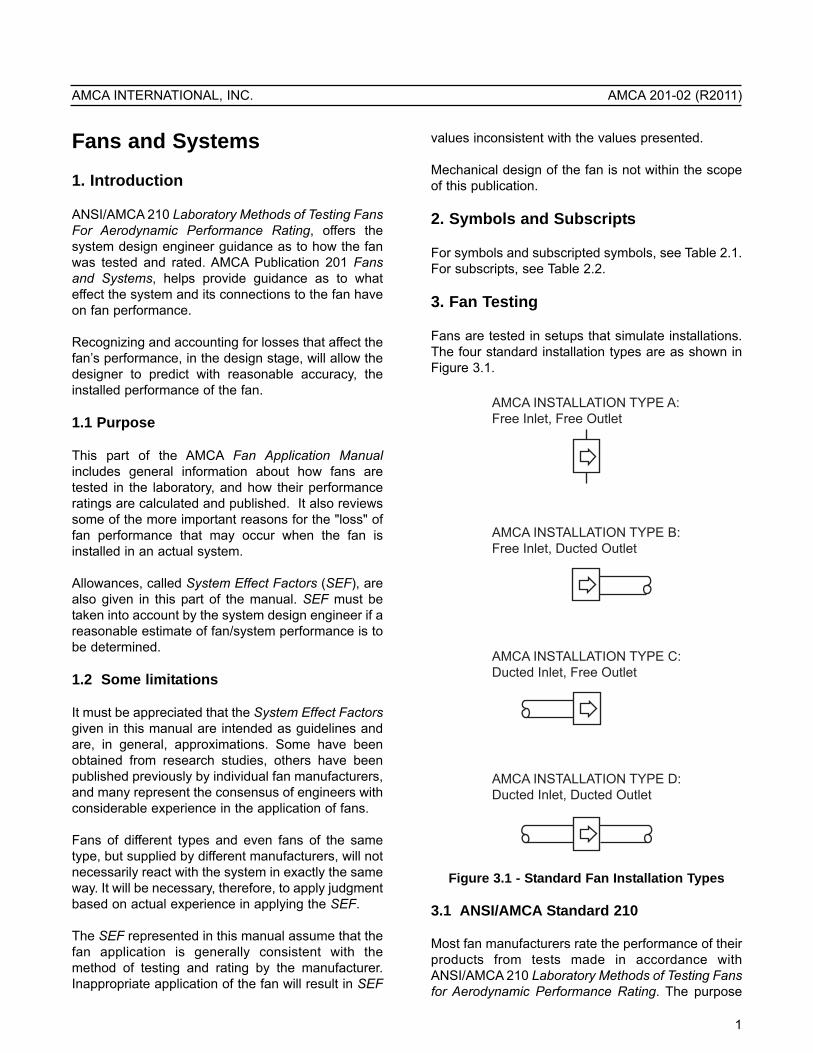
Fans are tested in setups that simulate installations.The four standard installation types are as shown inFigure 3.1.
Figure 3.1 - Standard Fan Installation Types
3.1 ANSI/AMCA Standard 210
Most fan manufacturers rate the performance of theirproducts from tests made in accordance withANSI/AMCA 210 Laboratory Methods of Testing Fansfor Aerodynamic Performance Rating. The purpose
AMCA INSTALLATION TYPE A:Free Inlet, Free Outlet
AMCA INSTALLATION TYPE B:Free Inlet, Ducted Outlet
AMCA INSTALLATION TYPE C:Ducted Inlet, Free Outlet
AMCA INSTALLATION TYPE D:Ducted Inlet, Ducted Outlet
1
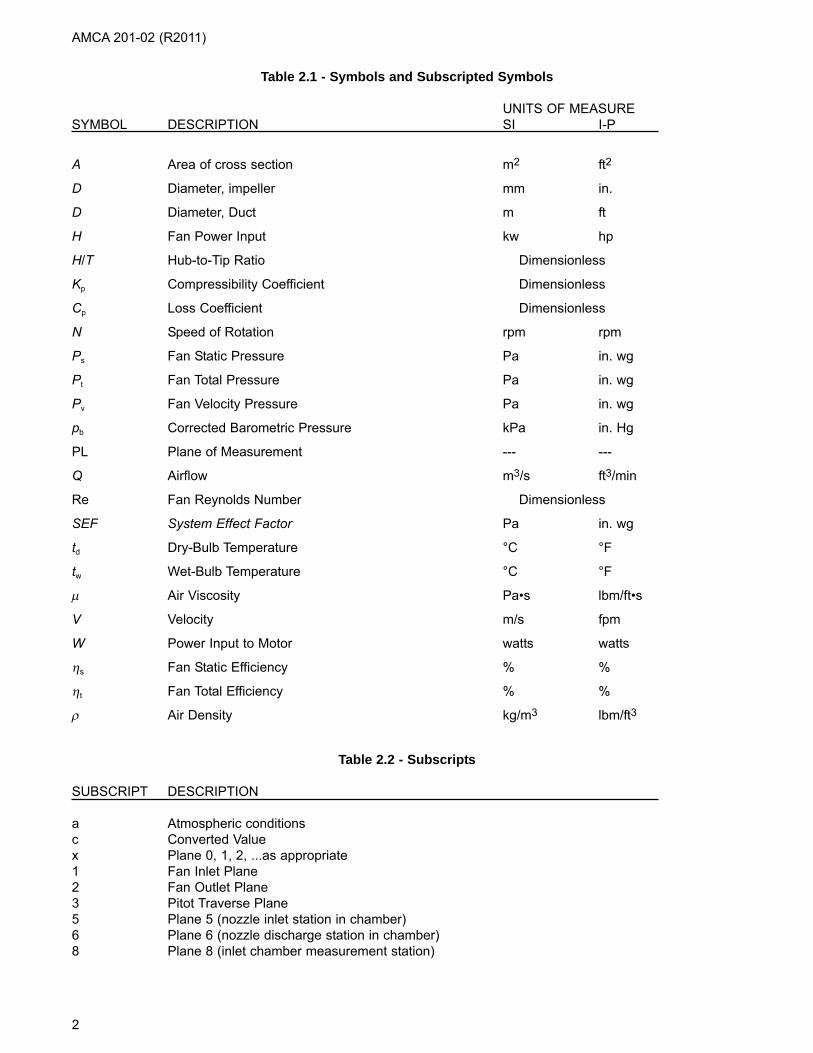
Table 2.1 - Symbols and Subscripted Symbols
UNITS OF MEASURESYMBOL DESCRIPTION SI I-P
A Area of cross section m2 ft2
D Diameter, impeller mm in.
D Diameter, Duct m ft
H Fan Power Input kw hp
H/T Hub-to-Tip Ratio Dimensionless
Kp Compressibility Coefficient Dimensionless
Cp Loss Coefficient Dimensionless
N Speed of Rotation rpm rpm
Ps Fan Static Pressure Pa in. wg
Pt Fan Total Pressure Pa in. wg
Pv Fan Velocity Pressure Pa in. wg
pb Corrected Barometric Pressure kPa in. Hg
PL Plane of Measurement --- ---
Q Airflow m3/s ft3/min
Re Fan Reynolds Number Dimensionless
SEF System Effect Factor Pa in. wg
td Dry-Bulb Temperature °C °F
tw Wet-Bulb Temperature °C °F
μ Air Viscosity Pa•s lbm/ft•s
V Velocity m/s fpm
W Power Input to Motor watts watts
ηs Fan Static Efficiency % %
ηt Fan Total Efficiency % %
ρ Air Density kg/m3 lbm/ft3
Table 2.2 - Subscripts
SUBSCRIPT DESCRIPTION
a Atmospheric conditionsc Converted Valuex Plane 0, 1, 2, ...as appropriate1 Fan Inlet Plane2 Fan Outlet Plane3 Pitot Traverse Plane5 Plane 5 (nozzle inlet station in chamber)6 Plane 6 (nozzle discharge station in chamber)8 Plane 8 (inlet chamber measurement station)
AMCA 201-02 (R2011)
2
TransitionPiece
Straightener
1 2
FOR FAN INSTALLATION TYPES:B: Free Inlet, Ducted Outlet D: Ducted Inlet, Ducted Outlet
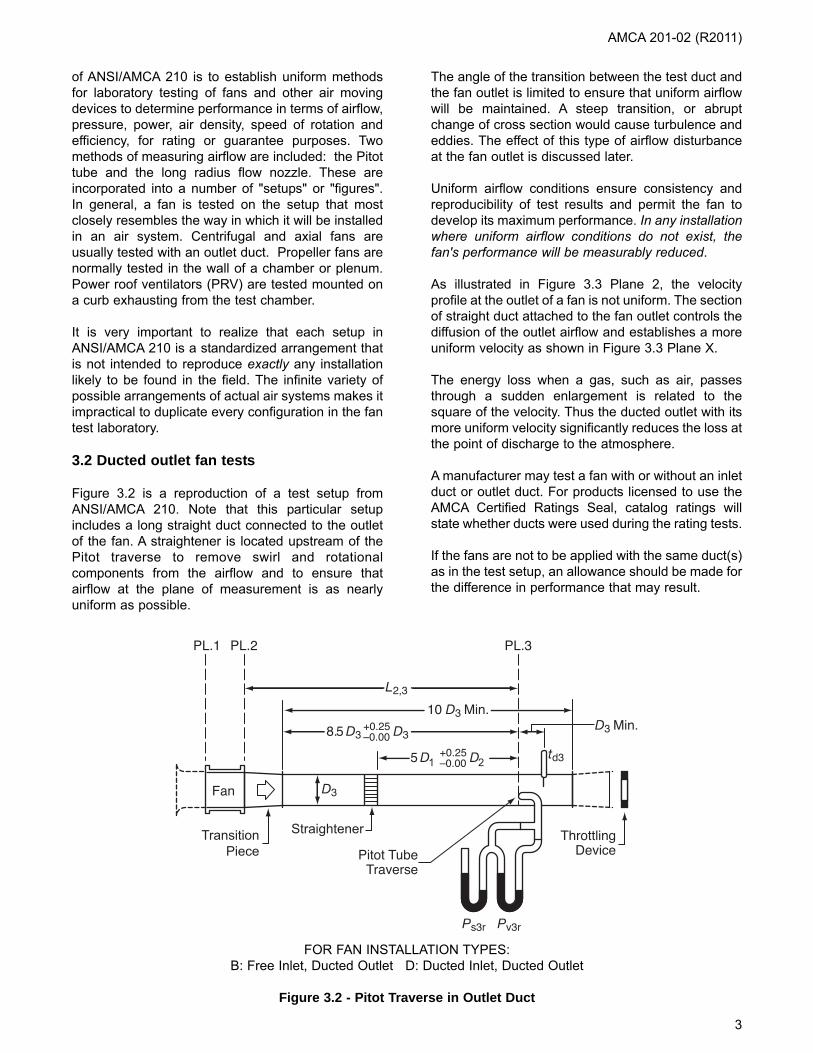
Figure 3.2 - Pitot Traverse in Outlet Duct
AMCA 201-02 (R2011)
of ANSI/AMCA 210 is to establish uniform methodsfor laboratory testing of fans and other air movingdevices to determine performance in terms of airflow,pressure, power, air density, speed of rotation andefficiency, for rating or guarantee purposes. Twomethods of measuring airflow are included: the Pitottube and the long radius flow nozzle. These areincorporated into a number of "setups" or "figures".In general, a fan is tested on the setup that mostclosely resembles the way in which it will be installedin an air system. Centrifugal and axial fans areusually tested with an outlet duct. Propeller fans arenormally tested in the wall of a chamber or plenum.Power roof ventilators (PRV) are tested mounted ona curb exhausting from the test chamber.
It is very important to realize that each setup inANSI/AMCA 210 is a standardized arrangement thatis not intended to reproduce exactly any installationlikely to be found in the field. The infinite variety ofpossible arrangements of actual air systems makes itimpractical to duplicate every configuration in the fantest laboratory.
3.2 Ducted outlet fan tests
Figure 3.2 is a reproduction of a test setup fromANSI/AMCA 210. Note that this particular setupincludes a long straight duct connected to the outletof the fan. A straightener is located upstream of thePitot traverse to remove swirl and rotationalcomponents from the airflow and to ensure thatairflow at the plane of measurement is as nearlyuniform as possible.
The angle of the transition between the test duct andthe fan outlet is limited to ensure that uniform airflowwill be maintained. A steep transition, or abruptchange of cross section would cause turbulence andeddies. The effect of this type of airflow disturbanceat the fan outlet is discussed later.
Uniform airflow conditions ensure consistency andreproducibility of test results and permit the fan todevelop its maximum performance. In any installationwhere uniform airflow conditions do not exist, thefan's performance will be measurably reduced.
As illustrated in Figure 3.3 Plane 2, the velocityprofile at the outlet of a fan is not uniform. The sectionof straight duct attached to the fan outlet controls thediffusion of the outlet airflow and establishes a moreuniform velocity as shown in Figure 3.3 Plane X.
The energy loss when a gas, such as air, passesthrough a sudden enlargement is related to thesquare of the velocity. Thus the ducted outlet with itsmore uniform velocity significantly reduces the loss atthe point of discharge to the atmosphere.
A manufacturer may test a fan with or without an inletduct or outlet duct. For products licensed to use theAMCA Certified Ratings Seal, catalog ratings willstate whether ducts were used during the rating tests.
If the fans are not to be applied with the same duct(s)as in the test setup, an allowance should be made forthe difference in performance that may result.
3
4
3.3 Free inlet, free outlet fan tests
Figure 3.4 illustrates a typical multi-nozzle chambertest setup from ANSI/AMCA 210. This simulates theconditions under which most exhaust fans are testedand rated. Fan performance based on this type oftest may require adjustment when additionalaccessories are used with the fan. Fans designed foruse without duct systems are usually rated over alower range of pressures. They are commonlycataloged and sold as a complete unit with suitabledrive and motor.
3.4 Obstructed inlets and outlets
The test setups in ANSI/AMCA 210 result inunobstructed airflow conditions at both the inlet andthe outlet of the fan. Appurtenances or obstructionslocated close to the inlet and/or outlet will affect fanperformance. Shafts, bearings, bearing supports andother appurtenances normally used with a fan shouldbe in place when a fan is tested for rating.
Variations in construction which may affect fanperformance include changes in sizes and types ofsheaves and pulleys, bearing supports, bearings andshafts, belt guards, inlet and outlet dampers, inletvanes, inlet elbows, inlet and outlet cones, andcabinets or housings.
Since changes in performance will be different forvarious product designs, it will be necessary to makesuitable allowances based on data obtained from theapplicable fan catalog or directly from themanufacturer.
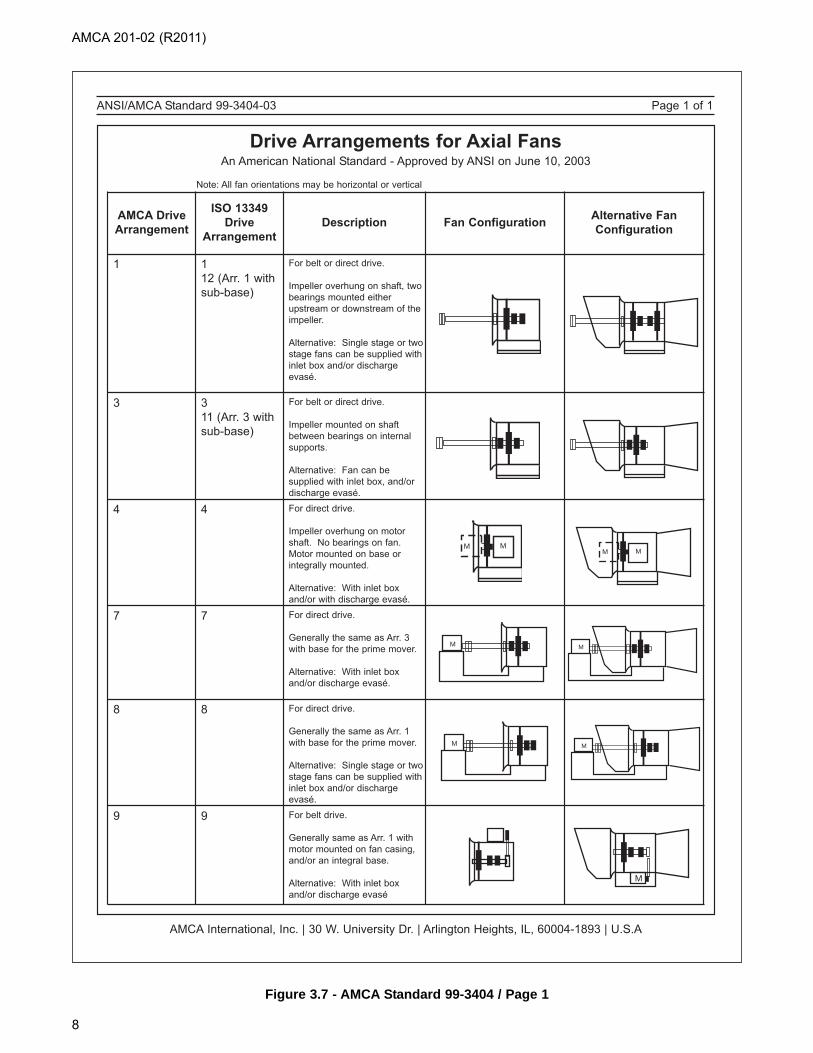
Most single width centrifugal fans are tested usingArrangement 1 fans. Some allowance for the effectof bearings and bearing supports in the inlet may benecessary when using Arrangement 3 orArrangement 7. The various AMCA standardarrangements are shown on Figures 3.5, 3.6, and3.7.
4. Fan Ratings
4.1 The Fan Laws
It is not practical to test a fan at every speed at whichit may be applied. Nor is it possible to simulate everyinlet density that may be encountered. Fortunately,by use of a series of equations commonly referred toas the Fan Laws, it is possible to predict with goodaccuracy the performance of a fan at other speedsand densities than those of the original rating test.
The performance of a complete series ofgeometrically similar (homologous) fans can also be
calculated from the performance of smaller fans inthe series using the appropriate equations.
Because of the relationship between the airflow,pressure and power for any given fan, each set ofequations for changes in speed, size or density,applies only to the same Point of Rating, and all theequations in the set must be used to define theconverted condition. A Point of Rating is the specifiedfan operating point on its characteristic curve.
The Fan Law equations are shown below as ratios.The un-subscripted variable is used to designate theinitial or test fan values for the variable and thesubscript c is used to designate the converted,dependent or desired variable.
Qc = Q × (Dc/D)3 × (Nc/N) × (Kp/Kpc)
Ptc = Pt × (Dc/D)2 × (Nc/N)2 × (ρc/ρ) × (Kp/Kpc)
Pvc = Pv × (Dc/D)2 × (Nc/N)2 × (ρc/ρ)
Psc = Ptc - Pvc
Hc = H × (Dc/D)5 × (Nc/N)3 × (ρc/ρ) × (Kp/Kpc)
ηtc = (Qc × Ptc × Kp) / Hc (SI)
ηtc = (Qc × Ptc × Kp) / (6362 • Hc) (I-P)
ηsc = ηtc × (Psc/Ptc)
These equations have their origin in the classicaltheories of fluid mechanics, and the accuracy of theresults obtained is sufficient for most applications.Better accuracy would require consideration ofReynolds number, Mach number, kinematic viscosity,dynamic viscosity, surface roughness, impeller bladethickness and relative clearances, etc.
4.2 Limitations
Under certain conditions the properties of gaseschange and there are, therefore, limitations to the useof the Fan Laws. Accurate results will be obtainedwhen the following limitations are observed:
a. Fan Reynolds Number (Re). The term Reynoldsnumber is associated with the ratio of inertia toviscous forces. When related to fans, investigationsof both axial and centrifugal fans show thatperformance losses are more significant at lowReynolds number ranges and are effectivelynegligible above certain threshold Reynoldsnumbers. In an effort to simplify the comparison ofthe Reynolds numbers of two fans, the fan industry
AMCA 201-02 (R2011)

5
AMCA 201-02 (R2011)
PL 2PL X
PL 2 PL X
OUTLET AREABLAST AREA
CENTRIFUGAL FAN
AXIAL FAN
CUTOFF
DISCHARGE DUCT
PL.5 PL.6 PL.8 PL.1 PL.2
SETTLINGMEANS
VARIABLESUPPLYSYSTEM
SETTLINGMEANS(See note 4)
FAN
0.1 M MIN.
0.5 M MIN.0.2 M MIN.0.3 M MIN.
P t8ΔPP s5
M
0.2MMIN.
38mm ±6mm(1.5in. ±0.25 in.)
0.5MMIN.
td2
td3
AIRFLOW
Figure 3.3 - Controlled Diffusion and Establishment of a Uniform Velocity Profile in a Straight Length of Outlet Duct
Figure 3.4 - Inlet Chamber Setup - Multiple Nozzles in Chamber(ANSI/AMCA 210-99, Figure 15)

AMCA International, Inc. | 30 W. University Dr. | Arlington Heights, IL, 60004-1893 | U.S.A
ANSI/AMCA Standard 99-2404-03 Page 1 of 2
AMCA Drive
Arrangement
ISO 13349
Drive
Arrangement
Description Fan ConfigurationAlternative Fan
Configuration
1 SWSI 1 or
12 (Arr. 1 with
sub-base)
For belt or direct drive.
Impeller overhung on shaft, two
bearings mounted on pedestal
base.
Alternative: Bearings mounted
on independant pedestals, with
or without inlet box.
2 SWSI 2 For belt or direct drive.
Impeller overhung on shaft,
bearings mounted in bracket
supported by the fan casing.
Alternative: With inlet box.
3 SWSI 3 or
11 (Arr. 3 with
sub-base)
For belt or direct drive.
Impeller mounted on shaft
between bearings supported by
the fan casing.
Alternative: Bearings mounted
on independent pedestals, with
or without inlet box.
3 DWDI 6 or
18 (Arr. 6 with
sub-base)
For belt or direct drive.
Impeller mounted on shaft
between bearings supported by
the fan casing.
Alternative: Bearings mounted
on independent pedestals, with
or without inlet boxes.
4 SWSI 4 For direct drive.
Impeller overhung on motor
shaft. No bearings on fan.
Motor mounted on base.
Alternative: With inlet box.
5 SWSI 5 For direct drive.
Impeller overhung on motor
shaft. No bearings on fan.
Motor flange mounted to
casing.
Alternative: With inlet box.
Drive Arrangements for Centrifugal FansAn American National Standard - Approved by ANSI on April 17, 2003
Figure 3.5 - AMCA Standard 99-2404 / Page 1
AMCA 201-02 (R2011)
6

ANSI/AMCA Standard 99-2404-03 Page 2 of 2
AMCA International, Inc. | 30 W. University Dr. | Arlington Heights, IL, 60004-1893 | U.S.A
AMCA Drive
Arrangement
ISO 13349
Drive
Arrangement
Description Fan ConfigurationAlternative Fan
Configuration
7 SWSI 7 For coupling drive.
Generally the same as Arr. 3,
with base for the prime mover.
Alternative: Bearings mounted
on independent pedestals with
or without inlet box.
7DWDI 17
(Arr. 6 with
base for motor)
For coupling drive.
Generally the same as Arr. 3
with base for the prime mover.
Alternative: Bearings mounted
on independent pedestals with
or without inlet box.
8 SWSI 8 For direct drive.
Generally the same as Arr. 1
with base for the prime mover.
Alternative: Bearings mounted
on independent pedestals with
or without inlet box.
9 SWSI 9 For belt drive.
Impeller overhung on shaft, two
bearings mounted on pedestal
base.
Motor mounted on the outside
of the bearing base.
Alternative: With inlet box.
10 SWSI 10 For belt drive.
Generally the same as Arr. 9
with motor mounted inside of
the bearing pedestal.
Alternative: With inlet box.
Figure 3.6 - AMCA Standard 99-2404 / Page 2
AMCA 201-02 AMCA 201-02 (R2011)
7
AMCA International, Inc. | 30 W. University Dr. | Arlington Heights, IL, 60004-1893 | U.S.A
ANSI/AMCA Standard 99-3404-03 Page 1 of 1
Drive Arrangements for Axial FansAn American National Standard - Approved by ANSI on June 10, 2003
AMCA Drive
Arrangement
ISO 13349
Drive
Arrangement
Description Fan ConfigurationAlternative Fan
Configuration
1 1
12 (Arr. 1 with
sub-base)
For belt or direct drive.
Impeller overhung on shaft, two
bearings mounted either
upstream or downstream of the
impeller.
Alternative: Single stage or two
stage fans can be supplied with
inlet box and/or discharge
evasé.
3 3
11 (Arr. 3 with
sub-base)
For belt or direct drive.
Impeller mounted on shaft
between bearings on internal
supports.
Alternative: Fan can be
supplied with inlet box, and/or
discharge evasé.
4 4 For direct drive.
Impeller overhung on motor
shaft. No bearings on fan.
Motor mounted on base or
integrally mounted.
Alternative: With inlet box
and/or with discharge evasé.
M MM M
7 7 For direct drive.
Generally the same as Arr. 3
with base for the prime mover.
Alternative: With inlet box
and/or discharge evasé.
M M
8 8 For direct drive.
Generally the same as Arr. 1
with base for the prime mover.
Alternative: Single stage or two
stage fans can be supplied with
inlet box and/or discharge
evasé.
M M
9 9 For belt drive.
Generally same as Arr. 1 with
motor mounted on fan casing,
and/or an integral base.
Alternative: With inlet box
and/or discharge evasé
M
Note: All fan orientations may be horizontal or vertical
Figure 3.7 - AMCA Standard 99-3404 / Page 1
AMCA 201-02 (R2011)
8
AMCA 201-02 (R2011)
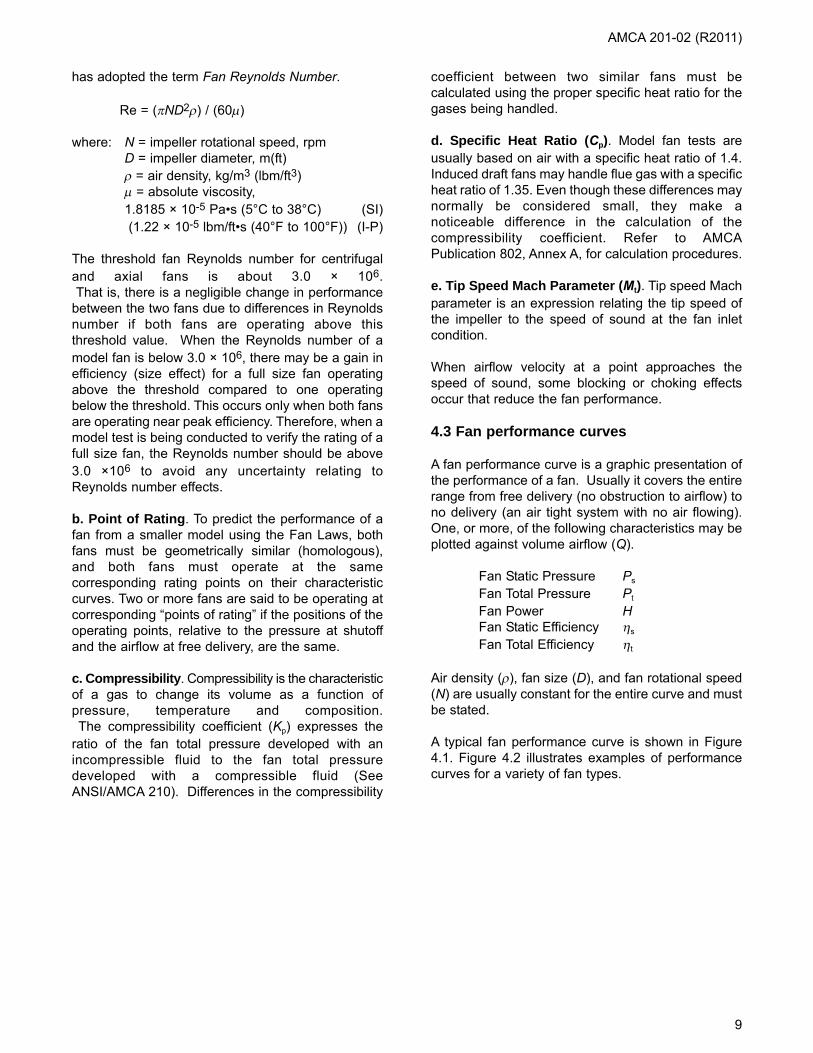
has adopted the term Fan Reynolds Number.
Re = (πND2ρ) / (60μ)
where: N = impeller rotational speed, rpm D = impeller diameter, m(ft) ρ = air density, kg/m3 (lbm/ft3)μ = absolute viscosity, 1.8185 × 10⁻⁵ Pa•s (5°C to 38°C) (SI)(1.22 × 10⁻⁵ lbm/ft•s (40°F to 100°F)) (I-P)
The threshold fan Reynolds number for centrifugaland axial fans is about 3.0 × 10⁶.That is, there is a negligible change in performance
between the two fans due to differences in Reynoldsnumber if both fans are operating above thisthreshold value. When the Reynolds number of amodel fan is below 3.0 × 10⁶, there may be a gain inefficiency (size effect) for a full size fan operatingabove the threshold compared to one operatingbelow the threshold. This occurs only when both fansare operating near peak efficiency. Therefore, when amodel test is being conducted to verify the rating of afull size fan, the Reynolds number should be above3.0 ×106 to avoid any uncertainty relating toReynolds number effects.
b. Point of Rating. To predict the performance of afan from a smaller model using the Fan Laws, bothfans must be geometrically similar (homologous),and both fans must operate at the samecorresponding rating points on their characteristiccurves. Two or more fans are said to be operating atcorresponding “points of rating” if the positions of theoperating points, relative to the pressure at shutoffand the airflow at free delivery, are the same.
c. Compressibility. Compressibility is the characteristicof a gas to change its volume as a function ofpressure, temperature and composition.The compressibility coefficient (Kp) expresses the
ratio of the fan total pressure developed with anincompressible fluid to the fan total pressuredeveloped with a compressible fluid (SeeANSI/AMCA 210). Differences in the compressibility
coefficient between two similar fans must becalculated using the proper specific heat ratio for thegases being handled.
d. Specific Heat Ratio (Cp). Model fan tests areusually based on air with a specific heat ratio of 1.4.Induced draft fans may handle flue gas with a specificheat ratio of 1.35. Even though these differences maynormally be considered small, they make anoticeable difference in the calculation of thecompressibility coefficient. Refer to AMCAPublication 802, Annex A, for calculation procedures.
e. Tip Speed Mach Parameter (Mt). Tip speed Machparameter is an expression relating the tip speed ofthe impeller to the speed of sound at the fan inletcondition.
When airflow velocity at a point approaches thespeed of sound, some blocking or choking effectsoccur that reduce the fan performance.
4.3 Fan performance curves
A fan performance curve is a graphic presentation ofthe performance of a fan. Usually it covers the entirerange from free delivery (no obstruction to airflow) tono delivery (an air tight system with no air flowing).One, or more, of the following characteristics may beplotted against volume airflow (Q).
Fan Static Pressure Ps
Fan Total Pressure Pt
Fan Power HFan Static Efficiency ηs
Fan Total Efficiency ηt
Air density (ρ), fan size (D), and fan rotational speed(N) are usually constant for the entire curve and mustbe stated.
A typical fan performance curve is shown in Figure4.1. Figure 4.2 illustrates examples of performancecurves for a variety of fan types.
9

SIZE 30 FAN AT N RPM
OPERATION ATSTANDARD DENSITY
PR
ES
SU
RE
, P
PO
WE
R, H
0
10
20
30
40
50
60
70
80
90
100
AIRFLOW, Q
Pt
Ps
η t
η s
H EFFI
CIE
NC
Y, η
PER
CEN
T
Figure 4.1 - Fan Performance Curve at N RPM
AMCA 201-02 (R2011)
10

AMCA 201-02 (R2011)
11
TYPE IMPELLER DESIGN HOUSING DESIGN
AIR
FOIL
BA
CK
WA
RD
-IN
CLI
NE
DB
AC
KW
AR
D-
CU
RV
ED
RA
DIA
LFO
RW
AR
D-
CU
RV
ED
PR
OP
ELL
ER
TUB
EA
XIA
L
AX
IAL
FAN
S
VAN
EA
XIA
L
CE
NTR
IFU
GA
L FA
NS
TUB
ULA
R
CE
NTR
IFU
GA
L
SP
EC
IAL
DE
SIG
NS
PO
WE
R R
OO
F V
EN
TILA
TOR
S
AX
IAL
CE
NTR
IFU
GA
L• Highest efficiency of all centrifugal fan designs.• Ten to 16 blades of airfoil contour curved away from direction of rotation. Deep blades allow for efficient expansion within blade passages• Air leaves impeller at velocity less than tip speed.• For given duty, has highest speed of centrifugal fan designs
• Scroll-type design for efficient conversion of velocity pressure to static pressure.• Maximum efficiency requires close clearance and alignment between wheel and inlet
• Uses same housing configuration as airfoil design.• Efficiency only slightly less than airfoil fan.• Ten to 16 single-thickness blades curved or inclined away from direction of rotation• Efficient for same reasons as airfoil fan.
• Scroll. Usually narrowest of all centrifugal designs.• Because wheel design is less efficient, housing dimensions are not as critical as for airfoil and backward-inclined fans.
• Higher pressure characteristics than airfoil, backward-curved, and backward-inclined fans.• Curve may have a break to left of peak pressure and fan should not be operated in this area.• Power rises continually to free delivery.
• Flatter pressure curve and lower efficiency than the airfoil, backward-curved, and backward-inclined.• Do not rate fan in the pressure curve dip to the left of peak pressure.• Power rises continually toward free delivery. Motor selection must take this into account.
• Scroll similar to and often identical to other centrifugal fan designs.• Fit between wheel and inlet not as critical as for airfoil and backward-inclined fans.
• Simple circular ring, orifice plate, or venturi.• Optimum design is close to blade tips and forms smooth airfoil into wheel.
• Cylindrical tube with close clearance to blade tips.
• Cylindrical tube with close clearance to blade tips.• Guide vanes upstream or downstream from impeller increase pressure capability and efficiency.
• Cylindrical tube similar to vaneaxial fan, except clearance to wheel is not as close.• Air discharges radially from wheel and turns 90° to flow through guide vanes.
• Normal housing not used, since air discharges from impeller in full circle.• Usually does not include configuration to recover velocity pressure component.
• Essentially a propeller fan mounted in a supporting structure• Hood protects fan from weather and acts as safety guard.• Air discharges from annular space at bottom of weather hood.
• Low efficiency.• Limited to low-pressure applications.• Usually low cost impellers have two or more blades of single thickness attached to relatively small hub.• Primary energy transfer by velocity pressure.
• Somewhat more efficient and capable of developing more useful static pressure than propeller fan.• Usually has 4 to 8 blades with airfoil or single- thickness cross section.• Hub usually less than transfer by velocity pressure.
• Good blade design gives medium- to high-pressure capability at good efficiency.• Most efficient of these fans have airfoil blades.• Blades may have fixed, adjustable, or controllable pitch.• Hub is usually greater than half fan tip diameter.
• Performance similar to backward-curved fan except capacity and pressure are lower.• Lower efficiency than backward-curved fan.• Performance curve may have a dip to the left of peak pressure.
• Low-pressure exhaust systems such as general factory, kitchen, warehouse, and some commercial installations.• Provides positive exhaust ventilation, which is an advantage over gravity-type exhaust units.• Centrifugal units are slightly quieter than axial units.
• Low-pressure exhaust systems such as general factory, kitchen, warehouse, and some commercial installations.• Provides positive exhaust ventilation, which is an advantage over gravity-type exhaust units.
R
M
A
B
R
M
Figure 4.2 - Types of FansAdapted with permission from 1996 ASHRAE Systems and Equipment Handbook (SI)

12
AMCA 201-02 (R2011)
Figure 4.2 - Types of FansAdapted with permission from 1996 ASHRAE Systems and Equipment Handbook (SI)
PERFORMANCE CHARACTERISTICS APPLICATIONSPERFORMANCE CURVES a
• Similar to airfoil fan, except peak efficiency slightly lower.
• Higher pressure characteristics than airfoil and backward- curved fans.• Pressure may drop suddenly at left of peak pressure, but this usually causes no problems.• Power rises continually to free delivery.
• Pressure curve less steep than that of backward-curved fans. Curve dips to left of peak pressure.• Highest efficiency to right of peak pressure at 40 to 50% of wide open volume.• Rate fan to right of peak pressure.• Account for power curve, which rises continually toward free delivery, when selecting motor.
• High flow rate, but very low-pressure capabilities.• Maximum efficiency reached near free delivery.• Discharge pattern circular and airstream swirls.
• High flow rate, medium-pressure capabilities.• Performance curve dips to left of peak pressure. Avoid operating fan in this region.• Discharge pattern circular and airstream rotates or swirls.
• High-pressure characteristics with medium-volume flow capabilities.• Performance curve dips to left of peak pressure due to aerodynamic stall. Avoid operating fan in this region.• Guide vanes correct circular motion imprated by wheel and improve pressure characteristics and efficiency of fan.
• Usually operated without ductwork; therefore, operates at very low pressure and high volume.• Only static pressure and static efficiency are shown for this fan.
• Usually operated without ductwork; therefore, operates at very low pressure and high volume.• Only static pressure and static efficiency are shown for this fan.
• Low-pressure exhaust systems, such as general factory, kitchen, warehouse, and some commercial installations.• Low first cost and low operating cost give an advantage over gravity flow exhaust systems.
• Has straight-through flow.
• Primarily for low-pressure, return air systems in HVAC applications.
• General HVAC systems in low-, medium-, and high-pressure applications where straight-through flow and compact installation are required.• Has good downstream air distribution• Used in industrial applications in place of tubeaxial fans.• More compact than centrifugal fans for same duty.
• Low-pressure exhaust systems, such as general factory, kitchen, warehouse, and some commercial installations.• Low first cost and low operating cost give an advantage over gravity flow exhaust systems.• Centrifugal units are somewhat quieter than axial flow units.
• Low- and medium-pressure ducted HVAC applications where air distribution downstream is not critical.• Used in some industrial applications, such as drying ovens, paint spray booths, and fume exhausts.
• For low-pressure, high-volume air moving applications, such as air circulation in a space or ventilation through a wall without ductwork.• Used for makeup air applications.
• Primarily for low-pressure HVAC applications, such as residential furnaces, central station units, and packaged air conditioners.
• Primarily for materials handling in industrial plants. Also for some high-pressure industrial requirements.• Rugged wheel is simple to repair in the field. Wheel sometimes coated with special material.• Not common for HVAC applications.
• Same heating, ventilating, and air-conditioning applications as airfoil fan.• Used in some industrial applications where airfoil blade may corrode or erode due to environment.
• General heating, ventilating, and air-conditioning applications.
• Highest efficiencies occur at 50 to 60% of wide open volume. This volume also has good pressure characteristics.• Power reaches maximum near peak efficiency and becomes lower, or self-limiting, toward free delivery.
• Performance similar to backward-curved fan, except capacity and pressure is lower.• Lower efficiency than backward-curved fan because air turns 90°.• Performance curve of some designs is similar to axial flow fan and dips to left of peak pressure.
PR
ES
SU
RE
-PO
WE
R
EFF
ICIE
NC
Y
VOLUME FLOW RATE, Q
10
108
8
6
4
2
0
6
4
2
00 2 4 6 8 10
PR
ES
SU
RE
-PO
WE
R
EFF
ICIE
NC
Y
VOLUME FLOW RATE, Q
10
108
8
6
4
2
0
6
4
2
00 2 4 6 8 10
PR
ES
SU
RE
-PO
WE
R
EFF
ICIE
NC
Y
VOLUME FLOW RATE, Q
10
108
8
6
4
2
0
6
4
2
00 2 4 6 8 10
PR
ES
SU
RE
-PO
WE
R
EFF
ICIE
NC
Y
VOLUME FLOW RATE, Q
10
108
8
6
4
2
0
6
4
2
00 2 4 6 8 10
PR
ES
SU
RE
-PO
WE
R
EFF
ICIE
NC
Y
VOLUME FLOW RATE, Q
10
108
8
6
4
2
0
6
4
2
00 2 4 6 8 10
PR
ES
SU
RE
-PO
WE
R
EFF
ICIE
NC
Y
VOLUME FLOW RATE, Q
10
108
8
6
4
2
0
6
4
2
00 2 4 6 8 10
PR
ES
SU
RE
-PO
WE
R
EFF
ICIE
NC
Y
VOLUME FLOW RATE, Q
10
108
8
6
4
2
0
6
4
2
00 2 4 6 8 10
PR
ES
SU
RE
-PO
WE
R
EFF
ICIE
NC
Y
VOLUME FLOW RATE, Q
10
108
8
6
4
2
0
6
4
2
00 2 4 6 8 10
PR
ES
SU
RE
-PO
WE
R
EFF
ICIE
NC
Y
VOLUME FLOW RATE, Q
10
108
8
6
4
2
0
6
4
2
00 2 4 6 8 10
PR
ES
SU
RE
-PO
WE
R
EFF
ICIE
NC
Y
VOLUME FLOW RATE, Q
10
108
8
6
4
2
0
6
4
2
00 2 4 6 8 10
Ps
Pt
ηt
ηs
wo
• Usually only applied to large systems, which may be low-, medium-, or high-pressure applications.• Applied to large, clean-air industrial operations for significant energy savings.
a: These performance curves reflect general characteristics of various fans as commonly applied. They are not intended to provide complete selection criteria, since other parameters, such as diameter and speed, are not defined.

13
AMCA 201-02 (R2011)
5. Catalog Performance Tables
5.1 Type A: Free inlet, free outlet fans
Fans designed for use other than with duct systemsare usually rated over a lower range of pressures.They are commonly cataloged and sold as acomplete unit with suitable drive and motor.
Typical fans in this group are propeller fans andpower roof ventilators. They are usually available indirect or belt-drive arrangements and performanceratings are published in a modified form of the multi-rating table. Figure 5.1 illustrates such a table for partof a line of belt-drive propeller fans.
5.2 Ducted fans
There are three types of ducted fans, as described inSection 3:
1) Type B: Free inlet, ducted outlet2) Type C: Ducted inlet, free outlet3) Type D: Ducted inlet, ducted outlet
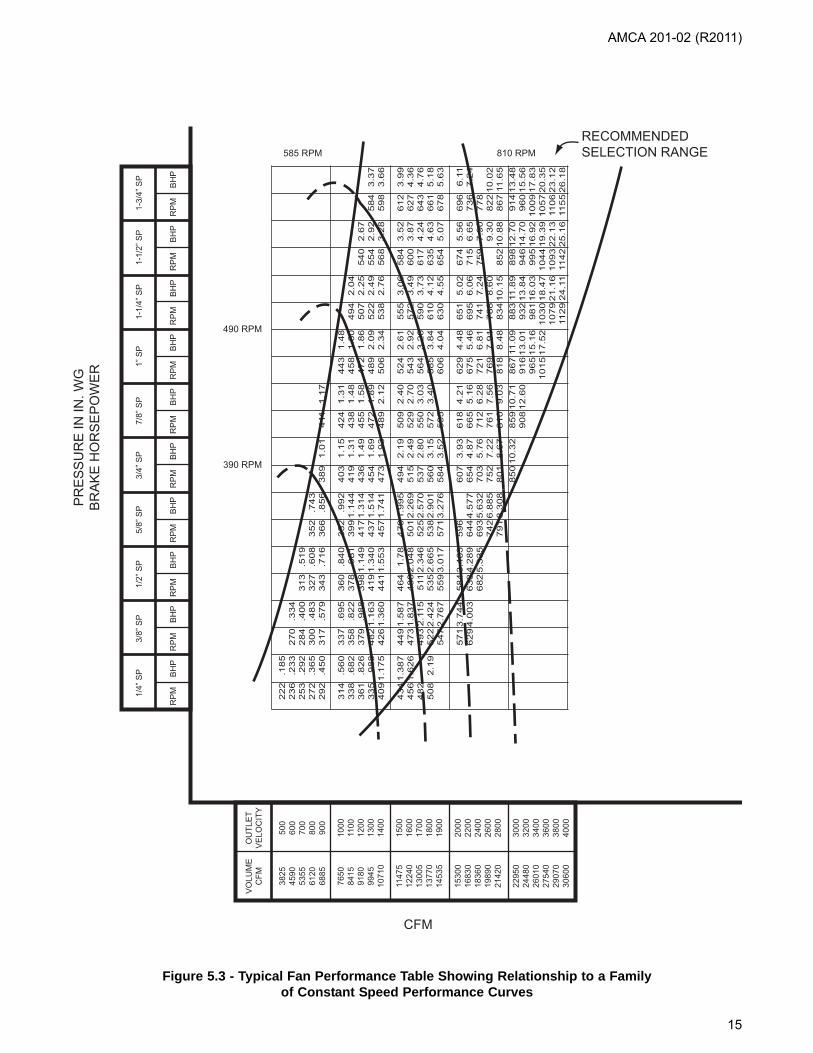
The performance of fans intended for use with ductsystems is usually published in the form of a "multi-rating" table. A typical multi-rating table, as illustratedin Figure 5.2 shows:
a) the speed (N) in rpmb) the power (H) in kw (hp)c) the fan static pressure (Ps) in Pa (in. wg)d) the outlet velocity (V) in m/s, (fpm)e) the airflow (Q) in m3/s (cfm)
Figure 5.3 shows constant speed characteristiccurves superimposed on a section of the multi-ratingtable for the same fan. A brief study of this figure willassist in understanding the relationship betweencurves and the multi-rating tables.
Figure 5.1 - Propeller Fan Performance Table
SIZE(cm)
No. ofBlades
MotorkW rpm Peak
kWAIRFLOW (m3/s) @ STATIC PRESSURE (Pa)
0 31 62 93 124 155 186 217 248
61 3
0.19 862 0.13 2.02 1.58 0.580.19 960 0.20 2.25 1.87 0.970.25 1071 0.27 2.51 2.18 1.76 0.760.37 1220 0.40 2.86 2.57 2.24 1.70 0.81
69 3
0.19 806 0.20 2.89 2.36 1.050.25 883 0.27 3.17 2.68 1.94 0.760.37 1035 0.43 3.71 3.30 2.85 1.56 0.950.56 1165 0.62 4.18 3.83 3.44 3.01 1.60 1.10
84 3
0.37 825 0.42 4.36 3.76 3.04 1.270.56 945 0.62 4.99 4.48 3.92 2.38 1.420.75 1045 0.82 5.23 5.08 4.57 4.01 2.31 1.521.12 1190 1.19 6.29 5.90 5.47 5.01 4.48 2.79 1.941.49 1306 1.64 6.91 6.53 6.15 5.75 5.32 4.81 3.05 2.24 1.84
SIZE(in.)
No. ofBlades
Motorhp rpm Peak
bhpAIRFLOW (ft3/min) @ STATIC PRESSURE (in. wg)
0 1/8 1/4 3/8 1/2 5/8 3/4 7/8 1
24 3
1/4 862 0.18 4,283 3,350 1,2301/4 960 0.27 4,770 3,960 2,0501/3 1071 0.36 5,321 4,620 3,730 1,6001/2 1220 0.54 6,062 5,450 4,750 3,600 1,710
27 3
1/4 806 0.27 6,123 4,990 2,2301/3 883 0.36 6,708 5,675 4,100 1,6201/2 1035 0.57 7,862 7,000 6,035 3,315 2,0203/4 1165 0.83 8,850 8,110 7,290 6,385 3,400 2,330
33 3
1/2 825 0.56 9,240 7,970 6,430 2,7003/4 945 0.83 10,580 9,500 8,300 5,040 3,0101 1045 1.1 11,710 10,755 9,685 8,490 4,890 3,215
1½ 1190 1.6 13,335 12,490 11,580 10,610 9,500 5,905 4,1002 1306 2.2 14,630 13,845 13,030 12,185 11,280 10,200 6,470 4,740 3,900
TYPICAL RATING TABLE FOR A SERIES OF BELT-DRIVEN PROPELLER FANS
TYPICAL RATING TABLE FOR A SERIES OF BELT-DRIVEN PROPELLER FANS

VolumeCFM
OutletVel.
(fpm)
1/4 in. wg 3/8 in. wg 1/2 in. wg 5/8 in. wg 3/4 in. wg 7/8 in. wg 1 in. wg 1-1/4 in. wg 1-1/2 in. wg
rpm bhp rpm bhp rpm bhp rpm bhp rpm bhp rpm bhp rpm bhp rpm bhp rpm bhp38254590535561206885
500600700800900
222236253272292
0.1850.2330.2920.3650.450
270284300317
0.3340.4000.4830.579
313327343
0.5190.6080.716
352366
0.7430.856 389 1.01 411 1.17
7650841591809945
10710
10001100120013001400
314338361385409
0.5600.6820.8260.9891.175
337358379402425
0.6950.8320.9881.1631.360
360378398419441
0.8400.9811.1491.3401.553
383399417437457
0.9921.1441.3141.5141.741
403419436454473
1.151.311.491.691.93
424438455472489
1.311.481.681.892.12
443458472489506
1.481.601.862.092.34
494507522538
2.042.252.492.76
540554568
2.672.923.20
1147512240130051377014535
15001600170018001900
434458483508
1.3871.6261.8952.191
449473498522547
1.5871.8372.1152.4242.767
464488511535559
1.7802.0482.3462.6653.017
479501525538571
1.9932.2692.5702.9013.275
494515537560584
2.192.492.803.153.52
509529550572595
2.402.703.033.403.78
524543564585606
2.612.923.263.644.04
555572590610630
3.063.393.734.124.55
584600617635654
3.523.874.244.635.07
1530016830183601989021420
20002200240026002800
571621
3.1444.003
585633682
3.4034.2895.335
595644693742791
3.6724.5775.6326.8858.308
607654703752801
3.934.875.967.228.67
618665712761810
4.215.166.287.569.03
629675721769818
4.485.466.617.919.40
651695741788834
5.026.067.248.60
10.15
674715759805852
5.566.657.909.30
10.88229502448026010275402907030600
300032003400360038004000
850 10.32 859908
10.7112.50
867916965
1015
11.0913.0115.1617.52
883932981
103010721129
11.8913.8416.0318.4721.1624.11
898946995
104410931142
12.7014.7016.9219.3922.1325.16
IMPELLER DIAMETER: 36.5 IN OUTLET AREA: 7.65 SQ FTTIP SPEED IN FPM: 9.56 × RPM MAXIMUM BHP: 18.3 × (RPM/1000)3
TYPICAL MULTISPEED RATING TABLE FOR A SINGLE WIDTH, SINGLE INLET CENTRIFUGAL FAN
Figure 5.2 - Centrifugal Fan Performance Tables
IMPELLER DIAMETER: 927 mm OUTLET AREA: .71 SQ METERSTIP SPEED IN m/s: .0485 × RPM MAXIMUM kW: 13.65 × (RPM/1000)3
Volume m3/s
OutletVel.
(m/s)
62 Pa 93 Pa 124 Pa 155 Pa 186 Pa 217 Pa 246 Pa 310 Pa 373 Pa
rpm kW rpm kW rpm kW rpm kW rpm kW rpm kW rpm kW rpm kW rpm kW1.812.172.532.893.25
2.553.063.564.074.58
222236253272292
0.140.170.220.270.34
270284300317
0.250.300.360.43
313327343
0.390.450.53
352366
0.550.64 389 0.75 411 0.87
3.613.974.334.695.06
5.085.596.106.617.13
314338361385409
0.420.510.620.740.88
337358379402426
0.520.620.740.871.01
360378398419441
0.630.730.861.001.16
382399417437457
0.740.850.981.131.30
403419436454473
0.860.981.111.261.44
424438455472489
0.981.101.251.411.58
443458472489506
1.101.191.391.561.74
494507522538
1.521.681.862.06
540554568
1.992.182.39
5.425.786.146.506.86
7.638.148.659.159.66
434458483508
1.031.211.411.63
449473498522547
1.181.371.581.812.06
464488511535559
1.331.531.751.992.25
479501525538571
1.491.691.922.162.44
494515537560584
1.631.862.092.352.62
509529550572595
1.792.012.262.542.82
524543564585606
1.952.182.432.713.01
555572590610630
2.282.532.783.073.39
584600617635654
2.622.893.163.453.78
7.227.948.679.3910.11
10.1711.1812.2113.2314.24
571621
2.342.99
585633682
2.543.203.98
595644693742791
2.743.414.205.136.20
607654703752801
2.933.634.445.386.47
616665712761810
3.143.854.685.646.73
629675721769818
3.344.074.935.907.01
651695741788834
3.744.525.406.417.57
674715759805852
4.154.965.896.948.11
10.8311.5512.2813.0013.7214.44
15.2516.2717.3018.3119.3220.34
850 7.70 859908
7.999.40
867916965
1015
8.279.7011.3013.06
883932981
103010721129
8.8710.3211.9513.7715.7817.98
898946995
104410931142
9.4710.9612.6214.4616.5018.76
TYPICAL MULTISPEED RATING TABLE FOR A SINGLE WIDTH, SINGLE INLET CENTRIFUGAL FAN
AMCA 201-02 (R2011)
14
222
236
253
272
292
.185
.233
.292
.365
.450
270
284
300
317
.334
.400
.483
.579
313
327
343
.51
9.6
08
.71
6352
366
.743
.856
389
1.0
1411
1.1
7
314
338
361
335
409
.560
.682
.826
.988
1.1
75
337
358
379
482
426
.695
.822
.988
1.1
63
1.3
60
360
378
398
419
441
.84
0.9
81
1.1
49
1.3
40
1.5
53
332
399
417
437
457
.992
1.1
44
1.3
14
1.5
14
1.7
41
403
419
436
454
473
1.1
51.3
11.4
91.6
91.9
3
424
438
455
472
489
1.3
11.4
81.5
81.8
92.1
2
443
458
472
489
506
1.4
81.6
01.8
62.0
92.3
4
494
507
522
538
2.0
42.2
52.4
92.7
6
540
554
568
2.6
72.9
23.2
8584
598
3.3
73.6
6
434
456
482
508
1.3
87
1.6
26
2.1
9
449
473
493
522
547
1.5
87
1.8
37
2.1
15
2.4
24
2.7
67
464
488
511
535
559
1.7
82.0
48
2.3
46
2.6
65
3.0
17
479
501
525
538
571
1.9
95
2.2
69
2.5
70
2.9
01
3.2
76
494
515
537
560
584
2.1
92.4
92.8
03.1
53.5
2
509
529
550
572
595
2.4
02.7
03.0
33.4
0
524
543
564
585
606
2.6
12.9
23.2
63.8
44.0
4
555
572
590
610
630
3.0
63.4
93.7
34.1
24.5
5
584
600
617
635
654
3.5
23.8
74.2
44.6
35.0
7
612
627
643
661
678
3.9
94.3
64.7
65.1
85.6
3
571
629
3.7
44
4.0
03
584
633
682
3.4
03
4.2
89
5.3
35
596
644
693
742
791
4.5
77
5.6
32
6.8
85
8.3
08
607
654
703
752
801
3.9
34.8
75.7
67.2
28.6
7
618
665
712
761
810
4.2
15.1
66.2
87.5
69.0
3
629
675
721
769
818
4.4
85.4
66.8
17.9
18.4
8
651
695
741
788
834
5.0
26.0
67.2
48.6
010.1
5
674
715
759
852
5.5
66.6
57.9
09.3
010.8
8
696
736
778
822
867
6.1
17.2
4
10.0
211
.65
850
10.3
2859
908
10.7
112.6
0867
916
965
10
15
11.0
913.0
115.1
617.5
2
883
932
981
1030
1079
1129
11.8
913.8
416.0
318.4
721.1
624.1
1
898
946
995
1044
1093
1142
12.7
014.7
016.9
219.3
922.1
325.1
6
914
960
10
09
1057
1106
1155
13.4
815.5
617.8
320.3
523.1
226.1
8
RECOMMENDEDSELECTION RANGE810 RPM585 RPM
490 RPM
390 RPM
PR
ES
SU
RE
IN IN
. WG
BR
AK
E H
OR
SE
PO
WE
R
VO
LUM
EC
FMO
UTL
ET
VE
LOC
ITY
500
600
700
800
900
1000
1100
1200
1300
1400
1500
1600
1700
1800
1900
2000
2200
2400
2600
2800
3000
3200
3400
3600
3800
4000
3825
4590
5355
6120
6885
7650
8415
9180
9945
1071
0
1147
512
240
1300
513
770
1453
5
1530
016
830
1836
019
890
2142
0
2295
024
480
2601
027
540
2907
030
600
CFM
1/4”
SP
3/8”
SP
1/2”
SP
5/8”
SP
3/4”
SP
7/8”
SP
1” S
P1-
1/4”
SP
1-1/
2” S
P1-
3/4”
SP
RP
MB
HP
RP
MB
HP
RP
MB
HP
RP
MB
HP
RP
MB
HP
RP
MB
HP
RP
MB
HP
RP
MB
HP
RP
MB
HP
RP
MB
HP
AMCA 201-02 (R2011)
15
Figure 5.3 - Typical Fan Performance Table Showing Relationship to a Family of Constant Speed Performance Curves

Most performance tables do not cover the completerange from no delivery to free delivery but cover onlythe typical operating range. Figure 5.4 illustrates therecommended performance range of a centrifugalfan. Comparison of Figure 5.4 with Figure 5.3 willshow that the published performance table alsocovers only the recommended performance range ofthe fan.
It should be remembered that fans are generallytested without obstructions in the inlet and outlet andwithout any optional airstream accessories in place.Catalog ratings will, therefore, usually apply only tothe bare fan with unobstructed inlet and outlet.
Fan performance adjustment factors for airstreamaccessories are normally available from either the fancatalog or the fan manufacturer.
Fans are usually tested in arrangement 1, or similar(see Figure 3.5). Rating tables will, therefore, alsoapply only to the tested arrangement. Allowances forthe effect of bearing supports used in otherarrangements should be obtained from themanufacturer if not shown in the catalog.
6. Air Systems
6.1 The system
An air system may consist simply of a fan withducting connected to either the inlet or outlet or toboth. A more complicated system may include a fan,ductwork, air control dampers, cooling coils, heatingcoils, filters, diffusers, sound attenuation, turningvanes, etc. See AMCA Publication 200 Air Systems,for more information.
6.2 Component losses
Every system has a combined resistance to airflowthat is usually different from every other system andis dependent upon the individual components in thesystem.
The determination of the "pressure loss" or"resistance to airflow," for the individual componentscan be obtained from the component manufacturers.The determination of pressure losses for ductworkdesign is well documented in standard handbookssuch as the ASHRAE Handbook of Fundamentals.
AIRFLOW
PRES
SUR
E
SELECTION NOT USUALLYRECOMMENDED IN THIS RANGE
SELECTIONNOT USUALLYRECOMMENDEDIN THIS RANGE
RECOMMENDEDSELECTION RANGE
PRESSURE
DUCT SYSTEM CURVE
DUCT SY
STEM
CURVE
Figure 5.4 - Recommended Performance Range of a Typical Centrifugal Fan
AMCA 201-02 (R2011)
16
In a later section, the effects of some systemcomponents and fan accessories on fan performanceare discussed. The System Effects presented willassist the system designer to determine fanselection.
6.3 The system curve
At a fixed airflow through a given air system acorresponding pressure loss, or resistance to thisairflow, will exist. If the airflow is changed, theresulting pressure loss, or resistance to airflow, willalso change. The relationship between airflowpressure and loss can vary as a function of type ofduct components, their interaction and the localvelocity magnitude. In many cases, typical ductsystems operate in the turbulent flow regime and thepressure loss can be approximated as a function ofvelocity (or airflow) squared. The simplifyingrelationship used in this publication governing thechange in pressure loss as a function of airflow for afixed system is:
Pc/P = (Qc/Q)2
A more through discussion of duct system pressurelosses can be found in AMCA Publication 200 AirSystems.
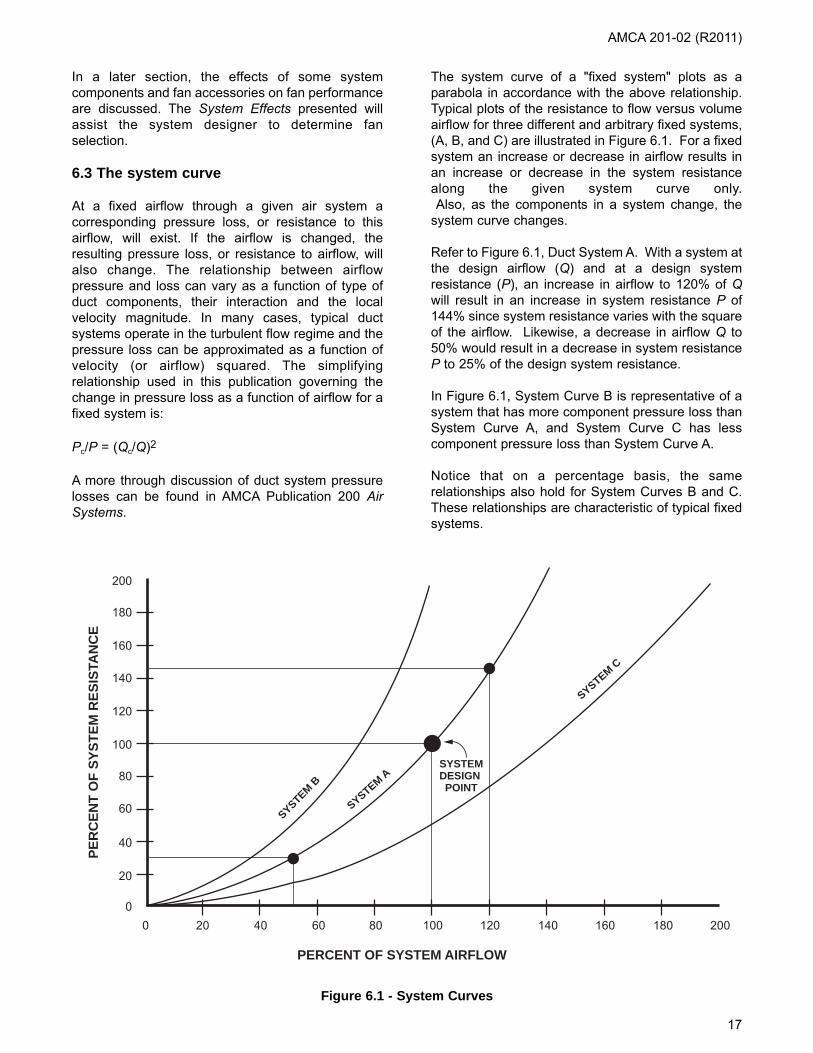
The system curve of a "fixed system" plots as aparabola in accordance with the above relationship.Typical plots of the resistance to flow versus volumeairflow for three different and arbitrary fixed systems,(A, B, and C) are illustrated in Figure 6.1. For a fixedsystem an increase or decrease in airflow results inan increase or decrease in the system resistancealong the given system curve only.Also, as the components in a system change, the
system curve changes.
Refer to Figure 6.1, Duct System A. With a system atthe design airflow (Q) and at a design systemresistance (P), an increase in airflow to 120% of Qwill result in an increase in system resistance P of144% since system resistance varies with the squareof the airflow. Likewise, a decrease in airflow Q to50% would result in a decrease in system resistanceP to 25% of the design system resistance.
In Figure 6.1, System Curve B is representative of asystem that has more component pressure loss thanSystem Curve A, and System Curve C has lesscomponent pressure loss than System Curve A.
Notice that on a percentage basis, the samerelationships also hold for System Curves B and C.These relationships are characteristic of typical fixedsystems.
SYSTEM B
SYSTEM A
SYSTEM C
PER
CEN
T O
F SY
STEM
RES
ISTA
NC
E
PERCENT OF SYSTEM AIRFLOW
0
20
40
60
80
100
120
140
160
180
200
020 40 60 80 100 120 140 160 180 200
SYSTEMDESIGN POINT
Figure 6.1 - System Curves
AMCA 201-02 (R2011)
17
6.4 Interaction of system curve and fanperformance curve
If the system characteristic curve, composed of theresistance to system airflow and the appropriate SEFhave been accurately determined, then the fan willdeliver the designated airflow when installed in thesystem.
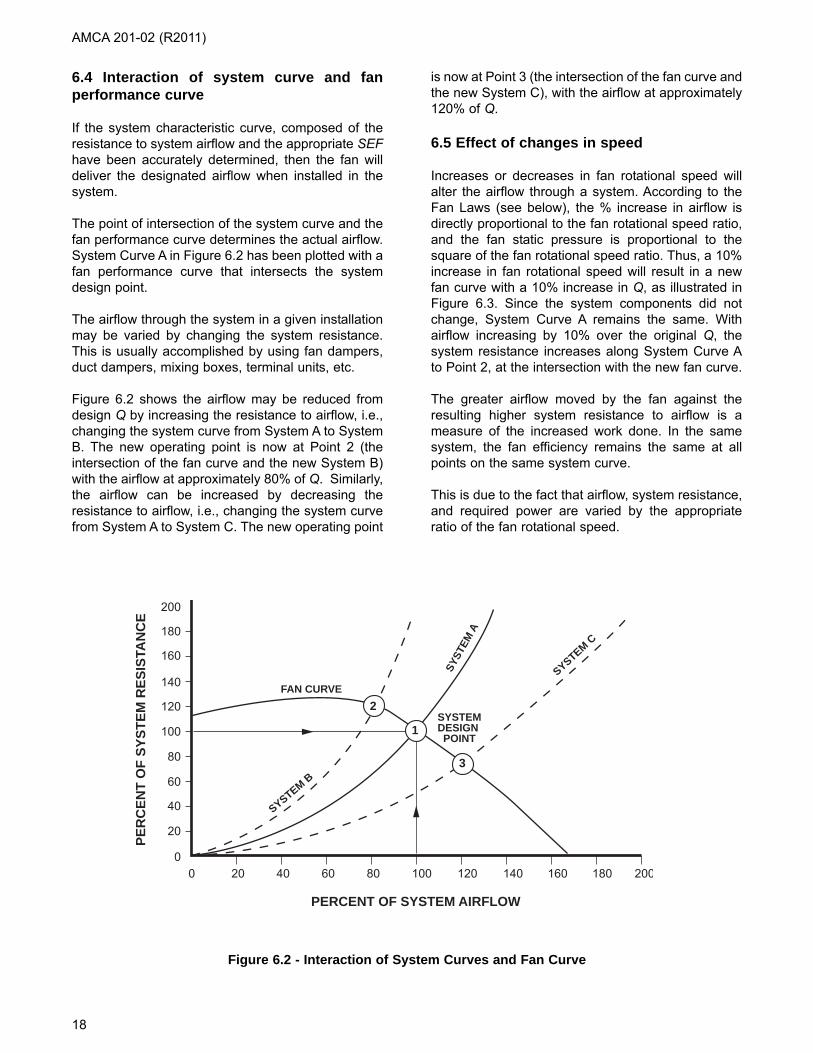
The point of intersection of the system curve and thefan performance curve determines the actual airflow.System Curve A in Figure 6.2 has been plotted with afan performance curve that intersects the systemdesign point.
The airflow through the system in a given installationmay be varied by changing the system resistance.This is usually accomplished by using fan dampers,duct dampers, mixing boxes, terminal units, etc.
Figure 6.2 shows the airflow may be reduced fromdesign Q by increasing the resistance to airflow, i.e.,changing the system curve from System A to SystemB. The new operating point is now at Point 2 (theintersection of the fan curve and the new System B)with the airflow at approximately 80% of Q. Similarly,the airflow can be increased by decreasing theresistance to airflow, i.e., changing the system curvefrom System A to System C. The new operating point
is now at Point 3 (the intersection of the fan curve andthe new System C), with the airflow at approximately120% of Q.
6.5 Effect of changes in speed
Increases or decreases in fan rotational speed willalter the airflow through a system. According to theFan Laws (see below), the % increase in airflow isdirectly proportional to the fan rotational speed ratio,and the fan static pressure is proportional to thesquare of the fan rotational speed ratio. Thus, a 10%increase in fan rotational speed will result in a newfan curve with a 10% increase in Q, as illustrated inFigure 6.3. Since the system components did notchange, System Curve A remains the same. Withairflow increasing by 10% over the original Q, thesystem resistance increases along System Curve Ato Point 2, at the intersection with the new fan curve.
The greater airflow moved by the fan against theresulting higher system resistance to airflow is ameasure of the increased work done. In the samesystem, the fan efficiency remains the same at allpoints on the same system curve.
This is due to the fact that airflow, system resistance,and required power are varied by the appropriateratio of the fan rotational speed.
2000
20
40
60
80
100
120
140
160
180
200
40 60 80 100 120 140 160 180 200
FAN CURVE
SYSTEM B
SYST
EM A
SYSTEM C
SYSTEMDESIGN POINT
1
2
3
PERCENT OF SYSTEM AIRFLOW
PER
CEN
T O
F SY
STEM
RES
ISTA
NC
E
Figure 6.2 - Interaction of System Curves and Fan Curve
AMCA 201-02 (R2011)
18

PERCENT OF SYSTEM AIRFLOW
PER
CEN
T O
F PO
WER
PER
CEN
T O
F SY
STEM
RES
ISTA
NC
E
00
20
40
60
80
100
120
140
160
20 40 60 80 100
100
133
50
120 140
110%
160 180 200
H (AT 1.1N)PRESSURES (AT 1.1N) DU
CT S
YSTE
M A
PRESSURES (AT N)
H (AT N)1
2
Figure 6.3 - Effect of 10% increase in Fan Speed
AMCA 201-02 (R2011)
6.5.1 Fan Laws - effect of change in speed - (fansize and air density remaining constant)
For the same size fan, Dc = D and, therefore, (Dc/D)= 1. When the air density does not vary, ρc = ρ andthe air density ratio (ρc/ρ) = 1. Kp is taken as equal tounity in this and following examples.
Qc = Q × (Nc/N)
Ptc = Pt × (Nc/N)2
Psc = Ps × (Nc/N)2
Pvc = Pv × (Nc/N)2
Hc = H × (Nc/N)3
6.6 Effect of density on system resistance
The resistance of a duct system is dependent uponthe density of the air flowing through the system. An
air density of 1.2 kg/m3 (0.075 lbm/ft3) is standard inthe fan industry throughout the world. Figure 6.4illustrates the effect on the fan performance of adensity variation from the standard value.
6.6.1 Fan Laws - effect of change in density - (fansize and speed remaining constant)
When the speed of the fan does not change, Nc = Nand, therefore, (Nc/N) = 1. The fan size is also fixed,Dc = D and therefore (Dc/D) = 1.
Qc = Q
Ptc = Pt × (ρc/ρ)
Psc = Ps × (ρc/ρ)
Pvc = Pv × (ρc/ρ)
Hc = H × (ρc/ρ)
19

0
00 20 40 60 80 100 120 140 160 180 200
20
40
60
80
100
20
40
60
80
100
PERCENT OF SYSTEM AIRFLOW
PER
CEN
T O
F PO
WER
PER
CEN
T O
F SY
STEM
RES
ISTA
NC
E A
ND
FA
N P
RES
SUR
E
POWER @ DENSITY ρ
FAN PRESSURE CURVE@ DENSITY ρ/2
FAN PRESSURE CURVE@ DENSITY ρ SYSTEM A
@ DENSITY ρFAN INLET
SYSTEM A@ DENSITY ρ/2
FAN INLET
POWER @ DENSITY ρ/2
Figure 6.4 - Density Effect
AMCA 201-02 (R2011)
20

CALCULATED SYSTEM CURVE
PEAK FAN PRESSURE
FAN PRESSURE CURVE
DESIGN AIRFLOW
DE
SIG
N R
ES
ISTA
NC
E
1
Figure 6.5 - Fan/System Curve at Design Point
AMCA 201-02 (R2011)
6.7 Fan and system interaction
When system pressure losses have been accuratelyestimated and desirable fan inlet and outletconditions have been provided, design airflow can beexpected, as illustrated in Figure 6.5. Note again thatthe intersection of the actual system curve and thefan curve determine the actual airflow. However,when system pressure losses have not beenaccurately estimated as in Figure 6.6, or whenundesirable fan inlet and outlet conditions exist as inFigure 6.7, design performance may not be obtained.
6.8 Effects of errors in estimating systemresistance
6.8.1 Higher system resistance. In Figure 6.6,System Curve B shows a situation where a systemhas greater resistance to airflow than designed(Curve A). This condition is generally a result ofinaccurate allowances of system resistance. Allpressure losses must be considered whencalculating system resistance or the actual systemwill be more restrictive to airflow than intended. This
condition results in an actual airflow at Point 2, whichis at a higher pressure and lower airflow than wasexpected.
If the actual duct system pressure loss is greater thandesign, an increase in fan speed may be necessaryto achieve Point 5, the design airflow.
CAUTION: Before increasing fan rotationalspeed, check with the fan manufacturer todetermine whether the fan rotational speed canbe safely increased. Also determine the expectedincrease in power. Since the power requiredincreases as the cube of the fan rotational speedratio, it is very easy to exceed the capacity of theexisting motor and that of the available electricalservice.
6.8.2 Lower system resistance. Curve C in Figure6.6 shows a system that has less resistance to airflowthan designed. This condition results in an actualairflow at Point 3, which is at a lower pressure andhigher airflow than was expected.
21

FAN PRESSURECURVE
CURVE B:ACTUAL SYSTEM
CURVE A:CALCULATED SYSTEM
CURVE CACTUAL SYSTEM
PEAK FANPRESSURE
ACTUAL SYSTEM RESISTANCEMORE THAN DESIGN
ACTUAL SYSTEMLESS THANDESIGN
DESIGN AIRFLOW
DE
SIG
N R
ES
ISTA
NC
E
5
1
2
4
3
Figure 6.6 - Fan/System Curve Not at Design Point
AMCA 201-02 (R2011)
6.9 Safety factors
It has been common practice among systemdesigners to add safety factors to the calculatedsystem resistance to account for the “unexpected”.In some cases, safety factors may compensate forresistance losses that were unaccounted for and theactual system will deliver the design airflow, Point 1,Figure 6.6. If the actual system resistance is lowerthan the design system resistance, including thesafety factors, the fan will run at Point 3 and delivermore airflow. This result may not be advantageousbecause the fan may be operating at a less efficientpoint on the fan’s performance curve and may requiremore power than a properly designed system. Underthese conditions, it may be desirable to reduce thefan performance to operate at Point 4 on Curve C,Figure 6.6. This may be accomplished by reducing
the fan speed, adjusting the variable inlet vane (VIV),if installed, or inlet dampers. The system resistancecould also be increased to Point 1 on Curve A, Figure6.6. The change in fan operating point should beevaluated carefully, since a change in fan powerconsumption may occur.
The system designer should also evaluate the fanperformance tolerance and system resistancetolerance to determine if the lower or upper limits ofthe probable airflow in the system are acceptable.The combination of these tolerances should beevaluated to ensure that the “high-side” systemresistance curve does not fall into the unstable rangeof performance. Operation in this area of the curveshould be avoided and precautions taken to ensureoperations outside of the unstable area, especially atthe highest expected system resistance.
22

AMCA 201-02 (R2011)
6.10 Deficient fan/system performance
The most common causes of deficient fan/systemperformance are improper fan inlet duct design, fanoutlet duct design, and fan installation into the ductsystem. Any one or a combination of these conditionsthat alter the aerodynamic characteristics of the airflowing through the fan such that the fan’s full airflowpotential, as tested in the laboratory and cataloged, isnot likely to be realized.
Other major causes of deficient performance are:
• The air performance characteristics of theinstalled system are significantly different fromthe system designer's intent (See Figure 6.6).This may be due to a change in the system byothers or unexpected behavior of the systemduring operation.
• The system design calculations did not includeadequate allowances for the effect of accessoriesand appurtenances (See Section 10).
• The fan selection was made without allowingfor the effect of appurtenances on the fan'sperformance (See Section 10).
• Dirty filters, dirty ducts, dirty coils, etc., willincrease the system resistance, andconsequently, reduce the airflow - oftensignificantly.
• The "performance" of the system has beendetermined by field measurement techniquesthat have a high degree of uncertainty.
Other "on-site" problems are listed in AMCAPublication 202 Troubleshooting, which includesdetailed checklists and recommendations for thecorrection of problems with the performance of airsystems.
6.11 Precautions to prevent deficientperformance
• Use appropriate allowances in the designcalculations when space or other factorsdictate the use of less than optimumarrangement of the fan outlet and inletconnections (See Sections 8 and 9).
• Design the connections between the fan andthe system to provide, as nearly as possible,uniform airflow conditions at the fan outlet andinlet connections (See Sections 8 and 9).
• Include adequate allowance for the effect of allaccessories and appurtenances on theperformance of the system and the fan. Ifpossible, obtain from the fan manufacturerdata on the effect of installed appurtenanceson the fan's performance (See Section 10).
• Use field measurement techniques that can beapplied effectively on the particular system.Be aware of the probable accuracy ofmeasurement and conditions that affect this.Refer to AMCA Publication 203 FieldPerformance Measurement of Fan Systems;for more precise measurement see AMCAStandard 803 Industrial Process/PowerGeneration Fans: Site Performance TestStandard. Also, refer to AABC NationalStandards, Chapter 8, Volume Measurements,Associated Air Balance Council, 5th Edition,1989.
6.12 System Effect
Figure 6.7 illustrates deficient fan/systemperformance resulting from one or more of theundesirable airflow conditions listed in Section 6.10.It is assumed that the system pressure losses, shownin system curve A, have been accurately determined,and a suitable fan selected for operation at Point 1.However, no allowance has been made for the effectof the system connections on the fan's performance.To account for this System Effect it will be necessaryto add a System Effect Factor (SEF) to the calculatedsystem pressure losses to determine the actualsystem curve. The SEF for any given configuration isvelocity dependent and will vary across a range ofairflow. This will be discussed in more detail inSection 7. (See Figure 7.1).
In Figure 6.7 the point of intersection between the fanperformance curve and the actual system curve B isPoint 4. The actual airflow will be deficient by thedifference 1-4. To achieve design airflow, a SEFequal to the pressure difference between Point 1 and2 should have been added to the calculated systempressure losses and the fan selected to operate atPoint 2. Note that because the System Effect isvelocity related, the difference represented betweenPoints 1 and 2 is greater than the difference betweenPoints 3 and 4.
The System Effect includes only the effect of thesystem configuration on the fan's performance.
23

AMCA 201-02 (R2011)
7. System Effect Factor (SEF)
A System Effect Factor is a value that accounts forthe effect of conditions adversely influencing fanperformance when installed in the air system.
7.1 System Effect Curves
Figure 7.1 shows a series of 19 System EffectCurves. By entering the chart at the appropriate airvelocity (on the abscissa), it is possible to readacross from any curve (to the ordinate) to find theSEF for a particular configuration.
24
AIRFLOWDEFICIENCY
SYSTEMEFFECT ATACTUAL AIRFLOW
FAN CATALOGPRESSURECURVE
SYSTEM EFFECT LOSSAT DESIGN AIRFLOW
CURVE ACALCULATED SYSTEMWITH NO ALLOWANCEFOR SYSTEM EFFECT
CURVE BACTUAL SYSTEMWITH SYSTEM EFFECT
DESIGN AIRFLOW
DE
SIG
N R
ES
ISTA
NC
E
1
2
4
3
Figure 6.7 - Deficient Fan/System Performance - System Effect Ignored

AIR VELOCITY, (m/s)
SYST
EM E
FFEC
T FA
CTO
R P
RES
SUR
E, P
a
(Air Density = 1.2 kg/m3)
1000
900
800
700
600
500
400
300
200
10090
80
70
60
50
40
30
202.5 3 4 5 6 7 8 9 10 20 30
X
W
V
U
T
S
R
Q
PONMLKJIHGF
Figure 7.1 - System Effect Curves (SI)
AMCA 201-02 (R2011)
25

AIR VELOCITY, ft/min × 100
SYST
EM E
FFEC
T FA
CTO
R -
PRES
SUR
E, in
. wg
50.1
0.15
0.2
0.25
0.3
0.4
0.5
0.6
0.7
0.8
0.91.0
1.5
2.0
2.5
3.0
4.0
5.0
6 7 8 9 10 15 20 25 30 40 50 60
FG H I J K L M N O
P
Q
R
S
T
U
V
W
X
(Air Density = 0.075 lbm/ft3)
Figure 7.1 - System Effect Curves (I-P)
AMCA 201-02 (R2011)
26

Table 7.1 - System Effect Coefficients
Curve in Dynamic PressureFigure 7.1 Loss Coefficient C
F 16.00G 14.20H 12.70I 11.40J 9.50K 7.90L 6.40M 4.50N 3.20O 2.50P 1.90Q 1.50R 1.20S 0.75T 0.50U 0.40V 0.25W 0.17X 0.10
SI
I-PSEF C V= ⎛
⎝⎜⎞⎠⎟1097
2
ρ
SEF C V= ⎛⎝⎜
⎞⎠⎟1 414
2
.ρ
AMCA 201-02 (R2011)
27
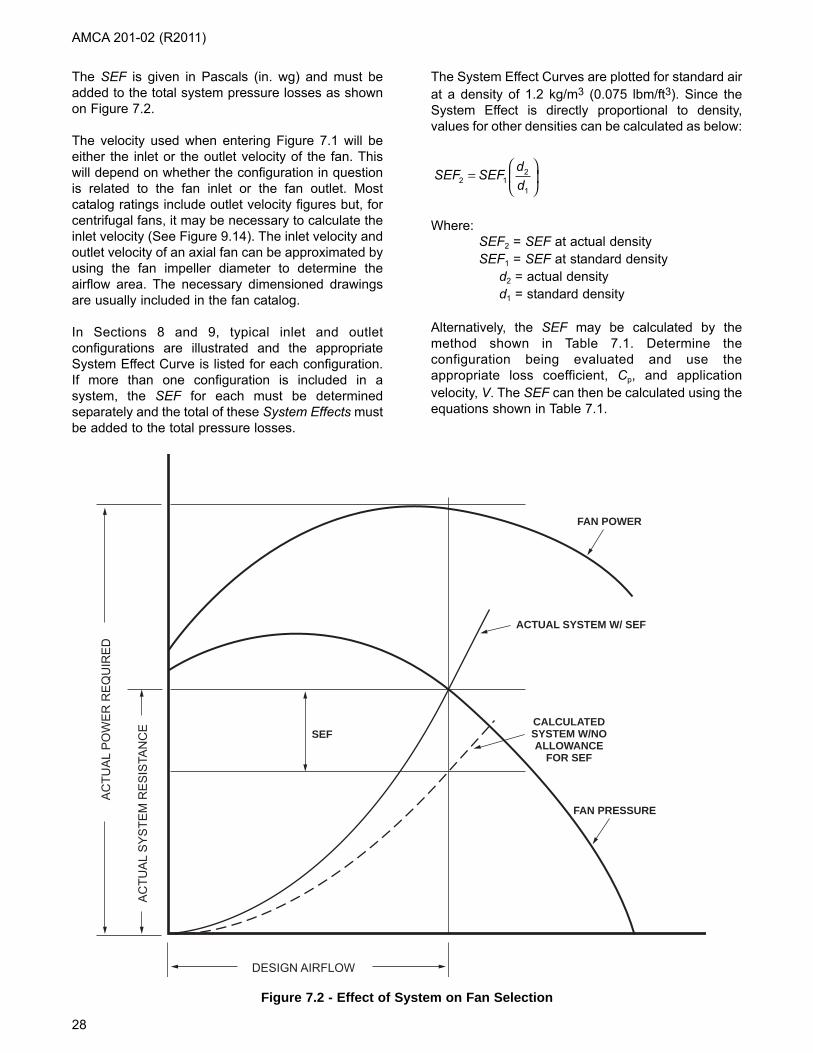
DESIGN AIRFLOW
AC
TUA
L S
YS
TEM
RE
SIS
TAN
CE
AC
TUA
L P
OW
ER
RE
QU
IRE
D
SEF
FAN POWER
FAN PRESSURE
ACTUAL SYSTEM W/ SEF
CALCULATEDSYSTEM W/NOALLOWANCE
FOR SEF
Figure 7.2 - Effect of System on Fan Selection
AMCA 201-02 (R2011)
The SEF is given in Pascals (in. wg) and must beadded to the total system pressure losses as shownon Figure 7.2.
The velocity used when entering Figure 7.1 will beeither the inlet or the outlet velocity of the fan. Thiswill depend on whether the configuration in questionis related to the fan inlet or the fan outlet. Mostcatalog ratings include outlet velocity figures but, forcentrifugal fans, it may be necessary to calculate theinlet velocity (See Figure 9.14). The inlet velocity andoutlet velocity of an axial fan can be approximated byusing the fan impeller diameter to determine theairflow area. The necessary dimensioned drawingsare usually included in the fan catalog.
In Sections 8 and 9, typical inlet and outletconfigurations are illustrated and the appropriateSystem Effect Curve is listed for each configuration.If more than one configuration is included in asystem, the SEF for each must be determinedseparately and the total of these System Effects mustbe added to the total pressure losses.
The System Effect Curves are plotted for standard airat a density of 1.2 kg/m3 (0.075 lbm/ft3). Since theSystem Effect is directly proportional to density,values for other densities can be calculated as below:
Where:SEF2 = SEF at actual densitySEF1 = SEF at standard density
d2 = actual densityd1 = standard density
Alternatively, the SEF may be calculated by themethod shown in Table 7.1. Determine theconfiguration being evaluated and use theappropriate loss coefficient, Cp, and applicationvelocity, V. The SEF can then be calculated using theequations shown in Table 7.1.
SEF SEF dd2 1
2
1
=⎛
⎝⎜
⎞
⎠⎟
28
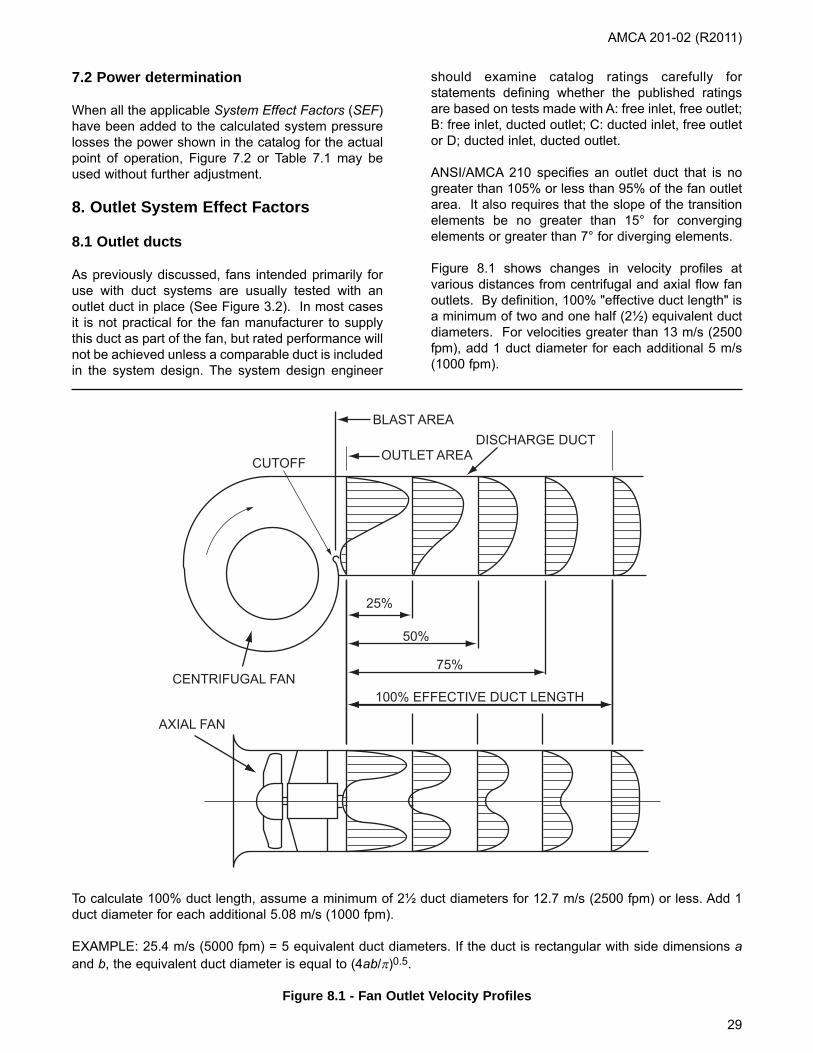
OUTLET AREA
BLAST AREA
CENTRIFUGAL FAN
AXIAL FAN
CUTOFF
DISCHARGE DUCT
25%
50%
75%
100% EFFECTIVE DUCT LENGTH
To calculate 100% duct length, assume a minimum of 2½ duct diameters for 12.7 m/s (2500 fpm) or less. Add 1duct diameter for each additional 5.08 m/s (1000 fpm).
EXAMPLE: 25.4 m/s (5000 fpm) = 5 equivalent duct diameters. If the duct is rectangular with side dimensions aand b, the equivalent duct diameter is equal to (4ab/π)0.5.
Figure 8.1 - Fan Outlet Velocity Profiles
AMCA 201-02 (R2011)
7.2 Power determination
When all the applicable System Effect Factors (SEF)have been added to the calculated system pressurelosses the power shown in the catalog for the actualpoint of operation, Figure 7.2 or Table 7.1 may beused without further adjustment.
8. Outlet System Effect Factors
8.1 Outlet ducts
As previously discussed, fans intended primarily foruse with duct systems are usually tested with anoutlet duct in place (See Figure 3.2). In most casesit is not practical for the fan manufacturer to supplythis duct as part of the fan, but rated performance willnot be achieved unless a comparable duct is includedin the system design. The system design engineer
should examine catalog ratings carefully forstatements defining whether the published ratingsare based on tests made with A: free inlet, free outlet;B: free inlet, ducted outlet; C: ducted inlet, free outletor D; ducted inlet, ducted outlet.
ANSI/AMCA 210 specifies an outlet duct that is nogreater than 105% or less than 95% of the fan outletarea. It also requires that the slope of the transitionelements be no greater than 15° for convergingelements or greater than 7° for diverging elements.
Figure 8.1 shows changes in velocity profiles atvarious distances from centrifugal and axial flow fanoutlets. By definition, 100% "effective duct length" isa minimum of two and one half (2½) equivalent ductdiameters. For velocities greater than 13 m/s (2500fpm), add 1 duct diameter for each additional 5 m/s(1000 fpm).
29

AXIAL FAN
100% EFFECTIVE DUCT LENGTH
Figure 8.2 - System Effect Curves for Outlet Ducts - Axial Fans
Tubeaxial Fan
Vaneaxial Fan
No Duct12%
Effective Duct
25%Effective
Duct
50 % Effective
Duct
100%Effective
Duct
--- --- --- --- ---
U V W --- ---
To calculate 100% duct length, assume a minimum of 2½ duct diameters for 12.7 m/s (2500 fpm) or less. Add 1duct diameter for each additional 5.08 m/s (1000 fpm).
EXAMPLE: 25.4 m/s (5000 fpm) = 5 equivalent duct diameters
Determine SEF by using Figure 7.1
AMCA 201-02 (R2011)
8.1.1 Axial flow fan - outlet ducts. Most exhaustaxial flow fans are tested and/or rated with two tothree equivalent duct diameters attached to the fanoutlet. Often, fans are installed without an outletduct, either because of available space or foreconomic reasons. Tubeaxial fans installed with nooutlet ducts have System Effect Factors (SEF)approaching zero.
Vaneaxial fans, however, do not perform ascataloged when they are installed with less than 50%"effective duct length." System Effect Curves fortubeaxial and vaneaxial fans with less than optimumoutlet duct are shown in Figure 8.2.
To determine the applicable SEF, calculate theaverage velocity in the outlet duct and enter theSystem Effect Curve (Figure 7.1) at this velocity,utilizing the appropriate System Effect Curveselected from Figure 8.2, then read over horizontallyto the System Effect Factor, Pascals (in. wg) on theordinate.
8.1.2 Centrifugal flow fan - outlet ducts.Centrifugal fans are sometimes installed with a lessthan optimum outlet duct. If it is not possible to use a
full-length outlet duct, then a SEF must be added tothe system resistance losses. System Effect Curvesfor centrifugal fans with less than optimum outlet ductlength are shown in Figure 8.3.
8.2 Outlet diffusers
Many air systems are space-constricted and must, ofnecessity, use relatively small ducts having highstatic pressure losses. If space is not severelyconstricted, the use of larger ductwork and movingair at a lower velocity may be beneficial. Largerductwork (within reason) reduces system pressurerequirements.
To effectively transition from a smaller duct size to alarger duct size it is necessary to use a connectionpiece between the duct sections that allows theairstream to expand gradually. This piece is called adiffuser, or evasé. These terms are usedinterchangeably in the industry. A properly designedevasé has a smooth and gradual transition betweenthe duct sizes so that airflow is relatively undisturbed.
An evasé operates on a very simple principle: airflowing from the smaller area to the larger area loses
30

OUTLET AREA
BLAST AREA
CENTRIFUGAL FAN
CUTOFF
DISCHARGE DUCT
100% EFFECTIVE DUCT LENGTH
To calculate 100% duct length, assume a minimum of 2½ duct diameters for 2500 fpm or less. Add 1 duct diameterfor each additional 1000 fpm.
EXAMPLE: 5000 fpm = 5 equivalent duct diameters. If the duct is rectangular with side dimensions a and b, theequivalent duct diameter is equal to (4ab/π)0.5.
Figure 8.3 - System Effect Curves for Outlet Ducts - Centrifugal Fans
No Duct 12% Effective Duct
25% Effective Duct
50% Effective Duct
100% Effective Duct
PressureRecovery 0% 50% 80% 90% 100%
Blast AreaOutlet Area System Effect Curve
0.40.50.60.70.80.91.0
PP
R-SS
T-UV-W—
R-SR-SS-TU
V-WW-X—
UU
U-VW-X
X——
WW
W-X————
———————
Determine SEF by using Figure 7.1
AMCA 201-02 (R2011)
velocity as it approaches the larger area, and aportion of the change (reduction) in velocity pressureis converted into static pressure. This process iscalled “static regain”, and is simply defined as theconversion of velocity pressure to static pressure.The efficiency of conversion (or loss of total pressure)will depend upon the angle of expansion, the lengthof the evasé section, and the blast area/outlet arearatio of the fan.
The fan manufacturer will, in most cases, be able toprovide design information for an efficient diffuser.
See AMCA Publication 200 Air Systems, for anexample showing the effect of a diffuser on a ductexit.
8.3 Outlet duct elbows
Values for pressure losses through elbows, which arepublished in handbooks and textbooks, are basedupon a uniform velocity profile at entry into the elbow.Any non-uniformity in the velocity profile ahead of theelbow will result in a pressure loss greater than theindustry-accepted value.
31
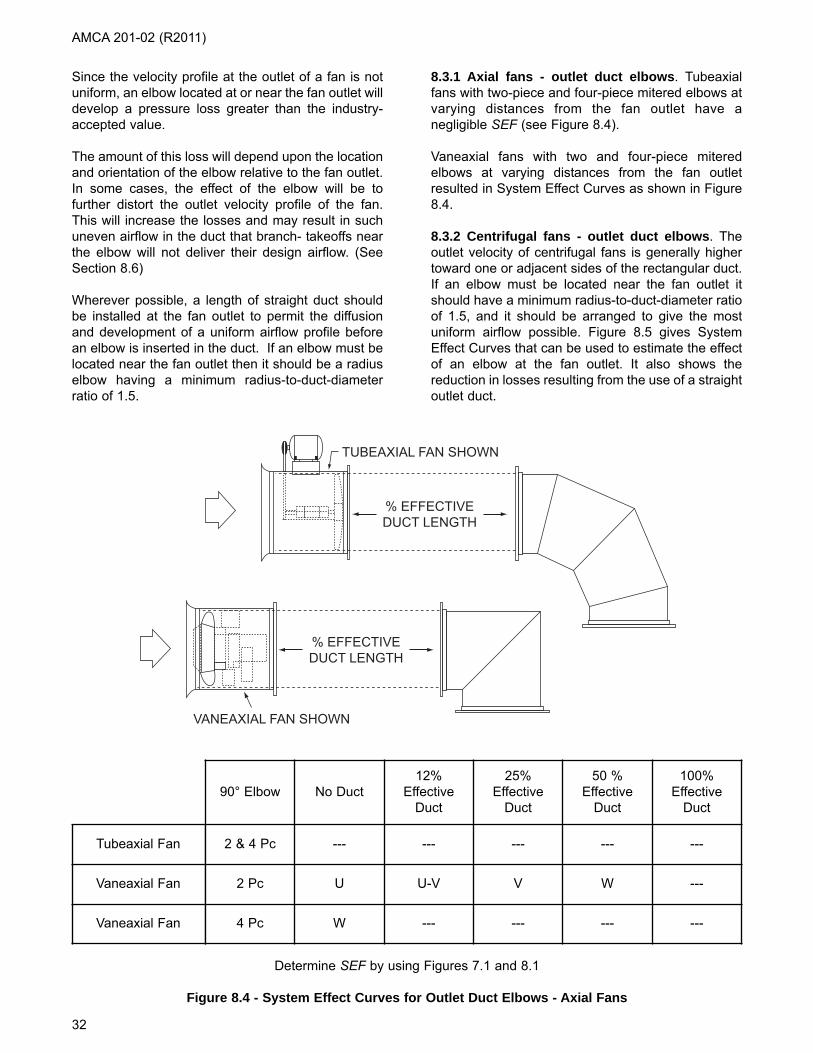
TUBEAXIAL FAN SHOWN
VANEAXIAL FAN SHOWN
% EFFECTIVEDUCT LENGTH
% EFFECTIVEDUCT LENGTH
Determine SEF by using Figures 7.1 and 8.1
Figure 8.4 - System Effect Curves for Outlet Duct Elbows - Axial Fans
Tubeaxial Fan
Vaneaxial Fan
Vaneaxial Fan
90° Elbow No Duct12%
Effective Duct
25%Effective
Duct
50 % Effective
Duct
100%Effective
Duct
2 & 4 Pc --- --- --- --- ---
2 Pc U U-V V W ---
4 Pc W --- --- --- ---
AMCA 201-02 (R2011)
Since the velocity profile at the outlet of a fan is notuniform, an elbow located at or near the fan outlet willdevelop a pressure loss greater than the industry-accepted value.
The amount of this loss will depend upon the locationand orientation of the elbow relative to the fan outlet.In some cases, the effect of the elbow will be tofurther distort the outlet velocity profile of the fan.This will increase the losses and may result in suchuneven airflow in the duct that branch- takeoffs nearthe elbow will not deliver their design airflow. (SeeSection 8.6)
Wherever possible, a length of straight duct shouldbe installed at the fan outlet to permit the diffusionand development of a uniform airflow profile beforean elbow is inserted in the duct. If an elbow must belocated near the fan outlet then it should be a radiuselbow having a minimum radius-to-duct-diameterratio of 1.5.
8.3.1 Axial fans - outlet duct elbows. Tubeaxialfans with two-piece and four-piece mitered elbows atvarying distances from the fan outlet have anegligible SEF (see Figure 8.4).
Vaneaxial fans with two and four-piece miteredelbows at varying distances from the fan outletresulted in System Effect Curves as shown in Figure8.4.
8.3.2 Centrifugal fans - outlet duct elbows. Theoutlet velocity of centrifugal fans is generally highertoward one or adjacent sides of the rectangular duct.If an elbow must be located near the fan outlet itshould have a minimum radius-to-duct-diameter ratioof 1.5, and it should be arranged to give the mostuniform airflow possible. Figure 8.5 gives SystemEffect Curves that can be used to estimate the effectof an elbow at the fan outlet. It also shows thereduction in losses resulting from the use of a straightoutlet duct.
32

POSITION C
POSITION D
POSITION B
POSITION A
SWSI CENTRIFUGAL FAN SHOWN
INLET
% EFFECTIVE
DUCT LENGTH
Note: Fan Inlet and elbow positions must be oriented as shown for the proper application of the table on the facingpage.
Figure 8.5 - Outlet Elbows on SWSI Centrifugal Fans
AMCA 201-02 (R2011)
33

Blast AreaOutlet Area
OutletElbow
Position
No OutletDuct
12%Effective
Duct
25%Effective
Duct
50%Effective
Duct
100%Effective
Duct
0.4
ABCD
NM-NL-ML-M
ONMM
P-QO-PNN
SR-SQQ
NO
Sys
tem
Effe
ct F
acto
r
0.5
ABCD
O-PN-OM-NM-N
P-QO-PNN
RQ
O-PO-P
TS-TR-SR-S
0.6
ABCD
QP
N-ON-O
Q-RQOO
SRQQ
UTSS
0.7
ABCD
R-SQ-R
PP
SR-SQQ
TS-TR-SR-S
VU-VTT
0.8
ABCD
SR-SQ-RQ-R
S-TSRR
T-UTSS
WV
U-VU-V
0.9
ABCD
TSRR
T-US-TSS
U-VT-US-TS-T
WWVV
1.0
ABCD
TS-TR-SR-S
T-UTSS
U-VUTT
WWVV
SYSTEM EFFECT CURVES FOR SWSI FANS
DETERMINE SEF BY USING FIGURES 7.1 AND 8.1
For DWDI fans determine SEF using the curve for SWSIfans. Then, apply the appropriate multiplier from thetabulation below
MULTIPLIERS FOR DWDI FANS
ELBOW POSITION A = ∆P × 1.00ELBOW POSITION B = ∆P × 1.25ELBOW POSITION C = ∆P × 1.00ELBOW POSITION D = ∆P × 0.85
Figure 8.5 - Outlet Elbows on SWSI Centrifugal Fans
AMCA 201-02 (R2011)
34
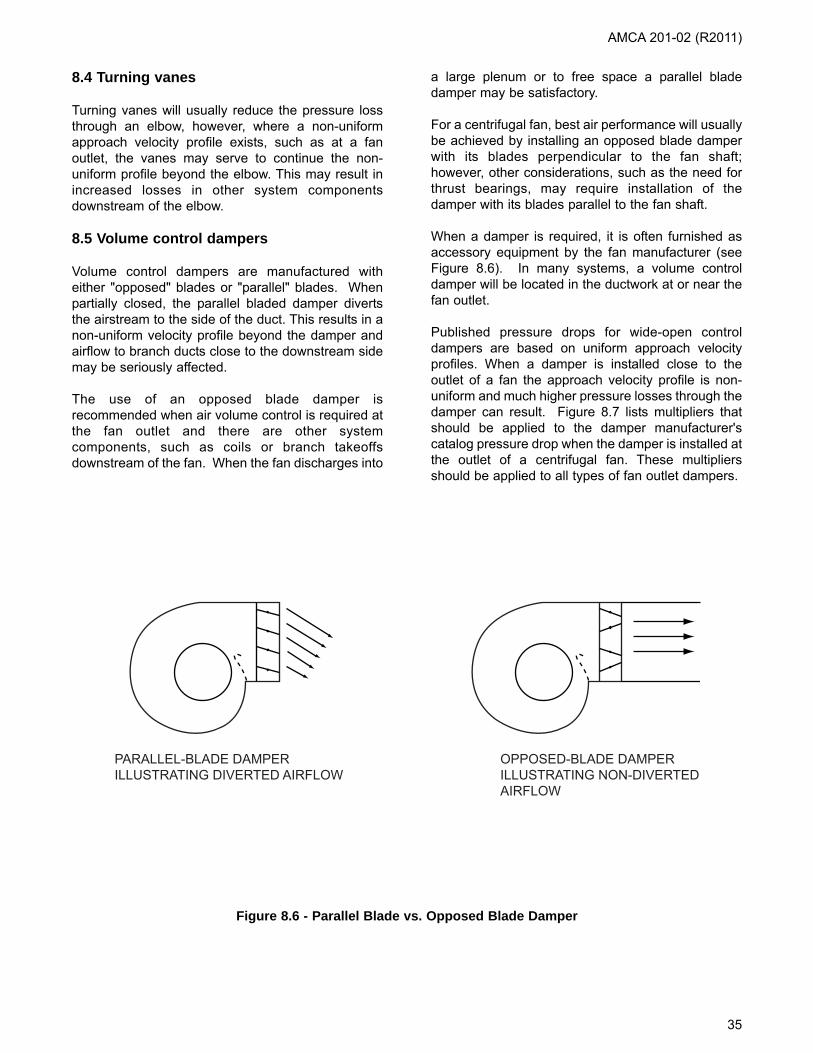
PARALLEL-BLADE DAMPERILLUSTRATING DIVERTED AIRFLOW
OPPOSED-BLADE DAMPERILLUSTRATING NON-DIVERTEDAIRFLOW
Figure 8.6 - Parallel Blade vs. Opposed Blade Damper
AMCA 201-02 (R2011)
8.4 Turning vanes
Turning vanes will usually reduce the pressure lossthrough an elbow, however, where a non-uniformapproach velocity profile exists, such as at a fanoutlet, the vanes may serve to continue the non-uniform profile beyond the elbow. This may result inincreased losses in other system componentsdownstream of the elbow.
8.5 Volume control dampers
Volume control dampers are manufactured witheither "opposed" blades or "parallel" blades. Whenpartially closed, the parallel bladed damper divertsthe airstream to the side of the duct. This results in anon-uniform velocity profile beyond the damper andairflow to branch ducts close to the downstream sidemay be seriously affected.
The use of an opposed blade damper isrecommended when air volume control is required atthe fan outlet and there are other systemcomponents, such as coils or branch takeoffsdownstream of the fan. When the fan discharges into
a large plenum or to free space a parallel bladedamper may be satisfactory.
For a centrifugal fan, best air performance will usuallybe achieved by installing an opposed blade damperwith its blades perpendicular to the fan shaft;however, other considerations, such as the need forthrust bearings, may require installation of thedamper with its blades parallel to the fan shaft.
When a damper is required, it is often furnished asaccessory equipment by the fan manufacturer (seeFigure 8.6). In many systems, a volume controldamper will be located in the ductwork at or near thefan outlet.
Published pressure drops for wide-open controldampers are based on uniform approach velocityprofiles. When a damper is installed close to theoutlet of a fan the approach velocity profile is non-uniform and much higher pressure losses through thedamper can result. Figure 8.7 lists multipliers thatshould be applied to the damper manufacturer'scatalog pressure drop when the damper is installed atthe outlet of a centrifugal fan. These multipliersshould be applied to all types of fan outlet dampers.
35

VOLUME CONTROL DAMPER
Figure 8.7 - Pressure Drop Multipliers for Volume Control Dampers on a Fan Discharge
BLAST AREA PRESSURE DROPOUTLET AREA MULTIPLIER
0.4 7.5
0.5 4.8
0.6 3.3
0.7 2.4
0.8 1.9
0.9 1.5
1.0 1.2
AMCA 201-02 (R2011)
36

Note: Avoid location of split or duct branch close to fan discharge. Provide a straight section of duct to allow for airdiffusion.
Figure 8.8 - Branches Located Too Close to Fan
AMCA 201-02 (R2011)
8.6 Duct branches
Standard procedures for the design of duct systemsare based on the assumption of uniform airflowprofiles in the system.
In Figure 8.8 branch takeoffs or splits are locatedclose to the fan outlet. Non-uniform airflow conditionswill exist and pressure loss and airflow may varywidely from the design intent. Wherever possible alength of straight duct should be installed betweenthe fan outlet and any split or branch takeoff.
37
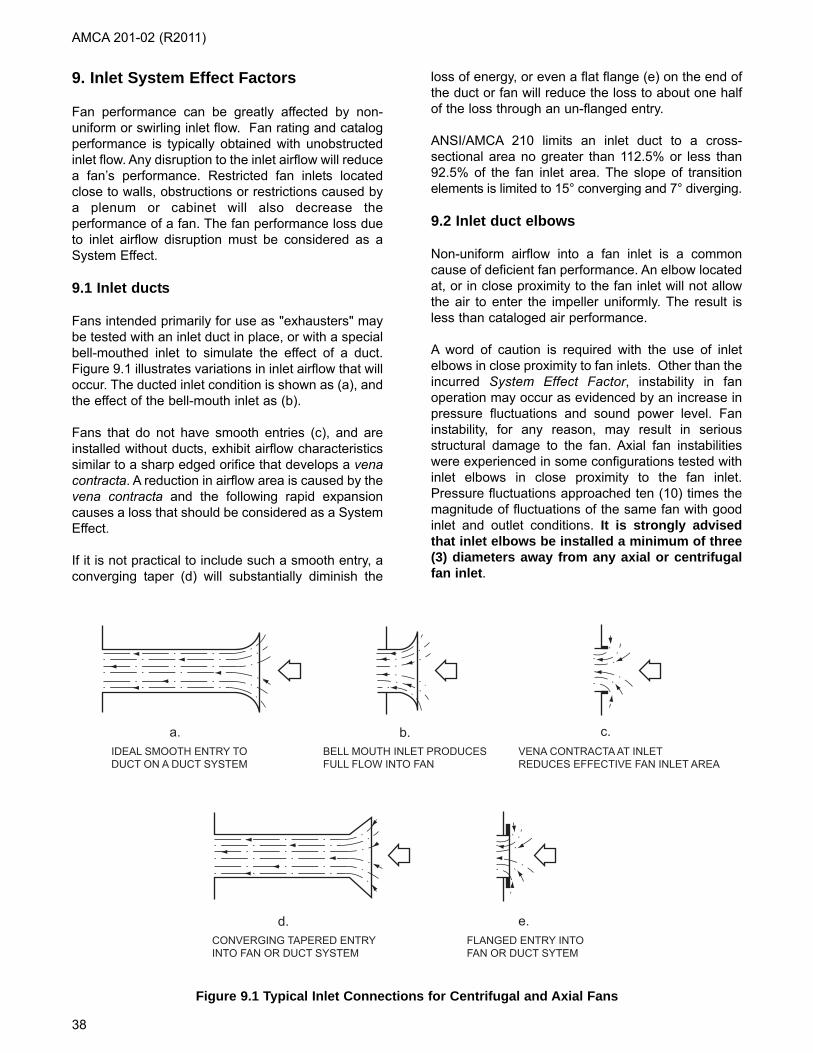
Figure 9.1 Typical Inlet Connections for Centrifugal and Axial Fans
CONVERGING TAPERED ENTRYINTO FAN OR DUCT SYSTEM
FLANGED ENTRY INTOFAN OR DUCT SYTEM
IDEAL SMOOTH ENTRY TODUCT ON A DUCT SYSTEM
a.BELL MOUTH INLET PRODUCESFULL FLOW INTO FAN
b.VENA CONTRACTA AT INLETREDUCES EFFECTIVE FAN INLET AREA
c.
e.d.
AMCA 201-02 (R2011)
9. Inlet System Effect Factors
Fan performance can be greatly affected by non-uniform or swirling inlet flow. Fan rating and catalogperformance is typically obtained with unobstructedinlet flow. Any disruption to the inlet airflow will reducea fan’s performance. Restricted fan inlets locatedclose to walls, obstructions or restrictions caused bya plenum or cabinet will also decrease theperformance of a fan. The fan performance loss dueto inlet airflow disruption must be considered as aSystem Effect.
9.1 Inlet ducts
Fans intended primarily for use as "exhausters" maybe tested with an inlet duct in place, or with a specialbell-mouthed inlet to simulate the effect of a duct.Figure 9.1 illustrates variations in inlet airflow that willoccur. The ducted inlet condition is shown as (a), andthe effect of the bell-mouth inlet as (b).
Fans that do not have smooth entries (c), and areinstalled without ducts, exhibit airflow characteristicssimilar to a sharp edged orifice that develops a venacontracta. A reduction in airflow area is caused by thevena contracta and the following rapid expansioncauses a loss that should be considered as a SystemEffect.
If it is not practical to include such a smooth entry, aconverging taper (d) will substantially diminish the
loss of energy, or even a flat flange (e) on the end ofthe duct or fan will reduce the loss to about one halfof the loss through an un-flanged entry.
ANSI/AMCA 210 limits an inlet duct to a cross-sectional area no greater than 112.5% or less than92.5% of the fan inlet area. The slope of transitionelements is limited to 15° converging and 7° diverging.
9.2 Inlet duct elbows
Non-uniform airflow into a fan inlet is a commoncause of deficient fan performance. An elbow locatedat, or in close proximity to the fan inlet will not allowthe air to enter the impeller uniformly. The result isless than cataloged air performance.
A word of caution is required with the use of inletelbows in close proximity to fan inlets. Other than theincurred System Effect Factor, instability in fanoperation may occur as evidenced by an increase inpressure fluctuations and sound power level. Faninstability, for any reason, may result in seriousstructural damage to the fan. Axial fan instabilitieswere experienced in some configurations tested withinlet elbows in close proximity to the fan inlet.Pressure fluctuations approached ten (10) times themagnitude of fluctuations of the same fan with goodinlet and outlet conditions. It is strongly advisedthat inlet elbows be installed a minimum of three(3) diameters away from any axial or centrifugalfan inlet.
38

DUCT LENGTH
DUCT LENGTH
VANEAXIAL FAN SHOWN
TUBEAXIAL FAN SHOWN
H/T 90° Elbow No Duct [1][2] 0.5D [1][2] 1.0D [1][2] 3.0D
Tubeaxial Fan .25 2 piece U V W ---
Tubeaxial Fan .25 4 piece X --- --- ---
Tubeaxial Fan .35 2 piece V W X
Vaneaxial Fan .61 2 piece Q-R Q-R S-T T-U
Vaneaxial Fan .61 4 piece W W-X --- ---
Notes:
[1] Instability in fan operation may occur as evidenced by an increase in pressure fluctuations and sound level.Fan instability, for any reason, may result in serious structural damage to the fan.
[2] The data presented in Figure 9.2 is representative of commercial type tubeaxial and vaneaxial fans, i.e. 60%to 70% fan static efficiency.
Figure 9.2 - System Effect Curves for Inlet Duct Elbows - Axial Fans
AMCA 201-02 (R2011)
9.2.1 Axial fans - inlet duct elbows. The SystemEffect Curves shown in Figure 9.2 for tubeaxial andvaneaxial fans are the result of tests run with two andfour piece mitered inlet elbows at or in close proximityto the fan inlets. Other variables tested included hub-to-tip (H/T) ratio and blade solidity. The number ofblades did not have a significant affect on the inletelbow SEF.
9.2.2 Centrifugal fans - inlet duct elbows. Non-uniform airflow into a fan inlet, Figure 9.3A, is acommon cause of deficient fan performance.The System Effect Curves for mitered 90° round
section elbows of given radius/diameter (R/D) ratios
are listed on Figure 9.4, and the System EffectCurves for various square duct elbows of givenradius/diameter ratios are listed on Figure 9.5. TheSEF for a particular elbow is found in Figure 7.1 atthe intersection of the average fan inlet velocity andthe tabulated System Effect Curve.
This pressure loss should be added to the friction anddynamic losses already determined for the particularelbow. Note that when duct turning vanes and/or asuitable length of duct is used (three to eightdiameters long, depending on velocities) between thefan inlet and the elbow, the SEF is not as great.These improvements help maintain uniform airflow
39
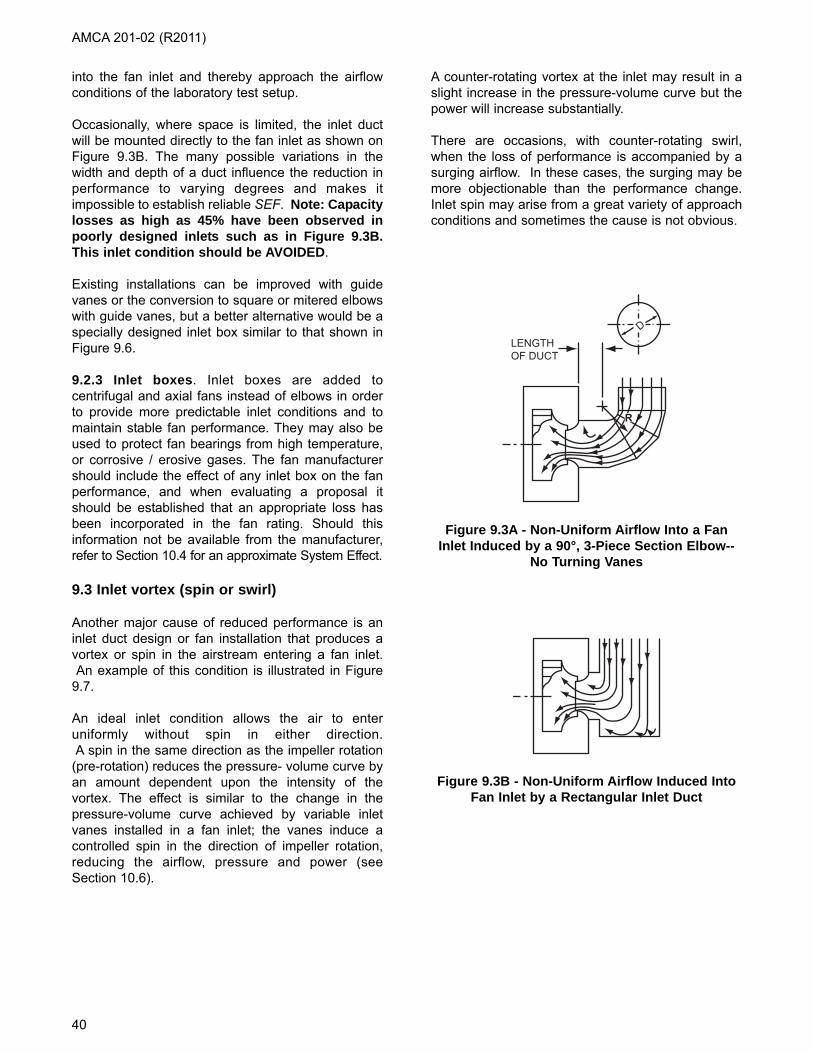
40
into the fan inlet and thereby approach the airflowconditions of the laboratory test setup.
Occasionally, where space is limited, the inlet ductwill be mounted directly to the fan inlet as shown onFigure 9.3B. The many possible variations in thewidth and depth of a duct influence the reduction inperformance to varying degrees and makes itimpossible to establish reliable SEF. Note: Capacitylosses as high as 45% have been observed inpoorly designed inlets such as in Figure 9.3B.This inlet condition should be AVOIDED.
Existing installations can be improved with guidevanes or the conversion to square or mitered elbowswith guide vanes, but a better alternative would be aspecially designed inlet box similar to that shown inFigure 9.6.
9.2.3 Inlet boxes. Inlet boxes are added tocentrifugal and axial fans instead of elbows in orderto provide more predictable inlet conditions and tomaintain stable fan performance. They may also beused to protect fan bearings from high temperature,or corrosive / erosive gases. The fan manufacturershould include the effect of any inlet box on the fanperformance, and when evaluating a proposal itshould be established that an appropriate loss hasbeen incorporated in the fan rating. Should thisinformation not be available from the manufacturer,refer to Section 10.4 for an approximate System Effect.
9.3 Inlet vortex (spin or swirl)
Another major cause of reduced performance is aninlet duct design or fan installation that produces avortex or spin in the airstream entering a fan inlet.An example of this condition is illustrated in Figure
9.7.
An ideal inlet condition allows the air to enteruniformly without spin in either direction.A spin in the same direction as the impeller rotation
(pre-rotation) reduces the pressure- volume curve byan amount dependent upon the intensity of thevortex. The effect is similar to the change in thepressure-volume curve achieved by variable inletvanes installed in a fan inlet; the vanes induce acontrolled spin in the direction of impeller rotation,reducing the airflow, pressure and power (seeSection 10.6).
A counter-rotating vortex at the inlet may result in aslight increase in the pressure-volume curve but thepower will increase substantially.
There are occasions, with counter-rotating swirl,when the loss of performance is accompanied by asurging airflow. In these cases, the surging may bemore objectionable than the performance change.Inlet spin may arise from a great variety of approachconditions and sometimes the cause is not obvious.
Figure 9.3A - Non-Uniform Airflow Into a FanInlet Induced by a 90°, 3-Piece Section Elbow--
No Turning Vanes
Figure 9.3B - Non-Uniform Airflow Induced IntoFan Inlet by a Rectangular Inlet Duct
LENGTHOF DUCT
D
R
AMCA 201-02 (R2011)

41
AMCA 201-02 (R2011)
LENGTHOF DUCT
R
D
+
LENGTHOF DUCT
D
R
+
LENGTHOF DUCT D
R
+
DETERMINE SEF BY USING FIGURE 7.1
Figure 9.4 - System Effect Curves for Various Mitered Elbows without Turing Vanes
Figure 9.4A - Two Piece Mitered 90° Round Section Elbow - Not Vaned
Figure 9.4B - Three Piece Mitered 90° Round Section Elbow - Not Vaned
Figure 9.4C - Four or More Piece Mitered 90° Round Section Elbow - Not Vaned
SYSTEM EFFECT CURVES
R/D NO 2D 5DDUCT DUCT DUCT
— N P R-S
SYSTEM EFFECT CURVES
R/D NO 2D 5DDUCT DUCT DUCT
0.5 O Q S
0.75 Q R-S T-U
1.0 R S-T U-V
2.0 R-S T U-V
3.0 S T-U V
SYSTEM EFFECT CURVES
R/D NO 2D 5DDUCT DUCT DUCT
0.5 P-Q R-S T
0.75 Q-R S U
1.0 R S-T U-V
2.0 R-S T U-V
3.0 S-T U V-W
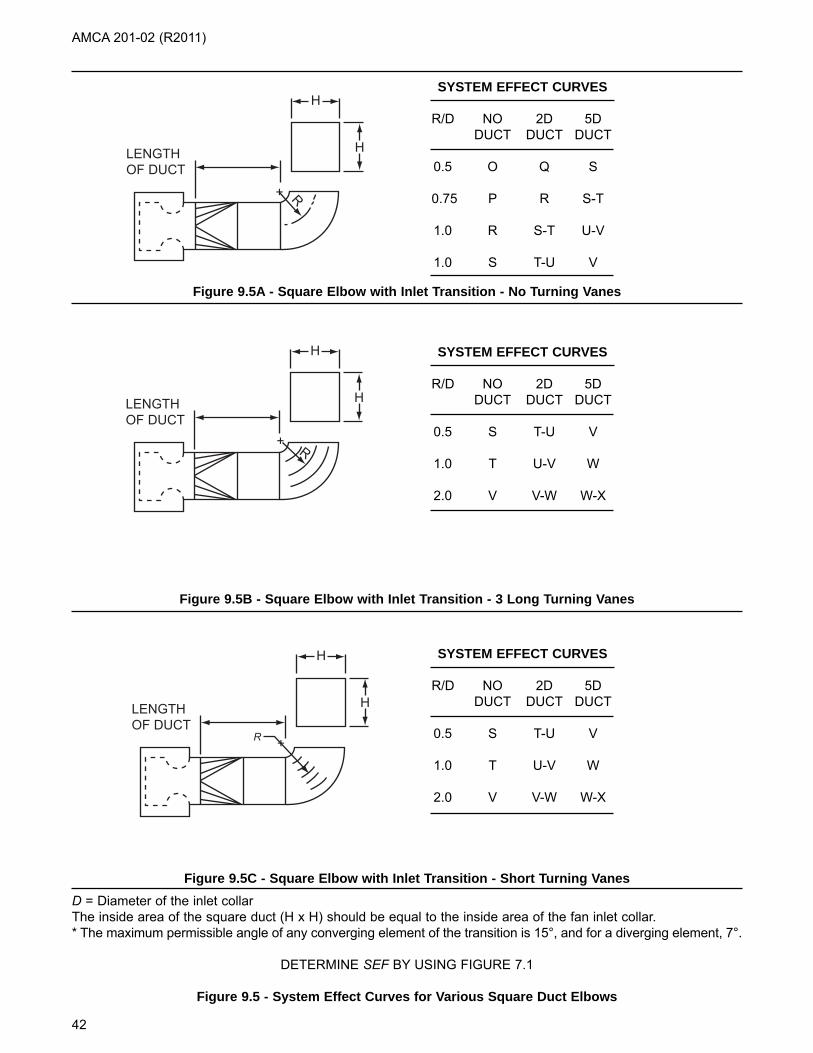
D = Diameter of the inlet collarThe inside area of the square duct (H x H) should be equal to the inside area of the fan inlet collar.* The maximum permissible angle of any converging element of the transition is 15°, and for a diverging element, 7°.
DETERMINE SEF BY USING FIGURE 7.1
Figure 9.5 - System Effect Curves for Various Square Duct Elbows
H
H
+ R
LENGTHOF DUCT
H
H
+ R
LENGTHOF DUCT
H
H
+
LENGTHOF DUCT
R
SYSTEM EFFECT CURVES
R/D NO 2D 5DDUCT DUCT DUCT
0.5 O Q S
0.75 P R S-T
1.0 R S-T U-V
1.0 S T-U V
SYSTEM EFFECT CURVES
R/D NO 2D 5DDUCT DUCT DUCT
0.5 S T-U V
1.0 T U-V W
2.0 V V-W W-X
SYSTEM EFFECT CURVES
R/D NO 2D 5DDUCT DUCT DUCT
0.5 S T-U V
1.0 T U-V W
2.0 V V-W W-X
Figure 9.5B - Square Elbow with Inlet Transition - 3 Long Turning Vanes
Figure 9.5A - Square Elbow with Inlet Transition - No Turning Vanes
Figure 9.5C - Square Elbow with Inlet Transition - Short Turning Vanes
AMCA 201-02 (R2011)
42
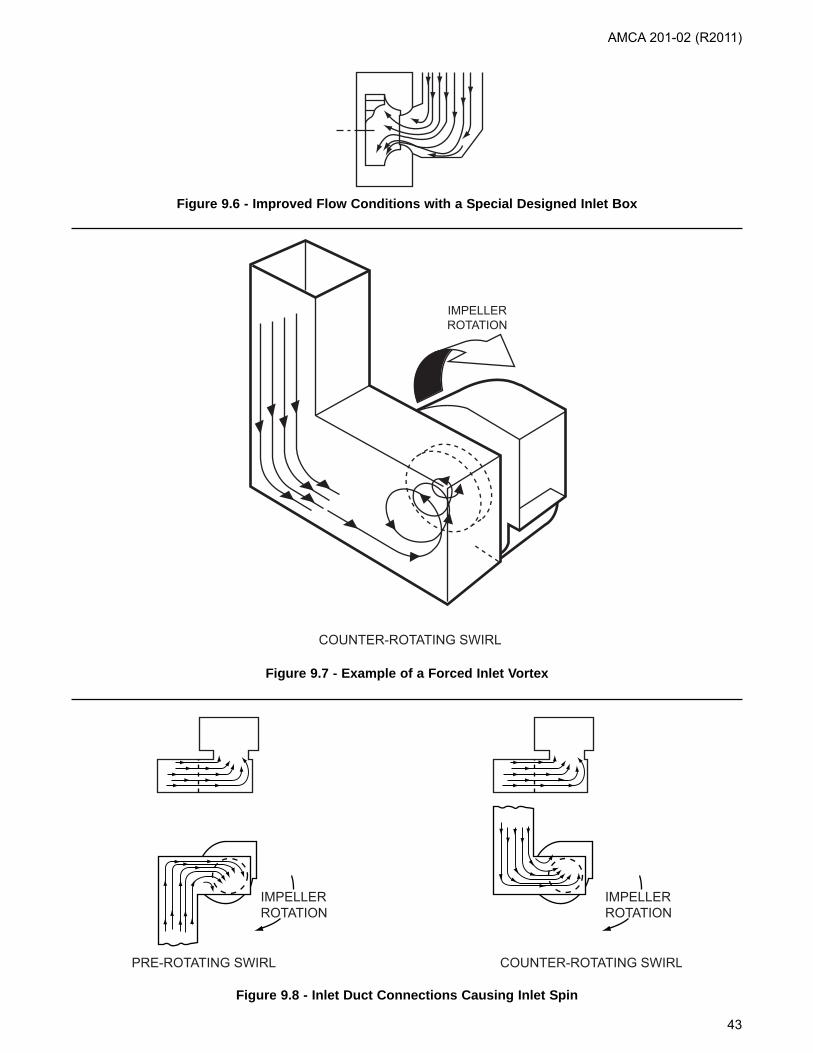
IMPELLERROTATION
COUNTER-ROTATING SWIRL
Figure 9.7 - Example of a Forced Inlet Vortex
Figure 9.8 - Inlet Duct Connections Causing Inlet Spin
IMPELLERROTATION
IMPELLERROTATION
PRE-ROTATING SWIRL COUNTER-ROTATING SWIRL
AMCA 201-02 (R2011)
43
Figure 9.6 - Improved Flow Conditions with a Special Designed Inlet Box

9.4 Inlet turning vanes
Where space limitations prevent the use of optimumfan inlet conditions, more uniform airflow can beachieved by the use of turning vanes in the inletelbow (see Figure 9.9). Numerous variations ofturning vanes are available, from a single curvedsheet metal vane to multi-bladed "airfoil" vanes.
The pressure drop (loss) through these devices mustbe added to the system pressure losses.
The amount of loss for each device is published bythe manufacturer, but it should be realized that thecataloged pressure loss will be based upon uniformairflow at the entry to the elbow. If the airflowapproaching the elbow is significantly non-uniformbecause of a disturbance farther upstream in thesystem, the pressure loss through the elbow will behigher than the published figure. A non-uniform
airflow entering a duct elbow with turning vanes willleave the duct elbow with non-uniform airflow.
9.5 Airflow straighteners
Figure 9.10 shows two airflow straighteners used intesting setups to reduce fan swirl before measuringstations. Figure 9.10A is the egg-crate straightenerused in ANSI/AMCA 210; larger cell sizes madeproportionately longer could be used.
Figure 9.10B shows the star straightener used in theISO standard. A single splitter sheet may be used toeliminate swirl in some cases. Straighteners areintended to reduce swirl before or after a fan or aprocess station. Do not install straighteners wherethe air profile is known to be non-uniform, thedevice will carry the non-uniformity furtherdownstream.
TURNINGVANES
TURNINGVANES
TURNINGVANES
CORRECTED PRE-ROTATING SWIRL
CORRECTED COUNTER-ROTATING SWIRL
IMPELLERROTATION
IMPELLERROTATION
Figure 9.9 - Corrections for Inlet Spin
AMCA 201-02 (R2011)
44
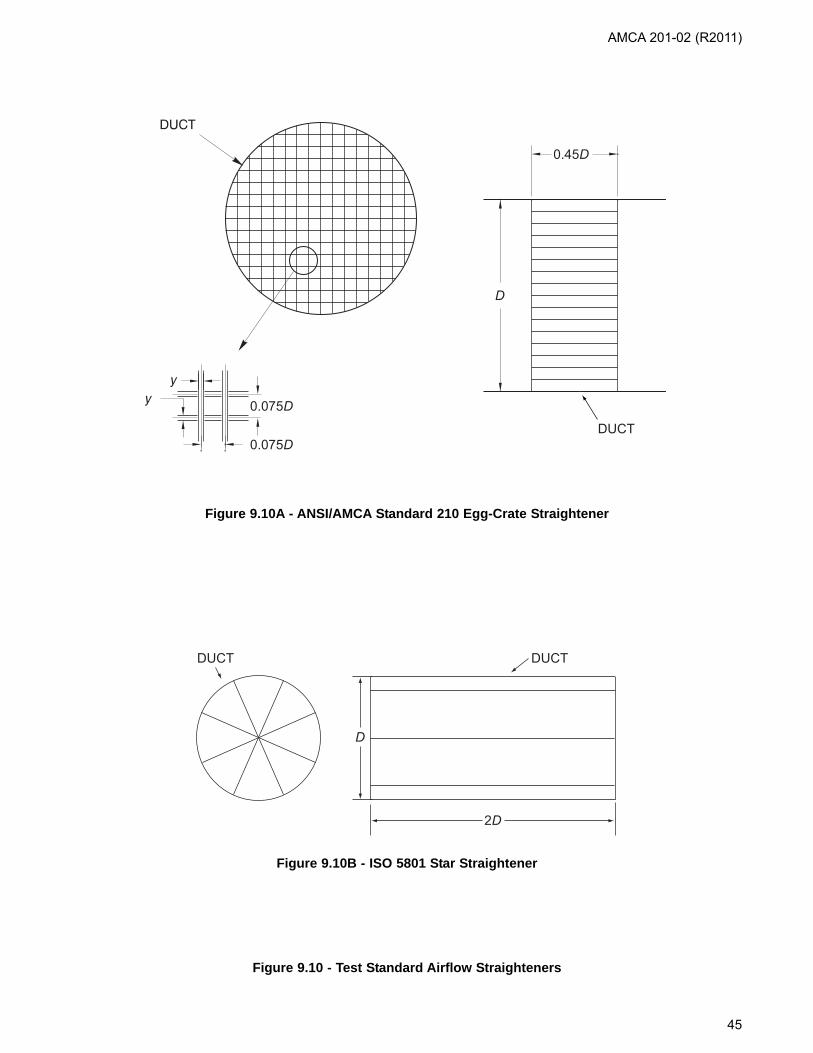
DUCT
0.075D
0.075D
D
0.45D
2D
D
DUCTDUCT
Figure 9.10B - ISO 5801 Star Straightener
Figure 9.10A - ANSI/AMCA Standard 210 Egg-Crate Straightener
Figure 9.10 - Test Standard Airflow Straighteners
AMCA 201-02 (R2011)
45

9.6 Enclosures (plenum and cabinet effects)
Fans within plenums and cabinets or next to wallsshould be located so that air may flow unobstructedinto the inlets. Fan performance is reduced if thespace between the fan inlet and the enclosure is toorestrictive. It is common practice to allow at least one-
half impeller diameter between an enclosure wall andthe fan inlet. Adjacent inlets of multiple double widthcentrifugal fans located in a common enclosureshould be at least one impeller diameter apart ifoptimum performance is to be expected. Figure 9.11illustrates fans with restricted inlets and theirapplicable System Effect Curves.
2LL L
INLE
TD
IA.
Figure 9.11C - Centrifugal Fan Near Wall(s) Figure 9.11D - DWDI Fan Near Wall on One Side
Figure 9.11A - Fans and Plenum Figure 9.11B - Axial Fan Near Wall
EQUAL
DIAMETEROF INLET
EQUAL L
LL L L
DWDI SWSI
L - DISTANCE INLET TO WALL
0.75 x DIA. OF INLET0.50 x DIA. OF INLET0.40 x DIA. OF INLET0.30 x DIA. OF INLET
V-WUTS
XV-WV-W
U
For Figures 9.11A, B & CSYSTEM EFFECT CURVES
For Figures 9.11DSYSTEM EFFECT CURVES
Determine SEF by calculating inlet velocity and using Figure 7.1
Figure 9.11 - System Effect Curves for Fans Located in Plenums and Cabinet Enclosures and for Various Wall-to-inlet Dimensions
AMCA 201-02 (R2011)
46

The manner in which the air stream enters anenclosure in relation to the fan inlets also affects fanperformance. Plenum or enclosure inlets or walls thatare not symmetrical with the fan inlets will causeuneven airflow and/or inlet spin. Figure 9.12Aillustrates this condition that must be avoided toachieve maximum performance from a fan. If this isnot possible, inlet conditions can usually be improvedwith a splitter sheet to break up the inlet vortex asillustrated in Figure 9.12B.
For proper performance of axial fans in parallelinstallations minimum space of one impeller diametershould be allowed between fans, as shown in Figure9.13. Placing fans closer together can result in erraticor uneven airflow into the fans.
9.7 Obstructed inlets
A reduction in fan performance can be expectedwhen an obstruction to airflow is located in the faninlet. Building structural members, columns, butterflyvalves, blast gates and pipes are examples of more
common inlet obstructions. Some accessories suchas fan bearings, bearing pedestals, inlet vanes, inletdampers, drive guards and motors may also causeinlet obstruction and are discussed in more detail inSection 10.
Obstruction at the fan inlet may be defined in termsof the unobstructed percentage of the inlet area.Because of the shape of the inlet cones of many fansit is sometimes difficult to establish the area of the faninlet. Figure 9.14 illustrates the convention adoptedfor this purpose. Where an inlet collar is provided, theinlet area is calculated from the inside diameter ofthis collar. Where no collar is provided, the inlet planeis defined by the points of tangency of the fanhousing side with the inlet cone radius.
The unobstructed percentage of the inlet area iscalculated by projecting the profile of the obstructionon the profile of the inlet. The adjusted inlet velocityobtained is then used to enter the System Effect Curvechart and the SEF determined from the curve listedfor that unobstructed percentage of the fan inlet area.
1 DIA.MIN
Figure 9.13 - Parallel Installation of Axial Flow Fans
Figure 9.12 - Fan in Plenum with Non-Symmetrical Inlet
SPLITTER SHEET
Figure 9.12A - Enclosure Inlet Not Symmetrical with Fan Inlet. Pre-
Rotational Vortex Induced
Figure 9.12B - Flow Condition of Figure 9.12A Improved with a Splitter Sheet. Substantial
Improvement Would Be To Relocate Enclosure Inlet as Shown in Figure 9.11A
AMCA 201-02 (R2011)
47

INLET PLANE
FREE INLET AREA PLANE - FAN WITH INLET COLLAR
FREE INLET AREA PLANE - FAN WITHOUT INLET COLLAR
INSIDE DIAMETER
INLET COLLAR
POINT OF TANGENTWITH FAN HOUSING SIDEAND INLET CONE RADIUS
INLET PLANE
DIAMETER
OF TANGENT
Figure 9.14 - System Effect Curves for Inlet Obstructions(Table based on Fans and Fan Systems, Thompson & Trickler, Chem Eng MAR83, p. 60)
System Effect Curve (Figure 7.1)
Distance from obstruction to inlet plane
Percentage ofunobstructed inlet area
0.75 Inletdiameter
0.5 Inletdiameter
0.33 Inletdiameter
0.25 Inletdiameter At Inlet plane
100 - - - - -
95 - - X W V
90 - X V-W U-V T-U
85 X W-X V-W U-V S-T
75 W-X V U S-T R-S
50 V-W U S-T R-S Q
25 U-V T S-T Q-R P
AMCA 201-02 (R2011)
48
Table for Figure 9.14
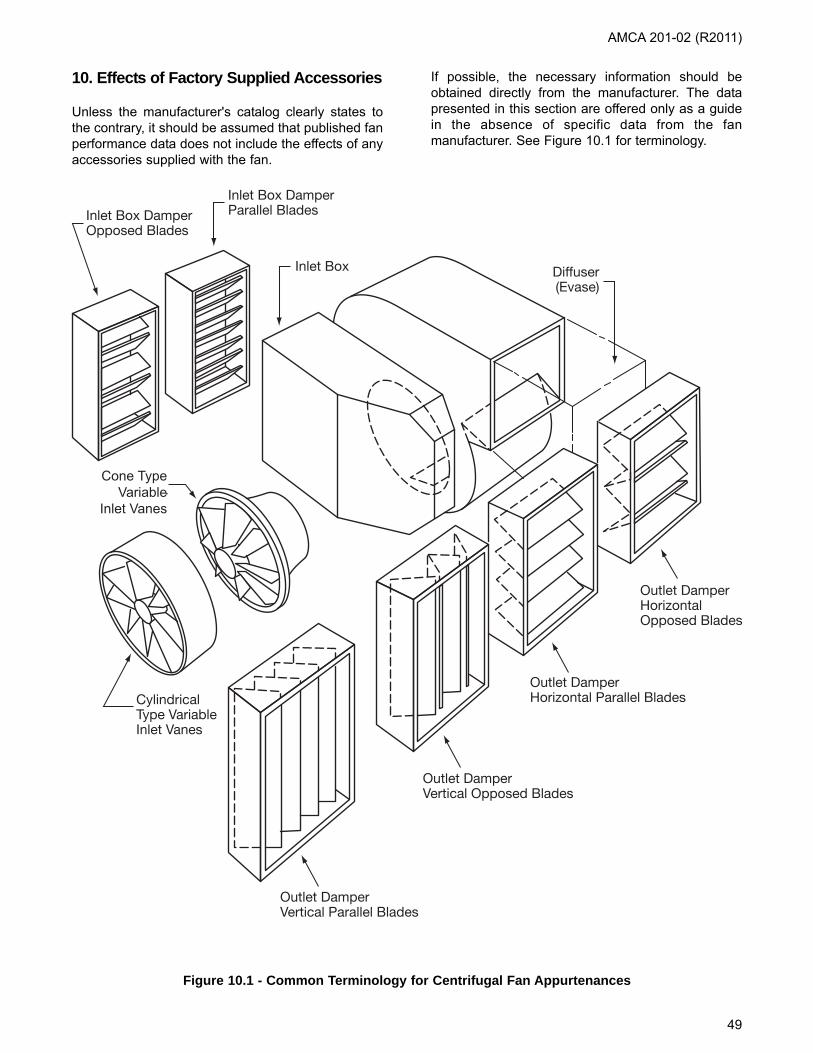
10. Effects of Factory Supplied Accessories
Unless the manufacturer's catalog clearly states tothe contrary, it should be assumed that published fanperformance data does not include the effects of anyaccessories supplied with the fan.
If possible, the necessary information should beobtained directly from the manufacturer. The datapresented in this section are offered only as a guidein the absence of specific data from the fanmanufacturer. See Figure 10.1 for terminology.
Cone TypeVariable
Inlet Vanes
Figure 10.1 - Common Terminology for Centrifugal Fan Appurtenances
AMCA 201-02 (R2011)
49

AMCA 201-02 (R2011)
10.1 Bearing and supports in fan inlet
Arrangement 3 and 7 fans (see Figure 3.5) requirethat the fan shaft be supported by a bearing andbearing support in the fan inlet or just adjacent to it.
These components may have an effect on the flow ofair into the fan inlet and consequently on the fanperformance, depending upon the size of thebearings and supports in relation to the fan inletopening. The location of the bearing and support, thatis, whether it is located in the actual inlet or "spacedout" from the inlet, will also have an effect.
In cases where manufacturer's performance ratingsdo not include the effect of the bearings andsupports, it will be necessary to compensate for thisinlet restriction. Use the fan manufacturer'sallowance for bearings in the fan inlet if possible.
If no better data are available, use the proceduresdescribed in Section 9.7 as an approximation.
10.2 Drive guards obstructing fan inlet
All fans have moving parts that require guarding forsafety in the same way as other moving machinery.Fans located less than 2.1 m (7 ft) above the floorrequire special consideration as specified in theUnited States’ Occupational Safety and Health Act.National, federal, state and local rules, regulations,and codes should be carefully considered andfollowed.
Arrangement 3 and 7 fans may require a belt driveguard in the area of the fan inlet. Depending on thedesign, the guard may be located in the plane of theinlet, along the casing side sheet, or it may be"spaced out" due to "spaced out" bearing pedestals.
In any case, depending on the location of the guard,and on the inlet velocity, the fan performance may besignificantly affected by this obstruction. It isdesirable that a drive guard located in this position befurnished with as much opening as possible to allowmaximum flow of air to the fan inlet.
If available, use the fan manufacturer's allowance fordrive guards obstructing the fan inlet. SEF for driveguard obstructions situated at the inlet of a fan maybe approximated using Figure 9.14.
Where possible, open construction on guards isrecommended to allow free air passage to the faninlet. Guards and sheaves should be designed toobstruct, as little of the fan inlet as possible and in nocase should the obstruction be more than 1/3 of thefan inlet area.
10.3 Belt tube in axial fan inlet or outlet
With a belt driven axial flow fan it is usually necessarythat the fan motor be mounted outside the fanhousing (see Figure 3.7 Arrangement 9, and Annex BFigure B.7).
To protect the belts from the airstream, and also toprevent any air leakage through the fan housing,manufacturers in many cases provide a belt tube.
Most manufacturers include the effects of an axial fanbelt tube in their rating tables. In cases where theeffect is not included, the appropriate SEF isapproximated by calculating the percentage ofunobstructed area of air passage way and usingFigure 9.14.
10.4 Inlet box
When an inlet box configuration is supplied by the fanmanufacturer, the fan performance should includethe effect of the inlet box.
The System Effect of fan inlet boxes can vary widelydepending upon the design. This data should beavailable from the fan manufacturer. In the absenceof fan manufacturer's data, a well-designed inlet boxshould approximate System Effect Curves "S" or "T"of Figure 7.1.
10.5 Inlet box dampers
Inlet box dampers may be used to control the airflowthrough the system. Either parallel or opposed bladesmay be used (see Figure 10.1).
The parallel blade type is installed with the bladesparallel to the fan shaft so that, in a partially closedposition, a forced inlet vortex will be generated. Theeffect on the fan characteristics will be similar to thatof a variable inlet vane control.
The opposed blade type is used to control airflow bythe addition of pressure loss created by the damperin a partially closed position.
If possible, complete data should be obtained fromthe fan manufacturer giving the System Effect of theinlet box and damper pressure drop over the range ofapplication. If data are not available, System EffectCurves "S" or "T" from Figure 7.1 should be appliedfor the inlet box and pressure loss from the dampermanufacturer for the damper in making the fanselection.
50
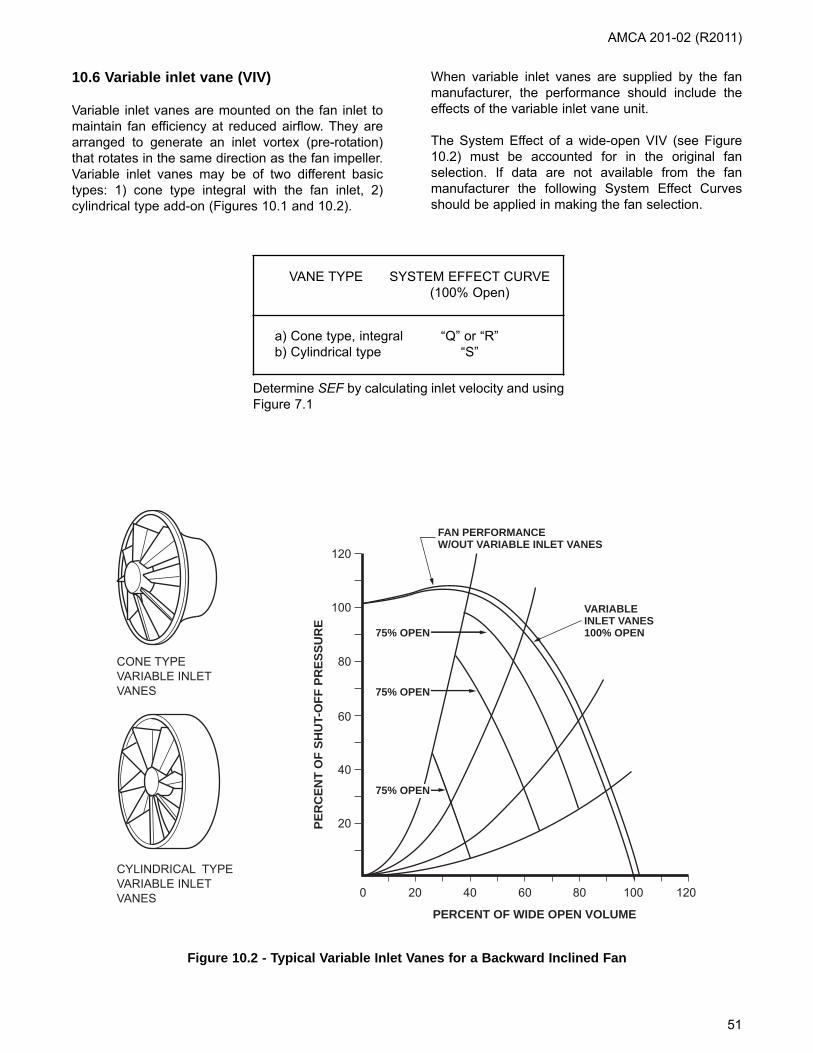
10.6 Variable inlet vane (VIV)
Variable inlet vanes are mounted on the fan inlet tomaintain fan efficiency at reduced airflow. They arearranged to generate an inlet vortex (pre-rotation)that rotates in the same direction as the fan impeller.Variable inlet vanes may be of two different basictypes: 1) cone type integral with the fan inlet, 2)cylindrical type add-on (Figures 10.1 and 10.2).
When variable inlet vanes are supplied by the fanmanufacturer, the performance should include theeffects of the variable inlet vane unit.
The System Effect of a wide-open VIV (see Figure10.2) must be accounted for in the original fanselection. If data are not available from the fanmanufacturer the following System Effect Curvesshould be applied in making the fan selection.
20
0 20 40 60 80 100 120
40
60
80
100
120
PERCENT OF WIDE OPEN VOLUME
PER
CEN
T O
F SH
UT-
OFF
PR
ESSU
RE
75% OPEN
75% OPEN
75% OPEN
FAN PERFORMANCEW/OUT VARIABLE INLET VANES
VARIABLE INLET VANES100% OPEN
CONE TYPEVARIABLE INLETVANES
CYLINDRICAL TYPEVARIABLE INLETVANES
Figure 10.2 - Typical Variable Inlet Vanes for a Backward Inclined Fan
VANE TYPE SYSTEM EFFECT CURVE(100% Open)
a) Cone type, integral “Q” or “R”b) Cylindrical type “S”
Determine SEF by calculating inlet velocity and usingFigure 7.1
AMCA 201-02 (R2011)
51

Annex A. SI / I-P Conversion Table (Informative)
Taken from AMCA 99-0100
Quantity I-P to SI SI to I-P
Length (ft) 0.3048 = m (m) 3.2808 = ft
Mass (weight) (lbs) 0.4536 = kg (kg) 2.2046 = lbs.
Time The unit of time is the second in both systems
Velocity (ft-s) 0.3048 = ms(ft/min) 0.00508 = ms
(ms) 3.2808 = ft-s(ms) 196.85 = ft/min
Acceleration (in./s2) 0.0254 = m/s2 (m/s2) 39.370 = in./s2
Area (ft2) 0.09290 = m2 (m2) 10.764 = ft2
Volume Flow Rate (cfm) 0.000471948 = m3/s (m3/s) 2118.88 = cfm
Density (lb/ft3) 16.01846 = kg/m3 (kg/m3) 0.06243 = lb/ft3
Pressure(in. wg) 248.36 = Pa(in. wg) 0.24836 = kPa(in. Hg) 3.3864 = kPa
(Pa) 0.004026 = in. wg(kPa) 4.0264 = in. wg(kPa) 0.2953 = in. Hg
Viscosity:AbsoluteKinematic
(lbm/ft-s) 1.4882 = Pa s(ft2/s) 0.0929 = m2/s
(Pa s) 0.6719 = (lbm/ft-s)(m2/s) 10.7639 = ft2/s
Gas Constant (ft lb/lbm-°R) 5.3803 = J-kg/K (j-kg/K) 0.1858 = (ft lb/lbm-°R)
Temperature (°F - 32°)/1.8 = °C (1.8 × °C) + 32° = °F
Power (BHP) 746 = W(BHP) 0.746 = kW
(W)/746 = BHP(kW)/0.746 = BHP
AMCA 201-02 (R2011)
52

AMCA 201-02 (R2011)
Annex B. Dual Fan Systems - Series andParallel
It is sometimes necessary to install two or more fansin systems that require higher pressures or airflowthan would be attainable with a single fan. Two fansmay offer a space, cost, or control advantage over asingle larger fan, or it may be simply a fieldmodification of an existing system to boost pressureor airflow.
B.1 Fans operating in series
To obtain a system pressure boost, fans are ofteninstalled in series. The fans may be mounted as closeas the outlet of one fan directly attached to the inletof the next fan, or they may be placed in remotelocations with considerable distance between fans.
The fans must handle the same mass airflow,assuming no loss or gains between stages. Thecombined total pressure will then be the sum of eachfan’s total pressure (Figure B.1). The velocitypressure corresponds to the air velocity at the outletof the last fan stage. The static pressure for thecombination is the total pressure minus the velocitypressure and is not the sum of the individual fanstatic pressures.
In practice there is some reduction in airflow due tothe increased air density in the later fan stage(s).There can also be significant loss of airflow due tonon-uniform airflow into the inlet of the next fan.
Sometimes multiple impellers are assembled in asingle housing and this assembly is known as a“multi-stage” fan. This combination is seldom used inconventional ventilating and air conditioning systemsbut it is not uncommon in special industrial systems.
It is advisable to request the fan manufacturer toreview the proposed system design and make someestimate of its installed performance.
B.2 Fans operating in parallel
Suppliers of air handling equipment and designers ofcustom systems commonly incorporate two identical,in parallel fans to deliver large volumes of air whiletaking advantage of the space savings offered byusing two smaller fans.
These types of systems normally have common inletand outlet sections, or they may have individual ductsof equal resistance that join together at equalvelocities. In either case, the characteristic curve isthe sum of the separate airflows for a given static ortotal pressure (Figure B.2).
The total performance of the multiple fans will be lessthan the theoretical sum if inlet conditions arerestricted or the airflow into the inlets is not straight(see Section 9.6). Also, adding a parallel fan to anexisting system without modifying the resistance(larger ducts, etc.) will result in lower than anticipatedairflow due to increased system resistance.
Fans that have a “positive” slope in the pressure-volume curve to the left of the peak pressure curve,typical of some axial and forward curved centrifugalfans (see Figure 4.2), can experience unstableoperation under certain conditions. If fans areoperated in parallel in the region of this “positive”slope, multiple operating conditions may occur.Figure B.2 illustrates the combined pressure-volumecurve of two such fans operating in parallel.
The closed loop to the left of the peak pressure pointis the result of plotting all the possible combinationsof volume airflow at each pressure. If the systemcurve intersects the combined volume-pressurecurve in the area enclosed by the loop, more thanone point of operation is possible. This may causeone of the fans to handle more of the air and couldcause a motor overload if the fans are individuallydriven. This unbalanced airflow condition tends toreverse readily with the result that the fans willintermittently load and unload. This "pulsing" oftengenerates noise and vibration and may causedamage to the fans, ductwork or driving motors.
Aileron controls in forward curved fan outlets ordampers near the inlets or outlets may be used tocorrect unbalanced airflow or to eliminate pulsationsor reversing operation (See Figure B.3).
53

100%
100%
200%
PERCENT OF FAN AIRFLOW
PER
CEN
T O
F FA
N S
TATI
C P
RES
SUR
E
SYSTEMRESISTANCE
SERIES FANCOMBINEDPRESSURE CURVE
SINGLE FANPRESSURE CURVE
Figure B.1 - Typical Characteristic Curve of Two Fans Operating in Series
AMCA 201-02 (R2011)
54

55
AMCA 201-02 (R2011)
PERCENT OF FAN AIRFLOW
PER
CEN
T O
F FA
N S
TATI
C P
RES
SUR
E
200
100
FAN OPERATION NOTRECOMMENDED IN THISRANGE
PARALLEL FANS - FAN PRESSURE ATCOMBINED VOLUME
SINGLE FAN -PRESSURECURVE
UNST
ABLE
SYS
TEM
STAB
LE S
YSTE
M
Figure B.2 - Parallel Fan Operation
AILERON
Figure B.3 - Aileron Control

56
Annex C. Definitions and Terminology
C.1 The air
C.1.1 Air velocity. The velocity of an air stream is itsrate of motion, expressed in m/s (fpm). The velocityat a plane (Vx) is the average velocity throughout theentire area of the plane.
C.1.2 Airflow. The airflow at a plane (Qx) is the rateof airflow, expressed in m3/s (cfm) and is the productof the average velocity at the plane and the area ofthe plane.
C.1.3 Barometric pressure. Barometric pressure(pb) is the absolute pressure exerted by theatmosphere at a location of measurement (per AMCA99-0066).
C.1.4 Pressure-static. Static pressure is the portionof the air pressure that exists by virtue of the degreeof compression only. If expressed as gauge pressure,it may be negative or positive (per AMCA 99-0066).
Static pressure at a specific plane (Psx) is thearithmetic average of the gauge static pressures asmeasured at specific points in the traverse of theplane.
C.1.5 Pressure-velocity. Velocity pressure is thatportion of the air pressure which exists by virtue ofthe rate of motion only. It is always positive (perAMCA 99-0066).
Velocity pressure at a specific plane (Pvx) is thesquare of the arithmetic average of the square rootsof the velocity pressures as measured at specificpoints in the traverse plane.
C.1.6 Pressure-total. Total pressure is the airpressure that exists by virtue of the degree ofcompression and the rate of motion. It is thealgebraic sum of the velocity pressure and the staticpressure at a point. Thus if the air is at rest, the totalpressure will equal the static pressure (per AMCA 99-0066).
Total pressure at a specific plane (Ptx) is the algebraicsum of the static pressure and the velocity pressureat that plane.
C.1.7 Standard air density. A density of 1.2 kg/m3
(0.075 lbm/ft3) corresponding approximately to air at20°C (68°F), 101.325 kPa (29.92 in. Hg) and 50%relative humidity (per AMCA 99-0066).
C.1.8 Temperature. The dry-bulb temperature (td) isthe air temperature measured by a dry temperaturesensor. Temperatures relating to air density areusually referenced to the fan inlet.
The wet-bulb temperature (tw) is the temperaturemeasured by a temperature sensor covered by awater-moistened wick and exposed to air in motion.Readings shall be taken only under conditions thatassure an air velocity of 3.6 to 10.2 m/s (700 to 2000ft/min) over the wet-bulb and only after sufficient timehas elapsed for evaporative equilibrium to beattained.
Wet bulb depression is the difference between dry-bulb and wet-bulb temperatures (td - tw) at the samelocation.
C.2 The fan
C.2.1 Blast area. The blast area of a centrifugal fanis the fan outlet area less the projected area of thecutoff; see Figure B.6 (per AMCA 99-0066).
C.2.2 Inlet area. The fan inlet area (A1) is the grossinside area of the fan inlet (see Figure 9.14).
C.2.3 Outlet area. The fan outlet area (A2) is thegross inside area of the fan outlet.
C.2.4 Fan. (1) A device, which utilizes a power-driverotating impeller for moving air or gases. The internalenergy (enthalpy) increase imparted by a fan to a gasdoes not exceed 25 kJ/kg (10.75 BTU/lbm). (2) Adevice having a power-driven rotating impellerwithout a housing for circulating air in a room (perAMCA 99-0066).
The volume airflow of a fan (Q) is the rate of airflowin m3/s (cfm) expressed at the fan inlet conditions.
C.2.5 Fan impeller diameter. The fan impellerdiameter is the maximum diameter measured overthe impeller blades.
C.2.6 Fan total pressure. Fan total Pressure (Pt) isthe difference between the total pressure at the fanoutlet and the total pressure at the fan inlet. Pt = Pt1 -Pt2 (Algebraic).
Ignoring the losses that exist between the planes ofmeasurement and the fan, Figures C.1, C.2 and C.3illustrate fan total pressures for three basicarrangements for fans connected to externalsystems.
AMCA 201-02 (R2011)

57
AMCA 201-02 (R2011)
Where the fan inlet is open to atmospheric air orwhere an inlet bell, as shown in the Figure C.1 isused to simulate an inlet duct, the total pressure atthe fan inlet (Pt1) is considered to be the same as thetotal pressure in the region near the inlet (Pta) whereno energy has been imparted to the air. This is thelocation of "still air". The following equations apply:
Pta = 0Pt = Pt2 - Pt1
Pt1 = Pta = 0Pt = Pt2
Where the fan outlet is open to atmospheric air orwhere an outlet duct three diameters or less in lengthis used to simulate a fan with an outlet duct and theoutlet duct is open to atmospheric air, the totalpressure at the fan outlet is equal to the fan velocitypressure (Pv). The following equations apply:
Pt = Pt2 - Pt1
Pt2 = Pv
Pt = Pv - Pt1
PLANE 2PLANE 1
Pt2
Pt = Pt2
Figure C.1 - Fan Total Pressure for Installation Type B: Free Inlet, Ducted Outlet

58
AMCA 201-02 (R2011)
PLANE 2PLANE 1
Pt1
Pt = Pv2 - Pt1
Figure C.2 - Fan Total Pressure for Installation Type C: Ducted Inlet, Free Outlet
Figure C.3 - Fan Total Pressure for Installation Type D: Ducted Inlet, Ducted Outlet
PLANE 2PLANE 1
Pt2Pt1
Pt = Pt2 - Pt1
Pt

59
AMCA 201-02 (R2011)
PLANE 2PLANE 1
Pv2
Pv = Pv2
Figure C.4 - Fan Velocity Pressure for Installation Type B: Free Inlet, Ducted Outlet
C.2.7 Fan velocity pressure. Fan velocity pressure(Pv) is the pressure corresponding to the average airvelocity at the fan outlet. Pv = Pv2
Assuming no change in air density or area betweenthe plane of measurement and the fan outlet, FigureC.4 illustrates fan velocity pressure.
C.2.8 Fan static pressure. The difference betweenthe fan total pressure and the fan velocity pressure.Therefore, fan static pressure is the differencebetween the static pressure at a fan outlet and thetotal pressure at a fan inlet (per AMCA 99-0066).
Ps = Pt - Pv
Ignoring losses between the planes of measurementand the fan, Figure C.5 illustrates the fan staticpressure for a fan with ducted inlet and outlet.
Ps = Ps2 - Ps1 - Pv1 (Algebraic)
Where the fan inlet is open to atmospheric air, (freeinlet, ducted outlet), the fan static pressure (Ps) isequal to the static pressure at the fan outlet.
Ps = Ps2
Where the fan outlet is open to atmospheric air(ducted inlet, free outlet), ignoring the SEF, the fanstatic pressure (Ps) is equal to the inlet staticpressure (Ps1) less the inlet velocity pressure (Pv1).
Ps = -Ps1 - Pv1
Ps = -(-Ps1) - Pv1
Ps = Ps1 - Pv1
C.3 The system
C.3.1 Equivalent duct diameter. The diameter of acircle having the same area as another geometricshape. For a rectangular cross-section duct withwidth (a) and height (b), the equivalent diameter is:(4ab/π)0.5 (per AMCA 99-0066).
C.3.2 Fan performance. Fan performance is astatement of the volume airflow, static or totalpressure, speed and power input at a stated inletdensity and may include total and static efficiencies.
C.3.3 Fan performance curve. Of the many forms offan performance curves, generally all conveyinformation sufficient to determine fan performanceas defined above. In this manual, ‘fan performancecurve’ refers to the constant speed performance
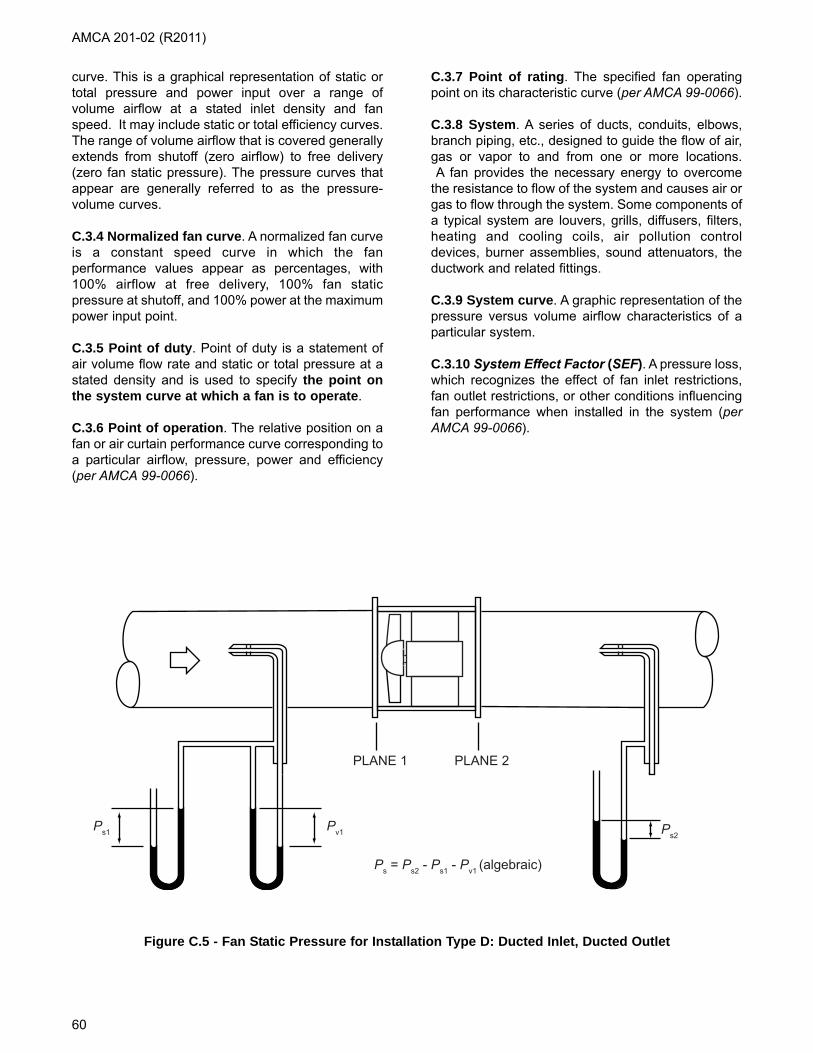
60
AMCA 201-02 (R2011)
curve. This is a graphical representation of static ortotal pressure and power input over a range ofvolume airflow at a stated inlet density and fanspeed. It may include static or total efficiency curves.The range of volume airflow that is covered generallyextends from shutoff (zero airflow) to free delivery(zero fan static pressure). The pressure curves thatappear are generally referred to as the pressure-volume curves.
C.3.4 Normalized fan curve. A normalized fan curveis a constant speed curve in which the fanperformance values appear as percentages, with100% airflow at free delivery, 100% fan staticpressure at shutoff, and 100% power at the maximumpower input point.
C.3.5 Point of duty. Point of duty is a statement ofair volume flow rate and static or total pressure at astated density and is used to specify the point onthe system curve at which a fan is to operate.
C.3.6 Point of operation. The relative position on afan or air curtain performance curve corresponding toa particular airflow, pressure, power and efficiency(per AMCA 99-0066).
C.3.7 Point of rating. The specified fan operatingpoint on its characteristic curve (per AMCA 99-0066).
C.3.8 System. A series of ducts, conduits, elbows,branch piping, etc., designed to guide the flow of air,gas or vapor to and from one or more locations.A fan provides the necessary energy to overcome
the resistance to flow of the system and causes air orgas to flow through the system. Some components ofa typical system are louvers, grills, diffusers, filters,heating and cooling coils, air pollution controldevices, burner assemblies, sound attenuators, theductwork and related fittings.
C.3.9 System curve. A graphic representation of thepressure versus volume airflow characteristics of aparticular system.
C.3.10 System Effect Factor (SEF). A pressure loss,which recognizes the effect of fan inlet restrictions,fan outlet restrictions, or other conditions influencingfan performance when installed in the system (perAMCA 99-0066).
Figure C.5 - Fan Static Pressure for Installation Type D: Ducted Inlet, Ducted Outlet
PLANE 2PLANE 1
Ps2Pv1Ps1
Ps = Ps2 - Ps1 - Pv1 (algebraic)
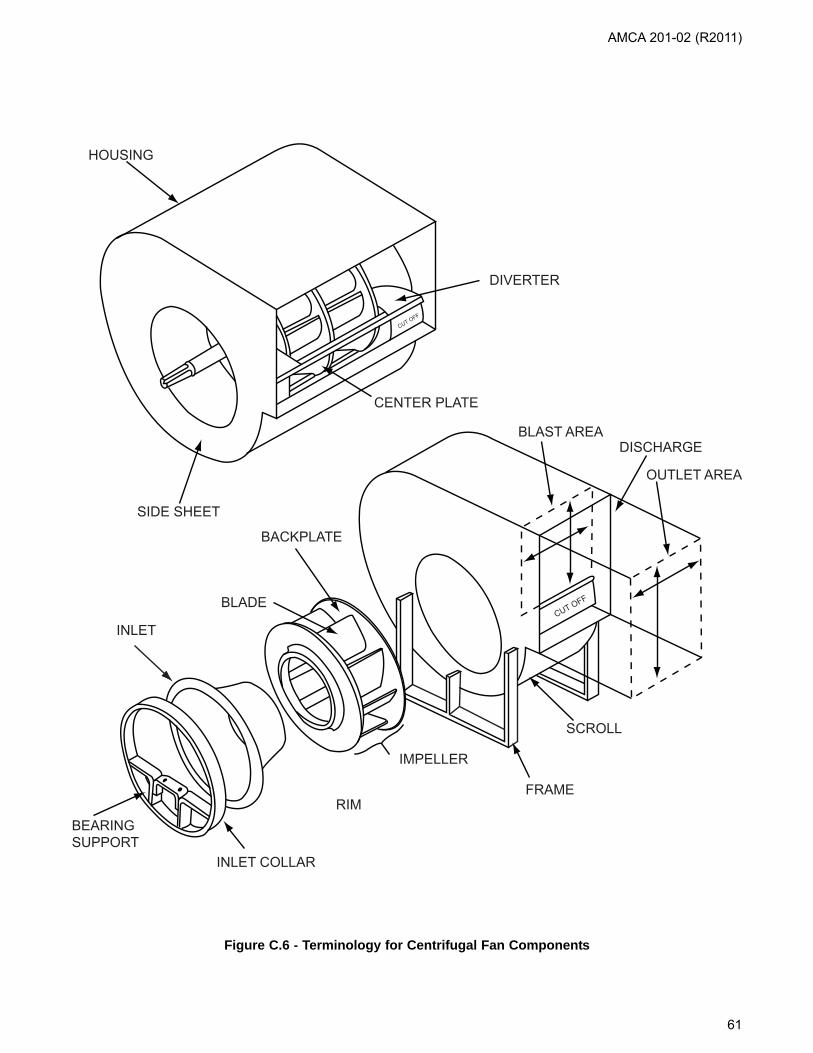
61
AMCA 201-02 (R2011)
HOUSING
DIVERTER
CENTER PLATE
SIDE SHEET
CUT OFF
BEARINGSUPPORT
INLET COLLAR
INLET
BLADE
BACKPLATE
IMPELLER
RIM
CUT OFF
BLAST AREADISCHARGE
OUTLET AREA
SCROLL
FRAME
Figure C.6 - Terminology for Centrifugal Fan Components
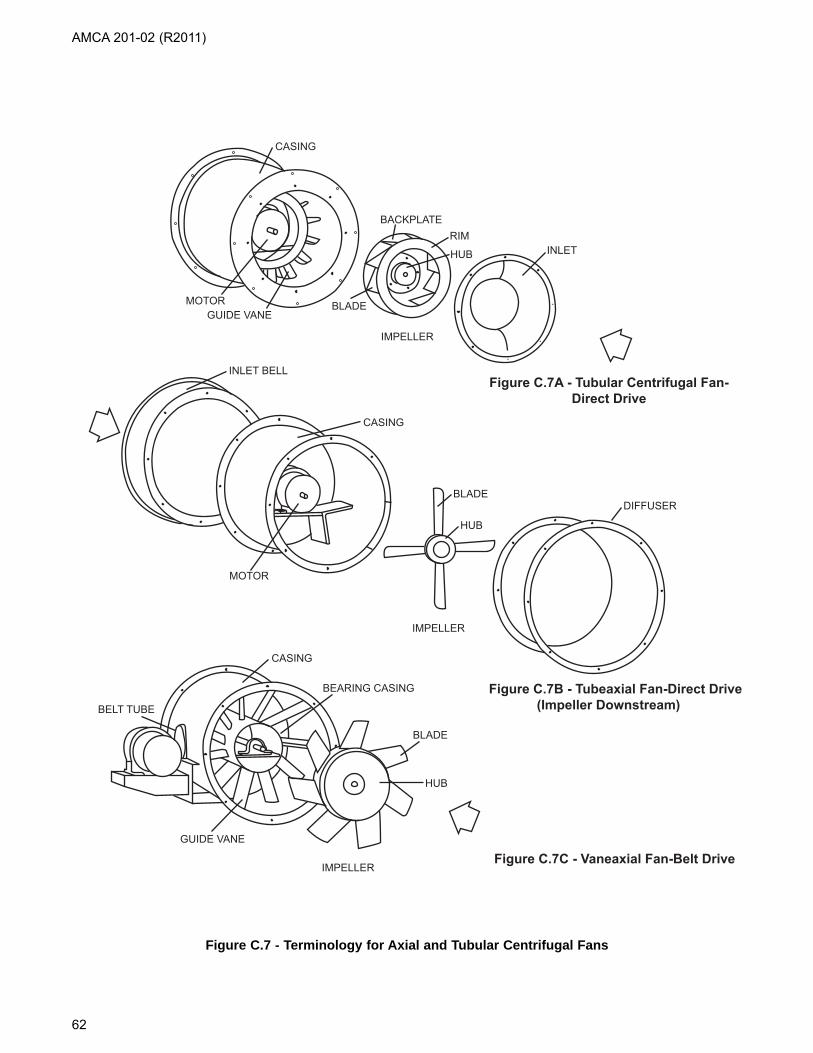
62
AMCA 201-02 (R2011)
BELT TUBE
CASING
BEARING CASING
BLADE
HUB
IMPELLER
GUIDE VANE
Figure C.7C - Vaneaxial Fan-Belt Drive
Figure C.7B - Tubeaxial Fan-Direct Drive (Impeller Downstream)
DIFFUSERBLADE
HUB
IMPELLER
INLET BELL
CASING
MOTOR
Figure C.7A - Tubular Centrifugal Fan-Direct Drive
INLET
BACKPLATERIM
HUB
IMPELLER
BLADEGUIDE VANE
MOTOR
CASING
Figure C.7 - Terminology for Axial and Tubular Centrifugal Fans

63
AMCA 201-02 (R2011)
Annex D. Examples of the Convertibilityof Energy from Velocity Pressure toStatic Pressure
SI CONVERSION was done using 249 Pa = 1 in. wg,1 m3/s = 2118 cfm, 1m/s = .00508 ft/min
D.1 Example of fan (tested with free inlet,ducted outlet) applied to a duct system
The overall friction of the duct system results in a 747Pa (3.0 in. wg) pressure drop at an airflow of 1.42m3/s (3000 cfm).
The Ps required at the fan outlet (C) will be equal tothe pressure drop at the desired airflow. Since thereare no inlet obstructions and the duct near the fanoutlet is the same as used in the test setup, thepublished fan performance can be used with noadditional system effect factors applied.
SI I-P
A Free inlet 0.00 Pa (no SEF) 0.0 in. wg
B-C Outlet with straightduct attached for two or more diameters. 0.00 Pa (no SEF) 0.0 in. wg
C-D Duct friction at Q =1.42 m3/s (3000 cfm). 747.00 Pa (duct design) 3.0 in. wg
REQUIRED FAN Ps 747.00 Pa 3.0 in. wg
Select a fan for Q = 1.42 m3/s (3000 cfm) and Ps = 747 Pa (3.0 in. wg).
Use manufacturer's data for rpm (N) and power (H).
NO OBSTRUCTION AT FAN INLET
ATMOSPHERIC PRESSURE0
1
2
3
4
0
249
498
747
996
Pt
Ps
Pv
Pv = 124 Pa (0.5 in.wg)
FRICTION 747 Pa (3.0 in.wg)AT 1.42 m3/s (3000 cfm)
A B C D
(I-P) in.wg
(SI) Pa
124 Pa(0.5 in.wg)
Figure D.1 - Pressure Gradients - Fan as Tested

64
AMCA 201-02 (R2011)
SI I-P
C-D Outlet duct on fan as tested 0.00 Pa (no SEF) 0.0 in. wg
D Pv loss (also Pt loss) asresult of air velocity decrease. Ps does not change from duct to plenum at D. 0.00 Pa 0.0 in. wg
E Contraction loss - plenum to duct 49.80 Pa (part of duct system) 0.2 in. wg
E Ps energy required to create velocity at E 124.50 Pa (part of duct system) 0.5 in. wg
E-F Duct friction at Q =1.42 m3/s (3000 cfm) 747.00 Pa 3.0 in. wg
REQUIRED FAN Ps 921.30 Pa 3.7 in. wg
Solution:
Select a fan for Q = 1.42 m3/s (3000 cfm) and Ps = 921.30 Pa (3.7 in. wg)Use manufacturer's data for rpm (N) and power (H).
D.2 Example of fan (tested with free inlet,ducted outlet), connected to a duct systemand then a plenum
This example includes the same duct system asdescribed in Example C.1. However, there is a shortoutlet duct on the fan followed by a plenum chamberwith cross-sectional area more than 10 times largerthan the area of the duct.
The velocity in the duct from E to F is 14.4 m/s (2830fpm), equal to a velocity pressure of 124.5 Pa (0.5 in.wg). At point "F" the Pv is 124.5 Pa (0.5 in. wg), thePs is 0.0 Pa (0.0 in. wg), and the Pt is 124.5 Pa (0.5in. wg). The friction of duct will cause a gradualincrease in Ps and Pt back to point E. If the duct hasa uniform cross-sectional area the Pv will be constantthrough this part of the system.
Since there is an energy loss of 49.8 Pa (0.2 in. wg)as a result of the abrupt contraction from the plenum
to the duct, the Pt requirement in the plenum is871.15 Pa (3.5 in. wg), Pt at duct entrance = 49.8 Pa(0.2 in. wg) in contraction loss, or 921.3 Pa (3.7 in.wg) Pt.
Air flowing across the plenum from D to E will have arelatively low velocity and the Pv in the plenum will be0.0 Pa (0.0 in. wg) since the velocity is negligible.
At point D, there is an abrupt expansion energy lossequal to the entire Pv in the duct discharging into theplenum. The outlet duct between the fan and theplenum is 2.5 equivalent diameters long. It is thesame as used during the fan rating test. The Ps in theoutlet duct (also the Ps in the plenum) is the same asthe Ps as measured during the rating test.
This example requires a fan to be selected for 921.30Pa (3.7 in. wg) at 1.42 m3/s (3000 cfm). Compare thiswith the previous selection of 747 Pa (3.0 in. wg) Ps
at 1.42 m3/s (3000 cfm).

65
AMCA 201-02 (R2011)
FRICTION 747 Pa (3.0 in.wg)AT 1.42 m3/s (3000 cfm)
ATMOSPHERIC PRESSURE
5
4
3
2
1
0
1245
996
747
498
249
0
Pt
Ps
Pv
Pv = 124 Pa (0.5in.wg)
1046 Pa (3.7 in.wg)
922 Pa (3.7 in.wg)
747 Pa (3.0 in.wg)
922 Pa (3.7 in.wg)
A B C D EF
(I-P) in.wg
(SI) Pa
124 Pa(0.5 in.wg)
NEGLIGIBLELOSS
2.5 DIA.
Figure D.2 - Pressure Gradients - Plenum Effect

66
AMCA 201-02 (R2011)
D.3 Example of fan with free inlet, free outlet- fan discharges directly into plenum andthen to duct system (abrupt expansion at fanoutlet)
This example is similar to the plenum effect exampleexcept the duct at the fan outlet has been omitted.The fan discharges directly into the plenum.
It may seem unreasonable that the System Effectloss at the fan outlet is greater than the defined fanoutlet velocity. Fans with cutoffs must generatehigher velocities at the cutoff plane (blast area) thanin the outlet duct (outlet area). This higher velocity (atcutoff) is partially converted to Ps when outlet ductsare used as on fan tests. When fans with cutoffs are"bulk-headed" into plenums or discharge directly intothe atmosphere as with exhausters, all the velocity
energy is lost. In these applications, the energy lossand the System Effect Factor may exceed the fanoutlet velocity pressure as defined in terms of "fanoutlet area".
The SEF for fans without outlet duct was obtained asfollows:
GIVEN:
Fan outlet velocity = 14.4 m/s(2830 fpm) No outlet duct
System Effect Curve = R-S, (from Figure 8.3)SEF = 149.4 Pa (0.6 in. wg), (from Figure 7.1) at 14.4m/s (2830 fpm) velocity and system curve R)
Fan Blast AreaOutlet Area
= 0 6.
SI I-P
B-C SEF 149.40 Pa 0.6 in. wg(see above)
B-C Pv loss (also Pt loss) asresult of air velocity decrease. Ps does not change from duct to plenum at C 0.00 Pa 0.0 in. wg
D contraction loss - plenum to duct 49.80 Pa (part of duct system) 0.2 in. wg
D Ps energy required to create velocity at D 124.50 Pa (part of duct system) 0.5 in. wg
D-E duct friction at Q =1.42 m3/s (3000 cfm) 747.00 Pa (duct design) 3.0 in. wg
REQUIRED FAN Ps 1070.70 Pa 4.3 in. wg
Solution:Select a fan for 1.42 m3/s (3000 cfm) Q and 1070.70 Pa (4.3 in. wg) Ps.Use manufacturer's data for rpm (N) and power (H).

67
AMCA 201-02 (R2011)
FRICTION 747 Pa (3.0 in.wg)AT 1.42 m3/s (3000 cfm)
ATMOSPHERIC PRESSURE
5
4
3
2
1
0
1245
996
747
498
249
0
Pt
Ps
Pv
Pv = 124 Pa (0.5 in.wg)
922 Pa (3.7 in.wg)
872 Pa (3.5 in.wg)
747 Pa (3.0 in.wg)
149 Pa (0.6 in.wg) SEF
A B C D E
(I-P) in.wg
(SI) Pa
124 Pa (0.5 in.wg)
Figure D.3 - Pressure Gradients - Abrupt Expansion at Fan Outlet

68
AMCA 201-02 (R2011)
SI I-P
A Entrance loss - sharpedge duct 99.60 Pa (duct design) 0.4 in. wg
A-B Duct friction at 1.42 m3/s (3000 cfm) 747.00 Pa (duct design) 3.0 in. wg
B SEF 1 149.40 Pa 0.6 in. wg
C SEF 2 49.80 Pa 0.2 in. wg
E Fan Pv 124.50 Pa 0.5 in. wg
E SEF 3 149.40.Pa 0.6 in. wg
REQUIRED FAN Pt 1319.70 Pa 5.3 in. wg
Fan Ps = fan Pt - fan Pv
Fan Ps (SI) = 1319.70 Pa – 124.5 Pa = 1195.2 PaFan Ps (I-P) = 5.3 in. wg - 0.5 in. wg = 4.8 in wg
Solution:Select a fan for 1.42 m3/s (3000 cfm) Q and 1195.2 Pa (4.8 in. wg) Ps
Use manufacturer's data for rpm (N) and power (H).
D.4 Example of fan used to exhaust withobstruction in inlet, inlet elbow, inlet duct,free outlet
This example is an exhaust system. Note the entryloss at point A. An inlet bell will reduce this loss.
On the suction side of the fan, Ps will be negative, butPv is always positive.
Fan Pv = 124.5 Pa (0.5 in. wg)
Three SEFs are shown in this example:
1) System Effect Curve R (see Figure 9.5 for a 3piece inlet elbow with R/D ratio of 1 and no ductbetween the elbow and the fan inlet).
2) System Effect Curve U (see Figure 9.14 for abearing in the fan inlet which obstructs 10% of theinlet).
3) System Effect Curve R (from Figure 8.3 for a fandischarging to atmosphere with no outlet duct).

69
AMCA 201-02 (R2011)
FRICTION 747 Pa (3.0 in.wg)AT 1.42 m3/s (3000 cfm)
ATMOSPHERIC PRESSURE
FAN INLET
-5
-4
-3
-2
-1
0
+1
-1245
-996
-747
-498
-249
0
+249
Pv
Pt
Ps
149 Pa (0.6 in.wg)ELBOW SEF
50 Pa (0.2 in.wg)OBSTRUCTION SEF
149 Pa (0.6 in.wg)REQUIRED
149 Pa (0.6 in.wg)
ABRUPTDISCHARGE SEF Pv = 124 Pa (0.5 in.wg)
100 Pa (0.4 in.wg)
-847 Pa (-3.4 in.wg)
-996 Pa (4.0 in.wg)
-971 Pa (3.9 in.wg)
-1121 Pa (4.5 in.wg)
-1171 Pa (4.7 in.wg)
224 Pa (0.9 in.wg)
C D E
(I-P) in.wg
(SI) Pa
BA
Figure D.4 - Pressure Gradients - Exhaust System

Annex E. References
These references contain additional information related to the subject of this manual:
1. ANSI/AMCA 210-99, Laboratory Methods of Testing Fans for Aerodynamic Performance Rating, Air Movementand Control Association International, Inc., 30 West University Drive, Arlington Heights, IL, 60004-1893 U.S.A.,1999.
2. AMCA Publication 200-95, Air Systems, Air Movement and Control Association International, Inc., 30 WestUniversity Drive, Arlington Heights, IL, 60004-1893 U.S.A., 1995.
3. AMCA Publication 202-98, Troubleshooting, Air Movement and Control Association International, Inc., 30 WestUniversity Drive, Arlington Heights, IL, 60004-1893 U.S.A., 1997.
4. ASHRAE Handbook, HVAC Systems and Equipment, 1996, The American Society of Heating, Refrigeratingand Air Conditioning Engineers, Inc., 1791 Tullie Circle N.E., Atlanta, GA, 30329 U.S.A., 1996, (Chapter 18Fans).
5. Traver, D. G., System Effects on Centrifugal Fan Performance, ASHRAE Symposium Bulletin, Fan Application,Testing and Selection, The American Society of Heating, Refrigerating and Air Conditioning Engineers, Inc.,1791 Tullie Circle N.E., Atlanta, GA, 30329 U.S.A., 1971.
6. Christie, D. H., Fan Performance as Affected By Inlet Conditions, ASHRAE Transactions, Vol. 77, TheAmerican Society of Heating, Refrigerating and Air Conditioning Engineers, Inc., 1791 Tullie Circle N.E.,Atlanta, GA, 30329 U.S.A., 1971.
7. Zaleski, R. H., System Effect Factors For Axial Flow Fans, AMCA Paper 2011-88, AMCA EngineeringConference, Air Movement and Control Association International, Inc., 30 West University Drive, ArlingtonHeights, IL, 60004-1893 U.S.A., 1988.
8. Roslyng, O., Installation Effect on Axial Flow Fan Caused Swirl and Non-Uniform Velocity Distribution,Institution of Mechanical Engineers (IMechE), 1 Birdcage Walk, London SW1H 9JJ, England, 1984.
9. Clarke, M. S., Barnhart, J. T., Bubsey, F. J., Neitzel, E., The Effects of System Connections on FanPerformance, ASHRAE RP-139 Report, The American Society of Heating, Refrigerating and Air ConditioningEngineers, Inc., 1791 Tullie Circle N.E., Atlanta, GA, 30329 U.S.A., 1978.
10. Madhaven, S., Wright, T., J. DiRe, Centrifugal Fan Performance With Distorted Inflows, The American Societyof Mechanical Engineers, 345 East 47th Street, New, York, NY, 10017 U.S.A., 1983.
11. Cory, W. T. W., Fan System Effects Including Swirl and Yaw, AMCA Paper 1832-84-A5, AMCA EngineeringConference, Air Movement and Control Association International, Inc., 30 West University Drive, ArlingtonHeights, IL, 60004-1893 U.S.A., 1984.
12. Cory, W. T. W., Fan Performance Testing and Effects of the System, AMCA Paper 1228-82-A5, AMCAEngineering Conference, Air Movement and Control Association International, Inc., 30 West University Drive,Arlington Heights, IL, 60004-1893 U.S.A., 1984.
13. Galbraith, L.E., Discharge Diffuser Effect on Performance -Axial Fans, AMCA Paper 1950-86-A6, AMCAEngineering Conference, Air Movement and Control Association International, Inc., 30 West University Drive,Arlington Heights, IL, 60004-1893 U.S.A., 1986.
14. Industrial Ventilation –23rd Edition, American Conference of Governmental Industrial Hygienists, 1330 KemperMeadow Drive, Cincinnati, OH 45240-1634 U.S.A., 1998.
15. Fans and Systems, John E. Thompson and C. Jack Trickler, The New York Blower Company, ChemicalEngineering, March 21, 1983, pp. 48-63
16. AABC National Standards, Chapter 8, Volume Measurements, Associated Air Balance Council, 1518 K StreetNW, Suite 503, Washington, DC 20005 U.S.A.
AMCA 201-02 (R2011)
70
The Air Movement and Control Association International Inc. is a not-for-profit association of the world’s manufacturers of air system equipment, such as fans, louvers, dampers, air curtains, airflow measurement stations, acoustic attenuators and other air system components for the industrial and commercial markets.
Air Movement and Control Association InternationalAMCA Corporate Headquarters30 W. University Drive, Arlington Heights, IL 60004-1893, [email protected] n Ph: +1-847-394-0150 n www.amca.org
AMCA Membership Information http://www.amca.org/members/members.php
AMCA International Headquarters and Laboratorywww.amca.org
AMCA White Paperswww.amca.org/whitepapers
Searchable CRP Database of AMCA Certified Productswww.amca.org/certified-listed/cpsearch.php
VISIT THE AMCA STOREAMCA provides its Publications (no cost) and Standards (cost) through the AMCA Store. Any document selected will be bring up options for a free or at-cost PDF, and, where applicable, at-cost print (hard copy), redline, multi-user license and PDF + print options. To access member-only pricing and access your 50% discount, first log into MyAMCA or click on MyAMCA from within the AMCA website. For more information on AMCA Publications and Standards, visit www.amca.org/store.