Altran H1 2018 results - Présentation PowerPoint
37
September 6 th , 2018 Altran H1 2018 results
-
Upload
khangminh22 -
Category
Documents
-
view
0 -
download
0
Transcript of Altran H1 2018 results - Présentation PowerPoint

September 6th, 2018
Altran H1 2018 results

Disclaimer
2
This presentation has been prepared by Altran Technologies S.A. (“Altran”) in connection with the publication of its H1 results and does not purport to contain all the information that may be necessary or
desirable to evaluate Altran. The information set out in this presentation is not intended to form the basis of any contract or definitive offer of securities capable of acceptance. Neither this presentation, nor
any information it contains may be released, presented, published, distributed or otherwise transmitted in any jurisdiction where to do so would constitute a violation of the relevant laws or regulations of
such jurisdiction. Non-compliance with these restrictions may result in the violation of laws and regulations of such jurisdictions. Altran assumes no responsibility for any violation of such laws and
regulations by any person. This presentation does not constitute an advertisement or offering memorandum. This presentation should not be construed or treated as providing legal, tax, regulatory,
accounting or investment advice, and is not intended to form the basis of any investment decision. This presentation does not constitute an offer to acquire, purchase, subscribe for, sell or exchange (or
the solicitation of an offer to acquire, purchase, subscribe for, sell or exchange), any securities in any jurisdiction where to do so would constitute a violation of the laws of such jurisdiction. Any offer of
Altran securities may only be made in France pursuant to a prospectus having received the visa of the Autorité des marchés financiers (“AMF”) or, outside of France, pursuant to an offering document
prepared for such purpose in accordance with applicable laws. Any investment decision shall only be made on the basis of such prospectus and/or offering document. This presentation does not constitute
an offer or a solicitation to sell or subscribe requiring a prospectus within the meaning of Directive 2003/71/EC of the European Parliament and Council dated 4 November 2003, as amended, in particular
by Directive 2010/73/EU in the case where such directive was implemented into law in the member States of the European Economic Area (together, the “Prospectus Directive”). This presentation is not a
prospectus within the meaning of the Prospectus Directive or otherwise.
No Representation or Warranty
This presentation includes only summary information and does not purport to be comprehensive. No representation, warranty or undertaking, express or implied, is made by Altran as to, and no reliance
should be placed on the completeness of the information and/or opinions contained herein or in any connected written or oral communications. In particular, but without limitation, no representation or
warranty is given as to the achievement or reasonableness of, and no reliance should be placed for any purpose whatsoever on, any targets, estimates, forecasts or other information contained in this
presentation. None of Altran or any of its affiliates, directors, officers, advisors, employees and agents accepts any responsibility or liability whatsoever (for negligence or otherwise) for any loss howsoever
arising from any use of this presentation or its contents or otherwise arising in connection therewith. All information in this presentation is subject to verification, correction, completion and change without
notice. In giving this presentation, none of Altran, nor any of its affiliates, directors, officers, advisors, employees or agents undertakes any obligation to provide the recipient with, or with access to, any
additional information or to update this presentation.
Forward-looking statement
This presentation includes certain projections and forward-looking statements with respect to the anticipated future performance of Altran.
Such information is sometimes identified by the use of the future tense, the conditional mood and forward-looking terms such as “think,” “aim,” “expect,” “intend,” “should,” “has the ambition of,” “consider,”
“believe,” “wish,” “could” and so forth. This information is based on data, assumptions and estimates that Altran considers reasonable. Actual results could differ materially from those projected or forecast
in the forward-looking statements. All forward-looking statements contained in this presentation are expressly qualified in their entirety by the cautionary statements contained or referred to in this
disclaimer. Each forward-looking statement speaks only as at the date of this presentation. Altran makes no undertaking to update or revise any information or the objectives, outlook and forward-looking
statements contained in this presentation or that Altran otherwise may make, except pursuant to any statutory or regulatory obligations applicable to Altran.
No statement in this presentation is intended as a profit forecast or estimate for any period. Persons receiving this document should not place undue reliance on forward-looking statements. Past
performance is not an indicator of future results and the results of Altran in this document may not be indicative of, and are not an estimate or forecast of, the future results of Altran.
This presentation includes market and competition data relating to Altran. Some of this data was obtained from external market research. Such publicly available data is not endorsed by Altran as being
accurate and has not been independently verified and Altran cannot guarantee that a third-party using different fact-gathering, analytical or calculation methods to compute market data would obtain the
same results. Unless otherwise stated, data included in this presentation relating to market size and competitive positions in Altran’s core markets is based on Altran’s management’s estimates. All such
data is included herein for information purposes only and is subject to the provisions of this notice.

3
Table of contents
Highlights of the period1
H1 2018 financial results2
Update on Aricent 3
Conclusion4

01.
Highlights of the period

5
Executive summary - H1 performance
Growth across all European countries except Benelux, Altran US reaching double-digit growth.
Investments translating into double digit growth in software engineering, semiconductor & electronics, space &
defense
Solid operating margin at 10.1%
Adjusted* net income at €57 million
Free Cash Flow mostly impacted by Aricent acquisition and working capital variation
Pipeline development:
• Industrialized services : very significant traction in Automotive, Aerospace &
Semiconductors. Accelerated pace of landmark projects signed or in advanced talks (total
contracts value >€200m over 3 years)
• High Value Services: growing demand for our solutions in AI/Analytics and Smart
Manufacturing - strong pipe of synergies with frog®
• Mainstream R&D services: accelerated Net Hiring in Q2 ; ambitious recruitment campaigns
rolled out Q2/Q3 (notably France)
*adjusted for PPA arising from Aricent acquisition, acquisition fees, insurance premium, one-offs related to the Group refinancing, integration costs, net of tax impacts.

6
External investigation confirms Aricent pre-acquisition incident was an isolated event.
Targeted action plan launched early July to restore Aricent margin to previous profile before year-end.Current margin profile of c. 15.6% on a LTM June 2018 basis, as communicated on 13 July.
Growing momentum of common customer engagements to support future growth
Integration plan on track versus initial roadmap
Executive summary - Aricent

7
H1 2018 Financial snapshot
* adjusted for PPA arising from Aricent acquisition, acquisition fees, insurance premium, one-offs related to the Group refinancing, integration costs, net of tax impacts.
** Free Cash Flow after paid finance cost
*** see details on page 17
€ 1,373m+18.5% (reported) vs. H1’17
+5.2% (economic) vs. H1’17
Aricent contribution: €162m
OPERATING MARGIN
€ 138.5m+28.8% vs. H1 2017
Aricent contribution: €27.4m
MARGIN
10.1%+80bps vs. H1 2017
NET INCOME (CONTINUED OPERATIONS)
€ 10m -81.9% vs. H1 2017
ADJUSTED NET INCOME* (CONTINUED OPERATIONS)
€ 57m +2.2% vs. H1 2017
FREE CASH FLOW**
€ (225)mo/w c.€(124)m linked to Aricent
transaction***
vs. € (14)m in H1 2017
REVENUESREVENUES

02.
H1 2018 financial results

9
H1 2018 financial highlights
Solid operating performance, delivering 10.1% operating margin
Free Cash Flow mostly impacted by the transaction and working capital variation
Long-term financing in place at attractive conditions
H1 not reflective of the full-year due to transaction-related items and typical seasonality

Economic to reported growth
10
Q2 2018
H1 2018

Steady growth in Q2 and in H1
11* Organic growth calculated on a constant forex and perimeter
** Economic growth calculated on organic growth at constant working days
(in €m) 2018Reported
Growth
Organic
Growth%*
Economic
Growth%**
FRANCE 484.5 2.9% 3.5% 4.3%
EUROPE 619.5 4.1% 5.7% 5.7%
Germany & Austria 144.5 4.0% 6.9% 7.1%
Iberia 130.2 12.2% 12.3% 12.1%
Italy 117.8 8.2% 8.1% 7.3%
Belgium & Netherlands 79.4 -5.5% -4.9% -4.1%
UK 98.9 5.2% 3.7% 3.7%
Scandinavia 32.6 -9.4% 3.1% 3.1%
Switzerland 16.1 -5.3% 3.1% 3.9%
AMERICAS 252.2 227.1% 10.5% 9.7%
ASIA (China) 16.5 8.6% -2.3% -3.5%
TOTAL 1,372.7 18.5% 5.0% 5.2%
First Half
2018Reported
Growth
Organic
Growth%*
Economic
Growth%**
233.9 2.6% 3.3% 3.1%
316.2 6.6% 7.9% 4.5%
74.4 4.1% 5.9% 4.1%
67.8 16.7% 16.7% 14.3%
59.6 7.2% 7.1% 5.5%
38.9 -2.5% -1.9% -1.9%
51.3 11.3% 9.1% 7.5%
15.9 -7.6% 7.2% 5.5%
8.3 0.0% 8.6% 7.0%
187.9 384.3% 12.1% 9.5%
8.8 12.8% -1.6% -0.4%
746.8 30.7% 6.2% 4.9%
Second Quarter

30 82132 848 33 665
45 01145 526
Q2 2017 Q3 2017 Q4 2017 Q1 2018 Q2 2018
H1 resources
12
Net hiring:
+914 end of Jun 2018
vs. Dec. 2017
o/w +1,115
at Altran
+ 14,705

Improvement in operating performance, net profitability being impacted by acquisition related items
13
Income statement (in €m ) H1 2018 H1 2017 %
Revenues 1,372.7 1,158.0 18.5%
Net operating expenses (1,234.2) (1,050.5)
Operating margin 138.5 107.5 28.8%
% of revenues 10.1% 9.3%
Other expenses (69.9) (16.0)
Operating income 68.6 91.5 -25.0%
Net financial expenses (53.8) (14.1)
Income tax (5.0) (23.1)
Share of net income of associates (0.2)
Net Income before discontinued
operations 9.8 54.1 -81.9%
Net income from discontinued
operations(0.2) 0.6 -133.3%
Non-controlling interests (0.1)
Net income (Group share) 9.5 54.7 -82.6%
Adjusted net income (Group share) 57.5 56.2 2.2%
All reported figures include Aricent from 20 March 2018 and fully reflect the implementation of IFRS15. Financial statements for H1 2017 have been restated
accordingly.

Details of net operating expenses and other expenses
14
(in €m ) H1 2018 H1 2017
Cost of revenues (995.6) (843.6)
o/w amortization of large software deals (7.3)
Selling, General & Administrative expenses (238.6) (206.9)
Net operating expenses (1,234.2) (1,050.5)
(in €m ) H1 2018 H1 2017
Amortization of intangibles arising from business
combinations(26.4) (2.2)
Restructuring costs (14.8) (7.3)
Acquisition & integration costs (27.5) (2.6)
Litigations and miscellenaeous (0.4) (1.6)
Share based compensation (0.8) (2.3)
Other expenses (69.9) (16.0)
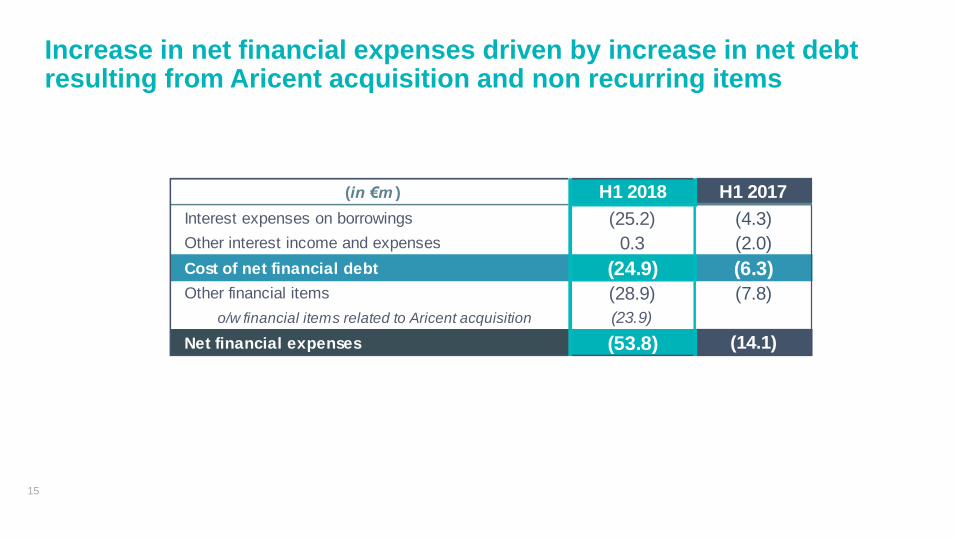
Increase in net financial expenses driven by increase in net debt resulting from Aricent acquisition and non recurring items
15
(in €m ) H1 2018 H1 2017
Interest expenses on borrowings (25.2) (4.3)
Other interest income and expenses 0.3 (2.0)
Cost of net financial debt (24.9) (6.3)
Other financial items (28.9) (7.8)
o/w financial items related to Aricent acquisition (23.9)
Net financial expenses (53.8) (14.1)

16
Balance sheet evolution reflects Aricent deal
€4,783m
ASSETS
€2,339m
Cash€395m Cash €208m
Receivables and other current assets €682m
o/w clients 358m
Receivables and other
current assets €1,071m
o/w clients 445m
Non-current assets
€1,262mo/w goodwil
€834m
Non-current assets
€3,504m
o/w goodwil€2,282m
30 June 2017 30 June 2018
Other liabilities €700m
Other liabilities €1,278m
Debts€780m
Debts€1,906mEquity
€859m
Equity €1,599m
30 June 2017 30 June 2018
LIABILITIES
€2,339m €4,783m

Free Cash Flow mostly impacted by the acquisition and working capital variation
17
(in €m) H1 2018 H1 2017
Operating margin 138.5 107.5
Depreciation, Amortization and changes in Provisions 25.1 11.3
Non-cash P&L items (0.2) (3.6)
Non recurring items (cash impact) (24.4) (18.5)
CASH FLOW 139.0 96.7
Change in WCR (168.8) (63.0)
o/w one-offs related to the acquisition (18.0)
Capital expenditures (69.4) (28.5)o/w capital expenditures - payments on Large software
deals(32.0)
Net interest and financial expense paid (105.5) (5.9)
o/w one-offs related to the (re)financing (84.6)
o/w interests on Aricent financing debt (16.0)
Tax paid (20.1) (13.0)
FREE CASH FLOW (224.8) (13.7)
(35) Shift of invoicing
(48.7) H1 2017 normalized FCF

Main items explaining the €175 m variation vs. H1 2017 normalized Free Cash Flow
18
ACQUISITION-RELATED
OUTFLOWS
-€116m
Costs linked to the debt
(re)financing -€85m
Impact of the transaction
on Working Capital c.- €31m
NEW CASH ITEMS INDUCED
BY ARICENT IN H1
-€8m
Cash flow from operations c.+ €40m(3 months 12 days)
Cash commitments from
software deals - €32m
(6 months)
Interest expenses on debt - €16m(3 months 12 days)
ALTRAN Y/Y
FCF VARIATION
-€51m
Cash flow from operations + €7m
Additional CAPEX - €6m
Non recurring items and
tax paid - €12m
Change in working capital - €40m
One-time event Recurring items looking
ahead / full year impact to
expect

19
Net debt evolution reflects Aricent financing

20
New long-term financing in place at attractive conditions
Net debt as of 30/06/2018:
€1,697.6m
Proforma Financial
Leverage ratio: c. 4.2x*
* incl acquisitions proforma EBITDA 12 months and net debt excluding acquisitions differed payments/earn-outs
€mJune 2018
utilized
June 2018
available
Term Loan B 1587.8
Revolving Credit Facility 0.0 250.0
Commercial Paper (NEU CP) 250.5 249.5
Consolidated factoring debt 54.5
Other 14.0 28.5
Total gross debt 1905.8 528.0
Cash & Cash Equivalents 208.2
Consolidated net debt 1697.6
Factoring 177.0 170.0
Deconsolidated factoring (excluding security
deposit) 122.5
Consolidated factoring debt 54.5
Total available committed and uncommitted credit lines 698.0
H1 net cost of debt
2.05%
Normalized cost of debt
c.3%

03.
Update on Aricent

22
Update on the incident
• 13 July: Announcement of a pre-acquisition incident with
financial implications
• $10m forged purchase orders over Q3’17 to Q1’18 from
one individual related to one client only
• Reassessment of Aricent margin profile down from
18.3% (LTM 09/17) to 15.6% (LTM 06/18, unaudited)
due to:
• $10 m forged PO
• in the context of this inflated profit, misguided
decisions on spending, and on additional
investments which have not yet materialized in
expected growth
• External investigations immediately launched
FACTS
• External investigations confirm the incident as an
isolated one.
• Complete overhaul of Aricent internal control underway
to reach highest standards.
• Targeted action plan launched early July to restore
Aricent margin to previous profile. Good confidence it
will bear expected fruits by year-end
• Counsels to advise on the next legal steps. Decision to
be agreed by the Board of Directors. Not to be
discussed at this stage.
STATUS as of 6 Sept. 2018 and NEXT STEPS

Update on the convergence program and synergies
20192018 2020
• Service models aligned
• US build-up integrated
• Talent management unified
• Integration:
• Common Go to Market for key customers in place
• North America operations under unified management
• Semiconductors & electronics under unified
management
• Delivery in India convergence started
• Value proposition convergence underway
• Aricent finance processes integrated into Altran
• Top line synergies :
• 15 common wins to date and 80+ opportunities in the
pipe, across innovation & design, cybersecurity,
analytics, software engineering, field testing, …
• Target Operating Model
rolled out
• Synergies totally delivered
• Group ERP running
• Legal & tax structure
simplified
22

04.
Conclusion

25
Conclusion
Solid H1 operating performance and completion of a transformative deal
2
3
1
Forgery at Aricent confirmed as an isolated event – integration on track
Team fully focused on top line growth acceleration, profit expansion
and cash conversion

Appendix

1. Operating margin is made up of the difference between the revenues and
the net operating expenses
2. Organic growth is the reported growth restated for the impact of
perimeter and change effects
3. Economic growth is the organic growth restated for the variation in the
number of working days
4. FCF: Operating margin + D&A + non-cash P&L – non-recurring items +/-
WCC – Capex – net interest and financial expense paid – tax paid
In accordance with the AMF’s position « DOC 2015-12 » applicable as of July 3, 2016, please
find below the definitions of the alternative performance indicators
GLOSSARY
26

Ma
rk
et g
ro
wth
Altra
n P
erfo
rm
an
ce
Market view & Altran performance by industry (1/2)
Automotive
21% of revenues
Aerospace/Defense
18% of revenues
28
Industries
6% of revenues
Energy
6% of revenues
Key: Low growth High growthMedium growth
• Overall energy sector still in crisis –
market driven by digitalization,
nuclear, renewables and distributed
generation.
• Nuclear market growing with 50
plants in construction and 160
planned (e.g. 15 in India).
• Business back to growth in Nuclear
and Wind (large deals and
increasing success of Industrialized
GlobalShore®).
• Growing traction on digitalization
solutions amongst all segments.
• Strong order backlog (35K new
aircrafts by 2036), leading to manufacturing
ramp-up and search for productivity.
• Civil aircraft market consolidation (e.g.
Airbus/Bombardier, Boeing/Embraer).
• Equipment manufacturers still driven by
investments in new technologies.
• Fast growth of space and defense market
due to international context and digitalization.
• Good traction with European OEMs
on Customer Services activities,
Analytics and IoT.
• Weak performance on standard
engineering (e.g. aero-structure,
embedded SW).
• Strong positioning in engineering
manufacturing to support end to end
production ramp-up & digitization.
• Continuous traction on digitization,
connectivity, autonomous driving and
electrification from OEMs & Tier 1s.
• High traction from customers on new
manufacturing processes (e.g. IoT,
ALM).
• Innovation and product value
increasingly defined by software.
• Confirmed success of our
Industrialized GlobalShore® model,
with a flagship project won with a
leading OEM.
• Reinforced positioning in
Connectivity and HMI thanks to
Aricent and frog design capabilities.
• Performance slowed down by 2
customers over the semester.
• Growing propensity towards
digitization, enhanced efficiency
and cost optimization.
• Growing demand of the different
segments of industry 4.0: discrete
and machine automation,
advanced robotics and predictive
maintenance.
• Growing traction on Industry 4.0
leveraging the WCC Advanced
Manufacturing, IoT Solutions and
Analytics.
• On Consumer goods, traction on
customization deals through our
Innovation & Design WCC.

Ma
rk
et g
ro
wth
Altra
n P
erfo
rm
an
ce
Market view & Altran performance by industry (2/2)
Life Sciences
9% of revenues
Communications
16% of revenues
29
• High growth in the Consumer
& Internet and New Age Enterprise
market segments.
• Medium to high growth in the
traditional enterprise segment.
• Clients are increasingly looking to
engineering services companies to
solve for both “time” and “cost.”
• High growth with small & mid-size
customers on the US West Coast.
• Significant vertical integration in large
R&D spenders, enabling Altran to sell
our diverse portfolio of services from
software to hardware and support.
• Strong traction for digital
transformation offerings.
Software &
Internet
6% of revenues
Semiconductor
& Electronics
6% of revenues
Key: Low growth High growthMedium growth
• Overall dynamic market , especially
for Digital Health, together with
important clients’ strategic moves to
refocus on added-value domains.
• The important re-organization trends
(e.g. large M&A) of some of the big
players are temporarily slowing down
the ER&D market in Europe.
• Reinforcement of partnerships
with our main clients, leveraging
World-Class Centers and
Industrialized GlobalShore®.
• Partner of Sanofi for their world-wide
“Factory of the Future” program.
• Telco players leveraging Cloud and
Digital to improve efficiency, while
preparing the launch of 5G Trials.
• Strong consolidation through M&A
activities, especially in the US
(Sprint’s acquisition by T-Mobile,
AT&T and Time Warner…).
• Good performance of Advanced
Networks World-Class Center,
supporting key operators on 5G
development projects and Use cases.
• Revamping our global approach
and strategy following the Aricent
acquisition.
• Excluding memory, growth
led by FPGAs & ASSPs in automotive,
industrial and data processing, 32-bit
MCUs CMOS & photo sensors.
• Growing demand in verticals for
dedicated chips to support AI, HMI/UX,
VPAs & similar emerging IoT/
connectivity technologies to gain early-
mover advantage.
• Growth driven by scale, broad full-
service capability and ongoing
consolidation as well as growth in
China.
• High growth in semiconductors,
leveraging our Industrialized
GlobalShore® model in India.

Quarterly revenues change (in €m)
30
571,2532,4
604,9625,9
746,8
Q2 2017 Q3 2017 Q4 2017 Q1 2018 Q2 2018

Balance sheet - assets (in €m)
31
June 2018 Dec. 2017
Gross valueAmort. And
Prov.Net Value Net value
Net Goodwill 2,470 (188) 2,282 902
Intangible assets 918 (169) 749 90
Land and buildings 67 (8) 59 41
Other property, plant and equipment 260 (179) 81 51
Property, plant and equipment 327 (187) 140 92
Investments in associates - - -
Non-current financial assets 60 (4) 56 39
Deferred tax assets 118 (18) 100 96
Non-current tax assets 159 (1) 158 117
Other non-current assets 23 (5) 18 5
Total non-current assets 4,075 (572) 3,503 1,341
Inventory and work in progress 2 2 2
Advances to suppliers 2 2
Trade receivables and related accounts 453 (8) 445 358
Other receivables 322 322 136
Trade accounts and other receivables 777 (8) 769 494
Assets relating to contracts with customers 290 290 128
Current financial assets 12 (1) 11 13
Cash equivalents 6 6 204
Cash 202 202 169
Total current assets 1,289 (9) 1,280 1,010
TOTAL ASSETS 5,364 (581) 4,783 2,351

Balance sheet - liabilities (in €m)
32
June 2018 Dec. 2017
Shareholder's equity 1,599 891
Total non-current liabilities 2,000 146
Bonds (>1 year) -
Bank loans and borrowings (>1 year) 1,596
Other non-current financial liabilities (2) 1
Non-current financial liabilities 1,594 1
Non-current provisions for contingencies and liabilities 89 48
Non-current employee benefits 61 39
Non-current liabilities for fixed assets 67 -
Deferred tax liabilities 174 19
Non-current liabilities for securities - 33
Other long-term liabilities 15 6
Other non-current liabilities 406 145
Total current liabilities 1,184 1,314
Suppliers and other current payables 716 472
Trade payables and related accounts 162 136
Taxes payable 223 111
Current employee benefits 252 214
Current liabilities for fixed assets 71 4
Other current payables 8 7
Liabilities relating to contracts with customers 81 96
Other current liabilities 387 746
Provisions for short-term risks and charges 18 17
Current liabilities for securities 57 6
Current financial liabilities 312 723
TOTAL SHAREHOLDERS' EQUITY AND LIABILITIES 4,783 2,351

H1 & FY 2017 income statement restated for IFRS15 (in €m)
33
H1 2017
(published)IFRS15
H1 2017
(restated)
2017
(published)IFRS15
2017
(restated)
Revenues 1,151.8 6.2 1,158.0 2,282.2 13.1 2,295.3
Other operating income 30.1 30.1 69.4 69.4
TOTAL OPERATING INCOME 1,181.9 6.2 1,188.1 2,351.6 13.1 2,364.7
Purchases & external expenses (245.8) (6.2) (252.0) (487.7) (13.1) (500.8)
Personnel costs (817.0) (817.0) (1,607.4) (1,607.4)
Taxes (2.0) (2.0) (2.9) (2.9)
Amortization and provisions (11.9) (11.9) (7.3) (7.3)
Customer-relationship amortization / Goodwill depreciation (2.2) (2.2) (4.3) (4.3)
CURRENT OPERATING INCOME 103.0 0.0 103.0 242.0 0.0 242.0
Non recurring Income / Losses (11.5) (11.5) (39.0) (39.0)
OPERATING INCOME 91.5 0.0 91.5 203.0 0.0 203.0
Cost of net financial debt (6.3) (6.3) (11.8) (11.8)
Other financial income / losses (7.8) (7.8) (8.3) (8.3)
Shares of net income of associates (0.2) (0.2) (0.4) (0.4)
Corporate income taxes (23.1) (23.1) (42.8) (42.8)
NET INCOME BEFORE DISCONTINUED OPERATIONS 54.1 0.0 54.1 139.7 0.0 139.7
Net profit/loss on discontinued operations 0.6 0.6 (8.9) (8.9)
Non-controlling interest 0.0 0.0
GROUP NET INCOME 54.7 0.0 54.7 130.8 0.0 130.8

Income statement (in €m)
34
H1 2018 H1 2017
Revenues 1,372.7 1,158.0
Other operating income 37.1 30.1
TOTAL OPERATING INCOME 1,409.8 1,188.1
Purchases & external expenses (298.5) (252.0)
Personnel costs (950.0) (817.0)
Taxes (2.3) (2.0)
Amortization and provisions (21.3) (11.9)
Customer-relationship amortization / Goodwill depreciation (26.4) (2.2)
CURRENT OPERATING INCOME 111.3 103.0
Non recurring Income / Losses (42.7) (11.5)
OPERATING INCOME 68.6 91.5
Cost of net financial debt (24.9) (6.3)
Other financial income / losses (28.9) (7.8)
Shares of net income of associates (0.2)
Corporate income taxes (5.0) (23.1)
NET INCOME BEFORE DISCONTINUED OPERATIONS 9.8 54.1
Net profit/loss on discontinued operations (0.2) 0.6
Non-controlling interest (0.1) 0.0
GROUP NET INCOME 9.5 54.7
ADJUSTED NET INCOME 57.5 56.2

Income statement (in €m) / Geographical data – IFRS 8
* Consolidating Aricent as at 20 March 2018
35
H1 2018 H1 2017 % H1 2018 H1 2017 %
France 484.5 470.8 2.9% 54.6 55.6 -1.8%
Europe 619.5 594.9 4.1% 47.9 47.2 1.5%
Americas 252.2 77.1 227.1% 35.9 4.5 697.8%
Asia (China) 16.5 15.2 8.6% 0.1 0.2 -50.0%
TOTAL 1,372.7 1,158.0 18.5% 138.5 107.5 28.8%
Revenues Operating margin

Cash flow statement (in €m)
36
30 June 2017 31 December 2017 30 June 2018
OPENING NET DEBT (209.6) (209.6) (351.1)
Operating income before Customer-relationship amortization / impaiment
losses105.2 246.3 137.7
Net operating depreciations and amortizations 12.0 9.3 24.0
Non-cash P&L items (2.0) (1.1) 1.7
Non recurring items (cash impact) (18.5) (29.4) (24.4)
CASH FLOW before net interest expenses and taxes 96.7 225.1 139.0
Working capital requirement (72.7) (4.6) (177.6)
Tax paid & change in tax liabilities & assets (13.0) (44.9) (20.1)
Interest paid & other financial charges (5.9) (11.1) (105.5)
Net cash flows from discontinued operations 6.6 (3.0) (0.2)
NET CASH FLOW GENERATED BY OPERATIONS 11.7 161.5 (164.4)
Earn-outs (0.4) 0.1
Scope change (32.1) (111.0) (1,768.6)
Capex (28.5) (57.5) (69.4)
Others (4.1) (3.0) (4.0)
Net cash from investments made by discontinued operations (0.1) 0.1 0.0
NET CASH FLOW RELATED TO INVESTMENTS (64.8) (171.8) (1,841.9)
Capital raised 718.8
Share buy-back (1.0) (1.6) 0.1
Dividends (41.5) (41.5) (60.9)
Timing differences factor deconsolidation (76.5) (78.1) (23.6)
Other financing transactions (1.4) (3.9) 57.6
Net cash from financing activities of discontinued operations 0.0 0.0 0.0
NET CASH FLOW GENERATED BY FINANCING TRANSACTIONS (120.4) (125.1) 692.0
Foreign exchange rate impact (1.6) (6.1) (32.2)
Change in net debt (175.1) (141.5) (1,346.5)
CLOSING NET DEBT (384.7) (351.1) (1,697.6)

64% of or total gross debt is protected against interest rates increases by caps
Gross debt by rate type
64%0,1%
36%
Capped
Fix
Float
689.8m
1214.4m
38