
Présentation PowerPoint - JCDecaux
62
Iconic bus shelters on Chater Road in Hong Kong, China 2020 ANNUAL RESULTS March 11 th , 2021
-
Upload
khangminh22 -
Category
Documents
-
view
1 -
download
0
Transcript of Présentation PowerPoint - JCDecaux

Iconic bus shelters on Chater Road in Hong Kong, China
2020 ANNUAL RESULTS
March 11th, 2021

BUSINESS OVERVIEW FY 2020Jean-Charles Decaux
Chairman of the Executive Board and Co-CEO
Changer les photos

In million Euros, except %. Adjusted figures (1) except when IFRS. 2020 2019
► Revenue 2,311.8 3,890.2 -40.6%
► Operating margin 141.6 792.2 -82.1%
► EBIT before impairment charge (2) (352.9) 385.2 -191.6%
► Net income Group share before impairment charge, IFRS (3) (393.3) 267.3 -247.1%
► Net income Group share, IFRS (604.6) 265.5 -327.7%
► Funds from operations net of maintenance costs (56.2) 550.8 -110.2%
► Free cash flow 161.9 169.7 -4.6%
► Net debt as of end of period, IFRS 1,086.3 1,125.0
2020 ANNUAL RESULTS
3
(1) Adjusted figures include our prorata share in companies under joint control accounted for using the equity method under IFRS 11 and exclude the IFRS 16 impact on core business lease contracts.(2) The impact of the impairment charge on EBIT in 2020 corresponds to a -€36.7m impairment charge on intangible assets and PP&E, a -€9.4m net provision for onerous contracts, a -€0.2m provision on net assets from companies under joint control and a -€176.0m impairment of goodwill. The impact of the impairment charge on EBIT in
2019 corresponds to a -€2.0m impairment on intangible assets, PP&E, a €1.0m net reversal on provisions for onerous contracts, a €10.7m reversal on net assets from companies under joint control and a -€10.0m impairment of goodwill.(3) The impact of the impairment charge on Net income Group share in 2020 corresponds to an impairment charge on intangible assets and PP&E, rights-of-use and equity affiliates (including a -€4.0m depreciation on companies under significant influence), a net provision for onerous contracts and an impairment on goodwill (net of tax and
net of the impact on minority interests) for -€211.3m. The impact of the impairment charge on Net income Group share in 2019 corresponds to an impairment charge on intangible assets and PP&E, rights-of-use and equity affiliates, a net reversal on provisions for onerous contracts and an impairment on goodwill (net of tax and net ofthe impact on minority interests) for -€1.8m.
The values shown in the tables are generally expressed in millions of euros. The sum of the rounded amounts or variations calculations may differ, albeit to an insignificant extent, from the reported values. Please refer to the Appendices section for financial definitions.

76%85% 87% 83%
73%
54%
24%15% 13% 15%
26%
44%
2% 1% 2%
April May June July September November
No restrictions
Borders opened but tests/quarantine required
Complete or partial closure of borders
+1.5% +1.5%+0.6%
+2.2%
+6.1%
+2.7%
-9.1%
-11.2%
-5.5%
-3.7%
+1.8%
-4.2%
+6.0%
+4.2%+2.8% +3.2%
+8.0%
+4.2%
2019 2020 2021
2020: UNPRECEDENTED CRISIS
4Source: UNWTO
GDP GROWTH
Source: OECD “OECD Economic Outlook: Statistics and Projections” – December 2020
ONLY 2% OF COUNTRIES
WITH NO RESTRICTIONS

AUDIENCES DECLINED BY MORE THAN 60%DRIVEN BY UNPRECEDENTED GLOBAL & LOCAL LOCKDOWNS
5Source: AdSquare (Mobile data)Baseline is defined as the reference traffic before lockdown
-67.9%
-49.2%
-56.8%
-53.2%
-10.6%
-33.0%
-65.0%
17.8%
1.6%
-80.0%
-54.8%
-77.1%
-62.6%
-0.7%
-53.3%
-71.8%
-57.9%
-32.5%
-72.4%
-12.0%
-22.2%
-45.5%
-12.3%
-60.4%
-72.7%
-30.3%
-41.1%
-100%
-80%
-60%
-40%
-20%
0%
20%
40%
USA Singapore Belgium United Kingdom Italy Australia France Germany Spain

UNPRECEDENTED AUDIENCE DECLINE IN PUBLIC TRANSPORT
6
-70%in our audiences in public transportation in Brussels (3)
(1) Compared to the same period in 2019 (i.e. February)(2) YouGov data: Percentage of the equivalent period in 2019 (i.e. April and May)(3) Compared to pre-Covid-19 period (i.e. February 2020)
-85%in our audiences in metros (1)
-85%in our audiences in metros (3)
-92%in TfL audiences (metros, buses) (2)
-95%in our audiences in National Rail (2)
-88% in Beijing metro -79% in Guangzhou metro
-81% in Shanghai metro -89% in Nanjing metro

Region Q1 Q2 Q3 Q4 (1) 2020
Africa -17.8% -97.4% -84.0% -73.8% -69.5%
Asia-Pacific -36.4% -82.1% -65.2% -53.1% -59.2%
Europe -23.2% -96.3% -72.5% -80.0% -70.8%
Latin America – Caribbean -13.9% -94.1% -79.0% -61.5% -61.8%
Middle East -16.1% -96.0% -84.0% -87.8% -70.6%
North America -19.1% -89.1% -71.9% -69.2% -63.6%
World -26.3% -89.4% -71.1% -64.1% -64.2%
Source: ACI World(1) Estimates
Airport passenger traffic volumes in 2020 by region: actual (under-Covid-19) vs. projected (pre-Covid-19)
AIRPORT AUDIENCE COLLAPSED
7

-31.9%
-47.1%
-30.8%
-38.1%-33.0%
-50.4%
-34.6%
-40.6%
2020 ADJUSTED REVENUE GROWTH BY SEGMENT
(1) Organic growth = excluding acquisitions / divestitures and the impact of foreign exchange.
Organic growth (%) (1)Reported growth (%)
8
Street Furniture
Transport Billboard GroupStreet
FurnitureTransport Billboard Group

-30.6%
-40.9%
-28.4%
-45.1% -46.1%-51.0%
-38.1%
2020 ADJUSTED REVENUE GROWTH BY GEOGRAPHY
(1) Organic growth = excluding acquisitions / divestitures and the impact of foreign exchange.(2) Excluding France and United Kingdom.
FranceUnited
KingdomRest of the
WorldNorth
AmericaGroup
Organic growth (%) (1)
9
Rest of Europe (2) Asia-Pacific

30.0%
19.2%8.8%
26.1%
8.9%
7.0%
48.9%
35.1%
16.0%
2020 ADJUSTED REVENUE BREAKDOWN
United Kingdom
Rest ofthe World
North America
France
(1) Excluding France and United Kingdom 10
Rest of Europe (1)
Asia-Pacific
Street Furniture
Transport
BillboardEUROPE: 58.0%

Digital bus shelters, London, United Kingdom
STRONG DIVERSIFIED CLIENTS PORTFOLIO
11
▪ Top 10 clients represent only 12.8% of Group revenue
# Category2020
revenue %YoY %
change
1 Retail 16.3% -35.5%
2 Personal Care & Luxury Goods 13.2% -43.0%
3 Finance 11.0% -36.9%
4 Entertainment, Leisure & Film 10.0% -48.5%
5 Food & Beverage 8.3% -37.7%
6 Services 6.6% -35.3%
7 Automotive 6.3% -35.4%
8 Telecom & Technology 6.2% -42.9%
9 Government 6.0% -7.2%
10 Internet & e-commerce 5.5% -40.9%

46.0%
40.8%
13.2% 12.9%
16.5%
20.4%
25.2%24.0%
2016 2017 2018 2019 2020
29.8%
61.8%
8.5%
DIGITAL EXPOSURE
12
Adjusted figures
Group digital revenue as a % of total Group revenue
Breakdown of digital revenue by segment
2016 2020
Billboard
Transport
StreetFurniture
Billboard
Transport
Street Furniture
N.B.: Years prior to 2017 have not been restated from the IFRS 15 impact, applicableon January 1st, 2018.

8.5%
13.9%
18.1%
21.9% 22.6%
2016 2017 2018 2019 2020
GROWING DIGITAL STREET FURNITURE PENETRATION
13
Adjusted figures
Street Furniture digital revenue as a % of total Street Furniture revenue
Digital street furniture, Berlin, GermanyN.B.: Years prior to 2017 have not been restated from the IFRS 15 impact, applicableon January 1st, 2018.

19.7%
22.2%
25.8%
30.3%
27.9%
2016 2017 2018 2019 2020
DIGITAL TRANSPORT
14
Adjusted figures
Transport digital revenue as a % of total Transport revenue
N.B.: Years prior to 2017 have not been restated from the IFRS 15 impact, applicableon January 1st, 2018.Shanghai Hongqiao airport, China

7.5%8.7%
11.6%
20.6% 19.8%
2016 2017 2018 2019 2020
DIGITAL BILLBOARD
15
Adjusted figures
Billboard digital revenue as a % of total Billboard revenue
Digital billboard “The Kensington”, London, United KingdomN.B.: Years prior to 2017 have not been restated from the IFRS 15 impact, applicableon January 1st, 2018.

65%
51%
41%
26%
19%
64%
50%
43%
23%
18%
2020
2019
Digital penetration (% of country revenue)
WHILE 5 COUNTRIES GENERATE 70% OF DIGITAL REVENUE,STILL SIGNIFICANT ROOM FOR DIGITAL PENETRATION GROWTH
16Digital bus shelter, New York, United States
Adjusted figures

IMMEDIATE RESPONSE TO COVID-19 CRISIS
17
MAG reliefs, adjustment of the base rent calculation and / or the revenue share percentage
Cut in discretionary spend and capexCancellation of 2019 dividends
Temporary unemployment measures, reducing employee hours, introducing voluntary salary reduction(incl. Board Members) and other more structural measures in some countries
Already strong liquidity reinforced with the placement of €1.2 billion of notes at 4.5 years and 8 yearsand the extension of our RCF maturity by one year to July 2025
Health and safety of our employees – Dedicated governance, regular communication, teams safely working from home, sanitary protocols, training, equipment, solidarity with healthcare workers…
Capital allocation and portfolio optimisation (Buy a minority stake in Clear Media in China with partners, Sell25% stake in Russ Outdoor in Russia, Acquire Abri Services Media in France)
€€€

Health prevention messages, Singapore Solidarity with healthcare workers, Mexico Health prevention messages, South Africa Solidarity with healthcare workers, United Kingdom
Hand sanitiser dispensers, United-StatesSupport for the reopening of cinemas,France
Solidarity with convenience stores, FranceFree bikes for healthcare workers, Belgium
SOLIDARITY WITH HEALTHCARE WORKERSAND SUPPORT TO LOCAL POPULATION
18

RECENT CONTRACT WINS & RENEWALS
Contract renewalsNew contracts
19
STREET FURNITUREGermany Dortmund CIPs
United Kingdom Manchester CIPs
TRANSPORTChina Beijing metro (10 metro lines)
China Hong Kong metro (8 metro lines)
Norway Bane NOR (Norwegian railway network)
Spain Madrid metro
STREET FURNITUREColombia Bogota street furniture
France Carrefour stores digital screens in shop windows
Brazil Campinas smart clocks
Japan Kawasaki CIPs
TRANSPORTIvory Coast Abidjan International airport
Gabon Libreville International airport
Paraguay Asuncion International airport
United Kingdom Merseyrail in Liverpool
Includes digital

CLEAR MEDIA: ACQUISITION OF AN EQUITY STAKEIN THE #1 CHINESE STREET FURNITURE COMPANY
▪ On March 31st, 2020, JCDecaux acquired a minority stake in Clear Media Limited as part of a consortium of investors
▪ Consortium shareholding structure▪ Han Zi Jing, Chief Executive Officer of Clear Media at 40%
▪ Antfin (Hong Kong) Holding Limited at 30%
▪ JCDecaux at 23%
▪ China Wealth Growth Fund III L.P. at 7%
▪ Consortium now owns 88.2% of Clear Media
▪ Complementary assets▪ Clear Media is the largest operator of bus shelters, more than
57,000 advertising panels covering 25 cities
▪ JCDecaux started operating in Hong Kong in 1999, Macau in 2001 and Mainland China in 2005, and is the leading Transport advertising company in China
20
Beijing
Tianjin
ShanghaiNanjing
Presence of JCDecaux
Chongqing
Guangzhou
Hong KongMacau
Chengdu
Presence of Clear Media
Shared presence
WuhanSuzhou
Hohhot
Shenzhen

#1 ADVERTISING STREET FURNITURE COMPANYIN JAPAN, 3RD GLOBAL ADVERTISING MARKET
▪ Exclusive national network▪ 42 cities (including Top 20), 152 shopping
malls
▪ 8,900 2sqm advertising faces
▪ Network strengthened with CIPs installation
▪ 2,600 bus shelters & 270 CIPs installed
▪ Premium locations equipped with 43 85" LCD screens
▪ Toyama & Kagoshima equipped
▪ Yokohama, Kawasaki & Nagoya ongoing installation
▪ Osaka & Tokyo open discussions
▪ Airports▪ Digital in Kansai airports
▪ 100% covered
▪ 61 digital screens from 85" to 15sqmCIPs in Tokyo & Nagoya, Osaka domestic airport, Japan 21

A REGIONAL FOOTPRINT EXPANSIONIN A DYNAMIC FRENCH REGION
22
▪ Abri Services Media: Street Furniture operator in France’s Grand-Ouest region (Brittany, Pays de la Loire and Nouvelle-Aquitaine)
▪ 2,600 bus shelters and 2,100 City Information Panels in 100 cities
▪ High presence in suburban areas of large cities
▪ Regional and local advertisers for sustainable, effective and impactful local communication
Presence of JCDecaux
Presence of Abri Services
Shared presence
Brest
Quimper
La Rochelle
Angers
Nantes
Saint-Nazaire
Rennes
Morlaix
Saumur
Fougères
Cholet
Saint-Hilaire du Riez

Our approach
recognised by extra-financial rating agencies,
aligned with the United Nations Sustainable Development Goals
70 million uses
Hand sanitiser dispensers deployed in Paris
(also deployed in Los Angeles, Madrid, Milan, Gothenburg,
Manchester, …)
Filtreo®, a bus shelter contributing to urban
depollution thanks to its green roof
A Natural Cooling bus shelterwith evaporative cooling
solution to the fight heat islands
(4.6/5) AAA
Public procurement, a weapon of mass construction, still underexploited today
Social criteria are not assessed in
90% of the tenders
Environment criteria are not assessed in
75% of the tenders
A VIRTUOUS MODEL INVENTED BY JEAN-CLAUDE DECAUX IN 1964Sustainable and innovative furniture and services financed by brands and their advertisement
2019 Analysis carried out in 49 countries for 206 projects covering all our activities (Street furniture, Transport,Billboard) including 162 public tenders
ESG PERFORMANCE IN OUR DNA
23

68%
76%
80%
70%
2018 2019 2020
Objective
69%
88% 91%
65%75%
85% 90%100%
2018 2019 2020 2021 2022
Objective
ESG PERFORMANCEENVIRONMENT
24
Our energy consumption covered by renewable electricity
The target of 70% of sorted recycled waste exceeded since 2019
For all JCDecaux in France
Our carbon emissions reduced by more than 64% between 2017 and 2020 (in KTEQ CO2)
Reducing our environmental impacts, a strategic priority
2020 highlight
29 countries covering 100% of their
consumption in 2020 (vs. 19 in 2019)
144.6
96.9
63.651.8
2017 2018 2019 2020

71%
88%100%
2018 2019 2020
Objective
ESG PERFORMANCESOCIAL
25
Achieve and maintain an average female representation rate in Executive Management
Committees equal to or greater than
40% by 2027 at Group level
DEFINITION OF OUR GENDER BALANCE PLAN
Essential pillarsof our Sustainable Development Strategy
2020 highlight
Performances in line with Group’s objectives
Our 2020 key figures
Objective of 100% key suppliers signing the Suppliers code of conduct achieved
Accidents’ frequency rate down for the 6th year in a row
Depuis 2015
99% of countries have established a Health & Safety risk identification and assessment procedure
95.7% employees on
permanent contracts
33% of women in JCDecaux’s
Executive Management Committees
9.7 years average length
of service
100% countries compliant with the
principles of Group’s Social Charter

▪ Sustainability issues included in the risk mapping since 2009
▪ Our Declaration of Extra-Financial Performance (DEFP) audited by an Independent Third-Party Organisation with unqualified opinion and commentary for the 3rd consecutive year
▪ An effective ethics alert procedure: in 2020, 3 alerts reported and closed after treatment
▪ Since 2017, sustainability criteria account for 10% in the variable compensation of executives (environment, health and safety, purchases). Integration of a social criterion in 2021
ESG PERFORMANCEGOVERNANCE
26
A strong governancefully integrating Sustainability issues

FINANCIAL HIGHLIGHTSDavid Bourg
Chief Financial & Administrative Officer

1,4171,5431,5781,544
1,6271,745
1,946
2,1072,169
1,919
2,3502,463
2,6232,6762,813
3,208
3,3933,472
3,619
3,890
2,312
In million Euros
-13.9%
-63.4%
-40.8%-37.9%
-33.9%-35.7%
-38.1%-40.6%
Q1 Q2 H1 2020 Q3 Q4 H2 2020 FY 2020 FY 2020
Reported
UNPRECEDENTED REVENUE DECLINE
28
2000 – 2020 Adjusted revenue 2020 Adjusted revenue growth
Note: Data from 2014 onwards are Adjusted figures.From 2014 to 2020, adjusted figures include our prorata share in companies under joint control accounted for using the equity method underIFRS 11.Years prior to 2017 have not been restated for the IFRS 15 impact, applicable on January 1st, 2018.
-40.6%-11.5%
-2.2%
(1) Organic growth = excluding acquisitions / divestitures and the impact of foreign exchange.
Organic (1)
▪ FY Reported at -40.6% affected by a scope and FX impacts of -€47.9m and -€47.4m, respectively
▪ Change in scope mainly due to a loss of joint control in Beijing Metro JV on May 1st, 2020 (fromproportional integration at 90% to equity method at 33%) and the sale of our 25% stake in RussOutdoor in July 2020
In million euros
SARS crisis
Great Financial
Crisis

62.3
591.4
175.7
98.3
(1,578.4)
792.2
141.6
2019 Revenue Cost of
goods sold
Rents &
Fees
Staff
costs
Other
operating costs
2020
POSITIVE OPERATING MARGIN: STRONG AND FAST ADJUSTMENTS
29
In million Euros
Adjusted figures (1)
XX% YOY Variation €610m savings in fixed R&Fand operating expenses
59% of the revenue drop absorbed (vs. 52% in H1 2020)
Improved performance through H2 2020:
Operating margin of €203.4m in H2 2020vs.
-€61.8m in H1 2020
-40.6% -38.7% -22.5%-23.9%
Variable254.8
Fixed336.6
-33.5%
(1) Adjusted figures include our prorata share in companies under joint control accounted for using the equity method under IFRS 11 and exclude the IFRS 16impact on core business lease contracts.
(2) Including Local Property Taxes
(2)

2.6 (90.1)
(222.0)
(650.6)
384.9
(263.1)
(575.2)
EBIT 2019 Operatingmargin
Recurringcharges
Recurring EBIT2020
One-offitems
Impairment EBIT 2020
EBIT: OPERATING MARGIN DECLINE & NON-RECURRING CHARGES
30
▪ One-off items, of which:
▪ Net loss on sale of Russ Outdoor mainly due to foreign exchange recycling for €39.0m,
▪ Restructuring costs for €31.7m
▪ Inventory depreciations due to impaired assets for €12.8m
▪ Impairment charges of €222.3m (vs. €0.3m in 2019), of which €176.0m on goodwill:
▪ €128.0m related to the Pacific area
▪ €48.0m on Billboard in the Rest of The World area
(960.1)
In million Euros
Adjusted figures (1)
(1) Adjusted figures include our prorata share in companies under joint control accounted for using the equity method under IFRS 11 and exclude the IFRS 16impact on core business lease contracts.

23.7 17.7
113.3 (103.3)38.7
(960.1)
265.5
(604.6)
Net result,
Group share
2019
Adjusted
EBIT
IFRS
adjustments
Financial
result
Tax Equity
affiliates
Minority
interests
Net result,
Group share
2020
FIRST NET LOSS EVER
31
▪ Financial result: favorable difference of +€17.7m resulting from the mechanical decrease in discounting charges on IFRS 16 lease liabilities (+€33.9m) partly mitigated by the increase in net financial interests mainly due to the financing put in place in 2020
▪ Taxes: a positive income of +€21.2m versus a charge of -€92.1m in 2019 in line with the business situation but with an effective rate limited to 4.6% (vs. 31.3% in 2019) mainly due to non-recognition of deferred tax assets on tax losses carried forward
▪ Equity affiliates: a virtually flat contribution versus a profit of €102m in 2019, companies under joint control or under significant influence being also very significantly affected by the crisis
In million Euros
IFRS excepted when Adjusted
(870.1)
(1) Adjusted figures include our prorata share in companies under joint control accounted for using the equity method under IFRS 11 and exclude the IFRS 16impact on core business lease contracts.
(2) On EBIT
(2)(1)

In million Euros. Adjusted figures (1) 2020 2019
• Operating margin 141.6 792.2 (650.6)
• Maintenance spare parts (25.3) (34.3) 9.1
• Non-core business leases, IFRS 16 (2) (43.1) (49.9) 6.8
• Income tax paid (50.3) (129.2) 78.9
• Interests paid and received (3) (18.8) (16.1) (2.6)
• Other items (3) (60.4) (11.8) (48.7)
► Funds from operations net of maintenance costs (56.2) 550.8 (607.0)
• Change in working capital requirement 403.0 (5.8) 408.8
• Capital expenditure (185.0) (375.4) 190.5
► Free cash flow 161.9 169.7 (7.8)
POSITIVE FREE CASH FLOW
32
(1) Adjusted figures include our prorata share in companies under joint control accounted for using the equity method under IFRS 11 and exclude the IFRS 16 impact on core and non-core business lease contracts.(2) Excluding non core business rents already restated before IFRS 16 application(3) Including non core business rents already restated before IFRS 16 application
Please refer to the Appendices section for financial definitions.

56.8 38.8
112.9
32.6
205.7
113.5
General investments Renewal capex Growth capex
375.4
185.0
SELECTIVE CAPEX REDUCTION
33
In million Euros
Adjusted figures (1)
Strong and fast actionsto reduce our Capex
Selective Capex allocation for future growth
Digital & IT Capex 53.5% of Total Capex
(vs. 44.5% in 2019)
-50.7%
H1 2020 YoY variation
-44.8%
-71.1%
-38.1%
-40.9%
+13.8%
(1) Adjusted figures include our prorata share in companies under joint control accounted for using the equity method under IFRS 11.
2019 2020
-31.7%-63.6%

DECREASE IN NET FINANCIAL DEBT
34
In million Euros. Adjusted figures (1) except when IFRS. 2020 2019
► Free cash flow 161.9 169.7 (7.8)
• Restatement of companies under joint control – IFRS 11 16.0 19.9 (3.9)
• Dividends (7.8) (135.6) 127.8
• Equity increase & movements on treasury shares (net) (0.1) 1.6 (1.7)
• Financial investments (net) (2) (108.6) 10.7 (119.3)
• Others (3) (22.9) (11.4) (11.4)
► Change in Net debt (Balance Sheet), IFRS (38.7) (54.9) 16.2
► Net debt as of end of period, IFRS 1,086.3 1,125.0 38.7(1) Adjusted figures include our prorata share in companies under joint control accounted for using the equity method under IFRS 11 and exclude the IFRS 16 impact on core and non-core business lease contracts.(2) Excluding net cash of acquired and sold companies.(3) Non cash variations (mainly due to consolidation scope variations, translation differences on net debt, the impact of IFRS 9 and reclassifications), variation of interests on debt and including net cash of acquired and sold companies.
Please refer to the Appendices section for financial definitions.

▪ Secured debt profile:
▪ No material maturity before mid-2023
▪ Average debt maturity: 3.6 years
▪ Average cost of debt: 1.1%
▪ Strong liquidity:
▪ €1,651m cash, with additional financing raised in 2020
▪ €1,200m bonds, maturity 2024 and 2028
▪ €150m term loan, maturity 2025
▪ €825m revolving credit facility unused
▪ Maturity mid-2025
▪ No financial covenant before 2023
▪ €750m NEU CP program (used for €481m)
▪ Current ratings:
▪ Moody’s: Baa2 – Negative Outlook
▪ S&P: BBB- – Negative Outlook
150
750600 600
825
481
2021 2022 2023 2024 2025 2026 2027 2028Bonds
In million euros
NEU CP Bank borrowings
975
+1
RCF, undrawn
STRONG LIQUIDITY
35
▪ Gross debt: €2,734.6m
▪ Net debt: €1,086.3m

2020 FINANCIAL HIGHLIGHTS
36
An unprecedented economic shock
-40.6% YoY on 2020 revenue affecting all segments
Strong and fast adjustments on operational and financial levers
R&F-33.5% YoY
Resilient financial structure
Positive OM and FCF Decrease in financial net debt
Opex-23.4% YoY
Capex-50.7% YoY
WCRTight
control
Dividendcancelled
First net loss ever – No dividend proposed related to 2020

OUTLOOK AND STRATEGYJean-François Decaux
Co-CEO

▪ Streets quickly regained their audience as soon as restrictions were lifted
▪ French people have gradually been able to adapt their mobility behaviour during constrained periods, in compliance with health precautionary instructions
▪ Revenue from urban businesses resisted and systematically rebounded as strongly as the audience recovery
STRONG URBAN AUDIENCE RECOVERY MAINLY IN EUROPEWHEN MOBILITY RESTRICTIONS ARE TOTALLY LIFTED
38Source: JCDecaux Mobility Tracker Index
Mobility Tracker IndexFRANCE
0
10
20
30
40
50
60
70
80
90
100
110 Index 97 Index 96
1st lockdown 2nd lockdown
Index 78Week s/ June 20th Week s/ September 7th Week s/ December 14th
Summer holidaysIndex less meaningful
compared to February 2020
Index 54Week s/ November 9th
Index 28Week s/ March 23rd
Curfew
Christmas holidaysIndex less meaningful
compared to February 2020
FRANCE EXAMPLE

RESILIENT REVENUE IN UK SUPERMARKETSDESPITE COVID-19
39
95% 93%
A U D I E N C EL E V E L
R E V E N U E L E V E L

Period Beijing Shanghai Guangzhou Nanjing Hong Kong
H1 2020 45.5% 57.4% 56.6% 52.2% 66.2%
Q3 2020 65.1% 85.8% 84.4% 82.3% 67.8%
October 2020 81.0% 88.4% 87.6% 87.7% 104.0% (2)
November 2020 84.2% 86.5% 91.5% 88.7% 102.9% (2)
December 2020 83.3% 89.9% 93.2% 92.8% 74.2%
December 30th (1) 7.2m 10.6m 8.6m 2.8m 3.2m
N.B.: Chinese New Year holidays started on January 24th, 2020, whereas in 2019, they started on February 4th.(1) PAX per day(2) Hong Kong PAX were up vs. 2019 in October and November due to low comparable (2019 protests)
Level of passengers traffic in metros in 2020, month by month, compared to the same period in 2019
Example of our metros in China
CHINA: METRO AUDIENCE ALMOST BACK TO 2019 LEVEL
40

-29%
-12%
-33%
+15%
Q1 2020 Q2 2020 Q3 2020 Q4 2020
QUARTERLY SEQUENTIAL REVENUE IMPROVEMENT IN CHINA DRIVEN BY A STRONG DOMESTIC AUDIENCE RECOVERY
41
Revenue growth in domestic airports in 2020 in Mainland China
Example of our airports in Mainland China

69%
31%
PROGRAMMATIC: A MASSIVE OPPORTUNITY
42
DIGITAL MEDIA (1) PROGRAMMATIC ADOPTION
(%)
Programmatic
Non-programmatic
2020
Source: Zenith’s Programmatic Marketing Forecasts(1) Digital media refers to all forms of paid-for advertising within online content, including banners, online video and social media, butexcluding paid search and classified advertising
GLOBAL PROGRAMMATIC OPPORTUNITY
(IN BILLION DOLLARS)
Sources: Zenith’s Programmatic Marketing Forecasts, Global Programmatic Advertising Spending Market 2020-2024
106
127
147
188
224
271
2019 2020 2021 2022 2023 2024

VIOOH: THE MOST CONNECTED DOOH PROGRAMMATIC PLATFORM
43
Incremental programmatic demand
United Kingdom
United States
Singapore
Germany
The Netherlands
Finland
Denmark
14 countries connected
Brazil
Belgium
Italy
China
Spain
Austria
Norway
Brands that trust us
▪ 20 DSPs deal with VIOOH
▪ 12 DSPs are in process for integration
▪ Programmatic CPMs are on average 25% to 30% higher than traditional sales

Bus shelter at the Opera Garnier, Paris, France
NESPRESSO: CROSS PLATFORM CAMPAIGNS DRIVE SALES
▪ JCDecaux and S4M: a new offer for advertisers combining outdoor and mobile advertising for efficiency and optimisation of their media investments
▪ Campaign advertising through OOH with other ad channels and especially mobile, proven to be an effective way to boost engagement and drive sales
▪ Nielsen OOH advertising study:
▪ OOH: highest online activation rate in traditional media
▪ 66% of consumers use their smartphone after seeing an OOH ad and 40% search for the brand online
▪ 88% of consumers who look for a store on their smartphone go there within 24 hours
44

-10.2%
-27.3%
+3.3%
-1.9%
-18.4%-16.1%
-25.4% -25.5%
+6.7%
+20.2%
+10.4%+7.8%
+4.6%+1.1%
-0.7% -0.4%
Total Outdoor Mobile Internet Search Radio Television Magazines Newspapers
OOH / DOOH: “STRONGEST REBOUND EXPECTED IN 2021”
45Source: WARC “Global Advertising Trends: State of The Industry 2020/21” – December 2020
Global advertising media owner ad revenue growth for 2020 and 2021
2021
2020
Mark Read, CEO of WPP:“The growth of digital outdoor media is really interesting. It offers the ability to target messages, more precisely by audiences, by time of day,
to be much more responsive to events, and to measure the impact much more carefully. […] We’ll see that’ll really drive the continued growth of outdoor and this pandemic will be something of a blip. But, a sort of broad based, brand awareness media will be still needed in this world.”

MAIN TENDERS
Street Furniture
EUROPE
Barcelona
Malaga
Dresden
Bordeaux
Brussels
NORTH AMERICA
Los Angeles
ASIA-PACIFIC
Japan
Seoul
Singapore
REST OF THE WORLD
Montevideo
Transport Billboard
EUROPE
Berlin buses
Budapest metro
Madrid buses
ASIA-PACIFIC
Metros in Chinese cities
Terminals in Chinese airports
Sydney trains
46
ASIA-PACIFIC
Sydney trains
On-going tenders

184
977749
1,569
1,236
147
2,456 878
898
1,584
294 272 227 171 170 157 157 110
Sources: Company news releases. Currency conversions are based on an annual average exchange rate $/€ of 0.8755, GBP/€ of 1.1240, CHF/€ of 0.9341, HKD/€ of 0.1129, RMB/€ of 0.1270 and AUD/€ of 0.6043.(1) Does not include revenue from APG|SGA, Metrobus and Clear Media, companies integrated through the equity method in JCDecaux’s financial statements. (2) Ströer’s revenue are split into Ströer OoH Media (€656m) and Ströer Digital & Dialog Media, DaaS & e-commerce and HQ (€787m).(3) JCDecaux’s estimate of 2020 revenue. (4) On March 31st, 2020, JCDecaux announced to acquire a minority stake, through its wholly owned subsidiary JCDecaux Innovate incorporated in Hong Kong, in a consortium of investors which formed an ad hoc company (“City Lead Development Limited”) to makea voluntary conditional cash offer to acquire all of the shares in the entire issued share capital of Clear Media. JCDecaux will account for its 23% interest in Bidco using equity method. City Lead Development Limited holds 88.2% as of July 30th, 2020.
North America operations
International operations excluding North America
2020 Out-of-Home revenue ($m)
47
Intersection (3)JCDecaux Focus Media (3) LamarStröer (2) OUTFRONTMedia
Asiaray (3) MetrobusGlobal (3)APG|SGA (3)oOh!mediaClear Channel
OutdoorAl Arabiya (3) Clear
Media (3) (4)
UNPRECEDENTED REVENUE DECLINE FOR THE OOH INDUSTRY WILL DRIVE MORE CONSOLIDATION
OceanEq
uity m
etho
d 3
0%
-30.9%
-22.9%
-10.5%
-30.6%
-34.3%
-38.4%
XX% 2020 reported growth
1,855
1,647
2,641 (1)
-40.6%

▪ Resilient financial structure▪ Unprecedented revenue decline due to Covid-19 lockdowns / restrictions
▪ Reactivity to adjust our cost structure, reduce our capex and preserve our cash
▪ Positive Operating Margin & Free Cash Flow / Decrease in net financial debt & strong liquidity
▪ First net loss ever – No dividend proposed related to 2020
▪ Ongoing commitment to adjust costs, working capital and capex on revenue level
▪ Investments for future growth▪ Pursue digitisation in premium locations
▪ Programmatic trading platform roll-out
▪ Further consolidation opportunities
▪ Well positioned for the recovery▪ A worldwide leadership position
▪ Well-diversified geographical and advertiser’s exposure
▪ The most digitised global OOH company
▪ On-going focus on innovation and ESG
CONCLUSION
48

Q1 2021 OUTLOOK
49
“As far as Q1 2021 is concerned,we expect an adjusted organic revenue decline at around -40%,
due to ongoing and stronger mobility restrictions introduced in some large countries, such as UK and Germany, while a double digit rebound
in domestic Chinese advertising revenue (excluding Hong Kong) is very encouraging.While we do not expect to recover our 2019 revenue level in 2021,
we believe that the rebound will be strongwhen audiences return to pre-Covid levels.”

APPENDICES

▪ Our Adjusted operating aggregates are:▪ As regards the Profit & Loss, all aggregates down to the EBIT;
▪ As regards the Cash flow statement, all aggregates down to the free cash flow.
▪ Adjustments relate to:▪ IFRS 11, applicable from January 1st, 2014, under which companies under joint control previously consolidated using the proportionate method are accounted for
using the equity method;
▪ IFRS 16, applicable from January 1st, 2019, under which a lease liability for contractual fixed rental payments is recognised on the balance sheet, against a right-of-useasset to be depreciated linearly over the lease term. As regards P&L, the fixed rent expense is replaced by the depreciation of the right-of-use in EBIT, below theoperating margin, and a lease interest expense on the lease liability in financial result, below EBIT. IFRS 16 has no impact on cash payments but payment of debt(principal) is booked in funds from financing activities.
▪ As these standards do not make it possible to measure the Group’s operating performance and to inform Management about theirdecision making in line with historical data, operating aggregates disclosed in this document are adjusted:▪ To integrate on proportional basis operating data of the companies under joint control;
▪ To exclude the IFRS 16 impact on our core business (lease agreements of locations for advertising structures excluding real estate and vehicle rental contracts).
Regarding IFRS 16, lease liabilities are excluded from net debt and the reimbursement of debt (principal) is reintegrated in the free cashflow (including non-core business).
▪ These adjusted data are used by Management and, pursuant to IFRS 8, Segment Reporting presented in the financial statements complieswith the Group’s internal information, and the Group’s external financial communication therefore relies on this operating financialinformation.
▪ In compliance with the AMF’s instructions, Adjusted data are reconciled with IFRS data in the Appendices section.
DISCLAIMER – ADJUSTED OPERATING AGGREGATES
51
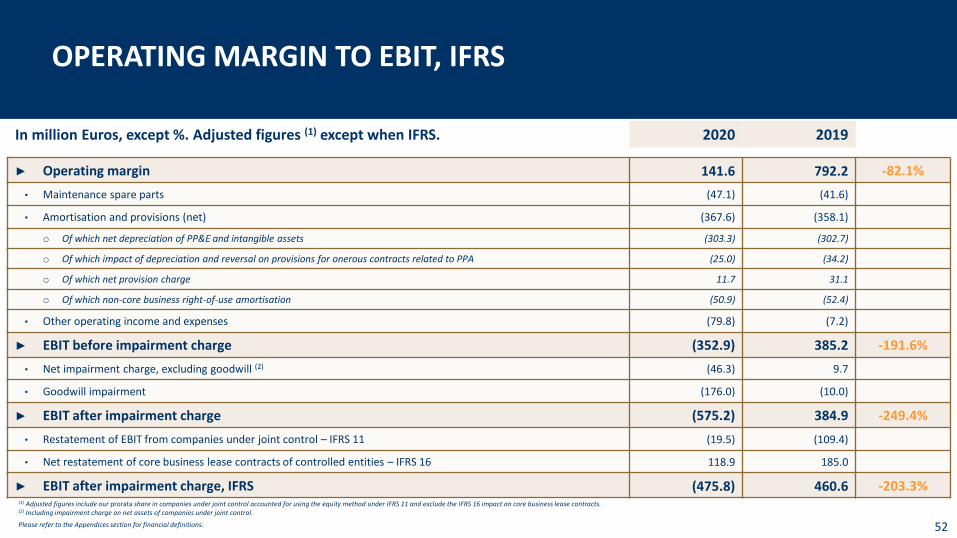
OPERATING MARGIN TO EBIT, IFRS
In million Euros, except %. Adjusted figures (1) except when IFRS. 2020 2019
► Operating margin 141.6 792.2 -82.1%
• Maintenance spare parts (47.1) (41.6)
• Amortisation and provisions (net) (367.6) (358.1)
o Of which net depreciation of PP&E and intangible assets (303.3) (302.7)
o Of which impact of depreciation and reversal on provisions for onerous contracts related to PPA (25.0) (34.2)
o Of which net provision charge 11.7 31.1
o Of which non-core business right-of-use amortisation (50.9) (52.4)
• Other operating income and expenses (79.8) (7.2)
► EBIT before impairment charge (352.9) 385.2 -191.6%
• Net impairment charge, excluding goodwill (2) (46.3) 9.7
• Goodwill impairment (176.0) (10.0)
► EBIT after impairment charge (575.2) 384.9 -249.4%
• Restatement of EBIT from companies under joint control – IFRS 11 (19.5) (109.4)
• Net restatement of core business lease contracts of controlled entities – IFRS 16 118.9 185.0
► EBIT after impairment charge, IFRS (475.8) 460.6 -203.3%
52
(1) Adjusted figures include our prorata share in companies under joint control accounted for using the equity method under IFRS 11 and exclude the IFRS 16 impact on core business lease contracts.(2) Including impairment charge on net assets of companies under joint control.
Please refer to the Appendices section for financial definitions.

-12.4% -11.7%
-32.0%
-15.3%
12.9%0.3%
-1.7%
6.1%
MARGINS BY SEGMENT
53
Street Furniture
Transport Billboard GroupStreet Furniture
Transport Billboard Group
Operation Margin(% of revenue)Adjusted figures (1)
EBIT (2)
(% of revenue)Adjusted figures (1)
-3,290bp
-2,500bp -2,200bp
-2,520bp
-1,480bp
-1,390bp
-1,590bp
-1,430bp
(1) Adjusted figures include our prorata share in companies under joint control accounted for using the equity method under IFRS 11 and exclude the IFRS 16 impact on core business lease contracts.(2) Before impairment charge

In million Euros. Adjusted figures (1) except when IFRS. 2020 2019
► EBIT after impairment charge (575.2) 384.9 (960.1)
• Restatement of IFRS 11 – EBIT from companies under joint control (19.5) (109.4)
• Net restatement of IFRS 16 – Core business lease contracts of controlled entities 118.9 185.0
► EBIT after impairment charge, IFRS (475.8) 460.6 (936.4)
• Financial income / (loss) (2) (158.7) (176.4)
o Financial interests relating to IFRS 16 liabilities of controlled entities (118.1) (152.0)
o Other net financial charges (40.6) (24.4)
• Tax 21.2 (92.1)
• Equity affiliates (1.3) 102.0
• Minority interests (2) 10.1 (28.7)
► Net income Group share, IFRS (604.6) 265.5 (870.1)
• Net impact of impairment charge 211.3 1.8
► Net income Group share before impairment charge, IFRS (393.3) 267.3 (660.6)
NET INCOME
54
(1) Adjusted figures include our prorata share in companies under joint control accounted for using the equity method under IFRS 11 and exclude the IFRS 16 impact on core business lease contracts.(2) Excluding discounting and revaluation of debt on commitments to purchase minority interests (-€2.1m in 2020 and -€12.0m in 2019).
Please refer to the Appendices section for financial definitions.

CHANGE IN NET DEBT
55
In million Euros. Adjusted figures (1) except when IFRS. 2020 2019 (2)
► Free cash flow 161.9 169.7 (7.8)
• Restatement of companies under joint control – IFRS 11 16.0 19.9 (3.9)
• Restatement of lease contracts reimbursement – IFRS 16 533.2 950.3 (417.0)
► Free cash flow, IFRS 711.2 1,139.9 (428.7)
• IFRS 16 lease contracts reimbursement (533.2) (950.3) 417.0
• Dividends (7.8) (135.6) 127.8
• Equity increase & movements on treasury shares (net) (0.1) 1.6 (1.7)
• Financial investments (net) (3) (108.6) 10.7 (119.3)
• Others (4) (22.9) (11.4) (11.4)
► Change in Net debt (Balance Sheet), IFRS (38.7) (54.9) 16.2(1) Adjusted figures include our prorata share in companies under joint control accounted for using the equity method under IFRS 11 and exclude the IFRS 16 impact on core and non-core business lease contracts.(2) 2019 IFRS figures are restated from the retrospective application of IFRS IC on lease terms. The impact on the 2019 published data is an increase in Free cash flow (under “Restatement of lease contracts reimbursement – IFRS 16”) of €0.7m offset by the -€0.7m impact under “IFRS 16
lease contracts reimbursement”.(3) Excluding net cash of acquired and sold companies.(4) Non cash variations (mainly due to consolidation scope variations, translation differences on net debt, the impact of IFRS 9 and reclassifications), variation of interests on debt and including net cash of acquired and sold companies.
Please refer to the Appendices section for financial definitions.

2020 2019
In million Euros Adjusted
Impact of companies under joint
control
Impact of IFRS 16 from
controlled entities (1)
IFRS Adjusted
Impact of companies under joint
control
Impact of IFRS 16 from
controlled entities (1)
IFRS (2)
-
► Revenue 2,311.8 (212.0) - 2,099.8 3,890.2 (402.5) - 3,487.6
• Net operating costs (2,170.2) 170.5 978.6 (1,021.1) (3,098.0) 278.7 1,046.6 (1,772.7)
► Operating margin 141.6 (41.5) 978.6 1,078.7 792.2 (123.8) 1,046.6 1,715.0
• Maintenance spare parts (47.1) 1.2 - (46.0) (41.6) 1.1 - (40.5)
• Amortisation and provisions (net) (367.6) 21.3 (868.4) (1,214.7) (358.1) 23.5 (924.7) (1,259.3)
• Other operating income / expenses (79.8) (0.6) 8.7 (71.8) (7.2) 0.5 63.1 56.4
► EBIT before impairment charge (352.9) (19.7) 118.9 (253.7) 385.2 (98.7) 185.0 471.6
• Net impairment charge (3) (222.3) 0.2 - (222.1) (0.3) (10.7) - (11.0)
► EBIT after impairment charge (575.2) (19.5) 118.9 (475.8) 384.9 (109.4) 185.0 460.6
RECONCILIATION BETWEEN ADJUSTED FIGURES AND IFRS FIGURES – PROFIT & LOSS
56
(1) IFRS 16 impact on core business rents from controlled entities(2) 2019 IFRS figures are restated from the retrospective application of IFRS IC on lease terms. The impact on the 2019 published data is an increase in operating margin of €0.7m linked to the decrease in fixed rent and fees under “Net operating costs”, and an increase of -€0.7m in
depreciation of right-of-use under “Amortisation and provisions (net)”, with no impact on EBIT.(3) Including impairment charge on net assets of companies under joint control.

RECONCILIATION BETWEEN ADJUSTED FIGURES AND IFRS FIGURES – CASH FLOW STATEMENT
57
2020 2019
In million Euros Adjusted
Impact of companies under joint
control
Impact of IFRS 16 from
controlled entities (1)
IFRS Adjusted
Impact of companies under joint
control
Impact of IFRS 16 from
controlled entities (1)
IFRS (2)
► Funds from operations net of maintenance costs
(56.2) 35.8 671.2 650.7 550.8 (4.9) 948.1 1,494.0
• Change in working capital requirement 403.0 (27.8) (137.9) 237.4 (5.8) 9.7 2.2 6.2
► Net cash flow from operating activities 346.8 8.0 533.2 888.1 545.1 4.8 950.3 1,500.2
• Capital expenditure (185.0) 8.0 - (176.9) (375.4) 15.1 - (360.3)
► Free cash flow 161.9 16.0 533.2 711.2 169.7 19.9 950.3 1,139.9
(1) IFRS 16 impact on core and non-core business rents from controlled entities(2) 2019 IFRS figures are restated from the retrospective application of IFRS IC on lease terms. The impact on the 2019 published data is an increase in Funds from operations net of maintenance costs of €0.7m.

In million Euros Q1 Q2 Q3 Q4 FY
► 2019 adjusted revenue (a) 840.0 1,002.3 925.8 1,122.0 3,890.2
► 2020 IFRS revenue (b) 658.2 310.4 495.0 636.2 2,099.8
• IFRS 11 impacts (c) 65.4 41.5 46.2 58.9 212.0
► 2020 adjusted revenue (d) = (b) + (c) 723.6 351.8 541.2 695.1 2,311.8
• Currency impacts (e) 1.7 8.0 15.5 22.2 47.4
► 2020 adjusted revenue at 2019 exchange rates (f) = (d) + (e) 725.3 359.9 556.7 717.3 2,359.2
• Change in scope (g) (2.3) 7.0 18.4 24.8 47.9
► 2020 adjusted organic revenue (h) = (f) + (g) 723.0 366.8 575.2 742.1 2,407.1
► Organic growth (i) = (h) / (a) -13.9% -63.4% -37.9% -33.9% -38.1%
RECONCILIATION OF ORGANIC GROWTH (1/2)
58

In million EurosImpact of currency
as of December 31st, 2020
• BRL 12.5
• USD 4.8
• RMB 4.7
• AUD 3.7
• Other 21.7
► Total 47.4
RECONCILIATION OF ORGANIC GROWTH (2/2)
59
Average exchange rate 2020 2019
• BRL 0.1697 0.2266
• USD 0.8755 0.8933
• RMB 0.1270 0.1293
• AUD 0.6043 0.6208

FINANCIAL DEFINITIONS
Organic growthThe Group’s organic growth corresponds to the adjusted revenue growth excluding foreign exchange impact and perimeter effect. The referencefiscal year remains unchanged regarding the reported figures, and the organic growth is calculated by converting the revenue of the current fiscalyear at the average exchange rates of the previous year and taking into account the perimeter variations prorata temporis, but including revenuevariations from the gains of new contracts and the losses of contracts previously held in our portfolio
Operating marginRevenue less Direct Operating Expenses (excluding Maintenance spare parts) less SG&A expenses
EBIT (Earnings Before Interests and Taxes)Operating Margin less Depreciation, amortisation and provisions (net) less Impairment of goodwill less Maintenance spare parts less Otheroperating income and expenses
Free cash flowNet cash flow from operating activities less capital investments (property, plant and equipment and intangible assets) net of disposals
Net debtDebt net of managed cash less bank overdrafts, excluding the non-cash IAS 32 impact (debt on commitments to purchase minority interests),including the non-cash IFRS 9 impact on both debt and hedging financial derivatives, excluding IFRS 16 lease liabilities
60

FORWARD LOOKING STATEMENTS
This presentation may contain some forward-looking statements. These statements are not undertakings asto the future performance of the Company. Although the Company considers that such statements arebased on reasonable expectations and assumptions on the date of publication of this presentation, they areby their nature subject to risks and uncertainties which could cause actual performance to differ from thoseindicated or implied in such statements.
These risks and uncertainties include without limitation the risk factors that are described in the RegistrationDocument registered in France with the French Autorité des Marchés Financiers.
Investors and holders of shares of the Company may obtain copy of such Registration Document bycontacting the French Autorité des Marchés Financiers on its website www.amf-france.org or directly on theCompany website www.jcdecaux.com.
The Company does not have the obligation and undertakes no obligation to update or revise any of theforward-looking statements.
61