Présentation PowerPoint - Actusnews
31
2020 Results March 25, 2021
-
Upload
khangminh22 -
Category
Documents
-
view
0 -
download
0
Transcript of Présentation PowerPoint - Actusnews

2020 Results
March 25, 2021

2ATEME © 1991-2020
Disclaimer
This presentation does not constitute or form part of and should not be construed as any offer for sale of or solicitation of any offerto buy any securities of ATEME, nor should it, or any part of it, form the basis of or be relied on in connection with any contract orcommitment whatsoever concerning ATEME’s assets, activities or shares.
All statements other than historical facts included in this presentation, including without limitations, those regarding ATEME’sposition, business strategy, plans and objectives are forward-looking statements.
The forward-looking statements included herein are for illustrative purposes only and are based on management’s current views andassumptions. Such forward-looking statements involve known and unknown risks. For illustrative purposes only, such risks includebut are not limited to impact of external events on customers and suppliers; the effects of competing technologies competitiongenerally in main markets; profitability of the expansion strategy; litigation; ability to establish and maintain strategic relationshipsin major businesses; and the effect of future acquisitions and investments.
ATEME expressly disclaims any obligation or undertaking to update or revise any projections, forecasts or estimates contained in thispresentation to reflect any change in events, conditions, assumptions or circumstances on which any such statements are based,unless so required by applicable law. These materials are supplied to you solely for your information and may not be copied ordistributed to any other person (whether in or outside your organization) or published, in whole or in part, for any purpose.

3ATEME © 1991-2020
Presenters
Michel ArtièresFounder & Chief Executive Officer
Degree in Engineering from Supelec, Paris, with a specialization in signal processing and telecommunications
Fabrice Sana Chief Financial Officer
Degrees from the European Business School and ESSEC

4ATEME © 1991-2020
1.Two Leaders Joining Forces
2. Market Trends
3. ATEME 2020 Results
4. Outlook

5ATEME © 1991-2020
ATEME + ANEVIA = Two Leaders Joining Forces
51 Patents
Up 70% in 2020
450 people in 20 countries
Public since 2014
1000+ clients in 100 countries
71 M€ in 2020, up 7%
ATEME + ANEVIA help Content Providers andService Providers transform their video deliveryto enable innovative live and on demand videoservices and enhance the quality of experience
MRRMONTHLY
RECURRINGREVENUE

6ATEME © 1991-2020
A Complete Offer for the Complete Video Flow
Service Provider(Satellite, Cable, Telco)
Video Headend
Event
ContributionPrimary
DistributionDistribution
OTT / Multiscreen
Subscriber
CDNContent Provider
TV Network
Kyrion encoders in the trucks and decoders at the TV station
TITAN is a virtualized Video Headend software covering all Live and File needs
NEA is a software suite for the OTT delivery (CDN, cloud DVR, DAI)
NEA is a software suite for the OTT delivery (CDN, cloud DVR, DAI)
7ATEME © 1991-2020
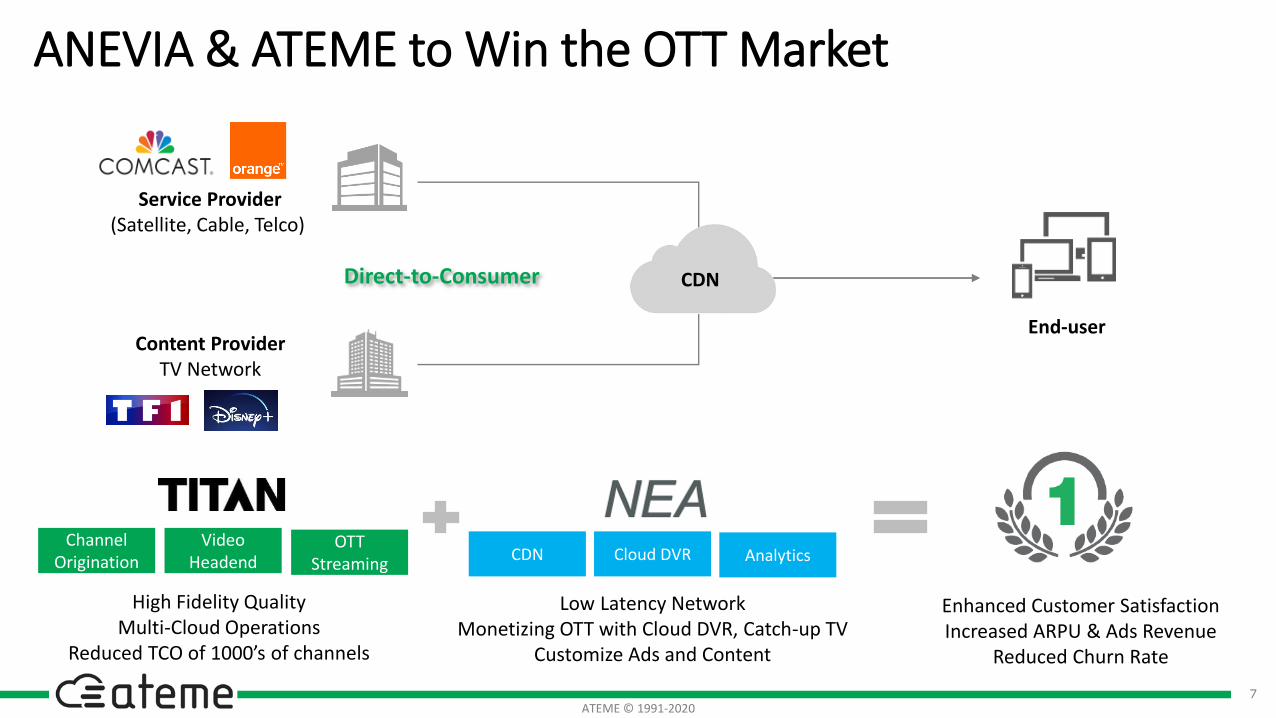
ANEVIA & ATEME to Win the OTT Market
Service Provider(Satellite, Cable, Telco)
End-userContent Provider
TV Network
Direct-to-Consumer
Channel Origination
VideoHeadend
OTTStreaming
CDN Cloud DVR Analytics
High Fidelity QualityMulti-Cloud Operations
Reduced TCO of 1000’s of channels
Low Latency NetworkMonetizing OTT with Cloud DVR, Catch-up TV
Customize Ads and Content
Enhanced Customer SatisfactionIncreased ARPU & Ads Revenue
Reduced Churn Rate
CDN
8ATEME © 1991-2020
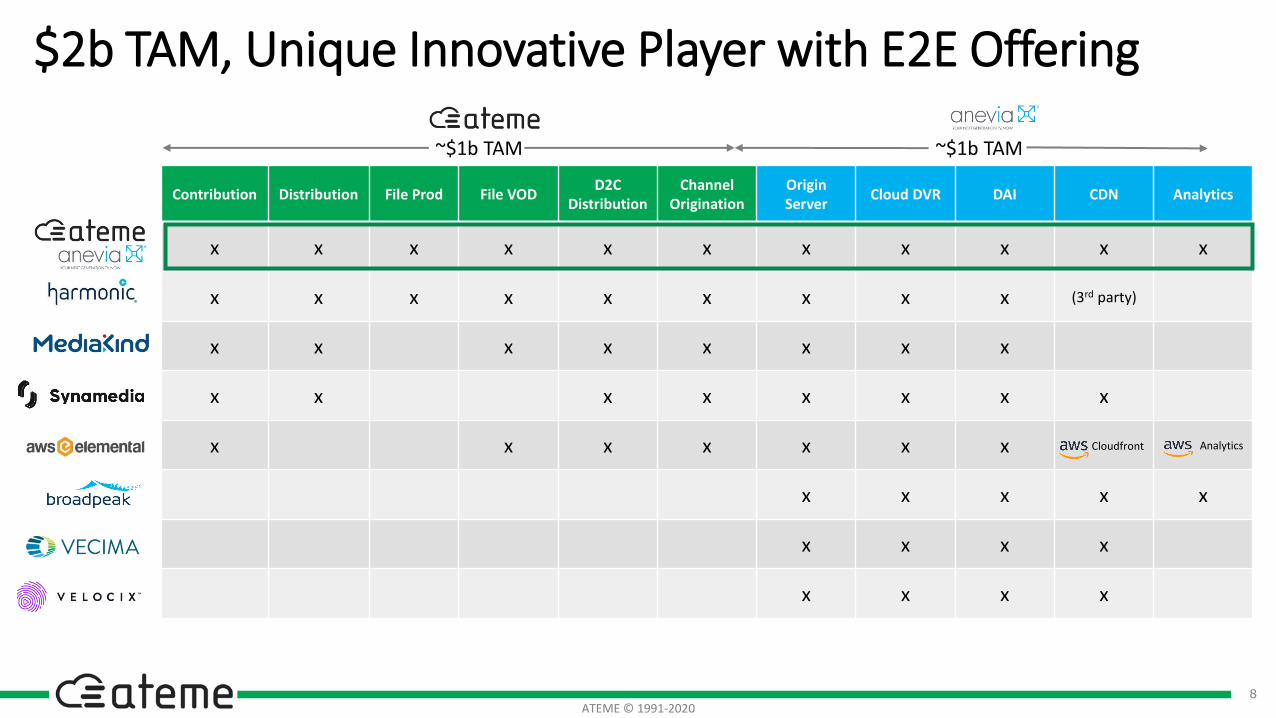
Contribution Distribution File Prod File VODD2C
DistributionChannel
OriginationOriginServer
Cloud DVR DAI CDN Analytics
x x x x x x x x x x x
x x x x x x x x x (3rd party)
x x x x x x x x
x x x x x x x x
x x x x x x x Cloudfront Analytics
x x x x x
x x x x
x x x x
$2b TAM, Unique Innovative Player with E2E Offering
~$1b TAM~$1b TAM
9ATEME © 1991-2020
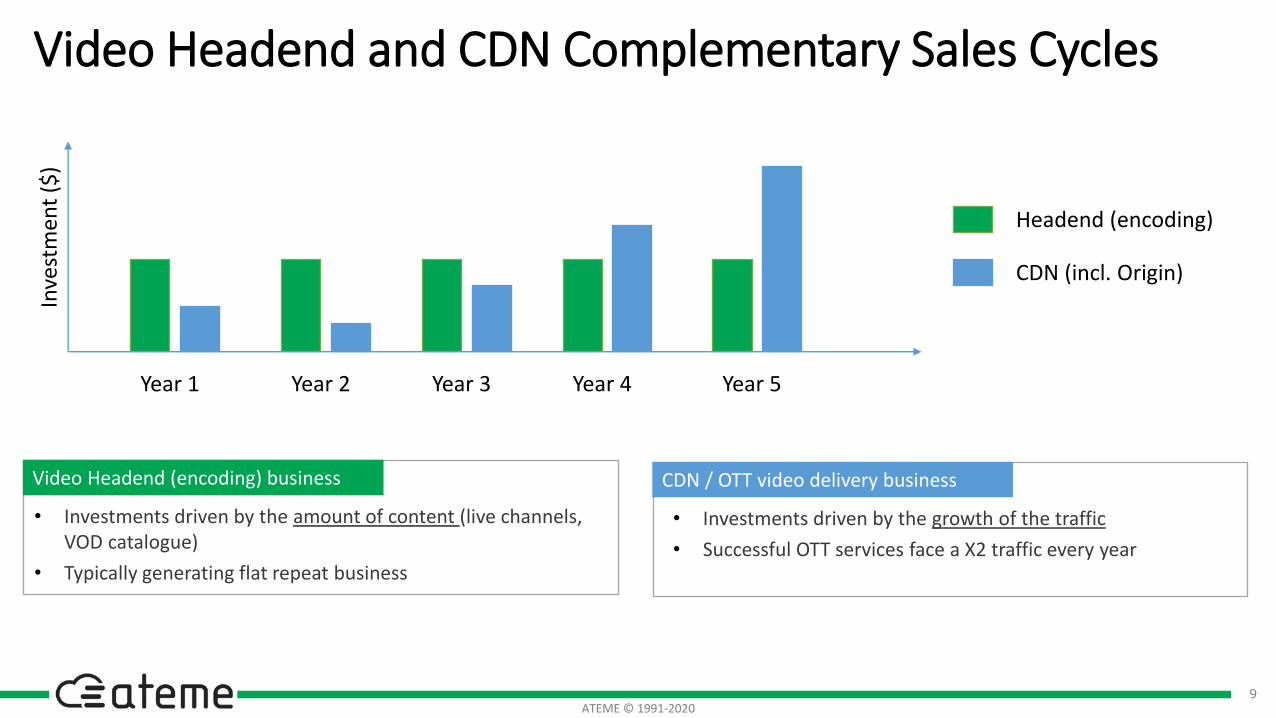
Video Headend and CDN Complementary Sales Cycles
Year 1 Year 2 Year 3 Year 4 Year 5
Headend (encoding)
CDN (incl. Origin)
Inve
stm
ent
($)
Video Headend (encoding) business
• Investments driven by the amount of content (live channels, VOD catalogue)
• Typically generating flat repeat business
CDN / OTT video delivery business
• Investments driven by the growth of the traffic
• Successful OTT services face a X2 traffic every year

ATEME © 1991-2021. Confidential & Proprietary10
ATEME Engaged in Corporate Social Responsibility
People Environment
Ateme and our people
• Focus on talent development
• Equal treatment for men and women
• Non-discrimination in hiring
• Ethic management
Ateme and the world
• Ethic business relationship with shareholders, clients, partners and suppliers
• Donations to charity organizations (humanitarian, education)
Titan and Nea innovations saved 65% of the video delivery energetic impact in 3 years while improving viewers’ experience
Targeting 50%+ additional savings in the next 3 years
Ateme committed to reduce our own impact by 50% in 3 years
• Reduction of business trips and attendance on trade shows
• 50% telework approved for R&D and HQ as the new normal

11ATEME © 1991-2020
1. Two Leaders Joining Forces
2.Market Trends3. ATEME 2020 Results
4. Outlook

12ATEME © 1991-2020
Evolution of the Media Landscape
Studios/Broadcasters/NetworksCreated string brands in the 80’s-90’s
Service Providers (MVPDs) Historically, got the broader access to customer
SVOD or Ad-Supported VOD ServiceImpose Binge Watching as the Way to consume video
Virtual Service Providers (vMVPDs)New content or Skinny cost-effective bundlesNew
Entrants
Digital Native
Traditional Players
TV/STB native
Content ProvidersCreate/Produce/License Content
Service ProvidersAggregate/Distribute Content
13ATEME © 1991-2020
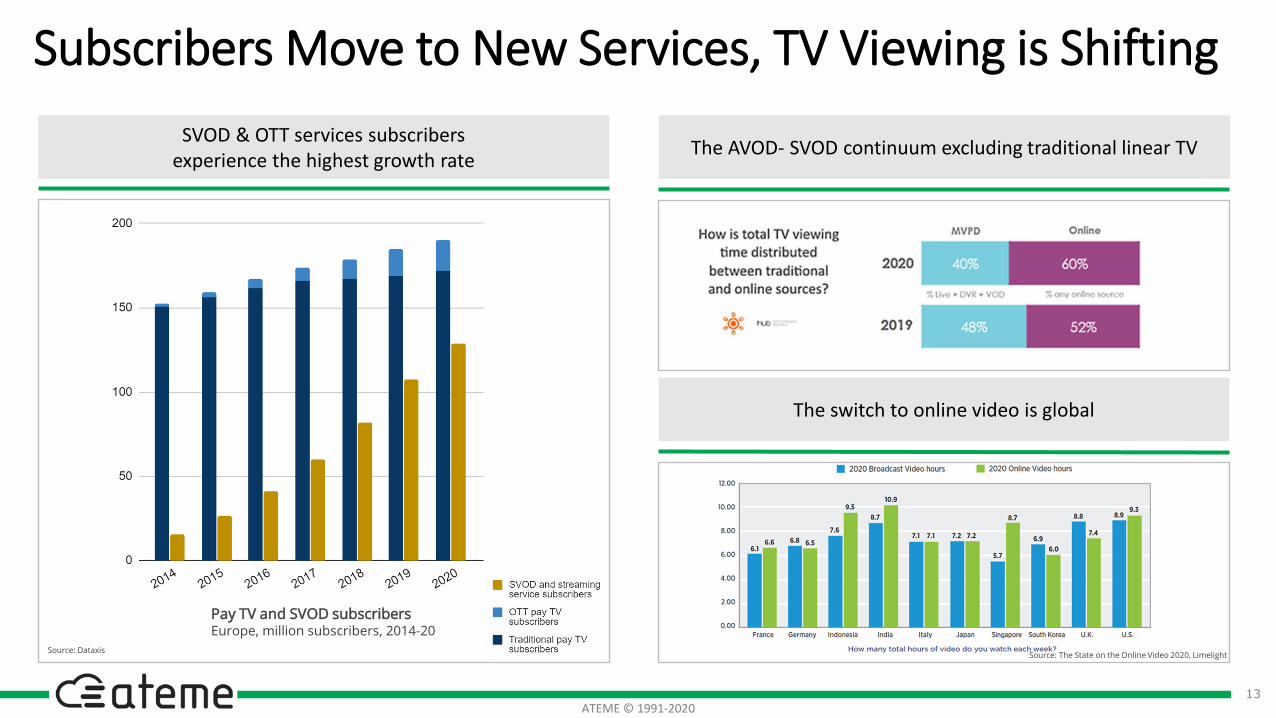
Subscribers Move to New Services, TV Viewing is Shifting
The AVOD- SVOD continuum excluding traditional linear TV
Pay TV and SVOD subscribersEurope, million subscribers, 2014-20
SVOD & OTT services subscribers experience the highest growth rate
The switch to online video is global
Source: The State on the Online Video 2020, LimelightSource: Dataxis
14ATEME © 1991-2020
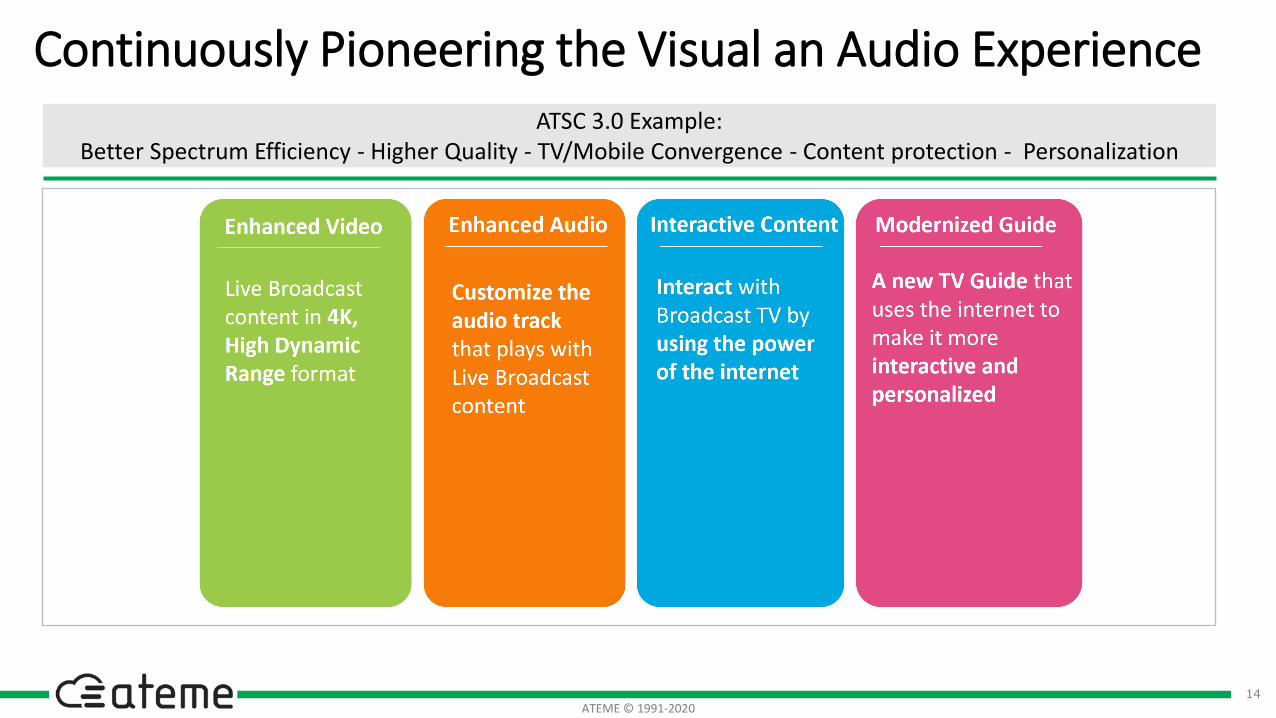
Continuously Pioneering the Visual an Audio ExperienceATSC 3.0 Example:
Better Spectrum Efficiency - Higher Quality - TV/Mobile Convergence - Content protection - Personalization
15ATEME © 1991-2020
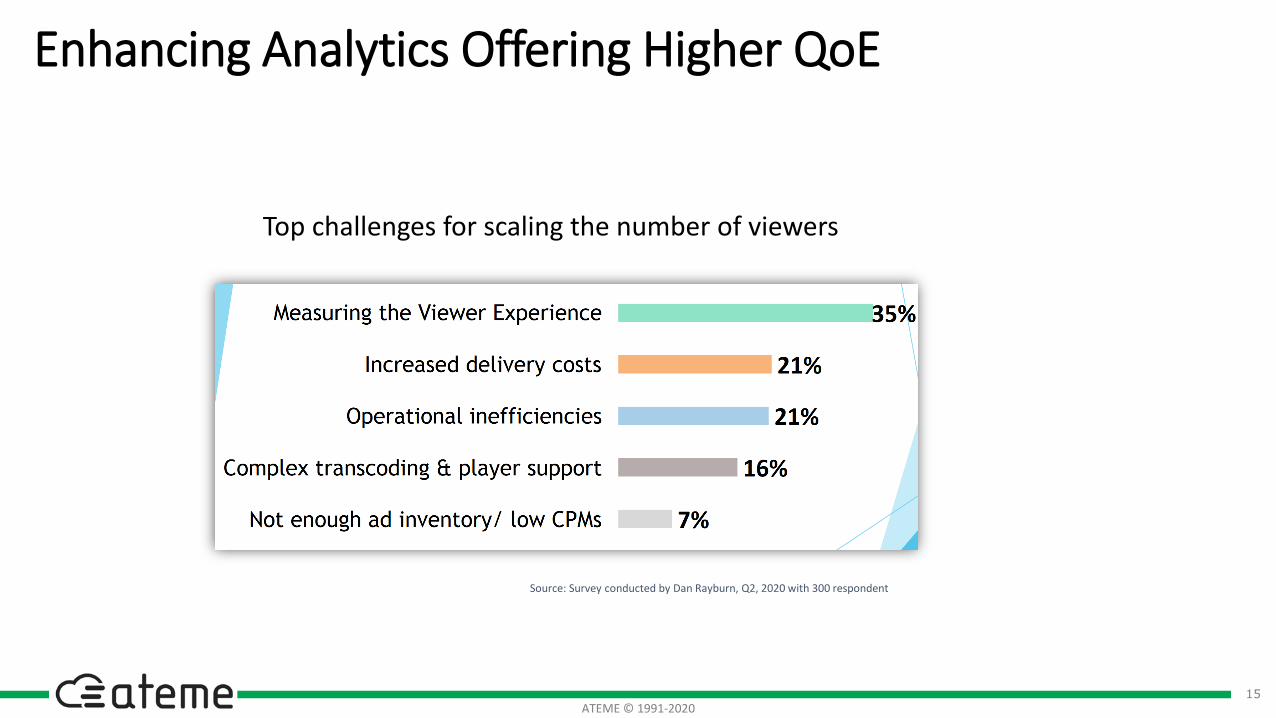
Enhancing Analytics Offering Higher QoE
Top challenges for scaling the number of viewers
Source: Survey conducted by Dan Rayburn, Q2, 2020 with 300 respondent
16ATEME © 1991-2020
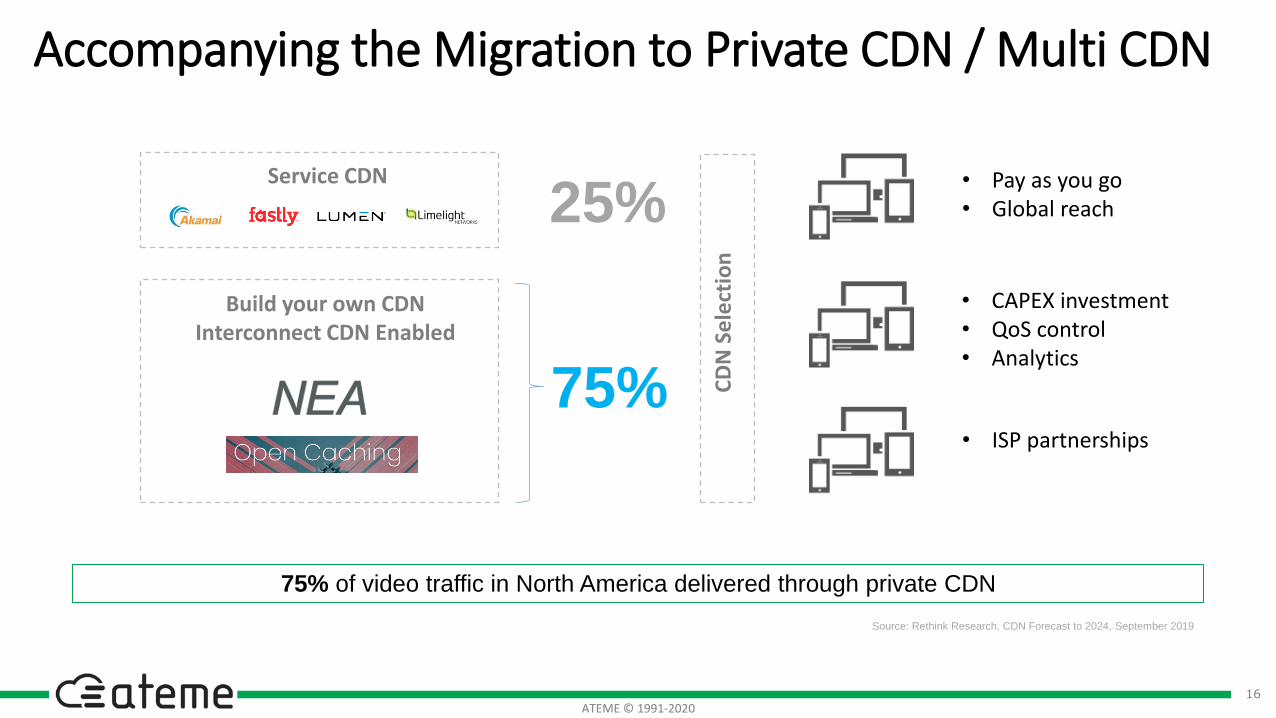
Accompanying the Migration to Private CDN / Multi CDN
Service CDN
Build your own CDNInterconnect CDN Enabled
• Pay as you go• Global reach
• CAPEX investment• QoS control• Analytics
• ISP partnerships
CD
N S
ele
ctio
n
Source: Rethink Research, CDN Forecast to 2024, September 2019
75%
25%
75% of video traffic in North America delivered through private CDN

17ATEME © 1991-2020
5G Broadcast – When Over-The-Air Meets Over-The-Top
• Convergence of OTT and Over-the-Air
• Pro-active standardizations activities: DVB-I, MABR, CMAF
• Strong parentship with ecosystem players
Leveraging Ateme’s expertise and involvement in standardisation

18ATEME © 1991-2020
Enabling Personalization for Boosting Engagement
Netflix is testing a TV-like channel based on their recommendation engine
The Wheather Channel has launched a local OTT version

19ATEME © 1991-2020
The Power of Personalization
Source: Deloitte InsightsSource: Google
Source: Tivo
Boosting Viewership Engagement Customers are Looking for It
Increase Ads Revenue

20ATEME © 1991-2020
How We Help
Personalization
Sustainable & Green Video Services
Generate New Revenue Streams
Next Gen Distribution: 5G, Services Aggregation
Lower Cost of Delivery and Customer Acquisition
High QoE on any screen boosting subscription

21ATEME © 1991-2020
1. Two Leaders Joining Forces
2. Market Trends
3.ATEME 2020 Results4. Outlook

22ATEME © 1991-2020
2011 2012 2013 2014 2015 2016 2017 2018 2019 2020
Q1 Q2 Q3 Q4 Anevia (2 months)
Revenues Evolution by Quarter
€37.5m
€28.6m
€12.3m
€17.9m€20.6m
€24.8m
IPO
€48.6m
+32% GrowthIn Q4 2020
+11%at constant
exch. Rate & perimeter
€56.5m
13.6
€66.3m
12.4
16.5 16.7
14.115.4
€70.7m
22.320.9
2020 REVENUES
€70.7m, up + 7%
(flat at constant exch. Rate & perimeter)
5.3
STRONG GROWTH IN
Q4

23ATEME © 1991-2020
2020 Revenue Split and Growth by Region
USA/CAN+8%
LATAM-16%
APAC+43%
2020 REVENUE SPLIT BY REGION 2020 REVENUE GROWTH BY REGION
-xx%at constant
exchange rate
+xx%at constant
exchange rate
+xx%at constant
exchange rate EMEA+2%
+7%(at constant
exch. rate and perimeter)
-41%(at constant
exch. rate and perimeter)
+45%(at constant
exch. rate and perimeter)
EMEA24.935%
USA/Canada26.537%
LATAM7.511%
APAC11.817%
-7%(at constant
exch. rate and perimeter)

24ATEME © 1991-2020
MRR up 70% in 2020
Multi-Year investment Contracts
Monthly Recurring Revenue
SLASubscription
Contracts
January 2018 January 2019 January 2020 January 2021✓ Increased visibility with secured
revenues✓ Higher resilience in crisis✓ Increased profitability with
optimization of S&M costs
€300k
€880k
€570k
€1.5m +55%
+70%
25ATEME © 1991-2020
-2%
-85%
-%
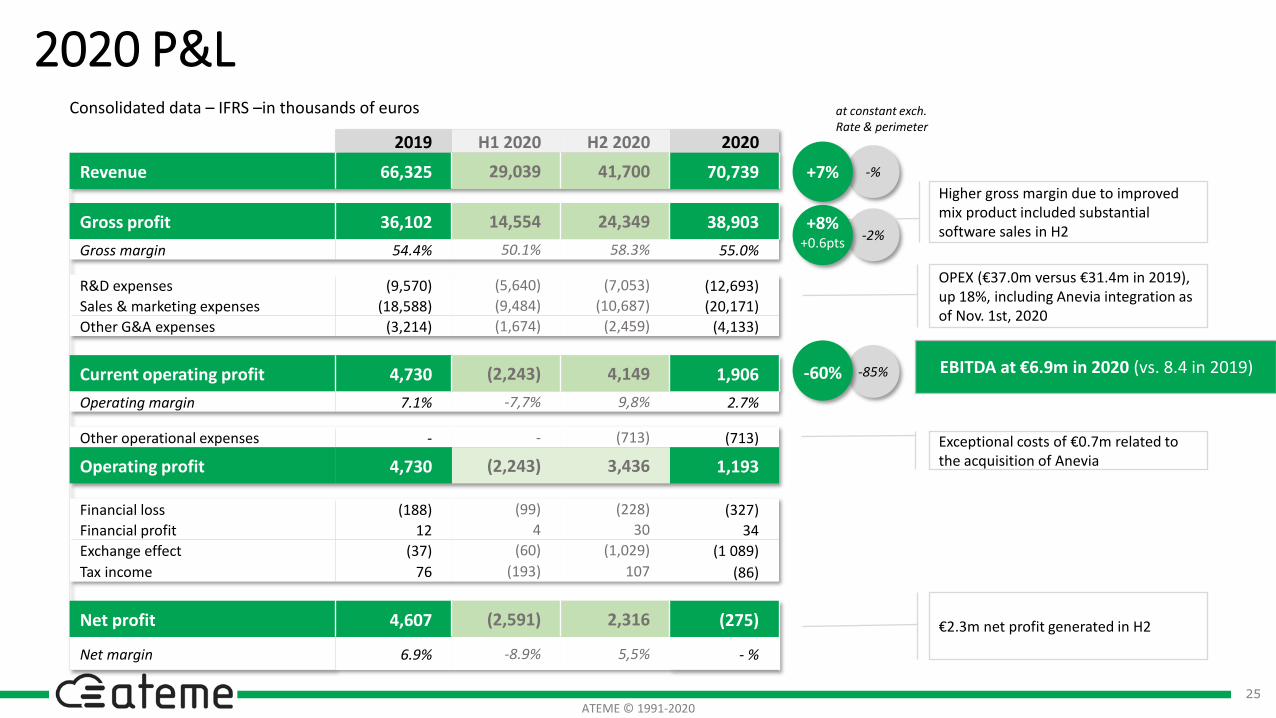
2020 P&LConsolidated data – IFRS –in thousands of euros
Higher gross margin due to improved mix product included substantial software sales in H2
OPEX (€37.0m versus €31.4m in 2019), up 18%, including Anevia integration as of Nov. 1st, 2020
+7%
+8%+0.6pts
-60%
+170%
€2.3m net profit generated in H2
2019 H1 2020 H2 2020 2020
Revenue 66,325 29,039 41,700 70,739
Gross profit 36,102 14,554 24,349 38,903
Gross margin 54.4% 50.1% 58.3% 55.0%
R&D expenses (9,570) (5,640) (7,053) (12,693)
Sales & marketing expenses (18,588) (9,484) (10,687) (20,171)
Other G&A expenses (3,214) (1,674) (2,459) (4,133)
Current operating profit 4,730 (2,243) 4,149 1,906
Operating margin 7.1% -7,7% 9,8% 2.7%
Other operational expenses - - (713) (713)
Operating profit 4,730 (2,243) 3,436 1,193
Financial loss (188) (99) (228) (327)
Financial profit 12 4 30 34
Exchange effect (37) (60) (1,029) (1 089)
Tax income 76 (193) 107 (86)
Net profit 4,607 (2,591) 2,316 (275)
Net margin 6.9% -8.9% 5,5% - %
at constant exch. Rate & perimeter
Exceptional costs of €0.7m related to the acquisition of Anevia
EBITDA at €6.9m in 2020 (vs. 8.4 in 2019)

26ATEME © 1991-2020
IPO July 2014
2016
2015
2014
Growing Profitably Since 2016
2017
€12.3m
€-2.5m
€15.0m
€-1.6m
€16.3m
€0.0m
€12.9m
€-1.1m
€11.9m
€-0.9m
€22.5m
€3.6m
Revenues
Net Loss/Profit
€20.9m
€0.3m
€27.7m
€3.5m
2018
€23.2m
€-3.2m
€33.3m
€4.9m
2019
€30.1m
€-1.2m
€36.2m
€5.8m
2020
€29.0m
€-2.6m
165135
170
220252
300
448*
€41.7m
* incl. Anevia employees
€2.3m

27ATEME © 1991-2020
2020/12/31 Balance SheetConsolidated data - IFRS – in thousands of euros
2019/12/31 2020/12/31
ASS
ETS
Non-current assets 8,931 31,942
o/w Goodwill - 13,186
o/w Intangible assets 1,716 10,850
Current assets 48,204 61,530
o/w stocks 3,065 4,456
o/w trade receivables 29,333 31,665
o/w cash and cash equivalents 10,345 17,095
57,135 93,472
LIA
BIL
ITIE
S
Shareholders’ equity 27,127 35,560
Non-current liabilities 8,217 19,234
o/w non-current financial debt 5,420 16,154
Current liabilities 21,791 38,678
o/w current financial debt 1,252 8,371
o/w trade payables 10,399 14,605
57,135 93,472
Acquisition of Anevia
Of which €3.7m related to the
acquisition of Anevia (earn-out)
Solid cash position
Net debt of €3.7m
28ATEME © 1991-2020
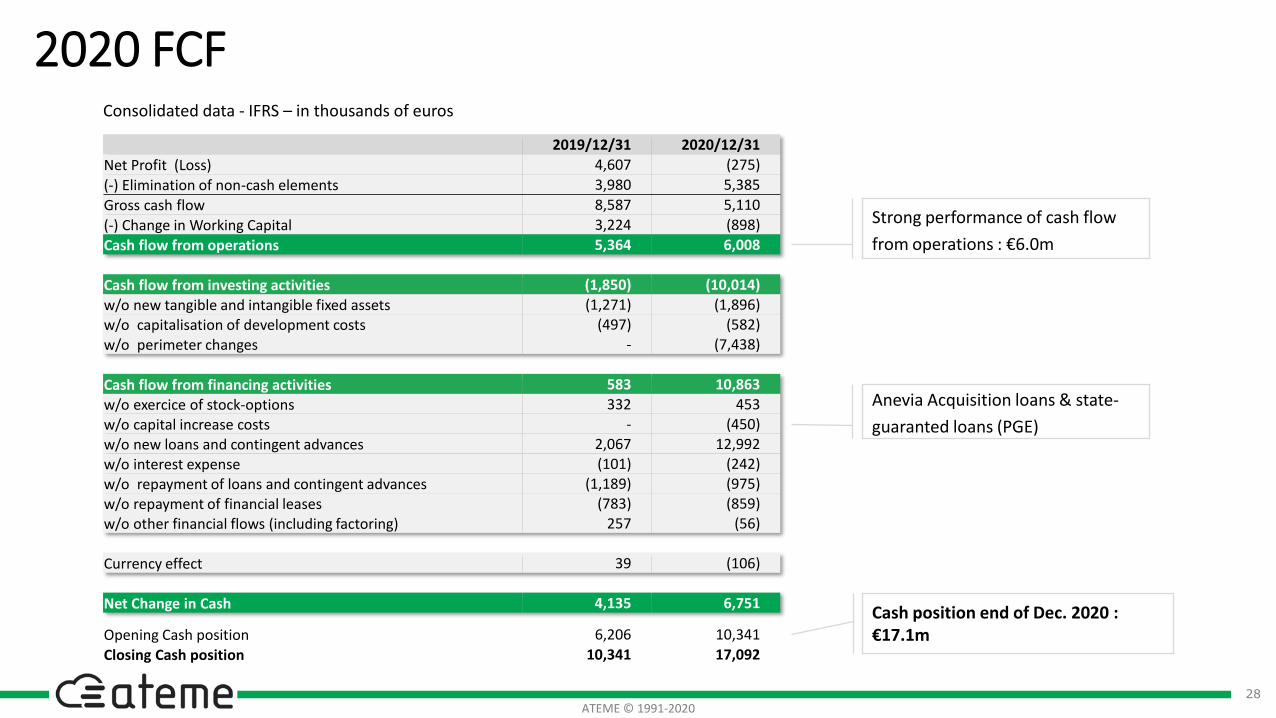
2020 FCFConsolidated data - IFRS – in thousands of euros
Strong performance of cash flow
from operations : €6.0m
Cash position end of Dec. 2020 : €17.1m
2019/12/31 2020/12/31
Net Profit (Loss) 4,607 (275)
(-) Elimination of non-cash elements 3,980 5,385
Gross cash flow 8,587 5,110
(-) Change in Working Capital 3,224 (898)
Cash flow from operations 5,364 6,008
Cash flow from investing activities (1,850) (10,014)
w/o new tangible and intangible fixed assets (1,271) (1,896)
w/o capitalisation of development costs (497) (582)
w/o perimeter changes - (7,438)
Cash flow from financing activities 583 10,863
w/o exercice of stock-options 332 453
w/o capital increase costs - (450)
w/o new loans and contingent advances 2,067 12,992
w/o interest expense (101) (242)
w/o repayment of loans and contingent advances (1,189) (975)
w/o repayment of financial leases (783) (859)
w/o other financial flows (including factoring) 257 (56)
Currency effect 39 (106)
Net Change in Cash 4,135 6,751
Opening Cash position 6,206 10,341
Closing Cash position 10,341 17,092
Anevia Acquisition loans & state-
guaranted loans (PGE)

29ATEME © 1991-2020
1. Two Leaders Joining Forces
2. Market Trends
3. ATEME 2020 Results
4.Outlook

30ATEME © 1991-2020
Boosting future profitability with the ramp-up of MRR
€4mMRR€3m
MRR€1.5mMRR
EBITDA> €10m
EBITDA€30m
€5-10m
€5-10m
€5-10mEBITDAtarget
2021 2024 20262022 2023
Revenues CAGR
10-15%
Strongly growing MRR
MRR covering
50%of cost base
MRR covering
60%of cost base
Doubling NEA revenuesover 2 years

31ATEME © 1991-2020
Investor Relations
Next investor dates
Market data
ISIN: FR0011992700 - Ticker: ATEME
Stock price: €17.80 (as of March 24, 2021)
Market cap: €198.2m (as of March 24, 2021)
Concert Artières
11%
NJJ Capital (Xavier Niel)
5%
Keren Finance5%
Axa IM5%
Otus Capital
9%
Others < 5%65%
Liquidity contract: Kepler Cheuvreux
Source : Company, as of February 28, 2021
Shareholder structureNumber of shares : 11,147,574 Potential dilution : 327,438
Stock price (€)
Volumes(nb of shares)
May 6, 2021 2021 First Quarter Revenues
June 9, 2021 Annual Shareholders Meeting
July 16, 2021 2021 Half-Year Revenues
September 28, 2021 2021 Half-Year Results
November 5, 2021 2021 Third Quarter Revenues0
50 000
100 000
150 000
200 000
250 000
300 000
8 €
10 €
12 €
14 €
16 €
18 €
20 €
01
/07
/20
19
30
/07
/20
19
28
/08
/20
19
26
/09
/20
19
25
/10
/20
19
25
/11
/20
19
24
/12
/20
19
27
/01
/20
20
25
/02
/20
20
25
/03
/20
20
27
/04
/20
20
29
/05
/20
20
29
/06
/20
20
28
/07
/20
20
26
/08
/20
20
24
/09
/20
20
23
/10
/20
20
23
/11
/20
20
22
/12
/20
20
22
/01
/20
21
22
/02
/20
21
23
/03
/20
21