Altered neural connectivity during response inhibition in adolescents with...
11
UNCORRECTED PROOF 1 Altered neural connectivity during response inhibition in adolescents 2 with attention-deficit/hyperactivity disorder and their 3 unaffected siblings 4 Q1 Daan van Rooij a,b, ⁎, Catharina A. Hartman a , Maarten Mennes b , Jaap Oosterlaan c , Barbara Franke d , 5 Nanda Rommelse e , Dirk Heslenfeld c , Stephen V. Faraone f , Jan K. Buitelaar e,g,1 , Pieter J. Hoekstra a,1 6 a Department of Psychiatry, University of Groningen, University Medical Center Groningen, Groningen, The Netherlands 7 b Centre for Cognitive Neuroimaging, Donders Institute for Brain Cognition and Behavior, Nijmegen, The Netherlands 8 c Department of Psychology, VU University Amsterdam, Amsterdam, The Netherlands 9 d Departments of Human Genetics and Psychiatry, Radboud University Medical Center, Nijmegen, The Netherlands 10 e Karakter Child and Adolescent Psychiatry, Radboud University Medical Center, Nijmegen, The Netherlands 11 f Departments of Psychiatry and of Neuroscience and Physiology, SUNY Upstate Medical University, Syracuse, NY, USA 12 g Department of Cognitive Neuroscience, Radboud University Medical Center, Donders Institute for Brain Cognition and Behavior, Nijmegen, The Netherlands abstract 13 article info 14 Article history: 15 Received 22 December 2014 16 Accepted 6 January 2015 17 Available online xxxx 18 Keywords: 19 ADHD 20 PPI 21 Connectivity 22 Siblings 23 Response inhibition 24 Introduction: Response inhibition is one of the executive functions impaired in attention-deficit/hyperactivity dis- 25 order (ADHD). Increasing evidence indicates that altered functional and structural neural connectivity are part of 26 the neurobiological basis of ADHD. Here, we investigated if adolescents with ADHD show altered functional con- 27 nectivity during response inhibition compared to their unaffected siblings and healthy controls. 28 Methods: Response inhibition was assessed using the stop signal paradigm. Functional connectivity was assessed 29 using psycho-physiological interaction analyses applied to BOLD time courses from seed regions within inferior- 30 and superior frontal nodes of the response inhibition network. Resulting networks were compared between ad- 31 olescents with ADHD (N = 185), their unaffected siblings (N = 111), and controls (N = 125). 32 Results: Control subjects showed stronger functional connectivity than the other two groups within the response 33 inhibition network, while subjects with ADHD showed relatively stronger connectivity between default mode 34 network (DMN) nodes. Stronger connectivity within the response inhibition network was correlated with 35 lower ADHD severity, while stronger connectivity with the DMN was correlated with increased ADHD severity. 36 Siblings showed connectivity patterns similar to controls during successful inhibition and to ADHD subjects dur- 37 ing failed inhibition. Additionally, siblings showed decreased connectivity with the primary motor areas as com- 38 pared to both participants with ADHD and controls. 39 Discussion: Subjects with ADHD fail to integrate activation within the response inhibition network and to inhibit 40 connectivity with task-irrelevant regions. Unaffected siblings show similar alterations only during failed stop tri- 41 als, as well as unique suppression of motor areas, suggesting compensatory strategies. These findings support the 42 role of altered functional connectivity in understanding the neurobiology and familial transmission of ADHD. 43 © 2015 Published by Elsevier Inc. This is an open access article under the CC BY-NC-ND license 44 (http://creativecommons.org/licenses/by-nc-nd/4.0/). 45 46 47 48 49 1. Introduction 50 Response inhibition, the process of actively suppressing an ongoing 51 or inappropriate response, is considered one of the main cognitive con- 52 trol deficits underlying ADHD (Alderson et al., 2007; Goos et al., 2009; 53 Crosbie et al., 2008, 2013). However, a recent meta-analysis has 54 shown only moderate effect sizes and large heterogeneity in response 55 inhibition performance in patients with ADHD, with half of the subjects 56 showing no performance deficits (Lipszyc and R. Schachar, 2010). Brain 57 activation during response inhibition, as measured by functional mag- 58 netic resonance imaging (fMRI), appears to be a more sensitive mea- 59 sure, as indicated by research in children (e.g. 12–14), adolescents NeuroImage: Clinical xxx (2015) xxx–xxx Abbreviations: ADHD, attention deficit/hyperactivity disorder; CD, conduct disorder; DMN, default mode network; GEE, generalized estimating equations; ICV, intraindividual coefficientofvariance; ODD,oppositional defiant disorder; RD, reading disorder; ROI, region of interest; SSRT, stop-signal reaction time; SST, Stop-signal task; SI, supplementary infor- mation; WM, white matter. ⁎ Corresponding author at: Department of Psychiatry, University of Groningen, University Medical Center Groningen, P.O. Box 30.001, Groningen 9700 RB, The Netherlands. E-mail address: [email protected] (D. van Rooij). 1 Shared last authors. YNICL-00420; No. of pages: 11; 4C: http://dx.doi.org/10.1016/j.nicl.2015.01.004 2213-1582/© 2015 Published by Elsevier Inc. This is an open access article under the CC BY-NC-ND license (http://creativecommons.org/licenses/by-nc-nd/4.0/). Contents lists available at ScienceDirect NeuroImage: Clinical journal homepage: www.elsevier.com/locate/ynicl Please cite this article as: van Rooij, D., et al., Altered neural connectivity during response inhibition in adolescents with attention-deficit/ hyperactivity disorder and their unaf..., NeuroImage: Clinical (2015), http://dx.doi.org/10.1016/j.nicl.2015.01.004
Transcript of Altered neural connectivity during response inhibition in adolescents with...
UNCO
RRECTED P
RO
OF
1 Altered neural connectivity during response inhibition in adolescents2 with attention-deficit/hyperactivity disorder and their3 unaffected siblings
4Q1 Daan van Rooij a,b,⁎, Catharina A. Hartman a, Maarten Mennes b, Jaap Oosterlaan c, Barbara Franke d,5 Nanda Rommelse e, Dirk Heslenfeld c, Stephen V. Faraone f, Jan K. Buitelaar e,g,1, Pieter J. Hoekstra a,1
6aDepartment of Psychiatry, University of Groningen, University Medical Center Groningen, Groningen, The Netherlands
7bCentre for Cognitive Neuroimaging, Donders Institute for Brain Cognition and Behavior, Nijmegen, The Netherlands
8cDepartment of Psychology, VU University Amsterdam, Amsterdam, The Netherlands
9dDepartments of Human Genetics and Psychiatry, Radboud University Medical Center, Nijmegen, The Netherlands
10eKarakter Child and Adolescent Psychiatry, Radboud University Medical Center, Nijmegen, The Netherlands
11fDepartments of Psychiatry and of Neuroscience and Physiology, SUNY Upstate Medical University, Syracuse, NY, USA
12gDepartment of Cognitive Neuroscience, Radboud University Medical Center, Donders Institute for Brain Cognition and Behavior, Nijmegen, The Netherlands
a b s t r a c t1 3 a r t i c l e i n f o
14 Article history:
15 Received 22 December 2014
16 Accepted 6 January 2015
17 Available online xxxx
18 Keywords:
19 ADHD
20 PPI
21 Connectivity
22 Siblings
23 Response inhibition
24Introduction:Response inhibition is oneof the executive functions impaired in attention-deficit/hyperactivity dis-
25order (ADHD). Increasing evidence indicates that altered functional and structural neural connectivity are part of
26the neurobiological basis of ADHD. Here, we investigated if adolescents with ADHD show altered functional con-
27nectivity during response inhibition compared to their unaffected siblings and healthy controls.
28Methods: Response inhibition was assessed using the stop signal paradigm. Functional connectivity was assessed
29using psycho-physiological interaction analyses applied to BOLD time courses from seed regions within inferior-
30and superior frontal nodes of the response inhibition network. Resulting networks were compared between ad-
31olescents with ADHD (N = 185), their unaffected siblings (N = 111), and controls (N = 125).
32Results: Control subjects showed stronger functional connectivity than the other two groups within the response
33inhibition network, while subjects with ADHD showed relatively stronger connectivity between default mode
34network (DMN) nodes. Stronger connectivity within the response inhibition network was correlated with
35lower ADHD severity, while stronger connectivity with the DMN was correlated with increased ADHD severity.
36Siblings showed connectivity patterns similar to controls during successful inhibition and to ADHD subjects dur-
37ing failed inhibition. Additionally, siblings showed decreased connectivity with the primarymotor areas as com-
38pared to both participants with ADHD and controls.
39Discussion: Subjects with ADHD fail to integrate activation within the response inhibition network and to inhibit
40connectivity with task-irrelevant regions. Unaffected siblings show similar alterations only during failed stop tri-
41als, aswell as unique suppression ofmotor areas, suggesting compensatory strategies. These findings support the
42role of altered functional connectivity in understanding the neurobiology and familial transmission of ADHD.
43 © 2015 Published by Elsevier Inc. This is an open access article under the CC BY-NC-ND license
44 (http://creativecommons.org/licenses/by-nc-nd/4.0/).
4546
47
48
491. Introduction
50Response inhibition, the process of actively suppressing an ongoing
51or inappropriate response, is considered one of the main cognitive con-
52trol deficits underlying ADHD (Alderson et al., 2007; Goos et al., 2009;
53Crosbie et al., 2008, 2013). However, a recent meta-analysis has
54shown only moderate effect sizes and large heterogeneity in response
55inhibition performance in patients with ADHD, with half of the subjects
56showing no performance deficits (Lipszyc and R. Schachar, 2010). Brain
57activation during response inhibition, as measured by functional mag-
58netic resonance imaging (fMRI), appears to be a more sensitive mea-
59sure, as indicated by research in children (e.g. 12–14), adolescents
NeuroImage: Clinical xxx (2015) xxx–xxx
Abbreviations:ADHD, attention deficit/hyperactivity disorder; CD, conduct disorder;
DMN, defaultmode network; GEE, generalized estimating equations; ICV, intraindividual
coefficientofvariance;ODD,oppositionaldefiantdisorder;RD,readingdisorder;ROI, region
of interest; SSRT, stop-signal reaction time; SST, Stop-signal task; SI, supplementary infor-
mation;WM,whitematter.
⁎ Corresponding author at: Department of Psychiatry, University of Groningen,
University Medical Center Groningen, P.O. Box 30.001, Groningen 9700 RB, The
Netherlands.
E-mail address: [email protected] (D. van Rooij).1 Shared last authors.
YNICL-00420; No. of pages: 11; 4C:
http://dx.doi.org/10.1016/j.nicl.2015.01.004
2213-1582/© 2015 Published by Elsevier Inc. This is an open access article under the CC BY-NC-ND license (http://creativecommons.org/licenses/by-nc-nd/4.0/).
Contents lists available at ScienceDirect
NeuroImage: Clinical
j ourna l homepage: www.e lsev ie r .com/ locate /yn ic l
Please cite this article as: van Rooij, D., et al., Altered neural connectivity during response inhibition in adolescents with attention-deficit/hyperactivity disorder and their unaf..., NeuroImage: Clinical (2015), http://dx.doi.org/10.1016/j.nicl.2015.01.004
UNCO
RRECTED P
RO
OF
60 (Katya Rubia et al., 2005), and adults with ADHD (Cubillo et al., 2011;
61 Mulligan et al., 2011), including a study by our group (Van Rooij et al.,
62 2014). These studies demonstrated that alterations within the neural
63 networks responsible for cognitive control, inhibition, and attention
64 can be found in the absence of behavioral response inhibition deficits.
65 These alterations have been found even in unaffected siblings of sub-
66 jects with ADHD (Van Rooij et al., 2014), adolescents with subthreshold
67 ADHD (Whelan et al., 2012), and adults with ADHD (Cubillo et al.,
68 2010).
69 Neuroimaging studies of response inhibition in healthy subjects
70 have identified a highly interconnected neural network. This involves
71 nodes from the frontal–striatal network such as the inferior frontal
72 gyrus, pre-supplementary motor area, basal ganglia, and suprathalamic
73 nucleus (A.R. Aron et al., 2007a,b; Zandbelt et al., 2013a,b; Hampshire
74 et al., 2010; Majid et al., 2012; Sebastian et al., 2012; Swick et al.,
75 2011; Verbruggen and G. Logan, 2008), as well as nodes from the fron-
76 tal–parietal network including supramarginal and temporal/parietal
77 areas (C. Fassbender et al., 2006; Chambers et al., 2009; Hugh Garavan
78 et al., 2006; Simmonds et al., 2008). Functionally, the inferior frontal
79 gyrus is involved in salience processing and initiation of the inhibition
80 signal (A.R. Aron et al., 2007b; Cai et al., 2011; Chevrier et al., 2007;
81 Hampshire et al., 2010; N. Swann et al., 2009a). This is thought to be
82 the most likely site for integration of response inhibition and higher
83 order cognitive control processes, executed from the superior frontal
84 areas (A.R. Aron, 2011). The pre-supplementarymotor area and subcor-
85 tical regions on the other hand are thought to be involved in the execu-
86 tion of the stop processes (A.R. Aron et al., 2007a; Cai et al., 2012; Chao
87 et al., 2009; de Wit et al., 2012; N.C. Swann et al., 2012; Tabu et al.,
88 2011),whereas the parietal areas are thought to reflect attentional redi-
89 rection and task-set maintenance during response inhibition (C.
90 Fassbender et al., 2006; Chambers et al., 2009).
91 While each of these nodes plays a distinct role in response inhibition,
92 the overall inhibition efficiency may depend on the degree of integra-
93 tion between the different parts of the network. Diminished functional
94 connectivity between the left and right inferior frontal gyrus, caudate/
95 thalamus, cingulate gyrus, and temporal/parietal regions during a re-
96 sponse inhibition task has previously been found in adults with ADHD
97 as compared to healthy controls (Cubillo et al., 2010). Additionally, evi-
98 dence from structural (De La Fuente et al., 2013; N.C. Swann et al., 2012)
99 and resting-state network studies (D.A. Fair et al., 2010; Mennes et al.,
100 2011; Tian et al., 2006) have supported the necessity of network inte-
101 gration during response inhibition and have confirmed altered patterns
102 of connectivity in subjects with ADHD. It is, therefore, specifically inter-
103 esting to investigate to what extent the functional connectivity is al-
104 tered in subjects with neural hypoactivation within the response
105 inhibition network.
106 In a previous paper we showed decreased neural activation during
107 response inhibition in left inferior frontal, left superior frontal, and bilat-
108 eral temporal/parietal areas in adolescents with ADHD and their unaf-
109 fected siblings as compared to healthy controls (Van Rooij et al.,
110 2014). The primary aim of the current studywas to investigate whether
111 subjects with ADHDwould also show decreased functional connectivity
112 between these nodes of the response inhibition network and whether
113 the degree of hypo-connectivitywould be linked to ADHD severity. Sec-
114 ondarily, we aimed to investigate the familial nature of functional con-
115 nectivity by comparing subjects with ADHD not only with healthy
116 controls, but also with their unaffected siblings. Since unaffected sib-
117 lings of subjectswith ADHD share on average half of the genetic risk fac-
118 tors with their affected siblings, we expected similar but less extensive
119 decreases in functional connectivity in this group (Bidwell et al., 2007;
120 Crosbie et al., 2008, 2013). This would support the familial nature of de-
121 creased functional connectivity during response inhibition and its possi-
122 ble use as an endophenotype in ADHD. Finally, we aimed to investigate
123 neural connectivity related to compensatory strategies in both subjects
124 with ADHD and unaffected siblings. Previous investigations had sug-
125 gested that subjectswithADHDmay be able to recruit alternative neural
126recourses to compensate for deficits in prefrontal functioning
127(Catherine Fassbender and Schweitzer, 2006), although we previously
128did not encounter such compensatory mechanisms in our study sample
129with regard to neural activation (Van Rooij et al., 2014). We expected
130that compensation for deficits in neural connectivity within the re-
131sponse inhibition network might occur by recruiting compensatory re-
132sources in other brain regions, leading to increased connectivity with
133these areas.
1342. Methods and materials
1352.1. Participants
136All subjects participated in the NeuroIMAGE project, the Dutch
137follow-up of the International Multicenter ADHD Genetics (IMAGE)
138study. Details about ethics approval, recruitment, assessment, and the
139general testing procedures can be found in the generalmethods and de-
140sign paper of the NeuroIMAGE project (Von Rhein et al., 2014).
141In short, ADHD diagnosis was based on semi-structured interviews
142(the Schedule for Affective Disorders and Schizophrenia for School-
143Age Children [K-SADS] (C. Kaufman et al., 1997)) as well as the Conners
144ADHD questionnaires (Conners et al., 1998a,b). Probands with ADHD
145had to have six ormore hyperactive/impulsive and/or inattentive symp-
146toms according to DSM-IV criteria (American Psychiatric Association,
1472000); unaffected siblings and unrelated controls had to have less
148than two symptoms overall, based on a structured psychiatric interview
149(K-SADS) and Conners questionnaires.
150Inclusion criteria for MRI participation consisted of the absence of
151claustrophobia and any metal in the body. Informed consent was ac-
152quired from all participants, with parents supplying consent for partici-
153pants less than 16 years old. Subsequently, 208 participants with ADHD,
154116 unaffected siblings, and 129 healthy controls successfully per-
155formed the stop signal task within an MRI scanner. Of these, 21 partici-
156pants only completed three out of four response inhibition runs (12
157subjects with ADHD and six unaffected siblings). Six participants were
158excluded after reaching an accuracy of b70% on the go-trials, indicating
159inadequate performance on the task and leaving an insufficient number
160of trials to estimate inhibition measures (four subjects with ADHD, two
161healthy controls). Eleven participants were removed after excessive
162movement (N3 mm within a single run) in the scanner (nine subjects
163with ADHD, one healthy control). Sixteen participants were excluded
164due to incidental neuroradiological findings. This led to a final inclusion
165of 185 subjects with ADHD, 111 unaffected siblings, and 124 controls in
166our analyses (see Q2Table 2).
1672.2. Stop signal task
168A visual version of the stop signal task (Logan et al., 1984) was used
169tomeasure response inhibition during fMRI acquisition. In this task, par-
170ticipants had to respond as quickly as possible to a go-stimulus by left or
171right button press, unless shortly after presentation it was followed by a
172stop signal, in which case they were to withhold their response (25% of
173trials). The task difficultywas adaptive,meaning delays between the go-
174and stop stimulus were adjusted by 50ms after every failed or success-
175ful response, leading to an approximately 50% success rate on the stop-
176trials for all subjects (except for the aforementioned six removed from
177the data). The task consisted of two practice blocks and four test blocks,
178each consisting of 60 trials.
179The Stop Signal Reaction Time (SSRT) was the main measure of re-
180sponse inhibition efficiency, calculated by subtracting the eventual
181delay between the go and stop signals. Secondary task outcome mea-
182sures were the intraindividual coefficient of variation (ICV; derived by
183dividing the reaction time variance by the mean reaction time), and
184the total number of errors. We included both omission and commission
185errors on go-trials in the error scores, since insufficient numbers of ei-
186ther event occurred to model them separately. Both secondary
2 D. van Rooij et al. / NeuroImage: Clinical xxx (2015) xxx–xxx
Please cite this article as: van Rooij, D., et al., Altered neural connectivity during response inhibition in adolescents with attention-deficit/hyperactivity disorder and their unaf..., NeuroImage: Clinical (2015), http://dx.doi.org/10.1016/j.nicl.2015.01.004
UNCO
RRECTED P
RO
OF
187 measures are related mainly to attentional processes that indirectly in-
188 fluence the response inhibition performance (Kofler et al., 2013;
189 Schachar et al., 2004).
190 2.3. Task outcome analysis
191 To link functional connectivity to behavioral performance, the effects
192 of diagnostic group (i.e. ADHD, vs. sibling, vs. healthy control) on the
193 SST task-outcomemeasureswere analyzed. Thiswas analyzed usingGen-
194 eral Estimated Equations models in SPSS (SPSS 19.0 Inc.). Family affilia-
195 tion was added as a between-subject factor to control for relatedness
196 between participants. Age, gender, IQ, and scan-site were added as covar-
197 iates. Effects of medication use and comorbid disorders such as opposi-
198 tional defiant disorder, conduct disorder, and reading disorder on stop
199 signal outcomemeasureswere investigated in separateGEEmodelswith-
200 in the subjectswithADHD(see SI). Further details concerning the analysis
201 of Stop Task outcomes can be found in Van Rooij et al. (2014).
202 2.4. fMRI acquisition
203 Data were acquired at two scanning locations on similar 1.5 Tesla
204 Siemens scanners (Siemens Sonata at VU UMC in Amsterdam; Siemens
205 Avanto at Donders Center for Cognitive Neuroimaging in Nijmegen)
206 using identical protocols, using a T2*weighted echo planar imaging se-
207 quence (TR = 2340 ms, TE = 40 ms, FOV = 224 × 224 mm, 37 inter-
208 leaved slices, voxel size = 3.5 × 3.5 × 3.5 mm, 94 volumes per run).
209 Each participant3s MPRAGE T1 scan (TR = 2730 ms, TE = 2.95 ms,
210 TI = 1000 ms, voxel size = 1 × 1 × 1 mm, FOV= 256 mm, 176 slices)
211 was used for spatial localization and normalization.
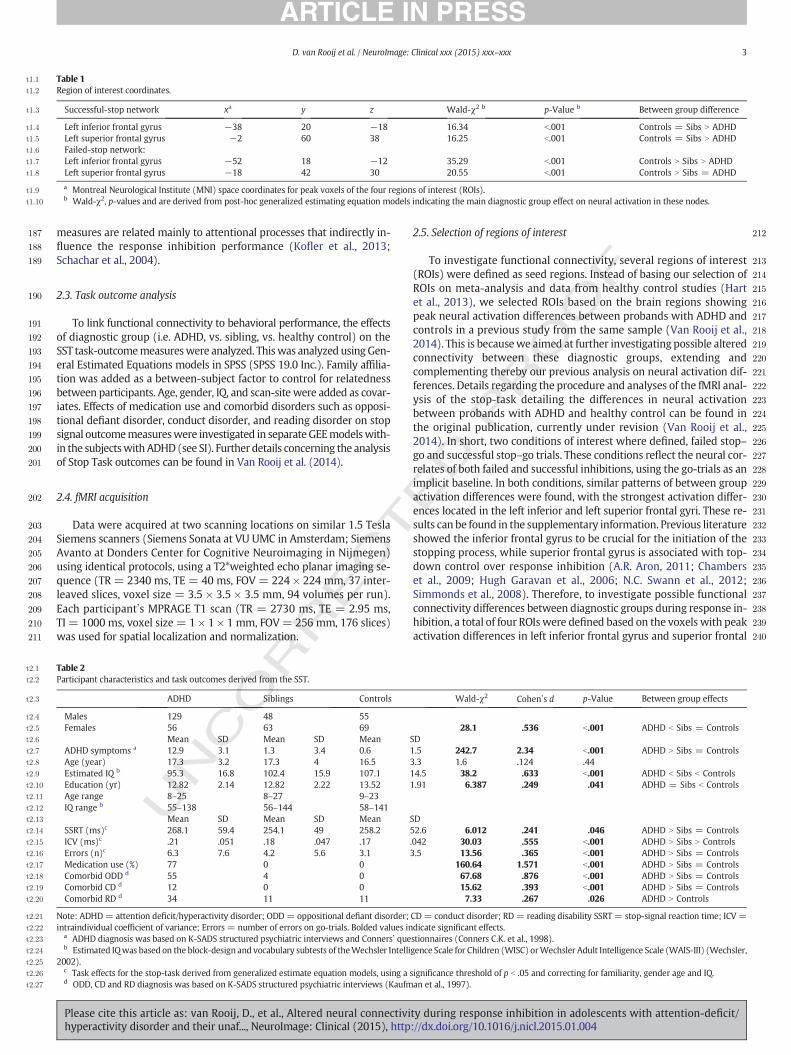
2122.5. Selection of regions of interest
213To investigate functional connectivity, several regions of interest
214(ROIs) were defined as seed regions. Instead of basing our selection of
215ROIs on meta-analysis and data from healthy control studies (Hart
216et al., 2013), we selected ROIs based on the brain regions showing
217peak neural activation differences between probands with ADHD and
218controls in a previous study from the same sample (Van Rooij et al.,
2192014). This is becausewe aimed at further investigating possible altered
220connectivity between these diagnostic groups, extending and
221complementing thereby our previous analysis on neural activation dif-
222ferences. Details regarding the procedure and analyses of the fMRI anal-
223ysis of the stop-task detailing the differences in neural activation
224between probands with ADHD and healthy control can be found in
225the original publication, currently under revision (Van Rooij et al.,
2262014). In short, two conditions of interest where defined, failed stop–
227go and successful stop–go trials. These conditions reflect the neural cor-
228relates of both failed and successful inhibitions, using the go-trials as an
229implicit baseline. In both conditions, similar patterns of between group
230activation differences were found, with the strongest activation differ-
231ences located in the left inferior and left superior frontal gyri. These re-
232sults can be found in the supplementary information. Previous literature
233showed the inferior frontal gyrus to be crucial for the initiation of the
234stopping process, while superior frontal gyrus is associated with top-
235down control over response inhibition (A.R. Aron, 2011; Chambers
236et al., 2009; Hugh Garavan et al., 2006; N.C. Swann et al., 2012;
237Simmonds et al., 2008). Therefore, to investigate possible functional
238connectivity differences between diagnostic groups during response in-
239hibition, a total of four ROIswere defined based on the voxels with peak
240activation differences in left inferior frontal gyrus and superior frontal
t1:1 Table 1
t1:2 Region of interest coordinates.
t1:3 Successful-stop network xa y z Wald-χ2 b p-Value b Between group difference
t1:4 Left inferior frontal gyrus −38 20 −18 16.34 b.001 Controls = Sibs N ADHD
t1:5 Left superior frontal gyrus −2 60 38 16.25 b.001 Controls = Sibs N ADHD
t1:6 Failed-stop network:
t1:7 Left inferior frontal gyrus −52 18 −12 35.29 b.001 Controls N Sibs N ADHD
t1:8 Left superior frontal gyrus −18 42 30 20.55 b.001 Controls N Sibs = ADHD
t1:9a Montreal Neurological Institute (MNI) space coordinates for peak voxels of the four regions of interest (ROIs).
t1:10b Wald-χ2, p-values and are derived from post-hoc generalized estimating equation models indicating the main diagnostic group effect on neural activation in these nodes.
t2:1 Table 2
t2:2 Participant characteristics and task outcomes derived from the SST.
t2:3 ADHD Siblings Controls Wald-χ2 Cohen3s d p-Value Between group effects
t2:4 Males 129 48 55
t2:5 Females 56 63 69 28.1 .536 b.001 ADHD b Sibs = Controls
t2:6 Mean SD Mean SD Mean SD
t2:7 ADHD symptoms a 12.9 3.1 1.3 3.4 0.6 1.5 242.7 2.34 b.001 ADHD N Sibs = Controls
t2:8 Age (year) 17.3 3.2 17.3 4 16.5 3.3 1.6 .124 .44
t2:9 Estimated IQ b 95.3 16.8 102.4 15.9 107.1 14.5 38.2 .633 b.001 ADHD b Sibs b Controls
t2:10 Education (yr) 12.82 2.14 12.82 2.22 13.52 1.91 6.387 .249 .041 ADHD = Sibs b Controls
t2:11 Age range 8–25 8–27 9–23
t2:12 IQ range b 55–138 56–144 58–141
t2:13 Mean SD Mean SD Mean SD
t2:14 SSRT (ms)c 268.1 59.4 254.1 49 258.2 52.6 6.012 .241 .046 ADHD N Sibs = Controls
t2:15 ICV (ms)c .21 .051 .18 .047 .17 .042 30.03 .555 b.001 ADHD N Sibs N Controls
t2:16 Errors (n)c 6.3 7.6 4.2 5.6 3.1 3.5 13.56 .365 b.001 ADHD N Sibs = Controls
t2:17 Medication use (%) 77 0 0 160.64 1.571 b.001 ADHD N Sibs = Controls
t2:18 Comorbid ODD d 55 4 0 67.68 .876 b.001 ADHD N Sibs = Controls
t2:19 Comorbid CD d 12 0 0 15.62 .393 b.001 ADHD N Sibs = Controls
t2:20 Comorbid RD d 34 11 11 7.33 .267 .026 ADHD N Controls
t2:21 Note: ADHD= attention deficit/hyperactivity disorder; ODD = oppositional defiant disorder; CD= conduct disorder; RD = reading disability SSRT = stop-signal reaction time; ICV =
t2:22 intraindividual coefficient of variance; Errors = number of errors on go-trials. Bolded values indicate significant effects.
t2:23a ADHD diagnosis was based on K-SADS structured psychiatric interviews and Conners3 questionnaires (Conners C.K. et al., 1998).
t2:24b Estimated IQwas based on the block-design and vocabulary subtests of theWechsler Intelligence Scale for Children (WISC) orWechsler Adult Intelligence Scale (WAIS-III) (Wechsler,
t2:25 2002).
t2:26c Task effects for the stop-task derived from generalized estimate equation models, using a significance threshold of p b .05 and correcting for familiarity, gender age and IQ.
t2:27d ODD, CD and RD diagnosis was based on K-SADS structured psychiatric interviews (Kaufman et al., 1997).
3D. van Rooij et al. / NeuroImage: Clinical xxx (2015) xxx–xxx
Please cite this article as: van Rooij, D., et al., Altered neural connectivity during response inhibition in adolescents with attention-deficit/hyperactivity disorder and their unaf..., NeuroImage: Clinical (2015), http://dx.doi.org/10.1016/j.nicl.2015.01.004
UNCO
RRECTED P
RO
OF
241 gyrus, from both the successful and failed stop conditions (see Table 1,
242 Fig. 1).
243 2.6. Psycho-physiological interaction connectivity analysis
244 A psycho-physiological interaction analysis executed in FSL FEAT
245 (FMRIB3s Software Library, http://www.fmrib.ox.ac.uk/fsl; fMRI Expert
246 Analysis Tool, version 6.0) was used to determine which voxels co-
247 varied in activation with the seed ROI as a function of task condition,
248 with the valence of the covariance coefficient indicating positive or neg-
249 ative connectivity. The average time series of neural activation was ex-
250 tracted from 6 mm diameter spheres around each ROI and entered as
251 a physiological variable in the psycho-physiological interaction model.
252 The task contrast of interest (successful stop–go or failed stop–go trials)
253 was entered as a psychological variable. The psycho-physiological inter-
254 actionwas obtained bymodeling a third variable as the interaction term
255 between the latter two variables. Since themain task-contrast is includ-
256 ed in the design matrix, the connectivity is effectively calculated over
257 the residuals of the activation maps, ensuring orthogonality of the con-
258 nectivity data from activation data. For optimal estimation ofmovement
259 artifacts, the 24 realignment parameters from the first-level analysis
260 were added, as well as spike regressors for all events within 8 s preced-
261 ing peakmovements greater than 1mm. Runswith totalmovement ex-
262 ceeding 3 mm were removed from the analysis. To correct for
263 background noise, the signal from cerebral spinal fluid (CSF) and
264 white matter (WM), extracted using FSL CSF and WM probability
265 masks (threshold of N0.8) were also added in the first level design.
266 Age, gender, IQ, and scan-site were included as covariates.
267 An F-contrast comparing the control group with the other two
268 groups was applied to the psycho-physiological interaction variable,
269 providing z-maps detailing the between-group effect on functional con-
270 nectivity. Multiple comparisons of resulting z-maps were performed by
271 FSL standards using thresholding clusters with a minimum z-score of
272 2.3 and a corrected p-value of b0.05 (Woo et al., 2014). Between-
273 group differences were further investigated by exporting the average
274 connectivity values of all clusters that reached significance in the F-
275 tests, and analyzing these in separate models in SPSS to account for
276 the familial relations between siblings within our sample. These post-
277 hoc analyseswere used to determine the size and direction of anydiffer-
278 ences in functional connectivity between subjects with ADHD, their un-
279 affected siblings, and healthy controls. Bonferroni–Holm corrections
280were implemented to account for multiple testing in all post-hoc tests
281(Holm, 1979).
282A series of sensitivity analyses were run, given that the participants
283with ADHD, unaffected siblings, and controls in our study were not a-
284priori matched on demographic factors and across scanner sites (see
285also Von Rhein et al., 2014). Therefore, the potential confounding effects
286of IQ, gender, scanner location, and agewere analyzed to validate the ro-
287bustness of the main diagnostic group effects. These analyses, together
288with tests for the influence of comorbid disorders and medication use
289in subjects with ADHD are also described in the Supplementary Infor-
290mation (SI). To ensure potential motion effects did not influence the
291group comparison, we calculated the root-mean-square of the frame-
292wise displacement over all runs per subject; the three diagnostic groups
293did not differ significantly on this measure (χ2 = 4.46; p = .107). The
294association between frame-wise displacement and the connectivity
295values from the nodes indicated in the group contrasts is depicted in
296SI Q3Table 5.
297Finally, we investigated if functional connectivity was associated
298with response inhibition performance or with ADHD severity. Two
299sets of GEE analyses were performed; one to test the association be-
300tween the SST outcome measures and connectivity in the significant
301nodes from the group contrast and a second to test the associations be-
302tween ADHD severity, as measured by the T-score of the Conners ques-
303tionnaire, and these connectivity patterns. Age, gender, IQ, and scan-site
304were also added as covariates in the post-hoc analyses.
3053. Results
3063.1. Task outcome measures
307Significant effects of diagnostic groupwere foundon all SST outcome
308measures (see Table 2). SSRT was slower in subjects with ADHD
309(mean = 269 ms) as compared to both unaffected siblings (mean =
310254 ms, p = .015) and healthy controls (mean = 255 ms, p = .05),
311but did not differ between the latter two groups. ICVs were higher in
312subjects with ADHD (mean = 0.2082) than in unaffected siblings
313(mean= 0.1860, p b .001), who showed more variability than controls
314(mean = 0.1743, p b .031). Subjects with ADHD made more errors
315(mean= 6.4) than siblings (mean= 4.2, p b .013), whomademore er-
316rors than controls (mean = 3.1, p b .032). No effects of gender, and IQ
317were found on any of the SST measures, nor did comorbid diagnoses
318or medication status affect results. Age had a significant main effect on
Fig. 1. Region of interest (ROIs) based on the maximal diagnostic group difference in neural activation (ADHD vs. Siblings vs. Controls). ROIs of the inferior frontal gyrus (A) and superior
frontal gyrus (B). Red spheres indicate the seed regions from the failed-stop contrast, blue spheres indicate ROIs from the successful-stop contrast.
4 D. van Rooij et al. / NeuroImage: Clinical xxx (2015) xxx–xxx
Please cite this article as: van Rooij, D., et al., Altered neural connectivity during response inhibition in adolescents with attention-deficit/hyperactivity disorder and their unaf..., NeuroImage: Clinical (2015), http://dx.doi.org/10.1016/j.nicl.2015.01.004
UNCO
RRECTED P
RO
OF
319 SST performance, though no interaction effects of age with diagnostic
320 group were found (see SI).
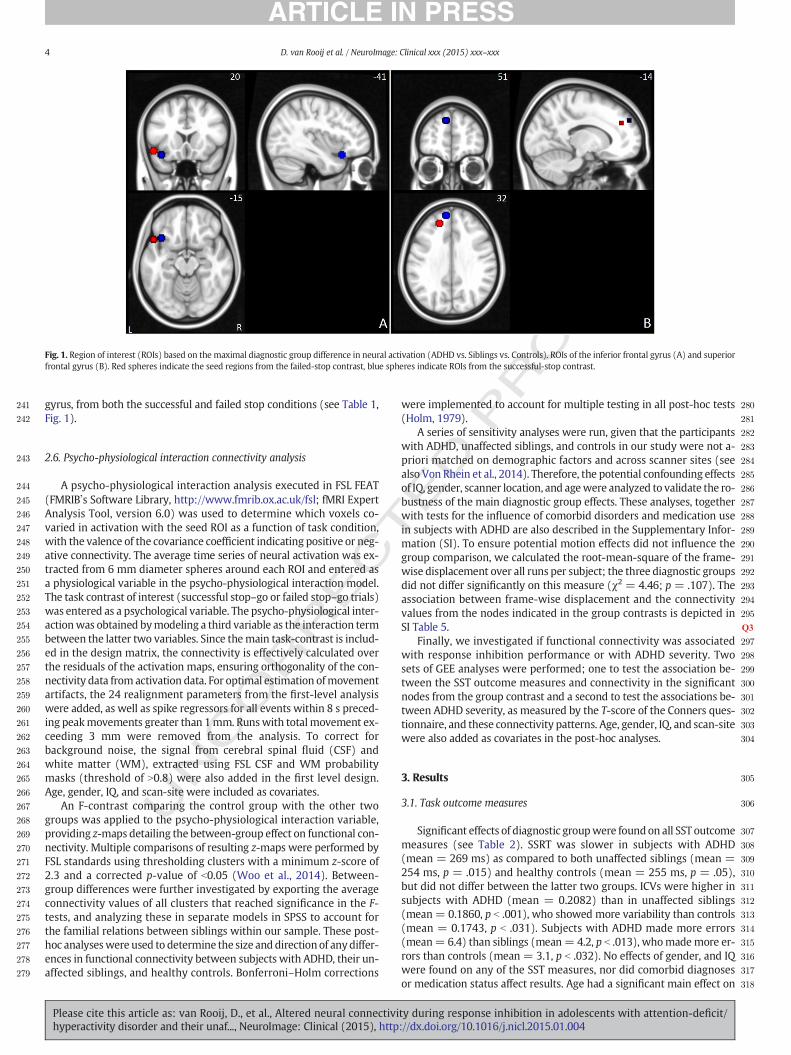
321 3.2. Task connectivity patterns
322Q4 Average connectivity patterns over all subjects from the left inferior
323 frontal seed region for the successful stop network and failed stop con-
324 ditions are shown in Table 3 and Fig. 2A and B, whereas the connectivity
325 patterns from the superior frontal seed are shown in Table 4, and Fig. 2C
326 andD. Over all subjects and task conditions, the areas that showpositive
327 connectivity with the seed regions during stop-task performance main-
328 ly encompass the inferior frontal, anterior cingulate, basal ganglia and
329 supramarginal nodes. Negative connectivity with the seed regions is
330 found in precuneus, occipital and medial frontal areas.
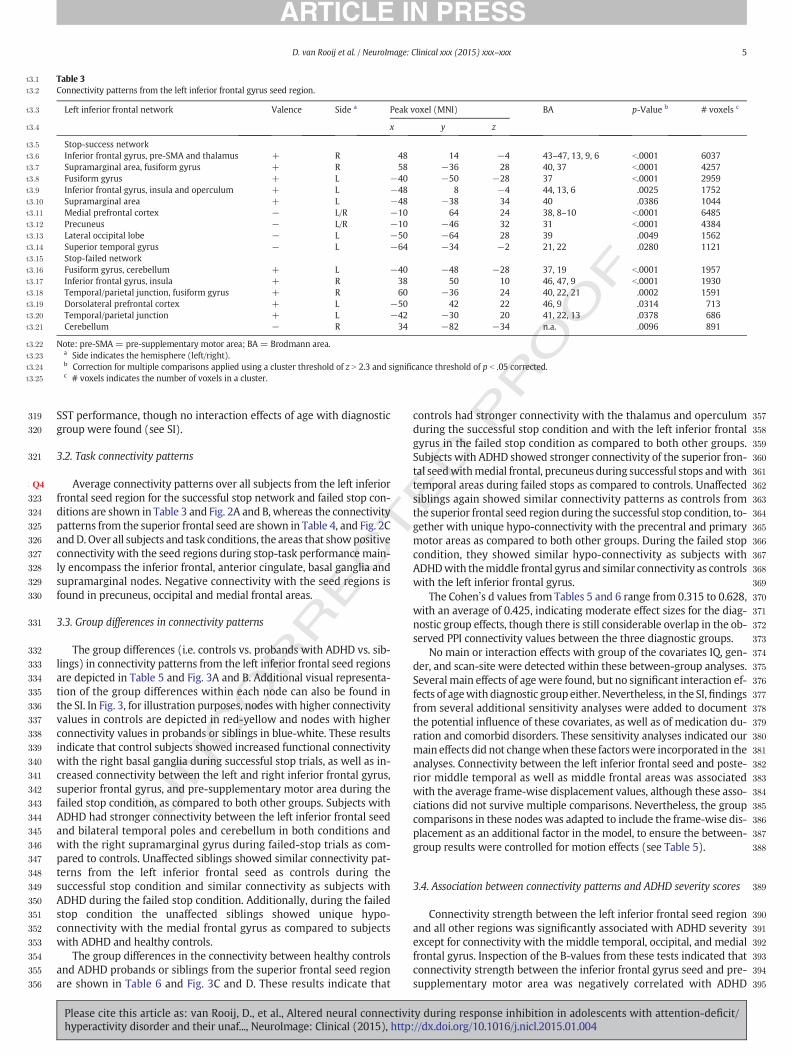
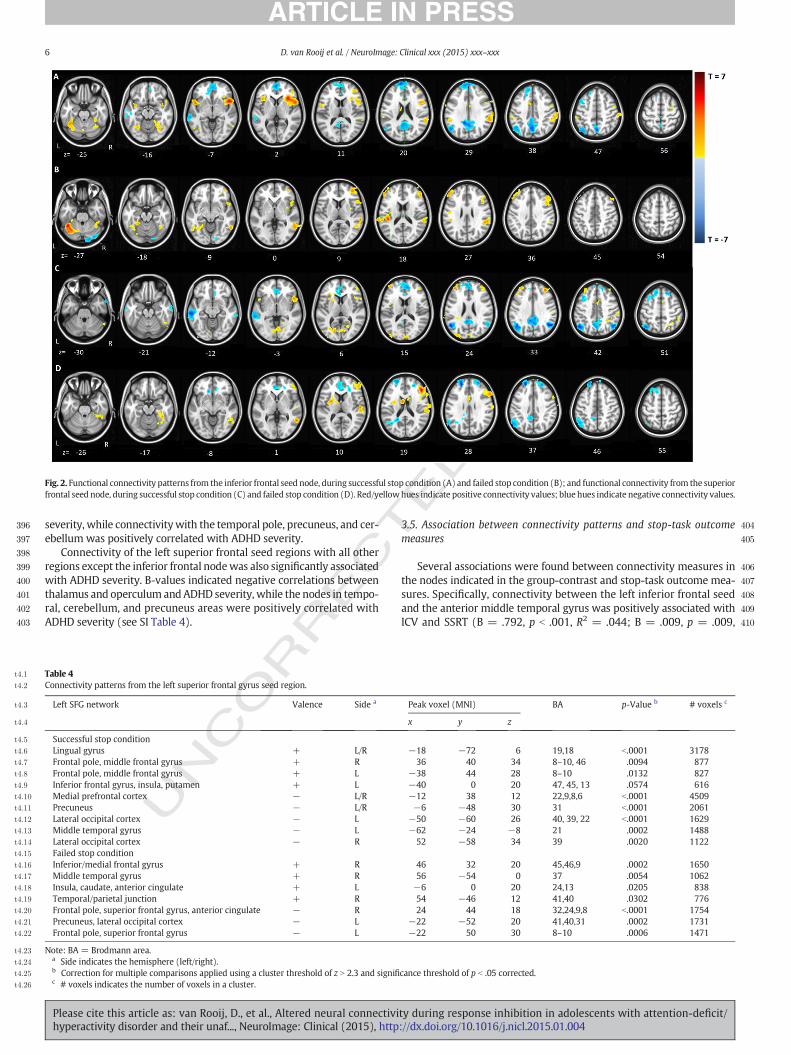
331 3.3. Group differences in connectivity patterns
332 The group differences (i.e. controls vs. probands with ADHD vs. sib-
333 lings) in connectivity patterns from the left inferior frontal seed regions
334 are depicted in Table 5 and Fig. 3A and B. Additional visual representa-
335 tion of the group differences within each node can also be found in
336 the SI. In Fig. 3, for illustration purposes, nodes with higher connectivity
337 values in controls are depicted in red-yellow and nodes with higher
338 connectivity values in probands or siblings in blue-white. These results
339 indicate that control subjects showed increased functional connectivity
340 with the right basal ganglia during successful stop trials, as well as in-
341 creased connectivity between the left and right inferior frontal gyrus,
342 superior frontal gyrus, and pre-supplementary motor area during the
343 failed stop condition, as compared to both other groups. Subjects with
344 ADHD had stronger connectivity between the left inferior frontal seed
345 and bilateral temporal poles and cerebellum in both conditions and
346 with the right supramarginal gyrus during failed-stop trials as com-
347 pared to controls. Unaffected siblings showed similar connectivity pat-
348 terns from the left inferior frontal seed as controls during the
349 successful stop condition and similar connectivity as subjects with
350 ADHD during the failed stop condition. Additionally, during the failed
351 stop condition the unaffected siblings showed unique hypo-
352 connectivity with the medial frontal gyrus as compared to subjects
353 with ADHD and healthy controls.
354 The group differences in the connectivity between healthy controls
355 and ADHD probands or siblings from the superior frontal seed region
356 are shown in Table 6 and Fig. 3C and D. These results indicate that
357controls had stronger connectivity with the thalamus and operculum
358during the successful stop condition and with the left inferior frontal
359gyrus in the failed stop condition as compared to both other groups.
360Subjects with ADHD showed stronger connectivity of the superior fron-
361tal seedwithmedial frontal, precuneus during successful stops andwith
362temporal areas during failed stops as compared to controls. Unaffected
363siblings again showed similar connectivity patterns as controls from
364the superior frontal seed region during the successful stop condition, to-
365gether with unique hypo-connectivity with the precentral and primary
366motor areas as compared to both other groups. During the failed stop
367condition, they showed similar hypo-connectivity as subjects with
368ADHDwith themiddle frontal gyrus and similar connectivity as controls
369with the left inferior frontal gyrus.
370The Cohen3s d values from Tables 5 and 6 range from 0.315 to 0.628,
371with an average of 0.425, indicating moderate effect sizes for the diag-
372nostic group effects, though there is still considerable overlap in the ob-
373served PPI connectivity values between the three diagnostic groups.
374No main or interaction effects with group of the covariates IQ, gen-
375der, and scan-site were detected within these between-group analyses.
376Severalmain effects of age were found, but no significant interaction ef-
377fects of agewith diagnostic group either. Nevertheless, in the SI,findings
378from several additional sensitivity analyses were added to document
379the potential influence of these covariates, as well as of medication du-
380ration and comorbid disorders. These sensitivity analyses indicated our
381main effects did not changewhen these factorswere incorporated in the
382analyses. Connectivity between the left inferior frontal seed and poste-
383rior middle temporal as well as middle frontal areas was associated
384with the average frame-wise displacement values, although these asso-
385ciations did not survive multiple comparisons. Nevertheless, the group
386comparisons in these nodes was adapted to include the frame-wise dis-
387placement as an additional factor in the model, to ensure the between-
388group results were controlled for motion effects (see Table 5).
3893.4. Association between connectivity patterns and ADHD severity scores
390Connectivity strength between the left inferior frontal seed region
391and all other regions was significantly associated with ADHD severity
392except for connectivity with the middle temporal, occipital, and medial
393frontal gyrus. Inspection of the B-values from these tests indicated that
394connectivity strength between the inferior frontal gyrus seed and pre-
395supplementary motor area was negatively correlated with ADHD
t3:1 Table 3
t3:2 Connectivity patterns from the left inferior frontal gyrus seed region.
t3:3 Left inferior frontal network Valence Side a Peak voxel (MNI) BA p-Value b # voxels c
t3:4 x y z
t3:5 Stop-success network
t3:6 Inferior frontal gyrus, pre-SMA and thalamus + R 48 14 −4 43–47, 13, 9, 6 b.0001 6037
t3:7 Supramarginal area, fusiform gyrus + R 58 −36 28 40, 37 b.0001 4257
t3:8 Fusiform gyrus + L −40 −50 −28 37 b.0001 2959
t3:9 Inferior frontal gyrus, insula and operculum + L −48 8 −4 44, 13, 6 .0025 1752
t3:10 Supramarginal area + L −48 −38 34 40 .0386 1044
t3:11 Medial prefrontal cortex − L/R −10 64 24 38, 8–10 b.0001 6485
t3:12 Precuneus − L/R −10 −46 32 31 b.0001 4384
t3:13 Lateral occipital lobe − L −50 −64 28 39 .0049 1562
t3:14 Superior temporal gyrus − L −64 −34 −2 21, 22 .0280 1121
t3:15 Stop-failed network
t3:16 Fusiform gyrus, cerebellum + L −40 −48 −28 37, 19 b.0001 1957
t3:17 Inferior frontal gyrus, insula + R 38 50 10 46, 47, 9 b.0001 1930
t3:18 Temporal/parietal junction, fusiform gyrus + R 60 −36 24 40, 22, 21 .0002 1591
t3:19 Dorsolateral prefrontal cortex + L −50 42 22 46, 9 .0314 713
t3:20 Temporal/parietal junction + L −42 −30 20 41, 22, 13 .0378 686
t3:21 Cerebellum − R 34 −82 −34 n.a. .0096 891
t3:22 Note: pre-SMA = pre-supplementary motor area; BA = Brodmann area.
t3:23a Side indicates the hemisphere (left/right).
t3:24b Correction for multiple comparisons applied using a cluster threshold of z N 2.3 and significance threshold of p b .05 corrected.
t3:25c # voxels indicates the number of voxels in a cluster.
5D. van Rooij et al. / NeuroImage: Clinical xxx (2015) xxx–xxx
Please cite this article as: van Rooij, D., et al., Altered neural connectivity during response inhibition in adolescents with attention-deficit/hyperactivity disorder and their unaf..., NeuroImage: Clinical (2015), http://dx.doi.org/10.1016/j.nicl.2015.01.004
UNCO
RRECTED P
RO
OF
396 severity, while connectivitywith the temporal pole, precuneus, and cer-
397 ebellum was positively correlated with ADHD severity.
398 Connectivity of the left superior frontal seed regions with all other
399 regions except the inferior frontal nodewas also significantly associated
400 with ADHD severity. B-values indicated negative correlations between
401 thalamus and operculum andADHD severity, while the nodes in tempo-
402 ral, cerebellum, and precuneus areas were positively correlated with
403 ADHD severity (see SI Table 4).
4043.5. Association between connectivity patterns and stop-task outcome
405measures
406Several associations were found between connectivity measures in
407the nodes indicated in the group-contrast and stop-task outcome mea-
408sures. Specifically, connectivity between the left inferior frontal seed
409and the anterior middle temporal gyrus was positively associated with
410ICV and SSRT (B = .792, p b .001, R2 = .044; B = .009, p = .009,
Fig. 2. Functional connectivity patterns from the inferior frontal seed node, during successful stop condition (A) and failed stop condition (B); and functional connectivity from the superior
frontal seed node, during successful stop condition (C) and failed stop condition (D). Red/yellowhues indicate positive connectivity values; bluehues indicate negative connectivity values.
t4:1 Table 4
t4:2 Connectivity patterns from the left superior frontal gyrus seed region.
t4:3 Left SFG network Valence Side a Peak voxel (MNI) BA p-Value b # voxels c
t4:4 x y z
t4:5 Successful stop condition
t4:6 Lingual gyrus + L/R −18 −72 6 19,18 b.0001 3178
t4:7 Frontal pole, middle frontal gyrus + R 36 40 34 8–10, 46 .0094 877
t4:8 Frontal pole, middle frontal gyrus + L −38 44 28 8–10 .0132 827
t4:9 Inferior frontal gyrus, insula, putamen + L −40 0 20 47, 45, 13 .0574 616
t4:10 Medial prefrontal cortex − L/R −12 38 12 22,9,8,6 b.0001 4509
t4:11 Precuneus − L/R −6 −48 30 31 b.0001 2061
t4:12 Lateral occipital cortex − L −50 −60 26 40, 39, 22 b.0001 1629
t4:13 Middle temporal gyrus − L −62 −24 −8 21 .0002 1488
t4:14 Lateral occipital cortex − R 52 −58 34 39 .0020 1122
t4:15 Failed stop condition
t4:16 Inferior/medial frontal gyrus + R 46 32 20 45,46,9 .0002 1650
t4:17 Middle temporal gyrus + R 56 −54 0 37 .0054 1062
t4:18 Insula, caudate, anterior cingulate + L −6 0 20 24,13 .0205 838
t4:19 Temporal/parietal junction + R 54 −46 12 41,40 .0302 776
t4:20 Frontal pole, superior frontal gyrus, anterior cingulate − R 24 44 18 32,24,9,8 b.0001 1754
t4:21 Precuneus, lateral occipital cortex − L −22 −52 20 41,40,31 .0002 1731
t4:22 Frontal pole, superior frontal gyrus − L −22 50 30 8–10 .0006 1471
t4:23 Note: BA = Brodmann area.
t4:24a Side indicates the hemisphere (left/right).
t4:25b Correction for multiple comparisons applied using a cluster threshold of z N 2.3 and significance threshold of p b .05 corrected.
t4:26c # voxels indicates the number of voxels in a cluster.
6 D. van Rooij et al. / NeuroImage: Clinical xxx (2015) xxx–xxx
Please cite this article as: van Rooij, D., et al., Altered neural connectivity during response inhibition in adolescents with attention-deficit/hyperactivity disorder and their unaf..., NeuroImage: Clinical (2015), http://dx.doi.org/10.1016/j.nicl.2015.01.004
UNCO
RRECTED P
RO
OF
411R2 = .011; respectively) in the successful-stop condition. Thus, in-
412creased connectivity was related to higher variability and poorer re-
413sponse inhibition performance. In the failed-stop condition, a positive
414association between inferior frontal and medial frontal connectivity
415and error rates was found (B = .003, p = .019, R2 = .006), indicating
416that increased connectivity between these regions was associated
417with worse task performance, though this latter result did not survive
418the Bonferonni–Holm correction for multiple-comparisons.
419Connectivity between the superior frontal seed region and thalamic
420connectivity was negatively associated with error rates (B = .002, p =
421.005, R2 = .05). Operculum connectivity was additionally negatively
422correlated with SSRT (B = −.022, p = .031) during successful stop tri-
423als, though this result did not survive Bonferonni-Holm correction. In
424other words, higher thalamus connectivity was associated with better
425task performance (see SI Table 3).
4264. Discussion
427Using psycho-physiological interaction analysis to investigate func-
428tional neural connectivity patterns during response inhibition, the cur-
429rent study provided evidence for altered functional connectivity
430patterns underlying response inhibition in adolescents with ADHD
431and their unaffected siblings, compared to healthy controls. Behavioral
432response inhibition deficits were only present in subjects with ADHD,
433as reported previously (Van Rooij et al., 2014).
434Task related connectivity over all subjects in the successful-stop con-
435dition showed positive connectivity between the left inferior frontal and
436superior frontal seed regions with the right inferior frontal gyrus, basal
437ganglia, thalamus, and supramarginal areas, indicating strong connec-
438tivity within the response inhibition network and nodes belonging to
439the ventral attention network (Cortese et al., 2012). Negative connectiv-
440ity was observed between seed regions and nodes in themedial frontal,
441precuneus, and temporal areas, which are generally attributed to the
442default mode network (DMN). During the failed-stop condition, posi-
443tive connectivity patterns remained relatively stable, while negative
444connectivity patterns were largely reduced. These results provide evi-
445dence that the integration of the response inhibition and attention net-
446works is key for proper response inhibition and support previous
447findings on the role of these networks in response inhibition (B.B.
448Zandbelt et al., 2013a,b; Chevrier et al., 2007; D.J. Sharp et al., 2010;
449Jahfari et al., 2011;M.C. Stevens et al., 2007; N.C. Swann et al., 2012). Ad-
450ditionally, recent studies have shown that suppression of activation in
451irrelevant networks, such as the DMN, is necessary for successful task
452performance (Fox et al., 2005; Gao and Lin, 2012; Spreng et al., 2010).
453The pattern of negative correlations between seed regions and task-
454irrelevant nodes during successful versus failed inhibitions in our
455study suggests that suppression of irrelevant networks is key for proper
456response inhibition.
457When compared with controls, subjects with ADHD showedweaker
458connectivity within the response inhibition network and stronger con-
459nectivity between the seed regions and nodes in temporal cortex and
460precuneus. This pattern of increased and decreased connectivity in ado-
461lescents with ADHD largely matches the pattern of positive and nega-
462tive task related connectivity described above, i.e. subjects with ADHD
463showedweaker integration between the relevant nodes in the response
464inhibition network than controls and stronger connectivity with DMN
465nodes, which are irrelevant for task performance. The continued func-
466tional connectivity with task irrelevant nodes is a likely source of inter-
467ference and may cause poorer task performance in these subjects
468(Hampson et al., 2010), as has previously been indicated in several
469other disorders (H. Liu et al., 2012; Hamilton et al., 2011). This interpre-
470tation is also supported by the associations between connectivity and
471ADHD severity. Thedirection of these associations followed the samedi-
472rection as the group contrasts, with higher frontal, opercular, and sub-
473cortical connectivity related to lower ADHD severity and higher
474posterior connectivity related to higher ADHD severity. This indicates,
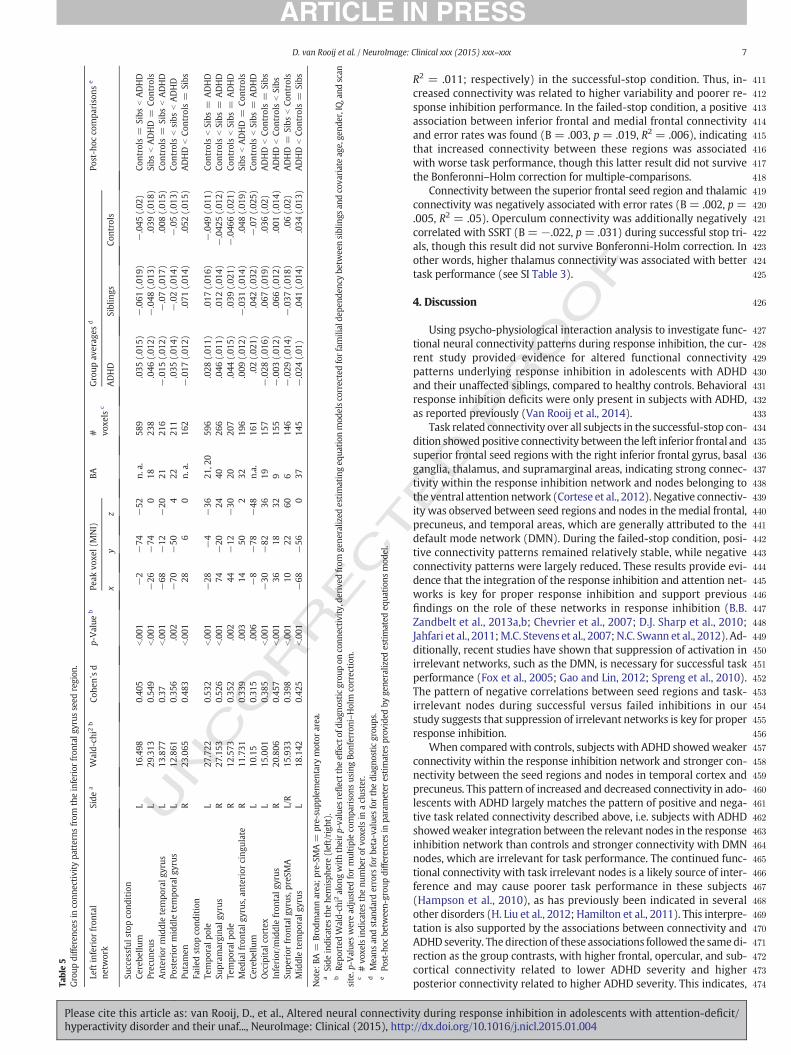
t5:1
Table
5
t5:2
Groupdifferencesin
connectivitypatternsfrom
theinferiorfrontalgyrusseed
region.
t5:3
Leftinferiorfrontal
t5:4
netw
ork
Side
aW
ald-chi2
bCohen3sd
p-V
alue
bPeak
voxel(M
NI)
BA
# voxels
c
Groupav
eragesd
Post-h
occo
mparisonse
t5:5
xy
zADHD
Siblings
Controls
t5:6
Successfulstopco
ndition
t5:7
Cerebellum
L16.498
0.405
b.001
−2
−74
−52
n.a.
589
.035(.015)
−.061(.019)
−.045(.02)
Controls
=SibsbADHD
t5:8
Precu
neus
L29.313
0.549
b.001
−26
−74
018
238
.046(.012)
−.048(.013)
.039(.018)
SibsbADHD
=Controls
t5:9
Anteriormiddle
temporalgyrus
L13.877
0.37
b.001
−68
−12
−20
21
216
−.015(.012)
−.07(.017)
.008(.015)
Controls
=SibsbADHD
t5:10
Posteriormiddle
temporalgyrus
L12.861
0.356
.002
−70
−50
422
211
.035(.014)
−.02(.014)
−.05(.013)
Controls
bsibsbADHD
t5:11
Putamen
R23.065
0.483
b.001
28
60
n.a.
162
−.017(.012)
.071(.014)
.052(.015)
ADHD
bControls
=Sibs
t5:12
Failedstopco
ndition
t5:13
Temporalpole
L27.722
0.532
b.001
−28
−4
−36
21,2
0596
.028(.011)
.017(.016)
−.049(.011)
Controls
bSibs=
ADHD
t5:14
Supramarginal
gyrus
R27.153
0.526
b.001
74
−20
24
40
266
.046(.011)
.012(.014)
−.0425(.012)
Controls
bSibs=
ADHD
t5:15
Temporalpole
R12.573
0.352
.002
44
−12
−30
20
207
.044(.015)
.039(.021)
−.0466(.021)
Controls
bSibs=
ADHD
t5:16
Medialfrontalgyrus,an
teriorcingulate
R11.731
0.339
.003
14
50
232
196
.009(.012)
−.031(.014)
.048(.019)
SibsbADHD
=Controls
t5:17
Cerebellum
L10.15
0.315
.006
−8
−78
−48
n.a.
161
.02(.021)
.042(.032)
−.07(.025)
Controls
bSibs=
ADHD
t5:18
Occipital
cortex
L15.001
0.385
b.001
−30
−82
36
19
157
−.028(.016)
.067(.019)
.036(.02)
ADHD
bControls
=Sibs
t5:19
Inferior/middle
frontalgyrus
R20.806
0.457
b.001
36
18
32
9155
−.003(.012)
.066(.012)
.001(.014)
ADHD
bControls
bSibs
t5:20
Superiorfrontalgyrus,preSMA
L/R
15.933
0.398
b.001
10
22
60
6146
−.029(.014)
−.037(.018)
.06(.02)
ADHD
=SibsbControls
t5:21
Middle
temporalgyrus
L18.142
0.425
b.001
−68
−56
037
145
−.024(.01)
.041(.014)
.034(.013)
ADHD
bControls
=Sibs
t5:22
Note:BA=
Brodman
narea
;pre-SMA=
pre-supplemen
tary
motorarea.
t5:23
aSideindicates
thehem
isphere(left/right).
t5:24
bRep
orted
Wald-chi2alongwiththeirp-values
reflecttheeffect
ofdiagnosticgrouponco
nnectivity,derived
from
gen
eralized
estimatingeq
uationmodelscorrectedforfamiliald
epen
den
cybetwee
nsiblingsan
dco
variate
age,gen
der,IQ,andscan
t5:25
site.p
-Values
weread
justed
formultiple
comparisonsusingBonferroni–Holm
correction.
t5:26
c#voxelsindicates
thenumber
ofvoxelsin
acluster.
t5:27
dMeansan
dstan
darderrors
forbeta-values
forthediagnosticgroups.
t5:28
ePost-hocbetwee
n-groupdifferencesin
param
eter
estimates
provided
bygen
eralized
estimated
equationsmodel.
7D. van Rooij et al. / NeuroImage: Clinical xxx (2015) xxx–xxx
Please cite this article as: van Rooij, D., et al., Altered neural connectivity during response inhibition in adolescents with attention-deficit/hyperactivity disorder and their unaf..., NeuroImage: Clinical (2015), http://dx.doi.org/10.1016/j.nicl.2015.01.004
UNCO
RRECTED P
RO
OF
475 in line with our hypothesis, that increased connectivity with DMN
476 nodes was related to higher ADHD severity, while connectivity with
477 nodes within the functional response inhibition network was related
478 to lower severity. The exception within this pattern of results was the
479 stronger connectivity with cerebellum shown by subjects with ADHD,
480 whichwas also related tomore severe ADHD symptoms. However, pre-
481 vious studies in healthy subjects have indicated a role for the cerebel-
482 lum in the frontal-striatal-cerebellar network during response
483 inhibition (H. Garavan et al., 2003, 1999; Mostofsky et al., 2003), while
484 other studies have indicated decreased cerebellar volumes in children
485 with ADHD (Ivanov et al., 2014; Mackie et al., 2007). More research
486 will be required to specifically delineate whether this additional con-
487 nectivity with the cerebellum in probands reflects compensatory strat-
488 egy during response inhibition, or is unrelated to response inhibition
489 performance and associated with decreased cerebellar volumes.
490 Our analyses of the relationship between behavioral task outcome
491 measures and connectivity further supports the potential functional im-
492 portance of proper integration and suppression, as connectivity with
493 the thalamus and operculumwas related with better task performance,
494 andmedial temporal activationwithworse performance. Medial frontal
495 activation was also related with worse performance, although this may
496 be related to increased errormonitoring activation after failed inhibition
497 (Van Meel et al., 2007). However, effect sizes of these relations were
498 small, and connectivity from other nodes did not significantly correlate
499 with performance. Further research should establish which factors de-
500 termine this potential relation between connectivity and task
501 performance.
502 In unaffected siblings, the observed pattern of connectivity was al-
503 most identical to the healthy controls in the successful-stop condition,
504 while during the failed-stop condition the patterns resembled those of
505 subjects with ADHD. This pattern of partially overlapping hypo-
506 connectivity between subjects with ADHD and their siblings supports
507 the familial nature of functional connectivity, and is in line with our hy-
508 pothesis regarding shared genetic risk factors between subjects with
509ADHD and their siblings and supports the utility of neural measures of
510response inhibition as a putative endophenotype for ADHD. Moreover,
511siblings showed partly unique patterns of functional connectivity
512between the seed regions, medial frontal, and motor areas as compared
513to both other groups. Since these unique patterns of hypo-connectivity
514are all located in task-irrelevant nodes, and since the connectivity values
515in these nodes are all positively associated with ADHD severity, we
516argue that the increased suppression of these areas may constitute a
517compensatory mechanism for decreased integration of the response-
518inhibition. Specifically, the primarymotor areas are amain downstream
519target of the response inhibition network (Aron and Poldrack, 2006;
520Aron et al., 2007b; Aron, 2011), suppression of which is necessary for
521motor inhibition (Swann et al., 2009b; Stinear et al., 2009). Stronger in-
522hibition of the primary motor areas may provide unaffected siblings
523with an alternative strategy to achieve appropriate levels of inhibition,
524distinct from the response inhibition network proper. In our previous
525study, no compensatory neural activation during response inhibition
526was found in unaffected siblings. The current results therefore suggest
527that compensatory connectivity may be able to offset hypoactivation
528in the response inhibition network.
529The hyper-connectivity shown by subjects with ADHD and siblings
530between the left inferior frontal seed and right supramarginal gyrus
531also warrants further attention. The supramarginal areas are considered
532part of the ventral attention network (Cortese et al., 2012; Dosenbach
533et al., 2008), and showgenerally positive connectivitywith the response
534inhibition network over both conditions. Previous studies have attribut-
535ed increased neural activation in supramarginal areas during response
536inhibition to compensatory activation utilized by subjects with ADHD
537to normalize task performance (Dillo et al., 2010; Durston et al., 2003;
538Karch et al., 2010). However, this explanation cannot directly be extrap-
539olated to the current data, aswe found no relation between connectivity
540with supramarginal areas and task outcome measures and only ob-
541served increased connectivity in subjects with ADHD during failed but
542not successful stop trials. It is therefore unclear from the current data
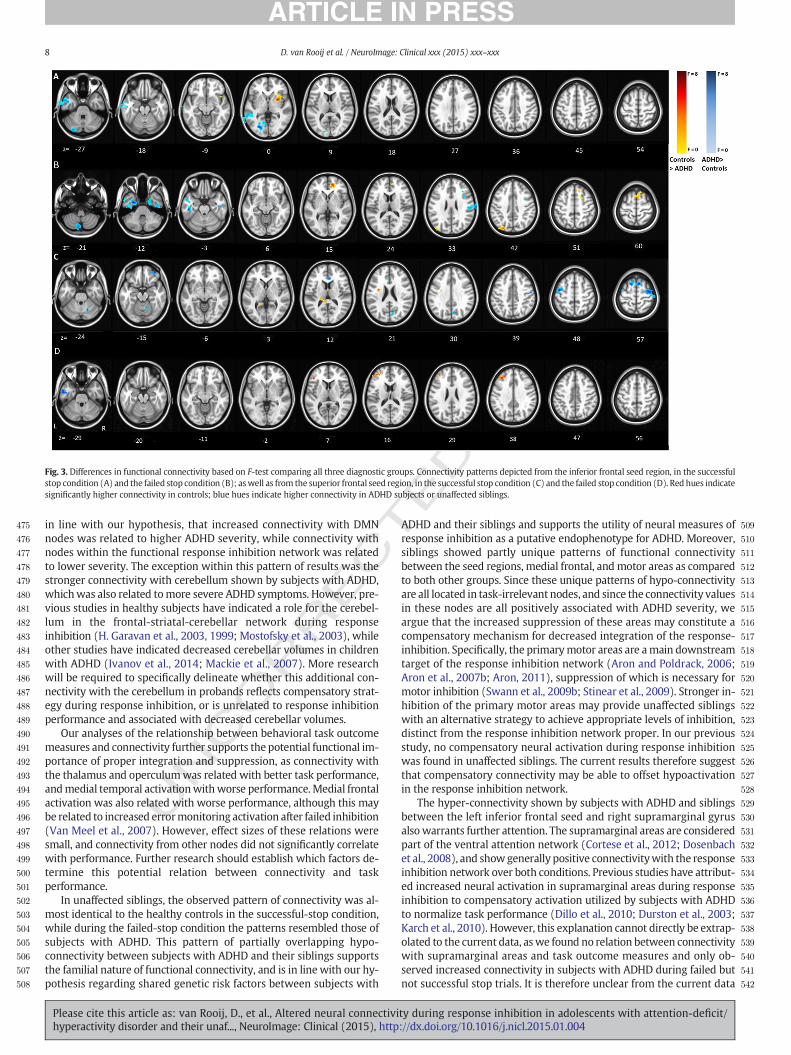
Fig. 3. Differences in functional connectivity based on F-test comparing all three diagnostic groups. Connectivity patterns depicted from the inferior frontal seed region, in the successful
stop condition (A) and the failed stop condition (B); aswell as from the superior frontal seed region, in the successful stop condition (C) and the failed stop condition (D). Red hues indicate
significantly higher connectivity in controls; blue hues indicate higher connectivity in ADHD subjects or unaffected siblings.
8 D. van Rooij et al. / NeuroImage: Clinical xxx (2015) xxx–xxx
Please cite this article as: van Rooij, D., et al., Altered neural connectivity during response inhibition in adolescents with attention-deficit/hyperactivity disorder and their unaf..., NeuroImage: Clinical (2015), http://dx.doi.org/10.1016/j.nicl.2015.01.004
UNCO
RRECTED P
RO
OF
543if enhanced connectivity with the supramarginal areas in participants
544with ADHD and their siblings reflects the recruitment of additional neu-
545ral resources, beneficial to the response inhibition process, or an addi-
546tional source of unrelated or interfering activity.
547Several interesting observations can be made when comparing the
548current groupdifferences in PPI connectivitywith our previously reported
549activation differences in the same sample (Van Rooij et al., 2014). The
550connectivity and activation data have similar effect sizes Q5(the average
551Cohen3s d for connectivity betas is 0.425 and the average Cohen3s d for
552clusters reported in the previous activation research was 0.407. Since
553the PPI analysis is corrected for the main task-contrast, the resulting cor-
554relation between PPI beta values from any nodes with any beta values
555from the task activation was as low as−0.02 (SD= 0.04). This indicates
556that both the connectivity and activation parameters uniquely explain
557variance in ADHD severity. These observations, taken together with
558abovementioned unique patterns of negative connectivity aswell as com-
559pensatory connectivity patterns in unaffected siblings both unseen in the
560activation data, further support the added value of employing both activa-
561tion and connectivity analyses within fMRI research.
562Our study and its findings should be viewed in the context of its
563strengths and weaknesses. Clear strengths of the current paper are the
564large sample size, as well as the inclusion of unaffected siblings in the
565design,which provides insight into the familial nature of functional con-
566nectivity patterns. However, our current analyses do not allow infer-
567ences about causal pathways within the response inhibition network
568and the specific role of the ventral attention network in response inhibi-
569tion. Future studiesmight use causal connectivitymodels (Stevens et al.,
5702007) or interfering transcranial magnetic stimulation (Zandbelt et al.,
5712013a,b) in connected nodes to dissociated these pathways.
572In conclusion, we showed hypo-connectivity during response inhibi-
573tion in both adolescents with ADHD and their unaffected siblings along
574with concomitant hyper-connectivity with DMN nodes in adolescents
575with ADHD with possible compensatory mechanisms in their unaffected
576siblings. Additionally, we showed that the degree of functional connectiv-
577ity in the response inhibition network is correlated with ADHD symptom
578severity. We conclude that altered functional connectivity may represent
579a significant part of the neurobiological alterations underlying ADHD.
580Uncited references
581No citations were found for the following references: Rubia et al.
582(1999) and Rubia et al. (2010)
583Financial disclosures
584This work was supported by NIH Grant R01MH62873 (to Stephen V.
585Faraone), NWO Large Investment Grant 1750102007010 (to Jan
586Buitelaar), and grants from Q6Radboud University NijmegenMedical Cen-
587ter, UniversityMedical Center Groningen and Accare, and VUUniversity
588Amsterdam. Jan K. Buitelaar has been in the past 3 years a consultant to/
589member of advisory board of/and/or speaker for Janssen Cilag BV, Eli
590Lilly, Bristol-Myer Squibb, Schering-Plough, UCB, Shire, Novartis, and
591Servier. He is not an employee of any of these companies and not a
592stock shareholder of any of these companies. He has no other financial
593or material support, including expert testimony, patents and royalties.
594Jaap Oosterlaan has received in the past 3 years an investigator initiated
595grant fromShire pharmaceuticals. Pieter Hoekstra has been paid consul-
596tant of Shire and Eli Lilly and has received unrestricted research funding
597from Shire.
598Acknowledgments
599We acknowledge the Department of Pediatrics of the VU University
600Medical Center for having the opportunity to use the mock scanner for
601preparation of our participants. The authors thank Roshan Cools for
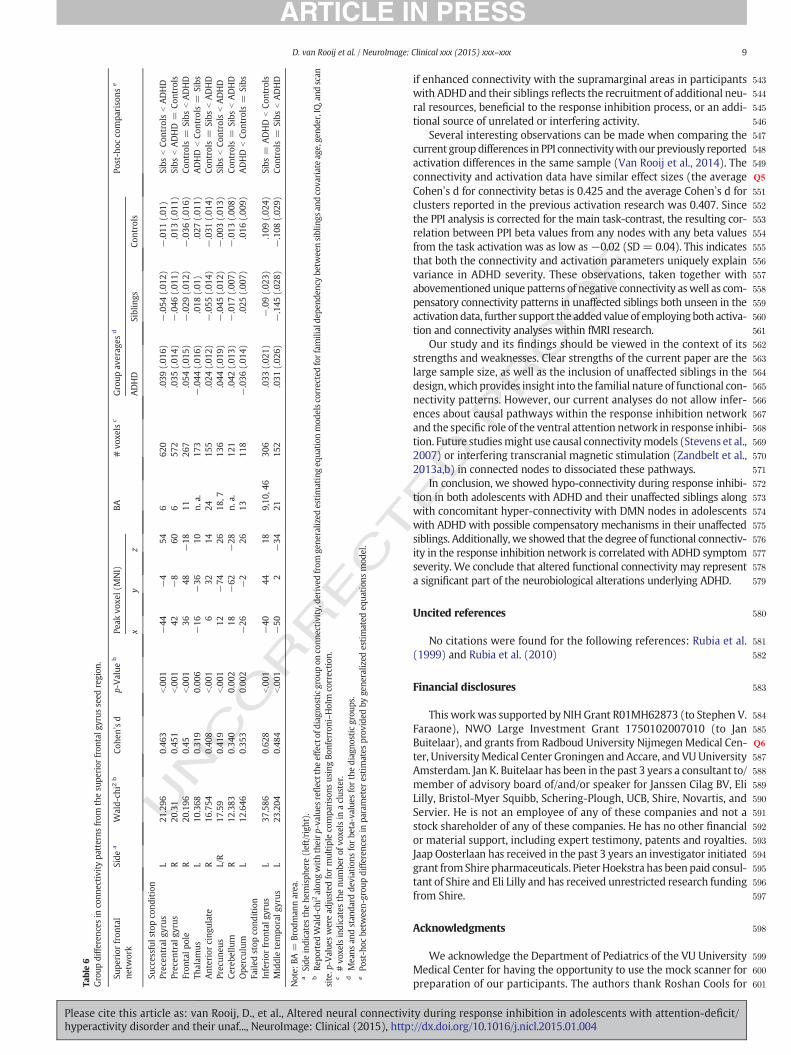
t6:1
Table
6
t6:2
Groupdifferencesin
connectivitypatternsfrom
thesu
periorfrontalgyrusseed
region.
t6:3
Superiorfrontal
t6:4
netw
ork
Side
aW
ald-chi2
bCohen3sd
p-V
alue
bPeak
voxel(M
NI)
BA
#voxels
cGroupav
eragesd
Post-h
occo
mparisonse
t6:5
xy
zADHD
Siblings
Controls
t6:6
Successfulstopco
ndition
t6:7
Precentral
gyrus
L21.296
0.463
b.001
−44
−4
54
6620
.039(.016)
−.054(.012)
−.011(.01)
SibsbControls
bADHD
t6:8
Precentral
gyrus
R20.31
0.451
b.001
42
−8
60
6572
.035(.014)
−.046(.011)
.013(.011)
SibsbADHD
=Controls
t6:9
Frontalpole
R20.196
0.45
b.001
36
48
−18
11
267
.054(.015)
−.029(.012)
−.036(.016)
Controls
=SibsbADHD
t6:10
Thalam
us
L10.368
0.319
0.006
−16
−36
10
n.a.
173
−.044(.016)
.018(.01)
.027(.011)
ADHD
bControls
=Sibs
t6:11
Anteriorcingulate
R16.754
0.408
b.001
632
14
24
155
.024(.012)
−.055(.014)
−.031(.014)
Controls
=SibsbADHD
t6:12
Precu
neus
L/R
17.59
0.419
b.001
12
−74
26
18,7
136
.044(.019)
−.045(.012)
−.003(.013)
SibsbControls
bADHD
t6:13
Cerebellum
R12.383
0.340
0.002
18
−62
−28
n.a.
121
.042(.013)
−.017(.007)
−.013(.008)
Controls
=SibsbADHD
t6:14
Operculum
L12.646
0.353
0.002
−26
−2
26
13
118
−.036(.014)
.025(.007)
.016(.009)
ADHD
bControls
=Sibs
t6:15
Failedstopco
ndition
t6:16
Inferiorfrontalgyrus
L37.586
0.628
b.001
−40
44
18
9,10,4
6306
.033(.021)
−.09(.023)
.109(.024)
Sibs=
ADHD
bControls
t6:17
Middle
temporalgyrus
L23.204
0.484
b.001
−50
2−34
21
152
.031(.026)
−.145(.028)
−.108(.029)
Controls
=SibsbADHD
t6:18
Note:BA=
Brodman
narea.
t6:19
aSideindicates
thehem
isphere(left/right).
t6:20
bRep
orted
Wald-chi2alongwiththeirp-values
reflecttheeffect
ofdiagnosticgrouponco
nnectivity,d
erived
from
gen
eralized
estimatingeq
uationmodelscorrectedforfamiliald
epen
den
cybetwee
nsiblingsan
dco
variate
age,gen
der,IQ,andscan
t6:21
site.p
-Values
weread
justed
formultiple
comparisonsusingBonferroni–Holm
correction.
t6:22
c#voxelsindicates
thenumber
ofvoxelsin
acluster.
t6:23
dMeansan
dstan
darddev
iationsforbeta-values
forthediagnostic
groups.
t6:24
ePost-hocbetwee
n-groupdifferencesin
param
eter
estimates
provided
bygen
eralized
estimated
equationsmodel.
9D. van Rooij et al. / NeuroImage: Clinical xxx (2015) xxx–xxx
Please cite this article as: van Rooij, D., et al., Altered neural connectivity during response inhibition in adolescents with attention-deficit/hyperactivity disorder and their unaf..., NeuroImage: Clinical (2015), http://dx.doi.org/10.1016/j.nicl.2015.01.004
UNCO
RRECTED P
RO
OF
602 her invaluable input and comments in the preparation of this
603 manuscript.
604 Appendix A. Supplementary data
605 Supplementary data to this article can be found online at http://dx.
606 doi.org/10.1016/j.nicl.2015.01.004.
607 References
608 Alderson, R.M., Rapport, M.D., Kofler, M.J., 2007. Attention-deficit/hyperactivity disorder609 and behavioral inhibition: a meta-analytic review of the stop-signal paradigm.610 J. Abnorm. Child Psychol. 35 (5), 745–758. http://dx.doi.org/10.1007/s10802-007-611 9131-617668315.612 American Psychiatric Association, 2000. Diagnostic and Statistical Manual of Mental Dis-613 orders fourth edition, text revision (DSM-IV-TR). American Psychiatric Association,614 Arlington, VA.615 Aron, A.R., 2011. From reactive to proactive and selective control: developing a richer616 model for stopping inappropriate responses. Biol. Psychiatry 69 (12), e55–e68.617 http://dx.doi.org/10.1016/j.biopsych.2010.07.02420932513.618 Aron, A.R., Behrens, T.E., Smith, S., Frank, M.J., Poldrack, R.A., 2007a. Triangulating a cogni-619 tive control network using diffusion-weighted magnetic resonance imaging (MRI)620 and functional MRI. J. Neurosci. 27 (14), 3743–3752. http://dx.doi.org/10.1523/621 JNEUROSCI.0519-07.200717409238.622 Aron, A.R., Durston, S., Eagle, D.M., Logan, G.D., Stinear, C.M., Stuphorn, V., 2007b. Con-623 verging evidence for a fronto-basal-ganglia network for inhibitory control of action624 and cognition. J. Neurosci. 27 (44), 11860–11864. http://dx.doi.org/10.1523/625 JNEUROSCI.3644-07.200717978025.626 Aron, A.R., Poldrack, R.A., 2006. Cortical and subcortical contributions to stop signal re-627 sponse inhibition: role of the subthalamic nucleus. J. Neurosci. 26 (9), 2424–2433.628 http://dx.doi.org/10.1523/JNEUROSCI.4682-05.200616510720.629 Bidwell, L.C., Willcutt, E.G., Defries, J.C., Pennington, B.F., 2007. Testing for neuropsycho-630 logical endophenotypes in siblings discordant for attention-deficit/hyperactivity dis-631 order. Biol. Psychiatry 62 (9), 991–998. http://dx.doi.org/10.1016/j.biopsych.2007.04.632 00317585884.633 Cai, W., George, J.S., Verbruggen, F., Chambers, C.D., Aron, A.R., 2012. The role of the right634 presupplementary motor area in stopping action: two studies with event-related635 transcranial magnetic stimulation. J. Neurophysiol. 108 (2), 380–389. http://dx.doi.636 org/10.1152/jn.00132.201222514296.637 Cai, W., Oldenkamp, C.L., Aron, A.R., 2011. A proactive mechanism for selective suppres-638 sion of response tendencies. J. Neurosci. 31 (16), 5965–5969. http://dx.doi.org/10.639 1523/JNEUROSCI.6292-10.201121508221.640 Chambers, C.D., Garavan, H., Bellgrove, M.A., 2009. Insights into the neural basis of re-641 sponse inhibition from cognitive and clinical neuroscience. Neurosci. Biobehav. Rev.642 33 (5), 631–646. http://dx.doi.org/10.1016/j.neubiorev.2008.08.01618835296.643 Chao, H.H.A., Luo, X., Chang, J.L.K., Li, C.R., 2009. Activation of the pre-supplementary644 motor area but not inferior prefrontal cortex in association with short stop signal re-645 action time — an intra-subject analysis. BCM. J. Neurosci. 10, 1–10. http://dx.doi.org/646 10.1186/1471-2202-10-75.647 Chevrier, A.D., Noseworthy, M.D., Schachar, R., 2007. Dissociation of response inhibition648 and performance monitoring in the stop signal task using event-related fMRI. Hum.649 Brain Mapp. 28 (12), 1347–1358. http://dx.doi.org/10.1002/hbm.2035517274022.650 Conners, C.K., Sitarenios, G., Parker, J.D., Epstein, J.N., 1998a. The revised Conners3 Parent Rat-651 ing Scale (CPRS-R): factor structure, reliability, and criterion validity. J. Abnorm. Child652 Psychol. 26 (4), 257–268. http://dx.doi.org/10.1023/A:10226024006219700518.653 Conners, C.K., Sitarenios, G., Parker, J.D., Epstein, J.N., 1998b. Revision and654 restandardization of the Conners Teacher Rating Scale (CTRS-R): factor structure, re-655 liability, and criterion validity. J. Abnorm. Child Psychol. 26 (4), 279–291. http://dx.656 doi.org/10.1023/A:10226065015309700520.657 Cortese, S., Kelly, C., Chabernaud, C., Proal, E., Di Martino, A., Milham, M.P., Castellanos,658 F.X., 2012. Toward systems neuroscience of ADHD: a meta-analysis of 55 fMRI stud-659 ies. Am. J. Psychiatry 169 (10), 1038–1055. http://dx.doi.org/10.1176/appi.ajp.2012.660 1110152122983386 http://dx.doi.org/10.1176/appi.ajp.2012.11101521.661 Crosbie, J., Arnold, P., Paterson, A., Swanson, J., Dupuis, A., Li, X., Shan, J., Goodale, T., Tam,662 C., Strug, L.J., Schachar, R.J., 2013. Response inhibition and ADHD traits: correlates and663 heritability in a community sample. J. Abnorm. Child Psychol. 41 (3), 497–507. http://664 dx.doi.org/10.1007/s10802-012-9693-923315233.665 Crosbie, J., Pérusse, D., Barr, C.L., Schachar, R.J., 2008. Validating psychiatric666 endophenotypes: inhibitory control and attention deficit hyperactivity disorder.667 Neurosci. Biobehav. Rev. 32 (1), 40–55. http://dx.doi.org/10.1016/j.neubiorev.2007.668 05.00217976721.669 Cubillo, A., Halari, R., Ecker, C., Giampietro, V., Taylor, E., Rubia, K., 2010. Reduced activa-670 tion and inter-regional functional connectivity of fronto-striatal networks in adults671 with childhood attention-deficit hyperactivity disorder (ADHD) and persisting symp-672 toms during tasks of motor inhibition and cognitive switching. J. Psychiatr. Res. 44673 (10), 629–639. http://dx.doi.org/10.1016/j.jpsychires.2009.11.01620060129.674 Cubillo, A., Halari, R., Giampietro, V., Taylor, E., Rubia, K., 2011. Fronto-striatal675 underactivation during interference inhibition and attention allocation in grown up676 childrenwith attention deficit / hyperactivity disorder and persistent symptoms. Psy-677 chiatry Res. 193 (1), 17–27. http://dx.doi.org/10.1016/j.pscychresns.2010.12.678 01421601434.
679De La Fuente, A., Xia, S., Branch, C., Li, X., 2013. A review of attention-deficit/hyperactivity680disorder from the perspective of brain networks. Front. Hum. Neurosci. 7, 192. http://681dx.doi.org/10.3389/fnhum.2013.0019223720619.682De Wit, S.J., De Vries, F.E., Van der Werf, Y.D., Cath, D.C., Heslenfeld, D.J., Veltman, E.M.,683Van Balkom, A.J., Veltman, D.J., Van den Heuvel, O.A., 2012. Presupplementary684motor area hyperactivity during response inhibition: a candidate endophenotype of685obsessive–compulsive disorder. Am. J. Psychiatry 169 (10), 1100–1108. http://dx.686doi.org/10.1176/appi.ajp.2012.1201007323032388.687Dillo, W., Göke, A., Prox-Vagedes, V., Szycik, G.R., Roy, M., Donnerstag, F., Emrich, H.M.,688Ohlmeier, M.D., 2010. Neuronal correlates of ADHD in adults with evidence for com-689pensation strategies — a functional MRI study with a Go/No-go paradigm. Ger. Med.690Sci. 8, 1–8. http://dx.doi.org/10.3205/000098.691Dosenbach, N.U., Fair, D.A., Cohen, A.L., Schlaggar, B.L., Petersen, S.E., 2008. A dual-692networks architecture of top-down control. Trends Cogn. Sci. 12 (3), 99–105.693http://dx.doi.org/10.1016/j.tics.2008.01.00118262825.694Durston, S., Tottenham, N.T., Thomas, K.M., Davidson, M.C., Eigsti, I.-M., Yang, Y., Ulug,695A.M., Casey, B.J., 2003. Differential patterns of striatal activation in young children696with and without ADHD. Biol. Psychiatry 53 (10), 871–878. http://dx.doi.org/10.6971016/S0006-3223(02)01904-212742674.698Fair, D.A., Posner, J., Nagel, B.J., Bathula, D., Dias, T.G., Mills, K.L., Blythe, M.S., Giwa, A.,699Schmitt, C.F., Nigg, J.T., 2010. Atypical default network connectivity in youth with700attention-deficit/hyperactivity disorder. Biol. Psychiatry 68 (12), 1084–1091. http://701dx.doi.org/10.1016/j.biopsych.2010.07.00320728873.702Fassbender, C., Murphy, K., Hester, R., Meaney, J., Robertson, I.H., Garavan, H., 2006. The703role of a right fronto-parietal network in cognitive control: common activations for704“cues-to-attend” and response inhibition. J. Psychophysiol. 20, 286–296. http://dx.705doi.org/10.1027/0269-8803.20.4.286.706Fassbender, C., Schweitzer, J.B., 2006. Is there evidence for neural compensation in atten-707tion deficit hyperactivity disorder? A review of the functional neuroimaging litera-708ture. Clin. Psychol. Rev. 26 (4), 445–465. http://dx.doi.org/10.1016/j.cpr.2006.01.70900316500007.710Fox, M.D., Snyder, A.Z., Vincent, J.L., Corbetta, M., Van Essen, D.C., Raichle, M.E., 2005. The711human brain is intrinsically organized into dynamic, anticorrelated functional net-712works. Proc. Natl. Acad. Sci. U S A 102 (27), 9673–9678. http://dx.doi.org/10.1073/713pnas.050413610215976020.714Gao, W., Lin, W., 2012. Frontal parietal control network regulates the anti-correlated de-715fault and dorsal attention networks. Hum. BrainMapp. 33 (1), 192–202. http://dx.doi.716org/10.1002/hbm.2120421391263.717Garavan, H., Hester, R., Murphy, K., Fassbender, C., Kelly, C., 2006. Individual differences in718the functional neuroanatomy of inhibitory control. Brain Res. 1105 (1), 130–142.719http://dx.doi.org/10.1016/j.brainres.2006.03.02916650836.720Garavan, H., Ross, T.J., Kaufman, J., Stein, E.A., 2003. A midline dissociation between error-721processing and response-conflict monitoring. Neuroimage 20 (2), 1132–1139. http://722dx.doi.org/10.1016/S1053-8119(03)00334-314568482.723Garavan, H., Ross, T.J., Stein, E.A., 1999. Right hemispheric dominance of inhibitory con-724trol: an event-related functional MRI study. Proc. Natl. Acad. Sci. U S A 96 (14),7258301–8306. http://dx.doi.org/10.1073/pnas.96.14.830110393989.726Goos, L.M., Crosbie, J., Payne, S., Schachar, R., 2009. Validation and extension of the727endophenotypemodel in ADHD patterns of inheritance in a family study of inhibitory728control. Am. J. Psychiatry 166 (6), 711–717. http://dx.doi.org/10.1176/appi.ajp.2009.7290804062119448185.730Hamilton, J.P., Furman, D.J., Chang, C., Thomason, M.E., Dennis, E., Gotlib, I.H., 2011.731Default-mode and task-positive network activity inmajor depressive disorder: impli-732cations for adaptive and maladaptive rumination. Biol. Psychiatry 70 (4), 327–333.733http://dx.doi.org/10.1016/j.biopsych.2011.02.00321459364.734Hampshire, A., Chamberlain, S.R., Monti, M.M., Duncan, J., Owen, A.M., 2010. The role of735the right inferior frontal gyrus: inhibition and attentional control. Neuroimage 50736(3), 1313–1319. http://dx.doi.org/10.1016/j.neuroimage.2009.12.10920056157.737Hampson, M., Driesen, N., Roth, J.K., Gore, J.C., Constable, R.T., 2010. Functional connectiv-738ity between task-positive and task-negative brain areas and its relation to working739memory performance. Magn. Reson. Imaging 28 (8), 1051–1057. http://dx.doi.org/74010.1016/j.mri.2010.03.02120409665.741Hart, H., Radua, J., Nakao, T., Mataix-Cols, D., Rubia, K., 2013. Meta-analysis of functional742magnetic resonance imaging studies of inhibition and attention in attention-deficit/743hyperactivity disorder: exploring task-specific, stimulant medication, and age effects.744JAMA Psychiatry 70 (2), 185–198. http://dx.doi.org/10.1001/jamapsychiatry.2013.74527723247506.746Holm, S., 1979. A simple sequentially rejective multiple test procedure. Scand. J. Stat. 6,74765–70.748Ivanov, I., Murrough, J.W., Bansal, R., Hao, X., Peterson, B.S., 2014. Cerebellar morphology749and the effects of stimulant medications in youths with attention deficit-750hyperactivity disorder. Neuropsychopharmacology 39 (3), 718–726. http://dx.doi.751org/10.1038/npp.2013.25724077064.752Jahfari, S., Waldorp, L., van den Wildenberg, W.P., Scholte, H.S., Ridderinkhof, K.R.,753Forstmann, B.U., 2011. Effective connectivity reveals important roles for both the754hyperdirect (fronto-subthalamic) and the indirect (fronto-striatal-pallidal) fronto-755basal ganglia pathways during response inhibition. J. Neurosci. 31 (18), 6891–6899.756http://dx.doi.org/10.1523/JNEUROSCI.5253-10.201121543619.757Karch, S., Thalmeier, T., Lutz, J., Cerovecki, A., Opgen-Rhein,M., Hock, B., Leicht, G., Hennig-758Fast, K., Meindl, T., Riedel, M., Mulert, C., Pogarell, O., 2010. Neural correlates (ERP/759fMRI) of voluntary selection in adult ADHD patients. Eur. Arch. Psychiatry Clin.760Neurosci. 260 (5), 427–440. http://dx.doi.org/10.1007/s00406-009-0089-y19907927.761Kaufman, J., Birmaher, B., Brent, D., Rao, U., Flynn, C., Moreci, P., Williamson, D., Ryan, N.,7621997. Schedule for affective disorders and schizophrenia for school-age children-763present and lifetime version (K-SADS-PL): initial reliability and validity data. J. Am.
10 D. van Rooij et al. / NeuroImage: Clinical xxx (2015) xxx–xxx
Please cite this article as: van Rooij, D., et al., Altered neural connectivity during response inhibition in adolescents with attention-deficit/hyperactivity disorder and their unaf..., NeuroImage: Clinical (2015), http://dx.doi.org/10.1016/j.nicl.2015.01.004
UNCO
RRECTED P
RO
OF
764 Acad. Child Adolesc. Psychiatry 36 (7), 980–988. http://dx.doi.org/10.1097/765 00004583-199707000-000219204677.766 Kofler, M.J., Rapport, M.D., Sarver, D.E., Raiker, J.S., Orban, S.A., Friedman, L.M., Kolomeyer,767 E.G., 2013. Reaction time variability in ADHD: a meta-analytic review of 319 studies.768 Clin. Psychol. Rev. 33 (6), 795–811. http://dx.doi.org/10.1016/j.cpr.2013.06.769 00123872284.770 Lipszyc, J., Schachar, R., 2010. Inhibitory control and psychopathology: a meta-analysis of771 studies using the stop signal task. J. Int. Neuropsychol. Soc. 16 (6), 1064–1076. http://772 dx.doi.org/10.1017/S135561771000089520719043.773 Liu, H., Kaneko, Y., Ouyang, X., Li, L., Hao, Y., Chen, E.Y., Jiang, T., Zhou, Y., Liu, Z., 2012.774 Schizophrenic patients and their unaffected siblings share increased resting-state775 connectivity in the task-negative network but not its anticorrelated task-positive net-776 work. Schizophr. Bull. 38 (2), 285–294. http://dx.doi.org/10.1093/schbul/777 sbq07420595202.778 Logan, G.D., Cowan, W.B., Davis, K.A., 1984. On the ability to inhibit simple and choice re-779 action time responses: a model and a method. J. Exp. Psychol. Hum. Percept. Perform.780 10 (2), 276–291. http://dx.doi.org/10.1037/0096-1523.10.2.2766232345.781 Mackie, S., Shaw, P., Lenroot, R., Pierson, R., Greenstein, D.K., Nugent III, T.F., Sharp, W.S.,782 Giedd, J.N., Rapoport, J.L., 2007. Cerebellar development and clinical outcome in at-783 tention deficit hyperactivity disorder. Am. J. Psychiatry 164 (4), 647–655. http://dx.784 doi.org/10.1176/appi.ajp.164.4.64717403979.785 Majid, D.S., Cai, W., George, J.S., Verbruggen, F., Aron, A.R., 2012. Transcranial magnetic786 stimulation reveals dissociable mechanisms for global versus selective corticomotor787 suppression underlying the stopping of action. Cereb. Cortex 22 (2), 363–371.788 http://dx.doi.org/10.1093/cercor/bhr11221666129.789 Mennes, M., Vega Potler, N., Kelly, C., Di Martino, A., Castellanos, F.X., Milham, M.P., 2011.790 Resting state functional connectivity correlates of inhibitory control in children with791 attention-deficit / hyperactivity disorder. Front. Psychiatry 2, 83. http://dx.doi.org/10.792 3389/fpsyt.2011.0008322470352.793 Mostofsky, S.H., Schafer, J.G., Abrams, M.T., Goldberg, M.C., Flower, A.A., Boyce, A.,794 Courtney, S.M., Calhoun, V.D., Kraut, M.A., Denckla, M.B., Pekar, J.J., 2003. fMRI evi-795 dence that the neural basis of response inhibition is task-dependent. Brain Res796 Cogn Brain Res 17 (2), 419–430. http://dx.doi.org/10.1016/S0926-6410(03)00144-797 712880912.798 Mulligan, R.C., Knopik, V.S., Sweet, L.H., Fischer, M., Seidenberg, M., Rao, S.M., 2011. Neural799 correlates of inhibitory control in adult attention deficit/hyperactivity disorder: evi-800 dence from the Milwaukee longitudinal sample. Psychiatry Res. 194 (2), 119–129.801 http://dx.doi.org/10.1016/j.pscychresns.2011.02.003.Neural21937201.802Q8 Rubia, K., Cubillo, A., Smith, A.B., Woolley, J., Heyman, I., Brammer, M.J., 2010. Disorder-803 specific dysfunction in right inferior prefrontal cortex during two inhibition tasks in804 boys with attention-deficit hyperactivity disorder compared to boys with obses-805 sive–compulsive disorder. Hum. Brain Mapp. 31 (2), 287–299. http://dx.doi.org/10.806 1002/hbm.2086419777552.807Q9 Rubia, K., Overmeyer, S., Taylor, E., Brammer, M., Williams, S.C., Simmons, A., Bullmore,808 E.T., 1999. Hypofrontality in attention deficit hyperactivity disorder during higher-809 order motor control: a study with functional MRI. Am. J. Psychiatry 156 (6),810 891–896. http://dx.doi.org/10.1176/ajp.156.6.89110360128.811 Rubia, K., Smith, A.B., Brammer, M.J., Toone, B., Taylor, E., 2005. Abnormal brain activation812 during inhibition and error detection in medication-naive adolescents with ADHD.813 Am. J. Psychiatry 162 (6), 1067–1075. http://dx.doi.org/10.1176/appi.ajp.162.6.814 106715930054.815 Schachar, R.J., Chen, S., Logan, G.D., Ornstein, T.J., Crosbie, J., Ickowicz, A., Pakulak, A., 2004.816 Evidence for an error monitoring deficit in attention deficit hyperactivity disorder.817 J. Abnorm. Child Psychol. 32 (3), 285–293. http://dx.doi.org/10.1023/B:JACP.818 0000026142.11217.f215228177.819 Sebastian, A., Gerdes, B., Feige, B., Klöppel, S., Lange, T., Philipsen, A., Tebartz van Elst, L.,820 Lieb, K., Tüscher, O., 2012. Neural correlates of interference inhibition, action with-821 holding and action cancelation in adult ADHD. Psychiatry Res. 202 (2), 132–141.822 http://dx.doi.org/10.1016/j.pscychresns.2012.02.01022475505.823 Sharp, D.J., Bonnelle, V., De Boissezon, X., Beckmann, C.F., James, S.G., Patel, M.C., Mehta,824 M.A., 2010. Distinct frontal systems for response inhibition, attentional capture, and825 error processing. Proc. Natl. Acad. Sci. U S A 107 (13), 6106–6111. http://dx.doi.org/826 10.1073/pnas.100017510720220100.827 Simmonds, D.J., Pekar, J.J., Mostofsky, S.H., 2008. Meta-analysis of Go/No-go tasks demon-828 strating that fMRI activation associated with response inhibition is task-dependent.829 Neuropsychologia 46 (1), 224–232. http://dx.doi.org/10.1016/j.neuropsychologia.830 2007.07.01517850833.831 Spreng, R.N., Stevens, W.D., Chamberlain, J.P., Gilmore, A.W., Schacter, D.L., 2010. Default832 network activity, coupled with the frontoparietal control network, supports goal-
833directed cognition. Neuroimage 53 (1), 303–317. http://dx.doi.org/10.1016/j.834neuroimage.2010.06.01620600998.835Stevens, M.C., Kiehl, K.A., Pearlson, G.D., Calhoun, V.D., 2007. Functional neural networks836underlying response inhibition in adolescents and adults. Behav. Brain Res. 181 (1),83712–22. http://dx.doi.org/10.1016/j.bbr.2007.03.02317467816.838Stinear, C.M., Coxon, J.P., Byblow, W.D., 2009. Primary motor cortex and movement pre-839vention: where stop meets Go. Neurosci. Biobehav. Rev. 33 (5), 662–673. http://dx.840doi.org/10.1016/j.neubiorev.2008.08.01318789963.841Swann, N., Tandon, N., Canolty, R., Ellmore, T.M., Mcevoy, L.K., Dreyer, S., Disano, M., Aron,842A.R., 2009a. Intracranial EEG reveals a time- and frequency-specific role for the right843inferior frontal gyrus and primary motor cortex in stopping initiated responses.844J. Neurosci. 29 (40), 12675–12685. http://dx.doi.org/10.1523/JNEUROSCI.3359-09.845200919812342.846Swann, N., Tandon, N., Canolty, R., Ellmore, T.M., Mcevoy, L.K., Dreyer, S., Disano, M., Aron,847A.R., 2009b. Intracranial EEG reveals a time- and frequency-specific role for the right848inferior frontal gyrus and primary motor cortex in stopping initiated responses.849J. Neurosci. 29 (40), 12675–12685. http://dx.doi.org/10.1523/JNEUROSCI.3359-09.850200919812342.851Swann, N.C., Cai, W., Conner, C.R., Pieters, T.A., Claffey, M.P., George, J.S., Aron, A.R.,852Tandon, N., 2012. Roles for the pre-supplementary motor area and the right inferior853frontal gyrus in stopping action: electrophysiological responses and functional and854structural connectivity. Neuroimage 59 (3), 2860–2870. http://dx.doi.org/10.1016/j.855neuroimage.2011.09.04921979383.856Swick, D., Ashley, V., Turken, U., 2011. Are the neural correlates of stopping and not going857identical? Quantitative meta-analysis of two response inhibition tasks. Neuroimage85856 (3), 1655–1665. http://dx.doi.org/10.1016/j.neuroimage.2011.02.07021376819.859Tabu, H., Mima, T., Aso, T., Takahashi, R., Fukuyama, H., 2011. Functional relevance of pre-860supplementary motor areas for the choice to stop during stop signal task. Neurosci.861Res. 70 (3), 277–284. http://dx.doi.org/10.1016/j.neures.2011.03.00721440014.862Tian, L., Jiang, T., Wang, Y., Zang, Y., He, Y., Liang, M., Sui, M., Cao, Q., Hu, S., Peng, M., Zhuo,863Y., 2006. Altered resting-state functional connectivity patterns of anterior cingulate864cortex in adolescents with attention deficit hyperactivity disorder. Neurosci. Lett.865400 (1–2), 39–43. http://dx.doi.org/10.1016/j.neulet.2006.02.02216510242.866VanMeel, C.S., Heslenfeld, D.J., Oosterlaan, J., Sergeant, J.A., 2007. Adaptive control deficits867in attention-deficit/hyperactivity disorder (ADHD): the role of error processing. Psy-868chiatry Res. 151 (3), 211–220. http://dx.doi.org/10.1016/j.psychres.2006.05.86901117328962.870Van Rooij, D., Hartman, C.A., Mennes, M., Oosterlaan, J., Franke, B., Rommelse, N.,871Heslenfeld, D., Faraone, S.V., Buitelaar, J.K., Hoekstra, P.J., Neural activation patterns872in inferior frontal areas during response inhibition distinguish adolescents with873ADHD, their unaffected siblings, and healthy controls. Am. J. Psychiatry (2014) Q10in874press875Verbruggen, F., Logan, G.D., 2008. Response inhibition in the stop-signal paradigm. Trends876Cogn. Sci. 12 (11), 418–424. http://dx.doi.org/10.1016/j.tics.2008.07.005.877Von Rhein, D., Mennes, M., Van Ewijk, H., Groenman, A.P., Zwiers, M.P., Oosterlaan, J.,878Heslenfeld, D., Franke, B., Hoekstra, P.J., Faraone, S.V., Hartman, C., Buitelaar, J.,8792014. The NeuroIMAGE study: a prospective phenotypic, cognitive, genetic and MRI880study in children with attention-deficit/hyperactivity disorder. Design and descrip-881tives. Eur. Child Adolesc. Psychiatry http://dx.doi.org/10.1007/s00787-014-0573-882425012461.883Q11Wechsler, D., 2002. WAIS-III Nederlandstalige bewerking. Technische handleiding. The884Psychological Corporation, London.885Whelan, R., Conrod, P.J., Poline, J.B., Lourdusamy, A., Banaschewski, T., Barker, G.J.,886Bellgrove, M.A., Büchel, C., Byrne, M., Cummins, T.D., Fauth-Bühler, M., Flor, H.,887Gallinat, J., Heinz, A., Ittermann, B., Mann, K., Martinot, J.L., Lalor, E.C., Lathrop, M.,888Loth, E., 2012. Adolescent impulsivity phenotypes characterized by distinct brain net-889works. Nat. Neurosci. 15 (6), 920–928. http://dx.doi.org/10.1038/nn.309222544311.890Woo, C.-W., Krishnan, A., Wager, T.D., 2014. Cluster-extent based thresholding in fMRI891analyses: pitfalls and recommendations. Neuroimage 91, 412–419. http://dx.doi.892org/10.1016/j.neuroimage.2013.12.05824412399.893Zandbelt, B.B., Bloemendaal, M., Hoogendam, J.M., Kahn, R.S., Vink, M., 2013a. Transcranial894magnetic stimulation and functional MRI reveal cortical and subcortical interactions895during stop-signal response inhibition. J. Cogn. Neurosci. 25 (2), 157–174. http://dx.896doi.org/10.1162/jocn_a_0030923066733.897Zandbelt, B.B., Bloemendaal, M., Neggers, S.F., Kahn, R.S., Vink, M., 2013b. Expectations898and violations: delineating the neural network of proactive inhibitory control. Hum.899Brain Mapp. 34 (9), 2015–2024. http://dx.doi.org/10.1002/hbm.2204722359406.
900
11D. van Rooij et al. / NeuroImage: Clinical xxx (2015) xxx–xxx
Please cite this article as: van Rooij, D., et al., Altered neural connectivity during response inhibition in adolescents with attention-deficit/hyperactivity disorder and their unaf..., NeuroImage: Clinical (2015), http://dx.doi.org/10.1016/j.nicl.2015.01.004