Delayed and Accelerated Aging Share Common Longevity Assurance Mechanisms
Upload
independentCategory
view
0download
0
1
Increased longevity in the siblings of late fertile women
Ken R. Smith1, 2
Geri Mineau2, 3
Richard A. Kerber2, 3
Elizabeth O’Brien2
Richard M. Cawthon4
1Department of Family and Consumer Studies
2Huntsman Cancer institute
3Department of Oncological Sciences
4Department of Human Genetics
University of Utah
Salt Lake City, Utah 84112-5330
USA.
Late Fertility and Longevity Smith, Mineau, Kerber, O’Brien, Cawthon
2
Summary
Evolutionary theory predicts genetically determined inter-individual differences in rates of aging
in humans should exist that contribute to inter-individual variation in both the duration of
reproductive life and the age at death. Here we show that among persons with a long-lived
opposite sex sibling (a sister age 98 or older or a brother age 96 or older), those with a late fertile
sister (childbirth at age 46.4 or older) enjoyed a higher median life expectancy (+ 3.9 years for
men, + 6.5 years for women) and probability of surviving to the 95th percentile for age at death
(3.5-fold higher for men, 6.6-fold higher for women) than those whose sisters all completed their
childbearing before age 43.9. These results support the hypothesis that some genetic variants in
human populations simultaneously slow aging, maintain female fertility later in life, and
contribute to longevity in both sexes.

Late Fertility and Longevity Smith, Mineau, Kerber, O’Brien, Cawthon
3
Introduction
Senescence, the deterioration in functioning that is associated with advancing adult age
and increasing adult mortality rates(Finch 1990), is subject to genetic regulation (Jazwinski
1998; Vaupel, Carey et al. 1998). Delayed senescence and increased mean and maximum life
spans in both sexes of the fruit fly Drosophila melanogaster have been achieved by selective
breeding of late-reproducing females from genetically heterogeneous stocks (Rose and
Charlesworth 1981; Luckinbill and Clare 1987; Rose, Nusbaum et al. 1992; Partridge, Prowse et
al. 1999). Recent work has shown that selection for late reproduction in female mice also yields
longer-lived strains (Nagai, Lin et al. 1995). Furthermore, field studies of reproductive histories
and mortality patterns in opossums (Austad 1993), and in baboons and lions (Packer, Tatar et al.
1998), suggest that the timing of reproductive cessation in female mammals is determined
primarily by the rate of senescence.
If there were evidence for genetic co-determination of late fertility in women and
longevity in both sexes, then researchers would then be able to select for study the long-lived
individuals most likely to carry genes for slower aging, i.e., those from families containing late
fertile women. Furthermore, late fertility, along with other putative biomarkers of slower aging
that can be measured in middle-aged women and their family members, may constitute a trait or
trait cluster sufficiently specific for slow aging to allow the identification of the relevant genes
even when long-lived research subjects are not available.
Early age at natural, but not surgical, menopause is associated with higher rates of all-
cause mortality (Snowdon, Kane et al. 1989; Cooper and Sandler 1998). Childbearing after age
40 was four times more frequent in centenarian women than in control women who died in their
early seventies (Perls, Alpert et al. 1997). During a period of natural fertility, late female
Late Fertility and Longevity Smith, Mineau, Kerber, O’Brien, Cawthon
4
fertility was associated with excess longevity after adjusting for the effects of parity (Smith,
Mineau et al. 2002). These studies support the hypothesis that late menopause and late fertility
are markers for slower rates of aging in women. Family and twin studies of age at natural
menopause per se (Torgerson, Thomas et al. 1997; Snieder, MacGregor et al. 1998) and
longevity per s e (Bocquet-Appel 1990; McGue, Vaupel et al. 1993; Perls, Bubrick et al. 1998;
Kerber, O'Brien et al. 2001) indicate that each has a significant genetic component. However,
this body of work has not determined whether longevity is more frequent in the relatives of late
fertile (or late menopausal) women, as would be predicted if genes that slow aging promote both
late fertility in women and longevity in both sexes. Here we compare survival to extreme ages in
sibships containing at least one late fertile woman to survival in sibships in which no woman was
late fertile. To evaluate possible social and environmental explanations of increased sibling
longevity associated with late fertility, we also examine survival among the spouses of the
siblings of late fertile women.
Dataset and Approach
Complete data on human fertility and mortality among all siblings are rare. Most sources
of data on entire human sibships lack death dates, usually because the birth dates are relatively
recent. A unique and very useful resource to investigate our hypothesis is the Utah Population
Database (UPDB). This database includes genealogical data on over one million individuals.
Approximately 70% of the records in the UPDB are for individuals affiliated with the Church of
Jesus Christ of Latter-day Saints (LDS) or Mormons. These records include basic demographic
data (dates and places of birth, marriage, death) and religious data on parents and their children
spanning the years 1800 to 1997. The analysis presented here is for sibships in which all siblings
Late Fertility and Longevity Smith, Mineau, Kerber, O’Brien, Cawthon
5
were born between 1850 and 1900. We further restricted the sample to those siblings who
survived to age 60, in an attempt to remove some of the variability in survival unrelated to
variation in the rate of aging that would have been present otherwise. Requiring that individuals
survive to age 60 also ensured that female fertility was complete.
The hypothesis is that long life in some families is in part attributable to genetic variants
that slow the rate of aging in both sexes via a mechanism that also facilitates late fertility in
women. Long life in other families, however, while associated with a relative lack of risk factors
for early death, does not involve slower rates of aging and therefore is less likely to be associated
with late fertility. The hypothesis predicts better survival of both sexes in sibships containing
late fertile women than in sibships containing women who were not fertile late. However, the
difference in survival between these groups is expected to be small at younger adult ages when
the majority of deaths are attributable to causes unrelated to aging and larger at older ages when
the primary factor determining the timing of death is the rate of aging itself. According to this
model, as sibships are selected for increasingly long-lived probands, the risk of death from
causes unrelated to rates of aging should decrease, the longevity observed in the remaining
siblings should increase, and (of greatest importance here) the benefit to survival to extreme ages
associated with having a late fertile sister versus not having one should also increase.
To test the above prediction, we examined survival of same-sex siblings from sibships
classified according to the longevity of the longest-lived opposite-sex sibling (the maximum age
at death, or MaxAAD, among opposite-sex siblings), and the age at last birth of the latest fertile
sister (the maximum age at last birth, or MaxALB, among sisters). The control sibships were
those below the 75th percentiles of the distributions for both MaxAAD and MaxALB. Survival
was assessed only in individuals who were married only once and lived to at least age 60, from

Late Fertility and Longevity Smith, Mineau, Kerber, O’Brien, Cawthon
6
sibships containing at least three sisters and three brothers who all met these requirements. The
absence of extreme longevity and/or late fertility in control sibships in spite of the presence of
multiple siblings in which these traits could appear increased the probability that the sibships
truly did not carry factors that contributed to these traits. Sibship categories, numbers of sibships
in the UPDB, and numbers of individuals contributing to the analysis of brothers’ survival are
given in Table 1; similar data for the sisters’ analysis are in Table 2.
Methods
Inclusion and Exclusion Criteria
Only individuals with known birth and death dates, or with a known birth date and confirmation
from the federal Health Care Financing Administration that the individual was alive in early
1997, were included in this study. Sibships with a MaxALB less than age 32 (the fifth percentile
of the full distribution of MaxALB) were excluded from the study, on the assumption that early
cessation of fertility of the latest fertile sister was likely the result of disease or adverse
environmental circumstances and less likely the consequence of factors related to rates of aging
per se. To reduce the level of environmental risk factors for early death in men unrelated to rates
of aging, we restricted the brothers’ survival analysis to men affiliated with the LDS church (for
both the selected and control sibships); church affiliation has previously been shown to be
associated with increased life expectancy in men (but not in women).
Logistic Regression
Logistic regressions were used to derive Relative Risks (RRs) of extreme longevity
associated with MaxAAD and MaxALB, because the outcome measures are binary variables
(coded 1 or 0) that indicate that an individual, who must have reached his or her 60th birthday,

Late Fertility and Longevity Smith, Mineau, Kerber, O’Brien, Cawthon
7
either lived beyond selected extreme ages or died at a younger age. The threshold for extreme
longevity varied across analyses: living to the 85th, 90th, and 95th sex-specific percentile for age
at death. The definition of non-extreme longevity was always the same: not living to the 75th
sex-specific percentile for age at death. The primary covariates are dummy variables (again
coded 1 or 0) that measured whether an individual was in one of several categories of sibships
defined by various combinations of MaxAAD and MaxALB (Hosmer and Lemeshow 1999).
In a model that predicts, for example, the probability of living to the 95th percentile,
denoted as Y>95, versus the probability of not living past the 75th percentile, denoted as Y<75, a
logistic regression was estimated with the following form:
loge(Y>95/ Y<75) = α + {β1 x (MaxAAD+ and MaxALB+)} +
{β2 x (MaxAAD+ and MaxALB-)} +
{β3 x (MaxAAD- and MaxALB+)}.
The terms MaxAAD and MaxALB were flagged with ‘+’ or ‘-’ to denote whether or not an
individual had a long-lived opposite-sex sibling and whether or not they had a late fertile sister.
Three dummy variables were constructed for each of three pairs of MaxAAD and MaxALB
conditions (i.e., {++}, {+-}, {-+}) such that persons received a score of one if they satisfied both
MaxAAD and MaxALB conditions and a score of zero if they did not. The longevity of persons
comprising the three combinations of MaxAAD and MaxALB shown in this equation were
compared to the longevity of persons in a reference group of {MaxAAD- and MaxALB-}. The
terms α and βi (i=1,2,3) are the intercept and regression coefficients, respectively. The RR for
living to the 95th percentile for those in the {MaxAAD+ and MaxALB+} group, relative to the
reference group, was calculated by RR = exp(β1). Similarly, the RRs for the other two
comparisons were exp(β2) and exp(β3). For simplicity, the equation above does not show terms
Late Fertility and Longevity Smith, Mineau, Kerber, O’Brien, Cawthon
8
for covariates measuring birth year, affiliation with the LDS church, and sibship size although
these covariates were included in the estimated models.
Given that our analysis relies on a sample containing sets of brothers and sets of sisters,
extreme longevity among siblings will be correlated. This lack of independence of responses can
occur when unobservable genetic and/or environmental factors that are the same within sibships
are thought to create significant variability in longevity between sibships not accounted for by
observable factors (e.g., MaxALB, MaxAAD). To take into account unmeasured heterogeneity
between sibships, logistic regression models with unobservable normally-distributed random
effects were estimated (Davidian and Giltinian 1995). Our approach maximised an
approximation to the likelihood function integrated over the random effects; the integral was
based on an adaptive Gaussian quadrature approximation (Diggle, Liang et al. 1994). Results
based on models that incorporate random effects were quite similar (data not shown) to those
reported in Figures 2 and 3.
Sibship Size Effects
It was expected that individuals with many siblings would be more likely to live long than those
with fewer siblings, because of the significant social support that siblings may provide one
another. Social support provided by siblings may have been especially important at times when
government social programs were absent or not widely available (pre-1950s). The LDS church
also has not been a provider of extensive economic support, given its emphasis on personal
economic independence and self-sufficiency (Mangum and Blumell 1993).
Given this potential benefit of larger sibship sizes to sibling survival, and given that
selection for the maximum values of traits (in our case, MaxALB and/or MaxAAD) across
sibships tends by chance alone to select for larger sibships, one might expect to observe some
Late Fertility and Longevity Smith, Mineau, Kerber, O’Brien, Cawthon
9
association between late fertility in women and sibling longevity simply due to sibship size
effects. Therefore, we examined the effects that adjustments for sibship size might have on the
association between late fertility in women and survival of siblings to extreme ages.
Our requirement that each sibship have at least three once-married brothers and three
once-married sisters live to age 60 greatly limited the variation in sibship size in our sample.
Within this sample, we tested for associations between sibling survival and sibship size in
several configurations, differing in the way in which sibship size was determined, including
number of siblings ever born (all siblings, sisters only, or brothers only) and number who lived to
age 60 (all siblings, sisters only, or brothers only). We included sibship size as a covariate in our
logistic regression models in order to control statistically for its possible effects (either linear or
non-linear) on longevity. We also partitioned the sample into strata defined by sibship size and
tested whether the longevity benefits associated with the various longevity and fertility selections
changed when all sibships being compared had identical numbers of siblings. Sibship size was
never found to have a significant effect on extreme longevity.
Survival of siblings after age 60
Survival probabilities and mortality relative risks (RR) were estimated using Cox
proportional hazards regression. All RRs were adjusted for the potential confounding effects of
an individual’s year of birth, affiliation with the LDS church, and number of siblings, because
these variables are either known or suspected to be related to an individual’s own longevity, to
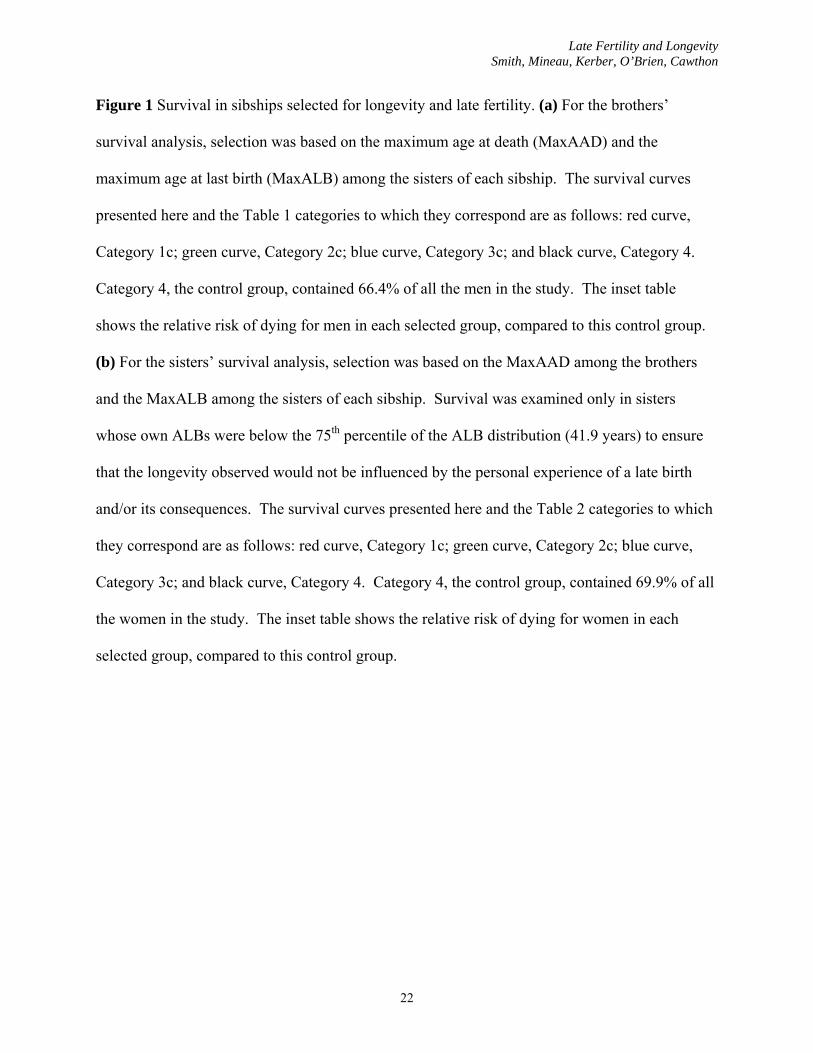
female fertility, and/or to overall longevity within a sibship. Figure 1a compares the survival of
men from four sibship categories. In sibships containing no sister who was fertile late, survival
after age 60 was significantly better for men who had a long-lived sister (green curve) than for

Late Fertility and Longevity Smith, Mineau, Kerber, O’Brien, Cawthon
10
men who had no long-lived sister (black curve). In sibships containing a long-lived sister,
survival after age 60 was significantly better for men who had a late fertile sister (red curve) than
for men who had no sister who was fertile late (green curve). The median male life expectancy
after 60 associated with having both a long-lived and a late fertile sister was 5.9 years higher
than that associated with having neither a long-lived nor a late fertile sister, and 3.9 years higher
than that associated with having a long-lived sister but no sister who was fertile late.
Figure 1b compares the survival of women from four sibship categories. In sibships
containing no sister who was fertile late, survival after age 60 was significantly better for women
who had a long-lived brother (green curve) than for women who had no long-lived brother (black
curve). In sibships containing a long-lived brother, survival after age 60 was significantly better
for women who had a late fertile sister (red curve) than for women who had no sister who was
fertile late (green curve). The median female life expectancy after 60 associated with having
both a long-lived brother and a late fertile sister was 9.8 years higher than that associated with
having neither a long-lived brother nor a late fertile sister, and 6.5 years higher than that
associated with having a long-lived brother but no sister who was fertile late.
Relative risks of siblings surviving to extreme ages
Estimates of relative risk (RR) of survival to various extreme ages were based on multivariate
maximum likelihood logistic regression techniques (see Methods). Adjustments for the same
confounders as those used in the survival analyses were also made here.
It is possible that some benefits to survival associated with having a long-lived opposite-
sex sibling and/or a late fertile sister arise by a social or environmental mechanism other than
those adjusted for above (birth year, church affiliation, sibship size). If this is correct, and if

Late Fertility and Longevity Smith, Mineau, Kerber, O’Brien, Cawthon
11
marriage partners tend to share environments, then spouses of siblings of long-lived and/or late
fertile individuals would be expected to live longer than spouses of individuals from sibships
without a long-lived or a late fertile individual. To test this, the same longevity thresholds and
covariates used in the logistic regression analysis to examine brothers’ and sisters’ longevity
were used to study spouses’ longevity. The spouse analysis was restricted to once-married
couples in which both spouses survived to age 60.
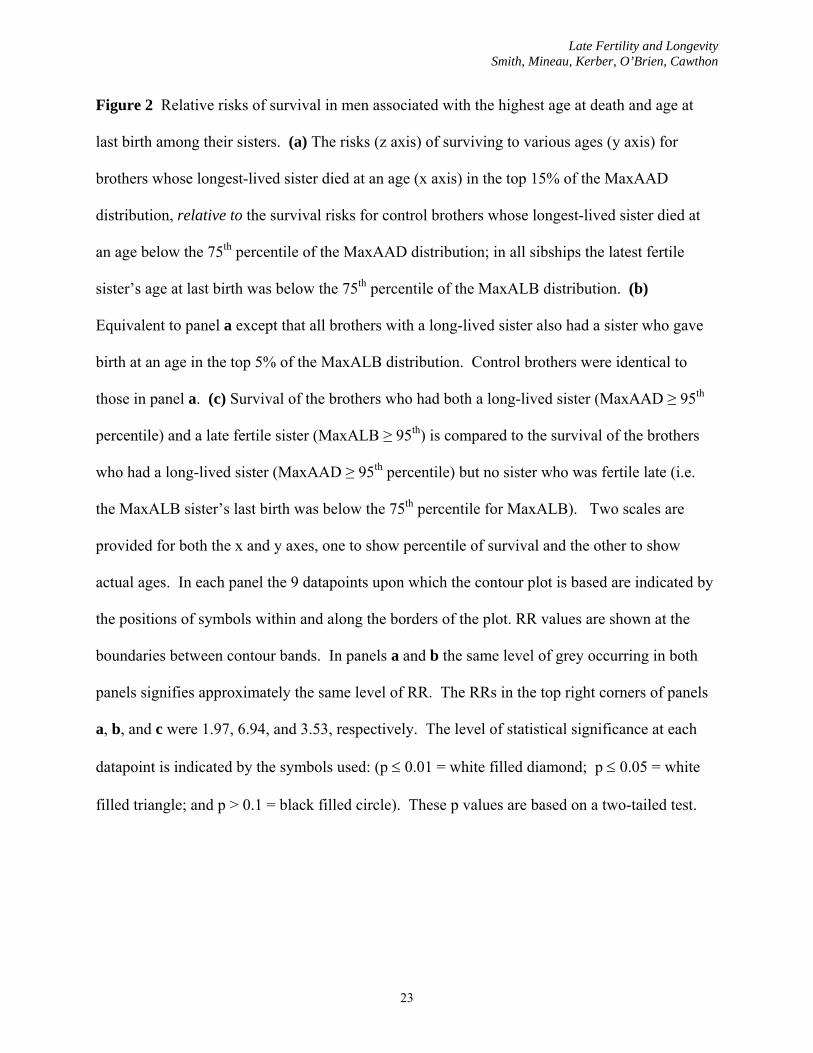
Figure 2 compares brothers’ survival in three categories of sibships: those containing a
long-lived sister and a late fertile sister (Category 1 in Table 1), those containing a long-lived
sister but no late fertile sister (Category 2 in Table 1), and those containing neither a long-lived
nor a late fertile sister (Category 4 in Table 1, the control group). Figure 2a shows that in
sibships containing no late fertile sister, the relative risks (z axis) of brothers surviving to various
ages (y axis) improved as the age at death of the longest-lived sister (x axis) increased (Category
2 vs. Category 4 sibships). Figure 2b shows that this association of brothers’ survival with the
longevity of the longest-lived sister was stronger in sibships containing a late fertile sister
(Category 1 vs. Category 4 sibships). Here, the RR for men attaining the 95th percentile of
survival reached 6.94. Figure 2c shows the significant benefit to men’s survival of having a late
fertile sister when all sibships in the analysis contain a long-lived sister (Category 1 vs. Category
2 sibships; p < 0.05 at the white filled triangles in 2c). Furthermore, survival risks generally
improved as the age at last birth of the latest fertile sister increased from the 85th to the 95th
percentile (data not shown).
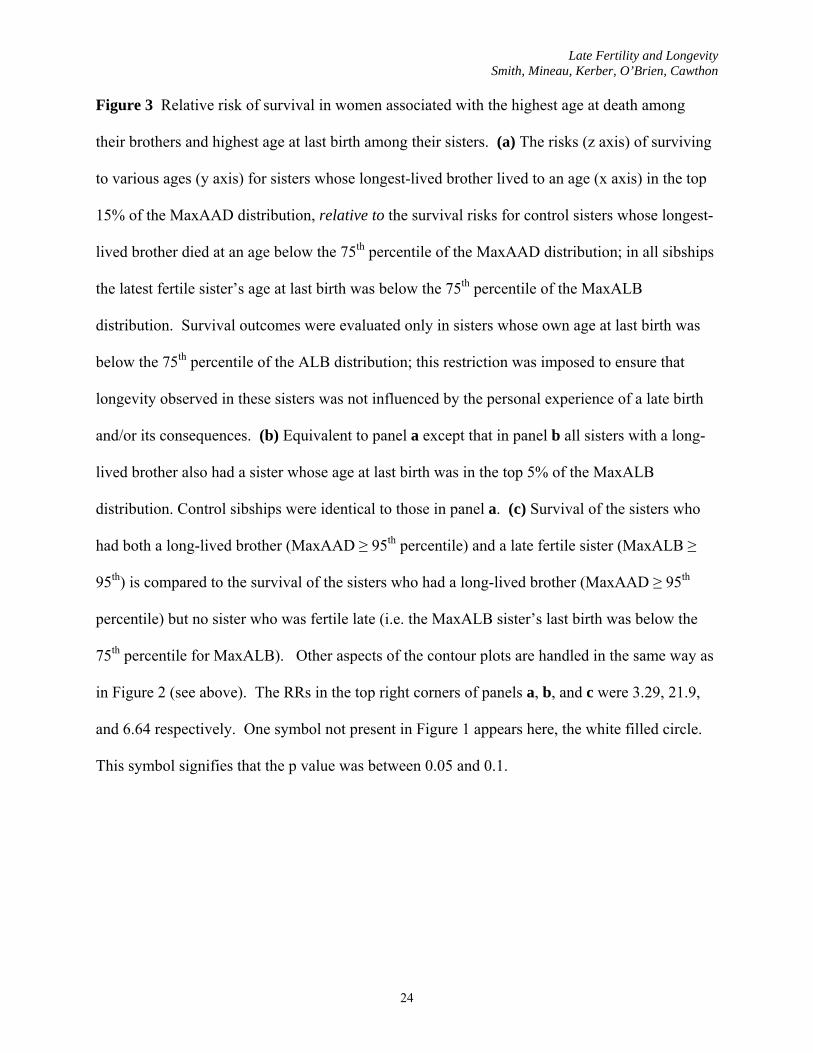
Figure 3 compares sisters’ survival in three categories of sibships: those containing a
long-lived brother and a late fertile sister (Category 1 in Table 2), those containing a long-lived
brother but no late fertile sister (Category 2 in Table 2), and those containing neither a long-lived
Late Fertility and Longevity Smith, Mineau, Kerber, O’Brien, Cawthon
12
brother nor a late fertile sister (Category 4 in Table 2, the control group). Figure 3a shows that in
sibships containing no late fertile sister, the relative risks (z axis) of sisters surviving to various
ages (y axis) improved as the age at death of the longest-lived brother (x axis) increased
(Category 2 vs. Category 4 sibships). Figure 3b shows that this association of sisters’ survival
with the longevity of the longest-lived brother was stronger in sibships containing a late fertile
sister (Category 1 vs. Category 4 sibships). Here, the RR for women attaining the 95th percentile
of survival reached 21.9. Figure 3c shows the significant benefit to women’s survival of having
a late fertile sister when all sibships in the analysis contain a long-lived brother (Category 1 vs.
Category 2 sibships; p < 0.05 at the white filled triangle, and 0.05 < p < 0.1 at the white filled
circle in 3c). Furthermore, survival risks generally improved as the age at last birth of the latest
fertile sister increased from the 85th to the 95th percentile (data not shown).
In contrast, no significant differences in the survival of wives were associated with their
husbands having (or not having) a long-lived sister and/or a late fertile sister, and no significant
differences in the survival of husbands were associated with their wives having (or not having) a
long-lived brother and/or a late fertile sister (data not shown). Furthermore, while the sibling
survival benefits associated with longevity and late fertility that are presented here have been
adjusted for the effects of birth year, affiliation with the LDS church, and sibship size, these
benefits were not substantively different even in the absence of these adjustments.
A frequently discussed evolutionary theory argues that there should be a trade-off
between reproductive success and longevity (e.g., ref. 19): slower rates of aging should be
associated with lower fertility and longer life. Indeed, a recent study found that lower parity
(bearing fewer children) was associated with significantly longer life in women (Westendorp and
Late Fertility and Longevity Smith, Mineau, Kerber, O’Brien, Cawthon
13
Kirkwood 1998). Therefore, we tested whether the already elevated relative risks of long life
associated with having a long-lived opposite-sex sibling and a late fertile sister (MaxALB in the
top 15% of the distribution of MaxALB) could be further increased by removing the 25% of
sibships in which the MaxALB sisters’ parities were the highest (12 or more children born per
sister). No significant changes in survival risks were observed (data not shown). These results
do not mean that there is no trade-off between reproductive success and longevity in humans;
further investigation of this question is needed. However, these results do suggest that sibships
selected for longevity, late fertility, and low parity are no more likely to carry genes that slow
aging than sibships selected simply for longevity and late fertility.
Discussion
The observation that late fertile sisters are associated with increased risks of sibling survival to
extremely old ages supports the hypothesis that there are genetic variants in the population that
slow aging by a mechanism that facilitates late fertility in women and contributes to longevity in
both sexes. The results also suggest that among sibships with equally long-lived individuals, the
sibships with late fertile sisters are more likely to carry genes that slow aging. Furthermore,
because longevity associated with late fertility is a more specific phenotype than longevity per
se, the genetic heterogeneity underlying this dual phenotype is likely to be less. Therefore,
genetic linkage analyses of longevity may be more powerful in families with late fertile women
than in families with no late fertile women. It may also be useful to substitute or supplement
phenotyping for late fertility with phenotyping for late menopause, if it can be established that
late menopause is associated with increased sibling survival to extreme ages.
There was only a small increase in sibling survival associated with selection on late
fertility in the absence of a long-lived opposite-sex sibling (Figure 1, blue survival curves). This
Late Fertility and Longevity Smith, Mineau, Kerber, O’Brien, Cawthon
14
may suggest that only some late fertility involves slower aging. However, such modest survival
benefits may be expected even in the presence of slower rates of aging, since selection only for
late female fertility in sibships does little to reduce the frequency of major risk factors (some
genetic, some non-genetic) for common diseases (e.g. heart disease, cancer, stroke) that can
threaten life in late middle and early old age. To begin to assess what proportion of late fertile
women are truly aging slowly, in women exceeding various thresholds for lateness of fertility,
additional indicators of slow aging other than longevity will need to be measured.
It may be feasible, therefore, to map genes that slow aging even without long-lived
research subjects, if heritable quantitative traits that are as good or better indicators of slow rates
of aging can be measured in middle-aged individuals. Late fertility, late menopause, and
continuing menstruation at an age that guarantees a late menopause are reasonable candidate
traits. Among middle-aged menstruating women approaching the average age at natural
menopause (50-51 years), those maintaining relatively high fertility may be distinguishable by
serum Follicle- Stimulating Hormone (FSH) and Luteinizing Hormone (LH) levels that are lower
than expected for the women’s ages (Ahmed Ebbiary, Lenton et al. 1994). Even among young
fertile women it may be possible to identify those destined for a late menopause (and possibly
late fertility) as those with menstrual cycle lengths at the high end of the normal range (Whelan,
Sandler et al. 1990). Furthermore, any largely heritable trait that predicts lower age-specific
mortality rates from multiple causes in longitudinal studies may be a marker for genetically-
determined slow aging. Examples are low peripheral blood leukocyte count (Grimm, Neaton et
al. 1985; Whitfield and Martin 1985; de_Labry, Campion et al. 1990; Weiss, Segal et al. 1995;
Weijenberg, Feskens et al. 1996), low resting heart rate (Dyer, Persky et al. 1980; Hanson, Tuna
et al. 1989; Wannamethee, Shaper et al. 1993; Mensink and Hoffmeister 1997; Greenland,
Late Fertility and Longevity Smith, Mineau, Kerber, O’Brien, Cawthon
15
Daviglus et al. 1999), and high percent-predicted forced expiratory volume in one second (Bang,
Gergen et al. 1993; McClearn, Svartengren et al. 1994; Rodriguez, Masaki et al. 1994; Weiss,
Segal et al. 1995; Hole, Watt et al. 1996; Emery, Pedersen et al. 1998). Low resting body
temperature may be another such trait (Lane, Baer et al. 1996). In middle-aged sibships initially
identified based on a late birth, one or more of the above traits could be measured in the proband
and her siblings; the families in which these phenotypes are clustering at higher than chance rates
may be those most suitable for genetic linkage efforts to identify genes that slow aging.
Social factors as well as the hypothesised genetic factors may play a role in explaining
the association between longevity and late fertility. It is possible, for example, that an individual
whose sister has children late in life will have a lower risk of death at extreme ages because of
social benefits conferred by the presence of younger adult kin. An individual who has long-lived
siblings may also expect to have above average longevity because of the support such siblings
might provide late in life. Our analysis of spouse longevity suggests that social variables
contribute less than genetic factors to the familial patterns of longevity we have observed.
However, it is clear that biological relatives sometimes share social factors more than non-
biological relatives, and it is not possible to definitively distinguish social and genetic
transmission of longevity in these data. Nevertheless, the results presented here should
encourage researchers to proceed with genetic analyses of slower aging and longevity in humans.
References
Ahmed Ebbiary, N. A., E. A. Lenton and I. D. Cooke (1994). "Hypothalamic-pituitary ageing: progressive increase in FSH and LH concentrations throughout the reproductive life in regularly menstruating women." Clin Endocrinol (Oxf) 41(2): 199-206.
Austad, S. (1993). "Retarded senescence in an Insular Population of Virginia Opossums (Didelphis virginianal)." Journal of Zoology 229: 695-708.
Bang, K. M., P. J. Gergen, R. Kramer and B. Cohen (1993). "The effect of pulmonary impairment on all-cause mortality in a national cohort." Chest 103(2): 536-40.
Bocquet-Appel, J. (1990). "Familial Transmission of Longevity." Annals of Human Biology 17(2): 81-95.

Late Fertility and Longevity Smith, Mineau, Kerber, O’Brien, Cawthon
16
Cooper, G. S. and D. P. Sandler (1998). "Age at natural menopause and mortality." Annals of Epidemiology 8(4): 229-35.
Davidian, M. and D. Giltinian (1995). Nonlinear Models for Repeated Measurement Data. New York, Chapman & Hall.
de_Labry, L. O., E. W. Campion, R. J. Glynn and P. S. Vokonas (1990). "White blood cell count as a predictor of mortality: results over 18 years from the Normative Aging Study." Journal of Clinical Epidemiology 43(2): 153-7.
Diggle, P., K. Liang and S. Zeger (1994). Analysis of Longitiudinal Data. Oxford, Clarendon Press.
Dyer, A. R., V. Persky, J. Stamler, O. Paul, R. B. Shekelle, D. M. Berkson, M. Lepper, J. A. Schoenberger and H. A. Lindberg (1980). "Heart rate as a prognostic factor for coronary heart disease and mortality: findings in three Chicago epidemiologic studies." Am J Epidemiol 112(6): 736-49.
Emery, C. F., N. L. Pedersen, M. Svartengren and G. E. McClearn (1998). "Longitudinal and genetic effects in the relationship between pulmonary function and cognitive performance." J Gerontol B Psychol Sci Soc Sci 53(5): P311-7.
Finch, C. E. (1990). Longevity, senescence, and the genome. Chicago, University of Chicago Press.
Greenland, P., M. L. Daviglus, A. R. Dyer, K. Liu, C. F. Huang, J. J. Goldberger and J. Stamler (1999). "Resting heart rate is a risk factor for cardiovascular and noncardiovascular mortality: the Chicago Heart Association Detection Project in Industry." American Journal of Epidemiology 149(9): 853-62.
Grimm, R. H., J. D. Neaton and W. Ludwig (1985). "Prognostic importance of the white blood cell count for coronary, cancer, and all-cause mortality." Jama 254(14): 1932-7.
Hanson, B., N. Tuna, T. Bouchard, L. Heston, E. Eckert, D. Lykken, N. Segal and S. Rich (1989). "Genetic factors in the electrocardiogram and heart rate of twins reared apart and together." Am J Cardiol 63(9): 606-9.
Hole, D. J., G. C. Watt, G. Davey-Smith, C. L. Hart, C. R. Gillis and V. M. Hawthorne (1996). "Impaired lung function and mortality risk in men and women: findings from the Renfrew and Paisley prospective population study." Bmj 313(7059): 711-5; discussion 715-6.
Hosmer, D. W. and S. Lemeshow (1999). "Applied Survival Analysis: Regression Modeling of Time to Event Data."
Jazwinski, S. M. (1998). "Genetics of longevity." Experimental Gerontology 33(7-8): 773-83. Kerber, R. A., E. O'Brien, K. R. Smith and R. M. Cawthon (2001). "Familial excess longevity in
Utah genealogies." J Gerontol A Biol Sci Med Sci 56(3): B130-9. Lane, M. A., D. J. Baer, W. V. Rumpler, R. Weindruch, D. K. Ingram, E. M. Tilmont, R. G.
Cutler and G. S. Roth (1996). "Calorie restriction lowers body temperature in rhesus monkeys, consistent with a postulated anti-aging mechanism in rodents." Proc Natl Acad Sci U S A 93(9): 4159-64.
Luckinbill, L. S. and M. J. Clare (1987). "Successful selection for increased longevity in Drosophila: analysis of the survival data and presentation of a hypothesis on the genetic regulation of longevity." Exp Gerontol 22(3): 221-6.
Mangum, G. and B. Blumell (1993). The Mormons' War on Poverty: A History of LDS Welfare. Salt Lake City, University of Utah Press.
McClearn, G. E., M. Svartengren, N. L. Pedersen, D. A. Heller and R. Plomin (1994). "Genetic

Late Fertility and Longevity Smith, Mineau, Kerber, O’Brien, Cawthon
17
and environmental influences on pulmonary function in aging Swedish twins." J Gerontol 49(6): 264-8.
McGue, M., J. Vaupel, N. Holm and B. Harvald (1993). "Longevity is moderately heritable in a sample of Danish twins born 1870-1880." J Gerontol 48: B237-B234.
Mensink, G. B. and H. Hoffmeister (1997). "The relationship between resting heart rate and all-cause, cardiovascular and cancer mortality." Eur Heart J 18(9): 1404-10.
Nagai, J., C. Y. Lin and M. P. Sabour (1995). "Lines of mice selected for reproductive longevity." Growth Dev Aging 59(3): 79-91.
Packer, C., M. Tatar and A. Collins (1998). "Reproductive cessation in female mammals." Nature 392(6678): 807-11.
Partridge, L., N. Prowse and P. Pignatelli (1999). "Another set of responses and correlated responses to selection on age at reproduction in Drosophila melanogaster." Proc Biol Sci 266(1416): 255-61.
Perls, T., L. Alpert and R. Fretts (1997). "Middle-aged mothers live longer." Nature (Letter) 389(6654): 922.
Perls, T. T., E. Bubrick, C. G. Wager, J. Vijg and L. Kruglyak (1998). "Siblings of centenarians live longer." Lancet 351(9115): 1560.
Rodriguez, B. L., K. Masaki, C. Burchfiel, J. D. Curb, K. O. Fong, P. H. Chyou and E. B. Marcus (1994). "Pulmonary function decline and 17-year total mortality: the Honolulu Heart Program." Am J Epidemiol 140(5): 398-408.
Rose, M. R. and B. Charlesworth (1981). "Genetics of life history in Drosophila melanogaster. II. Exploratory selection experiments." Genetics 97(1): 187-96.
Rose, M. R., T. J. Nusbaum and J. E. Fleming (1992). "Drosophila with postponed aging as a model for aging research." Lab Anim Sci 42(2): 114-8.
Smith, K. R., G. P. Mineau and L. L. Bean (2002). "Fertility and post-reproductive longevity." Social Biology 49(3-4): 185-205.
Snieder, H., A. J. MacGregor and T. D. Spector (1998). "Genes control the cessation of a woman's reproductive life: a twin study of hysterectomy and age at menopause." J Clin Endocrinol Metab 83(6): 1875-80.
Snowdon, D., R. Kane, W. Beeson, G. Burke, J. Sprafka, J. Potter, H. Iso, D. J. Jacobs and R. Phillips (1989). "Is early natural menopause a biologic marker of health and aging?" Am J Public Health 79(6): 709-714.
Torgerson, D. J., R. E. Thomas and D. M. Reid (1997). "Mothers and daughters menopausal ages: is there a link?" Eur J Obstet Gynecol Reprod Biol 74(1): 63-6.
Vaupel, J. W., J. R. Carey, K. Christensen, T. E. Johnson, A. I. Yashin, N. V. Holm, I. A. Iachine, V. Kannisto, A. A. Khazaeli, P. Liedo, V. D. Longo, Y. Zeng, K. G. Manton and J. W. Curtsinger (1998). "Biodemographic trajectories of longevity." Science 280(5365): 855-60.
Wannamethee, G., A. G. Shaper and P. W. Macfarlane (1993). "Heart rate, physical activity, and mortality from cancer and other noncardiovascular diseases." American Journal of Epidemiology 137(7): 735-48.
Weijenberg, M. P., E. J. Feskens and D. Kromhout (1996). "White blood cell count and the risk of coronary heart disease and all- cause mortality in elderly men." Arterioscler Thromb Vasc Biol 16(4): 499-503.
Weiss, S. T., M. R. Segal, D. Sparrow and C. Wager (1995). "Relation of FEV1 and peripheral blood leukocyte count to total mortality. The Normative Aging Study." American Journal

Late Fertility and Longevity Smith, Mineau, Kerber, O’Brien, Cawthon
18
of Epidemiology 142(5): 493-8; discussion 499-503. Westendorp, R. G. and T. B. Kirkwood (1998). "Human longevity at the cost of reproductive
success." Nature 396(6713): 743-6. Whelan, E. A., D. P. Sandler, D. R. McConnaughey and C. R. Weinberg (1990). "Menstrual and
reproductive characteristics and age at natural menopause." Am J Epidemiol 131(4): 625-32.
Whitfield, J. B. and N. G. Martin (1985). "Genetic and environmental influences on the size and number of cells in the blood." Genetic Epidemiology 2(2): 133-44.
Late Fertility and Longevity Smith, Mineau, Kerber, O’Brien, Cawthon
19
Acknowledgements
We thank Drs. Sandra Hasstedt and Mark Leppert for helpful discussions. We thank the
Huntsman Cancer Institute for Utah Population Database support. This work was funded by the
AlliedSignal Award for Research on Aging (to R.M.C.), by National Institutes of Health /
National Institute on Aging grants (to K.R.S. and R.M.C.), and by a National Institutes of Health
National Cancer Institute grant (to R.A.K.).
Correspondence and requests for materials should be addressed to [email protected]

Late Fertility and Longevity Smith, Mineau, Kerber, O’Brien, Cawthon
20
By definition, the longest-lived sister in a sibship was “long-lived” if her age at death (AAD) was in the top
15% of the distribution of AAD for longest-lived sisters (MaxAAD), and not long-lived if her AAD was
below the 75th percentile of MaxAAD. The latest fertile sister in a sibship was “late fertile” if her age at
last birth (ALB) was in the top 15% of the distribution of ALB for latest fertile sisters (MaxALB) and not
late fertile if her ALB was below the 75th percentile of MaxALB. These definitions placed all sibships
examined into one of four categories based on the presence or absence of a long-lived and/or a late fertile
sister (Column 1). Additional subsets of sibships (Columns 2 and 3) were identified, also based on the
MaxAAD and MaxALB among the sisters in each sibship. Column 5 gives the number of married-once
brothers who survived to at least 60, and Column 6 gives the number who were affiliated with the LDS
church, upon whom the survival analysis was based. Actual numbers of brothers surviving to various ages
are provided in Columns 7-10, but to derive the relative risks of survival presented in Figure 2, adjustments
were made for the effects on survival of birth year, church affiliation, and sibship size.
_______________________________________________________________________________________________________
Table 1 Sibships and individuals contributing to the analysis of brothers’ survival
Number of Brothers Surviving to the followingPercentiles of the Age at Death Distribution:
Sibship Categories
Longest-Lived Sister’s AAD as
Percentile of the MaxAAD Distribution
Latest Fertile Sister’s ALB as
Percentile of the MaxALB Distribution
Numberof
Sibships
Number of
Brothers
Number of LDSBrothers
<75th percentile
(83 yr)
≥ 85th percentile
(87 yr)
≥ 90th percentile
(89 yr)
≥ 95th percentile
(93 yr) 1. (+) Long-lived Sister (+)Late Fertile Sister
a. ≥ 85th (95 yr) ≥ 95th (46.4 yr) 39 131 89 59 30 27 11 b. ≥ 90th (96 yr) ≥ 95th (46.4 yr) 32 105 71 46 25 23 9 c. ≥ 95th (98 yr) ≥ 95th (46.4 yr) 18 58 40 24 16 16 7
2. (+) Long-lived Sister (-)Late Fertile Sister
a. ≥ 85th (95 yr) < 75th (43.9 yr) 386 1243 790 549 241 185 75 b. ≥ 90th (96 yr) < 75th (43.9 yr) 282 913 590 409 181 140 56 c. ≥ 95th (98 yr) < 75th (43.9 yr) 150 486 317 220 97 75 30
3. (-) Long-lived Sister (+)Late Fertile Sister
a. < 75th (93 yr) ≥ 85th (44.9 yr) 294 978 623 491 132 85 30 b. < 75th (93 yr) ≥ 90th (45.5 yr) 193 637 403 309 94 62 26 c. < 75th (93 yr) ≥ 95th (46.4 yr) 101 323 188 145 43 28 12
4. (-) Long-lived Sister (-)Late Fertile Sister < 75th (93 yr) < 75th (43.9 yr) 1633 5340 3248 2613 635 449 175

Late Fertility and Longevity Smith, Mineau, Kerber, O’Brien, Cawthon
21
_______________________________________________________________________________________________________
Table 2 Sibships and individuals contributing to the analysis of sisters’ survival
Number of Sisters Surviving to the followingPercentiles of the Age at Death Distribution:
Sibship Categories
Longest-Lived Brother’s AAD as Percentile of the MaxAAD Distribution
Latest FertileSister’s ALB
as Percentile ofthe MaxALB Distribution
Numberof
Sibships
Number of
Sisters
Number ofSisters
below 75th
Percentileof ALB
<75th percentile
(87 yr)
≥ 85th percentile
(90 yr)
≥ 90th percentile
(92 yr)
≥ 95th percentile
(95 yr) 1. (+)Long-lived Brother (+)Late Fertile Sister
a. ≥ 85th (92 yr) ≥ 95th (46.4 yr) 42 132 41 27 14 10 6 b. ≥ 90th (94 yr) ≥ 95th (46.4 yr) 26 78 25 16 9 6 5 c. ≥ 95th (96 yr) ≥ 95th (46.4 yr) 11 35 10 6 4 4 3
2. (+)Long-lived Brother (-)Late Fertile Sister
a. ≥ 85th (92 yr) < 75th (43.9 yr) 399 1296 623 455 168 113 60 b. ≥ 90th (94 yr) < 75th (43.9 yr) 236 759 360 260 100 75 41 c. ≥ 95th (96 yr) < 75th (43.9 yr) 117 374 177 122 55 44 24
3. (-) Long-lived Brother (+)Late Fertile Sister
a. < 75th (90 yr) ≥ 85th (44.9 yr) 288 1046 321 264 57 39 18 b. < 75th (90 yr) ≥ 90th (45.5 yr) 186 678 207 173 34 25 11 c. < 75th (90 yr) ≥ 95th (46.4 yr) 99 366 112 97 15 12 4
4. (-) Long-lived Brother (-)Late Fertile Sister < 75th (90 yr) < 75th (43.9 yr) 1585 5300 2474 2056 418 247 118
By definition, the longest-lived brother in a sibship was “long-lived” if his age at death (AAD) was in the top
15% of the distribution of AAD for longest-lived brothers (MaxAAD), and not long-lived if his AAD was
below the 75th percentile of MaxAAD. “Late fertile” and not late fertile sisters were defined as in Table 1.
These definitions placed all sibships examined in one of four categories based on the presence or absence of a
long-lived brother and/or a late fertile sister (Column 1). Additional subsets of sibships (Columns 2 and 3)
were identified, also based on the MaxAAD among brothers and the MaxALB among sisters. Column 5 gives
the total number of married-once sisters who survived to at least 60. Column 6 gives the numbers for the
subset of sisters whose own ALBs were below the 75th percentile of the ALB distribution (41.9 years);
survival outcomes were evaluated only in these women to ensure that any increased risk of longevity observed
in them could not be due to the personal experience of a late birth and/or its consequences. The purpose of this
table is primarily to show sample sizes; actual numbers of sisters surviving to various ages are provided in
Columns 7-10, but to derive the relative risks of survival presented in Figure 3, adjustments were made for the
effects on survival of birth year, church affiliation, and sibship size.
Late Fertility and Longevity Smith, Mineau, Kerber, O’Brien, Cawthon
22
Figure 1 Survival in sibships selected for longevity and late fertility. (a) For the brothers’
survival analysis, selection was based on the maximum age at death (MaxAAD) and the
maximum age at last birth (MaxALB) among the sisters of each sibship. The survival curves
presented here and the Table 1 categories to which they correspond are as follows: red curve,
Category 1c; green curve, Category 2c; blue curve, Category 3c; and black curve, Category 4.
Category 4, the control group, contained 66.4% of all the men in the study. The inset table
shows the relative risk of dying for men in each selected group, compared to this control group.
(b) For the sisters’ survival analysis, selection was based on the MaxAAD among the brothers
and the MaxALB among the sisters of each sibship. Survival was examined only in sisters
whose own ALBs were below the 75th percentile of the ALB distribution (41.9 years) to ensure
that the longevity observed would not be influenced by the personal experience of a late birth
and/or its consequences. The survival curves presented here and the Table 2 categories to which
they correspond are as follows: red curve, Category 1c; green curve, Category 2c; blue curve,
Category 3c; and black curve, Category 4. Category 4, the control group, contained 69.9% of all
the women in the study. The inset table shows the relative risk of dying for women in each
selected group, compared to this control group.
Late Fertility and Longevity Smith, Mineau, Kerber, O’Brien, Cawthon
23
Figure 2 Relative risks of survival in men associated with the highest age at death and age at
last birth among their sisters. (a) The risks (z axis) of surviving to various ages (y axis) for
brothers whose longest-lived sister died at an age (x axis) in the top 15% of the MaxAAD
distribution, relative to the survival risks for control brothers whose longest-lived sister died at
an age below the 75th percentile of the MaxAAD distribution; in all sibships the latest fertile
sister’s age at last birth was below the 75th percentile of the MaxALB distribution. (b)
Equivalent to panel a except that all brothers with a long-lived sister also had a sister who gave
birth at an age in the top 5% of the MaxALB distribution. Control brothers were identical to
those in panel a. (c) Survival of the brothers who had both a long-lived sister (MaxAAD ≥ 95th
percentile) and a late fertile sister (MaxALB ≥ 95th) is compared to the survival of the brothers
who had a long-lived sister (MaxAAD ≥ 95th percentile) but no sister who was fertile late (i.e.
the MaxALB sister’s last birth was below the 75th percentile for MaxALB). Two scales are
provided for both the x and y axes, one to show percentile of survival and the other to show
actual ages. In each panel the 9 datapoints upon which the contour plot is based are indicated by
the positions of symbols within and along the borders of the plot. RR values are shown at the
boundaries between contour bands. In panels a and b the same level of grey occurring in both
panels signifies approximately the same level of RR. The RRs in the top right corners of panels
a, b, and c were 1.97, 6.94, and 3.53, respectively. The level of statistical significance at each
datapoint is indicated by the symbols used: (p ≤ 0.01 = white filled diamond; p ≤ 0.05 = white
filled triangle; and p > 0.1 = black filled circle). These p values are based on a two-tailed test.
Late Fertility and Longevity Smith, Mineau, Kerber, O’Brien, Cawthon
24
Figure 3 Relative risk of survival in women associated with the highest age at death among
their brothers and highest age at last birth among their sisters. (a) The risks (z axis) of surviving
to various ages (y axis) for sisters whose longest-lived brother lived to an age (x axis) in the top
15% of the MaxAAD distribution, relative to the survival risks for control sisters whose longest-
lived brother died at an age below the 75th percentile of the MaxAAD distribution; in all sibships
the latest fertile sister’s age at last birth was below the 75th percentile of the MaxALB
distribution. Survival outcomes were evaluated only in sisters whose own age at last birth was
below the 75th percentile of the ALB distribution; this restriction was imposed to ensure that
longevity observed in these sisters was not influenced by the personal experience of a late birth
and/or its consequences. (b) Equivalent to panel a except that in panel b all sisters with a long-
lived brother also had a sister whose age at last birth was in the top 5% of the MaxALB
distribution. Control sibships were identical to those in panel a. (c) Survival of the sisters who
had both a long-lived brother (MaxAAD ≥ 95th percentile) and a late fertile sister (MaxALB ≥
95th) is compared to the survival of the sisters who had a long-lived brother (MaxAAD ≥ 95th
percentile) but no sister who was fertile late (i.e. the MaxALB sister’s last birth was below the
75th percentile for MaxALB). Other aspects of the contour plots are handled in the same way as
in Figure 2 (see above). The RRs in the top right corners of panels a, b, and c were 3.29, 21.9,
and 6.64 respectively. One symbol not present in Figure 1 appears here, the white filled circle.
This symbol signifies that the p value was between 0.05 and 0.1.

a
b
Frac
tion
aliv
eFr
actio
n al
ive
HighMaxAAD
HighMaxALB
Mortality RR(95% CI)
+ + 0.53 (0.34, 0.83)+ - 0.79 (0.71, 0.88)- + 0.90 (0.79, 1.03)- - 1.00 (reference)
HighMaxAAD
HighMaxALB
Mortality RR(95% CI)
+ + 0.35 (0.19, 0.65)+ - 0.69 (0.60, 0.80)- + 0.95 (0.79, 1.15)- - 1.00 (reference)
Men
Women
Age

85 90 9585
90
Perc
entil
e of
Sur
viva
l of B
roth
ers
Age
at D
eath
of B
roth
ers
9593
87
89
85 90 95Percentile of Survival of Longest-lived Sister
85
90
Perc
entil
e of
Sur
viva
l of B
roth
ers
Age
at D
eath
of B
roth
ers
95
Age at Death of Longest- lived Sister
95 96 98
93
87
89
b
c
Percentile of Survival of Longest-lived Sister
Percentile of Survival of Longest-lived Sister
a
85 90 9585
90
Perc
entil
e of
Sur
viva
l of B
roth
ers
Age
at D
eath
of B
roth
ers
9593
87
89

b
c
Percentile of Survival of Longest-lived Brother
Percentile of Survival of Longest-lived Brother
Percentile of Survival of Longest-lived Brother85 90 95
85
90
95
Age at Death of Longest-lived Brother
969492
Perc
entil
e of
Sur
viva
l of S
iste
rs
90
92
95
Age
at D
eath
of S
iste
rs
85 90 95
85
90
95
Perc
entil
e of
Sur
viva
l of S
iste
rs
90
92
95
Age
at D
eath
of S
iste
rs
a
85 90 9585
90
Perc
entil
e of
Sur
viva
l of S
iste
rs
90
92
95
Age
at D
eath
of S
iste
rs
95
Copyright © 2022 FDOKUMEN