Altered lacunar and vascular porosity in osteogenesis imperfecta mouse bone as revealed by...
10
This article appeared in a journal published by Elsevier. The attached copy is furnished to the author for internal non-commercial research and education use, including for instruction at the authors institution and sharing with colleagues. Other uses, including reproduction and distribution, or selling or licensing copies, or posting to personal, institutional or third party websites are prohibited. In most cases authors are permitted to post their version of the article (e.g. in Word or Tex form) to their personal website or institutional repository. Authors requiring further information regarding Elsevier’s archiving and manuscript policies are encouraged to visit: http://www.elsevier.com/authorsrights
-
Upload
ccny1-cuny -
Category
Documents
-
view
3 -
download
0
Transcript of Altered lacunar and vascular porosity in osteogenesis imperfecta mouse bone as revealed by...
This article appeared in a journal published by Elsevier. The attachedcopy is furnished to the author for internal non-commercial researchand education use, including for instruction at the authors institution
and sharing with colleagues.
Other uses, including reproduction and distribution, or selling orlicensing copies, or posting to personal, institutional or third party
websites are prohibited.
In most cases authors are permitted to post their version of thearticle (e.g. in Word or Tex form) to their personal website orinstitutional repository. Authors requiring further information
regarding Elsevier’s archiving and manuscript policies areencouraged to visit:
http://www.elsevier.com/authorsrights
Author's personal copy
Original Full Length Article
Altered lacunar and vascular porosity in osteogenesis imperfecta mousebone as revealed by synchrotron tomography contributes tobone fragility
A. Carriero a,b,⁎, M. Doube a,1, M. Vogt a, B. Busse c, J. Zustin d, A. Levchuk b, P. Schneider b,R. Müller b, S.J. Shefelbine a,2
a Department of Bioengineering, Imperial College London, UKb Institute for Biomechanics, ETH Zürich, Switzerlandc Department of Osteology and Biomechanics, University Medical Center Hamburg-Eppendorf, Germanyd Institute of Pathology, University Medical Center Hamburg-Eppendorf, Germany
a b s t r a c ta r t i c l e i n f o
Article history:Received 2 August 2013Revised 25 November 2013Accepted 17 December 2013Available online 27 December 2013
Edited by: Sharmila Majumdar
Keywords:Osteogenesis imperfectaOimBonePorosityCanalOsteocyte lacunae
Osteogenesis imperfecta (brittle bone disease) is caused bymutations in the collagen genes and results in skeletalfragility. Changes in bone porosity at the tissue level indicate changes in bone metabolism and alter bonemechanical integrity. We investigated the cortical bone tissue porosity of a mouse model of the disease, oim, incomparison to a wild type (WT-C57BL/6), and examined the influence of canal architecture on bone mechanicalperformance.High-resolution 3D representations of the posterior tibial and the lateral humeral mid-diaphysis of the boneswere acquired for both mouse groups using synchrotron radiation-based computed tomography at a nominalresolution of 700 nm. Volumetric morphometric indices were determined for cortical bone, canal network andosteocyte lacunae. The influence of canal porosity architecture on bone mechanics was investigated usingmicroarchitectural finite element (μFE) models of the cortical bone. Bright-field microscopy of stained sectionswas used to determine if canals were vascular.Although total cortical porosity was comparable between oim andWT bone, oim bone had more numerous andmore branched canals (p b 0.001), and more osteocyte lacunae per unit volume compared to WT (p b 0.001).Lacunae in oim were more spherical in shape compared to the ellipsoidal WT lacunae (p b 0.001). Histologyrevealed blood vessels in all WT and oim canals. μFE models of cortical bone revealed that small and branchedcanals, typical of oim bone, increase the risk of bone failure. These results portray a state of compromised bonequality in oim bone at the tissue level, which contributes to its deficient mechanical properties.
© 2013 Elsevier Inc. All rights reserved.
Introduction
Osteogenesis imperfecta (OI) or “brittle bone disease” is a geneticdefect occurring in 1 in 20,000 human births [1,2]. Phenotypically, it ischaracterized by bone fragility and skeletal deformities due to muta-tions in collagen type I genes. The mutations cause collagen to foldimproperly, disrupting fibril alignment and structure and providing anabnormal template for mineralization [3,4].
The oimmouse model (B6C3Fe a/a-Col1a2oim/oim), a natural mutationin C57BL/6–C3HeB/Fe hybrid, mimics the biochemical and phenotypicfeatures of the most debilitating non-lethal human forms of OI [5]. Oim
mice have severe osteopenia early in life due to a spontaneous mutationin theα2 chain of collagen type I,which replaces the normal heterotrimertype I collagenα1(I)2α2(I)1with the homotrimer type I collagen isotypeα1(I)3. Homozygotes have impaired growth and skeletal fragility charac-terized by fractures, cortical thinning and bowing of the long bones, ver-tebral fractures and spine deformities, initiating in the fetus [5]. Studieshave found that oimmice have high bone turnover, with a high resorptiveactivity [6] and lower bone formation rate [7], variable or heterogeneousmineralization [8,9] andmatrix abnormalities [8,10,11]. These tissue char-acteristics are also typical of human OI [3,4,12–14].
Several studies have demonstrated reduced mechanical propertiesin oim bone compared to wild type (WT) bone: oim bones tested inthree-point bending exhibited classic brittle behavior with fractureoccurring just after the yield point of the tissue [8,15–17].
The reducedmechanical properties of oim bone and its propensity tofracture depend on the material characteristics throughout the hierar-chy of bone. At the tissue level bone quality is characterized by factorssuch as mineral density, tissue matrix fabric (lamellar vs. woven), and
Bone 61 (2014) 116–124
⁎ Corresponding author at: Department of Bioengineering, Imperial College, RoyalSchool of Mines, South Kensington Campus, London, SW7 2AZ, UK.
E-mail address: [email protected] (A. Carriero).1 Present Address: Department of Comparative Biomedical Sciences, The Royal
Veterinary College, London, UK.2 Present address: Department of Mechanical and Industrial Engineering, Northeastern
University, Boston, USA.
8756-3282/$ – see front matter © 2013 Elsevier Inc. All rights reserved.http://dx.doi.org/10.1016/j.bone.2013.12.020
Contents lists available at ScienceDirect
Bone
j ourna l homepage: www.e lsev ie r .com/ locate /bone
Author's personal copy
porosity. Previous work has shown that oim bone has high tissuemineraldensity [18] and more woven bone [5,19] compared to the wild type.Intracortical porositymay also play a role in reduced bone fracture tough-ness in OI. A few studies have examined the two-dimensional (2D)porosity of human OI bone by light microscopy and scanning electronmicroscopy, and found higher porosity compared to healthy bones[20–23]. Only one study described the porosity in oim bone as increasedcompared to WT bone, but the techniques used to determine this werenot reported [5]. No previous study has investigated three-dimensional(3D) porosity in OI bone from humans or mice, allowing for quantifica-tion of intracortical features such as canal architecture and osteocytelacunar shape. Revealing the 3D porosity and architecture of OI corticalbone is essential for a better understanding of its structure in relation toits inferiormechanical properties, and for developing successful manage-ment or treatment strategies to reduce the fracture risk in brittle bone.
The aim of this studywas therefore to quantify the 3D cortical tissueporosity and matrix structure in oim bone compared to a WT controlusing SR CT. Further, we assessed if canals are vascular using bright-field microscopy of stained sections and determined the influenceof intracortical canal architecture on bone failure risk using micro-architectural finite element (μFE) modeling.
Material and methods
Morphometrical analysis
Three tibiae and four humeri from threeWTmice (C57BL/6, CharlesRiver Laboratories, Inc., UK) and three tibiae and three humeri from
three oim mice (B6C3Fe a/a-Col1a2oim/oim from maintained localcolony), all 8 weeks-old and male, were dissected after sacrifice,embedded at both ends in low viscosity poly-methylmethacrylatebone cement (PMMA; Cemex®, Tecres, VR) so that the shaft wasaligned vertically. During preparation and before imaging, the sampleswere wrapped in gauze moistened with phosphate buffered saline(PBS) and stored at −20 °C. All procedures followed local ethicalreview and Home Office approval.
Boneswere orientedwith their longitudinal axis parallel to the stagerotation axis and immersed in PBS during scanning at the beamlinefor tomographic microscopy and coherent radiology (TOMCAT) of theSwiss Light Source [24]. High-resolution 3D representations of theposterior tibial and the lateral humeral mid-diaphysis of the boneswere acquired for both mouse strains using SR CT at a nominal resolu-tion of 700 nm. For each 3D data set, a total of 1001 projections wereacquired over a range of 180° and at a photon energy of 17.5 keV.Tomograms were reconstructed using filtered back-projection yield-ing image volumes at the mid-diaphysis of 2048 × 2048 × 2048voxels (1.43 × 1.43 × 1.43 mm). From this volume only the regionoccupied by the bone was retained for further analysis.
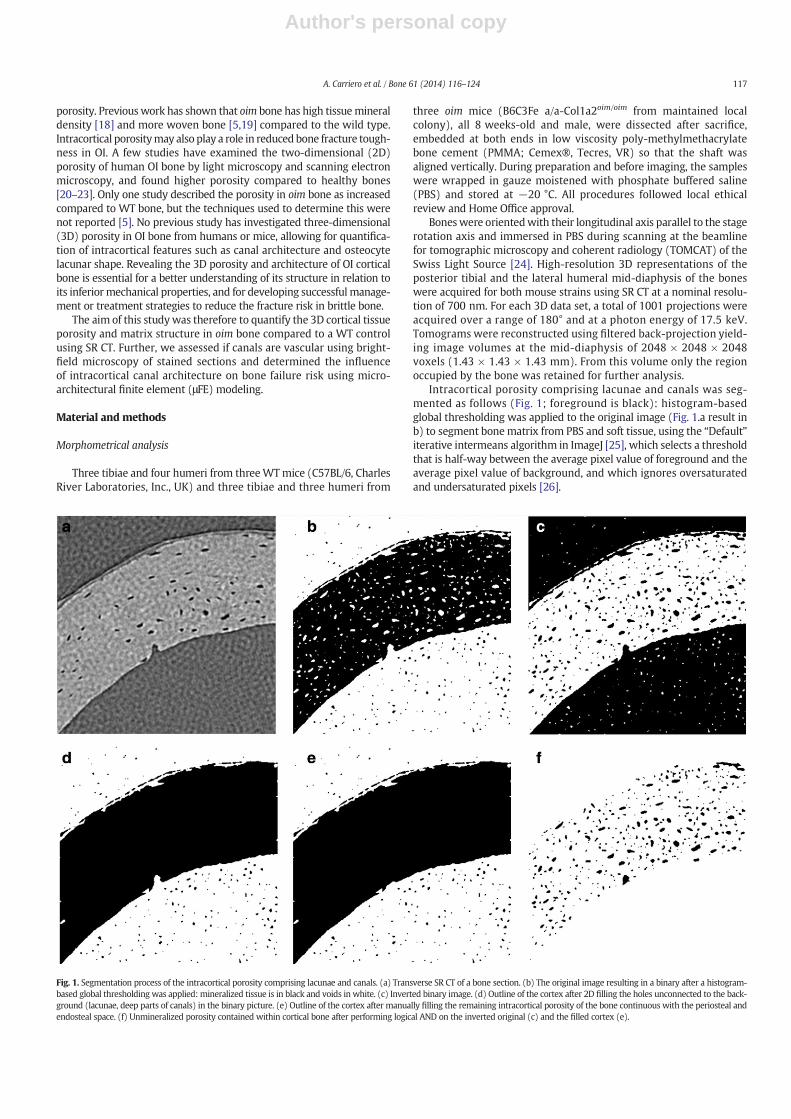
Intracortical porosity comprising lacunae and canals was seg-mented as follows (Fig. 1; foreground is black): histogram-basedglobal thresholding was applied to the original image (Fig. 1.a result inb) to segment bonematrix from PBS and soft tissue, using the “Default”iterative intermeans algorithm in ImageJ [25], which selects a thresholdthat is half-way between the average pixel value of foreground and theaverage pixel value of background, and which ignores oversaturatedand undersaturated pixels [26].
Fig. 1. Segmentation process of the intracortical porosity comprising lacunae and canals. (a) Transverse SR CT of a bone section. (b) The original image resulting in a binary after a histogram-based global thresholding was applied: mineralized tissue is in black and voids in white. (c) Inverted binary image. (d) Outline of the cortex after 2D filling the holes unconnected to the back-ground (lacunae, deep parts of canals) in the binary picture. (e) Outline of the cortex after manually filling the remaining intracortical porosity of the bone continuous with the periosteal andendosteal space. (f) Unmineralized porosity contained within cortical bone after performing logical AND on the inverted original (c) and the filled cortex (e).
117A. Carriero et al. / Bone 61 (2014) 116–124
Author's personal copy
The resulting binary image (Fig. 1.b), with mineralized tissue in theforeground was inverted (Fig. 1.c). Holes were filled in the binaryimage (Fig. 1.b) to give an image showing the outline of the cortex,with porosity unconnected to the background (lacunae, deep partsof canals), filled in (Fig. 1.d). The remaining porosity of the bone stillconnected to the PBS (i.e. periosteal and endosteal porosity) was sepa-rated manually on a slice-by-slice basis using ImageJ [25] (Fig. 1.e).Performing logical AND on the inverted original (Fig. 1.c) and the filledcortex (Fig. 1.e) we identified unmineralized porosity contained withincortical bone. The ‘Analyze Particles’ routine in BoneJ [27] was used tosegment intracortical canals and individual osteocyte lacunae bysequential region labeling for subsequentmorphometric analysis. Parti-cleswere segmented by volume into lacunae (50–1500 μm3) and canals(N1500 μm3) for subsequent morphometric analysis. Moreover, thecanal network was spatially decomposed into single elements and ana-lyzed with the skeletonization tools in Avizo (Burlington, MA) forelement-based morphometry [28]. Cortical thickness (Ct.Th), corticaltotal volume (Ct.TV), cortical total pore volume (Po.V) and corticalporosity (Ct.Po = Po.V/Ct.TV) were calculated on the whole bonelevel in the field of view. The canal network was characterized on thetissue level by number of canals (N.Ca), canal number density (N.Ca/Ct.TV), total canal volume (Ca.V), canal porosity (Ca.V/Ct.TV), canal con-nectivity density (Ca.ConnD = Ca.Conn/Ct.TV), mean canal volume(bCa.VN = Ca.V/N.Ca), mean canal diameter (bCa.DN) and mean canallength (bCa.LeN) [29].
We derived morphometric measures for the lacunar system, includ-ing number of lacunae (N.Lc), lacunar number density (N.Lc/Ct.TV),total lacunar volume (Lc.V), lacunar porosity (Lc.V/Ct.TV), and mean la-cuna volume (bLc.VN = Lc.V/N.Lc). The set of voxels defining each la-cuna was converted into a surface mesh by marching cubes [30] andthe vertices of the mesh were input to an ellipsoid-fitting algorithm(please refer to FitEllipsoid.java in BoneJ_.jar for the implementation)[27]. The best-fit ellipsoid gave lacuna major axis (Lc.λ1), lacuna inter-mediate axis (Lc.λ2) and lacuna minor axis (Lc.λ3), which correspondto the lacuna's principal axes (i.e. the eigenvalues of the inertialmatrix).From these values we calculated themean lacunar equancy (sphericity)(bLc.EqN = bLc.λ3/Lc.λ1N), mean lacunar elongation (bLc.ElN = b1−Lc.λ2/Lc.λ1N), mean lacunar flatness (bLc.FlN = b1−Lc.λ3/Lc.λ2N)[31], and mean lacunar orientation about the longitudinal axis of thebone (bLc.θN) (by considering the orientation of the lacuna major axisvs. the bone shaft orientation) [27].
Multilevel linear models, which take into account the number ofsamples and the dependence between them, were used to comparemorphologicalmeasures in oim andWTbone. This statistical complexitywas necessary because some of our measures were not independent(humerus and tibia from the same mouse). Multilevel linear modelsdo not assume homogeneity of data, Gaussian distribution, or equalsample size and account for dependence of the data. For the canal andlacunar density measures, the data were organized as hierarchicalwith two levels with values for each ‘mouse’ nested within ‘mousestrain’ (oim/WT). For canal and lacunar mean measures, the data wereorganized in a three-level hierarchy: ‘bone’ (specimen number),‘mouse’ (mouse number) and ‘mouse strain’ (oim/WT). Furthermore,the ‘bone type’ variable (i.e. tibia and humerus)was declared as a covar-iate of the ‘mouse strain’ variable to define any dependency in the datafrom bone type. The maximum likelihood was assessed to estimate theoverall fit of the data to the model, and p-values smaller than 0.05 wereconsidered to be significant.
Intracortical canal architecture and bone failure
The influence of the intracortical canal architecture on the mechan-ical performance of bone was assessed by creating μFE models of thecortical volume from the SR CT segmented images, where the canalstructure was explicitly modeled as voids (osteocyte lacunae were notconsidered) (Mimics, Materialise, Belgium). Each model consisted of
1–2.5 million tetrahedral elements with an edge length of 2–14 μm,with a finermesh in the location around the canals and surface irregular-ities. Bone was modeled as a linear elastic, isotropic and homogeneoustissue with the same material properties for WT and oim bones(E = 17 GPa, ν = 0.3) to investigate the contribution of the intracorticalarchitecture alone to themechanical properties of the bone. Nodes at thetop surface of the models (proximal side of tibia and distal side of thehumeri) were free to move in the transverse plane while a compressiveaxial displacement was applied corresponding to 0.5% apparent strain.Nodes at the bottom surface of the models (distal side of tibia and prox-imal side of the humeri) were fixed in the axial direction of the displace-ment, but allowed to translate in the other directions. These nodes wereallowed to rotate around the axis of displacement, but were blocked inany other rotation, to prevent rigid body rotation. All the remainingnodes, including those at the edges of the bone at either side of thefield of view were free to move. Tissue-level stresses and strains at
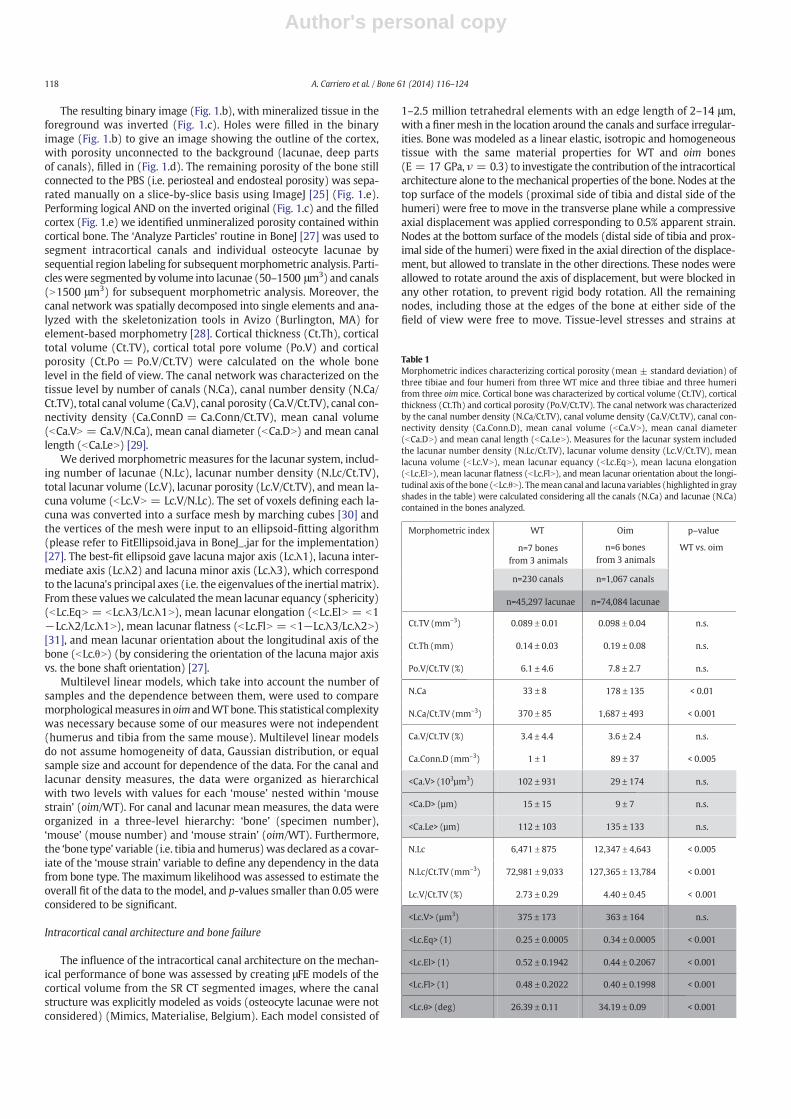
Table 1Morphometric indices characterizing cortical porosity (mean ± standard deviation) ofthree tibiae and four humeri from three WT mice and three tibiae and three humerifrom three oim mice. Cortical bone was characterized by cortical volume (Ct.TV), corticalthickness (Ct.Th) and cortical porosity (Po.V/Ct.TV). The canal network was characterizedby the canal number density (N.Ca/Ct.TV), canal volume density (Ca.V/Ct.TV), canal con-nectivity density (Ca.Conn.D), mean canal volume (bCa.VN), mean canal diameter(bCa.DN) and mean canal length (bCa.LeN). Measures for the lacunar system includedthe lacunar number density (N.Lc/Ct.TV), lacunar volume density (Lc.V/Ct.TV), meanlacuna volume (bLc.VN), mean lacunar equancy (bLc.EqN), mean lacuna elongation(bLc.ElN), mean lacunar flatness (bLc.FlN), and mean lacunar orientation about the longi-tudinal axis of the bone (bLc.θN). Themean canal and lacuna variables (highlighted in grayshades in the table) were calculated considering all the canals (N.Ca) and lacunae (N.Ca)contained in the bones analyzed.
Morphometric index WT
n=7 bones
from 3 animals
Oim
n=6 bones
from 3 animals
p–value
WT vs. oim
n=230 canals n=1,067 canals
n=45,297 lacunae n=74,084 lacunae
Ct.TV (mm–3) 0.089 ± 0.01 0.098 ± 0.04 n.s.
Ct.Th (mm) 0.14 ± 0.03 0.19 ± 0.08 n.s.
Po.V/Ct.TV (%) 6.1 ± 4.6 7.8 ± 2.7 n.s.
N.Ca 33 ± 8 178 ± 135 < 0.01
N.Ca/Ct.TV (mm–3) 370 ± 85 1,687 ± 493 < 0.001
Ca.V/Ct.TV (%) 3.4 ± 4.4 3.6 ± 2.4 n.s.
Ca.Conn.D (mm–3) 1 ± 1 89 ± 37 < 0.005
<Ca.V> (103µm3) 102 ± 931 29 ± 174 n.s.
<Ca.D> (µm) 15 ± 15 9 ± 7 n.s.
<Ca.Le> (µm) 112 ± 103 135 ± 133 n.s.
N.Lc 6,471 ± 875 12,347 ± 4,643 < 0.005
N.Lc/Ct.TV (mm–3) 72,981 ± 9,033 127,365 ± 13,784 < 0.001
Lc.V/Ct.TV (%) 2.73 ± 0.29 4.40 ± 0.45 < 0.001
<Lc.V> (µm3) 375 ± 173 363 ± 164 n.s.
<Lc.Eq> (1) 0.25 ± 0.0005 0.34 ± 0.0005 < 0.001
<Lc.El> (1) 0.52 ± 0.1942 0.44 ± 0.2067 < 0.001
<Lc.Fl> (1) 0.48 ± 0.2022 0.40 ± 0.1998 < 0.001
<Lc.θ> (deg) 26.39 ± 0.11 34.19 ± 0.09 < 0.001
118 A. Carriero et al. / Bone 61 (2014) 116–124
Author's personal copy
intervals of 0.1% apparent strain during compression were estimated inthe volume of interest (ABAQUS, 6.6, Simulia, UK), selected to be 10 μmaway from the top and from the bottom of the model in order to removethe influence of the boundary conditions on the failure analysis.
Failure within the WT and oim cortical bone was expected to occurwhen the effective strain level was equal to 0.7% [32,33]. For each sam-ple, at each tissue apparent strain (from 0.1 to 0.5%), the effective strainin each element was calculated with the formula:
εeff ¼ffiffiffiffiffiffiffiffiffiffiffiffi2U=E
p
where U is the strain energy density and E is the Young Modulus of thebone tissue. We calculated the volume of bone with effective strainabove 0.7% at each apparent strain level.
Histological analysis
The right tibiae from three oim and three WT mice were dissectedand fixed in 4% formaldehyde in PBS. After dehydration in ascendingconcentrations of ethanol, the samples were embedded in PMMA(MMA, Merck, Germany) and 4 μm thick sections cut using a Reichert-Jung Autocut rotation microtome (Germany) [34]. Each sample wascut one half transversally and the remaining half longitudinally inorder to analyze the posterior tibial diaphysis. The sectionswere stainedaccording to standardprotocolswithGoldner trichrome stainingmethodto visualize tissue details [34]. The sections were observed using stan-dard bright-field microscopy (Axiophot, Zeiss, Germany; magnification400× and numerical aperture (NA) = 0.75) and differentiated betweenbone and soft tissue: mineralized tissue stained dark green, osteoid andcollagen bright red, soft tissue pink to light green, and erythrocytesbright orange.
Results
Morphometrical analysis
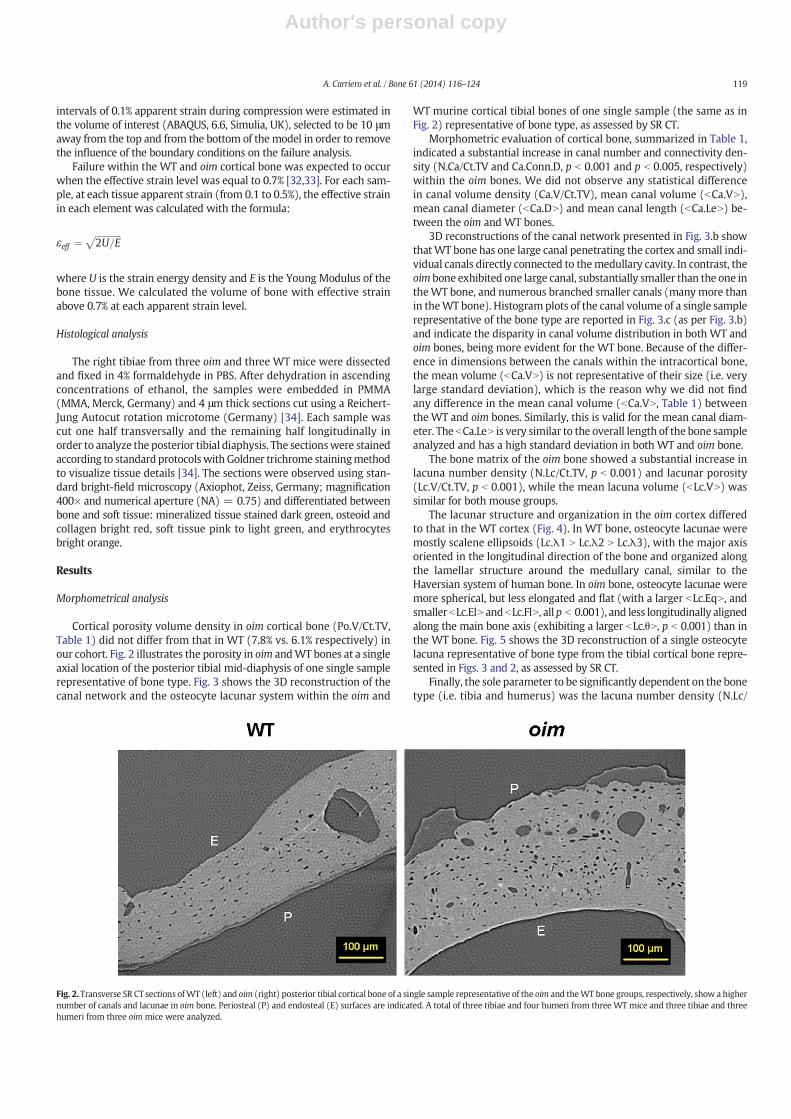
Cortical porosity volume density in oim cortical bone (Po.V/Ct.TV,Table 1) did not differ from that in WT (7.8% vs. 6.1% respectively) inour cohort. Fig. 2 illustrates the porosity in oim andWT bones at a singleaxial location of the posterior tibial mid-diaphysis of one single samplerepresentative of bone type. Fig. 3 shows the 3D reconstruction of thecanal network and the osteocyte lacunar system within the oim and
WT murine cortical tibial bones of one single sample (the same as inFig. 2) representative of bone type, as assessed by SR CT.
Morphometric evaluation of cortical bone, summarized in Table 1,indicated a substantial increase in canal number and connectivity den-sity (N.Ca/Ct.TV and Ca.Conn.D, p b 0.001 and p b 0.005, respectively)within the oim bones. We did not observe any statistical differencein canal volume density (Ca.V/Ct.TV), mean canal volume (bCa.VN),mean canal diameter (bCa.DN) and mean canal length (bCa.LeN) be-tween the oim and WT bones.
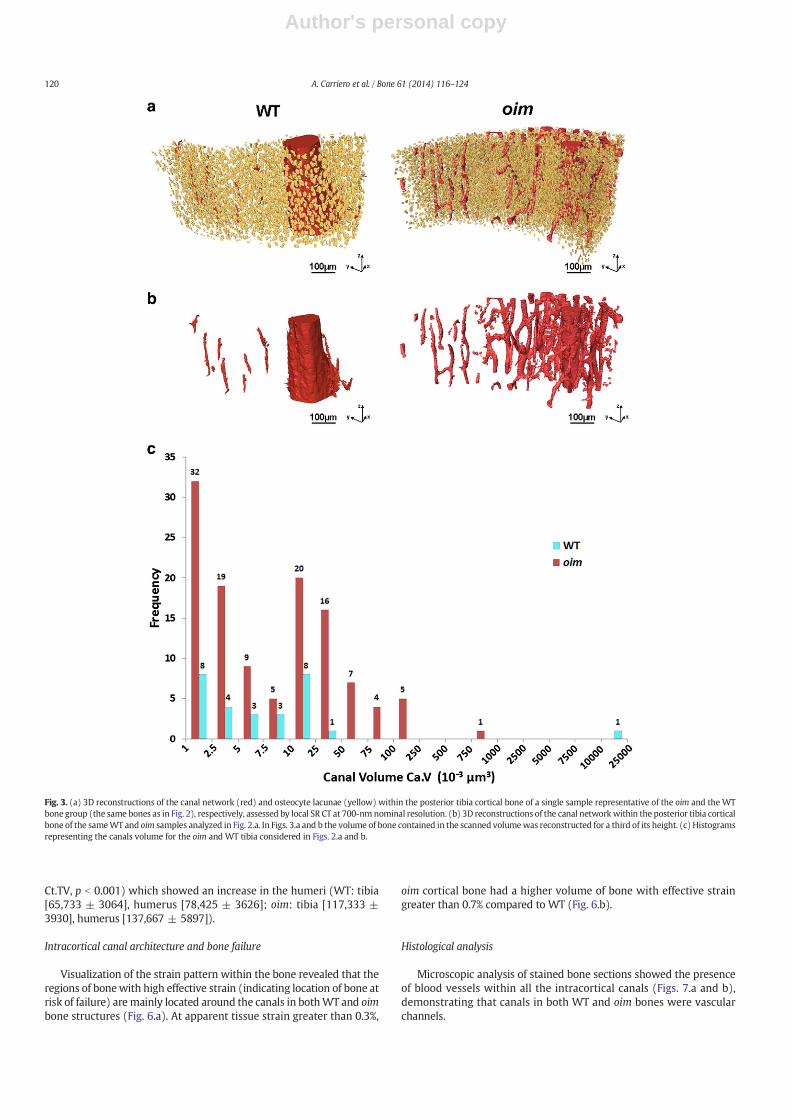
3D reconstructions of the canal network presented in Fig. 3.b showthatWT bone has one large canal penetrating the cortex and small indi-vidual canals directly connected to themedullary cavity. In contrast, theoim bone exhibited one large canal, substantially smaller than the one intheWT bone, and numerous branched smaller canals (manymore thanin theWT bone). Histogramplots of the canal volume of a single samplerepresentative of the bone type are reported in Fig. 3.c (as per Fig. 3.b)and indicate the disparity in canal volume distribution in both WT andoim bones, being more evident for the WT bone. Because of the differ-ence in dimensions between the canals within the intracortical bone,the mean volume (bCa.VN) is not representative of their size (i.e. verylarge standard deviation), which is the reason why we did not findany difference in the mean canal volume (bCa.VN, Table 1) betweenthe WT and oim bones. Similarly, this is valid for the mean canal diam-eter. The bCa.LeN is very similar to the overall length of the bone sampleanalyzed and has a high standard deviation in both WT and oim bone.
The bone matrix of the oim bone showed a substantial increase inlacuna number density (N.Lc/Ct.TV, p b 0.001) and lacunar porosity(Lc.V/Ct.TV, p b 0.001), while the mean lacuna volume (bLc.VN) wassimilar for both mouse groups.
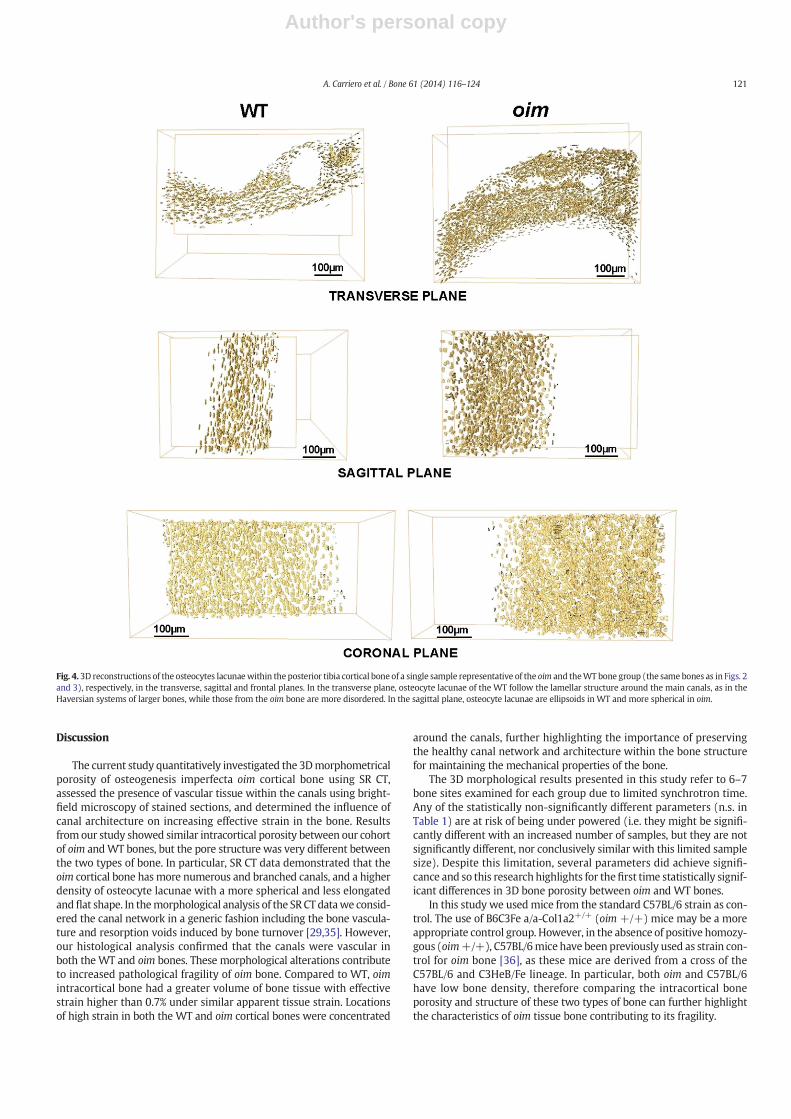
The lacunar structure and organization in the oim cortex differedto that in the WT cortex (Fig. 4). In WT bone, osteocyte lacunae weremostly scalene ellipsoids (Lc.λ1 N Lc.λ2 N Lc.λ3), with the major axisoriented in the longitudinal direction of the bone and organized alongthe lamellar structure around the medullary canal, similar to theHaversian system of human bone. In oim bone, osteocyte lacunae weremore spherical, but less elongated and flat (with a larger bLc.EqN, andsmaller bLc.ElN andbLc.FlN, allp b 0.001), and less longitudinally alignedalong the main bone axis (exhibiting a larger bLc.θN, p b 0.001) than inthe WT bone. Fig. 5 shows the 3D reconstruction of a single osteocytelacuna representative of bone type from the tibial cortical bone repre-sented in Figs. 3 and 2, as assessed by SR CT.
Finally, the sole parameter to be significantly dependent on the bonetype (i.e. tibia and humerus) was the lacuna number density (N.Lc/
Fig. 2. Transverse SR CT sections ofWT (left) and oim (right) posterior tibial cortical bone of a single sample representative of the oim and theWT bone groups, respectively, show a highernumber of canals and lacunae in oim bone. Periosteal (P) and endosteal (E) surfaces are indicated. A total of three tibiae and four humeri from three WTmice and three tibiae and threehumeri from three oim mice were analyzed.
119A. Carriero et al. / Bone 61 (2014) 116–124
Author's personal copy
Ct.TV, p b 0.001) which showed an increase in the humeri (WT: tibia[65,733 ± 3064], humerus [78,425 ± 3626]; oim: tibia [117,333 ±3930], humerus [137,667 ± 5897]).
Intracortical canal architecture and bone failure
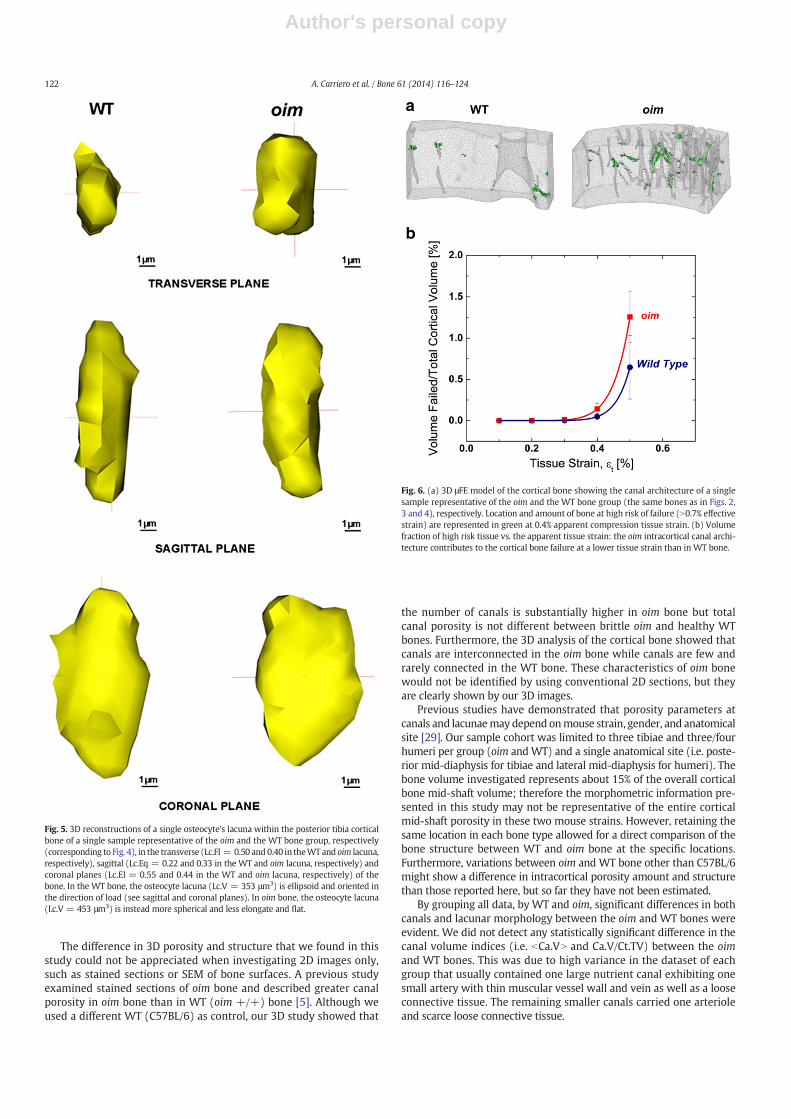
Visualization of the strain pattern within the bone revealed that theregions of bonewith high effective strain (indicating location of bone atrisk of failure) are mainly located around the canals in bothWT and oimbone structures (Fig. 6.a). At apparent tissue strain greater than 0.3%,
oim cortical bone had a higher volume of bone with effective straingreater than 0.7% compared to WT (Fig. 6.b).
Histological analysis
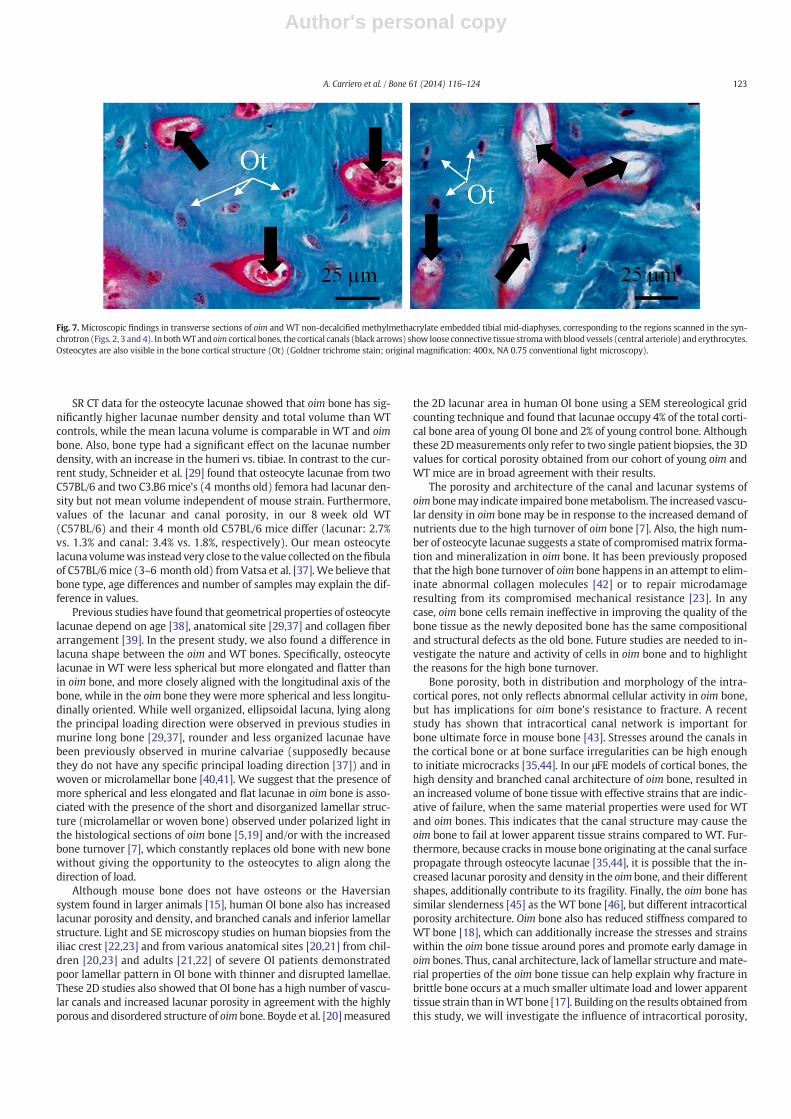
Microscopic analysis of stained bone sections showed the presenceof blood vessels within all the intracortical canals (Figs. 7.a and b),demonstrating that canals in both WT and oim bones were vascularchannels.
Fig. 3. (a) 3D reconstructions of the canal network (red) and osteocyte lacunae (yellow) within the posterior tibia cortical bone of a single sample representative of the oim and the WTbone group (the same bones as in Fig. 2), respectively, assessed by local SR CT at 700-nm nominal resolution. (b) 3D reconstructions of the canal networkwithin the posterior tibia corticalbone of the sameWT and oim samples analyzed in Fig. 2.a. In Figs. 3.a and b the volume of bone contained in the scanned volumewas reconstructed for a third of its height. (c) Histogramsrepresenting the canals volume for the oim and WT tibia considered in Figs. 2.a and b.
120 A. Carriero et al. / Bone 61 (2014) 116–124
Author's personal copy
Discussion
The current study quantitatively investigated the 3Dmorphometricalporosity of osteogenesis imperfecta oim cortical bone using SR CT,assessed the presence of vascular tissue within the canals using bright-field microscopy of stained sections, and determined the influence ofcanal architecture on increasing effective strain in the bone. Resultsfrom our study showed similar intracortical porosity between our cohortof oim andWT bones, but the pore structure was very different betweenthe two types of bone. In particular, SR CT data demonstrated that theoim cortical bone hasmore numerous and branched canals, and a higherdensity of osteocyte lacunae with a more spherical and less elongatedandflat shape. In themorphological analysis of the SR CT datawe consid-ered the canal network in a generic fashion including the bone vascula-ture and resorption voids induced by bone turnover [29,35]. However,our histological analysis confirmed that the canals were vascular inboth the WT and oim bones. These morphological alterations contributeto increased pathological fragility of oim bone. Compared to WT, oimintracortical bone had a greater volume of bone tissue with effectivestrain higher than 0.7% under similar apparent tissue strain. Locationsof high strain in both the WT and oim cortical bones were concentrated
around the canals, further highlighting the importance of preservingthe healthy canal network and architecture within the bone structurefor maintaining the mechanical properties of the bone.
The 3D morphological results presented in this study refer to 6–7bone sites examined for each group due to limited synchrotron time.Any of the statistically non-significantly different parameters (n.s. inTable 1) are at risk of being under powered (i.e. they might be signifi-cantly different with an increased number of samples, but they are notsignificantly different, nor conclusively similar with this limited samplesize). Despite this limitation, several parameters did achieve signifi-cance and so this research highlights for thefirst time statistically signif-icant differences in 3D bone porosity between oim and WT bones.
In this study we usedmice from the standard C57BL/6 strain as con-trol. The use of B6C3Fe a/a-Col1a2+/+ (oim +/+) mice may be a moreappropriate control group. However, in the absence of positive homozy-gous (oim+/+), C57BL/6mice have been previously used as strain con-trol for oim bone [36], as these mice are derived from a cross of theC57BL/6 and C3HeB/Fe lineage. In particular, both oim and C57BL/6have low bone density, therefore comparing the intracortical boneporosity and structure of these two types of bone can further highlightthe characteristics of oim tissue bone contributing to its fragility.
Fig. 4. 3D reconstructions of the osteocytes lacunaewithin the posterior tibia cortical bone of a single sample representative of the oim and theWT bone group (the same bones as in Figs. 2and 3), respectively, in the transverse, sagittal and frontal planes. In the transverse plane, osteocyte lacunae of the WT follow the lamellar structure around the main canals, as in theHaversian systems of larger bones, while those from the oim bone are more disordered. In the sagittal plane, osteocyte lacunae are ellipsoids in WT and more spherical in oim.
121A. Carriero et al. / Bone 61 (2014) 116–124
Author's personal copy
The difference in 3D porosity and structure that we found in thisstudy could not be appreciated when investigating 2D images only,such as stained sections or SEM of bone surfaces. A previous studyexamined stained sections of oim bone and described greater canalporosity in oim bone than in WT (oim +/+) bone [5]. Although weused a different WT (C57BL/6) as control, our 3D study showed that
the number of canals is substantially higher in oim bone but totalcanal porosity is not different between brittle oim and healthy WTbones. Furthermore, the 3D analysis of the cortical bone showed thatcanals are interconnected in the oim bone while canals are few andrarely connected in the WT bone. These characteristics of oim bonewould not be identified by using conventional 2D sections, but theyare clearly shown by our 3D images.
Previous studies have demonstrated that porosity parameters atcanals and lacunaemay depend onmouse strain, gender, and anatomicalsite [29]. Our sample cohort was limited to three tibiae and three/fourhumeri per group (oim andWT) and a single anatomical site (i.e. poste-rior mid-diaphysis for tibiae and lateral mid-diaphysis for humeri). Thebone volume investigated represents about 15% of the overall corticalbone mid-shaft volume; therefore the morphometric information pre-sented in this study may not be representative of the entire corticalmid-shaft porosity in these two mouse strains. However, retaining thesame location in each bone type allowed for a direct comparison of thebone structure between WT and oim bone at the specific locations.Furthermore, variations between oim and WT bone other than C57BL/6might show a difference in intracortical porosity amount and structurethan those reported here, but so far they have not been estimated.
By grouping all data, by WT and oim, significant differences in bothcanals and lacunar morphology between the oim and WT bones wereevident. We did not detect any statistically significant difference in thecanal volume indices (i.e. bCa.VN and Ca.V/Ct.TV) between the oimand WT bones. This was due to high variance in the dataset of eachgroup that usually contained one large nutrient canal exhibiting onesmall artery with thin muscular vessel wall and vein as well as a looseconnective tissue. The remaining smaller canals carried one arterioleand scarce loose connective tissue.
Fig. 5. 3D reconstructions of a single osteocyte's lacuna within the posterior tibia corticalbone of a single sample representative of the oim and the WT bone group, respectively(corresponding to Fig. 4), in the transverse (Lc.Fl = 0.50 and 0.40 in theWT and oim lacuna,respectively), sagittal (Lc.Eq = 0.22 and 0.33 in the WT and oim lacuna, respectively) andcoronal planes (Lc.El = 0.55 and 0.44 in the WT and oim lacuna, respectively) of thebone. In the WT bone, the osteocyte lacuna (Lc.V = 353 μm3) is ellipsoid and oriented inthe direction of load (see sagittal and coronal planes). In oim bone, the osteocyte lacuna(Lc.V = 453 μm3) is instead more spherical and less elongate and flat.
Fig. 6. (a) 3D μFE model of the cortical bone showing the canal architecture of a singlesample representative of the oim and the WT bone group (the same bones as in Figs. 2,3 and 4), respectively. Location and amount of bone at high risk of failure (N0.7% effectivestrain) are represented in green at 0.4% apparent compression tissue strain. (b) Volumefraction of high risk tissue vs. the apparent tissue strain: the oim intracortical canal archi-tecture contributes to the cortical bone failure at a lower tissue strain than in WT bone.
122 A. Carriero et al. / Bone 61 (2014) 116–124
Author's personal copy
SR CT data for the osteocyte lacunae showed that oim bone has sig-nificantly higher lacunae number density and total volume than WTcontrols, while the mean lacuna volume is comparable in WT and oimbone. Also, bone type had a significant effect on the lacunae numberdensity, with an increase in the humeri vs. tibiae. In contrast to the cur-rent study, Schneider et al. [29] found that osteocyte lacunae from twoC57BL/6 and two C3.B6mice's (4 months old) femora had lacunar den-sity but not mean volume independent of mouse strain. Furthermore,values of the lacunar and canal porosity, in our 8 week old WT(C57BL/6) and their 4 month old C57BL/6 mice differ (lacunar: 2.7%vs. 1.3% and canal: 3.4% vs. 1.8%, respectively). Our mean osteocytelacuna volumewas instead very close to the value collected on thefibulaof C57BL/6mice (3–6 month old) from Vatsa et al. [37].We believe thatbone type, age differences and number of samples may explain the dif-ference in values.
Previous studies have found that geometrical properties of osteocytelacunae depend on age [38], anatomical site [29,37] and collagen fiberarrangement [39]. In the present study, we also found a difference inlacuna shape between the oim and WT bones. Specifically, osteocytelacunae in WT were less spherical but more elongated and flatter thanin oim bone, and more closely aligned with the longitudinal axis of thebone, while in the oim bone they were more spherical and less longitu-dinally oriented. While well organized, ellipsoidal lacuna, lying alongthe principal loading direction were observed in previous studies inmurine long bone [29,37], rounder and less organized lacunae havebeen previously observed in murine calvariae (supposedly becausethey do not have any specific principal loading direction [37]) and inwoven or microlamellar bone [40,41]. We suggest that the presence ofmore spherical and less elongated and flat lacunae in oim bone is asso-ciated with the presence of the short and disorganized lamellar struc-ture (microlamellar or woven bone) observed under polarized light inthe histological sections of oim bone [5,19] and/or with the increasedbone turnover [7], which constantly replaces old bone with new bonewithout giving the opportunity to the osteocytes to align along thedirection of load.
Although mouse bone does not have osteons or the Haversiansystem found in larger animals [15], human OI bone also has increasedlacunar porosity and density, and branched canals and inferior lamellarstructure. Light and SE microscopy studies on human biopsies from theiliac crest [22,23] and from various anatomical sites [20,21] from chil-dren [20,23] and adults [21,22] of severe OI patients demonstratedpoor lamellar pattern in OI bone with thinner and disrupted lamellae.These 2D studies also showed that OI bone has a high number of vascu-lar canals and increased lacunar porosity in agreement with the highlyporous and disordered structure of oim bone. Boyde et al. [20]measured
the 2D lacunar area in human OI bone using a SEM stereological gridcounting technique and found that lacunae occupy 4% of the total corti-cal bone area of young OI bone and 2% of young control bone. Althoughthese 2Dmeasurements only refer to two single patient biopsies, the 3Dvalues for cortical porosity obtained from our cohort of young oim andWT mice are in broad agreement with their results.
The porosity and architecture of the canal and lacunar systems ofoim bonemay indicate impaired bonemetabolism. The increased vascu-lar density in oim bone may be in response to the increased demand ofnutrients due to the high turnover of oim bone [7]. Also, the high num-ber of osteocyte lacunae suggests a state of compromisedmatrix forma-tion and mineralization in oim bone. It has been previously proposedthat the high bone turnover of oim bone happens in an attempt to elim-inate abnormal collagen molecules [42] or to repair microdamageresulting from its compromised mechanical resistance [23]. In anycase, oim bone cells remain ineffective in improving the quality of thebone tissue as the newly deposited bone has the same compositionaland structural defects as the old bone. Future studies are needed to in-vestigate the nature and activity of cells in oim bone and to highlightthe reasons for the high bone turnover.
Bone porosity, both in distribution and morphology of the intra-cortical pores, not only reflects abnormal cellular activity in oim bone,but has implications for oim bone's resistance to fracture. A recentstudy has shown that intracortical canal network is important forbone ultimate force in mouse bone [43]. Stresses around the canals inthe cortical bone or at bone surface irregularities can be high enoughto initiate microcracks [35,44]. In our μFE models of cortical bones, thehigh density and branched canal architecture of oim bone, resulted inan increased volume of bone tissue with effective strains that are indic-ative of failure, when the same material properties were used for WTand oim bones. This indicates that the canal structure may cause theoim bone to fail at lower apparent tissue strains compared to WT. Fur-thermore, because cracks inmouse bone originating at the canal surfacepropagate through osteocyte lacunae [35,44], it is possible that the in-creased lacunar porosity and density in the oim bone, and their differentshapes, additionally contribute to its fragility. Finally, the oim bone hassimilar slenderness [45] as the WT bone [46], but different intracorticalporosity architecture. Oim bone also has reduced stiffness compared toWT bone [18], which can additionally increase the stresses and strainswithin the oim bone tissue around pores and promote early damage inoim bones. Thus, canal architecture, lack of lamellar structure andmate-rial properties of the oim bone tissue can help explain why fracture inbrittle bone occurs at a much smaller ultimate load and lower apparenttissue strain than inWT bone [17]. Building on the results obtained fromthis study, we will investigate the influence of intracortical porosity,
Fig. 7.Microscopic findings in transverse sections of oim andWT non-decalcified methylmethacrylate embedded tibial mid-diaphyses, corresponding to the regions scanned in the syn-chrotron (Figs. 2, 3 and 4). In bothWTand oim cortical bones, the cortical canals (black arrows) show loose connective tissue stromawith blood vessels (central arteriole) and erythrocytes.Osteocytes are also visible in the bone cortical structure (Ot) (Goldner trichrome stain; original magnification: 400x, NA 0.75 conventional light microscopy).
123A. Carriero et al. / Bone 61 (2014) 116–124
Author's personal copy
matrix architecture, and lamellar organization on the crack propagationin WT and brittle oim bone by using experimental ex-vivo studies andcomputational modeling.
Conclusions
SR CT and histological sections from this study portray a state ofcompromised intracortical structure in oim bone, with similar porosityto WT bone, but increased vascular canals and lacunar density. Thecanal architecture influenced the volume of bone with effective strainsindicative of failure. Specifically, an increased vascularity density maycontribute to brittleness in the oim bone. Defects in the intracorticalbone porosity and architecture have deleterious implications for bone'smechanical integrity and its ability to resist fractures. Our results sug-gest that in healthy bone vascular demand to support biologicalactivities is in balance with maintaining mechanical competence. How-ever, when vascular density increases in response to biological activity,mechanical integrity will be affected. A thorough understanding ofbone structure throughout its hierarchy and its contribution tomechan-ical performance will provide insight into OI and potential targets fortreatment.
Conflict of interest statement
All authors state that they have no conflicts of interest.
Acknowledgments
This work was funded by the IDEA League Grant, Imperial CollegeLondon, UK and the Elsie Widdowson Foundation, Imperial CollegeLondon, UK. The authors thank Rajmund Mokso, scientist at theTOMCAT beamline at the Swiss Light Source, for technical assistanceduring image acquisition and Dr. Michael Hahn, University MedicalCenter Hamburg-Eppendorf for support on the undecalcified prepara-tion of bone tissue and polarized light microscopy.
References
[1] Rauch F, Glorieux FH. Osteogenesis imperfecta. Lancet 2004;363:1377–85.[2] Huber MA. Osteogenesis imperfecta. Oral Surg Oral Med Oral Pathol Oral Radiol
Endod 2007;103:314–20.[3] ColeWG. The Nicholas Andry Award-1996. The molecular pathology of osteogenesis
imperfecta. Clin Orthop Relat Res 1997;343:235–48.[4] Cole WG. Advances in osteogenesis imperfecta. Clin Orthop Relat Res 2002;401:6–16.[5] Chipman SD, Sweet HO, McBride Jr DJ, DavissonMT, Marks Jr SC, Shuldiner AR, et al.
Defective pro alpha 2(I) collagen synthesis in a recessive mutation in mice: a modelof human osteogenesis imperfecta. Proc Natl Acad Sci U S A 1993;90:1701–5.
[6] Zhang H, Doty SB, Hughes C, Dempster D, Camacho NP. Increased resorptive activityand accompanying morphological alterations in osteoclasts derived from the oim/oim mouse model of osteogenesis imperfecta. J Cell Biochem 2007;102:1011–20.
[7] Kalajzic I, Terzic J, Rumboldt Z, Mack K, Naprta A, Ledgard F, et al. Osteoblasticresponse to the defective matrix in the osteogenesis imperfecta murine (oim)mouse. Endocrinology 2002;143:1594–601.
[8] Camacho NP, Hou L, Toledano TR, Ilg WA, Brayton CF, Raggio CL, et al. The materialbasis for reduced mechanical properties in oim mice bones. J Bone Miner Res1999;14:264–72.
[9] Phillips CL, Bradley DA, Schlotzhauer CL, Bergfeld M, Libreros-Minotta C, Gawenis LR,et al. Oimmice exhibit altered femur and incisormineral composition and decreasedbone mineral density. Bone 2000;27:219–26.
[10] Camacho NP, Landis WJ, Boskey AL. Mineral changes in a mouse model of osteogen-esis imperfecta detected by Fourier transform infrared microscopy. Connect TissueRes 1996;35:259–65.
[11] Grabner B, Landis WJ, Roschger P, Rinnerthaler S, Peterlik H, Klaushofer K, et al. Age-and genotype-dependence of bonematerial properties in the osteogenesis imperfectamurine model (oim). Bone 2001;29:453–7.
[12] Boyde A, Travers R, Glorieux FH, Jones SJ. The mineralization density of iliac crestbone from children with osteogenesis imperfecta. Calcif Tissue Int 1999;64:185–90.
[13] Zionts LE, Nash JP, Rude R, Ross T, Stott NS. Bone mineral density in children withmild osteogenesis imperfecta. J Bone Joint Surg Br 1995;77:143–7.
[14] Nyman JS, Reyes M, Wang X. Effect of ultrastructural changes on the toughness ofbone. Micron 2005;36:566–82.
[15] Saban J, ZussmanMA, Havey R, Patwardhan AG, Schneider GB, King D. Heterozygousoim mice exhibit a mild form of osteogenesis imperfecta. Bone 1996;19:575–9.
[16] McBride Jr DJ, Shapiro JR, Dunn MG. Bone geometry and strength measurements inaging mice with the oim mutation. Calcif Tissue Int 1998;62:172–6.
[17] Vanleene M, Saldanha Z, Cloyd KL, Jell G, Bou-Gharios G, Bassett JH, et al. Trans-plantation of human fetal blood stem cells in the osteogenesis imperfectamouse leads to improvement in multiscale tissue properties. Blood 2011;117:1053–60.
[18] Vanleene M, Porter A, Guillot PV, Boyde A, Oyen M, Shefelbine S. Ultra-structuraldefects cause low bone matrix stiffness despite high mineralization in osteogenesisimperfecta mice. Bone 2012;50:1317–23.
[19] Nadiarnykh O, Plotnikov S, Mohler WA, Kalajzic I, Redford-Badwal D, Campagnola PJ.Second harmonic generation imaging microscopy studies of osteogenesis imperfecta.J Biomed Opt 2007;12:051805.
[20] Boyde A,Maconnachie E, Reid SA, Delling G,Mundy GR. Scanning electronmicroscopyin bone pathology: review of methods, potential and applications. Scan ElectronMicrosc 1986;4:1537–54.
[21] Cassella JP, Stamp TC, Ali SY. A morphological and ultrastructural study of bone inosteogenesis imperfecta. Calcif Tissue Int 1996;58:155–65.
[22] Jones SJ, Glorieux FH, Travers R, Boyde A. Themicroscopic structure of bone innormalchildren and patients with osteogenesis imperfecta: a survey using backscatteredelectron imaging. Calcif Tissue Int 1999;64:8–17.
[23] Rauch F, Travers R, Parfitt AM,Glorieux FH. Static anddynamic bone histomorphometryin children with osteogenesis imperfecta. Bone 2000;26:581–9.
[24] Stampanoni M, Groso A, Isenegger A, Mikuljan G, Chen Q, Meister D, et al. TOMCAT:a beamline for TOmographic Microscopy and Coherent rAdiology experimenTs. AIPConf Proc 2007;879:848–51.
[25] Rasband WS. ImageJ, U.S. National Institutes of Health, Bethesda, MD, USA. http://rsb.info.nih.gov/ij/2011.
[26] Ridler TW, Calvard S. Picture thresholding using an iterative selection method. IEEETrans Syst Man Cybern 1978;8:603–32.
[27] Doube M, Klosowski MM, Arganda-Carreras I, Cordelieres FP, Dougherty RP, JacksonJS, et al. BoneJ: free and extensible bone image analysis in ImageJ. Bone 2010;47:1076–9.
[28] Stauber M, Müller R. Volumetric spatial decomposition of trabecular bone into rodsand plates—a new method for local bone morphometry. Bone 2006;38:475–84.
[29] Schneider P, Stauber M, Voide R, Stampanoni M, Donahue LR, Müller R. Ultra-structural properties in cortical bone vary greatly in two inbred strains of miceas assessed by synchrotron light based micro- and nano-CT. J Bone Miner Res2007;22:1557–70.
[30] Schmid B, Schindelin J, Cardona A, Longair M, Heisenberg M. A high-level 3D visual-ization API for Java and ImageJ. BMC Bioinformatics 2010;11:274.
[31] Carter Y, Thomas CD, Clement JG, Peele AG, Hannah K, Cooper DM. Variation inosteocyte lacunar morphology and density in the human femur—a synchrotronradiation micro-CT study. Bone 2013;52:126–32.
[32] Mueller TL, Christen D, Sandercott S, Boyd SK, van Rietbergen B, Eckstein F, et al.Computational finite element bone mechanics accurately predicts mechanicalcompetence in the human radius of an elderly population. Bone 2011;48:1232–8.
[33] Pistoia W, van Rietbergen B, Ruegsegger P. Mechanical consequences of differentscenarios for simulated bone atrophy and recovery in the distal radius. Bone2003;33:937–45.
[34] Hahn M, Vogel M, Delling G. Undecalcified preparation of bone tissue: report oftechnical experience and development of new methods. Virchows Arch A PatholAnat Histopathol 1991;418:1–7.
[35] Voide R, Schneider P, Stauber M, Wyss P, Stampanoni M, Sennhauser U, et al. Time-lapsed assessment of microcrack initiation and propagation in murine cortical boneat submicrometer resolution. Bone 2009;45:164–73.
[36] Dong XN, Zoghi M, Ran Q, Wang X. Collagen mutation causes changes of themicrodamage morphology in bone of an OI mouse model. Bone 2010;47:1071–5.
[37] Vatsa A, Breuls RG, Semeins CM, Salmon PL, Smit TH, Klein-Nulend J. Osteocytemorphology in fibula and calvaria—is there a role for mechanosensing? Bone2008;43:452–8.
[38] Hirose S, Li M, Kojima T, de Freitas PH, Ubaidus S, Oda K, et al. A histological assess-ment on the distribution of the osteocytic lacunar canalicular system using silverstaining. J Bone Miner Metab 2007;25:374–82.
[39] Remaggi F, Cane V, Palumbo C, Ferretti M. Histomorphometric study on the osteo-cyte lacuno-canalicular network in animals of different species. I. Woven-fiberedand parallel-fibered bones. Ital J Anat Embryol 1998;103:145–55.
[40] Hernandez CJ, Majeska RJ, Schaffler MB. Osteocyte density in woven bone. Bone2004;35:1095–9.
[41] Kerschnitzki M, Wagermaier W, Roschger P, Seto J, Shahar R, Duda GN, et al. Theorganization of the osteocyte network mirrors the extracellular matrix orientationin bone. J Struct Biol 2011;173:303–11.
[42] Boskey A, Pleshko Camacho N. FT-IR imaging of native and tissue-engineered boneand cartilage. Biomaterials 2007;28:2465–78.
[43] Schneider P, Voide R, Stampanoni M, Donahue LR, Muller R. The importance of theintracortical canal network for murine bone mechanics. Bone 2013;53:120–8.
[44] Voide R, Schneider P, Stauber M, van Lenthe GH, Stampanoni M, Müller R. Theimportance of murine cortical bone microstructure for microcrack initiation andpropagation. Bone 2011;49:1186–93.
[45] Jepsen KJ, Hu B, Tommasini SM, Courtland HW, Price C, Cordova M, et al. Phenotypicintegration of skeletal traits during growth buffers genetic variants affecting theslenderness of femora in inbred mouse strains. Mamm Genome 2009;20:21–33.
[46] Brodt MD, Ellis CB, Silva MJ. Growing C57Bl/6 mice increase whole bone mechanicalproperties by increasing geometric and material properties. J Bone Miner Res1999;14:2159–66.
124 A. Carriero et al. / Bone 61 (2014) 116–124