alstria Annual Company Report 2019 - AnnualReports.com
84
ANNUAL COMPANY REPORT 2019 Real Estate Portfolio Performance & Financial Development
-
Upload
khangminh22 -
Category
Documents
-
view
0 -
download
0
Transcript of alstria Annual Company Report 2019 - AnnualReports.com

ANNUALCOMPANY REPORT 2019Real Estate Portfolio Performance & Financial Development

CONTENTSalstria Annual Company Report 2019
2019
11 PORTFOLIO12 Letting19 Capital expenditure 22 Transactions24 External valuation27 Portfolio overview
35 DEVELOPMENT36 Our approach to internal growth 38 Case study: Gustav-Nachtigal-Str. 3 & 540 Case study: Geesthof42 Current development projects43 Refurbishment Candidates
64 APPENDIX65 Calculation of yields67 Achieved UIRR 2006 – 201971 Valuation certificate80 Management compensation scheme81 Glossary84 Imprint
45 FINANCIALS46 P&L and FFO 47 Cash flow48 Balance sheet50 Financial debt51 Outlook 2020 52 EPRA KPI’s
56 ALSTRIA’S SHARE57 Share price performance58 Shareholder structure59 IR activities
60 CORPORATE SOCIAL RESPONSIBILITY
61 Integral part of our business 62 Green Dividend
03 AT A GLANCE04 Our strategic cornerstones06 Management letter09 Portfolio key information 10 Financial key information
PAGE22
PAGE19
PAGE24

AT A GLANCE 04 Our strategic cornerstones
06 Management letter
09 Portfolio key information
10 Financial key information
Hamburger Str. 1, Hamburg
Development project 2012 – 2013
Yield on cost: 7.4 %
alstria Annual Company Report 2019 3
AT A GLANCE

alstria office REIT-AG is Germany’s leading office real estate company. As of December 31, 2019, we own and manage a portfolio of 116 buildings with a lettable area of around 1.5 million m² and a total value of EUR 4.5 bil-lion. Our properties are located in the large and liquid German office markets of Hamburg, Düsseldorf, Frankfurt, Stuttgart, and Berlin, where we are represented by local operating offices. As a fully integrated company, oriented toward the long term, alstria’s 165 employees actively manage our buildings throughout their entire life cycle.
Our corporate strategy is based on three pillars: Letting real estate Leasing our assets enables us to generate income that forms the basis of our ability to pay out attractive divi-dends over the long term.
Exploiting value creation potential We increase rental income and property values by mak-ing substantial and steady investments in our portfolio.
Capital allocationDepending on our perception of the real estate cycle, we buy or sell properties to continuously optimize the risk return profile of the portfolio.
Through our local presence, we offer our tenants modern and efficient office space, as well as comprehensive local services. Our company’s listing on the German stock exchange gives our shareholders access to a first-class, professionally and sustainably managed portfolio of office properties in the most attractive cities of Europe’s stron-gest economy. To our employees, we offer secure and attractive jobs, on the basis of our sustainable strategy.
OUR STRATEGIC CORNERSTONES
KEY NUMBERS
SHARE
CAPEX
TRANSACTION
LETTING
WHO WE ARE WHAT WE DO WHAT WE OFFER
alstria Annual Company Report 2019 4

€€ %%%alstria pursues a total return business, and as such, our balance sheet will shrink or grow depending on the arbi-trage that exists between pricing of real estate in the direct market and the public market. Our long-term goal is to grow the company across our markets to a portfo-lio value of around EUR 6.0 billion. In 2019, the private market priced real estate much more aggressively than in the public markets. We therefore saw limited oppor-tunity to buy and more opportunity to sell and de-risk the portfolio. We invest the proceeds from our disposals into quality-enhancing measures within our own port-folio, which offers higher yields than any acquisition in the market.
We believe that in the current volatile macro-environ-ment, maintaining a low leverage and a strong balance sheet is of paramount importance. The current net LTV stands at 27.1 % and represents the lowest level in the company’s history. Our intention is to keep the LTV level of the company at or around 35 % across a full real estate cycle.
Our three-pillar strategy has generated an average unlevered cash return of 8.0 % per annum for the EUR 1.5 billion of assets that we have acquired, man-aged, and sold back to the market since the company was founded 13 years ago. We intend to stick to the strict discipline that has enabled us to achieve this strong track record in the past.
PORTFOLIO OVERVIEW
FINANCIAL PERFORMANCE UIRR TABLE
OUR LONG-TERM PORTFOLIO STRATEGY
OUR LONG-TERM FINANCING STRATEGY
OUR LONG-TERM ACHIEVEMENTS
alstria Annual Company Report 2019 5

In 2010, alstria was the first German real estate company to publish a sustainability report. In 2013, three years prior to the signature of the Paris Agreement, alstria was one of a handful of European real estate companies to sign the RE100 pledge1), in which we committed to procure 100 % of our electrical energy from renewable sources (we ful-filled this pledge in 2019). All in all, alstria has been able to reduce its CO2 footprint2) for scopes 1 to 3 by 42.5 % since 2013 (or by 52,112 tCO2e per year). We have been acutely aware of the ‘embodied carbon’ in real estate construction.
In October 2009, we publicly3) stated for the first time our view that the most sustainable building is ‘the building that was not built.’ Our stated policy and approach to real estate is to stay away from green field development and focus on improving the existing stock. More importantly, we have been able to achieve all of the above while still meeting our financial returns. We have reviewed our pro-curement policy, incorporated the need for sustainable building upgrades in our underwriting, and used every
other lever at our disposal to reach both our financial and our sustainability goals. This journey is not over and is now deeply rooted in the culture of alstria.
As we moved forward, we started asking ourselves if and how we could do more and accelerate the path we were taking to reduce our carbon footprint. Now that we have put tools in place to measure and compare our properties, we can identify the underperformers and the reasons for their underperformance. If we were to decide to invest in improving the footprint of these lagging properties now, we could start doing better even faster. There is, however, a catch. Most of these investments, while yielding positive results from a carbon footprint perspective, would not meet our financial hurdles. In other words, most of these investments would cost the company. We have detailed in our introduction to alstria’s latest sus-tainability report4) why these investments would not yield a positive return to alstria and why it is preferable (from a
financial point of view) not to pursue them. In order to reach this conclusion, we have investigated them, applying the same diligent approach that we apply to financial investments. The only difference is that we have substituted CO2 return for financial return. What we have tried to do is identify projects that would yield the best CO2 outcomes for the money spent. Rather than looking at return on investment, we looked at CO2 saved per Euro invested. How much would our marginal cost be for suppressing an additional ton of CO2?
We looked at a variety of different projects, but the numbers we were getting out of this approach were underwhelming. The best projects we had would cost between EUR 25,000 and 30,000 per annual tCO2e saved and have an average life cycle of 25 years. Die-hard climate activists argue that the right annual cost for a ton of carbon should be between EUR 200 and 250. We were cruising 4 to 6 times higher and 20 to 30 times higher than current CO2 pricing (around EUR 25 per tCO2e). We paused and started looking around to figure out what we were missing.
MANAGEMENT LETTER
1) For more about RE100 please see www.there100.org/2) Market based.3) www.alstria.blogspot.com/2009/10/two-fridge-syndrome.html4) www.alstria.com/sustainability/
Dear ladies and gentlemen, shareholders, business partners, and tenants
alstria Annual Company Report 2019 6

We found a valuable source of information in various newly released ‘Green Bond Impact’ reports, which financial insti-tutions with green bonds outstanding started to publish. These reports published the Euro amount invested through green bonds in real estate assets as well as the annual CO2 impact. We could therefore benchmark our own numbers.
Much to our surprise, these reports confirmed our own expe-rience. The EUR 4.7 billion we identified that were invested in real estate had an average yield of EUR 29,000 per annual tCO2e saved, with the best yield being EUR 15,000 and the worst as high as EUR 290,000 per annual tCO2e saved.
While compiling these numbers, we also realized that the same green bond had much stronger CO2 yields when invested elsewhere. The same pool of financial institutions, using the same green bonds, invested EUR 5.7 billion in renewables at an average yield of EUR 350 per annual tCO2e saved. The best yield was EUR 76, and the worst was EUR 5,000 per annual tCO2e saved.
As investment professionals, we can draw only one conclu-sion looking at these numbers. If fighting climate change is our primary objective, then real estate is the wrong asset class to invest in. The marginal cost of saving a ton of CO2 seems to be 81 times higher in real estate than in renew-able. Considering that the current CO2 pricing is around EUR 25 per ton, it is likely that we would reach a similar conclusion if comparing real estate with industrial compa-nies or other economic activities.
As the saying goes, the road to hell is paved with good intentions. While we took to heart speeding up the com-pany carbon impact above and beyond what we were doing as part of our day-to-day business, we were limiting our thinking to our own realm. We were ignoring other poten-tial investment opportunities simply because we could not access them. In doing so, we were about to make a very bad capital allocation decision. It does not make it better that this misallocation of capital seems to be happening on a much greater scale in the green bond universe, as demonstrated by the numbers above.
Green buildings
Invested amount(EUR m)
Avoided CO2 per year(tCO2e)
Cost per avoided tCO2e / year
(EUR)
ING 1,096.2 23,027 47,603 SEB 88.4 309 286,073 KBC 299.0 4,893 61,108 Raiffeisen 630.0 12,992 48,491 Nordea 202.0 2,500 80,800 Berlin hypo 1,806.0 116,000 15,569 Westpac 567.9 3,743 151,715 Total 4,689.5 163,464 28,688
Renewable
Invested amount(EUR m)
Avoided CO2 per year(tCO2e)
Cost per avoided tCO2e / year
(EUR)
ING 3,816.2 4,126,160 925 SEB 184.1 146,291 1,259 KBC 201.0 40,066 5,017 Nordea 245.0 445,600 550 Westpac 832.8 10,972,870 76 Commerzbank 362.3 410,401 883 Total 5,641.4 16,141,388 350
Source: www.green-dividend.com
What is the ‘Green Dividend’?1)
The Green Dividend is born out of the above and the fol-lowing observations and / or beliefs:
› Any investment that yields positive financial returns and is sustainably beneficial will be undertaken in any case and does not need any additional incentive. As such, we are renovating our assets and improving their environ-mental footprint, industrial companies are implementing projects to reduce costs and save primary goods, and B2C companies are developing and selling environmentally cleaner products for which consumers are ready to pay more.
› The current pace of change being generated out of mar-ket-driven investments is not enough to meet the CO2 targets of the Paris Agreement. If the situation was oth-erwise, there would be no need for action.
› Any additional investment beyond economically justifia-ble projects should be focused on maximizing the impact of capital in terms of CO2 reduction, to achieve the most efficient results at the lowest capital cost (the ‘Efficiency Test’).
› While companies can identify the most efficient projects within their portfolios, they might not have access to investment opportunities that meet the Efficiency Test in the wider economy.
› Finally, we believe that in the absence of more decisive government intervention (in a form of more realistic car-bon pricing), there needs to be a sense of coordinated action to entice more cooperative behavior between the different economic agents involved.
1) For more about the Green Dividend concept, please visit www.green-dividend.com
alstria Annual Company Report 2019 7

In theory, a dividend payment by a company signals a lack of profitable investment opportunities and therefore a return of capital to shareholders1). The Green Dividend is intended for allowing a company to signal the existence of financially nonviable investment opportunities in the field of climate change and to provide the market with an estimate of the CO2 yield of such investments. It allows the market to understand a company’s marginal cost of saving a ton of CO2.
Our intention in proposing a Green Dividend is to fill the information gap that is, in our view, blurring most deci-sion-making that requires more than a financial view. Our intention is to provide more clarity to the market about the potential opportunities that exist in the field of cli-mate change mitigation. It is also to use the market (or, more specifically, our shareholders) as a sounding board on what is an efficient CO2 yield for a company to invest toward achieving.
In practice, we have identified a limited number of invest-ments2) that the company would not realize if we were to rely solely on financial analysis. The company has no legal or contractual obligation to execute these investments, and they would not pay for the company’s current cost of capital.
As is customary at alstria, when we introduce a new idea, we start small in order to assess its validity and viability. In that spirit, we will propose increasing our dividend by one cent (from EUR 0.52 to EUR 0.53 per share) at our next general meeting. This one-cent increase to the dividend will be proposed as our Green Dividend.
Shareholders will have the choice either to vote for get-ting the additional one cent paid off or to vote against the dividend increase. In the latter case, alstria would use the proceeds (around EUR 1.8 million) to implement climate change mitigation projects for an estimated CO2 yield of 1 tCO2e saved per year for every EUR 25,000 invested. The company would report back to the AGM after the success-ful implementation of the projects and present the actual CO2 savings achieved.
We believe that climate change is the greatest challenge that we will face in the coming years and are committed to addressing this challenge. It has been pushed to the forefront of every company’s and investor’s agenda. There seems to be a general understanding that it is unlikely that we will be able to reach the target of the Paris Agreement if we keep going on with a ‘business as usual’ approach.
As a first step, we are earmarking EUR 1.8 million to accel-erate the pace of action of the company in reducing its carbon footprint. We have identified the projects that we could implement and quantified the impact it could have. We will be asking our AGM to take a majority vote that will decide whether the company will pay the Green Dividend to all the shareholders or keep the funds. If shareholders decide to receive the Green Dividend, they will be able to invest the proceeds in a more efficient climate mitigation project. On the other hand, if shareholders ask the com-pany to keep the Green Dividend, they will provide us with a clear mandate to invest outside of our financial norms.
Whatever their decision is, alstria would have contributed around 2 % of its dividend toward climate mitigation issues. Our intention is to fully integrate the Green Dividend in our dividend policy. We are looking forward to our discussions.
Kind regards
Olivier ElamineChief Executive Officer (CEO)
Alexander DexneChief Financial Officer (CFO)
1) This is putting aside for a minute the specifics of REIT regimes.2) Please see www.green-dividend.com for a more detailed description of these
investments, or pages 62– 63 of this report.
alstria Annual Company Report 2019 8

11.0 % City of Hamburg
11.1 % Daimler AG
3.9 % Deutsche Telekom (GMG)
4.4 % German Government
2.9 % City of Frankfurt2.0 % HOCHTIEF AG
64.7 % Others
Annual rent EUR 208.3 million
Table 2: Portfolio highlights
Dec. 31, 2019 Dec. 31, 2018Number of properties 116 118Market value (EUR m) 4,476 3,985Contractual rent (EUR m) 208.3 197.0Valuation yield (%) 4.7 4.9Approx. lettable area (m²) 1,509,200 1,577,000EPRA vacancy rate (%) 8.1 9.7Lease length (years) 6.3 4.8Average value per m² (EUR) 2,966 2,525Average rent per m² (EUR per month) 12.62 12.25
BERLIN
DÜSSELDORF
STUTTGART
FRANKFURT
Table 1: Investment regions
Number of assets
Lettable area (m²)
Investment volume (EUR k)
Contractual rent (EUR k)
Yield (%)
Hamburg 37 385,900 1,429,450 52,382 3.7Düsseldorf 35 478,500 1,236,490 62,129 5.0Frankfurt 20 263,600 832,990 44,791 5.4Stuttgart 10 214,600 535,630 32,180 6.0Berlin 8 86,200 318,900 10,938 3.4Others 6 80,400 122,600 5,913 4.8Total 116 1,509,200 4,476,060 208,332 4.7
PORTFOLIO KEY INFORMATION
Our local offices Graph 1: Tenant split
HAMBURG
alstria Annual Company Report 2019 9
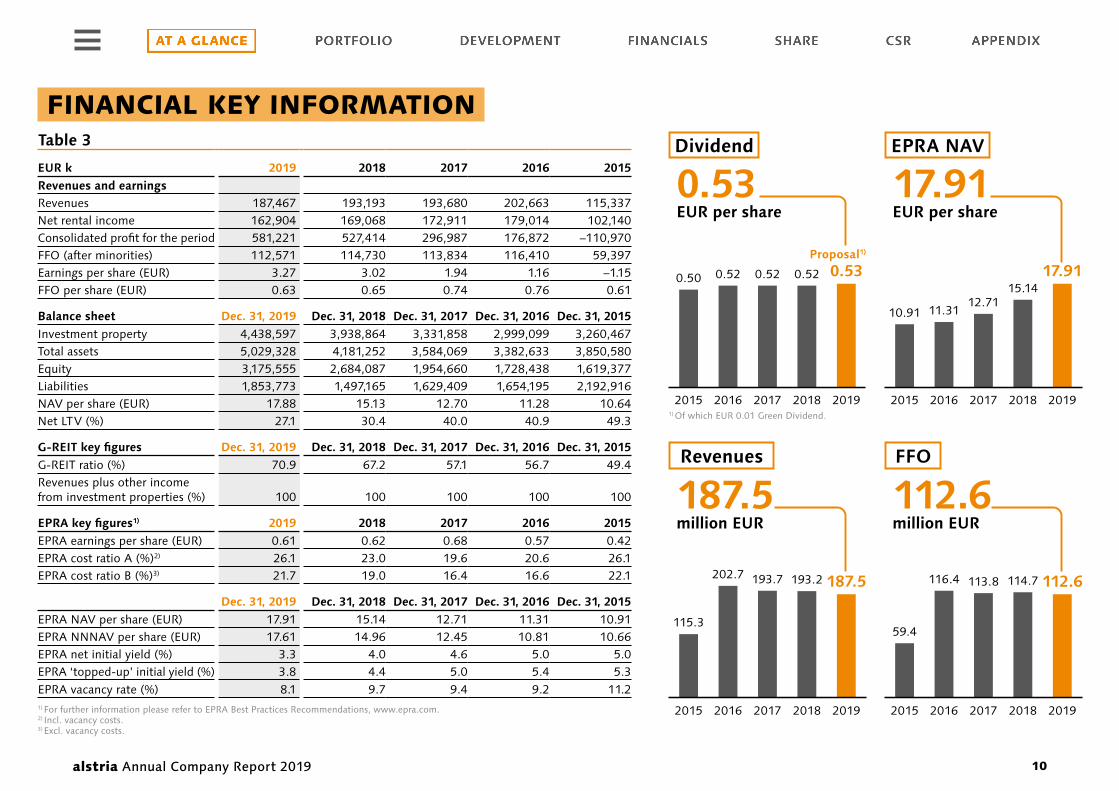
Table 3
EUR k 2019 2018 2017 2016 2015Revenues and earningsRevenues 187,467 193,193 193,680 202,663 115,337Net rental income 162,904 169,068 172,911 179,014 102,140Consolidated profit for the period 581,221 527,414 296,987 176,872 –110,970FFO (after minorities) 112,571 114,730 113,834 116,410 59,397Earnings per share (EUR) 3.27 3.02 1.94 1.16 –1.15FFO per share (EUR) 0.63 0.65 0.74 0.76 0.61
Balance sheet Dec. 31, 2019 Dec. 31, 2018 Dec. 31, 2017 Dec. 31, 2016 Dec. 31, 2015Investment property 4,438,597 3,938,864 3,331,858 2,999,099 3,260,467Total assets 5,029,328 4,181,252 3,584,069 3,382,633 3,850,580Equity 3,175,555 2,684,087 1,954,660 1,728,438 1,619,377Liabilities 1,853,773 1,497,165 1,629,409 1,654,195 2,192,916NAV per share (EUR) 17.88 15.13 12.70 11.28 10.64Net LTV (%) 27.1 30.4 40.0 40.9 49.3
G-REIT key figures Dec. 31, 2019 Dec. 31, 2018 Dec. 31, 2017 Dec. 31, 2016 Dec. 31, 2015G-REIT ratio (%) 70.9 67.2 57.1 56.7 49.4Revenues plus other income from investment properties (%) 100 100 100 100 100
EPRA key figures1) 2019 2018 2017 2016 2015EPRA earnings per share (EUR) 0.61 0.62 0.68 0.57 0.42EPRA cost ratio A (%)2) 26.1 23.0 19.6 20.6 26.1EPRA cost ratio B (%)3) 21.7 19.0 16.4 16.6 22.1
Dec. 31, 2019 Dec. 31, 2018 Dec. 31, 2017 Dec. 31, 2016 Dec. 31, 2015EPRA NAV per share (EUR) 17.91 15.14 12.71 11.31 10.91EPRA NNNAV per share (EUR) 17.61 14.96 12.45 10.81 10.66EPRA net initial yield (%) 3.3 4.0 4.6 5.0 5.0EPRA ‘topped-up’ initial yield (%) 3.8 4.4 5.0 5.4 5.3EPRA vacancy rate (%) 8.1 9.7 9.4 9.2 11.21) For further information please refer to EPRA Best Practices Recommendations, www.epra.com. 2) Incl. vacancy costs. 3) Excl. vacancy costs.
FINANCIAL KEY INFORMATION Dividend
Revenues FFO
10.91
115.359.4
11.31
202.7 116.4
12.71
193.7 113.8
15.1417.91
193.2 187.5 114.7 112.6
0.50 0.52 0.52 0.530.52
187.5million EUR
112.6 million EUR
0.53EUR per share
17.91EUR per share
2015 2016 2017 2018 2019
2015 2016 2017 2018 2019
2015 2016 2017 2018 2019
2015 2016 2017 2018 2019
Proposal1)
EPRA NAV
1) Of which EUR 0.01 Green Dividend.
alstria Annual Company Report 2019 10

PORTFOLIO 12 Letting
19 Capital expenditure
22 Transactions
24 External valuation
27 Portfolio overview
Am Wehrhahn 33, Düsseldorf
Development project 2016 – 2018
Yield on cost: 6.9 %
alstria Annual Company Report 2019 11
PORTFOLIO

LETTING
Leasing up office space is the core of our businessalstria invests in five of the main metropolitan cities in Ger-many. These are cities with a predicted positive demographic trend for the foreseeable future. These cities offer young, qualified people attractive and well-paid jobs, as well as a diverse cultural environment and leisure activities. German corporations are in competition to attract these talents in a time of low unemployment. It has become clear that the office space that a company can offer to its employees is a key competitive advantage in the corporation race for talents. As such demand for attractive, modern office space has remained on a very strong footing in 2019 and alstria has been positioning itself to make the best out of this unique environment.
In 2019, we achieved the highest leasing volume in the company's history, with 197,600 m² of new leases and 171,300 m² of lease extensions. This is a unique testimony to the strength of our portfolio and the ability of the company to create spaces that meet modern corporate demands. Understanding client needs is the basis for a successful leasing strategy and this in turn is the basis of our long-term corporate success.
Annual rent: EUR 254,000Size: 1,300 m²WAULT: 11 years Rent per m² / month: EUR 16.20
ALSTRIA’S AVERAGENEW LEASING CONTRACT
alstria Annual Company Report 2019 12

LEASES
New leases2019 was a record year in terms of leasing for our company. The signature of our two largest new contracts took place in our development portfolio. It enabled us to increase the pre-leasing rate in this sub-portfolio to 70 % and to increase the annual contractual rent to EUR 26.0 million. At ‘Sol-msstr. 27 – 37’ (Frankfurt) we let 30,900 m² and at ‘Gustav- Nachtigal-Str. 3 & 5’ (Wiesbaden) a total of 26,000 m², both to public tenants and thus securing long-term cash flows. Further substantial leasings were made, particularly in the properties ‘Am Seestern 1’ (Düsseldorf), ‘Heerdter Lohweg 35’ (Düsseldorf) and ‘T-Online-Allee 1’ (Darm-stadt). Larger lease extensions were signed at ‘Alfredstr. 236’ (Essen) and ‘Vaihinger Str. 131’ (Stuttgart).
Table 4: Main new leases in 2019 ( > 1,500 m²)
Adress City
Lettable area
(m²) Lease start
Net rent p. a.
(EUR k)
Net rent per m² (EUR)1)
Lease length (years)
Rent free(in % of
lease length)Solmsstr. 27 – 37 Frankfurt 30,900 July 01, 2021 6,081 16.50 20.0 1.7Gustav-Nachtigal-Str. 3 & 5 Wiesbaden 26,0002) Sept. 01, 2022 8,714 28.00 15.0 0.0Am Seestern 1 Düsseldorf 15,000 Oct. 01, 2020 3,338 16.59 10.0 1.7Heerdter Lohweg 35 Düsseldorf 13,500 May 01, 2020 1,894 11.70 12.0 7.6T-Online-Allee 1 Darmstadt 13,300 May 01, 2020 2,242 12.00 5.0 5.0Georg-Glock-Str. 18 Düsseldorf 6,500 May 01, 2020 1,613 21.50 12.0 2.8Rotebühlstr. 98 – 100 Stuttgart 6,300 Oct. 01, 2021 1,627 19.95 15.0 1.7Gustav-Nachtigal-Str. 5 Wiesbaden 5,400 June 01, 2019 1,415 20.00 1.6 0.0Kanzlerstr. 8 Düsseldorf 5,000 Mar. 01, 2020 865 13.61 10.0 5.2Platz der Einheit 1 Frankfurt 4,200 July 01, 2019 1,100 21.00 3.0 8.3Platz der Einheit 1 Frankfurt 2,900 July 01, 2019 850 24.00 10.0 5.8Amsinckstr. 28 Hamburg 2,900 May 01, 2020 524 14.10 5.0 0.0Amsinckstr. 28 Hamburg 2,700 July 01, 2020 529 16.50 10.0 0.0Schinkestr. 20 Berlin 2,400 Jan. 01, 2020 444 21.60 5.0 0.0Amsinckstr. 34 Hamburg 2,200 Sept. 01, 2019 424 14.75 5.0 1.7Maarweg 165 Cologne 2,000 Jan. 01, 2020 364 14.55 10.0 3.3Pempelfurtstr. 1 Ratingen 1,700 Apr. 01, 2019 179 7.50 10.0 0.0Epplestr. 225 Stuttgart 1,700 July 01, 2020 370 16.00 5.0 0.0Süderstr. 23 Hamburg 1,600 Oct. 01, 2019 294 15.30 10.0 2.5New leases > 1,500 m² 146,100Others 51,500Total 197,6001) Disregarding parking, storage and other suplementary spaces.2) Lease start for 18,400 m² on Sept. 1, 2021 and for 7,600 m² on Sept. 1, 2022.
alstria Annual Company Report 2019 13

Table 5: Main lease renewals in 2019 ( > 5,000 m²)
Adress City
Lettable area
(m²)
Net rent p. a.
(EUR k)
Net rent per m² (EUR)1)
Lease length (years)
Rent free(in % of
lease length)
Alfredstr. 236 Essen 30,300 4,150 11.41 4.0 0.0Vaihinger Str. 131 Stuttgart 21,400 3,785 13.63 1.0 0.0Epplestr. 225 Stuttgart 19,700 3,412 14.40 2.0 0.0Hanns-Klemm-Str. 45 Stuttgart 14,900 1,889 10.13 5.0 0.0Olof-Palme-Str. 37 Frankfurt 10,400 1,601 12.20 6.2 6.8Epplestr. 225 Stuttgart 8,900 1,574 14.68 1.0 0.0Ivo-Beucker-Str. 43 Düsseldorf 8,000 1,208 11.50 5.0 0.0Willstätterstr. 11–15 Düsseldorf 7,700 757 9.25 9.6 3.5Insterburger Str. 16 Frankfurt 5,500 826 11.50 3.0 8.3Renewals > 5,000 m² 126,800Others 44,500Total 171,3001) Disregarding parking, storage and other suplementary spaces.
Leasing outlook Commercial leases are generally signed for a limited period of time. The standard rental agreement in Germany has a term of 5 years (plus a 5-year extension option). In our portfolio, 30.0 % of the leases (measured by the annual-ized contract rent) expire over the next three years. In the past, around 70 % of expiring contracts were extended by the current tenants and 30 % were terminated. The latter is our primary good that we will use to enhance our space offering to tenants and realize higher rents for new leasings.
Graph 2: Lease expiries (in % of annual rent)
6.3 %
2020 2021 2022
12.7 % 11.0 %
alstria Annual Company Report 2019 14

RENTS
Like-for-like rental growth of 9.4 %Capital values of real estate in the direct investment market are at an all-time high. We therefore find more attractive investment opportunities in our own portfolio than in the direct market. Investing in our own portfolio, upgrading the quality of our offerings and generating rental growth were the factors driving the contractual rent growth in 2019. Our internal (like-for-like) growth amounted to 9.4 %. This translates into an increase of the contractual rent from EUR 189.9 million as of December 31, 2018 to EUR 208.3 million as of December 31, 2019. Table 6 shows that the rental growth that was generated by the leasing activities in our investment portfolio (EUR 2.4 million) and our devel-opment portfolio (EUR 16.0 million) substantially overcom-pensated the lower rental income from our transactions, as we continued to be a net seller in 2019. In line with EPRA BPR, table 6 also shows the development of contractual rents over the past 24 months, where we have achieved an EPRA like-for-like rental growth of 6.0 %.
Table 6: Change in rental income1)
2 year period (Dec. 31, 2017 – Dec 31, 2019)
1 year period(Dec. 31, 2018 – Dec 31, 2019)
EUR k % EUR k %Contractual rent as of Dec. 31, 2017 202,002 100.0Contractual rent as of Dec. 31, 2018 196,967 100.0+ / – Change in rent investment portfolio 3,016 1.5 2,439 1.2
o / w New leases / rent increases 14,811 7.3 13,181 6.7o / w Lease expiries – 11,795 – 5.8 – 10,742 – 5.5
+ / – Change in rent development portfolio 9,014 4.5 16,002 8.1o / w New leases 23,809 11.8 16,962 8.6o / w Lease terminations – 14,795 – 7.3 – 960 – 0.5
+ / – Change in rent from transactions – 5,699 – 2.8 – 7,076 – 3.6o / w Rents from acquired assets 8,685 4.3 1,932 1.0o / w Rents from disposed assets – 14,384 – 7.1 – 9,008 – 4.6
Contractual rent as of Dec. 31, 2019 208,332 103.1 208,332 105.81) Based on a total portfolio of EUR 4,476 m (2019), EUR 3,985 m (2018) and EUR 3,409 m (2017).
Graph 3: Development of average rent in EUR per m²
Increase of CPI: 1.1 % p. a.
Rental growth over CPI 2014 – 2019: 1.7 % p. a.
10.99 11.61 11.60 12.05 12.25 12.62
2014 2015 2016 2017 2018 2019
Growth of average rent per m²: 2.8 % p. a.
Average rent grew to EUR 12.62 per m²In 2019, continuing its growth trajectory, the average rent per m² in our total portfolio increased by 3.0 % to EUR 12.62 per m² (see graph 3). Besides the like-for-like rental growth, the development of the average rent per m² is an important indicator and shows the impact of our active asset manage-ment. Over the longer term, we grew our average rent per m² by 2.8 % p. a., which is at the upper end of our target to increase rents by 1 – 2 % beyond inflation.
alstria Annual Company Report 2019 15

COST OF LETTING
Effective rent rose to EUR 11.20 per m² A rental contract does not come for free. Before a tenant moves in, the landlord must bear the costs for tenant fit-outs and broker fees. When applicable, concessions like rent-free periods must also be considered. The base rent of a rental contract is what is usually communicated. However, the effective rent is a more useful indicator of the profitability of a rental agreement. We calculate our effective rent by accounting for all the costs incurred in a new lease and deduct them from the base rent as shown in table 7. In 2019, new leases for a leasable office space of 127,900 m² started. The weighted average effective rent for these new leases was EUR 11.20 per m² (+ 5.5 % compared to 2018), with a weighted average lease term of 6.0 years. The new leases thus generate a future rental income of EUR 123.6 million (2018: EUR 69.5 million).
Table 7: Weighted average effective rent
per m² in EUR 2019 2018 2017Base rent 13.41 13.78 12.57Tenant fit-outs –1.65 – 2.35 – 1.74Broker fees – 0.56 – 0.48 – 0.44Rent concessions – 0.01 – 0.33 – 0.18Effective rent 11.20 10.62 10.21Weighted average lease term (in years) 6.0 5.7 7.6
Am Seestern 1
Düsseldorf
alstria Annual Company Report 2019 16

VACANCY
EPRA vacancy rate down to 8.1 %The significant lease-up with a net absorption of 83,900 m² had a positive impact on our occupancy in 2019. Relative to December 31, 2019, our EPRA vacancy rate fell by 160 bps to 8.1 %. A more detailed analysis on vacancy is shown in table 8, as it also includes our development assets, which according to EPRA BPR are not part of the EPRA vacancy rate. As shown in table 8, the total vacancy in our portfolio decreased by 540 bps to 9.7 %.
Going forward, we expect a total vacancy rate of between 8 % and 12 %. The exact number depends on how much vacancy we buy, how many fully leased properties we sell and how many buildings we have under development. Vacant space is the primary good we need to be able to create value in our property portfolio.
Table 8: Vacancy schedule Vacancy
rate m² (%)
Total lettable area – Dec. 31, 2018 (A) 1,577,000Acquired space 17,600Disposed space1) – 77,500Net new built space – 100Remeasurements – 7,800Total lettable area – Dec. 31, 2019 (C) 1,509,200Vacancy – Dec. 31, 2018 (B) 237,600 15.1 (B / A)Acquired vacancy 900Disposed vacancy – 8,500Expiries and breaks 285,000Renewals – 171,300New leases – 197,600Vacancy – Dec. 31, 2019 (D) 146,100 9.7 (D / C)o / w Developments 38,500
EPRA vacancy rate2) 8.11) Disposed assets incl. assets held for sale as per Dec. 31, 2018.2) For detailled calculation see table 24, page 52.
Heidenkampsweg 99
Hamburg
alstria Annual Company Report 2019 17

Graph 4: ‘Top 5’ vacant assets 2017 – 2019
Acquired vacancy
Regular expiries
Development-related vacancy
2017 2018 2019
70,800 m²
111,400 m²
66,200 m²
19,900 m²Am Seestern 1
20,400 m²Am Seestern 1
25,200 m²Heerdter Lohweg 35
14,300 m²Heerdter Lohweg 35
29,800 m²Solmstr. 27–37
18,500 m²Gustav-Nachtigal-Str. 3
17,500 m²Carl-Reiss-Platz 1– 5
17,500 m²Carl-Reiss-Platz 1– 5
15,500 m²T-Online-Allee 1
10,200 m²Gasstr. 18
12,000 m²Gasstr. 18
12,300 m²Heidenkampsweg 99–101 6,900 m²
Heidenkampsweg 99–101
8,100 m²Amsinckstr. 28
20,300 m²Am Wehrhahn 33
Average down period of 20 months For our business model, the average down period of rental space (which provides a dynamic picture of vacancy in the portfolio) is a more meaningful indicator of leasing perfor-mance than the vacancy rate (which, by contrast, provides a static picture of vacancy). As of December 31, 2019, the average down period for our vacant space was 20 months (previous year: 15 months). This means that, on average, we needed 20 months (including developments) to re-let vacant space. The dynamic nature of our vacancy is shown by the fact that year by year there is change in our ‘Top 5’ assets that contribute to the vacancy in our portfolio (see graph 4), whose composition changes every year, thus showing that there are no major structural vacancies in our portfolio.
alstria Annual Company Report 2019 18

2019
Capex is the key to rental growthIn commercial real estate, there is little evidence for the will-ingness of tenants to pay higher rents without an improve-ment of the space quality. The most sustainable way to increase rents is to invest money to improve the quality of the building and the amount of incremental rent usually is a function of the amount of capex that is invested. The main challenge in this respect is to find the most efficient combination of capex and rent increase to optimize the return (i. e. yield on capex).
To maximize our yield on capex, we combine the local knowledge of our Real Estate Operations team with the know-how of our Development team. This allows us to unlock the potential of our portfolio. The fact that our portfolio is still leased below market levels gives us the headroom to invest into the space, lift the rents and achieve attractive returns of 6 – 7 % on our capex, which is much more than what the direct investment market currently offers.
Size: 23,000 m² Capex: EUR 30 millionCapex / m²: EUR 1,300All-in cost yield: 6.3 %
ALSTRIA’S AVERAGEDEVELOPMENT PROJECT
CAPITAL EXPENDITURE
alstria Annual Company Report 2019 19

Capex volume substantially increased To provide transparency on our capex, we split our total capex into different categories in line with the new EPRA BPR (table 9). Our development capex relates to the respec-tive sub-portfolio, which undergoes a substantial refur-bishment (capex > EUR 1,000 per m²). It was substantially up in 2019 as we increased our capital allocation to the refurbishment program because of the lack of viable alter-native investment in the direct market.
The investment portfolio capex relates to our investment portfolio and characterizes modernization capex and tenant fit-outs, which usually amount to below EUR 1,000 per m². The total portfolio capex amount of EUR 116.1 million was capitalized in 2019. In addition to capitalized invest-ments, we were constantly carrying out minor upgrades (EUR 8.5 million) and ongoing repairs (EUR 5.1 million) on our buildings, which were recognized in our income statement and therefore also in our operating profit (FFO). Overall, we invested a total of EUR 129.7 million into our properties in 2019. In the context of the total portfolio, this corresponds to an average amount of EUR 86 per m² or around 4.3 % of the portfolio value (excluding land value).
Like-for-like growth yield of 5.9 % Over the past 24 months, we leased 572,200 m² and gen-erated an additional rent (like-for-like) of EUR 12.0 mil-lion. The capex we spent over this period of time was EUR 202.6 million, leading to a like-for-like growth yield of 5.9 % (table 10).
TENANT IN
TENANT OUT
REFURBISHMENT
RE-LETTING
TENANT IN
Table 10: Like-for-like growth yield
EUR kChange rental income 2018 and 20191) 12,029o / w Investment portfolio 3,016o / w Development portfolio 9,014Capex 2018 and 20192) 202,562Like-for-like growth yield 5.9 %1) See table 6, page 15.2) See table 9, page 20 (EUR 116.1 m for 2019 and EUR 86.4 m for 2018).
Table 9: Property related capex / opex
EUR k 2019 2018 2017Acquisitions 49,300 107,300 259,500
Development 44,105 36,320 18,081Investment portfolio 72,037 50,100 40,700o / w Incremental lettable space 0 0 0o / w No incremental lettable space 29,114 26,508 19,900o / w Tenant incentives 27,989 21,187 17,900o / w Other material non-allocated
types of expenditure 14,934 2,392 2,900Capitalized interest 0 0 0Total capital expenditure 116,142 86,420 58,781Maintenance1) 8,476 8,532 9,086Running repairs1) 5,095 4,802 4,275Operating expenditure 13,571 13,334 13,361Total Capex / Opex 129,713 99,754 72,1421) Incl. in P&L and FFO.
CAPEX / OPEX OF EUR 129.7 MILLION IN 2019
alstria Annual Company Report 2019 20

Significant progress in the course of 2019 To effectively exploit the potential of our property portfolio, we have around 8 % of portfolio volume under develop-ment. The development buildings are sourced from our investment portfolio and are intended to be returned into the investment portfolio after completion. Our current development pipeline comprises eight projects, with a total lettable area of 184,000 m². In 2019, we took advantage of the strong leasing market to pre-lease a substantial part of our development portfolio, therefore significantly de-risking the process. The two main projects in Gustav-Nachtigal- Str. 3 & 5 (Wiesbaden) and Solmsstr. 27 – 37 (Frankfurt) are fully leased and are in the process of refurbishment. The assets will be handed over to the tenants in 2021 and 2022. Rents on both buildings increased by 52 %, reflecting the new quality of the assets.
Planned development capex of EUR 238.4 millionFor the current development portfolio, we plan a capex volume of EUR 238.4 million, which is EUR 1,300 per m². Taking into account the current book value, the required capex and the rent that we will achieve after completion, the all-in cost yield of our current development portfolio will be around 6.3 %.
DEVELOPMENT PORTFOLIO
Table 11: Key data
Adress City
Lettable area (m²)
OMV at start of development
(EUR k) Total capex
(EUR k)
Cost to complete
(EUR k)
Target rent on completion
(EUR k)
All-in-cost yield
(%) (A) (B) (C) (C/A+B)
Besenbinderhof 41 Hamburg 5,000 6,500 11,300 10,100 1,198 6.7Carl-Reiß-Platz 1– 5, TG Mannheim 17,500 16,900 40,600 38,000 3,400 5.9Deutsche Telekom Allee 7 Darmstadt 24,700 40,100 16,800 16,800 3,500 6.2Georg-Glock-Str. 18 Düsseldorf 10,800 28,800 14,900 3,400 2,649 6.1Gustav-Nachtigal-Str. 3 & 5 Wiesbaden 26,100 28,800 63,700 53,700 8,710 9.4Rotebühlstr. 98 – 100 Stuttgart 8,400 22,000 15,700 14,000 2,059 5.5Solmsstr. 27 – 37 Frankfurt 30,900 68,000 43,600 37,500 6,081 5.4T-Online-Allee 1 Darmstadt 60,600 140,100 31,800 29,900 9,500 5.5Total 184,000 351,200 238,400 203,400 37,097 6.3
Table 12: Pre-let status
Adress City
Lettable area (m²)
Pre-letting (% of target
rent) Secured rent
(EUR k)
Target rent on completion
(EUR k) Status
Expected completion
date Besenbinderhof 41 Hamburg 5,000 0 0 1,198 Construction Q2 2021Carl-Reiß-Platz 1 – 5, TG Mannheim 17,500 0 0 3,400 Construction Q4 2022Deutsche Telekom Allee 7 Darmstadt 24,700 0 0 3,500 Planning n/aGeorg-Glock-Str. 18 Düsseldorf 10,800 100 2,649 2,649 Construction Q2 2020Gustav-Nachtigal-Str. 3 & 5 Wiesbaden 26,100 100 8,710 8,710 Construction Q3 2022Rotebühlstr. 98 – 100 Stuttgart 8,400 100 2,059 2,059 Construction Q3 2021Solmsstr. 27 – 37 Frankfurt 30,900 100 6,081 6,081 Construction Q3 2021T-Online-Allee 1 Darmstadt 60,600 68 6,461 9,500 Planning n/aTotal 184,000 70 25,960 37,097
alstria Annual Company Report 2019 21

TRANSACTIONS
Capital recycling optimizes the structure of our portfolioalstria is not a trading company and we do not bet on the real estate cycle. As a long-term oriented investor and real estate operator, we buy assets in our core regions whenever we see the potential to improve the building quality and to generate higher rents. This is the most sustainable way to create value. When we acquire real estate assets, we strive for internal rates of return (on an unlevered basis) of 6 % to 8 %, depending on the individual risk of the prop-erty. Potential acquisition targets undergo a rigorous due diligence and have to perform on an unlevered basis. Our pricing discipline has remained unchanged, regardless of the current low interest rate environment.
We do, however, review our investment on a regular basis and assess the risk return prospect of holding the asset to execute our business plan vs. the opportunity to sell the asset in the market. If and when we believe there is a pricing dislocation in the market, we try to take advantage of it, either to buy more assets or to sell some assets. Our aim is to systematically improve the overall risk return profile of the portfolio.
Number of assets: 5 Avg. size: 3,600 m² Avg. in-place rent: EUR 9.20 per m²Market rent: EUR 13.80 per m²
Number of assets: 6Avg. size: 14,300 m²Avg. in-place rent: EUR 8.30 per m²
ACQUISITIONS IN THE CORE
DISPOSALS IN THE PERIPHERY
alstria Annual Company Report 2019 22

Buy the core – sell the periphery In 2019, we saw and took advantage of the strong demand for German office real estate to dispose of the weaker assets in our portfolio (usually located in the periphery of our core markets), with the intention to re-invest the sale proceeds into the core of our markets, either through our refurbishment program or, if available, through selective acquisitions. As such, we were net seller for the year (we sold EUR 139.7 million and acquired EUR 49.3 million of assets). This capital re-allocation process is allowing us to continuously improve the risk return of the portfolio. Considering the current market environment, we expect to remain being a net seller in 2020.
Unlevered return of 6.6 % in 2019We measure the return on our properties over their entire holding period, on the basis of an unlevered internal return (UIRR = unlevered rate of return). Over their holding period, the buildings sold in 2019 generated an unlevered profit of EUR 49.2 million and an estimated UIRR of 6.6 %. This result is in line with our target return and serves as proof of our realistic view on real estate investments throughout the cycle. The properties we disposed in 2019 were sold at a gain of 11.2 % compared to the FY 2018 appraised value.
ACQUISITIONS & DISPOSALS 2019
Table 13: Acquisitions
Adress
Lettable area (m²)
Vacancy rate(%)
Acquisition price1)
(EUR k)
Annual rent
(EUR k)
Transfer of benefits and
burden Lehrter Str. 17, Berlin 2,400 1.0 9,100 300 Feb. 01, 2019Handwerkstr. 4, Stuttgart 5,700 5.9 7,900 400 Mar. 01, 2019Maxstr. 3a, Berlin 3,800 0.0 11,000 448 June 01, 2019Hauptstr. 98 – 99, Berlin 3,000 6.7 13,000 416 Apr. 30, 2019Adlerstr. 63, Düsseldorf 2,700 0.0 8,300 335 Sept. 11, 2019Total 17,600 3.2 49,300 1,8991) Incl. 7 % transaction costs.
Table 14: Disposals UIRR
Adress
Lettable area (m²)
Vacancy rate1)
(%)
Transfer of benefits and
burden
Historical acquisition
price (EUR k)
Annual rent1)
(EUR k)
Gain to book
value (EUR k)
Disposal price
(EUR k)
Rent collected
(EUR k)
Totalcapex
(EUR k)
Unlevered profit
(EUR k)UIRR2)
(%)Opernplatz 2, Essen 24,300 0.0 2015 – 2019 36,700 2,802 700 38,900 8,486 3,394 8,309 5.7Ingersheimer Str. 20, Stuttgart 12,900 0.0 2015 – 2019 23,100 1,811 11,500 41,500 5,168 911 22,585 19.8Berner Str. 119, Frankfurt 14,900 25.8 2015 – 2019 20,200 1,344 2,800 27,000 3,982 1,133 9,620 10.7Stiftsplatz 5, Kaiserslautern 8,900 27.8 2015 – 2019 12,100 895 1,250 12,750 2,805 1,306 2,151 4.4W.-v.-Siemens Platz 4,Laatzen 21,000 18.7 2007 – 2019 27,700 1,411 – 370 16,680 22,208 3,912 6,708 2.4Balgebrückstr. 13, Bremen 4,200 14.7 2015 – 2019 3,800 297 – 1,850 2,900 910 118 – 136 – 9.0Total 86,200 12.7 123,600 8,560 14,030 139,730 43,559 10,774 49,237 6.61) At the time of the signing of the SPA.2) Incl. 6 % transactions costs and 5 % real estate operating expenses.
alstria Annual Company Report 2019 23

EXTERNAL VALUATION
Valuation based on RICS standardsOur entire real estate portfolio is revalued at least once a year by independent appraisers. Last years’ valuation was conducted by Savills Advisory Services Germany. The val-uation report can be found on pages 71 – 79 in this report.
In determining the value of our real estate portfolio, Sav-ills applied the Hardcore and Top Slice (H & T) method in accordance with the recommendations of the RICS (Royal Institution of Chartered Surveyors). The H & T method divides the cashflow of the property into two blocks being calcu-lated individually and being summed up subsequently. To derive the capital value, a yield is used, which is obtained from transactions of comparable buildings. The Hardcore block considers the cashflow as at the valuation date until the expiry of the existing lease, while the Top Slice marks the second phase from the beginning of the releasing based on market rents. The cashflows consider management, main-tenance and unrecoverable costs, as well as an appropriate void period. Finally, the capital value (sum of Hardcore and Top Slice) is corrected by costs for outstanding repairs, future capital costs (refurbishment and releasing) and purchasers’ costs to calculate the net value of the property, which is the amount reflected on our balance sheet.
alstria Annual Company Report 2019 24

PORTFOLIO VALUE
Increase of EUR 454.8 millionFor the overall portfolio, the 2019 valuation process resulted in a total increase of EUR 454.8 million (net of capex and acquisitions) over the course of 2019. 104 properties experi-enced an increase in value amounting to EUR 573.0 million, while 8 buildings were devalued by a total of EUR 13.2 mil-lion. The valuation increase not only reflects the change in the underlying real estate market, but also mirrors the capex spent on the portfolio (EUR 116.1 million).
Significant valuation gains were generated particularly by the assets in Solmsstr. 27 – 37 (Frankfurt) and Gustav-Nachti-gal-Str. 3 & 5 (Wiesbaden) reflecting the leasing progress and in our long-term leased assets in Hamburg.
Portfolio value grew by 37 % since 2016Over the past four years, our investment portfolio grew by 37 % to EUR 4.5 billion. During this time period, we sold slightly more than we bought and concentrated our portfolio to the core of our markets. We spent EUR 292.8 million of capex to improve the quality of our assets. Finally, the strong price increase in the German office market has led to a valuation increase of EUR 1.1 billion since 2016. The strong investment market was reflected by a yield that came down from 6.2 % in 2016 to 4.7 % in 2019.
Graph 5: Portfolio value 2016 – 2019
2017 2018 20192016
10
%
9
7
8
6
5
4
3
2
1
– 1
– 2
0
5,000
EUR million
4,000
3,000
2,000
1,000
– 1,000
0
Valuation yield
Standing portfolio
Capex
Acquisitions
Valuation gain
Disposals
alstria Annual Company Report 2019 25

RANGE OF YIELDS
ERV yields between 3.3 % and 8.8 % The valuation yield on our portfolio stands at 4.7 % as per December 31, 2019, whereas the market yield (ERV yield) amounts to 5.6 %. However, there is a wide range of yields reflecting the characteristics of each individual property (see Graph 6). The range of ERV yields (excluding develop-ment portfolio assets) represents the difference between the building with the lowest ERV yield and the building with the highest ERV yield in the respective region. The value within the range is the average ERV yield in the local portfolio. The lower end of the yield usually represents buildings with longer-term leases and the higher end of the range represents properties with shorter leases in the respective region.
0
2
3
4
1
5
6
9
8
7
10
%
Hamburg Düsseldorf Frankfurt Stuttgart Berlin Others
highest ERV yield
average ERV yield
lowest ERV yield
alstria’s averageERV yield: 5.6 %
7.7
3.3
4.5
7.6
4.4
5.9
8.5
4.0
5.7
6.5
4.6
5.5
8.8
4.0
6.4
6.4
4.5
7.1
Graph 6: Range of ERV yields1) in alstria’s portfolio
as of December 31, 2019
1) The ERV yield is the market value of the asset (OMV) in relation to its market rent (ERV). The valuation yield is 4.7 % as of Dec. 31, 2019.
alstria Annual Company Report 2019 26
SELL
BUY
MANAGE
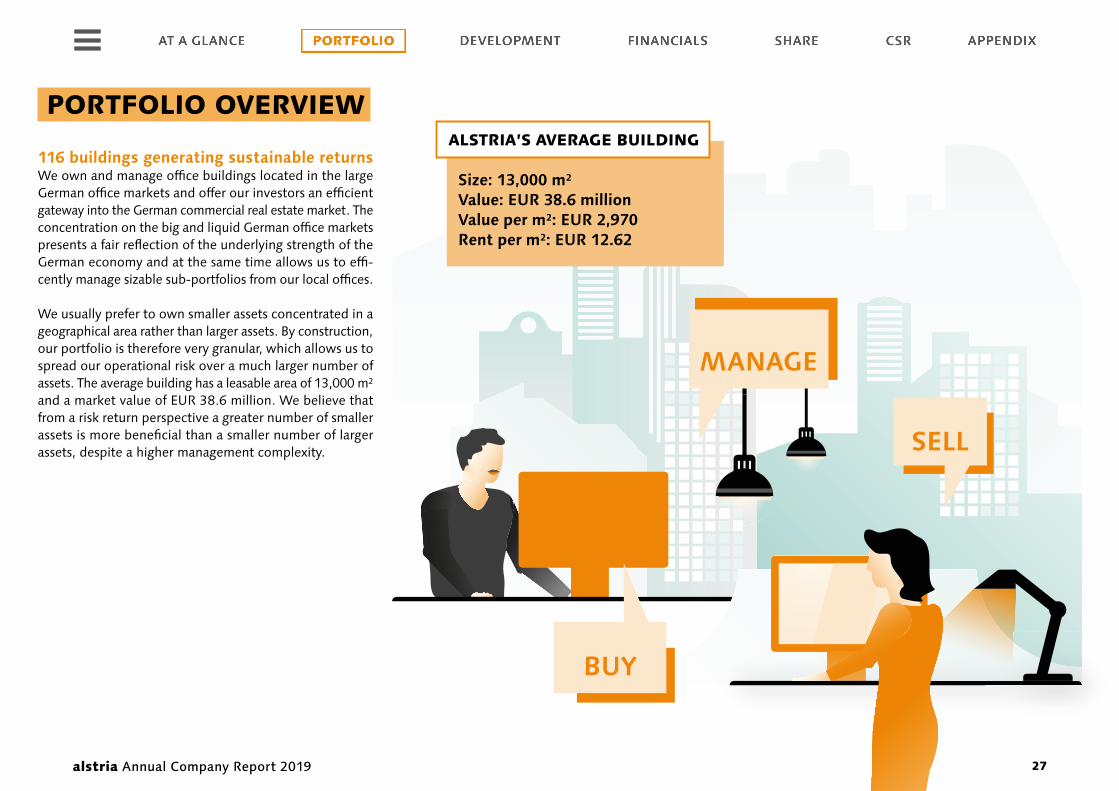
Size: 13,000 m² Value: EUR 38.6 million Value per m²: EUR 2,970 Rent per m²: EUR 12.62
ALSTRIA’S AVERAGE BUILDING
PORTFOLIO OVERVIEW
116 buildings generating sustainable returnsWe own and manage office buildings located in the large German office markets and offer our investors an efficient gateway into the German commercial real estate market. The concentration on the big and liquid German office markets presents a fair reflection of the underlying strength of the German economy and at the same time allows us to effi-cently manage sizable sub-portfolios from our local offices.
We usually prefer to own smaller assets concentrated in a geographical area rather than larger assets. By construction, our portfolio is therefore very granular, which allows us to spread our operational risk over a much larger number of assets. The average building has a leasable area of 13,000 m² and a market value of EUR 38.6 million. We believe that from a risk return perspective a greater number of smaller assets is more beneficial than a smaller number of larger assets, despite a higher management complexity.
alstria Annual Company Report 2019 27

PORTFOLIO MOVEMENT
Total portfolio value of EUR 4.5 billion The value of our total property portfolio has grown by 12.4 % to EUR 4.5 billion in 2019. To improve the transparency of our reporting, we split the change into the impact from transactions, capital expenditure and valuation. Table 15 shows that the portfolio movement has been driven pri-marily by a positive valuation result of EUR 454.8 million in 2019, which was due to the combined effect of the strong operational result and the strong underlying investment market. We used this strong investment market to dis-pose non-core assets, putting us into a net-seller position. To capture the opportunities of the strong office market and to meet the demand for high quality office space, we invested an amount of EUR 116.1 million into our assets.Besides our investment property portfolio, we held assets for sale and the assets in our own use on our balance sheet. The total portfolio value as per December 31, 2019 amounted to EUR 4.5 billion. A detailed asset-by-asset portfolio description can be found on the following pages and downloaded from our website www.alstria.com/portfolio/
Table 15: Movements property portfolio
EUR kInvestment properties as of Dec. 31, 2018 3,938,900+ Transactions – 53,900o / w Acquisitions1) 49,900o / w Disposals (book value) – 103,800+ Capital expenditure 116,100o / w Development portfolio2) 44,100o / w Investment portfolio 72,000+ Valuation result 454,800o / w Development portfolio1) 103,300o / w Investment portfolio 351,500+ Reclassification – 20,600o / w Assets held for sale (book value) – 20,600o / w Owner occupied properties 0+ Other adjustments 3,300 = Investment properties as of Dec. 31, 2019 4,438,600+ Fair value of owner occupied properties as of
Dec. 31, 2019 23,000+ Assets held for sale 19,600– Other adjustment – 5,100
= Total portfolio value as of Dec. 31, 2019 4,476,1001) Including acquisition costs.2) Assets classified as development assets as of Dec. 31, 2018 and Dec. 31, 2019.
Platz der Einheit 1
Frankfurt
alstria Annual Company Report 2019 28

TABLE 16: PORTFOLIO OVERVIEW
Lettable area (m²)
Office space(m²)
Vacancy (m²)
Contractual annual net rent
(EUR) ERV 1)
(EUR)OMV 1)
(EUR)Capex(EUR)
Wault(years)
∆ Rental income (2018 / 19)
(%)
∆ OMV(2018 / 19)
(%)Investment portfolio 1,325,300 1,069,900 107,600 178,707,400 212,727,600 3,988,350,000 81,234,000 5.4 5.9 14.3Current development portfolio 183,800 163,100 38,500 29,624,800 35,737,100 487,710,000 34,908,600 11.8 54.2 34.8Total portfolio2) 1,509,200 1,233,000 146,100 208,332,200 248,464,700 4,476,060,000 116,142,500 6.3 10.8 16.21) According to the year-end valuation by Savills Advisory Services.2) The entire portfolio is held as freehold assets.
Investment portfolio
Asset City
Total lettable area
(m²) Office space
(m²) Vacancy
(m²)
Contractual annual net rent
(EUR) ERV 1)
(EUR)OMV 1)
(EUR)Capex(EUR)
Wault(years)
∆ Rental income (2018 / 19)
(%)
∆ OMV(2018 / 19)
(%)HamburgAlte Königstr. 29 – 39 Hamburg 4,300 3,600 0 637,100 738,200 16,200,000 0 6.4 0.0 8.9Alter Steinweg 4 Hamburg 32,000 28,000 0 4,502,000 5,403,600 147,000,000 158,000 6.4 0.0 15.3Amsinckstr. 28 Hamburg 8,700 8,200 200 1,587,400 1,555,300 30,800,000 3,245,800 6.7 n/a 62.1Amsinckstr. 34 Hamburg 6,600 6,500 3,300 647,700 1,192,400 22,300,000 3,467,500 5.3 193.8 39.4Bäckerbreitergang 73 – 75 Hamburg 2,700 2,600 0 562,200 610,200 16,500,000 – 18,200 5.2 0.5 25.0Basselweg 73 Hamburg 2,700 1,900 0 295,600 328,500 6,790,000 0 6.1 0.4 4.5Borsteler Chaussee 111 – 113 Hamburg 5,400 3,600 0 654,200 678,100 13,900,000 82,600 3.2 3.1 7.8Buxtehuder Str. 9, 9a, 11, 11a Hamburg 7,700 5,100 1,500 622,400 922,500 12,000,000 8,300 6.4 0.0 1.7Drehbahn 36 Hamburg 25,700 20,200 0 3,688,100 4,394,500 118,400,000 173,900 16.4 0.1 9.6Ernst-Merck-Str. 9 Hamburg 17,500 15,200 100 3,093,300 3,444,800 100,600,000 3,647,600 10.0 11.5 25.8Essener Bogen 6 a – d Hamburg 5,400 4,500 0 741,900 734,400 9,810,000 0 3.5 4.3 12.2Essener Str. 97 Hamburg 1,400 900 0 158,800 173,800 2,220,000 11,500 2.4 2.5 11.0Garstedter Weg 13 Hamburg 3,600 2,700 0 390,300 476,900 8,270,000 900 1.4 0.0 3.4Gasstr. 18 Hamburg 26,100 21,200 12,000 2,130,900 4,353,500 56,000,000 4,233,000 4.3 8.8 12.7Grindelberg 62 – 66 Hamburg 18,400 17,400 0 2,362,300 2,761,300 61,400,000 244,000 6.4 0.0 9.1Hamburger Str. 1 – 15 (MOT) Hamburg 9,500 8,300 400 1,934,200 2,152,600 35,400,000 – 98,300 3.2 3.0 18.0Hamburger Str. 1 – 15 (MUC) Hamburg 12,700 0 200 2,467,900 2,743,700 42,200,000 28,100 3.5 3.8 – 3.0Hammer Steindamm 129 Hamburg 7,200 6,300 0 620,000 776,700 14,400,000 0 6.4 0.0 2.91) According to the year-end valuation by Savills Advisory Services.
alstria Annual Company Report 2019 29

Investment portfolio
Asset City
Total lettable area
(m²) Office space
(m²) Vacancy
(m²)
Contractual annual net rent
(EUR) ERV 1)
(EUR)OMV 1)
(EUR)Capex(EUR)
Wault(years)
∆ Rental income (2018 / 19)
(%)
∆ OMV(2018 / 19)
(%)Heidenkampsweg 44 – 46 Hamburg 4,500 4,000 400 444,400 585,900 8,010,000 233,000 3.6 10.1 14.4Heidenkampsweg 51 – 57 Hamburg 10,200 9,400 0 1,695,400 1,812,500 36,300,000 139,000 3.5 2.9 6.8Heidenkampsweg 99 – 101 Hamburg 19,400 18,900 6,900 1,804,900 3,263,500 50,400,000 8,621,900 4.8 22.3 38.8Herthastr. 20 Hamburg 3,300 2,700 0 335,600 404,400 6,610,000 – 2,300 1.4 0.0 1.1Johanniswall 4 Hamburg 14,100 10,500 0 1,940,400 2,148,800 63,900,000 – 300 15.2 0.2 12.1Kaiser-Wilhelm-Str. 79 – 87 Hamburg 5,600 4,400 0 1,191,200 1,254,200 33,900,000 – 45,600 2.7 4.5 21.1Kattunbleiche 19 Hamburg 12,400 9,800 0 1,717,700 1,583,300 47,300,000 83,300 16.4 0.0 1.1Ludwig-Rosenberg-Ring 41 Hamburg 4,900 4,100 100 534,600 560,400 11,200,000 85,600 6.7 0.2 1.8Max-Brauer-Allee 89 – 91 Hamburg 9,800 7,000 0 1,022,700 1,182,500 25,700,000 0 6.4 0.0 7.1Nagelsweg 41 – 45 Hamburg 6,900 6,300 100 1,000,200 1,156,700 23,500,000 1,229,700 8.7 0.3 24.9Öjendorfer Weg 9 – 11 Hamburg 6,100 5,900 0 637,100 727,000 14,400,000 0 6.4 0.0 2.9Rahlstedter Str. 151 – 157 Hamburg 2,900 2,900 0 329,600 364,100 7,040,000 0 6.4 0.0 2.8Schaartor 1 Hamburg 5,200 4,400 0 962,400 1,184,200 28,000,000 – 47,100 3.2 1.5 19.1Sonninstr. 24 – 28 Hamburg 22,200 19,900 1,100 2,633,900 3,566,500 72,400,000 130,800 5.8 9.0 32.6Steinstr. 10 Hamburg 26,800 22,200 0 3,689,100 4,259,100 123,200,000 637,000 6.4 0.0 19.9Steinstr. 5 – 72) Hamburg 22,400 18,700 100 4,360,700 4,806,500 125,800,000 – 39,900 8.3 1.4 23.8Süderstr. 24 Hamburg 6,600 6,200 300 985,700 1,131,300 23,000,000 2,588,100 4.2 46.0 27.8Total 380,900 313,500 26,700 52,381,900 63,431,900 1,414,850,000 28,797,900 7.3 7.8 16.7
DüsseldorfAdlerstr. 63 Düsseldorf 2,700 900 0 335,000 420,400 7,820,000 – 3,800 11.8 n/a n/aAlfredstr. 236 Essen 30,300 27,700 0 4,150,000 4,587,000 83,700,000 0 4.0 –33.5 13.9Am Seestern 1 Düsseldorf 35,700 31,800 6,200 5,608,200 5,856,600 93,300,000 4,817,200 8.7 131.9 18.6Am Wehrhahn 28 – 30 Düsseldorf 2,600 1,500 400 368,600 441,600 9,050,000 163,400 5.3 0.9 7.7Am Wehrhahn 33 Düsseldorf 24,100 18,100 4,600 4,520,400 5,660,400 125,000,000 8,204,700 5.9 21.2 25.0An den Dominikanern 6 Cologne 27,500 0 0 3,396,000 4,284,100 91,600,000 0 5.6 0.0 9.0Bamlerstr. 1 – 5 Essen 33,100 28,400 700 3,837,700 4,098,700 61,600,000 199,300 2.3 0.0 6.2Berliner Str. 91 – 101 Ratingen 33,900 24,100 6,400 3,871,000 4,471,900 63,600,000 275,800 5.3 – 2.1 4.3Carl-Schurz-Str. 2 Neuss 12,700 12,700 3,700 938,700 1,358,900 17,000,000 426,900 2.9 – 14.1 – 1.21) According to the year-end valuation by Savills Advisory Services.2) Own used property, partly classified as property, plant and equipment.
alstria Annual Company Report 2019 30

Investment portfolio
Asset City
Total lettable area
(m²) Office space
(m²) Vacancy
(m²)
Contractual annual net rent
(EUR) ERV 1)
(EUR)OMV 1)
(EUR)Capex(EUR)
Wault(years)
∆ Rental income (2018 / 19)
(%)
∆ OMV(2018 / 19)
(%)D2-Park 5 Ratingen 5,700 5,100 0 739,100 716,800 9,220,000 443,100 1.0 0.0 12.4Earl-Bakken-Platz 1 Meerbusch 8,000 7,200 0 1,175,200 1,175,200 20,000,000 309,400 6.7 0.0 6.4Elisabethstr. 5 – 112) Düsseldorf 10,200 9,100 300 2,173,100 2,343,100 52,700,000 38,700 6.2 0.6 19.2Emanuel-Leutze-Str. 11 Düsseldorf 8,300 7,500 1,100 936,700 1,183,600 18,700,000 579,200 3.2 2.4 16.9Frauenstr. 5 – 9 Trier 16,900 900 100 1,530,300 1,936,700 27,700,000 – 1,100 4.7 0.3 1.5Friedrich-List-Str. 20 Essen 9,000 7,900 0 1,477,600 1,466,700 21,200,000 0 1.5 0.0 2.9Friedrichstr. 19 Düsseldorf 2,200 1,300 0 377,500 453,300 8,900,000 50,300 3.7 0.2 14.4Gartenstr. 2 Düsseldorf 4,800 4,700 400 909,600 1,028,800 16,900,000 – 6,500 1.7 – 4.7 0.6Gereonsdriesch 13 Cologne 2,500 2,100 0 384,800 469,200 8,710,000 – 13,900 3.2 0.3 16.8Graf-Adolf-Str. 67 – 69 Düsseldorf 4,900 2,900 500 555,200 620,600 10,300,000 11,600 3.4 16.6 9.6Hansaallee 247 Düsseldorf 5,700 4,300 0 776,400 782,600 13,700,000 197,000 3.8 – 0.2 17.1Hans-Böckler-Str. 36 Düsseldorf 7,700 6,500 0 1,155,900 1,312,800 29,900,000 4,000 9.1 8.1 19.6Heerdter Lohweg 35 Düsseldorf 37,600 33,400 14,300 3,405,600 5,633,600 74,500,000 6,283,600 8.0 99.1 10.0Horbeller Str. 11 Cologne 6,600 5,800 0 659,000 788,700 12,100,000 290,500 6.9 0.7 24.7Immermannstr. 40 Düsseldorf 8,200 7,200 500 1,217,500 1,461,700 27,100,000 99,600 2.7 – 5.3 23.7Immermannstr. 59 Düsseldorf 6,500 5,100 0 1,067,500 1,038,300 20,400,000 394,600 3.9 8.2 4.1Ivo-Beucker-Str. 43 Düsseldorf 8,000 7,700 0 1,208,000 1,124,400 16,200,000 443,200 4.7 15.8 40.9Josef-Wulff-Str. 75 Recklinghausen 19,900 0 0 2,042,300 1,965,600 27,700,000 295,800 1.2 7.5 – 6.1Kaistr. 16, 16a, 18 Düsseldorf 9,300 8,900 0 2,333,200 2,445,500 53,700,000 94,100 2.8 5.3 23.4Kampstr. 36 Dortmund 3,100 1,400 700 505,300 635,100 9,490,000 512,500 5.3 28.2 31.8Kanzlerstr. 8 Düsseldorf 9,000 7,500 1,100 1,273,100 1,304,200 18,400,000 1,969,800 7.4 112.0 6.4Karlstr. 123 – 127 Düsseldorf 5,700 5,200 0 794,000 990,800 16,000,000 0 3.5 1.7 19.4Maarweg 165 Cologne 22,800 20,400 8,800 2,040,100 3,470,800 53,800,000 1,034,500 4.0 – 31.0 7.2Pempelfurtstr. 1 Ratingen 18,500 17,000 5,200 1,539,500 1,825,000 28,600,000 1,208,800 5.4 – 8.3 – 13.5Willstätterstr. 11 – 15 Düsseldorf 24,000 16,700 2,500 2,177,600 2,703,800 44,900,000 2,074,000 7.2 3.9 4.2Total 467,700 341,000 57,500 59,479,700 70,056,500 1,193,490,000 30,396,300 5.1 7.4 12.41) According to the year-end valuation by Savills Advisory Services.2) Own used property, partly classified as property, plant and equipment.
alstria Annual Company Report 2019 31

Investment portfolio
Asset City
Total lettable area
(m²) Office space
(m²) Vacancy
(m²)
Contractual annual net rent
(EUR) ERV 1)
(EUR)OMV 1)
(EUR)Capex(EUR)
Wault(years)
∆ Rental income (2018 / 19)
(%)
∆ OMV(2018 / 19)
(%)
FrankfurtAm Hauptbahnhof 6 Frankfurt 7,700 5,900 600 1,582,200 1,712,800 38,300,000 137,600 5.7 0.6 0.0Goldsteinstr. 114 Frankfurt 8,500 7,900 800 1,066,400 1,195,300 19,500,000 540,000 5.0 21.3 19.8Gustav-Nachtigal-Str. 4 Wiesbaden 800 700 800 101,100 166,800 1,340,000 800 0.4 17.1 5.1Hauptstr. 45 Dreieich 8,100 7,000 0 1,449,700 1,026,100 25,200,000 183,500 8.2 1.9 2.4Insterburger Str. 16 Frankfurt 13,000 12,900 300 1,816,700 2,042,600 31,900,000 452,500 3.8 – 0.7 10.0Mainzer Landstr. 33a Frankfurt 3,300 2,800 100 615,100 683,300 15,000,000 22,700 1.9 3.3 13.2Mergenthalerallee 45 – 47 Eschborn 5,100 4,800 1,900 308,400 477,900 5,650,000 78,900 1.3 9.9 0.9Olof-Palme-Str. 37 Frankfurt 10,400 9,300 0 1,608,500 1,695,200 27,000,000 524,800 6.2 0.0 2.7Platz der Einheit 12) Frankfurt 30,100 28,700 4,300 6,628,500 7,963,000 197,400,000 3,979,000 3.6 – 5.1 3.1Siemensstr. 9 Neu-Isenburg 9,600 9,300 900 1,112,400 1,251,500 17,200,000 65,000 3.5 0.3 11.7Stresemannallee 30 Frankfurt 9,000 7,700 0 1,357,200 1,438,400 26,400,000 441,300 4.2 3.7 29.0Taunusstr. 45 – 47 Frankfurt 7,300 5,500 700 1,076,900 1,235,900 29,500,000 66,300 3.4 0.2 17.5Wilhelminenstr. 25 Darmstadt 8,400 3,500 1,100 1,169,200 1,303,600 21,700,000 409,000 4.6 3.0 7.4Total 121,300 106,000 11,500 19,892,300 22,192,400 456,090,000 6,901,400 4.4 0.0 6.7
StuttgartBreitwiesenstr. 5 – 7 Stuttgart 25,100 20,100 0 3,091,100 3,878,600 60,100,000 506,200 5.5 3.1 8.7Eichwiesenring 1 Stuttgart 12,300 5,100 800 1,556,200 1,910,200 30,300,000 88,500 5.0 – 1.7 8.2Epplestr. 225 Stuttgart 107,200 101,700 1,500 16,609,400 17,181,600 260,000,000 10,395,700 2.9 – 1.3 10.6Handwerkstr. 4 Stuttgart 5,700 2,100 600 395,100 669,500 7,610,000 0 4.4 n/a n/aHanns-Klemm-Str. 45 Böblingen 14,900 14,100 0 1,897,200 1,966,900 30,000,000 560,700 5.5 0.0 9.5Hauptstätter Str. 65 – 67 Stuttgart 8,600 7,700 0 1,735,600 1,736,800 43,500,000 – 13,300 7.9 1.2 11.5Kupferstr. 36 Stuttgart 5,100 4,700 0 584,100 752,800 10,800,000 – 700 3.3 2.1 6.9Kurze Str. 40 Filderstadt 5,900 4,200 1,500 504,300 701,700 8,320,000 118,500 3.2 2.8 4.0Vaihinger Str. 131 Stuttgart 21,400 18,500 0 3,785,200 3,633,900 54,300,000 121,800 2.2 0.0 5.8Total 206,200 178,200 4,400 30,158,200 32,432,000 504,930,000 11,777,400 3.6 1.0 11.21) According to the year-end valuation by Savills Advisory Services.2) Own used property, partly classified as property, plant and equipment.
alstria Annual Company Report 2019 32

Investment portfolio
Asset City
Total lettable area
(m²) Office space
(m²) Vacancy
(m²)
Contractual annual net rent
(EUR) ERV 1)
(EUR)OMV 1)
(EUR)Capex(EUR)
Wault(years)
∆ Rental income (2018 / 19)
(%)
∆ OMV(2018 / 19)
(%)
BerlinAm Borsigturm 13 – 17, 19, 27 – 29, 31 – 33
Berlin 15,300 15,100 0 1,713,400 2,407,100 36,800,000 86,700 2.7 7.0 26.9
Am Borsigturm 44 – 46, 52 – 54 Berlin 10,700 8,400 700 991,200 1,448,100 22,300,000 105,600 3.3 13.7 17.4Darwinstr. 14 – 18 Berlin 22,500 21,400 0 3,412,100 5,603,800 107,400,000 203,100 7.1 0.7 19.3Hauptstr. 98 – 99 Berlin 3,000 2,500 200 416,500 671,800 13,200,000 0 2.0 n/a n/aHolzhauser Str. 175 – 177 Berlin 7,900 7,600 300 841,500 1,125,900 20,000,000 30,200 2.6 11.2 25.0Lehrter Str. 17 Berlin 2,400 2,300 0 337,300 657,600 10,900,000 0 1.3 n/a n/aMaxstr. 3a Berlin 3,800 3,700 0 448,100 539,000 11,800,000 20,600 2.1 n/a n/aRankestr. 172) Berlin 4,900 4,000 400 705,700 1,354,200 25,300,000 375,300 3.3 14.5 28.9Schinkestr. 20 Berlin 2,600 2,400 200 444,400 705,700 13,800,000 0 5.0 64.6 46.8Tempelhofer Damm 146 Berlin 3,600 1,700 300 586,100 730,300 11,300,000 202,000 4.9 7.8 8.7Uhlandstr. 85 Berlin 9,500 6,300 600 1,041,400 2,275,100 46,100,000 44,300 4.6 3.0 2.3Total 86,200 75,400 2,700 10,937,700 17,518,600 318,900,000 1,067,800 4.5 20.7 33.7
OthersArndtstr. 1 Hannover 10,900 7,300 0 1,272,400 1,341,600 29,500,000 – 32,200 12.6 5.0 12.5Balgebrückstr. 13 Bremen 4,200 3,800 600 296,600 373,700 3,090,000 2,000 3.6 – 13.8 – 34.9Friedrich-Scholl-Platz 1 Karlsruhe 26,800 26,800 0 2,877,700 3,246,000 51,000,000 2,349,400 6.0 10.0 7.4Werner-von-Siemens-Platz 1 Laatzen 21,000 18,000 3,900 1,411,000 2,134,800 16,500,000 – 26,400 0.7 – 21.6 – 3.2Total 62,900 55,900 4,500 5,857,700 7,096,100 100,090,000 2,292,800 6.0 – 1.9 4.81) According to the year-end valuation by Savills Advisory Services.2) Own used property, partly classified as property, plant and equipment.
alstria Annual Company Report 2019 33

Development assets
Asset City
Total lettable area
(m²) Office space
(m²) Vacancy
(m²)
Contractual annual net rent
(EUR) ERV 1)
(EUR)OMV 1)
(EUR)Capex(EUR)
Wault(years)
∆ Rental income (2018 / 19)
(%)
∆ OMV(2018 / 19)
(%)Besenbinderhof 41 Hamburg 5,000 3,500 5,000 0 1,198,100 14,600,000 1,177,600 0.0 n/a 128.1Carl-Reiß-Platz 1 – 5 Mannheim 17,500 14,800 17,500 0 3,130,500 21,000,000 2,561,800 0.0 n/a 39.3Carl-Reiß-Platz TG Mannheim 0 0 0 55,200 269,300 1,510,000 0 2.2 26.8 0.7Deutsche Telekom Allee 7 Darmstadt 24,700 23,300 0 3,646,700 3,911,300 39,700,000 – 16,500 0.2 1.0 – 2.5Georg-Glock-Str. 18 Düsseldorf 10,800 10,200 500 2,648,800 2,457,600 43,000,000 11,524,800 10.2 > 100 34.4Gustav-Nachtigal-Str. 3 Wiesbaden 18,500 16,500 0 6,078,300 3,585,400 63,700,000 7,356,600 16.0 > 100 225.0Gustav-Nachtigal-Str. 5 Wiesbaden 7,600 6,900 0 2,632,000 1,513,200 27,300,000 2,643,300 15.0 > 100 255.7Rotebühlstr. 98 – 100 Stuttgart 8,400 6,400 0 2,022,300 2,059,000 30,700,000 1,673,300 12.6 24.2 39.5Solmsstr. 27 – 37 Frankfurt 30,900 27,400 0 6,080,900 6,161,700 108,400,000 6,130,100 20.0 > 100 41.1T-Online-Allee 1 Darmstadt 60,600 54,000 15,500 6,460,600 11,451,000 137,800,000 1,857,600 6.0 – 48.9 – 1.6Total 184,000 163,000 38,500 29,624,800 35,737,100 487,710,000 34,908,600 11.8 54.2 34.81) According to the year-end valuation by Savills Advisory Services.
DOWNLOAD Portfolio overview (Excel) www.alstria.com/portfolio/
alstria Annual Company Report 2019 34

DEVELOPMENT 36 Our approach to internal growth
38 Case study: Gustav-Nachtigal-Str. 3 & 5
40 Case study: Geesthof
42 Current development projects
43 Refurbishment Candidates
Poststr. 11, Hamburg
Development project 2010 – 2011
Sold 2012
Profit: EUR 59.6 million
alstria Annual Company Report 2019 35
DEVELOPMENT

OUR APPROACH TO INTERNAL GROWTH
Jesko, you head up the development at alstria.
Can you briefly describe how your department is
structured?
We are specialists in the revitalization and extension of office buildings of all ages. Our experienced team of architects, engineers, urban planners and business economists has a wealth of experience in the field of retrofitting old assets. When we do so, we do not necessarily keep the office use, but always strive to achieve the best for the asset. We have indeed converted office assets into residential assets or hotels, and even into a theatre. The responsibility for success is always clearly defined: Every project manager leads his project from conception to successful completion.
Jesko LohrHead of Development
Many real estate companies concentrate on
transactions and the rental business, but engage
external service developers for their refurbishment
projects. alstria runs an integrated approach.
What is the advantage of doing the development
work in-house?
First of all, it is always interesting to keep the development margin for yourself, as long as you can manage the risk. As we only develop properties within our own portfolio, we know the buildings inside and out and we are in a posi-tion to design and plan the project while the asset is still yielding, which saves us a lot of time. Furthermore, every sale and subsequent purchase of a property costs alstria time and transactions costs.We save these costs and keep the building if the devel-oped product fits into our core portfolio. If we come to the conclusion that it makes sense to sell the building after the development, we are open to do that. The disposal proceeds and the realized gains usually fund the next devel-opment projects. Service development also has the decisive disadvantage that the service provider bears significantly less risk than the owner. This motivates risky decisions and is therefore not sustainable.
Development is an integral part of alstria’s
business model. Why do buildings need substantial
modernization from time to time?
Buildings are depreciating assets and they have a life cycle. While the structure can be used for more than 100 years, the technical lifetimes of windows, facades, heating and plumbing are more likely to be 30 – 40 years and of cool-ing, ventilation, lifts and lighting only 20 – 30 years. The requirements of the users regarding room concepts, func-tionality and equipment are changing even faster. In terms of design, 10 years is already a new generation. The aim of our development projects in existing buildings is to meet the requirements of tomorrow's tenants while con-tinuing to use the building substance in a sustainable and cost-saving manner.
alstria Annual Company Report 2019 36

alstria’s Development Team
Construction capacities are scarce and the prices
for construction services are rising. How does alstria
ensure that projects are completed on time and on
budget?
This is indeed an important point. Yields are compressing as property prices are growing faster than rents. To keep returns at an economically viable level, our clear target is to optimize rental growth in relation to capital expenditure, i. e. to realize an efficient yield on cost. This concept usually allows us to be better off than the market, but we cannot escape the price increases entirely. The overall economic forecast must be adequately reflected in the expected rent and cost planning of development projects. Our experience shows that we achieve good results by tailoring the spec-ifications to the respective core competencies of efficient specialist companies with whom we make early contact. For these individual contracts, services critical to deadlines can be prioritized at a very early stage in order to compensate for the longer order or delivery times.
How do you manage the risks?
Are the projects already pre-leased
before construction begins?
Long-term vacancies are one of the fundamental risks in project development. That is why we always aim to cre-ate a unique, convincing product. In the long term, this is considerably more valuable than a high pre-leasing rate. Our projects are the best proof of this. In fact, we usu-ally succeed in binding tenants at an early stage with our convincing product. However, these leasings often only take place after the start of construction. Despite our high product quality, we always assume target rents carefully and keep a close eye on the rental space during the plan-ning process. At the same time, our risks are manageable due to the project sizes, as we never have more than 10 % of our space under development at any moment in time. The average investment volume currently is EUR 30 million per project, which limits the risk. Last but not least, the comprehensive experience and interdisciplinary compe-tence of our employees in conjunction with clear project responsibility is also crucial for risk management.
alstria Annual Company Report 2019 37

Recently, our Frankfurt team signed a lease
agreement for 26,000 m² with a term of 15 years for
Gustav-Nachtigal-Str. 3 & 5. This is a great success
because the campus is now fully leased.
Yes, indeed. Now we can start the construction work. The buildings in Gustav-Nachtigal-Str. 3 and 4 have been part of our portfolio since 2008. In combination with the neigh-boring building Gustav-Nachtigal-Str. 5, which we acquired last year, we were able to market a campus with 26,000 m² of leasable space. Our colleagues in Frankfurt have been in contact with the Federal Agency for Real Estate regarding a lease to a major federal institution for the past two years. In the case of such a tenant, negotiations are complex and lengthy due to the involvement of various authorities and the complex development measures. But all these efforts have paid off, because in the end we have more than tripled the annual rent on the buildings and will realize a return of more than 9 % for our shareholders.
Markus WydmuchDeveloper
Verena IntorpSenior Developer
With an expected investment volume of EUR 63 million, the project at Gustav-Nachtigal-Str. 3 & 5 in Wiesbaden is the largest development project in alstria’s corporate history. Verena and Markus, our responsible project managers, give more insight into the project.
CASE STUDY: GUSTAV-NACHTIGAL-STR. 3 & 5 WIESBADEN
alstria Annual Company Report 2019 38

How difficult is it to consider the tenants’ needs in a
project like this?
A high-quality tenant such as the federal agency usually expresses strict requirements in terms of its real estate needs. In a project like this one, we tailor our project to the tenant’s needs, and have a joint definition of the final product with the tenant's teams. The final rent that will be paid by the tenant is not only a function of the location of the asset, but also a function of the quality of the space that we have produced, and the duration of its commit-ment to the space.
We have already successfully finalized extensive
developments in recent years. What is the approach
to this special project?
In general, every revitalization should create a unique prop-erty. The tenant should recognize the building through its significance and individual appearance. This is how we stand out from our competitors. The project in Wiesbaden is a little different because the function of the building is the abso-lute focus here. Our flexible development concept allows us to successfully implement even the highest requirements in terms of technology. We are in close coordination with the tenant in order to optimally realize his specifications together with the external service providers. Through close exchange with all parties involved, we have developed a common understanding of the tasks and approaches and are well on the way to completing this demanding project successfully and on time.
Since you now have planning security, you will face
special challenges with the refurbishment of the
building. What makes this project so special?
We bring the buildings optically and technically up to date. Sustainability plays a decisive role here, as the German gov-ernment intends to make the buildings climate-neutral by 2050. Fire protection is also an important issue. In addition, tenants' quality demands have risen sharply in recent years, and in this case the requirements for the building itself and the embedded technology are particularly high. Usually the ratio here is 70 % (building) to 30 % (technology), but in this project it is 50 % to 50 %. For example, we will install four times as many sockets and data connections at each workstation as is normally the case.
alstria Annual Company Report 2019 39

CASE STUDY: GEESTHOF HAMBURG
Klara and Matthias, could you please give us some
more details about the project?
The Geesthof is a listed property, which was occupied by the City of Hamburg until 2018. The last substantial refurbishment took place more than 30 years ago and the Second World War caused considerable damage to the building, so that over the last 100 years the building has lost its original appearance. The move out of the City of Hamburg now gives us the opportunity to reconstruct and comprehensively modernize this historic building in the heart of Hamburg. The Geesthof has been part of Hamburg's history since the 1920s. We started the project with the aim of giving the building back its former look and ensuring a sustainable use over the next decades.
Built in 1927, the ‘Geesthof’ in the heart of Hamburg impresses with its architecture, which is typical of the 1920s. In 2018, we started the refurbishment of the his-toric building and today the project managers Klara and Matthias give us some exclusive insights behind the facade of the Geesthof.
The development of the Geesthof is quite complex.
How did you prepare for the construction phase?
In simple terms, we started looking at the options the building offers. For this purpose, we carried out a feasibility study. Within the scope of this study, we examined which types of use the Geesthof provides due to its location and structural characteristics. Taking these aspects and history into account, we then designed a concept for how the Geesthof should look after modernization.
Klara MeisterDeveloper
Matthias LehmannSenior Developer
alstria Annual Company Report 2019 40

The appearance of the Geesthof is impressive
with its expressionistic front, south-eastern facade
in Bauhaus style and art nouveau elements in the
interior. Were these elements included in the
concept?
Yes, of course. Due to the historical appearance, we have developed a concept in the style of the 1920s, which inte-grates influences from the art of that time. The charm of the existing building structure is reinterpreted and combined with modern elements. During the Second World War, the Geesthof was badly damaged, losing almost two floors and its distinctive crown. We will put the crown back on the building and return it to the original form it has lost. At this point, we also see our duty as a responsible citizen, as we have a direct impact on the appearance of the cities in which we invest.
In August 2018, the City of Hamburg moved out
of the Geesthof. Was this the starting signal for
the construction work?
Yes, we were in a position to start right away because we had developed a coherent concept, the approval planning and the building application had been submitted and the contractors were ready. This is important because we want to keep vacancies in our buildings as short as possible. As we are planning an open office concept, we started with the demolition of the non-load-bearing walls. Here we found a historical wall painting from the 1920s, created by the artist Otto Fischer-Trachau, whose works during the Nazi era belonged to the so-called degenerate art. We included the painting in our planning concept and it will be professionally restored. As the mural, like many other parts of the Geesthof, is under a preservation order, we coordinate closely with the relevant authorities. The cooperation is excellent, and the monument protection authority supports us in our project to give the Geesthof back its original appearance.
Can you already foresee when the development will
be completed and the Geesthof will be filled with life
again?
The complexity of the Geesthof with all its special archi-tectural characteristics is very exciting and challenging to implement. In addition to the buildings’ historical value for the cityscape, we also have clear financial targets. We plan to invest EUR 11 million into the building. The con-siderable improvement in the quality of the space will allow for significantly higher rents, so that we will achieve a return of around 6 %. Our team is working with great commitment at the Geesthof and we are aiming for com-pletion in mid-2021.
alstria Annual Company Report 2019 41

CURRENT DEVELOPMENT PROJECTS
Georg-Glock-Str. 18, Düsseldorf
Lettable area: 10,800 m²Post refurbishment rent: EUR 21.40 per m²
Carl-Reiß-Platz 1 – 5, Mannheim
Lettable area: 17,500 m²Letting status: vacant
T-Online-Allee 1, Darmstadt
Lettable area: 60,600 m²In-place rent: EUR 12.00 per m²
Rotebühlstr. 98 – 100, Stuttgart
Lettable area: 8,400 m²Post refurbishment rent: EUR 20.10 per m²
Solmsstr. 27 – 37, Frankfurt
Lettable area: 30,900 m²Post refurbishment rent: EUR 16.40 per m²
Deutsche-Telekom-Allee 7, Darmstadt
Lettable area: 24,700 m²In-place rent: EUR 12.30 per m²
alstria Annual Company Report 2019 42

REFURBISHMENT CANDIDATES – MID-TERM
Immermannstr. 40, Düsseldorf
Lettable area: 8,200 m²In-place rent: EUR 13.20 per m²
Garstedter Weg. 13, Hamburg
Lettable area: 3,600 m²In-place rent: EUR 9.10 per m²
Maxstr. 3a, Berlin
Lettable area: 3,800 m²In-place rent: EUR 9.80 per m²
Taunusstr. 45 – 47, Frankfurt
Lettable area: 7,300 m²In-place rent: EUR 13.70 per m²
Lehrter Str. 17, Berlin
Lettable area: 2,400 m²In-place rent: EUR 11.70 per m²
Heidenkampsweg 44 – 46, Hamburg
Lettable area: 4,500 m²In-place rent: EUR 8.90 per m²
alstria Annual Company Report 2019 43

REFURBISHMENT CANDIDATES – LONG-TERM
Alter Steinweg 4, Hamburg
Lettable area: 32,000 m²In-place rent: EUR 11.70 per m²
Karlstr. 123 – 127, Düsseldorf
Lettable area: 5,700 m²In-place rent: EUR 11.70 per m²
Sonninstr. 24 – 28, Hamburg
Lettable area: 22,200 m²In-place rent: EUR 9.80 per m²
Am Hauptbahnhof 6, Frankfurt
Lettable area: 7,700 m²In-place rent: EUR 18.50 per m²
Uhlandstr. 85, Berlin
Lettable area: 9,500 m²In-place rent: EUR 9.80 per m²
An den Dominikanern 6, Cologne
Lettable area: 27,500 m²In-place rent: EUR 10.30 per m²
alstria Annual Company Report 2019 44

FINANCIALS
46 P & L and FFO
47 Cash flow
48 Balance sheet
50 Financial debt
51 Outlook 2020
52 EPRA KPI’s
Große Bleichen 23 – 27, Hamburg
Development project 2014 – 2016
Sold 2017
Profit: EUR 58.3 million
alstria Annual Company Report 2019 45
FINANCIALS

FFO margin up to 60.0 % In 2019, the operating performance of our company was in line with our plans. Due to the disposal of properties and a corresponding reduction of our lettable area, revenues fell slightly by EUR 5.7 million, from EUR 193.2 million to EUR 187.5 million in the course of 2019. The consol-idated net result increased to EUR 581.2 million in 2019 (EUR 527.4 million in 2018) and was substantially impacted by the revaluation result of our property portfolio.
The FFO (after minorities) amounted to EUR 112.6 million, which is in line with the forecasted level of EUR 112.0 mil-lion. The decline by EUR 2.1 million compared to the prior year period is directly linked to the lower revenue base but was partly compensated by lower financing costs. However, the FFO margin increased to 60.0 % in 2019 and was up by 60 bps compared to the prior year period.
FFO adjustments 2019Table 17 provides information on the adjustments we made to reconcile our P&L into our FFO. In general, non-cash and non-recurring items do not contribute to the FFO, as the purpose of this number is to give a clear picture of the oper-ating performance of the company. The most meaningful adjustments we made are the revaluation result (non-cash) and the disposal gain (non-recurring), but also the release of accruals (EUR 10.5 million) and other one-off items (EUR 3.2 million), which are included in other operating income. Other operating expenses were adjusted by one-off items amounting to EUR 5.2 million and non-cash items of EUR 8.5 million related to the increase of the minority share in alstria office Prime Portfolio GmbH & Co. KG.
Table 17: Consolidated income statement for the period from January 1 to December 31, 2019
2019 2018
EUR k P&L Adjustments FFO P&L Adjustments FFO Revenues 187,467 0 187,467 193,193 0 193,193Service charge income 37,038 0 37,038 39,160 0 39,160Real estate operating expenses – 61,601 0 – 61,601 – 63,285 0 – 63,285Net rental income 162,904 0 162,904 169,068 0 169,068Administrative expenses – 9,545 1,106 – 8,439 – 8,834 794 – 8,040Personnel expenses – 18,441 2,544 – 15,897 – 15,910 1,304 – 14,606Other operating income 16,185 – 13,644 2,541 10,656 – 9,728 928Other operating expenses – 15,230 13,824 – 1,406 – 13,746 12,752 – 994Net result from fair value adjustments on investment property 454,767 – 454,767 0 398,954 – 398,954 0Gain on disposal of investment property 17,350 – 17,350 0 14,887 – 14,887 0Net operating result 607,990 – 468,287 139,703 555,075 – 408,719 146,356Net financial result – 27,460 3,331 – 24,129 – 29,497 1,238 – 28,259Share of the result of joint ventures – 170 126 – 44 – 70 0 – 70Net result from fair value adjustments on financial derivatives 0 0 0 2,452 – 2,452 0Pre-tax income (EBT) 580,360 – 464,830 115,530 527,960 – 409,933 118,027Income tax expense 861 – 861 0 – 546 546 0Consolidated profit / loss for the period 581,221 – 465,691 115,530 527,414 – 409,387 118,027Minorities 0 – 2,959 – 2,959 – 3,297 – 3,297Consolidated profit after minorities / Funds from operations (FFO) 581,221 – 468,650 112,571 527,414 – 412,684 114,730Maintenance capex – 14,276 – 11,924Adjusted funds from operations (AFFO) 98,295 102,806
Number of shares outstanding (k) 177,593 177,416FFO per share (EUR) 0.63 0.65AFFO per share (EUR) 0.55 0.58
P&L AND FFO
alstria Annual Company Report 2019 46

CASH FLOW
Table 18: Consolidated statement of cash flows for the year ended December 31, 2019
EUR k 2019 20181. Cash flows from operating activitiesConsolidated profit for the period 581,221 527,414Interest income – 575 –745Interest expense 28,035 30,241Result from income taxes – 861 546Unrealized valuation movements –445,940 –389,465Other non-cash income (–) / expenses (+) 663 5,616Gain (–) / loss (+) on disposal of investment properties –17,350 –14,887Depreciation and impairment of fixed assets (+) 1,106 794Decrease (+) / Increase (–) in trade receivables and other assets that are not attributed to investing or financing activities 867 –1,055Decrease (–) / increase (+) in trade payables and other liabilities that are not attributed to investing or financing activities – 1,093 –369Cash generated from operations 146,073 158,090Interest received 814 745Interest paid –24,674 –26,658Income taxes paid – 520 –13,163Net cash generated from operating activities 121,693 119,014
FFO in line with operating cash flowThe FFO of a real estate company should be comparable to its operating cash flow. In 2019, our operating cash flow was EUR 122.0 million, slightly higher than the FFO gen-erated (EUR 112.6 million), thereby underscoring the conservative character of our FFO calculation. In recent years, both figures have developed to square perfectly with our expectations. Our operating cash flow over the past five years was at 101.4 % of our FFO.
EUR k 2019 20182. Cash flows from investing activities
Acquisition of investment properties –164,915 –253,119
Proceeds from sale of investment properties 139,777 119,200Payment of transaction cost in relation to the sale of investment properties –179 –139Acquisition of other property, plant and equipment –287 –2,145Proceeds from the equity release of interests in joint ventures 7,350 0Payments for investment in financial assets –238,864 0Proceeds from the repayment of financial assets 36,567 0Net cash used in / generated from investing activities – 220,551 – 136,2033. Cash flows from financing activitiesCash received from cash equity contributions 0 193,072Payment of transaction costs of issue of shares 0 –2,611Payments for the acquisition of minority interests –73 –101Distributions on limited partnerships of minority shareholders –1,947 –1,941Proceeds from the issuing of bonds and borrowings 393,596 60,000Payments of transaction costs / redemption of leasing obligations – 1,141 –151Payments of dividends –92,257 –92,170Payments of the redemption of bonds and borrowings –34,000 –108,088Net cash used in financing activities 264,178 48,0104. Cash and cash equivalents at the end of the periodChange in cash and cash equivalents (subtotal of 1 to 3) 165,320 30,821Cash and cash equivalents at the beginning of the period 132,899 102,078Cash and cash equivalents at the end of the period 298,219 132,899
alstria Annual Company Report 2019 47

BALANCE SHEET
Value of investment properties up by 12.7 % The balance sheet of our company is as simple and transpar-ent as it can be. All real estate and associated land are 100 % owned by the company. These real estate assets are on the assets side of our balance sheet and currently account for 89 % of our balance sheet total (including owner- occupied space). Cash / cash equivalents and financial assets make up 10 %, and other assets account for just 1 % of the bal-ance sheet total. The increase of the balance sheet total by EUR 848.1 million to EUR 5.0 billion as per December 31, 2019, was mainly driven by the increase of our investment properties, which grew by 12.7 % to 4.4 billion in 2019, reflecting revaluation gains and capital expenditure. Cash and financial assets were up by EUR 365 million following the placement of a capital market bond in September 2019. The proceeds will serve to repay the maturing debt coming up in 2020 and 2021 in the amount of EUR 363.8 million.
On the liabilities side, the company’s equity is the largest item, representing 63 % of the balance sheet total. Finan-cial liabilities account for 34 % and other liabilities for 3 % of the balance sheet. Total equity was up by 18.3 % to EUR 3.2 billion as a result of net profit contribution in 2019. Financial debt was temporarily up by EUR 390.0 million due to the bond placement. With the repayment of the maturing debt in 2020 / 2021, the level of debt will substantially decline.
Table 19: Consolidated balance sheet as of December 31, 2019Assets
EUR k Dec. 31,
2019Dec. 31,
2018Non-current assetsInvestment property 4,438,597 3,938,864Equity-accounted investments 1,070 8,589Property, plant and equipment 19,055 18,972Intangible assets 232 349Financial assets 39,108 36,737Total non-current assets 4,498,062 4,003,511
Current assetsTrade receivables 3,877 6,865Financial assets 199,750 0Tax receivables 1,231 43Other financial receivables 8,601 8,314Cash and cash equivalents 298,219 132,899Assets held for sale 19,588 29,620Total current assets 531,226 177,741
Total assets 5,029,328 4,181,252
Equity and liabilities
EUR k Dec. 31,
2019Dec. 31,
2018EquityShare capital 177,593 177,416Capital surplus 1,448,709 1,538,632Retained earnings 1,545,768 964,554Revaluation surplus 3,485 3,485Total equity 3,175,555 2,684,087
Non-current liabilitiesLiabilities minority interest 70,504 64,013Long-term loans, net of current portion 1,661,080 1,336,090Other provisions 1,226 1,275Other liabilities 11,532 5,010Total non-current liabilities 1,744,342 1,406,388
Current liabilitiesLiabilities minority interest 24 47Short-term loans 50,590 14,171Trade payables 4,611 4,400Profit participation rights 457 530Liabilities of current tax 5,793 5,945Other provisions 2,505 5,477Other current liabilities 45,451 60,207Total current liabilities 109,431 90,777Total liabilities 1,853,773 1,497,165
Total equity and liabilities 5,029,328 4,181,252
alstria Annual Company Report 2019 48

Solid balance sheet As of December 31, 2019, our G-REIT equity ratio reached a new record level of 70.9 % and clearly exceeded the legally required figure of 45 %. At the same time, our net LTV fell further to 27.1 %.
IFRS NAV per share + 18.3 %Our IFRS net asset value per share rose by EUR 2.77 to EUR 17.88 as of the reporting date. The revaluation of our properties resulted in an increase of EUR 2.56 per share, and the operating profit covered the dividend payment in May 2019.
Table 20: Balance sheet ratios
EUR k 2019 2018Investment properties 4,438,597 3,938,864Carrying amount of owner occupied properties 17,217 17,585Assets held for sale 19,588 29,620Equity value of JV (A) 1,070 8,589Carrying amount of immovable assets (B) 4,476,472 3,994,657Adjustments to fair value of owner occupied properties 5,240 1,144Fair value of immovable assets (C) 4,481,712 3,995,801Cash on balance sheet (D) 497,969 132,899IFRS equity (E) 3,175,555 2,684,087Interest bearing debt (F) 1,711,700 1,345,700
G-REIT equity ratio (%) (E) / (B) 70.9 67.2Corporate LTV (%) (F) / (B) 38.2 33.8Corporate Net LTV (%) (F-D) / (B-A) 27.1 30.4
Table 21: Movement in net asset value (NAV)
EUR kEUR
per shareIFRS NAV as of Dec. 31, 20181) 2,684,087 15.11Portfolio revaluation 454,767 2.56Profit on disposals 17,350 0.10Adjusted profit for the year 109,104 0.61Dividend payment – 92,257 – 0.52Other adjustments 2,504 0.01
IFRS NAV as of Dec. 31, 2019 3,175,555 17.88EPRA NRV as of Dec. 31, 20192) 3,492,621 19.67EPRA NTA as of Dec. 31, 20192) 3,180,892 17.91EPRA NDV as at Dec. 31, 20192) 3,128,097 17.611) Fully diluted.2) Calculation see table 27, page 54.
BALANCE SHEET RATIOS
alstria Annual Company Report 2019 49

FINANCIAL DEBT
Proactive debt management Over the course of 2019, we continued to actively shape the structure of our financial liabilities. The main event on the debt side was the refinancing of the capital market bond we issued in 2015 with a volume of EUR 327 million (coupon: 2.25 %). This bond will be redeemed toward the end of 2020. Given the favorable refinancing conditions, we decided for an early issuance of a new bond, which had a volume of EUR 400 million at a coupon of 0.5 %. The lower cost of debt will substantially reduce our financing expenses going forward.
Net debt / EBITDA of 8.5 Besides the LTV, the net debt / EBITDA is a widely accepted KPI with regard to the indebtedness of a real estate company. In the current stage of the cycle after a multi-year upswing in real estate prices, we regard the net debt / EBITDA as an important indicator, because it is not impacted by the volatility of property valuation. Our net debt / EBITDA was roughly stable at 8.5 and therefore meets our target level as per December 31, 2019. A second debt indicator that is not blurred by property valuation and therefore is a sensible indicator for the indebtedness of a real estate company is the net debt per m², which stood at EUR 804 as per December 31, 2019.
Table 22: Cash cost of debt1) as of December 31, 2019
Nominal amount(EUR k)
Cost of debt (%)
Average maturity
(years)Bonds 1,075,000 1.3 5.7Bank debt 195,900 1.1 6.3Schuldschein 77,000 2.5 5.0Total 1,347,900 1.3 5.8
Graph 8: Sources of financing1)
2020 20222021 2023 2024 2025 2026 2027 2028
400
350
300
250
200
150
100
50
0
Graph 9: Debt maturity profile1)
Schuldschein Bank debt Bonds
EUR million
2017 2018 2019
Graph 7: Net debt / EBITDA
9.1 8.3 8.5
Equity EUR 3,176 m
Debt EUR 1,348 m
Schuldschein EUR 77 mBank debt EUR 196 m
Bonds EUR 1,075 m
1) Assuming repayment of Schuldschein (EUR 37 m) and bond (EUR 327 m) maturing in 2020/21 using available cash.
alstria Annual Company Report 2019 50

OUTLOOK 2020
Based on the current portfolio, we expect revenues of EUR 179 million and an FFO of EUR 108 million for the 2020 fiscal year. The slight year-on-year decline in revenues is mainly due to the disposal of properties. With regard to our transaction activities, we will continue to take advan-tage of the strong investment market in Germany and most likely remain a net seller in 2020. However, the new leases signed in 2019 are a solid foundation for our top line and bottom line growth in the years to come.
Lower revenues will also have an impact on our operating profit (FFO) in 2020. However, declining cost will partially compensate for the loss in rental income. Our FFO margin is expected to exceed previous years level.
This report contains forward-looking statements about expected developments. These statements are based on current assessments and naturally subject to risks and uncer-tainties. Actual events may differ from those described herein.
Carl-Reiß-Platz 1 – 5
Mannheim
alstria Annual Company Report 2019 51

EPRA earningsEarnings reported in the income statement as required under IFRS do not provide stakeholders with the most relevant information on the operating performance of real estate companies. For real estate investment companies, a key measure of a company’s operational performance and the extent to which its dividend payments to shareholders are underpinned by earnings is the level of income arising from operational activities. Unrealized changes in valua-tion, gains or losses on disposals of properties and other non-operating items are therefore taken out.
EPRA vacancy Vacancy disclosures are not consistently defined in the real estate industry. Consistent disclosure of vacancy measures will always be a challenge between companies because property markets around Europe have different charac-teristics and each measure can serve a different purpose. To encourage the provision of comparable and consistent disclosure of vacancy measures, EPRA has identified a single vacancy measure that can be clearly defined and is shown in table 24.
Table 23: EPRA earnings & earnings per share
EUR k 2019 2018Earnings per IFRS income statement 581,221 527,414(a) Changes in value of investment properties, development
properties held for investment and other interests – 454,767 – 398,954(b) Profits or losses on disposal of investment properties, devel-
opment properties held for investment and other interests – 17,350 – 14,887(c) Tax on profits or losses on disposals 0 0(d) Changes in fair value of financial instruments 2,731 – 2,452(e) Acquisition costs on share deals 250 0(f) Deferred tax in respect to EPRA adjustments 0 0(g) Adjustments (a) to (c) above in respect of joint ventures 0 0(h) Non-controlling interest on adjustments – 3,141 – 2,813EPRA earnings 108,695 108,308EPRA earnings per share (EUR) 0.61 0.62
Table 24: EPRA vacancy rate
EUR k Dec. 31, 2019 Dec. 31, 2018Estimated rental value (ERV) 212,728 220,912ERV of vacant space 17,263 21,435Vacancy rate (%) 8.1 9.7
EPRA KPI’S
alstria Annual Company Report 2019 52

EPRA NAV and EPRA NNNAVThe target of the EPRA NAV is to provide stakeholders with the most relevant information on the fair value of the assets and liabilities within a true real estate investment company with a long-term investment strategy. It adjusts the company’s IFRS NAV. Adjustments are made to include properties and other investment interests at fair value and to exclude certain items that are not expected to crystallize in a long-term investment property business model.
New EPRA NAV metrics However, the evolution of property companies into actively managed entities, including non-property operating activ-ities, has resulted in more active ownership, higher asset turnover, and the shifting of balance sheet financing from traditional bank lending into capital markets. Therefore, EPRA has set up a new standard on NAV reporting, con-taining three different metrics (see table 26).
Table 25: EPRA NAV per share
EUR kDec. 31,
2019Dec. 31,
2018NAV (IFRS equity ex. minority interest) 3,175,555 2,684,087Share ‘A’ (outstanding shares) 177,593 177,416NAV per share (EUR) 17.88 15.13Effect of exercise of options, convert-ibles and other equity interests 0 0‘New’ Shares B 0 0Share A + B 177,593 177,416Diluted NAV, after the exercise of options, convertibles and other equity interests 3,175,555 2,684,087Dilluted NAV per share (EUR) 17.88 15.13Revaluation of investment properties (if IAS 40 cost option is used) 5,746 1,143Fair value adjustments of financial instruments – 177 394EPRA NAV 3,181,125 2,685,624EPRA NAV per share (EUR) 17.91 15.14Fair value of financial instruments – 177 – 394Fair value of debt – 53,204 – 30,619EPRA NNNAV 3,127,744 2,654,611EPRA NNNAV per share (EUR) 17.61 14.96
Table 26: EPRA cost ratio
EUR k 2019 2018Administrative / operating expense line per IFRS income statement –52,904 –48,898Service fees / recharges 355 28Management fees 5,065 5,594Share of joint ventures expenses –160 –79Exclude:Investment Property Depreciation 0 298EPRA Costs (including direct vacancy costs) (A) –47,644 –43,057Direct vacancy costs 8,077 7,482EPRA Costs (excluding direct vacancy costs) (B) –39,567 –35,575Gross Rental Income less ground rents 187,467 193,193Less: service fee and service
charge costs components of gross rental income 5,065 –5,594
Gross rental income (C) 182,402 187,599EPRA cost ratio (%) (including direct vacancy costs) (A / C) 26.1 23.0EPRA cost ratio (%)(excluding direct vacancy costs) (B / C) 21.7 19.0
alstria Annual Company Report 2019 53

New EPRA NAV reporting standard The objective of the EPRA Net Reinstatement Value measure is to highlight the value of net assets on a long-term basis. Assets and liabilities that are not expected to crystallize in normal circumstances such as the fair value movements on financial derivatives and deferred taxes on property valua-tion surpluses are therefore excluded. Since the aim of the metric is to also reflect what would be needed to recreate the company through the investment markets based on its current capital and financing structure, related costs such as real estate transfer taxes are included.
The underlying assumption of the EPRA Net Tangible Assets measure assumes entities buy and sell assets, thereby crys-tallizing certain levels of deferred tax liability.
Shareholders are interested in understanding the full extent of liabilities and resulting shareholder value if company assets are sold and / or if liabilities are not held until maturity. For this purpose, the EPRA Net Disposal Value provides the information with a scenario where deferred tax, financial instruments and certain other adjustments are calculated to the full extent of their liability, including tax exposure not reflected in the balance sheet, net of any resulting tax. This measure should not be viewed as a ‘liquidation NAV’ because, in many cases, fair values do not represent liquidation values.
Table 27: New EPRA NAV metrics
EUR k EPRA NRV EPRA NTA EPRA NDV IFRS equity attributable to shareholders 3,175,555 3,175,555 3,175,555Include / exclude I) Hybrid instruments 0 0 0Dilluted NAV 3,175,555 3,175,555 3,175,555
Include:II. a) Revaluation of IP (if IAS 40 cost option is used) 5,746 5,746 5,746II. b) Revaluation of IPUC (if IAS 40 cost option is used) 0 0 0II. c) Revaluation of other non-current investments 0 0 0III.) Revaluation of tenent leases held as finance leases 0 0 0IV.) Revaluation of trading properties 0 0 0Dilluted NAV at fair value 3,181,301 3,181,301 3,181,301
Exclude:V) Deferred tax in relation to fair value gains of IP 0 0 –VI) Fair value of financial instruments – 177 – 177 –VII) Goodwill as a result of deferred tax 0 0 0VIII. a) Goodwill as per the IFRS balance sheet – 0 0VIII. b) Intangibles as per the IFRS balance sheet – – 232 –
Include:IX) Fair value of fixed interest rate debt – – – 53,204X) Revaluation of intangibles to fair value 0 – –XI) Real estate transfer tax / acquisition costs 311,497 0 –
NAV 3,492,621 3,180,892 3,128,097Fully diluted number of shares 177,593 177,593 177,593NAV per share 19.67 17.91 17.61
alstria Annual Company Report 2019 54

EPRA Yield There is variation in the nature and extent of yield disclosures and yield measurements used are not consistently defined. Consistent disclosure of yield measurements such as net initial yield, ‘topped-up’ yields and equivalent yields will always be a challenge between companies because each measure serves a different purpose depending on the user and the local property market. To encourage the provision of comparable and consistent disclosure of yield measures across Europe, EPRA has defined two yield measures shown in table 28.
EPRA NIY is calculated as the annualized rental income based on the cash rents passing at the balance sheet date minus non-recoverable property operating expenses, divided by the gross market value of the property. The EPRA ‘topped-up’ NIY is calculated by making an adjust-ment to the EPRA NIY in respect of the expiration of rent-free periods (or other unexpired lease incentives such as discounted rent periods and step rents).
Table 28: EPRA Yield
EUR kDec. 31,
2019Dec. 31,
2018Portfolio value Investment properties (on balance sheet) 4,438,597 3,938,864Trading property 19,588 29,620Development assets – 487,710 – 187,830Completed portfolio 3,970,475 3,780,654Acquisition cost 258,081 245,743Gross up completed property portfolio valuation (A) 4,228,556 4,026,397IncomeContractual rent 208,332 196,967Contractual rent developments – 29,625 – 2,175Contractual rent (excluding developments) 178,707 194,792Rent-free periods – 19,391 – 12,524Annualized cash passing rent 159,316 182,268Property outgoings – 17,871 – 19,479Annualized net cash rents (B) 141,445 162,789Rent free periods 19,391 12,524’Topped-up‘ net annulized rent (C ) 160,836 175,313EPRA Net initial yield (%) (B/A) 3.3 4.0EPRA ’topped-up’ Net initial yield (%) (C/A) 3.8 4.4
Elisabethstr. 5 – 11
Düsseldorf
alstria Annual Company Report 2019 55

57 Share price performance
58 Shareholder structure
59 IR activities
ALSTRIA’S SHARE
Ernst-Merck-Str. 9, Hamburg
Development project 2016 – 2018
Yield on cost: 5.8 %
alstria Annual Company Report 2019 56
SHARE

42.5 % total shareholder return in 2019alstria measures the performance of its shares based on the development of total shareholder return (TSR). The TSR includes the development of the share price plus the dividend reinvested. For 2019, the TSR of alstria's share was 42.5 % and therefore performed much better than most of its peers and also clearly beat the broad market. The strong performance was primarily a reflection of the strong NAV growth. alstria's share clearly outperformed the broad German stock indices in 2019 (DAX30: 25.5 %, MDAX: 31.2 %) and the European sector indices (EPRA Europe: 29.4 %). As the real estate business requires a long-term perspective, multi-year performance is an important indicator of the attractiveness of our share. Over the past five years (2015 – 2019), the average annual TSR has been 14.4 %, once again demonstrating the strength of our busi-ness model in a strong real estate market.
Table 29: Key share dataISIN DE000A0LD2U1Symbol AOXMarket segment Financial Services Industry group Real Estate Prime sector Prime Standard, Frankfurt Indices FTSE EPRA / NAREIT Global Real Estate Index Series,
FTSE EPRA / NAREIT Europe Real Estate Index Series, MDAX, RX REIT Index, GPR 250 Index Series, GPR 250 REIT Index Series, EURO STOXX 600
Designated Sponsor M. M. Warburg & CO
January 2019 December 2019
80
100
120
140
160
%
60
alstria EPRA Europe Index EPRA Global REITs Index
Graph 10: Share price development
SHARE PRICE PERFORMANCE
alstria Annual Company Report 2019 57

100 % free float alstria’s shares are 100 % free float as defined by Deutsche Börse. More than 95 % of the outstanding shares are held by institutional investors, mainly large pension funds and specialized real estate investors. At the end of 2019, alstria's top 20 investors held approximately 60 % of the outstand-ing shares. Geographically, approximately 24 % of alstria's shareholders are located in the USA / Canada and 21 % in Asia. European investors hold 55 % of the shares, of which 16 % are held by shareholders domiciled in France, 10 % in the UK, 8 % in Germany and 6 % in the Netherlands. Our international shareholder structure is a consequence of our REIT status, as REIT is a globally established brand for listed real estate companies.
Coverage by analystsThe interest of analysts and financial journalists in the development of alstria office REIT-AG remained high in 2019. A total of 19 investment banks and brokers regularly reported on the development of the company. alstria thus continues to be one of the best-covered companies in the German MDAX.
Table 30: Key share data
Dec. 31, 2019 Dec. 31, 2018Number of shares thousand 177,593 177,416thereof outstanding thousand 177,593 177,416Closing price1) EUR 16.75 12.20Market capitalization EUR k 2,974,690 2,164,475Free float % 100.0 100.0
2019 2018Average daily trading volume (all exchanges) EUR k 8,797 9,935thereof XETRA EUR k 6,049 5,042Share price: high1) EUR 17.60 13.49Share price: low1) EUR 11.91 11.871) Xetra closing share price.
SHAREHOLDER STRUCTURE
100 Free-Float
%
alstria Annual Company Report 2019 58

BostonToronto
Chicago
Helsinki
London
ParisFrankfurt
Zurich
Amsterdam
Brussels
Munich
New York
Hamburg
IR ACTIVITIES
260 meetings with investors In 2019, alstria's investor relations activities remained focused on informing investors, financial analysts and the business press about the company's performance and the market environment. Management roadshows and par-ticipation in numerous investment conferences in Europe and the USA ensured a continuous dialogue between the company and its shareholders. Over the course of the year, we held more than 260 meetings with investors and ana-lysts in Germany and abroad. In addition to management personnel, our supervisory board was also involved in the
roadshow activities and available to investors for discussions on all aspects of corporate governance. As capital market bonds with a volume of EUR 1 billion are the main source of our debt financing, the special information requirements of our investors in the bond market are also an integral part of our investor relations work. In addition to our presence at roadshows and conferences, we conducted several prop-erty tours with analysts and shareholders, particularly in Hamburg, Frankfurt and Düsseldorf.
Digital communication with investors has always played an important role for alstria. All interested parties are invited to participate in the presentation of our annual and quar-terly results via live stream on alstria's website. All relevant information is available on our website ww.alstria.com/investor/
alstria Annual Company Report 2019 59

CORPORATE SOCIAL RESPONSIBILITY
61 Integral part of our business
62 Green dividend Kaiser-Wilhelm-Str. 79 – 87, Hamburg
Development project 2013 – 2014
Yield on cost: 7.0 %
alstria Annual Company Report 2019 60
CSR

Sustainability is at the core of what we doSustainability is an integral part of our business strategy, governance, and operations. The integration of sustainability into the design, construction, and operation of our proper-ties helps us to ensure that our buildings continue to meet the needs of their tenants and surrounding communities while also minimizing our impact on the environment.
We take responsibility for climate change Toward decarbonizing our portfolio, we managed to procure 100% renewable energy for the electricity that we con-trol and achieved our RE100 target in 2018. Our business activities also emitted 42% less carbon emissions com-pared to the base year 2013. Finally, our comprehensive sustainability strategy was recognized with numerous ESG ratings, including MSCI, CDP, and ISS-oekom.
For further information, please visit the sustainability sec-tion of our website and our sustainability report 2018 / 19. www.alstria.com/sustainability/
measures 13,635 m²
accommodates8 tenants
emits per year 325 tCO2e
consumes123 kWh
energy per m²/yearoffers
150 parkingspaces
ALSTRIA BUILDINGA TYPICAL
INTEGRAL PART OF OUR BUSINESS
Reporting date: Dec. 31, 2018.
alstria Annual Company Report 2019 61

Shareholders are asked to cast their vote for the payout or against the payout (majority rule apply).
€€
A Euro amount needed to finance these projects is proposed to the Annual General Meeting as ‘Green Dividend’.
1 Centper share
GREEN DIVIDEND HOW DOES IT WORK?
The dividend is not paid out and the projects are implemented by the Company, which will report on progress at the next Annual General Meeting.
The dividend is paid out and the projects are not implemented.
The Company indentifies projects that would not be financed solely based on financial criteria, as well as expected non financial benefits.
VOTE FOR THE PAYOUT
VOTE AGAINST THE PAYOUT
alstria Annual Company Report 2019 62

PROJECTS THAT WOULD BE FINANCED WITH THE GREEN DIVIDEND
There is no technical, legal or contractual reason why these investment would need to be realized. The existing equip-ment is properly maintained and reflects the current con-tractual agreement between alstria and the tenant. The investments described would not offer alstria its expected returns and would only be undertaken with the aim of improving alstria‘s carbon footprint.
Öjendorfer Weg 9 – 11, Hamburg
Heating performance: 107 KW per m²
Underperformance: 35 %
Lowering demand: Windows, LED
Renewable energy: Solar panels
Potential saving: 45 tCO2e per year
Investment: EUR 750,000
CO2 yield: EUR 16,500 per tCO2e saved annually
In-place rent: EUR 8.70 per m²
Hammer Steindamm 129, Hamburg
Heating performance: 97 KW per m²
Underperformance: 30 %
Lowering demand: Windows
Renewable energy: Solar panels
Potential saving: 50 tCO2e per year
Investment: EUR 950,000
CO2 yield: EUR 19,000 per tCO2e saved annually
In-place rent: EUR 7.20 per m²
alstria Annual Company Report 2019 63

65 Calculation of yields
67 Achieved UIRR 2006 – 2019
71 Valuation certificate
80 Management Compensation Scheme
81 Glossary
84 Imprint
APPENDIX
Schaartor 1, Hamburg
Development project 2013 – 2014
Yield on cost: 6.8 %
alstria Annual Company Report 2019 64
APPENDIX

Different yields – but all are based on the same portfolio value The calculation of portfolio yields is sometimes confusing, as it is always the same portfolio, but a different outcome. In tables 31 – 33, we summarized the calculation schemes of the different yields that we use to indicate the valuation of our portfolio. It is important to note that the calculations are different, but they all start on the same basis, which is the portfolio value, conducted by our external appraisers.
Our own portfolio yield of 4.7 % is the contractual rent in relation to the portfolio value on our balance sheet (table 31).
The EPRA calculation (table 32) starts at the same basis but corrects the portfolio value for development assets and trading properties. On the income side, the EPRA concept also adjusts for the impact of rent-free periods and property costs (‘property outgoings’).
Table 31: alstria’s calculation
EUR kDec. 31,
2019Dec. 31,
2018Portfolio valueInvestment properties (on balance sheet) 4,438,597 3,938,864Value of own used property 22,964 18,728Assets held for sale 19,588 29,620Other adjustments – 5,089 0Prepayments of properties 0 – 1,944Total portfolio value (A) 4,476,060 3,985,268IncomeContractual rent (B) 208,332 210,425Real estate operating expenses (5 %) – 10,417 – 10,521Contractual net rent (C ) 197,916 199,903Yield (%) (B / A) 4.7 5.3Net yield (%) (C / A) 4.4 5.0
Table 32: EPRA calculation
EUR kDec. 31,
2019Dec. 31,
2018Portfolio value Investment properties (on balance sheet) 4,438,597 3,938,864Trading property 19,588 29,620Development assets – 487,710 – 187,830Completed portfolio 3,970,475 3,780,654Acquisition cost 258,081 245,743Gross up completed property portfolio valuation (A) 4,228,556 4,026,397IncomeContractual rent 208,332 196,967Contractual rent developments – 29,625 – 2,175Contractual rent (excluding developments) 178,707 194,792Rent-free periods – 19,391 – 12,524Annualized cash passing rent 159,316 182,268Property outgoings – 17,871 – 19,378Annualized net cash rents (B) 141,445 162,890Rent free periods 19,391 12,524’Topped-up‘ net annulized rent (C ) 160,836 175,414EPRA Net initial yield (%) (B/A) 3.3 4.0EPRA ’topped-up’ Net initial yield (%) (C/A) 3.8 4.4
CALCULATION OF YIELDS
alstria Annual Company Report 2019 65

Table 33: Savills’ calculation1)
EUR k Dec. 31, 2019 Dec. 31, 2018Portfolio valueInvestment properties (on balance sheet) 4,438,597 3,936,920Value of own used property 22,964 18,728Assets held for sale 19,588 29,620Other adjustments – 5,089 0Total portfolio (A) 4,476,060 3,985,268Acquisition cost (B) 311,497 272,197Capital cost (C) 363,313 271,297Gross value (D) 5,150,870 4,528,762
Income Initial passing gross rents (E) 182,513 185,619Non-recoverable expenses – 22,708 – 14,788Initial net rents (F) 159,806 170,831Reversions 65,952 48,799Estimated net rents (G) 230,575 219,630
Savills Net initial yield (F/A + B) 3.3 % 4.0 %Savills Reversionary yield (G/A + B) 4.8 % 5.2 %1) Yields 2019 and 2018 not fully comparable.
Our appraiser uses a different methodology (table 33), again starting with the portfolio value he calculated, and which is reflected on our balance sheet. Adjustments are made for the value of our own used properties, estimated acquisition costs and capital costs (required capex), as the appraiser calculates the market yield from the perspective of the buyer. On the income side, adjustments are made for property expenses and an estimated rent reversion.
alstria Annual Company Report 2019 66

Average UIRR of 8.0 % from 2006 – 2019The company’s history, over the past 13 years, impressively demonstrates our ability to achieve an unlevered IRR of 7 – 8 % per year over the cycle. This result is based on a port-folio consisting of 80 individual properties with a volume of EUR 1.5 billion, which we bought, managed and sold on the market between 2007 and 2019 (see table 34). We achieved this result, on the one hand, through our asset
Table 34: Unlevered returns (UIRR) 2006 – 2019
Asset City Region Ownership start Disposal date
Total lettable area
(m²)
Gross purchase price1)
(EUR k)
Rent Collected2)
(EUR k)Capex
(EUR k)
Disposal proceeds
(EUR k)
Unlevered profit
(EUR k) UIRR
(%)Balgebrückstr. 13 Bremen Others 01.11.2015 29.02.2020 4,153 3,798 910 118 2,900 – 136 – 0.9Werner-von-Siemens-Platz 1 Laatzen Others 01.04.2007 29.02.2020 21,027 27,693 22,208 3,912 16,675 6,708 2.4Stiftplatz 5 Kaiserslautern Others 01.11.2015 31.10.2019 8,942 12,079 2,805 1,306 12,750 2,151 4.4Opernplatz 2 Essen Düsseldorf 01.11.2015 30.01.2019 24,271 36,743 8,486 3,394 40,000 8,309 5.7Berner Str. 119 Frankfurt Frankfurt 01.11.2015 30.04.2019 14,852 20,199 3,982 1,133 27,000 9,620 10.7Brödermannsweg 5 – 9 Hamburg Hamburg 01.11.2015 28.02.2019 1,374 2,260 430 48 4,300 2,403 21.0Ingersheimer Str. 20 Stuttgart Stuttgart 01.11.2015 31.03.2019 12,895 23,142 5,168 911 41,500 22,585 19.8Jagenbergstr. 1 Neuss Düsseldorf 01.10.2007 31.12.2018 20,400 49,660 30,644 3,804 23,400 145 0.0Gathe 78 Wuppertal Düsseldorf 01.10.2007 01.01.2019 8,400 11,331 10,827 1,535 9,120 6,883 5.9Washingtonstr. 16 Dresden Others 01.10.2007 31.12.2018 20,500 16,801 12,715 3,535 28,080 20,066 8.7Harburger Ring 17 Hamburg Hamburg 01.10.2007 31.08.2018 3,600 3,392 2,260 4,352 10,000 4,486 8.3Lötzener Str. 3 Bremen Others 01.11.2015 30.06.2018 5,000 3,445 803 98 3,600 749 7.4Eschersheimer Landstr. 55 Frankfurt Frankfurt 01.11.2015 01.04.2018 8,700 27,300 3,018 606 44,000 19,112 20.1Frankfurter Str. 71 – 75 Eschborn Frankfurt 01.11.2015 01.03.2019 6,700 15,700 2,500 206 16,200 2,794 5.9Doktorweg 2 – 4 Detmold Düsseldorf 01.04.2008 31.12.2017 9,800 8,569 4,889 699 11,300 6,921 7.5Carl Benz Str. 15 Ludwigsburg Stuttgart 01.11.2015 30.08.2017 32,500 19,300 2,764 294 19,600 2,770 6.3
management skills and, on the other hand, by applying a strict acquisition discipline. Low interest rates have never tempted us to enter into risky transactions and pure spec-ulation on future market-driven rental growth has never motivated us to buy properties. Instead, we always took a realistic view of the rental market and increased rents through quality-enhancing investments.
ACHIEVED UIRR 2006 – 2019
1) Incl. 6 % transaction costs. Disclaimer: The data shown in the table above can differ from the IFRS accounting numbers.2) Incl. 5 % real estate operating expenses.
alstria Annual Company Report 2019 67

Table 34: Unlevered returns (UIRR) 2006 – 2019
Asset City Region Ownership start Disposal date
Total lettable area
(m²)
Gross purchase price1)
(EUR k)
Rent Collected2)
(EUR k)Capex
(EUR k)
Disposal proceeds
(EUR k)
Unlevered profit
(EUR k) UIRR
(%)Vichystr. 7 – 9 Bruchsal Stuttgart 01.11.2015 30.08.2017 20,200 12,600 1,668 347 13,400 2,121 8.4Grosse Bleichen 23 – 27 (JV) Hamburg Hamburg 01.01.2010 31.08.2017 18,300 31,164 11,912 5,774 83,300 58,274 17.3Zellescher Weg 18 – 25a Dresden Others 01.04.2006 31.01.2017 6,539 8,576 7,977 183 10,500 9,718 11.1Feldstr. 16 / Gutenbergstr. Weiterstadt Frankfurt 01.11.2015 31.12.2016 14,200 6,700 385 33 7,350 1,002 15.1Gutenbergstr. 1 Ismaning Munich 01.11.2015 31.12.2016 12,200 12,800 917 465 14,100 1,752 13.9Oskar-Messter-Str. 22a – 24a Ismaning Munich 01.11.2015 31.12.2016 12,400 16,700 1,445 8 18,400 3,137 19.0Nägelsbachstr. 26 / Nürnberger Str. 41
Erlangen Others 01.11.2015 31.12.2016 11,600 18,500 1,526 949 11,200 – 6,722 – 36.8
Lina-Ammon-Str. 19 Nürnberg Others 01.11.2015 31.12.2016 11,200 15,100 1,191 0 15,100 1,191 8.0Richard-Wagner-Platz 1 Nürnberg Others 01.11.2015 31.12.2016 6,800 14,400 1,106 221 17,000 3,485 24.5Bahnhofstr. 1 – 5 Heilbronn Stuttgart 01.11.2015 30.11.2016 14,700 28,400 2,224 654 33,650 6,820 24.3An den Treptowers 3 Berlin Berlin 01.11.2015 30.09.2016 85,400 209,300 12,188 965 228,431 30,354 14.7Ludwig-Erhard-Str. 49 Leipzig Others 01.04.2006 30.09.2016 6,290 10,307 7,746 267 9,450 6,622 6.9Taunusstr. 34 – 36 Munich Munich 01.11.2015 31.08.2016 11,200 26,400 1,404 28 26,830 1,806 6.9Wandsbeker Chaussee 220 Hamburg Hamburg 01.10.2007 30.06.2016 3,156 5,671 3,026 226 5,920 3,049 6.4Max-Eyth-Str. 2 Dortmund Düsseldorf 01.10.2007 31.12.2016 7,042 7,791 434 73 4,625 – 2,805 – 5.1Landshuter Allee 174 Munich Munich 05.06.2007 30.06.2016 7,151 11,342 3,071 1,849 14,000 3,881 4.3Hofmannstr. 51 Munich Munich 01.04.2007 30.06.2016 22,151 41,764 21,009 782 44,987 23,450 6.2Dieselstr. 18 Ditzingen Stuttgart 01.04.2007 25.06.2016 9,639 3,100 0 8,986 13,395 1,309 34.1Emil-von-Behring-Str. 2 Frankfurt Frankfurt 01.04.2007 31.12.2015 9,308 15,370 9,254 3,696 12,800 2,988 2.9Arnulfstr. 150 Munich Munich 01.04.2006 31.12.2015 5,871 16,258 8,074 138 16,500 8,177 6.6Halberstädter Str. 17 Magdeburg Others 01.04.2006 30.11.2015 7,527 10,417 5,089 304 6,200 568 0.8Siemensstr. 31 – 33 Ditzingen Stuttgart 01.04.2007 01.11.2015 15,051 28,620 12,097 900 22,300 4,878 2.5Englische Planke 2 Hamburg Hamburg 01.04.2011 31.12.2014 4,623 12,065 2,804 431 15,530 5,838 15.2Hamburger Str. 43 – 49 Hamburg Hamburg 28.12.2006 30.11.2014 21,777 36,010 18,227 401 41,662 23,478 9.1Spitzweidenweg 107 Jena Others 03.03.2008 31.10.2014 2,880 1,993 1,064 106 1,415 380 3.7Ernsthaldenstr. 17 Stuttgart Stuttgart 03.03.2008 31.05.2014 2,472 2,714 1,663 662 3,300 1,587 10.0Max-Brauer-Allee 41 – 43 Hamburg Hamburg 01.06.2008 31.03.2014 3,226 4,569 1,665 852 6,150 2,395 7.2Joliot-Curie-Platz 29 – 30 Halle Others 02.05.2008 31.12.2013 1,080 1,325 475 19 610 – 259 – 5.31) Incl. 6 % transaction costs. Disclaimer: The data shown in the table above can differ from the IFRS accounting numbers.2) Incl. 5 % real estate operating expenses.
alstria Annual Company Report 2019 68

Table 34: Unlevered returns (UIRR) 2006 – 2019
Asset City Region Ownership start Disposal date
Total lettable area
(m²)
Gross purchase price1)
(EUR k)
Rent Collected2)
(EUR k)Capex
(EUR k)
Disposal proceeds
(EUR k)
Unlevered profit
(EUR k) UIRR
(%)Bornbarch 2 – 12 Norderstedt Hamburg 01.05.2012 31.12.2013 12,351 6,466 1,357 660 10,320 4,552 68.8Johannesstr. 164 – 165 / J.-Gagarin-Ring 133 – 135
Erfurt Others 01.04.2006 31.10.2013 5,846 8,127 3,791 187 5,850 1,328 2.7
Am Roten Berg 5 Erfurt Others 03.03.2008 31.07.2013 5,284 2,756 791 35 1,060 – 940 – 9.7Schweinfurter Str. 4 Würzburg Others 01.01.2007 30.06.2013 5,076 7,950 2,875 161 4,530 – 706 – 1.9Helene-Lange-Str. 6 / 7 Potsdam Others 01.04.2006 30.06.2013 3,292 6,866 2,705 232 5,700 1,307 3.0Kanalstr. 44 Hamburg Hamburg 03.03.2008 31.05.2013 8,094 10,854 4,624 488 15,000 8,281 14.3Lothar-Streit-Str. 10b Zwickau Others 01.04.2006 23.05.2013 1,034 1,583 599 30 350 – 665 – 11.6Benrather Schlossallee 29 – 33 / Ludolfstr. 3
Düsseldorf Düsseldorf 01.04.2008 01.02.2013 4,941 8,684 2,614 510 7,620 1,040 2.7
Zwinglistr. 11 / 13 Dresden Others 03.03.2008 31.12.2012 2,924 1,982 725 31 2,640 1,352 15.4Schopenstehl 24 / Kleine Reichenstr. 2
Hamburg Hamburg 01.08.2009 30.06.2012 2,122 3,509 498 999 5,040 1,031 8.0
Am Gräslein 12 Nürnberg Others 01.04.2006 31.03.2012 2,708 3,769 1,344 71 3,400 904 4.3Poststr. 11 Hamburg Hamburg 01.06.2006 30.03.2012 7,356 36,302 5,211 30,100 120,839 59,648 17.0Bertha-von-Suttner-Platz 17 Bonn Düsseldorf 01.04.2006 30.09.2011 1,388 1,624 990 50 2,100 1,416 16.7Kümmellstr. 5 – 7 Hamburg Hamburg 01.06.2006 09.11.2010 15,666 26,325 6,094 305 25,279 4,744 4.6Lenhartzstr. 28 Hamburg Hamburg 01.06.2006 09.11.2010 1,131 1,788 466 23 4,221 2,875 28.8Schloßstr. 60 Hamburg Hamburg 01.06.2006 22.09.2010 11,945 15,141 4,009 200 17,001 5,669 9.1Steckelhörn 12 Hamburg Hamburg 01.06.2006 22.09.2010 14,720 36,616 7,797 390 35,200 5,992 4.2Gänsemarkt 36 Hamburg Hamburg 01.06.2006 31.03.2010 20,900 66,341 12,889 644 68,700 14,603 5.5Gorch-Fock-Wall 15, 17 Hamburg Hamburg 01.06.2006 31.03.2010 7,700 16,013 3,368 168 15,500 2,686 4.3Eserwallstr. 1 – 3 Augsburg Others 01.04.2006 31.12.2009 5,564 10,583 2,510 126 10,556 2,358 7.7Rheinstr. 23 Darmstadt Frankfurt 01.04.2006 31.12.2009 2,696 5,060 1,132 57 4,197 212 1.5Mecumstr. 10 Düsseldorf Düsseldorf 01.04.2006 31.12.2009 8,638 21,452 4,377 219 18,128 834 1.4Vahrenwalder Str. 133 Hannover Others 01.04.2006 31.12.2009 7,142 16,869 3,529 176 18,587 5,071 10.2Bonner Str. 351 / 351 a Cologne Düsseldorf 01.04.2006 31.12.2009 10,907 23,192 5,259 263 21,736 3,541 5.4Steubenstr. 72 – 74 Mannheim Frankfurt 01.04.2006 31.12.2009 4,070 7,898 1,896 95 7,844 1,748 7.6Regensburger Str. 223 – 231 Nürnberg Others 01.04.2006 31.12.2009 8,938 15,489 3,582 179 14,877 2,791 6.31) Incl. 6 % transaction costs. Disclaimer: The data shown in the table above can differ from the IFRS accounting numbers.2) Incl. 5 % real estate operating expenses.
alstria Annual Company Report 2019 69

Table 34: Unlevered returns (UIRR) 2006 – 2019
Asset City Region Ownership start Disposal date
Total lettable area
(m²)
Gross purchase price1)
(EUR k)
Rent Collected2)
(EUR k)Capex
(EUR k)
Disposal proceeds
(EUR k)
Unlevered profit
(EUR k) UIRR
(%)Poststr. 51 Hamburg Hamburg 01.06.2006 07.10.2009 1,681 7,347 1,283 64 6,500 372 1.8Eppendorfer Landstr. 59 Hamburg Hamburg 01.06.2006 30.09.2009 3,293 7,423 1,228 61 6,622 365 1.7Ottenser Marktplatz 10 / 12 Hamburg Hamburg 01.06.2006 30.09.2009 934 2,687 470 24 2,375 134 1.8Marburger Str. 10 Berlin Berlin 01.04.2008 29.09.2009 6,219 13,155 747 37 12,950 504 3.9Gorch-Fock-Wall 11 Hamburg Hamburg 01.06.2006 30.06.2009 8,693 20,405 2,886 144 19,600 1,936 3.3Nikolaistr. 16 Leipzig Others 01.01.2007 30.11.2008 1,191 2,438 363 18 2,000 – 93 – 2.0Düsternstr. 10 Hamburg Hamburg 01.06.2006 31.10.2008 2,156 4,463 583 29 4,950 1,040 11.6Osterbekstr. 96 Hamburg Hamburg 01.06.2006 30.09.2008 7,393 10,067 1,126 56 11,000 2,003 9.9Richard-Strauß-Allee 10 – 14a Wuppertal Düsseldorf 01.04.2006 13.07.2007 1,258 1,394 139 7 1,545 284 21.3Schellenbecker Str. 15 – 21 Wuppertal Düsseldorf 01.04.2006 13.07.2007 1,854 1,944 177 9 2,155 379 20.5Total 774,204 1,325,927 348,087 92,116 1,524,501 452,640 8.01) Incl. 6 % transaction costs. Disclaimer: The data shown in the table above can differ from the IFRS accounting numbers.2) Incl. 5 % real estate operating expenses.
alstria Annual Company Report 2019 70

VALUATION CERTIFICATE
Project ‘Portfolio of alstria office REIT-AG’
Opinion of Market Valueas at 31 December 2019
on behalf of
alstria office REIT-AGSteinstraße 720095 HamburgGermany
Commercial Portfolio of alstria office REIT-AGValuation date: 31 December 2019
Clientalstria office REIT-AGSteinstraße 720095 HamburgGermany
Prepared bySavills Advisory Services Germany GmbH & Co. KGTaunusanlage 19 60325 Frankfurt am Main Germany
A. Executive Summary
Portfolio Overview Subject to this report are 116 commercial properties with a total lettable area of approx. 1,521,084 sqm. The prop-erties are located mainly in the north, west and southwest of Germany.
TenureAll properties are held on the German equivalents of free-hold title
Location AnalysisApprox. 57 % of the total gross rental income are gener-ated by the top three locations Hamburg, Stuttgart and Düsseldorf.
Top 10 municipalities by current rental income
# MunicipalityLettable area
sqmLettable units
number
Current rental income
EUR p. a.
Averageremaining lease term
years
Current rental income with lease expiry
1 Hamburg 385,956 – 50,553,738 7.59 95.92 Stuttgart 193,903 – 28,863,930 4.27 99.63 Düsseldorf 227,578 – 25,105,341 5.46 98.34 Frankfurt am Main 120,315 – 15,363,234 4.41 97.35 Essen 72,386 – 11,567,625 3.22 99.76 Berlin 86,253 – 10,519,177 4.40 95.47 Darmstadt 104,946 – 8,979,115 3.94 99.08 Ratingen 58,118 – 6,197,259 4.87 99.59 Köln 59,423 – 6,026,918 5.35 98.3
10 Karlsruhe 26,762 – 2,877,705 6.01 100.0> 10 Remaining 185,442 21,803 16,162,061 6.22 97.3
alstria Annual Company Report 2019 71

B. Valuation Results
I. Total Rental Income (‘Current Rent’) According to the provided tenancy schedule, the current rental income as at 31 December 2019 amounts to:
EUR 182,512,997 p. a. (ONE HUNDRED EIGHTY TWO MILLION FIVE
HUNDRED TWELVE THOUSAND NINE HUNDRED AND NINETY SEVEN EURO)
II. Opinion of Net Estimated Rental Value (ERV)
The estimated rental value as at 31 December 2019 amounts to:
EUR 248,464,720 p. a.(TWO HUNDRED FORTY EIGHT MILLION FOUR
HUNDRED SIXTY FOUR THOUSAND SEVEN HUNDRED AND TWENTY EURO)
III. Opinion of Market ValueWe are of the opinion that the Market Value of the free-hold interests in the subject properties as at 31 December 2019 is:
4,476,060,000 EUR (FOUR BILLION FOUR HUNDRED SEVENTY SIX
MILLION AND SIXTY THOUSAND EURO)
Market Value in EUR per sqm 2,943Gross Multiplier on Current Rent 24.52Gross Multiplier on Market Rent 18.01Net Initial Yield (NIY) on Current Rent in % 3.34Net Yield (NY) on Market Rent in % 4.80
C. Instructions and Sources of Information
We are of the opinion that the Market Value of the free-hold interests in the subject properties as at 31 December 2017 is:
I. Scope of Instruction
Report Date13 January 2010
InstructionIn accordance with the Instruction Letter dated 01 August 2017, the 1. Amendment dated 06 December 2017 and 2. Amendment dated 19 March 2019, we carried out a valuation of all 116 commercial properties of the respec-tive portfolio.
Please note that since the last valuation (30 June 2019) the following properties were acquired respectively sold:
› VU2197 – Adlerstraße 63, 40211 Düsseldorf (purchased) › VU2154 – Stiftsplatz 5, 67655 Kaiserslautern (sold)
Therefore, the valuation portfolio comprises 116 commer-cial properties at the valuation date of 31 December 2019.
Instructing PartyThis valuation statement is addressed to and may be relied upon by:
alstria office REIT-AGSteinstraße 720095 HamburgGermanyHereinafter referred to as ‘Client’
Conflict of InterestWe hereby confirm that we have no existing potential conflict of interest in providing the valuation report, either with the Principal or with the properties.
Furthermore, we confirm that we will not benefit (other than from receipt of the valuation fee) from this valuation instruction.
CurrencyThe relevant currency for this valuation is EUR.
Portfolio AssumptionEach property will be valued individually, and no discount or addition is made in the aggregate value to reflect the fact that it may form part of a portfolio.
TenureAll properties are held on the German equivalent of free-hold title.
Purpose of ValuationThe Instructing Party requires this valuation for accounting purposes.
Disclosure of Excerpts of Savills’ Reports in the Com-pany ReportsSavills agrees to the disclosure of an excerpt of Savills’ reports (which include the Valuation Certificate and Annex 1 thereto but exclude any other Annexes or information) in the Company Reports of the Instructing Party (‘Com-pany Report’) with the proviso, and under the condition, that Savills is liable to the Instructing Party only, and no third party (in particular no recipients of the Company Reports) may raise any claims against Savills in connection with Savills’ report or the disclosure of parts thereof in the Company Report. The Instructing Party shall procure that
alstria Annual Company Report 2019 72

the Company Reports contain (i) a statement that the dis-closure in the Company Reports is made on a non-reliance basis, and no third party (other than the Instructing Party) will be entitled to raise claims against Savills, and (ii) the information that the knowledge of the excerpts of Savills’ report disclosed in the Company Reports do not constitute a sufficient basis for business decisions of the recipients of the Company Reports.
RelianceOur valuation is for the use of the party to whom it is addressed only and for the specific purpose referred to above. No responsibility is accepted to any other party than the instructing party.
LiabilityThe liability of Savills is limited to a maximum amount of EUR 3 million under Sec. 6 of the General Terms. Savills is prepared to increase this maximum amount for this instruc-tion up to EUR 50m (fifty million EUR). This increased maximum amount is valid for this instruction only and does not apply for any other present or future instructions, agreements or legal relationships between the Instructing Party and Savills. Where there is more than one Addressee to this Report, the aforementioned maximum amount of our liability is a total limit to be allocated between the Addressees, such allocation being entirely a matter for the Addressees. Savills does not accept any duty, liability or responsibility to any party other than the Instructing Party with respect to the report unless and to the extent otherwise agreed with such party in writing.
Nature and Source of Information relied onThe valuation has been substantially and mainly based upon the information supplied to us by the Instructing Party and / or entitled advisors. For details please refer to the chapter ‘Sources of Information and Inspection’.
Basis of ValuationOur valuation has been carried out in accordance with the RICS Valuation – Global Standards 2017 (the ‘Red Book’) published by the Royal Institution of Chartered Surveyors (RICS), London, which was effective from 1 July 2017. We have been instructed to value the properties on the basis of Market Value in accordance with Valuation Practice State-ments VPS 4 of the RICS Valuation – Professional Standards (the ‘Red Book’) which is defined as follows:
‘The estimated amount for which an asset or liability should exchange on the valuation date between a willing buyer and a willing seller in an arm’s length transaction after proper marketing and where the parties had each acted knowledg-ably, prudently and without compulsion.’
Furthermore, we confirm that the determined Market Value corresponds with the German ‘Verkehrswert’ (§194 BauGB) and is also conform to the International Valuation Standards (IVS).
Date of Valuation31 December 2019
Savills’ TeamThe responsible project managers for this valuation were Klaus Trautner MRICS, CIS HypZert (F) and Christian Quandt CIS HypZert (F) who are well experienced in the valuation of office properties.
Besides the project manager the following Savills team was involved in the valuation of the subject properties:
› Drazenko Grahovac MRICS › Sebastian Arndt › Erik Matthes MRICS › Magda Podniece MRICS
› Tanja Künne › Desiree von Holt › Oliver Risopp › Konstantinos Yfantidis
Verification, LiabilityThis report contains many assumptions, some of a general and some of a specific nature. Our valuations are based upon certain information supplied to us by others. Some information we consider material may not have been pro-vided to us.
We recommend that the addressee of this report satisfies itself on all these points, either by verification of individual points or by judgement of the relevance of each particular point in the context of the purpose of our valuations. Our valuations should not be relied upon pending this verifi-cation process.
Should any of the information or assumption on which Savills’ valuation is based be subsequently found incorrect or incomplete our value conclusion may be incorrect so that our valuation may need to be amended. Savills there-fore cannot accept any liability for the correctness of this assessment or for any loss or damage resulting there from.
General Terms and ConditionsThe ‘General Terms and Conditions’ (Appendix V) of Savills Advisory Services Germany GmbH & Co. KG apply to this agreement. We specifically draw your attention to these.
alstria Annual Company Report 2019 73

II. Sources of Information and Inspection
Information Sources For the purpose of this update valuation we have relied on our initial valuation certificates as at 29 January 2018, 14 January 2019, 30 July 2019 and the following new information, provided to us by the client:
› Rent roll for the properties including future leases infor-mation received by email on 06 January 2020
› Information regarding penalty payments for potential break options received by email on 05 November 2019
› Information regarding development properties received by email on 14 November 2019
› Final capex list as at 31 December 2019 received by email on 26 November 2019
› Additional specific documents in course of the Q & A process
Furthermore we relied (which means we assumed that the respective information provided by alstria is complete, correct, up to date and not misleading) on the following information for the one new subject property:
› Land register copies of › Land register excerpts, › Cadastral maps, › Excerpts regarding public easements, › Building permissions, › Information regarding planning law (land utilization plan, development plan, information from planning authorities)
Unless otherwise stated in the Report, Savills based its valuations on the aforementioned documents and infor-mation received in the course of the initial and update valuations as at 31 December 2017, 31 December 2018 and 30 June 2019.
We have also included the following sources into our val-uation report:
› Savills Research › Local Land Valuation Boards and other local authorities › Geoport › Empirica › RIWIS online database
Extent of InspectionsFor the purpose of this valuation (as at 31 December 2019) 4 subject properties were fully inspected by Savills in Octo-ber 2019.
112 subjected properties were not inspected for this valua-tion (as at 31 December 2019). Nevertheless, we have been carried out inspections for 75 subject properties between April and May 2019 and for 37 subject properties between August 2017 and September 2017. We have assumed that there were no material changes on the properties that could have an impact on the valuation during the time of the inspection and the valuation date.
All conclusions made by Savills with regard to the condition and the actual characteristics of the land and buildings have been based on our inspection of the subject properties and on the documents and information provided (please see above).
In the event that only partial internal inspections were pos-sible, it will be assumed that the parts that were inspected are typical of the remainder.
For the avoidance of doubt, Savills did not carry out any building or structural surveys of the subject properties nor tested any of the electrical, heating or other services.
The properties were not measured as part of Savills’ inspec-tion, nor were the services or other installations tested.All Savills’ conclusions resulting from the inspections are based purely on visual investigations without any assertion as to their completeness.
Furthermore, investigations that might cause damage to the subject properties have not been carried out. Statements about parts of the structure or materials that are covered or otherwise inaccessible are based on the information or documents provided (or on assumptions, respectively).
D. Valuation Methods
I. H&T (Hardcore & Top Slice)
In determining the market value for commercial proper-ties we therefore have applied the Hardcore and Top Slice Method (H&T). Using the H&T method, the cash flows from the property are divided into two blocks with the cash flow of each block being calculated individually and being summed up subsequently.
The H&T method is a static calculation approach which makes no explicit refection of rental growth: the effects of rental growth and potential changes in other market and financial factors are implicit in the yield, which is normally obtained from the analysis of comparable transactions. Hardcore considers the cash flow as at the date of valuation until the expiry of the existing lease and therefore consid-ers the contractual rents. Management and maintenance costs as well as other unrecoverable costs of the owner are deducted from the current achievable gross annual yield (Gross Income). The remaining Net Income is capitalized by the annuity factor.
alstria Annual Company Report 2019 74

Top slice marks the second phase from the beginning of reletting, if required under consideration of an appropriate vacancy period. The calculation of cash flows is based on the estimated market rent. The costs of any outstanding repairs (‘deferred maintenance’) or other capital costs that would be immediately incurred are deducted from the total capital value. Future capital costs (e. g. renovation or refurbishment before renewed letting) are estimated and discounted for an appropriate period before being deducted.
After the deduction of the purchaser’s costs (real prop-erty transfer tax, notary and agent costs) and immediately required capital expenditure, the result is the Net Value.
E. Valuation Considerations
In this chapter we comment on our individual considerations in order to arrive with our opinion of value.
Please note that our opinion of value is carried out on the basis of a number of assumptions. In the absence of any information to the contrary in the Report, our indication of value is based on our General Assumptions and Conditions enclosed in Appendix V to this Report.
Our General Assumptions and Conditions will be amended by our individual considerations, including underlying indi-vidual valuation assumptions, as described in the following sections. Our individual considerations are based on these additional assumptions which were adopted specifically with respect to our opinion of value of the assets which are subject to this Report.
In case of any discrepancies with our General Assumptions and Conditions, our individual valuation assumptions as described in the following do prevail. If any of the afore-mentioned assumptions (General or individual valuation assumptions or other) are subsequently found to be incorrect or invalid, our opinion of value may need to be reconsidered.
I. Portfolio Considerations
1. Legal Aspects
Land RegisterAccording to the provided land register excerpts, all prop-erties are held on freehold title
There are several encumbrances regarding the subject prop-erties like pipeline way leaves, cable rights, right of ways and restricted personal easement.
For the subject property VU2107 – Hamburg, there is a superstructure payment in an amount of EUR 6,383.71 p. m. (Überbaurente) in favour of the respective owner of land register Uhlenhorst folio 3403. We have considered these costs in our valuation approach.
Except for the subject property VU2107 – Hamburg, we are of the opinion that the encumbrances and restrictions registered under Section II do not affect the use of the subject properties. They are therefore assumed to have no impact on value.
Further legal AspectsWe were provided with some information regarding legal issues. This legal information partially include information regarding:
› Public encumbrances › Planning law, zoning specification › Historical listings › Soil and building contamination
According to this information, we are of the opinion that the further legal aspects do not affect the use of the subject properties, therefore we have assumed no impact of value.
2. Technical Aspects
Maintenance Backlog and Capital ExpenditureBased upon the inspection as well as the documents and information provided by the client we have assumed that the continuing repair and maintenance of the properties have been carried out accordingly.
We were provided with a Capital expenditures overview with estimations for ‘Major Refurbishment costs’ and for ‘Re-letting costs’ for vacant units.
The total Capital expenditures for major refurbish-ments amount to ca. EUR 261.22m and for re-letting to EUR 102.09m.
This leads to total Capital expenditures of ca. EUR 363.31m for the 77 subject properties (ca. 8.0 % of the portfolio value).
We have considered the costs for Capital expenditures in our valuation approach.
Please refer to Appendix II (‘Detailed Valuation Overview’) for more details of individual aspects.
alstria Annual Company Report 2019 75

3. Tenancy Aspects
Our valuation is based on the rent roll for the subject prop-erties received from the client via email on 06 January 2020. We assume that the document reflect the status quo of all tenancies as at valuation date 31 December 2019 to a true and comprehensive extent. Please note that we cannot accept any reliance on the correctness nor the complete-ness of the provided information of tenancies.
For details of all tenancies, please refer to pp. 7 of the ‘Detailed Valuation Overview’ in Appendix II.
II. Basic Cash Flow Considerations
In the following section, we like to comment on all input parameters in our valuation model. Besides a general description of each parameter, the applied ranges of those parameters will be stated, too. For more detailed informa-tion on a property level please refer to Appendix II ‘Detailed Valuation Overview’.
The Estimated Rental Value (ERV)Estimated rental values (‘market rents’) indicated in this report are those which have been adopted by us as appro-priate in assessing the capital value or the letting potential of the property, being subject to market conditions that are either current or are expected in the short term. They are based on our experience of the markets and our knowledge of actual comparable market activity.
For the purpose of comparison, we considered market evidence by assessment of actual lettings of units with the same or the closest comparable use, where applicable and available. In few cases we also considered asking rents.
Applied ERVs range as follows in the subject portfolio:
Market rentMinimum
EUR persqm p. m.
MaximumEUR per
sqm p. m.
Average* EUR per
sqm p. m.Office – 28.00 13.56Storage 0.50 10.00 5.00Nursing home 8.25 13.00 10.51Retail – 75.00 17.82Other Area – 50.00 6.85Hotel 11.25 12.00 11.56Surgery 8.50 22.50 12.55Residential 5.00 14.50 12.63Restaurant 1.49 25.00 9.28Fitness 5.50 9.50 6.82Theatre 3.25 3.25 3.25Cinema 9.25 9.25 9.25External Parking – 180.00 46.03Internal Parking – 180.00 72.84Antenna – 2,350.00 613.07Advertisement – 1,200.00 239.82Other Unit – 1,869.16 171.18
* weighted by sqm / units
Our individually-applied rental values are included for each unit in the ‘Detailed Valuation Overview’ enclosed in Appendix II to this report.
Non-Recoverable CostsAncillary costs of a property are generally costs of
› ongoing maintenance, › management and › other non-recoverable costs.
These costs can generally be allocated to the responsibility of tenants in commercial leases – at least to a very high degree of total costs – whereas there are much stricter regulations for residential leases. Residential tenants may only be obliged to bear services charges as defined in the Ordinance of Services Charges (Betriebskostenverordnung) but must never – by law – be made responsible for costs of maintenance or management.
For the purpose of valuing the subject properties, we did not receive details of the amount of non-recoverable costs which remains to be borne by the owner. Therefore, we applied common appropriate assumptions in our valuation.
For costs of ongoing maintenance we have assumed the following for the respective types of use:
MaintenanceMinimum
EUR persqm p. a.
MaximumEUR per
sqm p. a.
Average* EUR per
sqm p. a.Office 7.00 10.00 8.04Storage 7.00 10.00 8.08Nursing home 4.00 4.00 4.00Retail 7.50 10.00 8.02Other Area – 10.00 7.27Hotel 7.50 7.50 7.50Surgery 7.50 9.00 7.61Residential 7.50 11.00 8.10Restaurant 7.50 10.00 8.13Fitness 7.50 9.00 7.99Theatre 8.50 8.50 8.50Cinema 9.00 9.00 9.00External Parking – 80.00 29.93Internal Parking – 80.00 76.60
* weighted by sqm / units
alstria Annual Company Report 2019 76

Our approach considers both, that commercial tenants bear a considerable portion of maintenance costs, i.e. in their units and of all fixtures and fittings, but that it is also likely that the owner shall bear costs of maintaining the roof and structure (‘Dach und Fach’). We assume the applied cost estimation to be sufficient to at least maintain the respec-tive property in the current condition.
The portfolio contains three elderly homes (#2133, #2139 and #2155) which are leased on a triple-net-basis. For these properties we applied only maintenance costs of EUR 4.00 per sqm and partially 0.5 % for other non-recoverable costs.For the subject properties we have allowed management costs as a percentage of the annual market rent:
Management costsMinimum
% ofMarket Rent
Maximum% of
Market Rent
Average % of
Market RentOffice 1.00 4.00 1.93Storage 1.00 3.00 1.84Nursing home 1.00 2.00 1.21Retail 1.00 4.00 2.61Other Area 1.00 3.00 1.95Hotel 1.00 3.00 2.15Surgery 2.00 3.00 2.67Residential 1.01 8.59 1.84Restaurant 1.00 3.00 2.82Fitness 2.00 3.00 2.46Theatre 2.50 2.50 2.50Cinema 3.00 3.00 3.00External Parking 1.00 3.00 1.88Internal Parking 1.00 3.00 1.96Antenna 1.00 3.00 2.46Advertisement 1.00 3.00 2.90Other Unit 1.00 3.00 1.59
Our approach is to reflect a common level of management costs under consideration of the type and complexity of the asset and relevant utilisation(s). We generally assumed the subject asset to require a normal management effort.
We considered other non-recoverable costs between of 0.50 % and 15.00 % of the market rent for the subject properties, VU2122, VU2133, VU2139, VU2155, VU2156, VU2107 and VU2186.
The other non-recoverable costs such as:
› leasing commissions (for rental agents)
are taken into account by the applied yields as in our ini-tial valuation.
Reletting Costs (tenant improvement costs for unit fit-out)These costs were taken into account in accordance with the provided Reletting Capital expenditures by the client which amount to ca. EUR 102.09m. Please see section I. 2. Technical Aspects for detailed numbers.
Non-Recoverable Costs on VacancyThese are generally non-recoverable service charges, for example any operational costs, which may need to be borne by the landlord should a tenant become unable to pay for any reason (e.g. insolvency) or in the general case of vacancy. These costs are incurred in addition to the reg-ular non-recoverable ancillary costs as explained above.
In the absence of more detailed information of actual non-recoverable costs in the case of vacancy, we consid-ered non-recoverable ancillary costs per sqm p.m. for vacant area as follows:
Vacancy costsMinimum
EUR persqm p. a.
MaximumEUR per
sqm p. a.
Average* EUR per
sqm p. a.Office – 1.50 1.93Storage – 1.50 1.84Nursing home 1.00 1.50 1.21Retail 0.25 1.50 2.61Other Area – 1.50 1.95Hotel 1.50 1.50 2.15Surgery 1.50 1.50 2.67Residential 0.25 1.50 1.84Restaurant 1.00 1.50 2.82Fitness 1.00 1.50 2.46Theatre 1.00 1.00 1.00Cinema 0.50 0.50 0.50
* weighted by sqm / units
Please note that these costs will only be applied to vacant space and only for the assumed duration of vacancy.
Void Periods for Currently Vacant Space & Future Void Periods on Renewed LettingVoids generally represent the time period between the expiry of a lease and the start date of a new lease.
Depending on the quality of situation and the respective property, the current rental situation and the local vacancy rate we have assumed an initial void period for current vacancy and future void periods until re-letting after the expiry of leases of rental units.
There is currently some initial vacancy in the subject prop-erties. For these units, we have estimated ‘Void Periods of Current Vacancy’ which are starting at the beginning of
alstria Annual Company Report 2019 77

the next full month following the reference date of this valuation (the ‘projection date’).
We have assumed the following void periods for current vacancy:
Void period of current vacancy
Minimummonth
Maximummonth
Average *month
Office 3.00 30.00 15.57Storage 2.00 30.00 12.99Retail 9.00 24.00 15.31Other Area 6.00 24.00 11.80Surgery 18.00 18.00 18.00Residential 12.00 24.00 23.53External Parking 3.00 26.00 17.11Internal Parking 2.00 30.00 13.96Antenna 9.00 18.00 15.71Advertisement 6.00 6.00 6.00Other Unit 9.00 12.00 10.85
* weighted by market rent
We have set a void period of current vacancies of 0 months for hotel, nursing home, restaurant, fitness, theatre and cinema because these types of use are currently fully let.
Those units which are currently let and which become vacant in the future will be subject to the ‘Void Periods after Expiry of Leases’.
For all units where leases expire in the future and during the upcoming DCF term of 10 years, we considered the following void periods:
Void Period after expiry of leases
Minimummonth
Maximummonth
Average *month
Office 3.00 4.00 12.08Storage 3.00 3.00 11.14Nursing home 12.00 2.00 13.49Retail 6.00 4.00 11.96Other Area – 3.00 11.26Hotel 12.00 3.00 15.45Surgery 12.00 3.00 15.25Residential 1.00 8.59 4.73Restaurant 6.00 3.00 15.05Fitness 12.00 3.00 12.00Theatre 10.00 2.50 10.00Cinema 12.00 3.00 12.00External Parking 3.00 3.00 12.76Internal Parking 3.00 3.00 12.35Antenna 2.00 3.00 10.38Advertisement 2.00 3.00 5.70Other Unit – 3.00 6.32
* weighted by market rent
The above discussed considerations are shown as the num-ber of months for each existing unit within the rent roll in the ‘Detailed Valuation Overview’ enclosed in Appendix II to this report.
Remaining lease time until lease expiryFor current lease contracts without fixed lease expiry date we applied half of the previous rental period as remaining lease term (e. g. a lease contract is running for 6 years as at valuation date, than we applied 3 years as remaining lease term).
Leased rental units by alstria office REIT-AGAlstria office REIT-AG currently occupies rental areas and in the following properties:
› VU2053: Steinstraße 5 – 7, Hamburg › VU2054: Friedrichstraße 19, Düsseldorf › VU2118: Elisabethstraße 5 –11, Düsseldorf › VU2150: Platz der Einheit 1, Frankfurt am Main › VU2176: Rankestraße 17, Berlin
For each of these properties we have agreed to make a Special Assumption that alstria office REIT-AG occupies the accommodation on a typical commercial Dach und Fach lease term for a duration of 5 years commencing on the valuation date, and is paying the applied Market rent. This Special Assumption is made on the basis that alstria office REIT-AG undertakes to enter into such a lease either of these properties be sold.
Permanent Void Allowance / Structural VacancyAt the date of valuation the portfolio of alstria office REIT-AG has a total vacancy area of 285,661 sqm. We have appointed 3,375 sqm of this area as structurally vacant. The Portfolio thus has a cumulative vacancy rate of approximately 18.8 %.
alstria Annual Company Report 2019 78

Structural Vacancy
Subject PropertyLettable
AreaStructurally Vacant Area
Property Adress Municipality sqm sqm %VU2032 Ernst-Merck-Straße 9 Hamburg 17,566 41 0.23VU2039 Johanniswall 4 Hamburg 14,113 38 0.27VU2044 Ludwig-Rosenberg-Ring 41 Hamburg 4,895 88 1.79VU2106 Hamburger Straße 1 – 15 (MOT) Hamburg 9,473 171 1.80VU2118 Elisabethstraße 5 – 11 Düsseldorf 10,169 301 2.96VU2125 Heidenkampsweg 51 – 57 Hamburg 10,192 58 0.57VU2137 Berliner Straße 91 – 101/
Brandenburger Straße 2 – 6 Ratingen 33,905 889 2.62VU2138 Pempelfurtstraße 1 Ratingen 18,543 925 4.99VU2145 Mergenthalerallee 45 – 47 Eschborn 5,061 534 10.55VU2150 Platz der Einheit 1 Frankfurt am Main 30,158 45 0.15VU2179 Kanzlerstraße 8 Düsseldorf 8,993 104 1.16VU2180 Am Wehrhahn 28 – 30 Düsseldorf 2,610 161 6.17VU2197 Adlerstraße 63 Düsseldorf 2,686 19 0.72
Applied calculations YieldsWe applied the following range of yields for the subject portfolio considering the individual cash-flows, locations, as well as use types and building qualities.
Internal yields and rates
Minimum Maximum Average *Office 2.80 12.00 % 15.57 %
* Equivalent Yield weighted by Gross Present Value
Costs of TransactionFor our opinion of value, we applied costs of transaction as follows:
› Real Estate Transfer Tax: 4.50 % – 6.50 % (depending on federal state relevant to an asset)
› Notary fees: 0.25 % – 0,50 % › Agency fees: 0,50 % – 1.00 %
These costs are chosen as they are common in ordinary course of business, i. e. in an asset deal, and for the sub-ject type of properties. Costs of transaction may, however, differ in the actual individual case – depending on the type of transaction.
ClosureFinally, in accordance with the recommendations of the RICS, we would state that this report is provided solely for the purpose stated above. It is confidential to and for the use only of the party to whom it is addressed, and no responsibility is accepted to any third party for the whole or any part of its contents. Any such parties rely upon this report at their own risk. Neither the whole nor any part of this report or any reference to it may be included now, or at any time in the future, in any published document, circular or statement, nor published, referred to or used in any way without our written approval of the form and context in which it may appear.
For and on behalf ofSavills Advisory Services Germany GmbH & Co. KG
Draženko Grahovac MRICS Klaus Trautner MRICSRICS Registered Valuer RICS Registered Valuer, CIS HypZert(F)
alstria Annual Company Report 2019 79
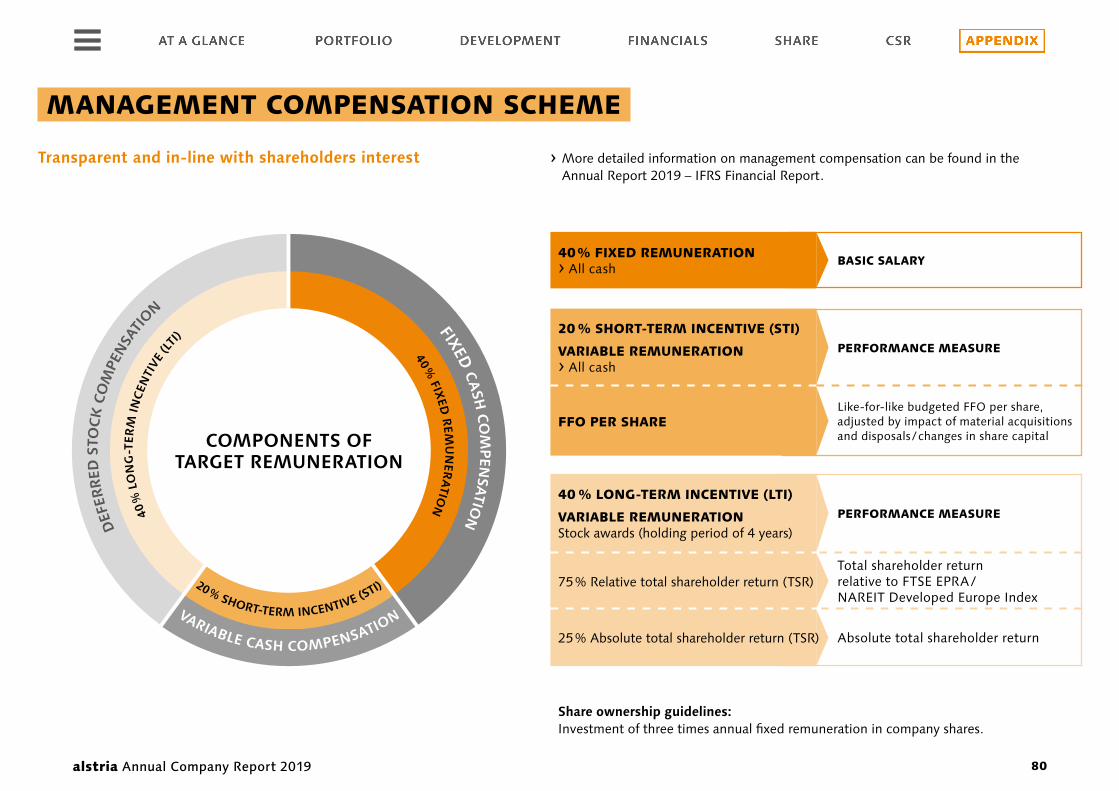
MANAGEMENT COMPENSATION SCHEME
Transparent and in-line with shareholders interest
DEF
ERR
ED S
TOCK
CO
MPE
NSA
TION
FIXED CA
SH CO
MPEN
SATION
VARIABLE CASH COMPENSATION
40 %
LO
NG
-TER
M IN
CEN
TIVE
(LTI
)
40 %
FIXED
REM
UN
ERATIO
N
20 % SHORT-TERM INCENTIVE (STI)
COMPONENTS OF TARGET REMUNERATION
› More detailed information on management compensation can be found in the Annual Report 2019 – IFRS Financial Report.
PERFORMANCE MEASURE
20 % SHORT-TERM INCENTIVE (STI)
VARIABLE REMUNERATION› All cash
40 % LONG-TERM INCENTIVE (LTI)
VARIABLE REMUNERATION Stock awards (holding period of 4 years)
FFO PER SHARELike-for-like budgeted FFO per share, adjusted by impact of material acquisitions and disposals / changes in share capital
40 % FIXED REMUNERATION› All cash
BASIC SALARY
Absolute total shareholder return
75 % Relative total shareholder return (TSR)
25 % Absolute total shareholder return (TSR)
PERFORMANCE MEASURE
Total shareholder return relative to FTSE EPRA / NAREIT Developed Europe Index
Share ownership guidelines: Investment of three times annual fixed remuneration in company shares.
alstria Annual Company Report 2019 80

GLOSSARY
A
AFFOThe adjusted funds from operations (AFFO) is equal to the FFO (funds from oper ations) with adjustments made for capital expenditures used to maintain the quality of the underlying investment portfolio.
Annual financial statementsThe annual financial statements include the balance sheet and the profit and loss account of a company. In respect of a joint stock company, these are prepared by the Man-agement Board, audited by a chartered accountant for compliance and checked by the Supervisory Board.
Asset management Value-driven management and / or optimization of real estate investments through letting management, refurbish-ment, repositioning and tenant management.
Average cost of debtThe cost of finance expressed as a percentage of the weighted average of borrowings during the period. B
Broker feesFees paid to an intermediary in connection with the bro-kerage of rental space or a real estate transaction.
C
Cash flow The cash flow statement shows how the cash and cash equivalents of the Group changed in the course of the financial year as a result of cash received and paid. In accor-dance with IAS 7, a distinction is made between cash flows from operating activities and cash flows from investing and financing activities.
CO2
Carbon dioxide, a gas produced primarily through the com-bustion of fossil fuels, is believed to be the main cause of climate change.
Completed developmentsCompleted developments consist of those properties pre-viously included in the development programme, which have been transferred to the investment portfolio from the development programme during the reporting period.
Contractual rentAt a given date, the contractual rent reflects the total annual-ised rent taking into consideration all signed rental contracts.
CoverageInformation provided on a listed public company by banks and financial analysts in the form of studies and research reports.
CSRCorporate social responsibility is a management concept whereby companies integrate social and environmental concerns in their business operations and interactions with their stakeholders.
D
Development capexInvestments related to the substantial modernization / ren-ovation of a building.
Development portfolioPart of the real estate portfolio on which modernization / ren-ovation work took place during the reporting period.
DividendThe share of the distributed net profit of a company to which a shareholder is entitled in line with the number of shares he holds. E
EPRAThe European Public Real Estate Association is an organi-zation that represents the interests of the major European property management companies and supports the devel-opment and market presence of European public property companies.
ERVThe estimated market rental value of the total lettable space in a property, after deducting head and equity rents, calculated by the Group’s external valuers.
alstria Annual Company Report 2019 81

F
Fair value (or open market value [OMV])The estimated amount for which a property should exchange on the date of valuation between a willing buyer and a willing seller in an arm’s-length transaction after proper marketing, wherein the parties had each acted knowledge-ably, prudently and without compulsion. The fair value for alstria’s investment properties is reviewed regularly by external appraisers.
FFOalstria calculates Funds From Operations as EBT, decreased / increased by the net gain / loss from fair value adjustment on investment property, decreased / increased by the net gain / loss from fair value adjustment on financial derivatives, increased / reduced by the profit / loss on disposal of invest-ment property, decreased / increased by the net gain / loss from fair value adjustments on investment property of joint ventures, decreased / increased by non-recurring items, plus non-cash-expenses and less cash taxes paid.
G
G-REITReal Estate Investment Trusts are public listed companies, fully tax-transparent, which solely invest in properties.
I
IFRSThe international financial reporting standards (IFRS) are adopted by the International Accounting Standards Board (IASB). The objective is to achieve uniformity and transpar-ency in the accounting principles that are used by companies and other organisations worldwide for financial reporting. IFRS have applied to listed companies since January 1, 2005.
Investment property Property, land and buildings, which are held as financial investments to earn rents or for growth and not used for the Company’s own purpose. The value of the investment property is determined according to IAS 40.
L
LTV and Net LTValstria calculates loan to value (LTV) by dividing the total loans outstanding to finance investment properties by the value of all mortgaged investment properties. The calculation of alstria’s Net LTV also deducts the available non-restricted cash on the respective balance sheet date, which is deducted from the gross debt amount.
M
MDAXMid Cap Index; it contains, with variable weighting, the prices of the 50 most important, in terms of market cap-italization and turnover, German joint stock companies which are not included in DAX30. In addition to dividend payments, subscription right proceeds are also included when calculating the index.
N
NAV (net asset value)Reflects the economic equity of the Company. It is calcu-lated from the value of assets less debt.
Net absorptionReduction of vacant space in a real estate portfolio, which remains unchanged over two reporting periods.
Net debt / EBITDAThe Net debt / EBITDA ratio gives an indication as to how long a company would need to operate at its current level to pay off all its debt.
NNNAV (triple net asset value)The Company computes NNNAV as total equity as reported in the IFRS consolidated statement of financial position, which accounts for the carrying amount and the fair value of financial instruments and financial liabilities, adjusted for hidden reserves and hidden losses in immovable assets and financial liabilities.
O Office buildingProperty where at least 75 % of the lettable area is destined for office use (disregarding potential ground-floor retail).
Opex (Operating expenditure)Maintenance costs of buildings that are not capitalized but are immediately recognized in the income statement.
P
Passing rentAnnual gross rental income as per a certain date, excluding the net effects of straight-lining for lease incentives.
PerformanceThe term performance describes the percentage appre-ciation of an investment or a securites portfolio during a given period.
Pre-letA lease signed with a tenant prior to completion of a development.
alstria Annual Company Report 2019 82

Property managementProperty management is the management of real estate assets including the processes, systems and manpower required to manage the life cycle of a building.
R
Rent concessionGranting of rent-free periods in connection with a lease.
RoadshowsCorporate presentations to institutional investors.
S
ShareThe term ‘share’ describes both the membership rights (holding in the joint stock company) and the security that embodies these rights. The holder of a share (shareholder) is a ‘sharer’ in the assets of the joint stock company. Their rights are protected by the regulations contained in the Companies Act.
Share capitalThe capital stipulated in a corporation’s articles of associ-ation. The articles also specify the number of shares into which the share capital is divided. The Company issues shares in the amount of its share capital.
Supervisory Board The Supervisory Board is one of the three executive bod-ies of a joint stock company: Annual General Meeting, Management Board and Supervisory Board. The Supervi-sory Board appoints the Management Board and provides supervision and advice regarding management of the com-pany’s business.
SustainabilityAlignment of an organisation’s products and services with stakeholder expectations, thereby adding economic, envi-ronmental and social value.
T Tenant fit outsCosts related to the fit out of rental space due to special tenant requirements.
Tenant incentivesAny incentive offered to occupiers to enter into a lease. Typically the incentive will be an initial rent-free period, or a cash contribution to fit-out or similar costs.
TSR (Total shareholder return)Dividends and capital growth in the share price, expressed as a percentage of the share price at the beginning of the year.
TransparencyA principle that allows those affected by administrative decisions, business transactions or charitable work to know not only the basic facts and figures but also the mechanisms and processes. It is the duty of civil servants, managers and trustees to act visibly, predictably and understandably.
U
UIRRThe Unlevered internal rate of return (UIRR) is a key indi-cator to assess the attractiveness of an investment. It is the rate needed to discount the unlevered sum of the future cash flow to equal the initial investment.
V
Vacant spaceVacant space refers to the sum of all lettable space that at the end of a calendar year is unoccupied or offered for lease.
W
WAULTWeighted average unexpired lease term. Remaining lease length of a rent contract.
X XETRAAn electronic stock exchange trading system that uses the open order book and thus increases transparency.
Y YieldKey performance indicator, which is determined at a given date by the contractual rent in relation to the fair value of the property.
alstria Annual Company Report 2019 83

alstria office REIT-AGSteinstr. 720095 Hamburg, Germanywww.alstria.comwww.beehive.work
Contact Investor RelationsRalf Dibbern+49 (0) 40 / 22 63 [email protected]/en/investors
Social media
alstria office REIT-AG is a member of DIRK (Deutscher Investor Relations Verband, the German Investor Relations Association).
Other reports issued by alstria office REIT-AG are posted on the Company’s website.
Forward-looking statementsThis annual report contains forward-looking statements. These statements represent assessments which we have made on the basis of the information available to us at the time. Should the assumptions on which the statements are based not occur, or if risks should arise the actual results could differ materially from the results currently expected.
Design & Layout Teresa Henkel
BUILDING YOUR FUTURE